Article

Multi-Organ Nutrigenomic Effects of Dietary Grapes in a Mouse Model

1
Division of Pharmaceutical Sciences, Arnold & Marie Schwartz College of Pharmacy and Health Sciences, Long Island University, Brooklyn, NY 11201, USA
2
Immunology Program, Memorial Sloan Kettering Cancer Center, New York, NY 10065, USA
3
Department of Pharmaceutical and Administrative Science, College of Pharmacy and Health Sciences, Western New England University, Springfield, MA 01119, USA
4
College of Pharmacy and Health Sciences, Western New England University, Springfield, MA 01119, USA
5
Department of Medicine, UMass Chan Medical School—Baystate, Springfield, MA 01199, USA
*
Author to whom correspondence should be addressed.
Antioxidants 2023, 12(10), 1821; https://doi.org/10.3390/antiox12101821
Submission received: 19 September 2023 / Accepted: 28 September 2023 / Published: 1 October 2023
(This article belongs to the Special Issue Natural Antioxidants in Obesity and Related Diseases)

Abstract

:
As a whole food, the potential health benefits of table grapes have been widely studied. Some individual constituents have garnered great attention, particularly resveratrol, but normal quantities in the diet are meniscal. On the other hand, the grape contains hundreds of compounds, many of which have antioxidant potential. Nonetheless, the achievement of serum or tissue concentrations of grape antioxidants sufficient to mediate a direct quenching effect is not likely, which supports the idea of biological responses being mediated by an indirect catalytic-type response. We demonstrate herein with Hsd:ICR (CD-1® Outbred, 18–24 g, 3–4 weeks old, female) mice that supplementation of a semi-synthetic diet with a grape surrogate, equivalent to the human consumption of 2.5 servings per day for 12 months, modulates gene expression in the liver, kidney, colon, and ovary. As might be expected when sampling changes in a pool of over 35,000 genes, there are numerous functional implications. Analysis of some specific differentially expressed genes suggests the potential of grape consumption to bolster metabolic detoxification and regulation of reactive oxygen species in the liver, cellular metabolism, and anti-inflammatory activity in the ovary and kidney. In the colon, the data suggest anti-inflammatory activity, suppression of mitochondrial dysfunction, and maintaining homeostasis. Pathway analysis reveals a combination of up- and down-regulation in the target tissues, primarily up-regulated in the kidney and down-regulated in the ovary. More broadly, based on these data, it seems logical to conclude that grape consumption leads to modulation of gene expression throughout the body, the consequence of which may help to explain the broad array of activities demonstrated in diverse tissues such as the brain, heart, eye, bladder, and colon. In addition, this work further supports the profound impact of nutrigenomics on mammalian phenotypic expression.

1. Introduction

The influence of diet on human health has been recognized over the millennia. From the time of Hippocrates (ca. 460 BC–ca. 370 BC), it has been clear that food has been considered good medicine and the converse under some situations. The health benefits of whole fruits and vegetables and a myriad of phytochemicals derived therefrom are widely recognized based on epidemiological investigations and clinical trials. In this context, we have been especially interested in the potential of table grapes to influence health and the mode of action.
Although some individual chemical constituents of grapes, particularly resveratrol [1], have been heavily studied, the grape is known to produce over 1600 phytochemicals [2]. Thus, regarding the potential of grapes to influence health, testing the product as a whole is more rational than testing individual components, especially when individual components are tested at concentrations unachievable through normal dietary means. Challenges of working with whole food, however, include the reproducibility of results experiment-by-experiment and year-by-year. This issue has been resolved by providing a surrogate whole-grape freeze-dried powder stored in vacuum-sealed packages. Showing good chemical stability when properly warehoused, the powder is composed of fresh seeded and seedless red, green, and black grapes that are grounded to retain their bioactive compounds. The standard product is subjected to chemical and microbial analyses to assure quality [3].
As a whole food, grapes have an impressive array of potential health benefits, including cardiovascular, atherosclerosis, inflammation, cancer, gastrointestinal, bone health, brain, joint, and vision [4]. Recently, regarding skin, we have reported that grape consumption can increase resistance to ultraviolet irradiation in human volunteers [5], with concomitant alterations in the metabolome [5] and the microbiome [6].
Mechanisms commonly associated with grapes and constituents of grapes have long been associated with antioxidant effects [7], interference with the NF-κB signal transduction pathway [8], activation of Nrf2 signaling and induction of phase II detoxifying and antioxidant genes [9], etc. Reported responses include lowering LDL cholesterol oxidation and platelet aggregation, antiapoptotic, antimicrobial, antihypercholesterolemic, antiatherosclerotic, antiarrhythmic, and antidiabetic actions, among others [9]. Mechanistic underpinnings have been explored in many of these cases.
Considering the array of activities facilitated by the grape, it seems reasonable to speculate that, when taken as a whole, the plethora of chemical constitutes associated with this fruit may induce a broad-based, multifunctional response. Indeed, as demonstrated by Milella et al. [10], peripheral blood mononuclear cells from six human subjects who had consumed fresh table grapes identified 930 differentially expressed transcripts, some of which were associated with favorable processes such as immune response, DNA and protein repair, autophagy, and mitochondrial biogenesis.
In our work with female C57BL6/J mice, as expected, the provision of a high-fat western-pattern diet led to significant increases in body weight and reduced lifespan. However, the addition of grapes to an isocaloric high-fat diet enhanced longevity and reduced fatty liver [11]. Simultaneously, significant alteration of hepatic gene expression was observed. Interestingly, the gene expression pattern of the mice receiving the high-fat diet containing grapes mapped closer to the standard diet containing grapes than the high-fat diet devoid of grapes. Further, with murine models, we have demonstrated that dietary grape consumption modulates gene expression in the brain, with corresponding behavior changes [12], as well as metabolomic alterations [13]. The alterations of gene expression induced by grape consumption likely provide a mechanistic underpinning.
In the current report, we examined the nutrigenomic effect of grapes more broadly. Similar to our work with grapes in the past [11,12,13], we elected to continue the studies with a murine model. In part, this was due to logistical considerations since, although mice consume a large amount of diet relative to their body weight, the rate of consumption is certainly less than rats, dogs, rabbits, or other larger mammals. We selected females, partly due to continuity with our past studies, as well as easing the burden of animal husbandry. Naturally, future work with male mice would be of value, but changing gender or evaluating both genders was not well-justified at the outset of this work. Finally, we chose to perform the study with CD-1 mice. Over the decades, CD-1 mice have been broadly used for research in toxicology, immunology, aging, and genetics. Here, however, we selected the CD-1 since it is an outbred strain. Although inbred mice have a more uniform genotype, which may allow for easier interpretation of results, this uniformity does not reflect the genetic diversity of the general human population. We considered this as an advantage of using CD-1 mice.
In our past work, using C57BL6/J mice, we primarily focused on the effect of grape consumption on the liver. In the present work, in addition to the liver, we assessed the effect of adding grapes to the diet on the gene expression in the colon, ovary, and kidney. Notable changes were observed in every case, indicating the global ability of grape consumption to alter the fundamental characteristics of mammalian cells and organs and suggesting a preeminent mechanism by which grape consumption may promote health.

2. Materials and Methods

2.1. Experimental Animals

Hsd:ICR (CD-1® Outbred, 18–24 g, 3–4 weeks old, female) mice were obtained from Envigo RMS, LLC (Indianapolis, IN, USA). The mice were randomly divided into two groups of 10 mice each and were kept under a 12 h light–dark cycle. The dietary intervention study commenced immediately and continued for 12 months. Throughout the study, the animals had free access to the respective diet, except when fasting overnight in preparation for the next day’s sacrifice and organ harvesting. Water was available to the animals at all times. The animal protocol (16-01) was approved in advance by the Institutional Animal Care and Use Committee (IACUC) at Long Island University, Brookville, NY, USA. The body weight of the mice was monitored every two weeks.

2.2. Diet

To assure the continuity and reproducibility of experimental and clinical studies performed with grapes, a surrogate powder provided in vacuum-sealed packets was obtained from the California Table Grape Commission (Fresno, CA, USA) and stored at −20 °C. The powder is composed of fresh seeded and seedless red, green, and black grapes that are freeze-dried and grounded to retain their bioactive compounds. The standard product is subjected to chemical and microbial analyses to assure quality [3].
A control diet (STD) and an isocaloric control diet supplemented with 5% (w/w) grape powder (STD5GP) (Table 1) were manufactured by Envigo (Madison, WI, USA). The formulations were based on the knowledge that the grape powder provides 3.71 kcal/g, with a composition of 3% fat, 88.6% carbohydrate (as a 1:1 mixture of fructose and glucose), 3.58% protein, and 9.73 g/kg of potassium. The diets were accordingly adjusted to ensure comparable kcal levels and stored at 4 °C.

2.3. Tissue Collection

The mice, at the age of 12 months, underwent euthanasia following an overnight fasting period. Euthanasia was performed using CO2. The liver, colon, kidneys, and ovaries were harvested and immediately submerged in an RNAlater™ stabilization solution (ThermoFisher Scientific, Waltham, CA, USA) for up to 12 h at room temperature. Subsequently, the samples were transferred to −20 °C until RNA extraction.

2.4. RNA Extraction and RNA Sequencing

Tissue samples for analysis were taken from the center of the colon, the distal part of the largest lobe of the liver, and the left lower part of the kidney. In addition, the entire left ovary was processed. Tissue homogenization was performed following the instructions of the manufacturer using 750 μL of QIAzol (Qiagen, Germantown, PA, USA) with an RNeasy 96 Universal Tissue kit (Qiagen, Germantown, PA, USA). To assess the quantity and quality of the extracted RNA samples, spectrophotometric measurements were taken using BioSpec-nano (Shimadzu, Tokyo, Japan), and the integrity of the RNA samples was evaluated via QIAxcel® capillary electrophoresis. For the preparation of a “combined sample”, specimens derived from a respective tissue of each of the 10 mice in a group were pooled, ensuring that an equal amount of RNA from each mouse was added to the mixture. This yielded four samples from the STD group and four samples from the STD5GP group for analysis.
The library construction and RNA-seq were performed using Novogene (Sacramento, CA, USA). In brief, library concentration was first quantified using a Qubit 2.0 fluorometer (Life Technologies, Carlsbad, CA, USA) and then diluted to 1 ng/µL before checking insert size on an Agilent 2100 and quantifying to greater accuracy via quantitative PCR (Q-PCR) (library activity > 2 nM). Libraries are fed into HiSeq machines according to activity and expected data volume. The Novogene Corporation Inc. (Beijing, China) conducted paired-end (PE) 150 sequencing using the Illumina HiSeq platform, generating 20 million raw reads per sample.

2.5. Pathway and GO Term Enrichment Analyses

Pathway analysis was performed for cancer gene pathways, Reactome pathways, PID pathway, and Biocarta using the Bioconductor package msigdb v.1.8.0.

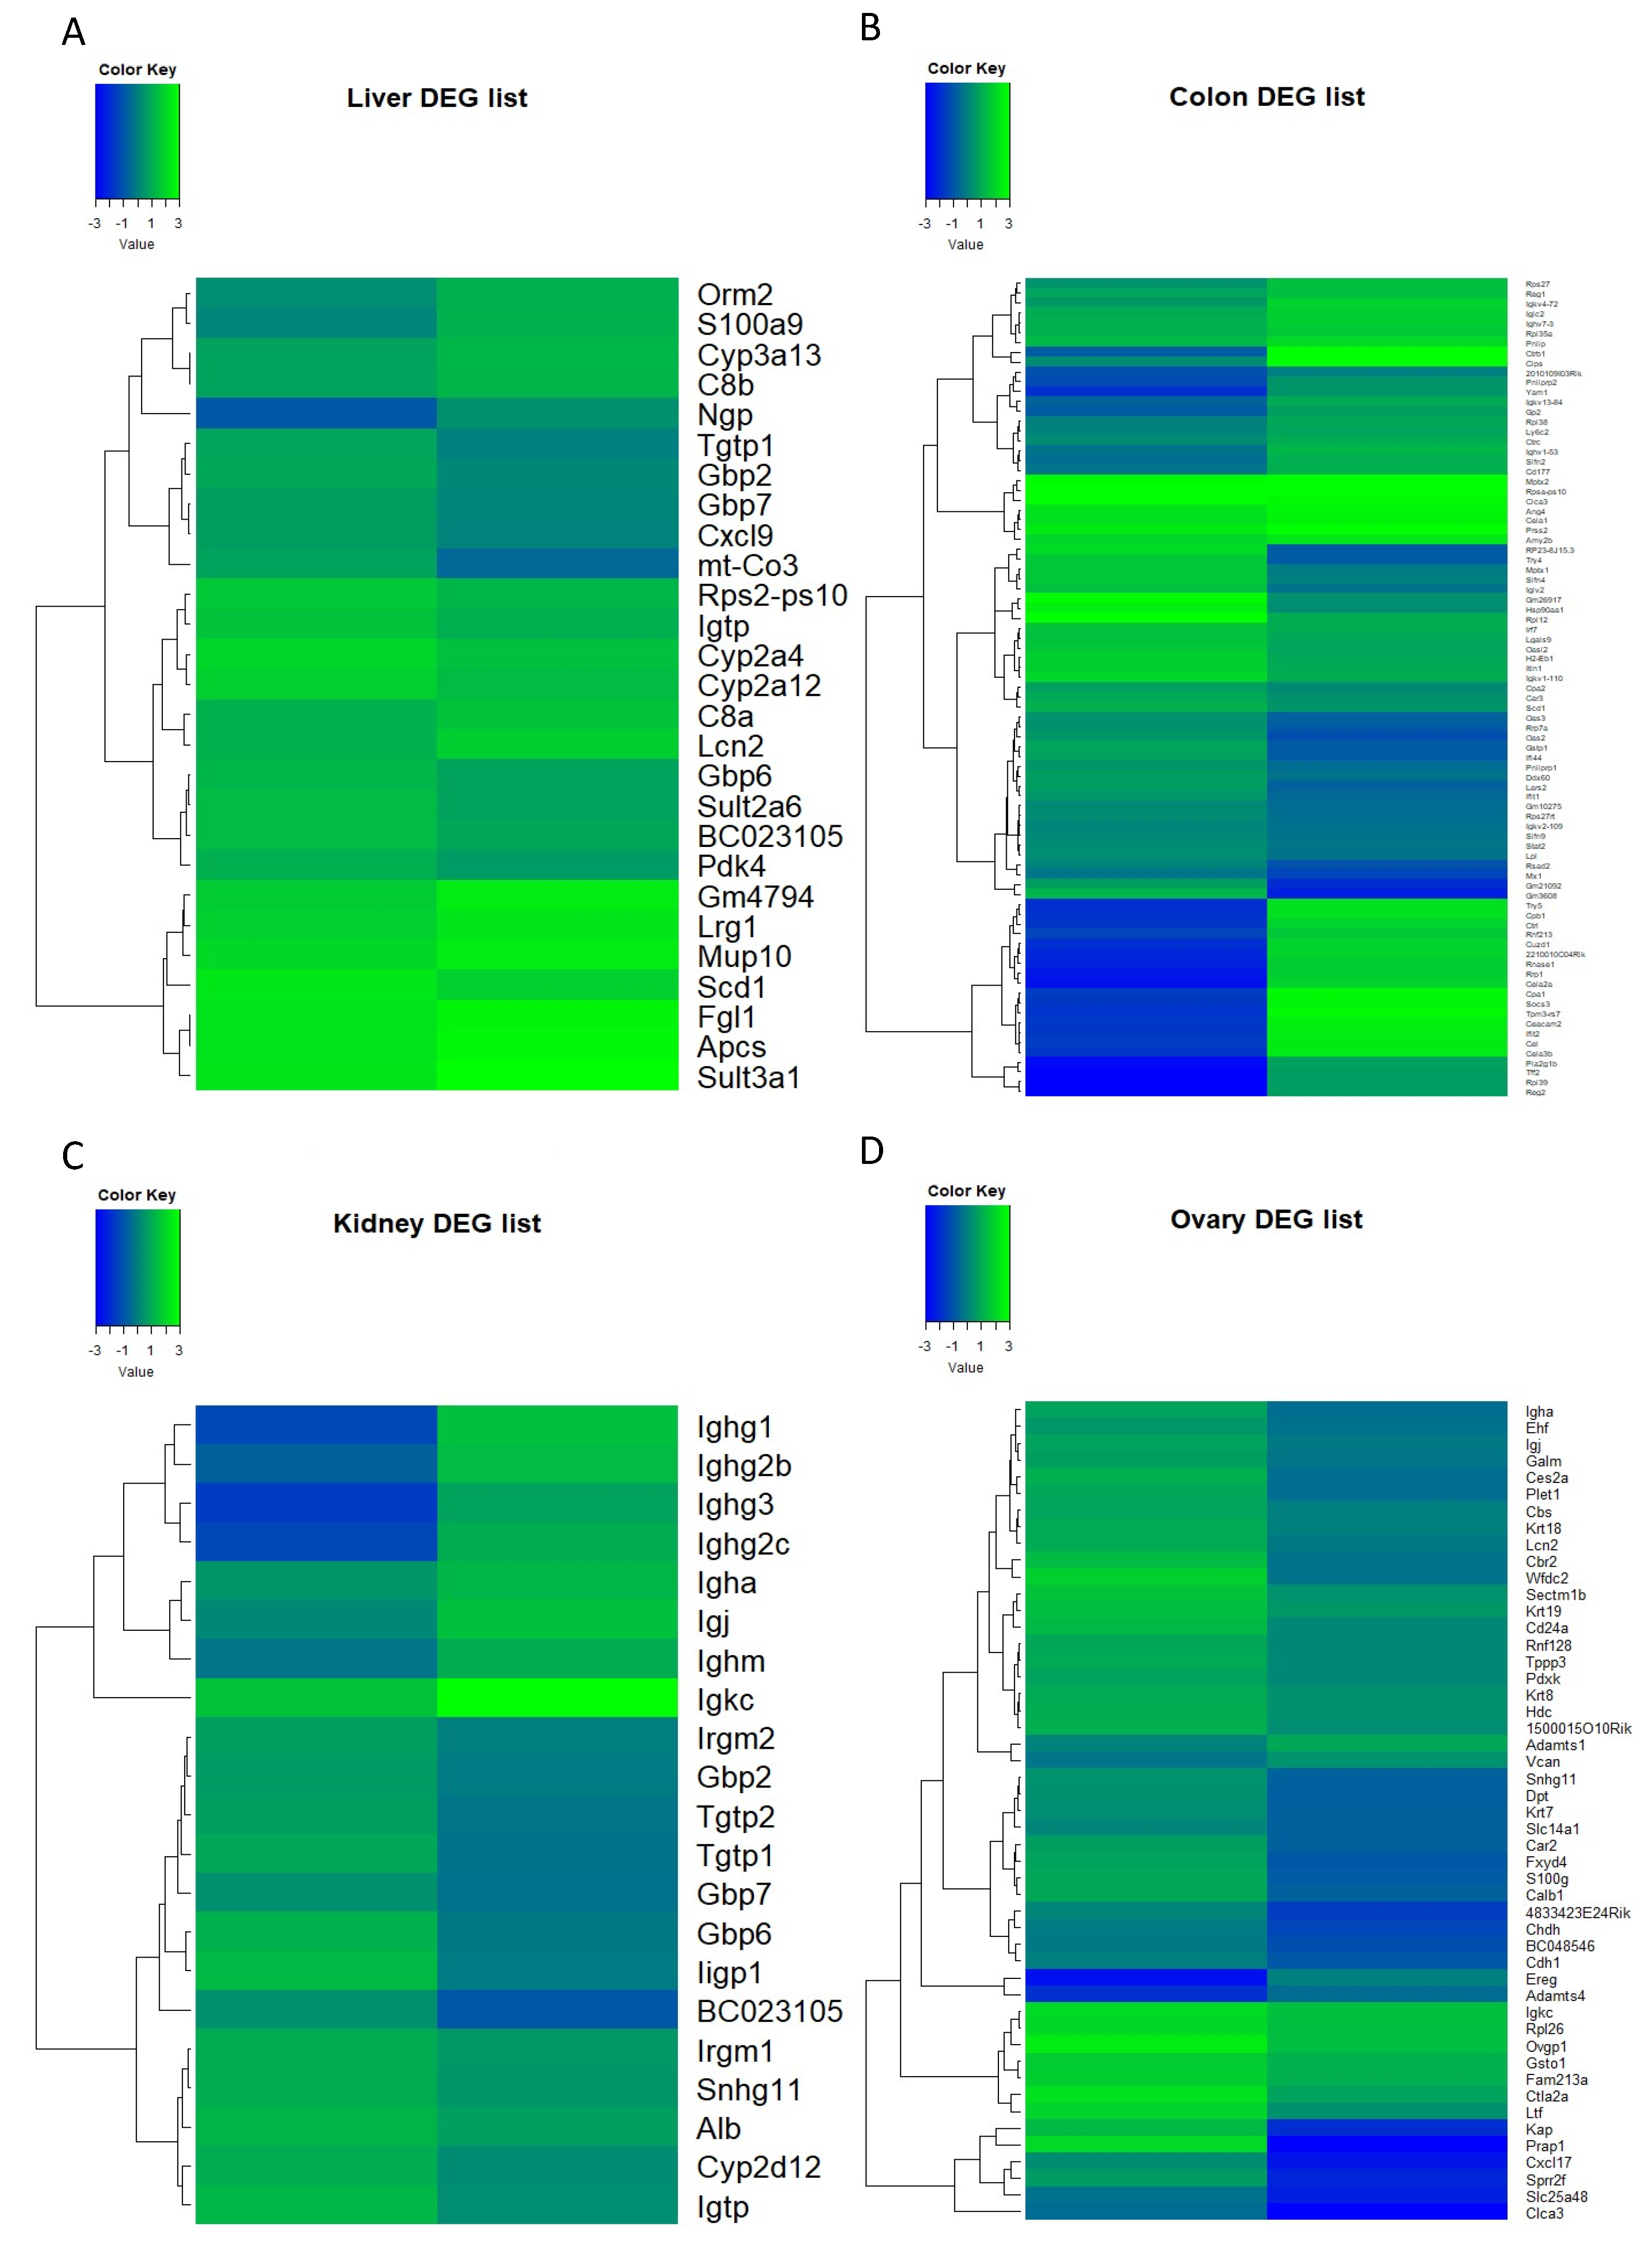
2.6. Heat Map Generation

Heat maps were created using genes identified as differentially expressed with q < 0.05. Rows were centered and scaled using the Z-score. The hierarchical clusters were created using Ward’s linkage method.

2.7. Statistical Analyses

Statistical analyses were performed using two-tailed Student’s t-tests (Microsoft® Excel, version 2206) unless otherwise indicated. A p-value of ≤0.05 was considered statistically significant. Differential expression analysis of two conditions/groups (two biological replicates per condition) was performed using the DESeq R package (1.18.0). DESeq provides statistical routines for determining differential expression in digital gene expression data using a model based on the negative binomial distribution. The resulting p-values were adjusted using the Benjamini and Hochberg approach for controlling the false discovery rate (fdr). Genes with q < 0.05 found via DESeq and Log2(Fold-change) of 1 were set as the thresholds for significant differential expression were assigned as differentially expressed.

3. Results and Discussion

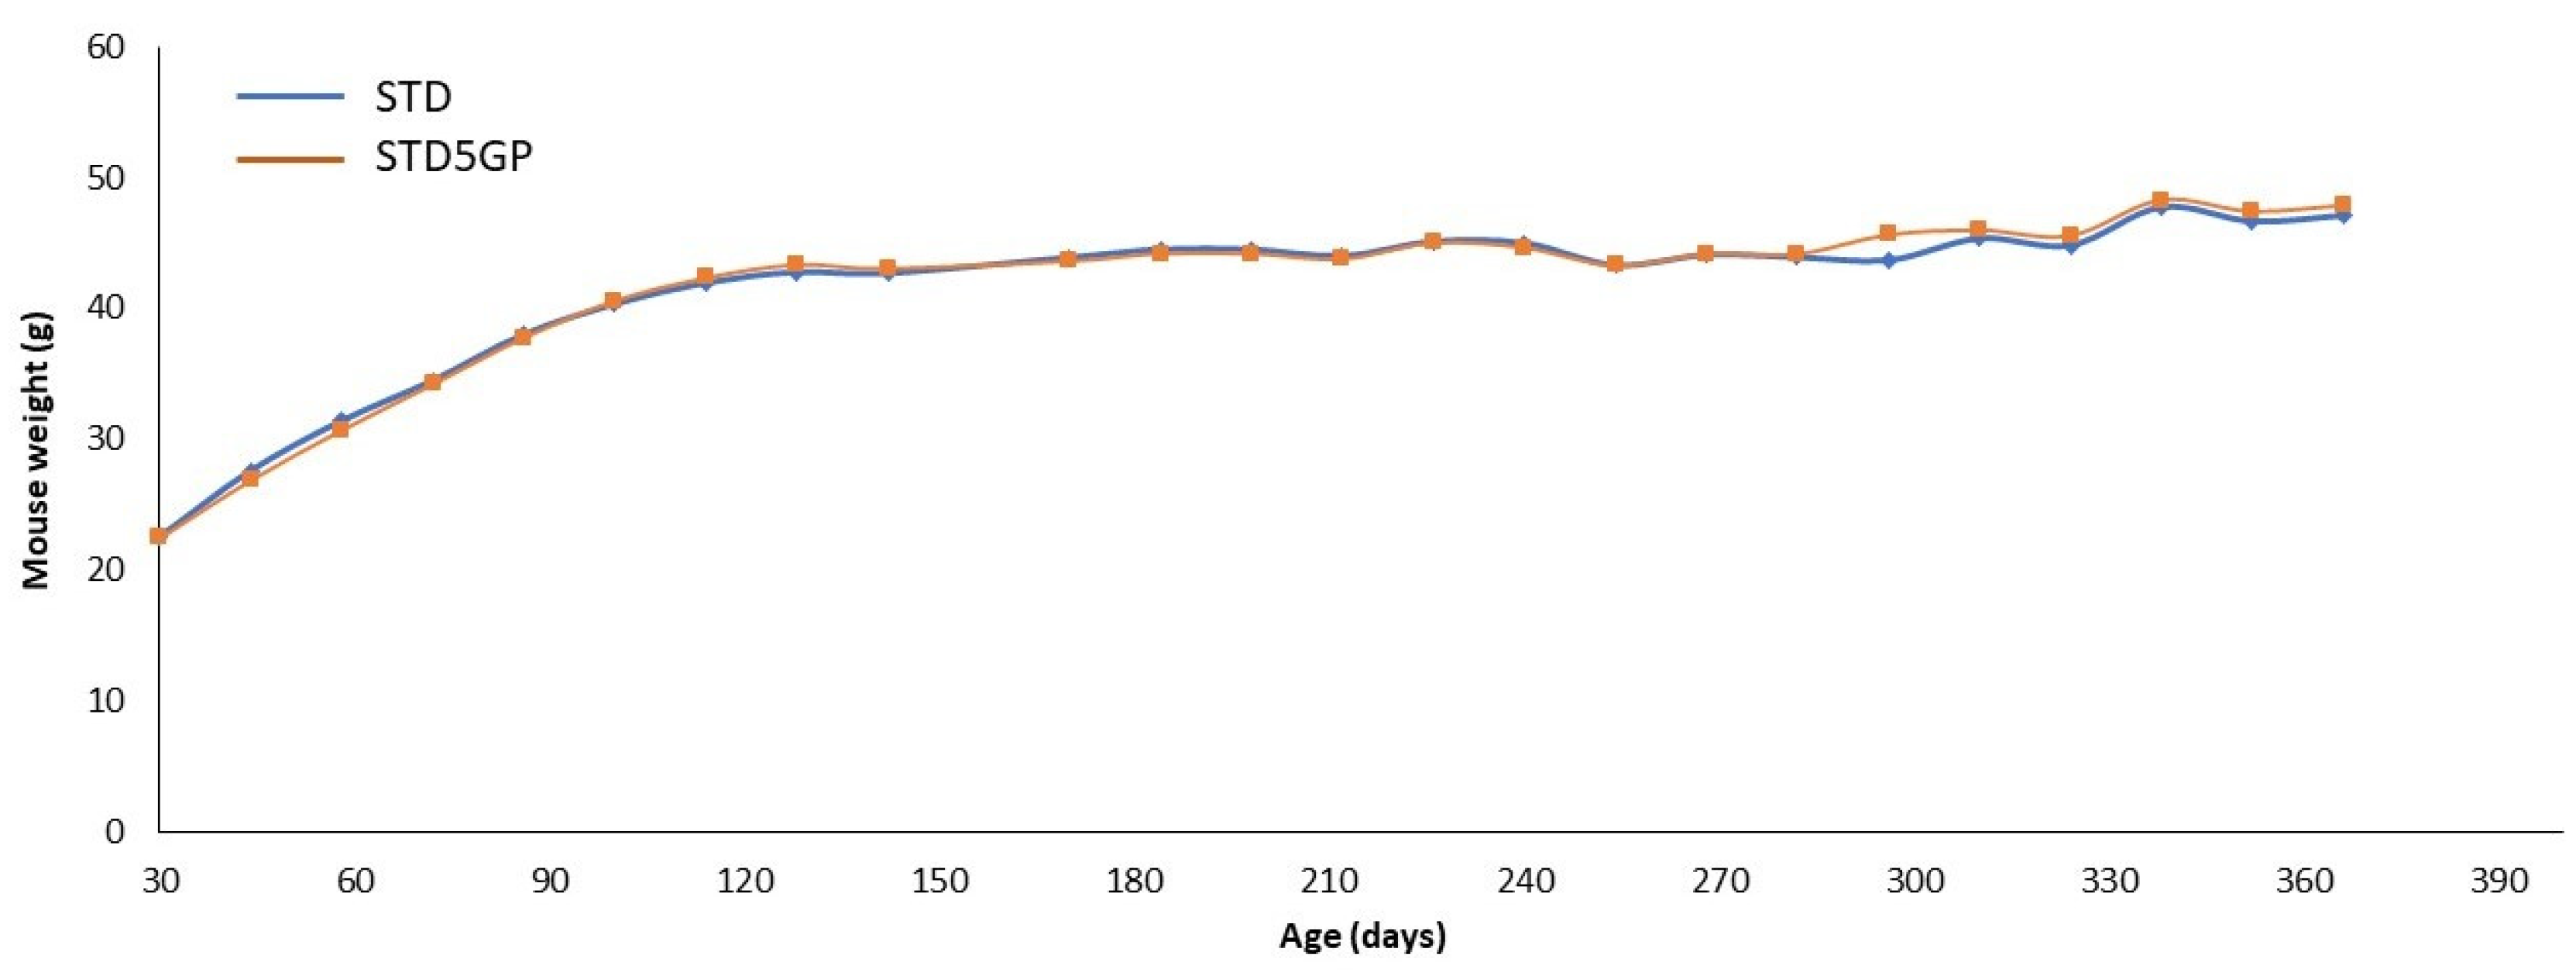
3.1. Body Weight and Dose Selection

For the current study, we elected to supplement the murine diet with 5% standardized grape powder. For humans, a single serving of grapes is considered to be ¾ of one cup, which is approximately 124 g. Accordingly, based on body weight, daily consumption rates, and metabolic correction factors [14], it was estimated that supplementation of the mouse diet with 5% grape powder corresponds to the daily consumption of about 2.5 servings of fresh grapes by a human weighing 70 kg.
In previous studies, we have demonstrated that the murine consumption rate of the STD and STD5GP does not differ [11]. This is clearly supported by the data shown in Figure 1. Body weight was determined every two weeks for the duration of the study. No significant difference was observed between the body weights of the two groups throughout. At the end of the study, the body weights of the STD and STD5GP groups were 41.46 ± 6.33 and 41.62 ± 6.60 g, respectively (p = 0.931, Student’s t-test).

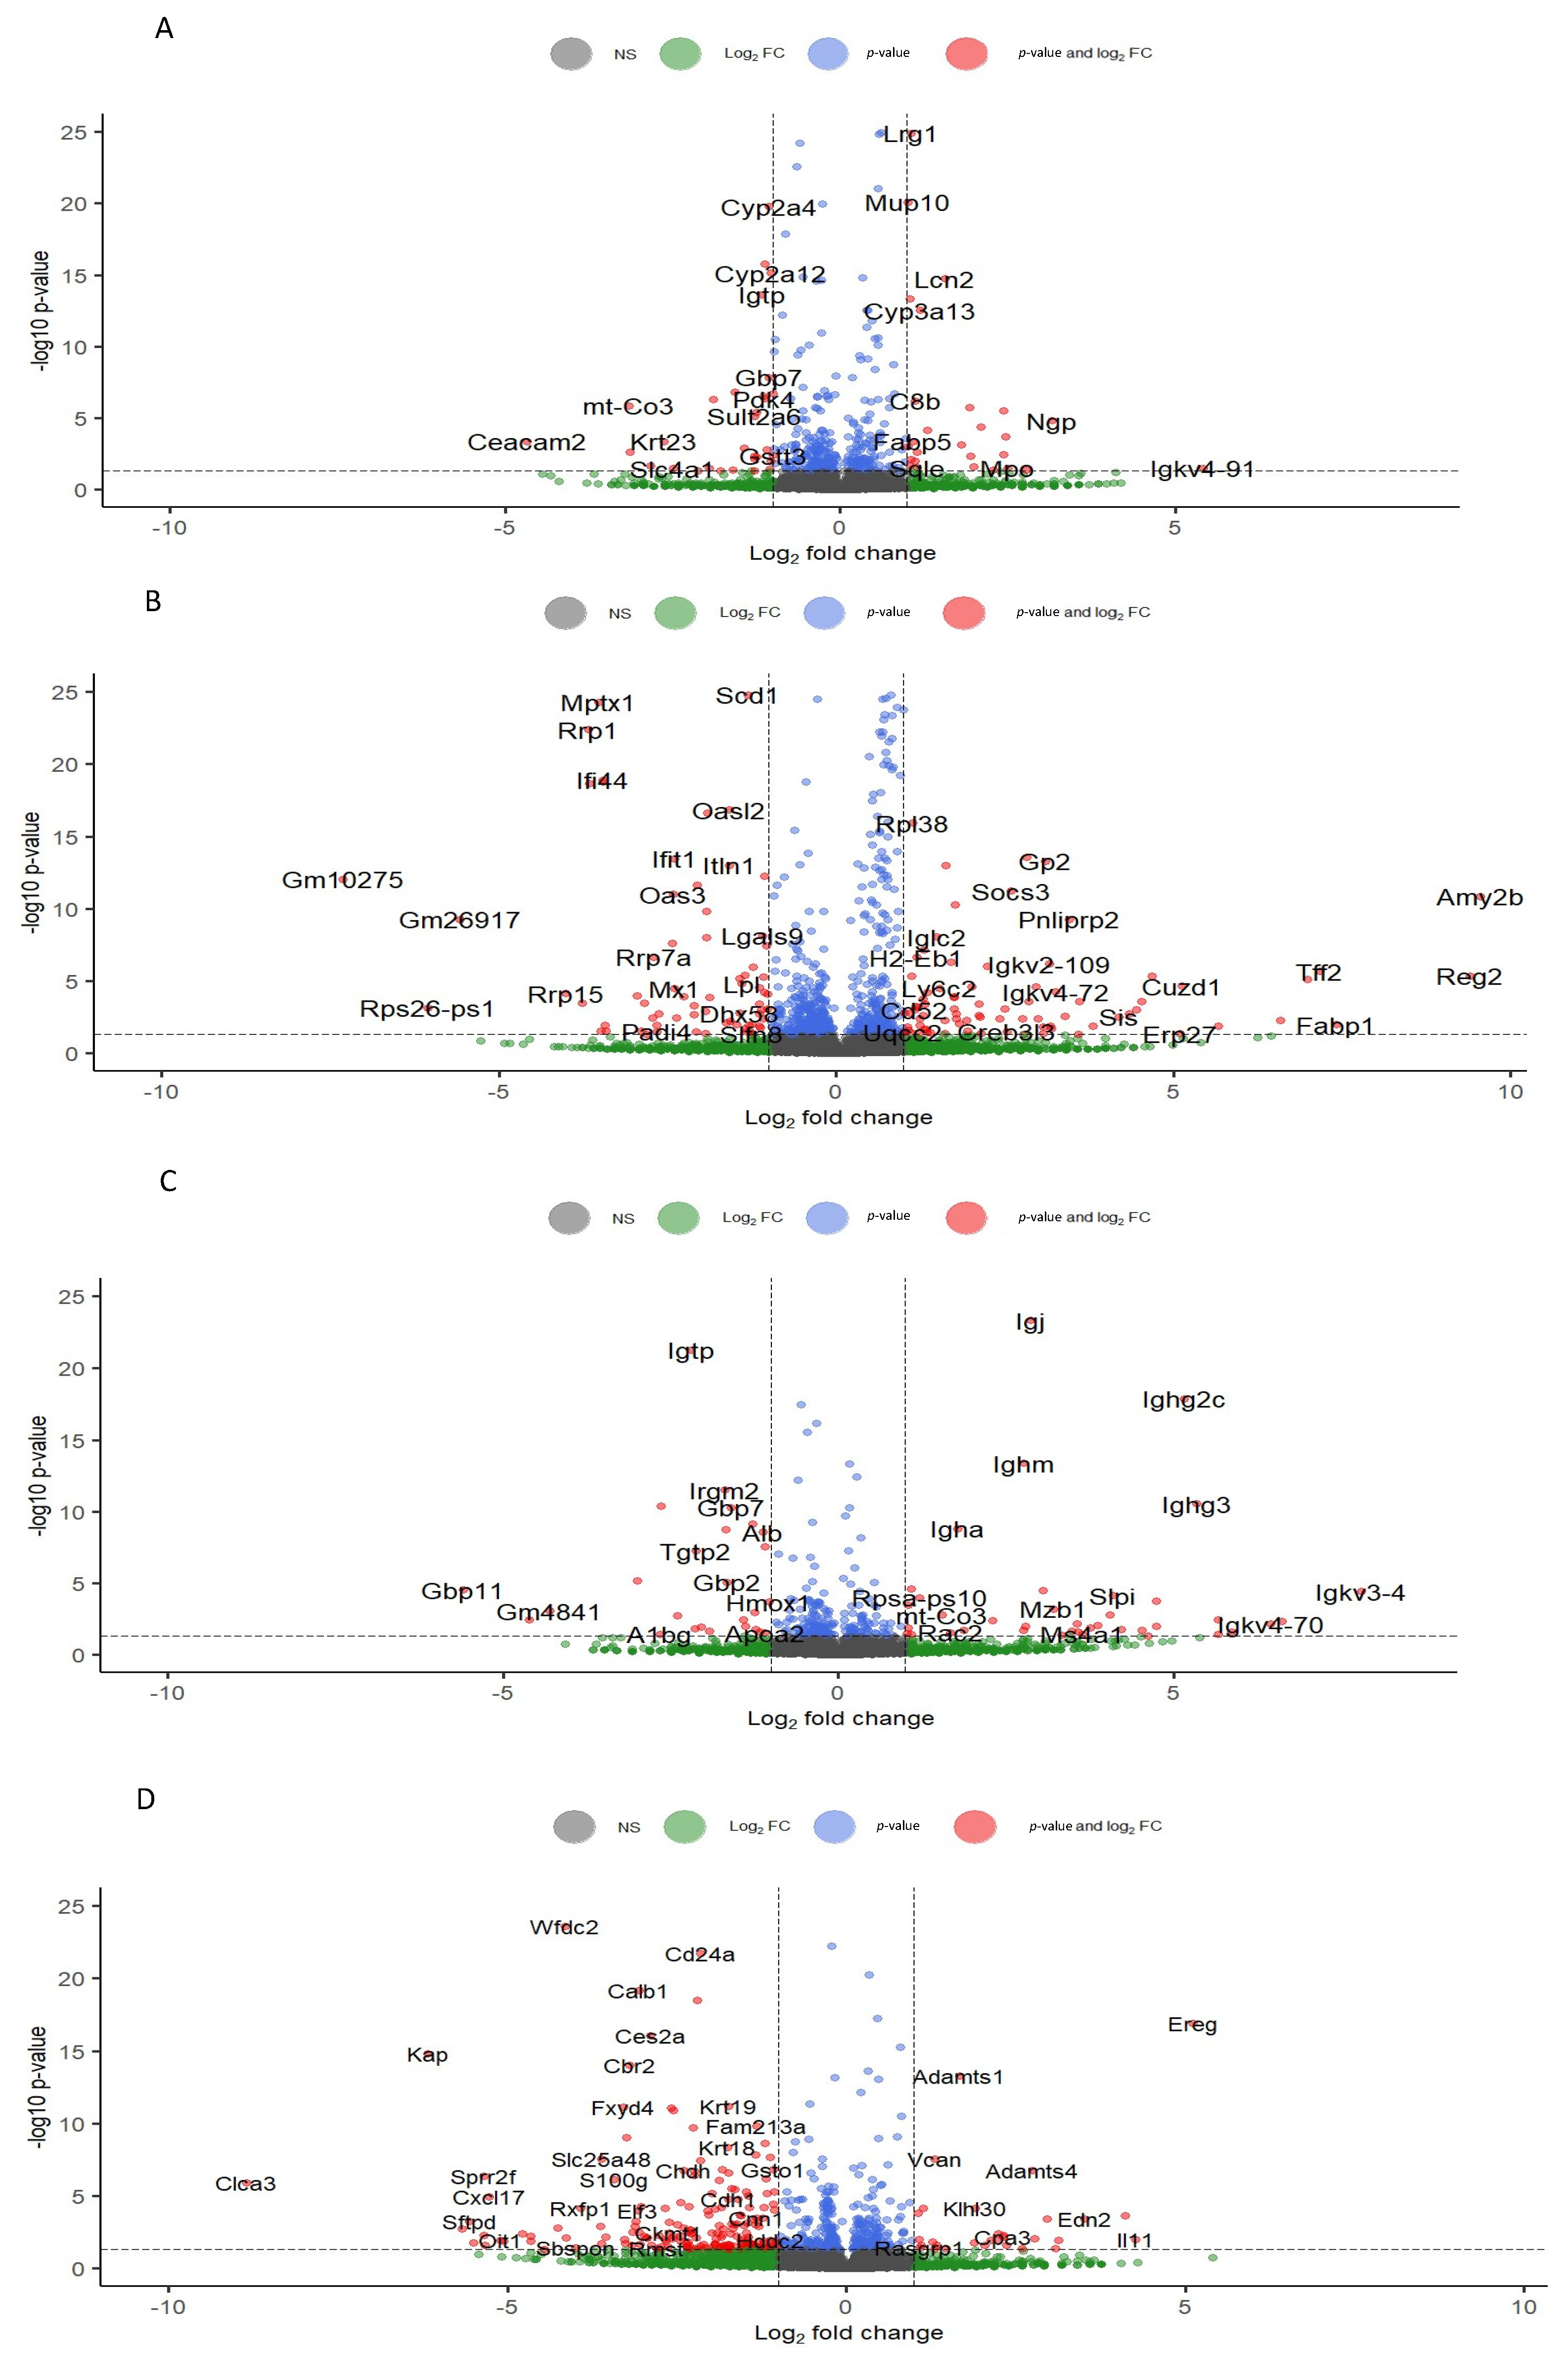
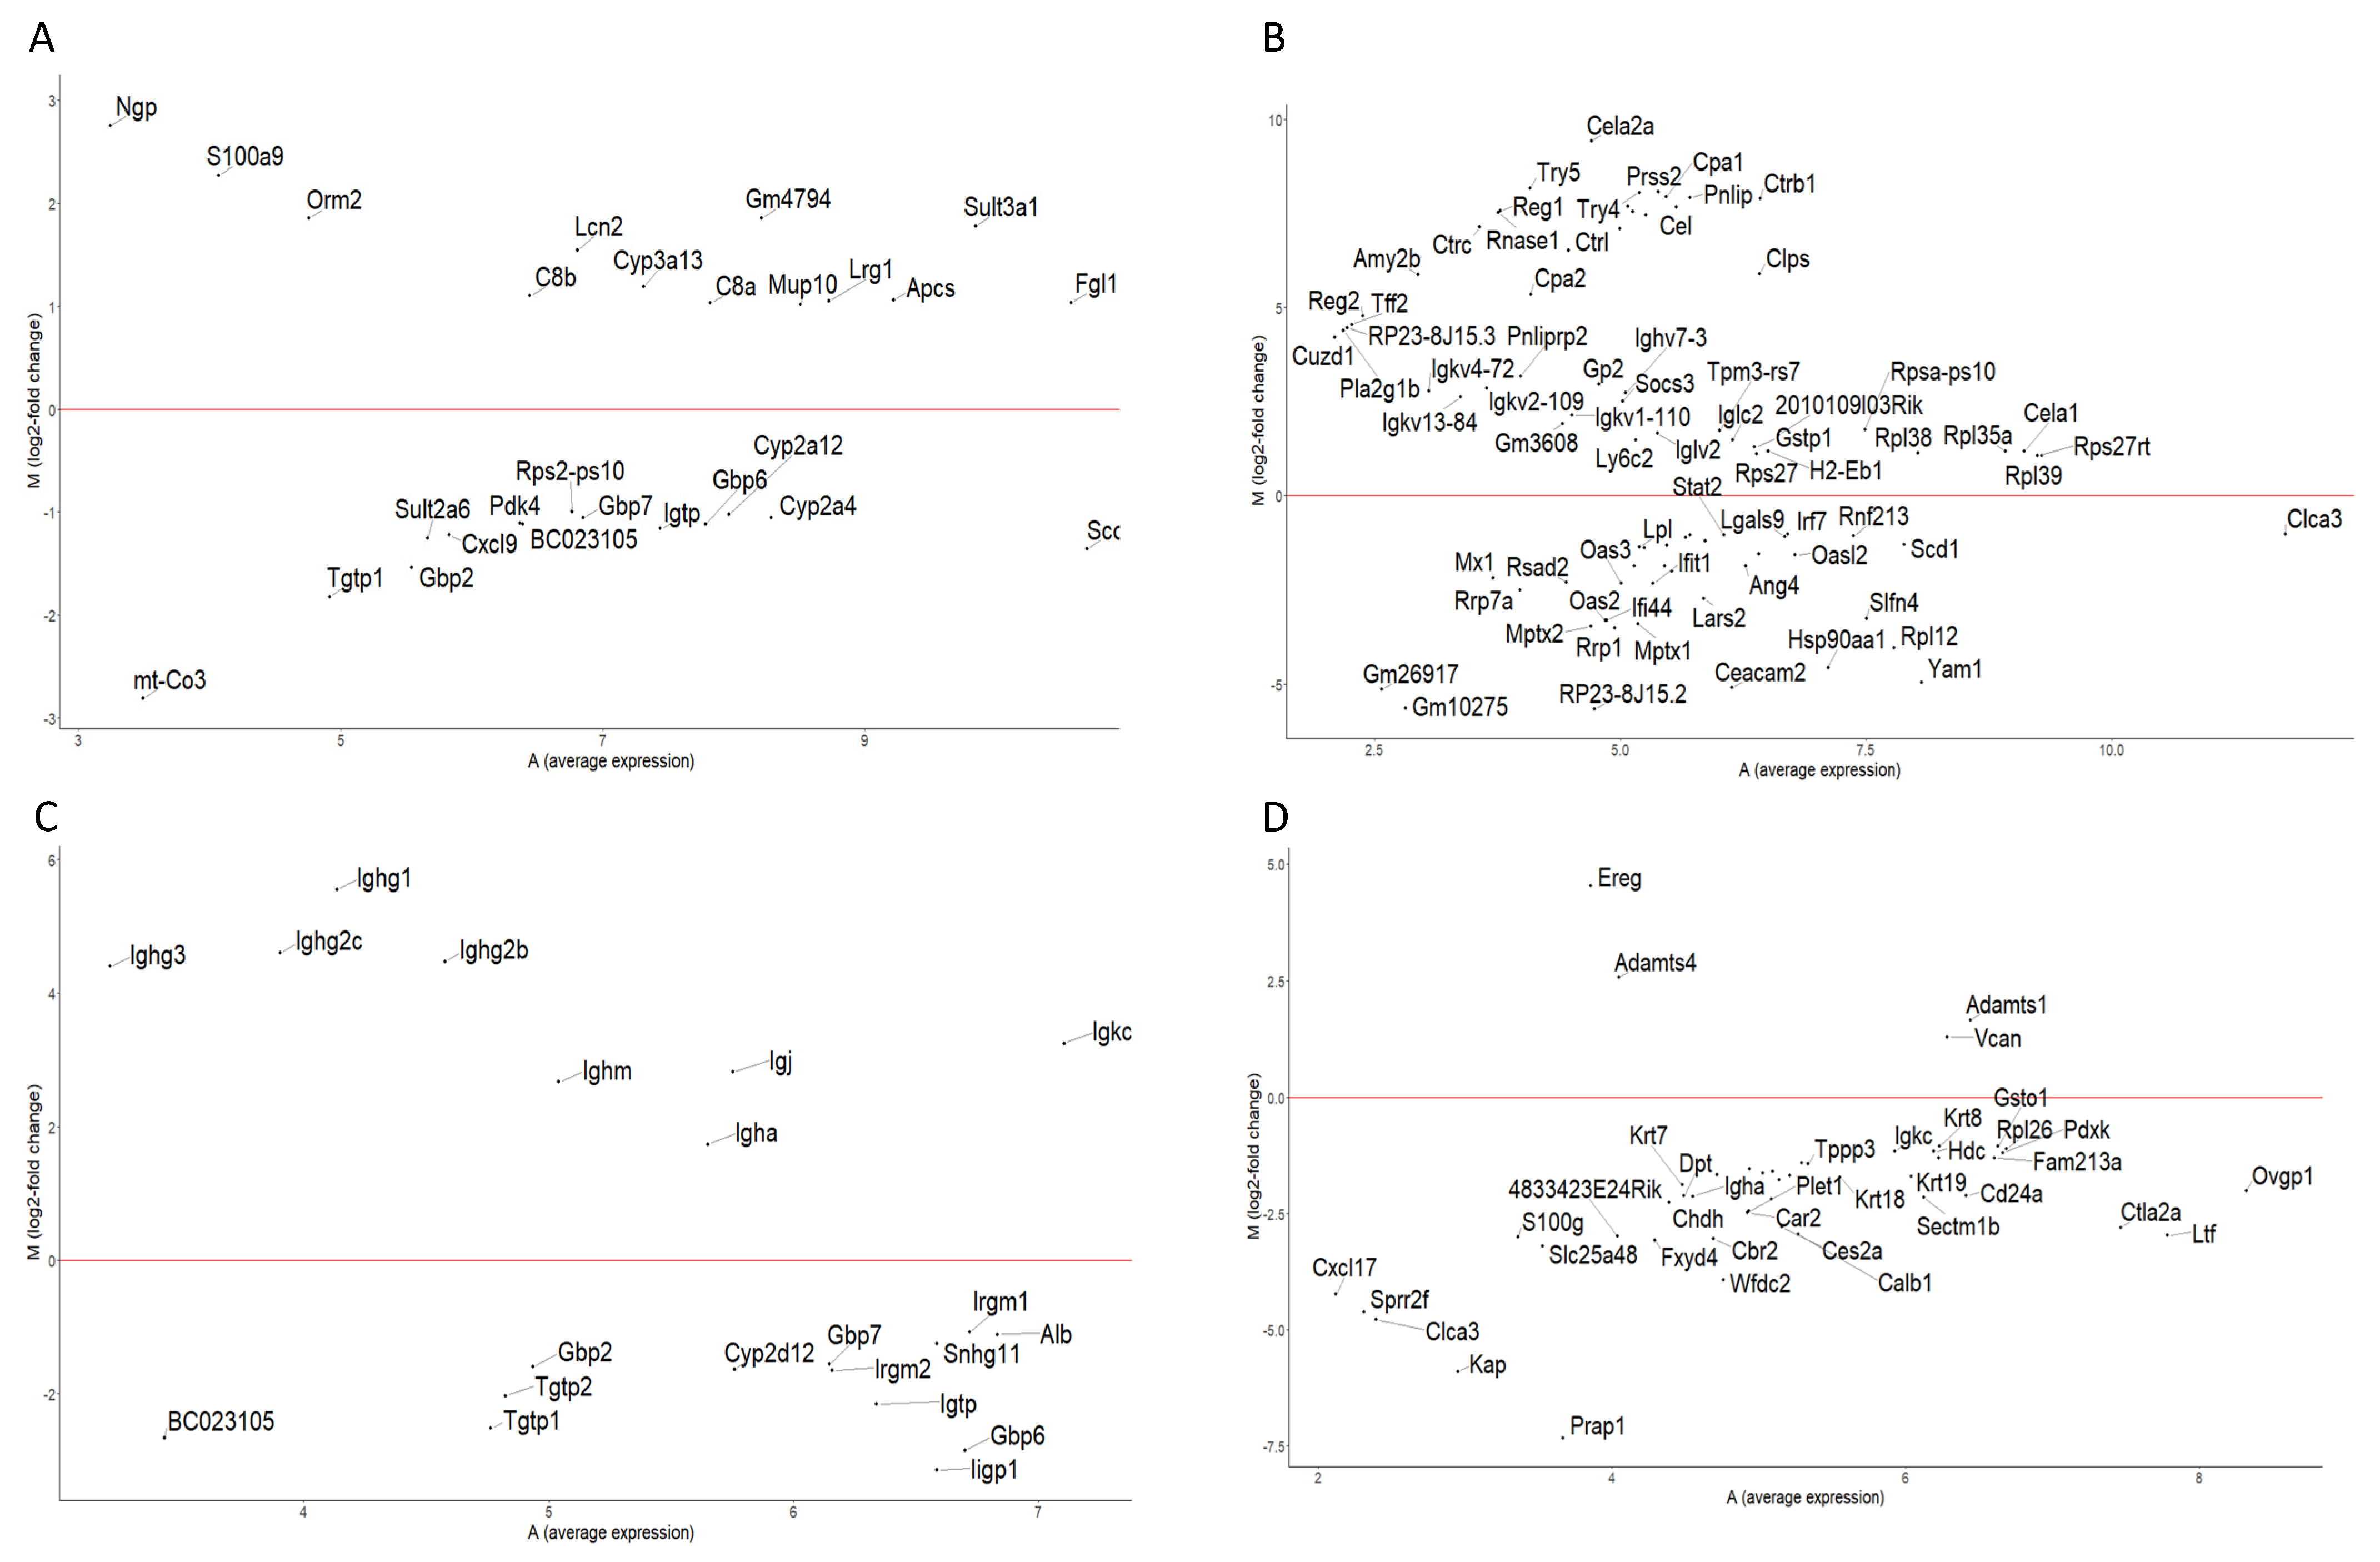
3.2. Differential Gene Expression

To understand the multi-organ effect of grape consumption, we conducted RNA seq analysis from samples derived from the liver, colon, kidney, and ovary, as described in Section 2.4. Differential expression analysis was performed for each organ, with the criteria of q < 0.05 and Log2(Fold-change) > 1 for gene selection. A list of genes from the differentially expressed gene (DEG) analysis, showing genes both up- and down-regulated by consumption of the grape diet, is provided in Table S1.
When comparing the STD5GP vs. STD diet groups in the liver, we observed 27 DEGs (13 up-regulated and 14 down-regulated). The colon exhibited a higher number of DEGs, with 84 being differentially expressed (47 up-regulated; 37 down-regulated). In the kidney, we noted 21 DEGs (eight up-regulated and 13 down-regulated), and in the ovary, we found 49 DEGs (four up-regulated and 45 down-regulated).
These data are exhibited as heat maps in Figure 2. The maps illustrate the shift in the gene expression across the tissues. Hierarchical clustering using Ward’s linkage was performed on the rows of the heat maps to minimize within-cluster variance for further analysis of the biological responses of genes. Figure 2A displays expression alterations within the liver, while Figure 2B displays changes occurring in the colon. Similarly, Figure 2C reveals the differential expression patterns in the kidney, and Figure 2D provides a visual representation of variations in the gene expression of the ovary. The genes featured in each heat map are drawn from tissue-specific DEG lists. This portrayal vividly captures the shift in expression patterns with the indicated tissues.
We created volcano plots to visualize the entire gene list in our dataset and distinguish genes based on expression levels and statistical significance (Figure 3). The entire gene list is comprised of 35,275 genes, and the volcano plots show gene distribution for the liver (Figure 3A), colon (Figure 3B), kidney (Figure 3C), and ovary (Figure 3D). The plots further differentiate the genes based on their fold-change threshold Log2(Fold-change) > 1 and the significance value (p < 0.05). This allows us to identify genes with significant expression changes induced by the grape diet, separating them from genes with lower expression changes.
Moreover, the DEG list from Table S1, which was visualized in the volcano plots (Figure 3), was used to generate MA plots (Figure 4). These plots illustrate the expression levels of the DEGs for each organ, namely, the liver (Figure 4A), colon (Figure 4B), kidney (Figure 4C), and ovary (Figure 4D). The distinct populations of genes on the MA plot represent the influence of grapes on the genes; some genes are clustered closely while others are uniquely positioned, suggesting varying magnitude of expression changes.

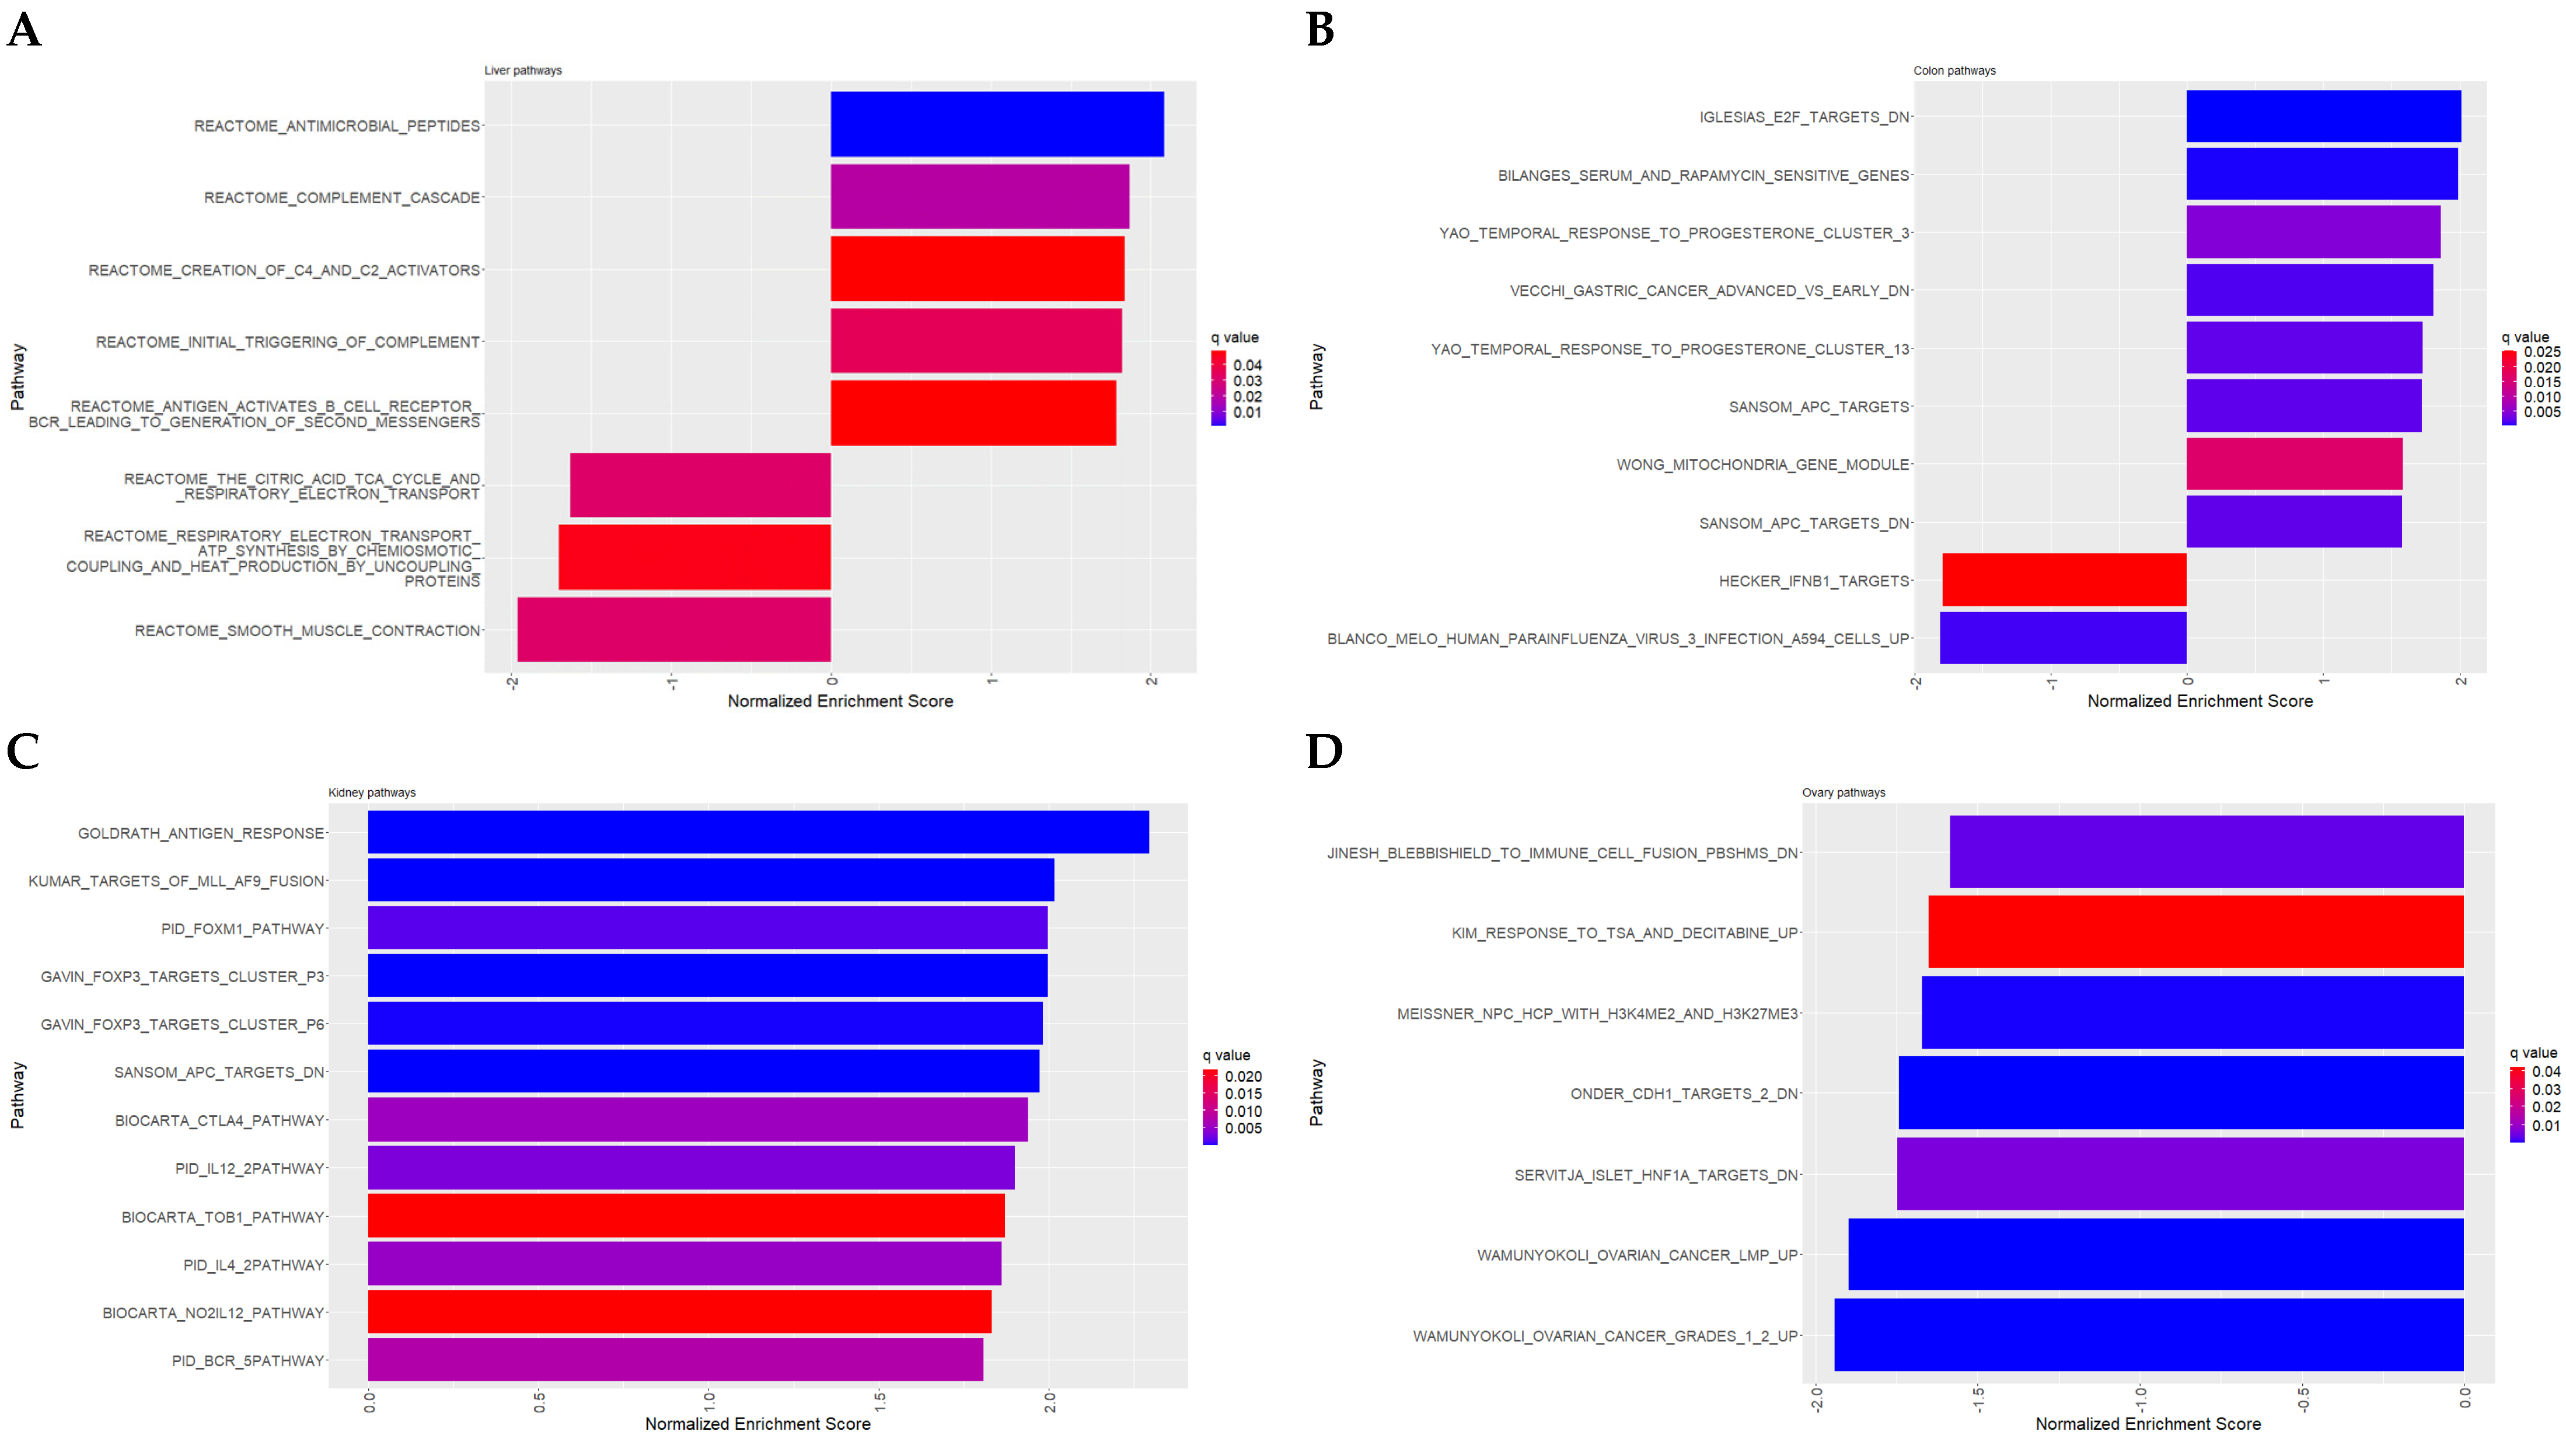
3.3. Pathway Analysis and Gene Enrichment

As an attempt to gain functional insight into the changes observed in various organs resulting from grape consumption, we conducted pathway analysis on the entire gene set. The pathways were analyzed for each subject organ: liver (Figure 5A), colon (Figure 5B), kidney (Figure 5C), and ovary (Figure 5D). Functional annotations of these pathways were derived from cancer gene pathways, Reactome pathways, PID pathways, and Biocarta. The data set used for the analysis was generated by comparing STD5GP vs. STD diet groups, and each specific gene set corresponding to a particular pathway was identified based on the ontology domain. The analysis provides the enrichment score and the statistical values, which were utilized to generate bar plots (Figure 5) for the significantly enriched pathways with q < 0.05. The pathways for each organ suggest the magnitude of enrichment influenced by grape consumption.

3.3.1. Liver

  • Pathway analysis
In the liver, pathways such as the citric acid cycle (TCA cycle) and the respiratory electron transport chain associated with ATP synthesis were found to be enriched in the STD group. With STD5GP, the triggering of complement and the complement cascade were enriched, suggesting enhanced capability of the liver to combat foreign invaders, including bacteria and viruses [15]. Further, the up-regulation of antimicrobial peptides and other immune activators suggests a homeostatic response to potential allergens within the tissue.
  • Genes enriched
STD5GP exhibited up-regulated genes associated with various functions, including xenobiotic detoxification (Sult3a1) [16], protection through sulfation of benzene metabolites (Gm4794) [17], promotion of mitochondrial mitosis in response to liver injury (FGL1) [18], tumor suppressor gene (APCs) [19], and up-regulation of a component of the complement system (C8a) [20]. Down-regulation of the biosynthesis of monounsaturated fatty acids (SCd1) [21] was observed.

3.3.2. Colon

  • Pathway analysis
In the colon, grape consumption induced the enrichment of various pathways. Specifically, the grape diet enhanced the enrichment of response to progesterone clusters 3 and 13, which are essential in regulating apoptosis. Additionally, the grape diet demonstrated enrichment of the mitochondria gene module, which is involved in energy production within the mitochondria [22]. Conversely, pathways associated with gastric cancer were down-regulated in response to the grape diet. The APC pathway exhibited a neutral response, while the E2F targets pathway showed down-regulation. Moreover, the grape diet resulted in the enrichment of the rapamycin-sensitive genes pathway.
  • Genes enriched
STD5GP exhibited up-regulated genes associated with various functions, including CTRB1 [23] and clps [24], involved in the breakdown of food and the absorption of nutrients, and cpa1, which helps to protect the tissue from harmful bacteria and viruses through carboxypeptidase A1 [25]. Further, cel was up-regulated, which is responsible for regulating the pH of the colon [26], and Pnlip exhibited up-regulation, facilitating intestinal cholesterol absorption [27]. Furthermore, grape consumption was found to up-regulate the antiapoptotic gene Reg1, contributing to the regeneration of the gastric mucosal layer [28].
Conversely, the grape diet showed down-regulation of ceacam2, which is found in diseases such as ulcerative colitis and Crohn’s disease [29]. Further, down-regulation of LARS2 was found in the STD5GP, which is shown to contribute to colorectal cancer [30]. Additionally, down-regulation was observed in clca3, which is associated with the prognosis of colon cancer [31].

3.3.3. Kidney

  • Pathway analysis
In the kidney, we observed enrichment of immune regulators, such as FOXP3 clusters, coupled with antigen response pathways. Further, we discovered enrichment of the IL-4 pathway, which plays a regulatory role in inflammation and fibrosis within the kidney [32]. The grape diet also demonstrated enrichment of the FOXM1 pathway, suggesting its pivotal involvement in repairing damaged kidney cells [33]. This enrichment coincided with the enrichment of the BCR-5 signaling pathway. Additionally, we observed enrichment of the IL-12 pathway, which is closely associated with Th-1 immune response [34]. This pathway may significantly combat infections caused by bacteria and other pathogens [35].
The consumption of grapes led to the enrichment of the Transducer of the ERBB2.1 (TOB1) pathway, which functions as a tumor suppressor and acts as a negative regulator of the ERBB2 receptor tyrosine kinase [36]. Additionally, the enrichment of the NO2IL12 pathway indicated the potential role of grapes in promoting host defense against intracellular microbial infections and controlling malignancy [37]. Furthermore, we observed enrichment of the CTLA4 pathway, highlighting the effect of grapes in preventing autoimmune diseases by inhibiting T cell activation [38].
  • Genes enriched
In the kidney, we observed that grape consumption up-regulated genes associated with the production of the immunoglobulin kappa light chain (IGKC), along with the up-regulation of IGJ. This up-regulation enhances the ability of the kidney to combat infections [39,40]. Furthermore, grape consumption resulted in the up-regulation of IgA, which can potentiate a neutralizing effect on pathogens [41]. Additionally, the up-regulation of Ighm in the grape diet can further strengthen the immune defense of the kidney [42]. Notably, grape down-regulated gbp2 and snhg11 are associated with malignancy in renal cell carcinoma [43,44]. Further, down-regulation of irgm1 and irgm2 was observed, which can be associated with suppression of cell formation and Akt activation [45], further leading to suppressed carcinogenesis [45].

3.3.4. Ovary

  • Pathway analysis
In ovaries, we found significant enrichment of the ovarian cancer pathway, as well as the CDH1 targets and HNF1A pathways. Moreover, the enrichment of nuclear pore complex proteins and heat shock proteins in the STD diet provided a potential relationship between these proteins and ovarian cancer [46,47]. Furthermore, a down-regulation of the immune cell fusion PBShMS pathway was observed, suggesting its involvement in the susceptibility to autoimmune diseases [48].
  • Genes enriched
In ovaries, we observed up-regulation of genes related to the process of ovulation, corpus luteum formation, and implantation of the embryo, as indicated by adamts [49] and vcan [50].
Conversely, there was a trend in down-regulation concerning genes related to ovarian cancer pathogenesis. Down-regulation of ovgp1 [51], which is involved in the development of ovarian cancer, coupled with suppression of CD24a [52], which acts as a tumor-promoting factor by stimulating angiogenesis. Notably, cxcl17 [53] was suppressed in the presence of STD5GP, suggesting reduced infiltration of antigen-presenting cells in the tissue. Additionally, our analysis revealed that the grape diet is a down-regulated promoter of methylation in ovarian cancer (cdh1) [54]. Moreover, TGF-beta signaling mediated ovarian cancer was attenuated by decreased expression of igkc [55]. Intriguingly, inhibition of genes such as krt7 [56], krt8 [56], ehf [57], s100p [58], cbs [59], wfdc2 [60], pdxk [61], fxyd [62], igj [40], snhg11 [63], and calb1 [64] provides evidence of suppressive impact of the grape diet on progression of tumors in the ovary.

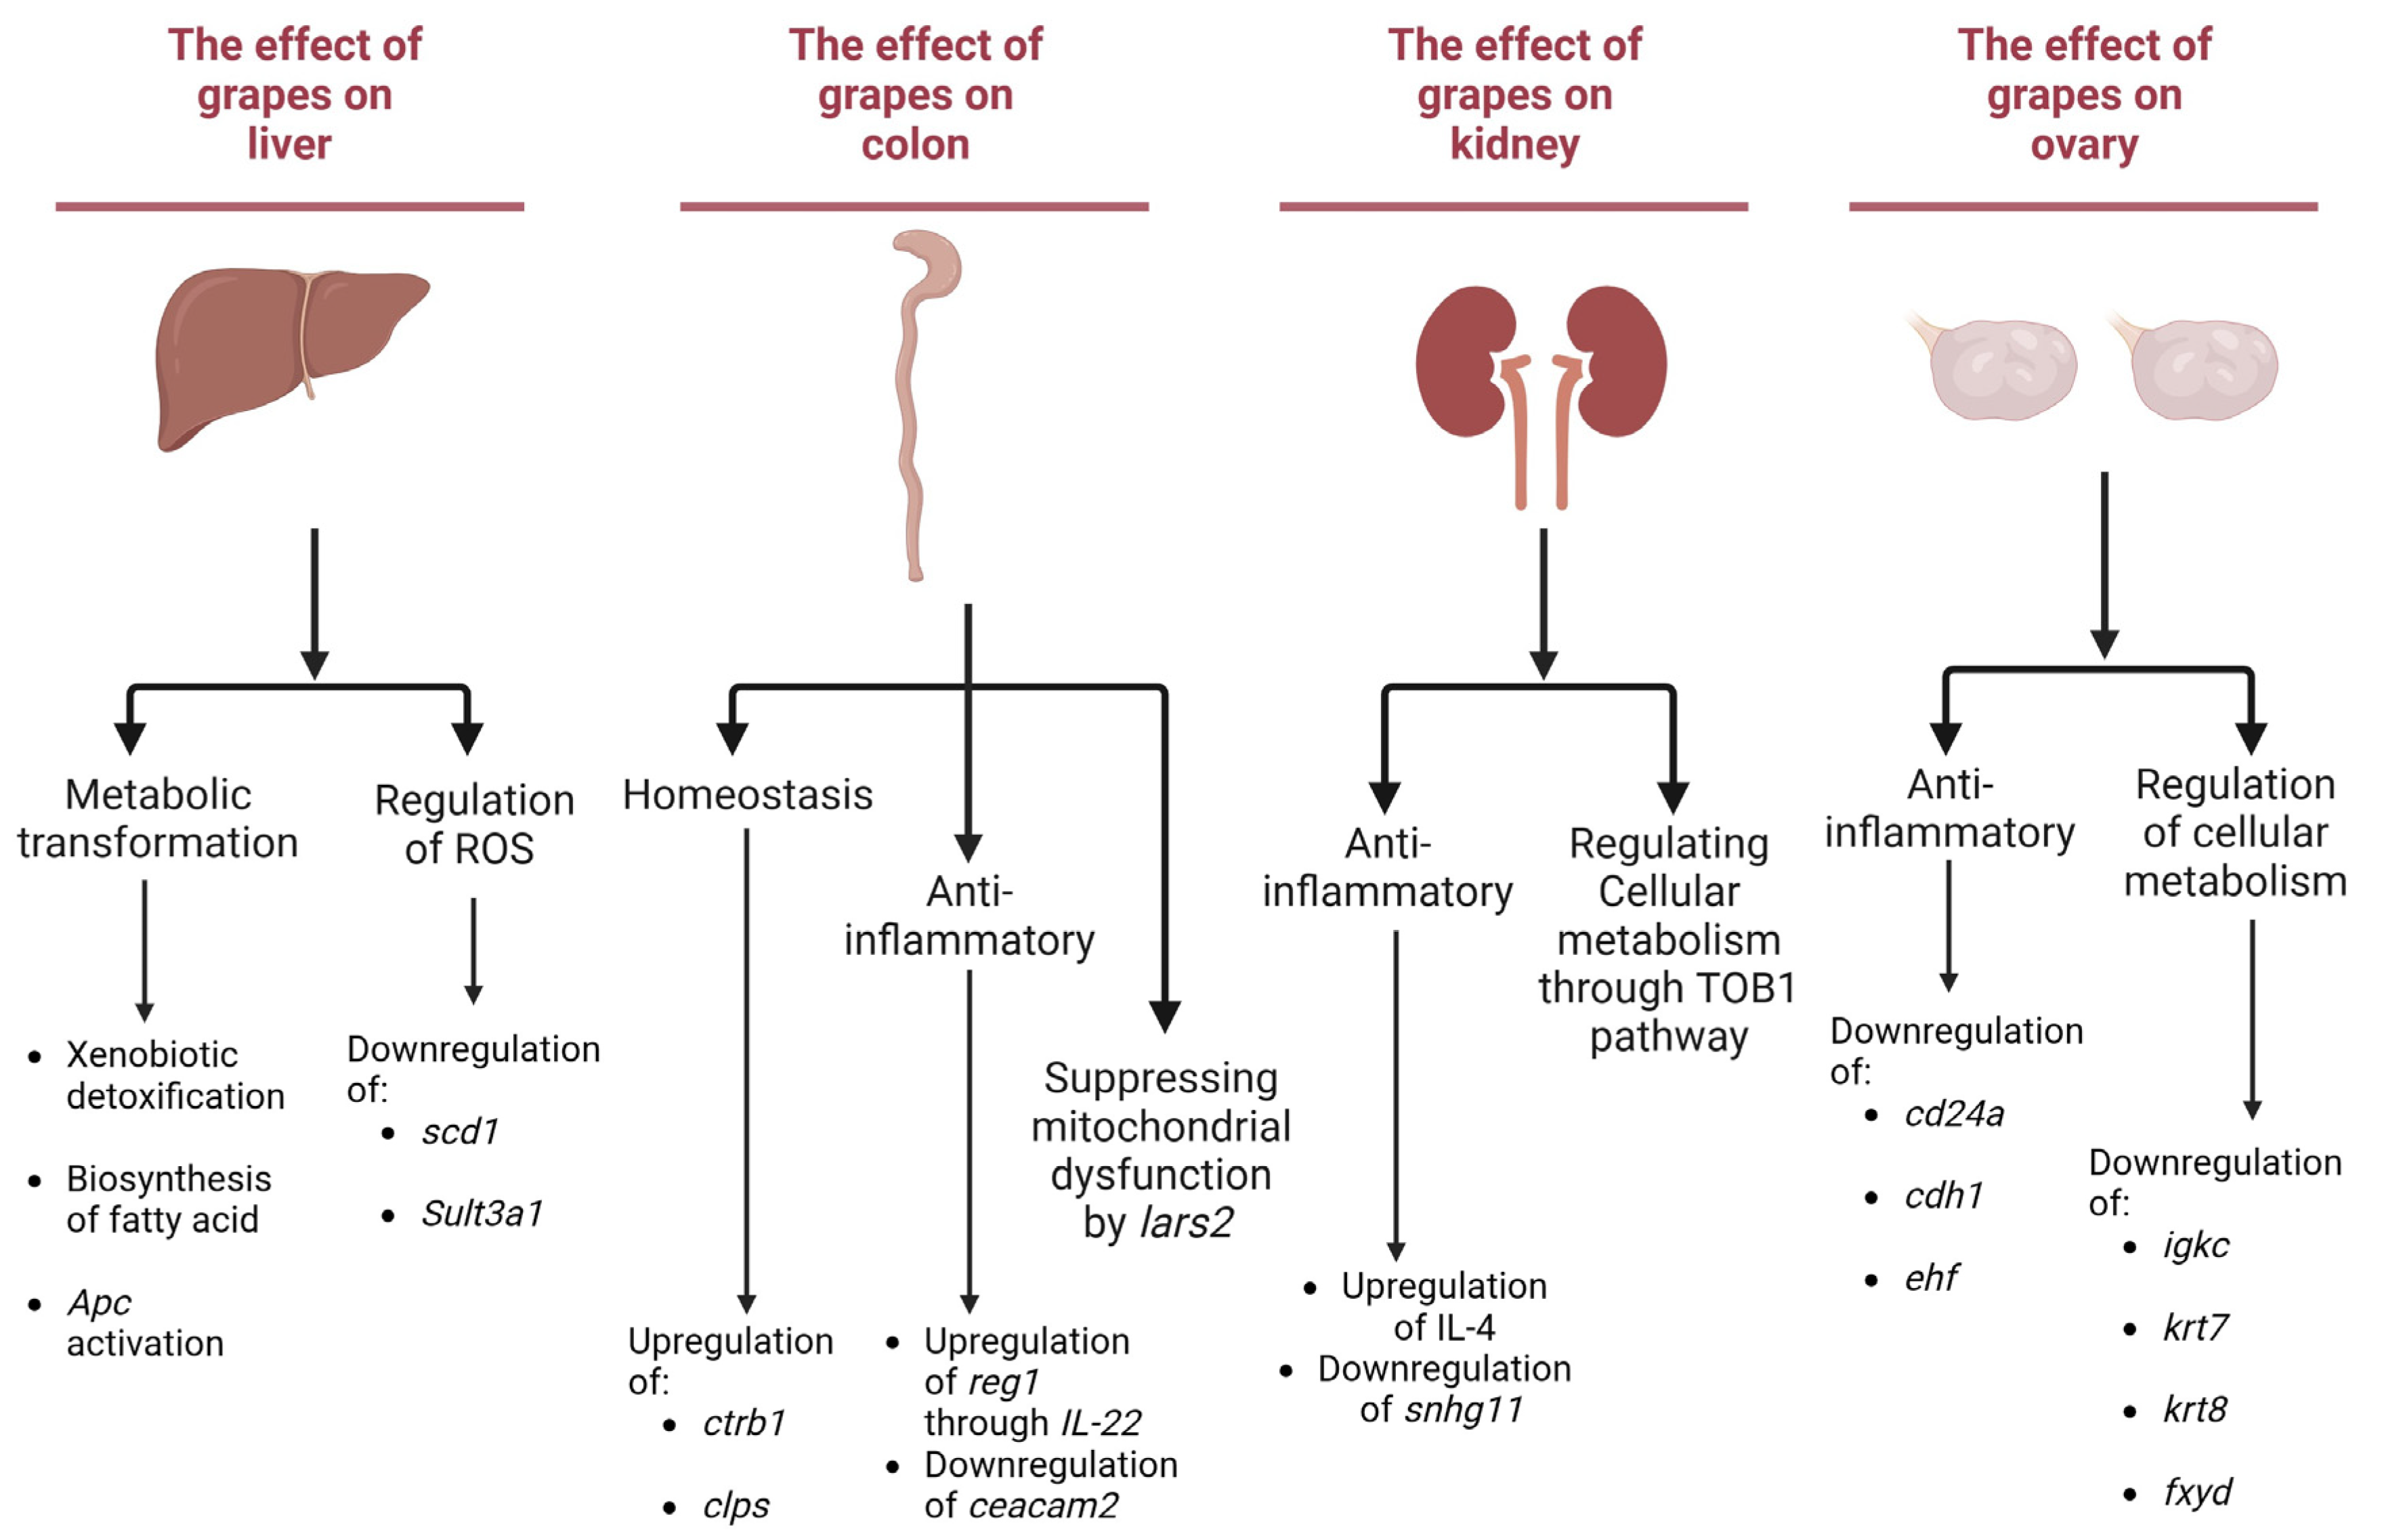
3.4. Potential Influence of Grape Consumption on Metabolic Pathways Associated with Health

As described above, the addition of grapes to the diet of mice influences gene expression in the liver, colon, kidney, and ovary, and presumably other organs as well. In related work, we have demonstrated physiological responses likely resulting from grape consumption related to the liver [11], brain [12], and longevity [11]. More broadly, dietary grapes have been demonstrated to mollify various disease states [4] in clinical trials and animal models.
In general, based on the alteration of gene expression modulated by grapes, it is logical to anticipate some cause-and-effect relationship. The main objective of this work was to examine the multi-organ nutrigenomic potential of grapes (Figure 6). Direct assessment of physiological responses was beyond the scope of the study. However, based on the accumulated data, it is possible to analyze the influence of grapes on metabolic pathways established as relevant to illness. Although additional investigations are required to prove such cause/effect relationships, some examples follow that provide suggestive evidence and a rationale for additional work.

3.4.1. Liver-Associated Effects

In the liver, several facets of grape-related effects have emerged. First, grapes up-regulated the expression of sult3a1, which is associated with drug metabolism and pharmacokinetics (DMPK) responsible for xenobiotic detoxification [65]. This alteration in sult3a1 expression is essential since it has been down-regulated in response to high-fat diets [65]. Importantly, the impact of sult3a1 extends beyond metabolic processes, as its action in the liver contributes to reducing the risk of bladder cancer by decreasing the exposure of bladder tissue to toxins [66]. Furthermore, grapes exhibit an inhibitory effect on the biosynthesis of monounsaturated fatty acids via the enzyme scd1 in the liver. This observation reinforces the potential of grapes in combatting adiposity [67]. Additionally, scd1 plays a pivotal role in regulating ferroptosis [68], thereby reducing lipid reactive oxygen species [69]. Moreover, the ability of grapes to promote the activation of antigen-presenting cells (APCs) holds the potential for preventing hepatocellular carcinoma, particularly through the Wnt/β-catenin pathway [70]. This function is tied to the spatial organization within the portocentral axis, highlighting the significance of grapes in orchestrating metabolic and biotransformation processes within specific hepatic zones [19]. These multifaceted effects emphasize the interplay between metabolism and regulation of pathogenesis.

3.4.2. Colon-Associated Effects

In the colon, grapes play a role in maintaining homeostasis through regulatory actions on ctrb1 and clps. As discussed previously regarding involvement in food breakdown and nutrient absorption, it is established that ctrb1 is a mediator of epithelial homeostasis, leading to amelioration of T cell-mediated colitis [71]. This protective effect is attributed to the nuclear receptor LRH-1, which binds to the proximal promoter of ctrb1, initiating downstream effects that promote cell survival and maintain epithelial homeostasis [71]. This function is further substantiated by the up-regulation of reg1, a downstream effector of IL-22 [72], and down-regulation of ceacam2, which is shown to be modified in inflammatory bowel disease (IBD) [73]. Further, grapes are involved in suppressing lars2, which has been linked with mitochondrial dysfunction [74]. This correlation is corroborated by our research findings that revealed an enrichment of down-regulated genes associated with the gastric cancer pathway, which suggests the impact of grapes on colon health, encompassing epithelial homeostasis and anti-inflammatory activity.

3.4.3. Kidney-Associated Effects

In the kidney, the anti-inflammatory effects of grapes were indicated through the involvement of the IL-4 and FOXM1 pathways. In the context of acute kidney injury (AKI), it has been observed that IL-4 orchestrates the process of recovery, particularly within tubule-interstitial injury (TII) via albumin overload, without concurrent alterations in glomerular function [75]. Furthermore, the FOXM1 pathway is responsible for the proliferation of tubular epithelial cells following injury [76]. This occurs by regulating keratinocyte cell-cycle progression through the epidermal growth factor receptor (EGFR) [77]. Extending the scope of inquiry, we found down-regulation of genes such as gbp2, snhg11, irgm1, and irgm2 with the grape diet. Specifically, gbp2 has been observed to modulate the expression of programmed death-ligand 1 (PD-L1), along with the signal transducer and activator of transcription 1 [78]. Meanwhile, snhg11 has been identified to play a role in DNA methylation [79] and an inducer of glycogen synthase kinase 3 beta (GSK-3β) ubiquitination, thereby contributing to the activation of the Wnt/β-catenin pathway [80]. Additionally, enrichment of the transforming growth factor beta-1 (TOB1) pathway provides evidence supporting the potential of the grape diet to remodel cell metabolism [81].

3.4.4. Ovary-Associated Effects

In ovarian tissue, we observed enrichment of down-regulated genes associated with the ovarian cancer pathway. This down-regulation was primarily attributed to genes such as ovgp1, CD24a, cdh1, igkc, krt7, krt8, ehf, and fxyd. The down-regulation of CD24a, for instance, has been shown to inhibit the interaction with the inhibitory receptor known as sialic-acid-binding Ig-like lectin 10 (Siglec-10), which is expressed via tumor-associated macrophages. This suppression is significant in the context of cancer immunotherapy [82]. Furthermore, cdh1 is known to be involved in DNA methylation [54], which was down-regulated by the grape diet. Additionally, genes igkc, krt7, and krt8 play crucial roles in regulating the epithelial–mesenchymal transition (EMT), primarily through the TGF-β pathway [55,56], resulting in the regulating cellular metabolism [81]. Moreover, ehf has been found to reduce the phosphorylation of ERK and AKT, contributing to an anti-inflammatory effect. Simultaneously, the down-regulation of fxyd5 illustrates a mechanism by which the regulation of cell metabolism is sustained, involving the regulation of TGF-β-driven EMT [83].

4. Conclusions

Using a well-defined semi-synthetic diet, we have previously shown the phytochemical components associated with the consumption of grapes as a whole food modulate gene expression in the liver [11] and brain [12]. We currently demonstrate that the modulatory effect is generalized throughout the body, as exemplified by investigation of the kidney, colon, and ovary, as well as liver (Figure 6). Some ramifications of these phenotypic changes are suggested through pathway analysis and consideration of the specific gene function. However, the implications are much broader. From a holistic point of view, the potential of dietary grapes to alter gene expression and corresponding downstream responses signifies a broad-based mechanism that may contribute to the pleiotropic activities mediated by grapes. Naturally, any influence of diet on genetic homeostasis depends on the diet as a whole. Nonetheless, the utilization of grapes in this capacity may be viewed as a prototype that exemplifies the power of dietary nutrigenomics.

Supplementary Materials

The following supporting information can be downloaded at https://www.mdpi.com/article/10.3390/antiox12101821/s1, Table S1: Genes present in the DEG list for different tissues.

Author Contributions

Conceptualization, A.D., E.-J.P. and J.M.P.; methodology, A.D., E.-J.P. and J.M.P.; software, A.D. and E.-J.P.; validation, A.D., E.-J.P. and J.M.P.; formal analysis, A.D., E.-J.P. and J.M.P.; writing—original draft preparation, A.D., E.-J.P. and J.M.P.; writing—review and editing, A.D., E.-J.P. and J.M.P.; visualization, A.D.; supervision, E.-J.P. and J.M.P.; project administration, E.-J.P. and J.M.P.; funding acquisition, J.M.P. All authors have read and agreed to the published version of the manuscript.

Funding

This work was supported in part by the California Table Grape Commission (J.M.P.).

Institutional Review Board Statement

This study was conducted in accordance with the IACUC protocol approved at Long Island University (protocol number 19-07).

Data Availability Statement

The datasets generated and analyzed for the current study are available in the National Center for Biotechnology Information (NCBI) repository. Bioproject accession number PRJNA1004855.

Conflicts of Interest

J.M.P. serves on the scientific advisory committee for the California Table Grape Commission. The funders had no role in the design of the study, in the collection, analyses, or interpretation of data, in the writing of the manuscript, or in the decision to publish the results. The remaining authors declare that they have no competing interest.

Abbreviations

AKI, acute kidney injury; APCs, antigen-presenting cells; DEG, differentially expressed gene; DMPK, drug metabolism and pharmacokinetics; EMT, epithelial–mesenchymal transition; GSK-3β, glycogen synthase kinase 3 beta; IACUC, institutional animal care and use committee; IGKC, immunoglobulin kappa light chain; IBD, inflammatory bowel disease; PE, paired-end; PD-L1, programmed death-ligand 1; siglec-10, sialic-acid-binding Ig-like lectin 10; STD, standard diet; STD5GP, standard diet containing 5% grape powder; EGFR, epidermal growth factor receptor; TOB1, transducer of ERBB2.1; TOB1, transforming growth factor beta-1; TII, tubule-interstitial injury (TII).

References

  1. Pezzuto, J.M. Resveratrol: Twenty Years of Growth, Development and Controversy. Biomol. Ther. 2019, 27, 1–14. [Google Scholar] [CrossRef] [PubMed]
  2. Pezzuto, J.M. Grapes and Human Health: A Perspective. J. Agric. Food Chem. 2008, 56, 6777–6784. [Google Scholar] [CrossRef] [PubMed]
  3. van Breemen, R.B.; Wright, B.; Li, Y.; Nosal, D.; Burton, T. Standardized Grape Powder for Basic and Clinical Research. In Grapes and Health; Pezzuto, J.M., Ed.; Springer International Publishing: Cham, Switzerland, 2016; pp. 17–26. [Google Scholar] [CrossRef]
  4. Pezzuto, J.M. Grapes and Health; Springer: Heidelberg, Germany, 2016. [Google Scholar]
  5. Pezzuto, J.M.; Dave, A.; Park, E.-J.; Beyoğlu, D.; Idle, J.R. Short-Term Grape Consumption Diminishes UV-Induced Skin Erythema. Antioxidants 2022, 11, 2372. [Google Scholar] [CrossRef]
  6. Dave, A.; Beyoğlu, D.; Park, E.-J.; Idle, J.R.; Pezzuto, J.M. Influence of grape consumption on the human microbiome. Sci. Rep. 2023, 13, 7706. [Google Scholar] [CrossRef] [PubMed]
  7. Kanner, J.; Frankel, E.; Granit, R.; German, B.; Kinsella, J.E. Natural antioxidants in grapes and wines. J. Agric. Food Chem. 1994, 42, 64–69. [Google Scholar] [CrossRef]
  8. Li, X.; Yang, X.; Cai, Y.; Qin, H.; Wang, L.; Wang, Y.; Huang, Y.; Wang, X.; Yan, S.; Wang, L.; et al. Proanthocyanidins from Grape Seeds Modulate the NF-κB Signal Transduction Pathways in Rats with TNBS-Induced Ulcerative Colitis. Molecules 2011, 16, 6721–6731. [Google Scholar] [CrossRef]
  9. Yang, J.; Xiao, Y.-Y. Grape Phytochemicals and Associated Health Benefits. Crit. Rev. Food Sci. Nutr. 2013, 53, 1202–1225. [Google Scholar] [CrossRef]
  10. Milella, R.A.; Gasparro, M.; Alagna, F.; Cardone, M.F.; Rotunno, S.; Ammollo, C.T.; Semeraro, F.; Tullo, A.; Marzano, F.; Catalano, D.; et al. Gene Expression Signature Induced by Grape Intake in Healthy Subjects Reveals Wide-Spread Beneficial Effects on Peripheral Blood Mononuclear Cells. J. Funct. Foods 2020, 64, 103705. [Google Scholar] [CrossRef]
  11. Dave, A.; Park, E.-J.; Kumar, A.; Parande, F.; Beyoğlu, D.; Idle, J.R.; Pezzuto, J.M. Consumption of Grapes Modulates Gene Expression, Reduces Non-Alcoholic Fatty Liver Disease, and Extends Longevity in Female C57BL/6J Mice Provided with a High-Fat Western-Pattern Diet. Foods 2022, 11, 1984. [Google Scholar] [CrossRef]
  12. Parande, F.; Dave, A.; Park, E.-J.; McAllister, C.; Pezzuto, J.M. Effect of Dietary Grapes on Female C57BL6/J Mice Consuming a High-Fat Diet: Behavioral and Genetic Changes. Antioxidants 2022, 11, 414. [Google Scholar] [CrossRef]
  13. Beyoğlu, D.; Park, E.-J.; Quiñones-Lombraña, A.; Dave, A.; Parande, F.; Pezzuto, J.M.; Idle, J.R. Addition of Grapes to Both a Standard and a High-Fat Western Pattern Diet Modifies Hepatic and Urinary Metabolite Profiles in the Mouse. Food Funct. 2022, 13, 8489–8499. [Google Scholar] [CrossRef] [PubMed]
  14. Nair, A.B.; Jacob, S. A Simple Practice Guide for Dose Conversion between Animals and Human. J. Basic Clin. Pharm. 2016, 7, 27–31. [Google Scholar] [CrossRef] [PubMed]
  15. Dunkelberger, J.R.; Song, W.-C. Complement and its Role in Innate and Adaptive Immune Responses. Cell Res. 2010, 20, 34–50. [Google Scholar] [CrossRef] [PubMed]
  16. Suiko, M.; Kurogi, K.; Hashiguchi, T.; Sakakibara, Y.; Liu, M.-C. Updated Perspectives on the Cytosolic Sulfotransferases (SULTs) and SULT-mediated Sulfation. Biosci. Biotechnol. Biochem. 2017, 81, 63–72. [Google Scholar] [CrossRef]
  17. French, J.E.; Gatti, D.M.; Morgan, D.L.; Kissling, G.E.; Shockley, K.R.; Knudsen, G.A.; Shepard, K.G.; Price, H.C.; King, D.; Witt, K.L.; et al. Diversity Outbred Mice Identify Population-Based Exposure Thresholds and Genetic Factors that Influence Benzene-Induced Genotoxicity. Environ. Health Perspect. 2015, 123, 237–245. [Google Scholar] [CrossRef]
  18. Liu, X.-H.; Qi, L.-W.; Alolga, R.N.; Liu, Q. Implication of the Hepatokine, Fibrinogen-like Protein 1 in Liver Diseases, Metabolic Disorders and Cancer: The Need to Harness its Full Potential. Int. J. Biol. Sci. 2022, 18, 292–300. [Google Scholar] [CrossRef]
  19. Benhamouche, S.; Decaens, T.; Godard, C.; Chambrey, R.; Rickman, D.S.; Moinard, C.; Vasseur-Cognet, M.; Kuo, C.J.; Kahn, A.; Perret, C.; et al. Apc Tumor Suppressor Gene Is the “Zonation-Keeper” of Mouse Liver. Dev. Cell 2006, 10, 759–770. [Google Scholar] [CrossRef]
  20. Schartz, N.D.; Tenner, A.J. The Good, the Bad, and the Opportunities of the Complement System in Neurodegenerative Disease. J. Neuroinflamm. 2020, 17, 354. [Google Scholar] [CrossRef]
  21. Aljohani, A.; Khan, M.I.; Bonneville, A.; Guo, C.; Jeffery, J.; O’Neill, L.; Syed, D.N.; Lewis, S.A.; Burhans, M.; Mukhtar, H.; et al. Hepatic Stearoyl CoA Desaturase 1 Deficiency Increases Glucose Uptake in Adipose Tissue Partially through the PGC-1α–FGF21 Axis in Mice. J. Biol. Chem. 2019, 294, 19475–19485. [Google Scholar] [CrossRef]
  22. Guerbette, T.; Boudry, G.; Lan, A. Mitochondrial Function in Intestinal Epithelium Homeostasis and Modulation in Diet-Induced Obesity. Mol. Metab. 2022, 63, 101546. [Google Scholar] [CrossRef]
  23. Németh, B.Z.; Demcsák, A.; Micsonai, A.; Kiss, B.; Schlosser, G.; Geisz, A.; Hegyi, E.; Sahin-Tóth, M.; Pál, G. Arg236 in Human Chymotrypsin B2 (CTRB2) is a Key Determinant of High Enzyme Activity, Trypsinogen Degradation Capacity, and Protection against Pancreatitis. Biochim. Biophys. Acta (BBA)-Proteins Proteom. 2022, 1870, 140831. [Google Scholar] [CrossRef] [PubMed]
  24. Sæle, Ø.; Rød, K.E.L.; Quinlivan, V.H.; Li, S.; Farber, S.A. A Novel System to Quantify Intestinal Lipid Digestion and Transport. Biochim. Biophys. Acta 2018, 1863, 948–957. [Google Scholar] [CrossRef] [PubMed]
  25. Uhlig, R.; Contreras, H.; Weidemann, S.; Gorbokon, N.; Menz, A.; Büscheck, F.; Luebke, A.M.; Kluth, M.; Hube-Magg, C.; Hinsch, A.; et al. Carboxypeptidase A1 (CPA1) Immunohistochemistry is Highly Sensitive and Specific for Acinar Cell Carcinoma (ACC) of the Pancreas. Am. J. Surg. Pathol. 2022, 46, 97–104. [Google Scholar] [CrossRef] [PubMed]
  26. Li, Q.-L.; Lin, X.; Yu, Y.-L.; Chen, L.; Hu, Q.-X.; Chen, M.; Cao, N.; Zhao, C.; Wang, C.-Y.; Huang, C.-W.; et al. Genome-wide Profiling in Colorectal Cancer Identifies PHF19 and TBC1D16 as Oncogenic Super Enhancers. Nat. Commun. 2021, 12, 6407. [Google Scholar] [CrossRef]
  27. Zhu, G.; Fang, Q.; Zhu, F.; Huang, D.; Yang, C. Structure and Function of Pancreatic Lipase-Related Protein 2 and Its Relationship with Pathological States. Front. Genet. 2021, 12, 693538. [Google Scholar] [CrossRef] [PubMed]
  28. Peterson, K.M.; Guo, X.; Elkahloun, A.G.; Mondal, D.; Bardhan, P.K.; Sugawara, A.; Duggal, P.; Haque, R.; Petri, W.A. The Expression of REG 1A and REG 1B is increased during Acute Amebic Colitis. Parasitol. Int. 2011, 60, 296–300. [Google Scholar] [CrossRef] [PubMed]
  29. Saiz-Gonzalo, G.; Hanrahan, N.; Rossini, V.; Singh, R.; Ahern, M.; Kelleher, M.; Hill, S.; O’sullivan, R.; Fanning, A.; Walsh, P.T.; et al. Regulation of CEACAM Family Members by IBD-Associated Triggers in Intestinal Epithelial Cells, Their Correlation to Inflammation and Relevance to IBD Pathogenesis. Front. Immunol. 2021, 12, 655960. [Google Scholar] [CrossRef]
  30. Wang, Z.; Lu, Z.; Lin, S.; Xia, J.; Zhong, Z.; Xie, Z.; Xing, Y.; Qie, J.; Jiao, M.; Li, Y.; et al. Leucine-tRNA-synthetase-2-expressing B cells Contribute to Colorectal Cancer Immunoevasion. Immunity 2022, 55, 1067–1081.e8. [Google Scholar] [CrossRef]
  31. Pan, X.; Wang, Q.; Xu, C.; Yan, L.; Pang, S.; Gan, J. Prognostic Value of Chloride Channel Accessory mRNA Expression in Colon Cancer. Oncol. Lett. 2019, 18, 2967–2976. [Google Scholar] [CrossRef]
  32. Zhang, M.-Z.; Wang, X.; Wang, Y.; Niu, A.; Wang, S.; Zou, C.; Harris, R.C. IL-4/IL-13–Mediated Polarization of Renal Macrophages/Dendritic Cells to an M2a Phenotype is Essential for Recovery from Acute Kidney Injury. Kidney Int. 2017, 91, 375–386. [Google Scholar] [CrossRef]
  33. Chang-Panesso, M.; Kadyrov, F.F.; Lalli, M.; Wu, H.; Ikeda, S.; Kefaloyianni, E.; Abdelmageed, M.M.; Herrlich, A.; Kobayashi, A.; Humphreys, B.D. FOXM1 Drives Proximal Tubule Proliferation during Repair from Acute Ischemic Kidney Injury. J. Clin. Investig. 2019, 129, 5501–5517. [Google Scholar] [CrossRef]
  34. Jacobson, N.G.; Szabo, S.J.; Weber-Nordt, R.M.; Zhong, Z.; Schreiber, R.D.; Darnell, J.E., Jr.; Murphy, K.M. Interleukin 12 Signaling in T helper Type 1 (Th1) Cells Involves Tyrosine Phosphorylation of Signal Transducer and Activator of Transcription (Stat)3 and Stat4. J. Exp. Med. 1995, 181, 1755–1762. [Google Scholar] [CrossRef]
  35. Hamza, T.; Barnett, J.B.; Li, B. Interleukin 12 a Key Immunoregulatory Cytokine in Infection Applications. Int. J. Mol. Sci. 2010, 11, 789–806. [Google Scholar] [CrossRef]
  36. Lee, H.S.; Kundu, J.; Kim, R.N.; Shin, Y.K. Transducer of ERBB2.1 (TOB1) as a Tumor Suppressor: A Mechanistic Perspective. Int. J. Mol. Sci. 2015, 16, 29815–29828. [Google Scholar] [CrossRef] [PubMed]
  37. Diefenbach, A.; Schindler, H.; Röllinghoff, M.; Yokoyama, W.M.; Bogdan, C. Requirement for Type 2 NO Synthase for IL-12 Signaling in Innate Immunity. Science 1999, 284, 951–955. [Google Scholar] [CrossRef] [PubMed]
  38. Grywalska, E.; Smarz-Widelska, I.; Mertowski, S.; Gosik, K.; Mielnik, M.; Podgajna, M.; Abramiuk, M.; Drop, B.; Roliński, J.; Załuska, W. CTLA-4 Expression Inversely Correlates with Kidney Function and Serum Immunoglobulin Concentration in Patients with Primary Glomerulonephritides. Arch. Immunol. Ther. Exp. 2019, 67, 335–349. [Google Scholar] [CrossRef] [PubMed]
  39. Rudman-Melnick, V.; Adam, M.; Stowers, K.; Potter, A.; Ma, Q.; Chokshi, S.M.; Vanhoutte, D.; Valiente-Alandi, I.; Lindquist, D.M.; Nieman, M.L.; et al. Single-cell Transcriptomic Profiling of Kidney Fibrosis Identifies a Novel Specific Fibroblast Marker and Putative Disease Target. bioRxiv 2022. bioRxiv:2022.09.13.507855. [Google Scholar] [CrossRef]
  40. Cruz-Rodriguez, N.; Combita, A.L.; Enciso, L.J.; Raney, L.F.; Pinzon, P.L.; Lozano, O.C.; Campos, A.M.; Peñaloza, N.; Solano, J.; Herrera, M.V.; et al. Prognostic Stratification Improvement by Integrating ID1/ID3/IGJ Gene Expression Signature and Immunophenotypic Profile in Adult Patients with B-ALL. J. Exp. Clin. Cancer Res. 2017, 36, 37. [Google Scholar] [CrossRef]
  41. Woof, J.M.; Kerr, M.A. The Function of Immunoglobulin A in Immunity. J. Pathol. 2006, 208, 270–282. [Google Scholar] [CrossRef]
  42. Bilal, S.; Etayo, A.; Hordvik, I. Immunoglobulins in Teleosts. Immunogenetics 2021, 73, 65–77. [Google Scholar] [CrossRef]
  43. Yang, W.; Zhang, K.; Li, L.; Ma, K.; Hong, B.; Gong, Y.; Gong, K. Discovery and Validation of the Prognostic Value of the lncRNAs Encoding snoRNAs in Patients with Clear Cell Renal Cell Carcinoma. Aging 2020, 12, 4424–4444. [Google Scholar] [CrossRef] [PubMed]
  44. Liu, Q.; Hoffman, R.M.; Song, J.; Miao, S.; Zhang, J.; Ding, D.; Wang, D. Guanylate-binding Protein 2 Expression is Associated with Poor Survival and Malignancy in Clear-cell Renal Cell Carcinoma. Anticancer. Res. 2022, 42, 2341–2354. [Google Scholar] [CrossRef] [PubMed]
  45. Xu, Y.; Liu, R.; Liao, C.; Liu, J.; Zhao, H.; Li, Z.; Liu, W.; Chen, L.; Wu, C.; Tan, H.; et al. High Expression of Immunity-Related GTPase Family M Protein in Glioma Promotes Cell Proliferation and Autophagy Protein Expression. Pathol. Res. Pract. 2019, 215, 90–96. [Google Scholar] [CrossRef] [PubMed]
  46. Hoter, A.; Naim, H.Y. Heat Shock Proteins and Ovarian Cancer: Important Roles and Therapeutic Opportunities. Cancers 2019, 11, 1389. [Google Scholar] [CrossRef] [PubMed]
  47. Xu, S.; Powers, M.A. Nuclear Pore Proteins and Cancer. Semin. Cell Dev. Biol. 2009, 20, 620–630. [Google Scholar] [CrossRef] [PubMed]
  48. Skapenko, A.; Leipe, J.; Lipsky, P.E.; Schulze-Koops, H. The Role of the T cell in Autoimmune Inflammation. Arthritis Res. Ther. 2005, 7, S4–S14. [Google Scholar] [CrossRef] [PubMed]
  49. Tatar, M.; Tufekci, K.K.; Uslu, S.; Öner, J. Expression of ADAMTS 1-4-8 and Placental Growth Factor in Ovary and Oviduct during Pregnancy in the First Trimester. Anat. Histol. Embryol. 2023, 52, 619–626. [Google Scholar] [CrossRef]
  50. Russell, D.L.; Ochsner, S.A.; Hsieh, M.; Mulders, S.; Richards, J.S. Hormone-Regulated Expression and Localization of Versican in the Rodent Ovary. Endocrinology 2003, 144, 1020–1031. [Google Scholar] [CrossRef]
  51. Maines-Bandiera, S.; Woo, M.M.; Borugian, M.; Molday, L.L.; Hii, T.; Gilks, B.; Leung, P.C.; Molday, R.S.; Auersperg, N. Oviductal Glycoprotein (OVGP1, MUC9): A Differentiation-Based Mucin Present in Serum of Women with Ovarian Cancer. Int. J. Gynecol. Cancer 2010, 20, 16–22. [Google Scholar] [CrossRef]
  52. Tarhriz, V.; Bandehpour, M.; Dastmalchi, S.; Ouladsahebmadarek, E.; Zarredar, H.; Eyvazi, S. Overview of CD24 as a New Molecular Marker in Ovarian Cancer. J. Cell. Physiol. 2019, 234, 2134–2142. [Google Scholar] [CrossRef]
  53. MacGregor, H.L.; Garcia-Batres, C.; Sayad, A.; Elia, A.; Berman, H.K.; Toker, A.; Katz, S.R.; Shaw, P.A.; Clarke, B.A.; Crome, S.Q.; et al. Tumor Cell Expression of B7-H4 Correlates with Higher Frequencies of Tumor-Infiltrating APCs and Higher CXCL17 Expression in Human Epithelial Ovarian Cancer. OncoImmunology 2019, 8, e1665460. [Google Scholar] [CrossRef] [PubMed]
  54. Wang, Q.; Wang, B.; Zhang, Y.-M.; Wang, W. The Association between CDH1 Promoter Methylation and Patients with Ovarian Cancer: A Systematic Meta-analysis. J. Ovarian Res. 2016, 9, 23. [Google Scholar] [CrossRef]
  55. Zhang, D.; Lu, W.; Cui, S.; Mei, H.; Wu, X.; Zhuo, Z. Establishment of an Ovarian Cancer Omentum Metastasis-related Prognostic Model by Integrated Analysis of scRNA-seq and Bulk RNA-seq. J. Ovarian Res. 2022, 15, 123. [Google Scholar] [CrossRef] [PubMed]
  56. An, Q.; Liu, T.; Wang, M.; Yang, Y.; Zhang, Z.; Liu, Z.; Yang, B. KRT7 Promotes Epithelial-mesenchymal Transition in Ovarian Cancer via the TGF-β/Smad2/3 Signaling Pathway. Oncol. Rep. 2021, 45, 481–492. [Google Scholar] [CrossRef] [PubMed]
  57. Brenne, K.; Nymoen, D.A.; Hetland, T.E.; Trope’, C.G.; Davidson, B. Expression of the Ets Transcription Factor EHF in Serous Ovarian Carcinoma Effusions is a Marker of Poor Survival. Hum. Pathol. 2012, 43, 496–505. [Google Scholar] [CrossRef] [PubMed]
  58. Umezaki, Y.; Ito, M.; Nakashima, M.; Mihara, Y.; Kurohama, H.; Yatsunami, N.; Yasuhi, I. Low Expression of S100P Is Associated with Poor Prognosis in Patients with Clear Cell Adenocarcinoma of the Ovary. Int. J. Gynecol. Cancer 2015, 25, 1582–1586. [Google Scholar] [CrossRef] [PubMed]
  59. Bhattacharyya, S.; Saha, S.; Giri, K.; Lanza, I.R.; Nair, K.S.; Jennings, N.B.; Rodriguez-Aguayo, C.; Lopez-Berestein, G.; Basal, E.; Weaver, A.L.; et al. Cystathionine Beta-synthase (CBS) Contributes to Advanced Ovarian Cancer Progression and Drug Resistance. PLoS ONE 2013, 8, e79167. [Google Scholar] [CrossRef]
  60. Hellström, I.; Raycraft, J.; Hayden-Ledbetter, M.; Ledbetter, J.A.; Schummer, M.; McIntosh, M.; Drescher, C.; Urban, N.; Hellström, K.E. The HE4 (WFDC2) Protein is a Biomarker for Ovarian Carcinoma. Cancer Res. 2003, 63, 3695–3700. [Google Scholar] [PubMed]
  61. Hou, L.; Wang, W.; Zhai, J.; Zhao, H. Circular RNA pyridoxal kinase (circPDXK) involves in the progression of ovarian cancer and glycolysis via regulating miR-654-3p and hexokinase II. Appl. Biol. Chem. 2022, 65, 81. [Google Scholar] [CrossRef]
  62. Jin, M.; Zhang, H.; Yang, J.; Zheng, Z.; Liu, K. Expression Mode and Prognostic Value of FXYD Family Members in Colon Cancer. Aging 2021, 13, 18404–18422. [Google Scholar] [CrossRef]
  63. Wu, Y. SNHG11: A New Budding Star in Tumors and Inflammatory Diseases. Mini-Rev. Med. Chem. 2023, 23, 14. [Google Scholar] [CrossRef] [PubMed]
  64. Cao, L.; Wang, Y.; Liang, M.; Pan, M. CALB1 Enhances the Interaction between p53 and MDM2, and Inhibits the Senescence of Ovarian Cancer Cells. Mol. Med. Rep. 2019, 19, 5097–5104. [Google Scholar] [CrossRef] [PubMed]
  65. He, Y.; Yang, T.; Du, Y.; Qin, L.; Ma, F.; Wu, Z.; Ling, H.; Yang, L.; Wang, Z.; Zhou, Q.; et al. High Fat Diet Significantly Changed the Global Gene Expression Profile Involved in Hepatic Drug Metabolism and Pharmacokinetic System in Mice. Nutr. Metab. 2020, 17, 37. [Google Scholar] [CrossRef] [PubMed]
  66. Li, Y.; Chen, Z.; Paonessa, J.D.; Meinl, W.; Bhattacharya, A.; Glatt, H.; Vouros, P.; Zhang, Y. Strong Impact of Sulfotransferases on DNA Adduct Formation by 4-Aminobiphenyl in Bladder and Liver in Mice. Cancer Med. 2018, 7, 5604–5610. [Google Scholar] [CrossRef]
  67. Ntambi, J.M.; Miyazaki, M.; Stoehr, J.P.; Lan, H.; Kendziorski, C.M.; Yandell, B.S.; Song, Y.; Cohen, P.; Friedman, J.M.; Attie, A.D. Loss of Stearoyl–CoA Desaturase-1 Function Protects Mice against Adiposity. Proc. Natl. Acad. Sci. USA 2002, 99, 11482–11486. [Google Scholar] [CrossRef] [PubMed]
  68. Sen, U.; Coleman, C.; Sen, T. Stearoyl Coenzyme A Desaturase-1: Multitasker in Cancer, Metabolism, and Ferroptosis. Trends Cancer 2023, 9, 480–489. [Google Scholar] [CrossRef] [PubMed]
  69. Li, J.; Cao, F.; Yin, H.; Huang, Z.; Lin, Z.; Mao, N.; Sun, B.; Wang, G. Ferroptosis: Past, Present and Future. Cell Death Dis. 2020, 11, 88. [Google Scholar] [CrossRef]
  70. Colnot, S.; Decaens, T.; Niwa-Kawakita, M.; Godard, C.; Hamard, G.; Kahn, A.; Giovannini, M.; Perret, C. Liver-targeted Disruption of Apc in Mice Activates β-Catenin Signaling and Leads to Hepatocellular Carcinomas. Proc. Natl. Acad. Sci. USA 2004, 101, 17216–17221. [Google Scholar] [CrossRef]
  71. Bayrer, J.R.; Wang, H.; Nattiv, R.; Suzawa, M.; Escusa, H.S.; Fletterick, R.J.; Klein, O.D.; Moore, D.D.; Ingraham, H.A. LRH-1 Mitigates Intestinal Inflammatory Disease by Maintaining Epithelial Homeostasis and Cell Survival. Nat. Commun. 2018, 9, 4055. [Google Scholar] [CrossRef]
  72. Edwards, J.-A.; Tan, N.; Toussaint, N.; Ou, P.; Mueller, C.; Stanek, A.; Zinsou, V.; Roudnitsky, S.; Sagal, M.; Dresner, L.; et al. Role of Regenerating Islet-Derived Proteins in Inflammatory Bowel Disease. World J. Gastroenterol. 2020, 26, 2702–2714. [Google Scholar] [CrossRef]
  73. Kelleher, M.; Singh, R.; O’driscoll, C.M.; Melgar, S. Carcinoembryonic Antigen (CEACAM) Family Members and Inflammatory Bowel Disease. Cytokine Growth Factor Rev. 2019, 47, 21–31. [Google Scholar] [CrossRef] [PubMed]
  74. Li, R.; Guan, M.-X. Human Mitochondrial Leucyl-tRNA Synthetase Corrects Mitochondrial Dysfunctions Due to the tRNALeu(UUR) A3243G Mutation, Associated with Mitochondrial Encephalomyopathy, Lactic acidosis, and Stroke-like Symptoms and Diabetes. Mol. Cell. Biol. 2010, 30, 2147–2154. [Google Scholar] [CrossRef] [PubMed]
  75. Peruchetti, D.B.; Silva-Filho, J.L.; Silva-Aguiar, R.P.; Teixeira, D.E.; Takiya, C.M.; Souza, M.C.; Henriques, M.d.G.; Pinheiro, A.A.S.; Caruso-Neves, C. IL-4 Receptor α Chain Protects the Kidney Against Tubule-Interstitial Injury Induced by Albumin Overload. Front. Physiol. 2020, 11, 172. [Google Scholar] [CrossRef] [PubMed]
  76. Chen, J.; Chen, J.-K.; Harris, R.C. Deletion of the Epidermal Growth Factor Receptor in Renal Proximal Tubule Epithelial Cells Delays Recovery from Acute Kidney Injury. Kidney Int. 2012, 82, 45–52. [Google Scholar] [CrossRef]
  77. Stoll, S.W.; Stuart, P.E.; Swindell, W.R.; Tsoi, L.C.; Li, B.; Gandarillas, A.; Lambert, S.; Johnston, A.; Nair, R.P.; Elder, J.T. The EGF Receptor Ligand Amphiregulin Controls Cell Division via FoxM1. Oncogene 2015, 35, 2075–2086. [Google Scholar] [CrossRef]
  78. Ye, S.; Li, S.; Qin, L.; Zheng, W.; Liu, B.; Li, X.; Ren, Z.; Zhao, H.; Hu, X.; Ye, N.; et al. GBP2 Promotes Clear Cell Renal Cell Carcinoma Progression through Immune Infiltration and Regulation of PD-L1 Expression via STAT1 Signaling. Oncol. Rep. 2023, 49, 49. [Google Scholar] [CrossRef]
  79. Xu, L.; Huan, L.; Guo, T.; Wu, Y.; Liu, Y.; Wang, Q.; Huang, S.; Xu, Y.; Liang, L.; He, X. LncRNA SNHG11 Facilitates Tumor Metastasis by Interacting with and Stabilizing HIF-1α. Oncogene 2020, 39, 7005–7018. [Google Scholar] [CrossRef]
  80. Wu, Q.; Ma, J.; Wei, J.; Meng, W.; Wang, Y.; Shi, M. lncRNA SNHG11 Promotes Gastric Cancer Progression by Activating the Wnt/β-Catenin Pathway and Oncogenic Autophagy. Mol. Ther. 2021, 29, 1258–1278. [Google Scholar] [CrossRef]
  81. Liu, H.; Chen, Y.-G. The Interplay between TGF-β Signaling and Cell Metabolism. Front. Cell Dev. Biol. 2022, 10, 846723. [Google Scholar] [CrossRef]
  82. Barkal, A.A.; Brewer, R.E.; Markovic, M.; Kowarsky, M.; Barkal, S.A.; Zaro, B.W.; Krishnan, V.; Hatakeyama, J.; Dorigo, O.; Barkal, L.J.; et al. CD24 Signalling through Macrophage Siglec-10 is a Target for Cancer Immunotherapy. Nature 2019, 572, 392–396. [Google Scholar] [CrossRef]
  83. Bai, Y.; Li, L.; Li, J.; Chen, R.; Yu, H.; Sun, H.; Wang, J.; Lu, X. A FXYD5/TGF-β/SMAD Positive Feedback Loop Drives Epithelial-to-mesenchymal Transition and Promotes Tumor Growth and Metastasis in Ovarian Cancer. Int. J. Oncol. 2020, 56, 301–314. [Google Scholar] [CrossRef] [PubMed]
Figure 1. Average mouse body weight for groups consuming the STD and STD5GP. No significant differences were observed for the duration of the study.
Antioxidants 12 01821 g001
Figure 2. Heat maps illustrating differentially expressed genes (DEGs) with (A) liver, (B) colon, (C) kidney, and (D) ovary. Each heat map illustrates the gene expression levels with the Z-score, where blue indicates lower expression and green indicates higher expression. Rows are hierarchically clustered using Ward’s linkage method for pattern identification.
Antioxidants 12 01821 g002
Figure 3. Volcano plots illustrating differentially expressed genes for (A) liver, (B) colon, (C) kidney, and (D) ovary. Significant changes were considered as those with a p-value < 0.05 and an absolute Log2(Fold-change) > 1 (delineated by the dotted lines).
Antioxidants 12 01821 g003
Figure 4. MA plots generated using the DEG list for (A) liver, (B) colon, (C) kidney, and (D) ovary.
Antioxidants 12 01821 g004
Figure 5. Pathway analysis showing significant enrichment (q < 0.05) in (A) liver, (B) colon, (C) kidney, and (D) ovary.
Antioxidants 12 01821 g005
Figure 6. Graphical depiction of some key genes and pathways modulated by the grape diet in the liver, colon, kidney, and ovary.
Antioxidants 12 01821 g006
Table 1. Diet compositions.
Control
(STD)
Control + 5% Grape Powder (STD5GP)
TD.160157TD.160158
Ingredient(g/kg)(g/kg)
1Casein195.0192.94
2DL-Methionine3.03.0
3Sucrose191.0191.0
4Dextrose, anhydrous66.4544.3
5Fructose66.4544.3
6Corn starch235.03232.88
7Maltodextrin100.0100.0
8Anhydrous milkfat30.029.85
9Soybean oil10.010.0
10Cellulose50.050.0
11Mineral mix, AIN-7635.035.0
12Calcium carbonate4.04.0
13Potassium citrate, monohydrate4.032.69
14Vitamin mix, Teklad10.010.0
15Ethoxyquin, antioxidant0.040.04
16Grape powder, freeze-dried0.050.0
Disclaimer/Publisher’s Note: The statements, opinions and data contained in all publications are solely those of the individual author(s) and contributor(s) and not of MDPI and/or the editor(s). MDPI and/or the editor(s) disclaim responsibility for any injury to people or property resulting from any ideas, methods, instructions or products referred to in the content.

