
Assessing Cellular Uptake of Exogenous Coenzyme Q10 into Human Skin Cells by X-ray Fluorescence Imaging

 , , , and
Abstract
:1. Introduction
- (a)
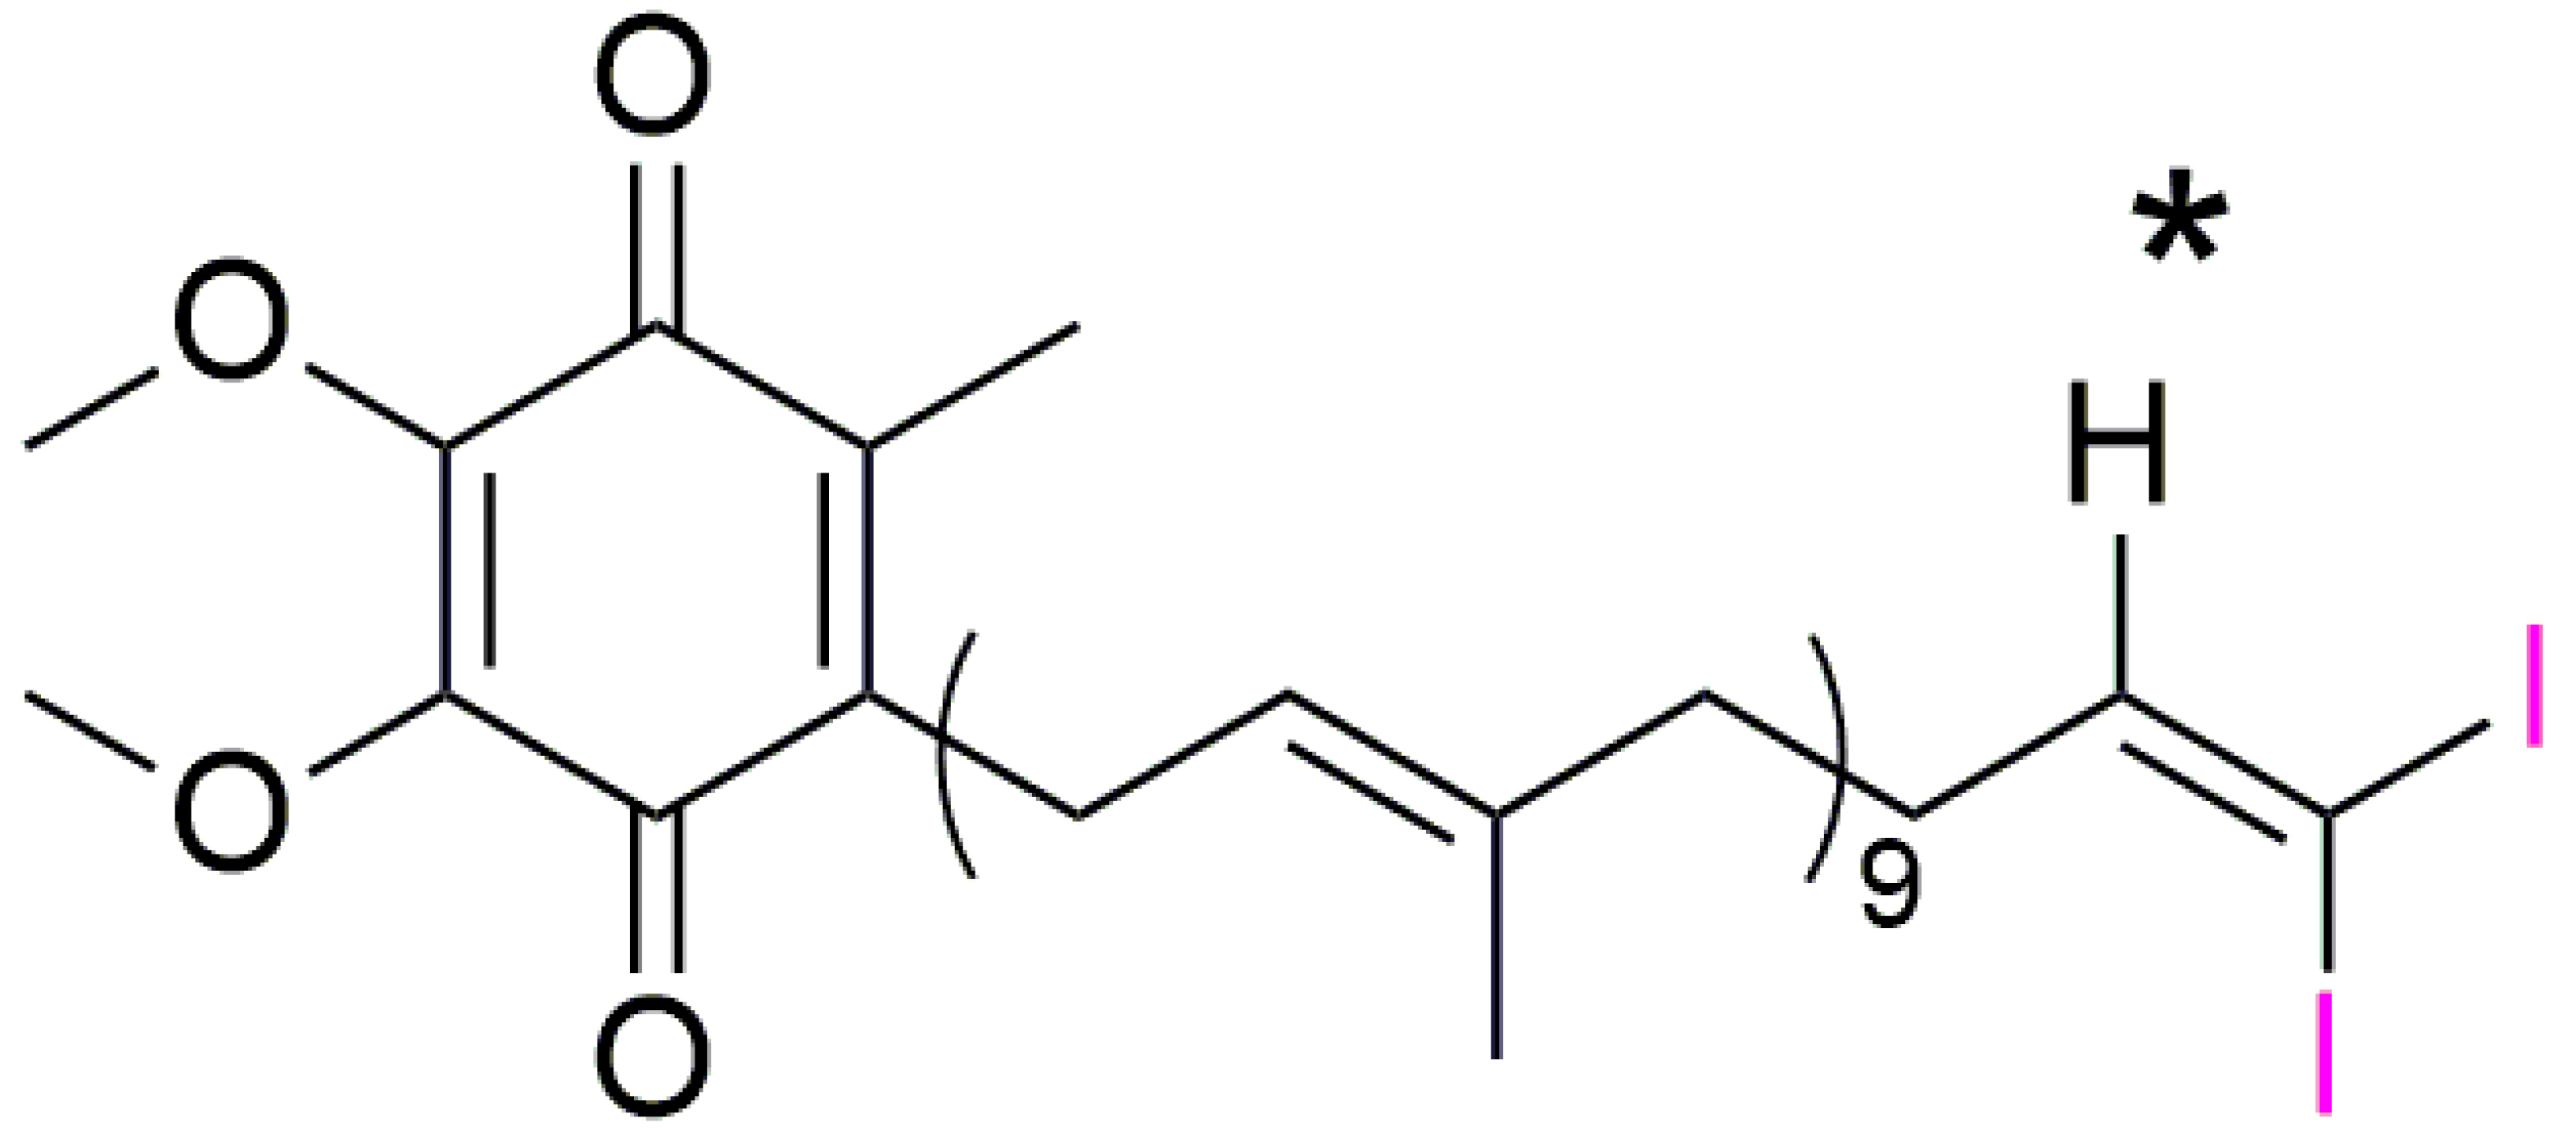
- The feasibility of labeling a relatively small biomolecule, i.e., Q10.
- (b)
- Cellular uptake and distribution of Q10 by means of XRF imaging.
2. Materials and Methods
2.1. Analytical Pre-Assessment of I2-Q10
2.2. Cell Culture
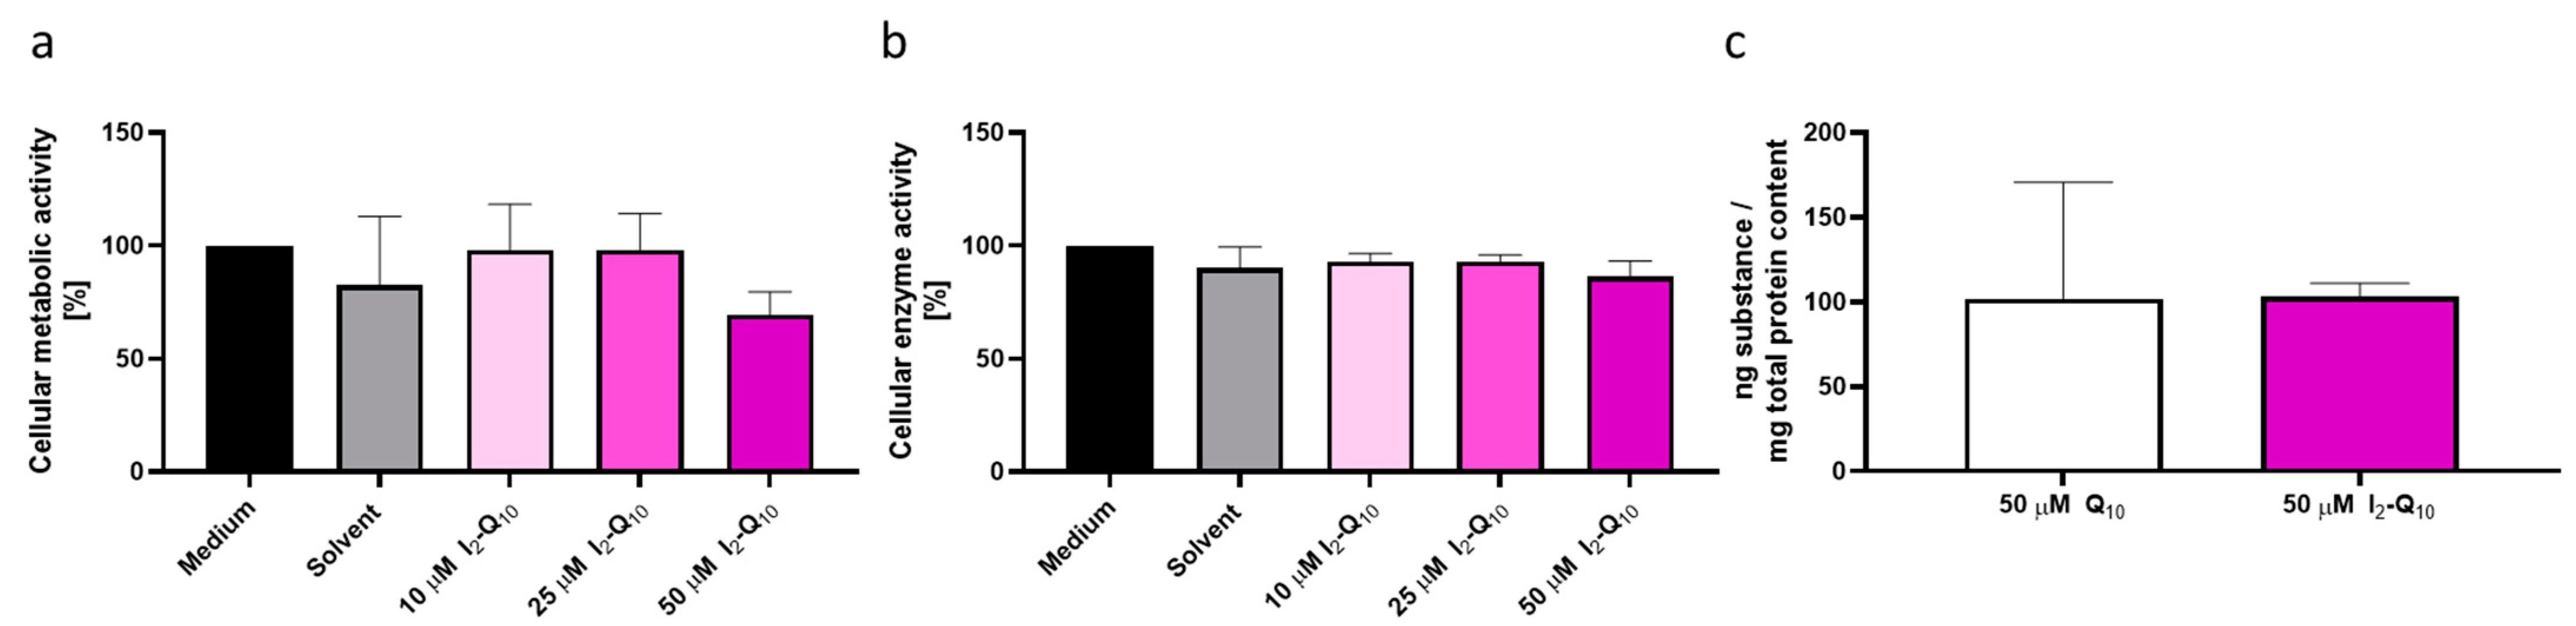
2.3. Cell Vitality
2.4. Bioavailability
2.5. Cell Preparation for XRF Measurements
2.6. XRF Cell Uptake and Single Cell Measurements
Experimental Setup
2.7. Data Acquisition and Analysis
2.7.1. Fit Routine and Calibration in Cell Pellet Measurements
2.7.2. Fit Routine and Calibration in Single-Cell Measurements
3. Results
3.1. Biological Pre-Assessment of I2-Q10
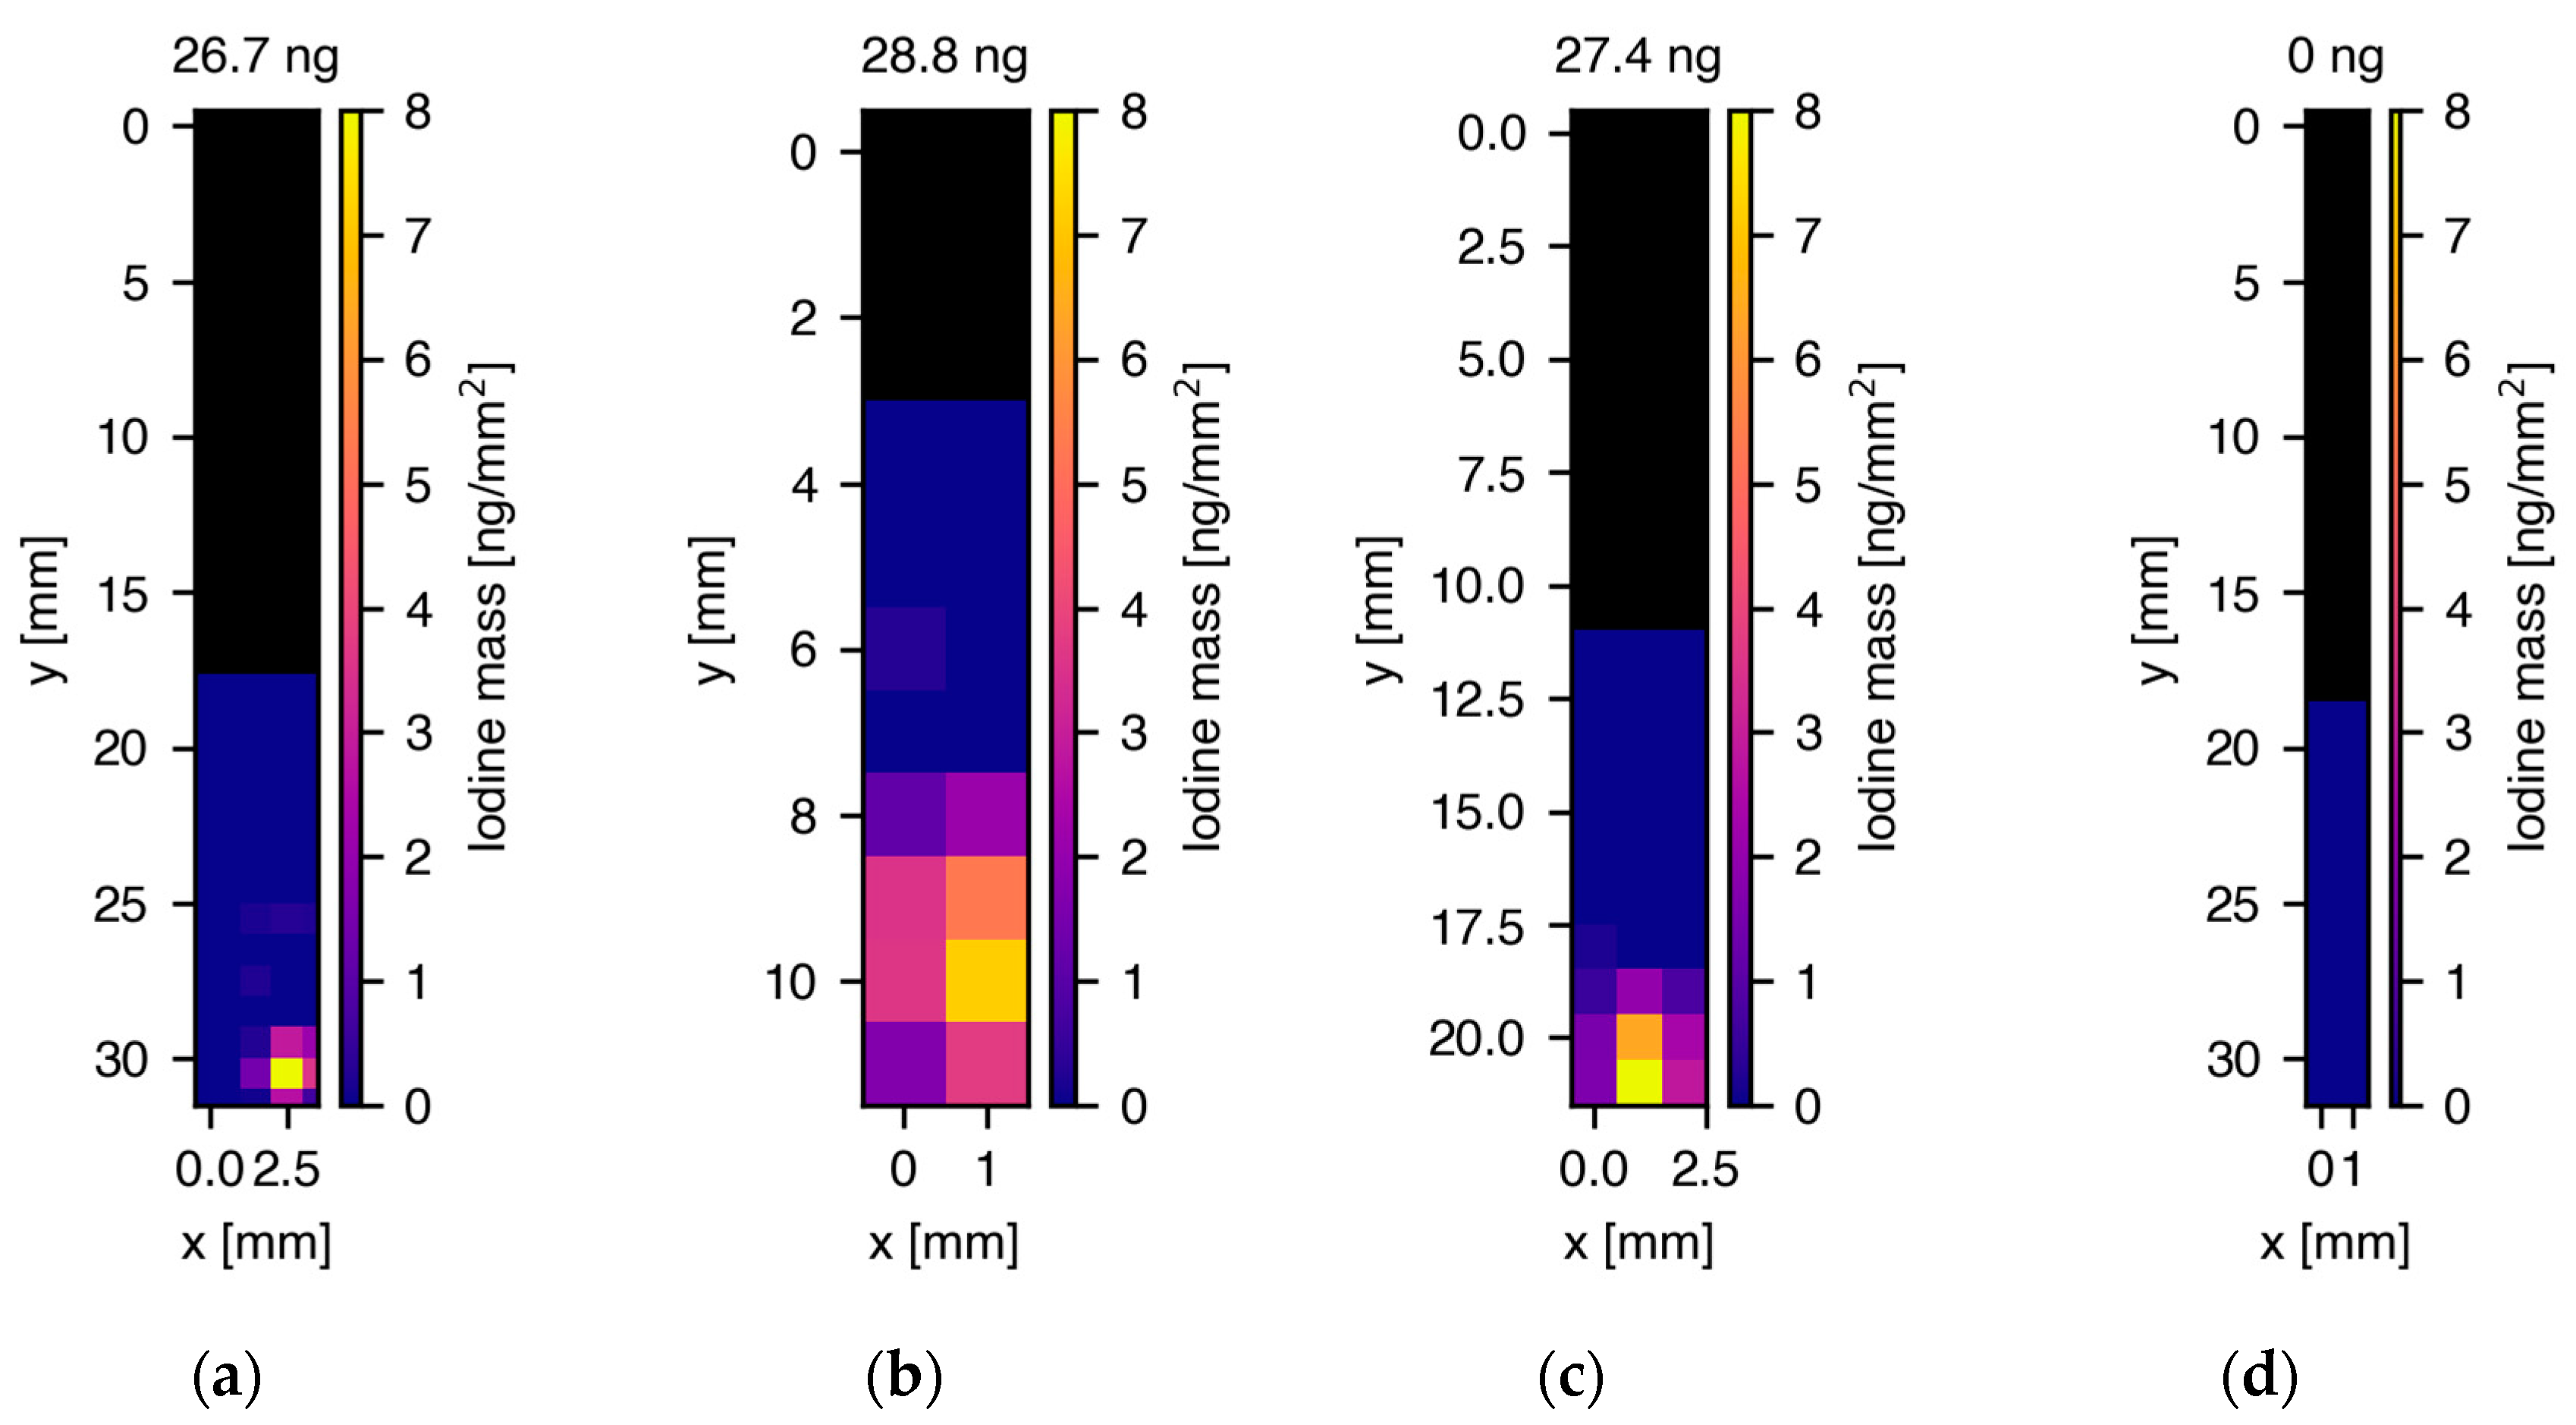
3.2. Quantitative I2-Q10 Uptake Measurements of Human Skin Cell Pellets
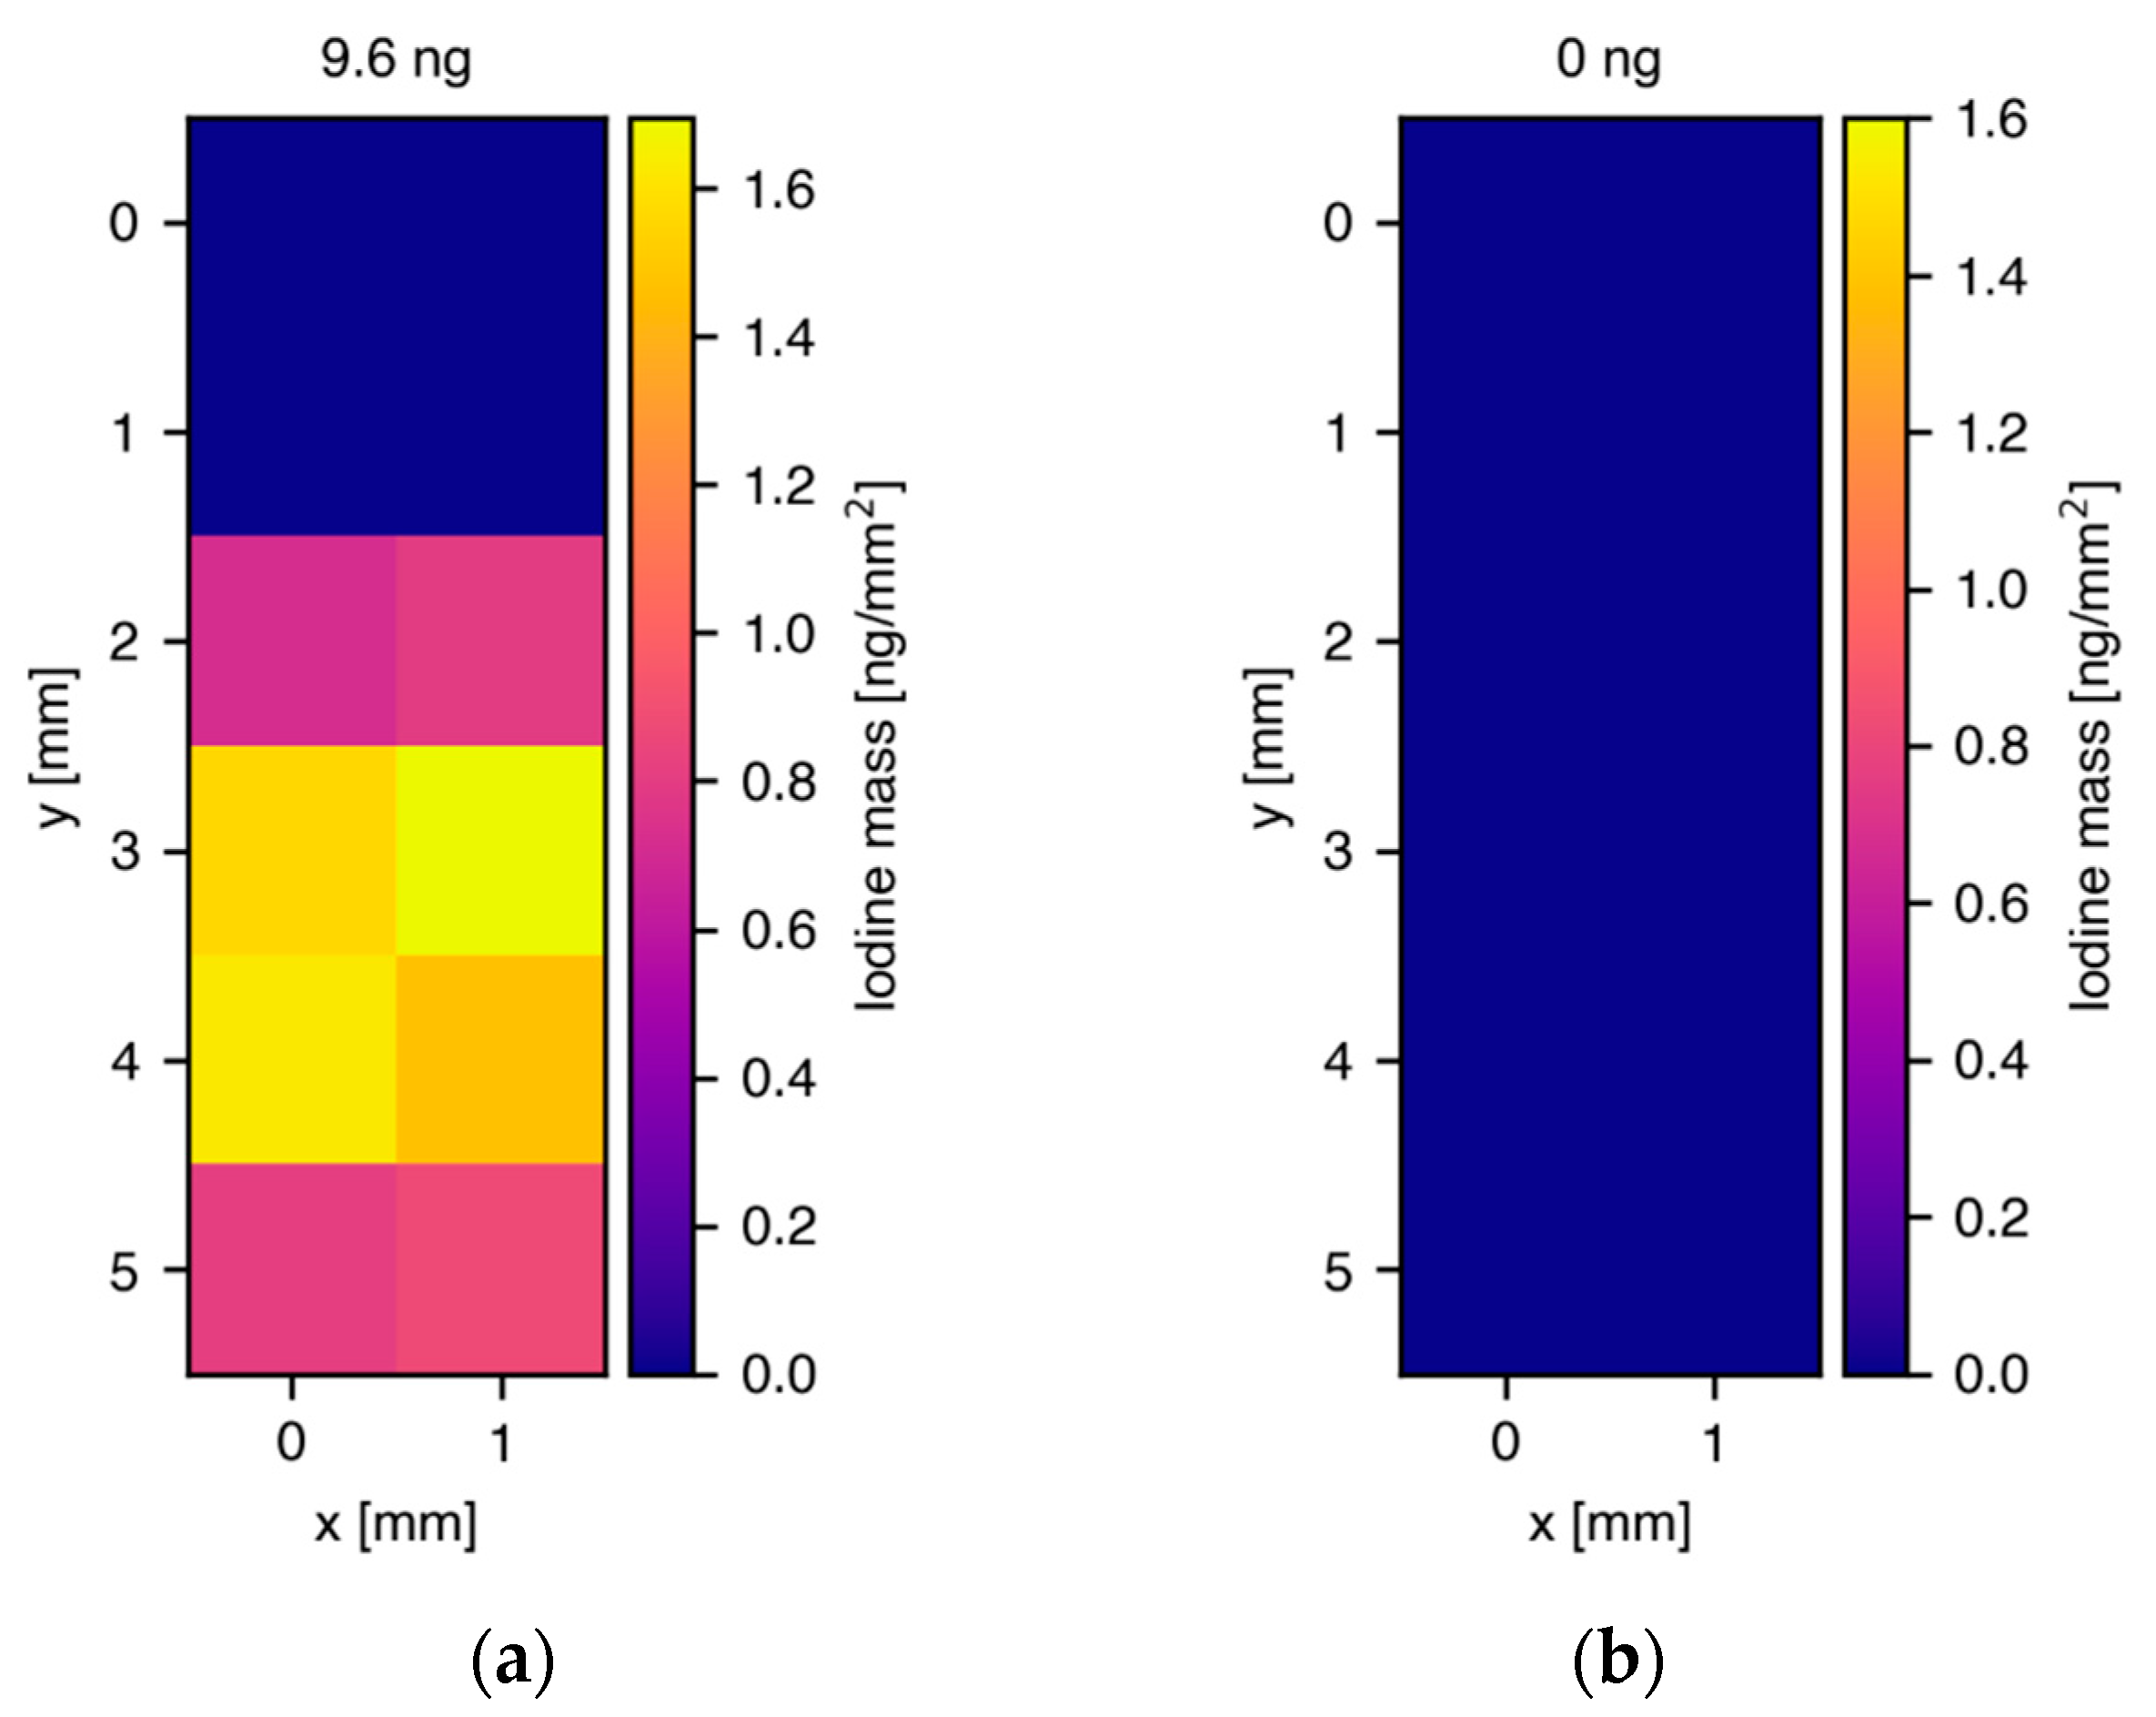
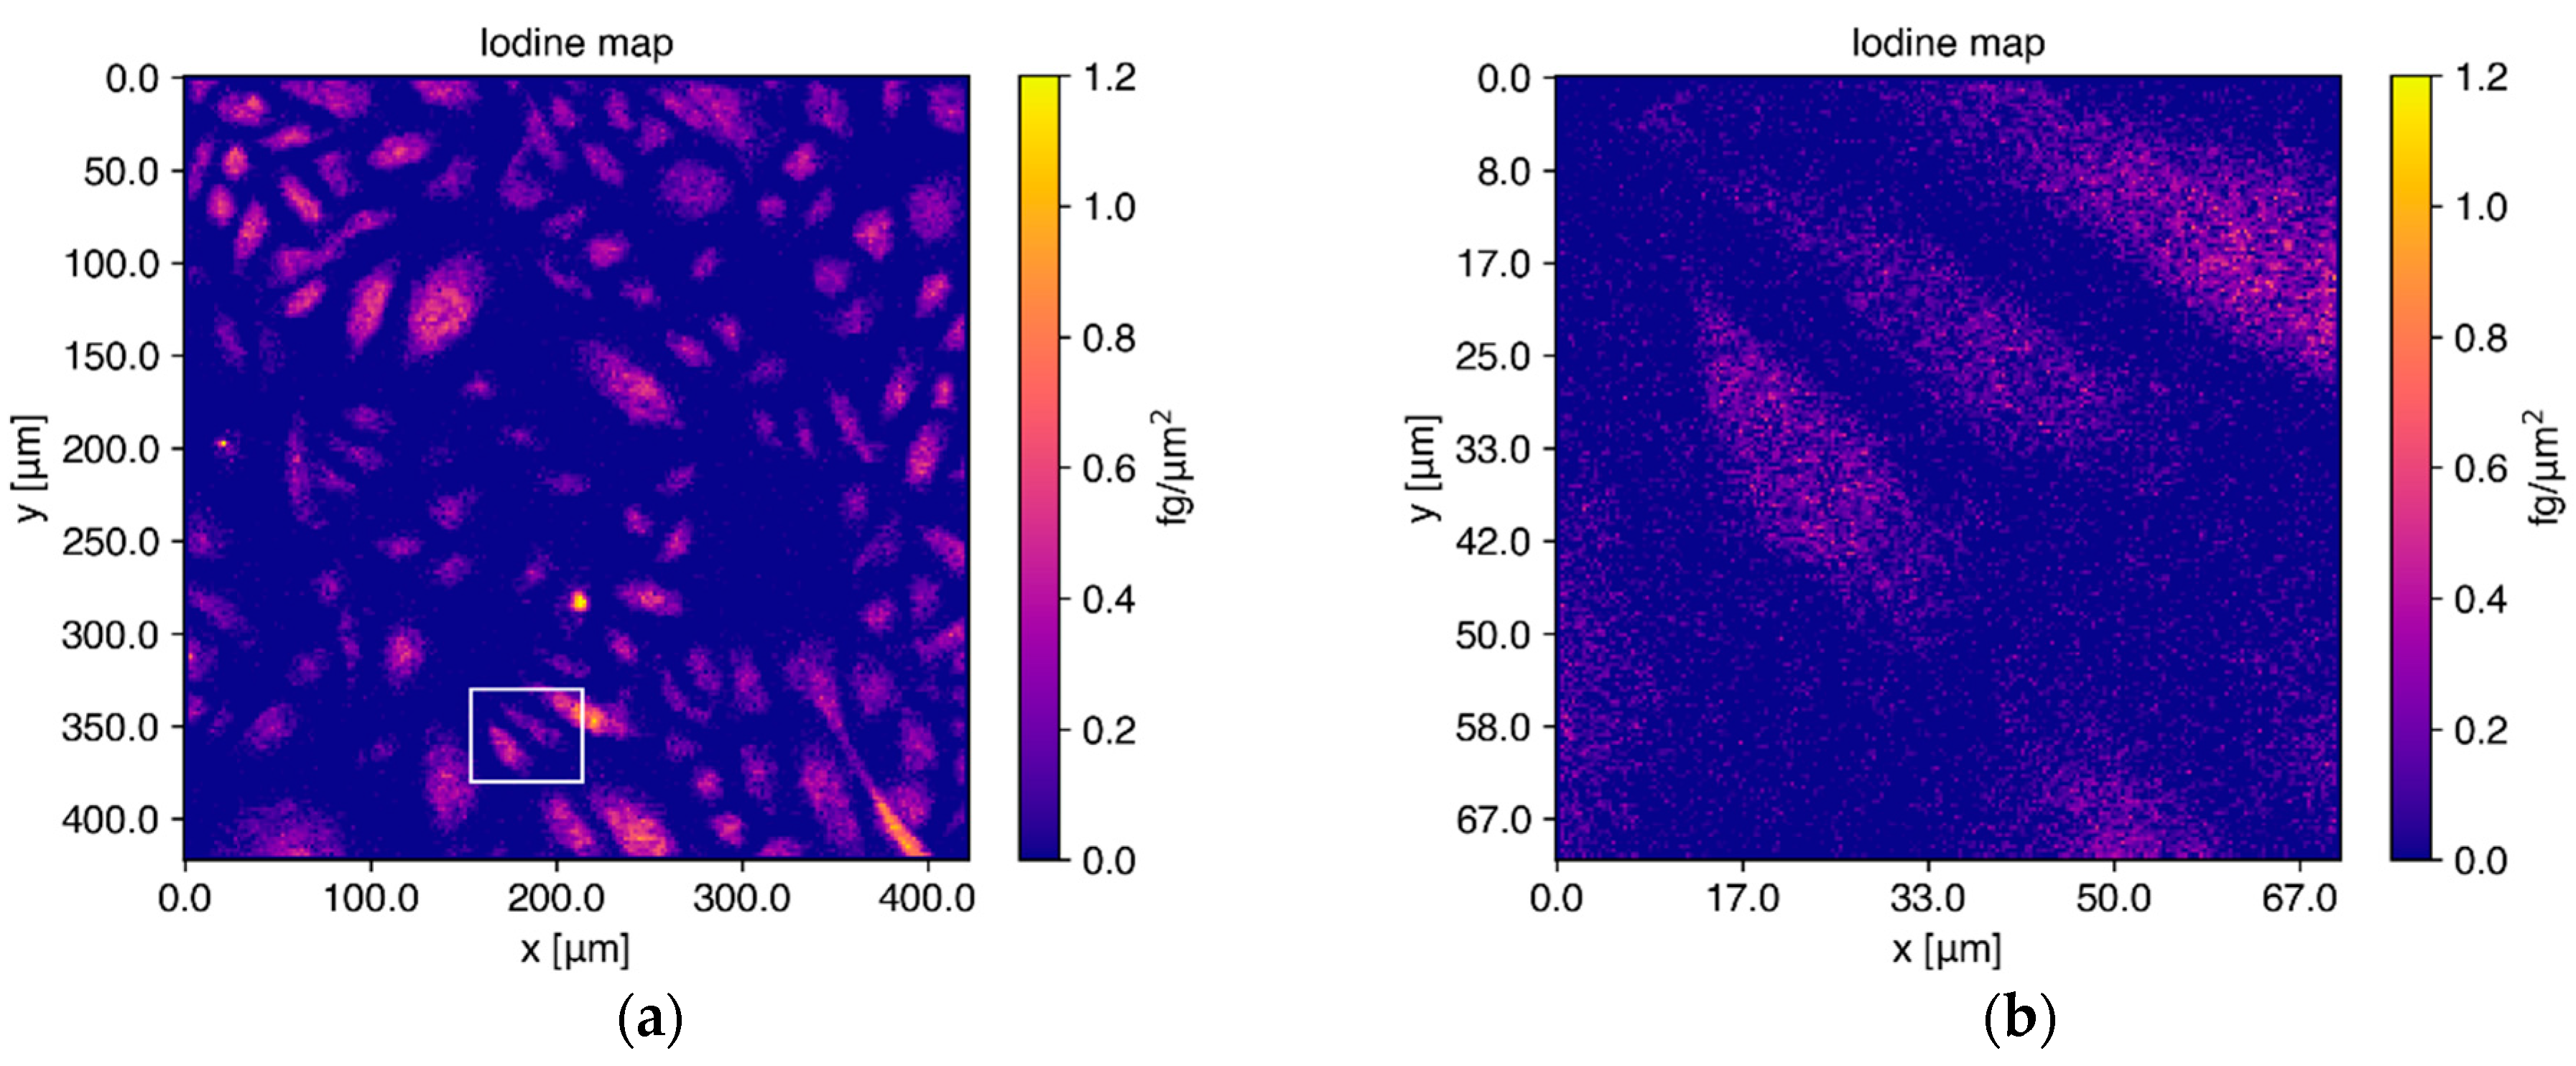
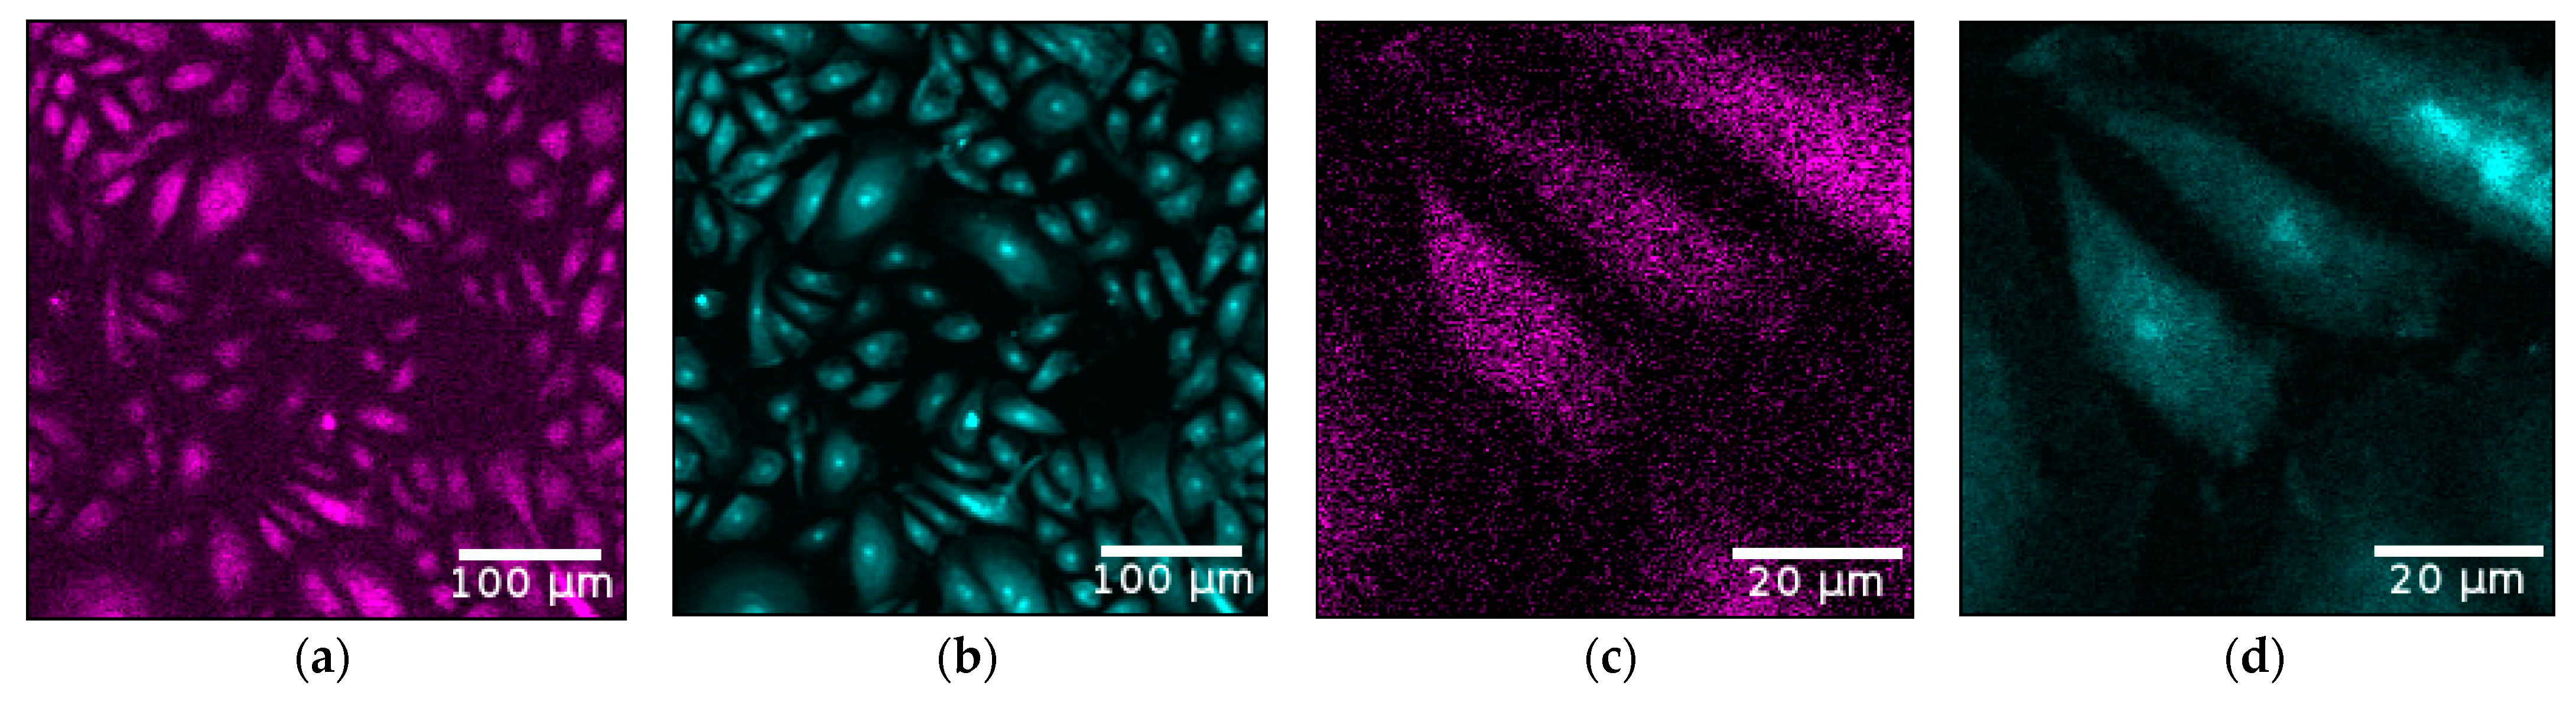
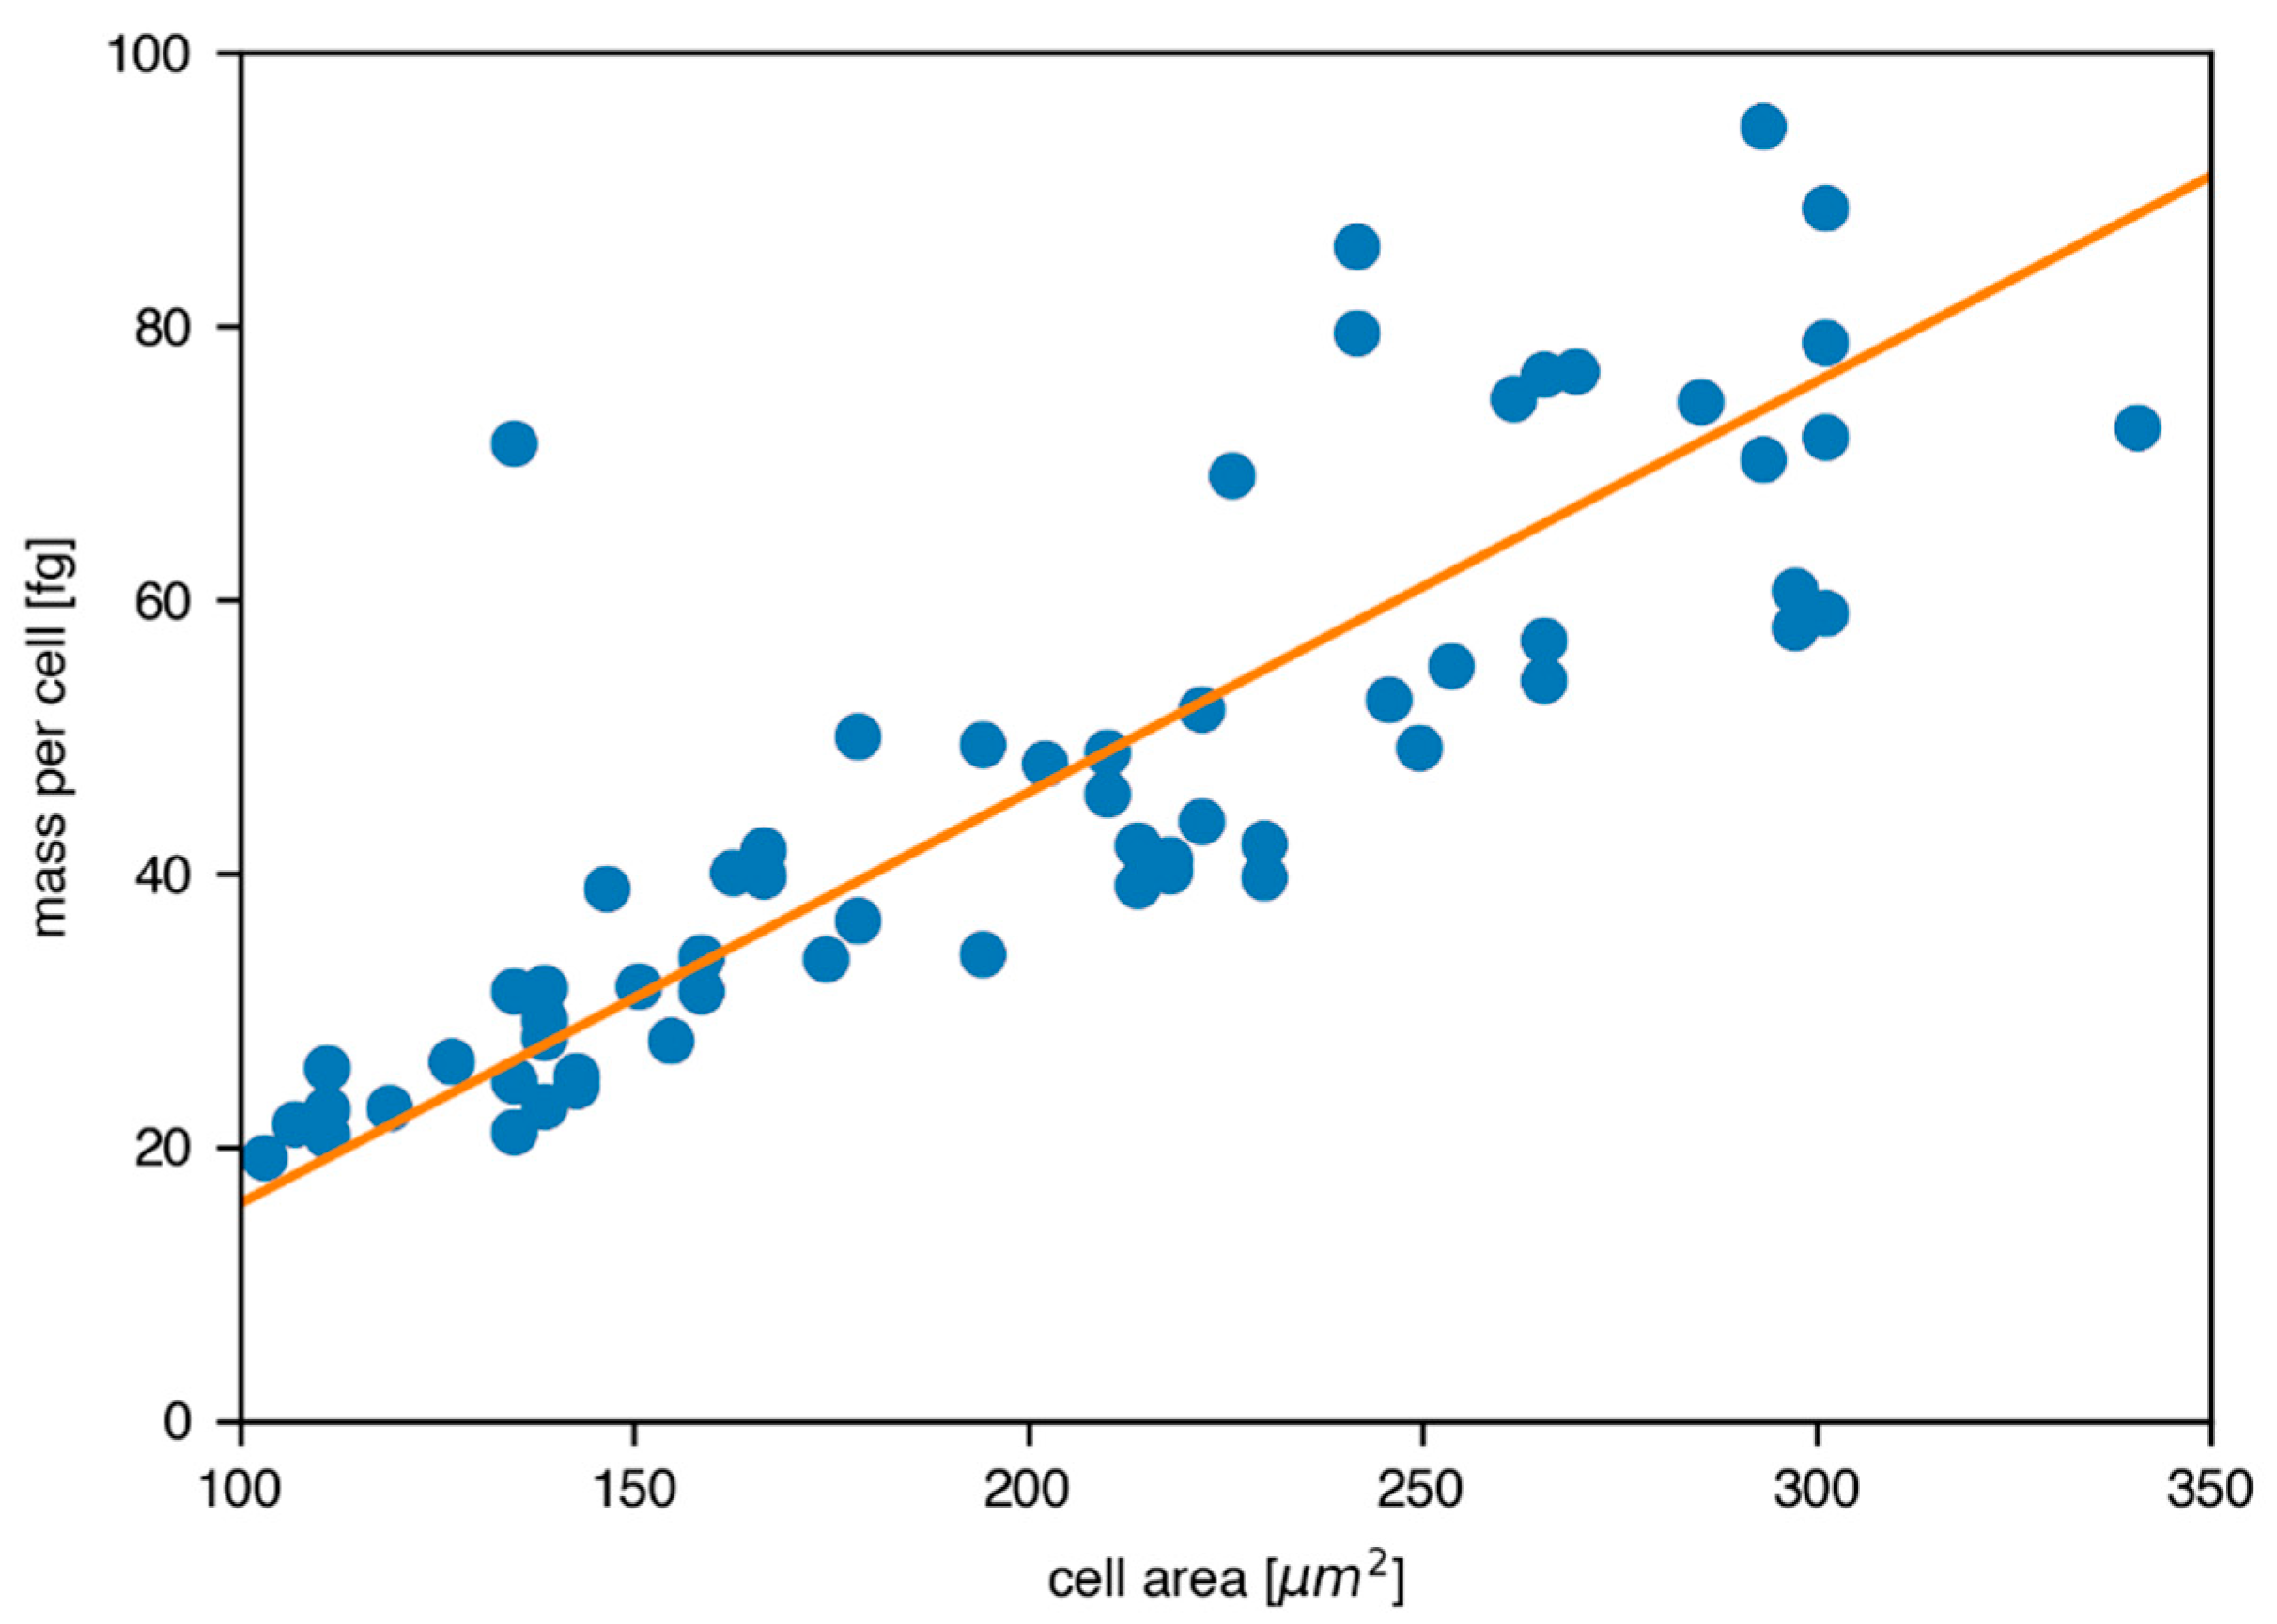
3.3. Single Cell Measurements to Determine I2-Q10 Uptake and Distribution
4. Discussion
Author Contributions
Funding
Institutional Review Board Statement
Informed Consent Statement
Data Availability Statement
Acknowledgments
Conflicts of Interest
References
- Willmann, J.K.; van Bruggen, N.; Dinkelborg, L.M.; Gambhir, S.S. Molecular imaging in drug development. Nat. Rev. Drug Discov. 2008, 7, 591–607. [Google Scholar] [CrossRef] [PubMed]
- Schmutzler, O.; Graf, S.; Behm, N.; Mansour, W.Y.; Blumendorf, F.; Staufer, T.; Körnig, C.; Salah, D.; Kang, Y.; Peters, J.N.; et al. X-ray Fluorescence Uptake Measurement of Functionalized Gold Nanoparticles in Tumor Cell Microsamples. Int. J. Mol. Sci. 2021, 22, 3691. [Google Scholar] [CrossRef] [PubMed]
- Kahl, H.; Staufer, T.; Körnig, C.; Schmutzler, O.; Rothkamm, K.; Grüner, F. Feasibility of Monitoring Tumor Response by Tracking Nanoparticle-Labelled T Cells Using X-ray Fluorescence Imaging—A Numerical Study. Int. J. Mol. Sci. 2021, 22, 8736. [Google Scholar] [CrossRef]
- Ungerer, A.; Staufer, T.; Schmutzler, O.; Körnig, C.; Rothkamm, K.; Grüner, F. X-ray Fluorescence Imaging for In Vivo Detection of Gold-Nanoparticle-Labeled Immune Cells: A GEANT4 Based Feasiblity Study. Cancers 2021, 13, 5759. [Google Scholar] [CrossRef] [PubMed]
- Osterode, W.; Falkenberg, G.; Wrba, F. Copper and Trace Elements in Gallbladder from Patients with Wilson’s Disease Imaged and Determined by Synchrotron X-ray Fluorescence. J. Imaging 2021, 7, 261. [Google Scholar] [CrossRef] [PubMed]
- Pushie, M.J.; Pickering, I.J.; Korbas, M.; Hackett, M.J.; George, G.N. Elemental and Chemically Specific X-ray Fluorescence Imaging of Biological Systems. Chem. Rev. 2014, 114, 8499–8541. [Google Scholar] [CrossRef]
- Sanchez-Cano, C.; Alvarez-Puebla, R.A.; Abendroth, J.M.; Beck, T.; Blick, R.; Cao, Y.; Caruso, F.; Chakraborty, I.; Chapman, H.N.; Chen, C.; et al. X-ray Based Techniques to Study the Nano-Bio Interface. ACS Nano 2021, 15, 3754–3807. [Google Scholar] [CrossRef]
- Grüner, F.; Blumendorf, F.; Schmutzler, O.; Staufer, T.; Bradbury, M.; Wiesner, U.; Rosentreter, T.; Loers, G.; Lutz, D.; Richter, B.; et al. Localising functionalised gold-nanoparticles in murine spinal cords by X-ray fluorescence imaging and background-reduction through spatial filtering for human-sized objects. Sci. Rep. 2018, 8, 16561. [Google Scholar] [CrossRef]
- Körnig, C.; Staufer, T.; Schmutzler, O.; Bedke, T.; Machicote, A.; Liu, B.; Liu, Y.; Gargioni, E.; Feliu, N.; Parak, W.J.; et al. In-situ X-Ray Fluorescence Imaging of the Endogenous Iodine Distribution in Murine Thyroids. Sci. Rep. 2022, 12, 2903. [Google Scholar] [CrossRef]
- Naganawa, M.; Gallezot, J.-D.; Rossano, S.; Carson, R.E. Quantitative PET Imaging in Drug Development: Estimation of Target Occupancy. Bull. Math. Biol. 2019, 81, 3508–3541. [Google Scholar] [CrossRef]
- Gomes, C.M.; Abrunhosa, A.J.; Ramos, P.; Pauwels, E.K.J. Molecular imaging with SPECT as a tool for drug development. Adv. Drug Deliv. Rev. 2011, 63, 547–554. [Google Scholar] [CrossRef] [PubMed]
- Wilfschefski, S.C.; Baxter, M.R. Inductively Coupled Plasma Mass Spectrometry: Introduction to Analytical Aspects. Clin. Biochem. Rev. 2019, 40, 115–133. [Google Scholar] [CrossRef] [PubMed]
- Littarru, G.P.; Tiano, L. Clinical aspects of coenzyme Q10: An update. Curr. Opin. Clin. Nutr. Metab. Care 2005, 8, 641–646. [Google Scholar] [CrossRef]
- Rittié, L.; Fisher, G.J. UV-light-induced signal cascades and skin aging. Ageing Res. Rev. 2002, 1, 705–720. [Google Scholar] [CrossRef]
- Knott, A.; Achterberg, V.; Smuda, C.; Mielke, H.; Sperling, G.; Dunckelmann, K.; Vogelsang, A.; Krüger, A.; Schwengler, H.; Behtash, M.; et al. Topical treatment with coenzyme Q10-containing formulas improves skin’s Q10 level and provides antioxidative effects. Biofactors 2015, 41, 383–390. [Google Scholar] [CrossRef] [PubMed]
- Montero, R.; Sánchez-Alcázar, J.A.; Briones, P.; Rodríguez Hernández, A.; Cordero, M.D.; Trevisson, E.; Salviati, L.; Pineda, M.; García-Cazorla, A.; Navas, P.; et al. Analysis of coenzyme Q10 in muscle and fibroblasts for the diagnosis of CoQ10 deficiency syndromes. Clin. Biochem. 2008, 41, 697–700. [Google Scholar] [CrossRef] [PubMed]
- Schniertshauer, D.; Gebhard, D.; Bergemann, J. Age-Dependent Loss of Mitochondrial Function in Epithelial Tissue Can Be Reversed by Coenzyme Q10. J. Aging Res. 2018, 2018, 6354680. [Google Scholar] [CrossRef]
- Quinzii, C.M.; Hirano, M. Coenzyme Q and Mitochondrial Disease. Dev. Disabil. Res. Rev. 2010, 16, 183–188. [Google Scholar] [CrossRef]
- Sreedhar, A.; Aguilera-Aguirre, L.; Singh, K.K. Mitochondria in skin health, aging, and disease. Cell Death Dis. 2020, 11, 444. [Google Scholar] [CrossRef]
- Prahl, S.; Kueper, T.; Biernoth, T.; Wöhrmann, Y.; Münster, A.; Fürstenau, M.; Schmidt, M.; Schulze, C.; Wittern, K.-P.; Wenck, H.; et al. Aging skin is functionally anaerobic: Importance of coenzyme Q10 for anti aging skin care. Biofactors 2008, 32, 245–255. [Google Scholar] [CrossRef]
- Kalén, A.; Appelkvist, E.L.; Dallner, G. Age-related changes in the lipid compositions of rat and human tissues. Lipids 1989, 24, 579–584. [Google Scholar] [CrossRef] [PubMed]
- Takahashi, K.; Ohsawa, I.; Shirasawa, T.; Takahashi, M. Early-onset motor impairment and increased accumulation of phosphorylated α-synuclein in the motor cortex of normal aging mice are ameliorated by coenzyme Q. Exp. Gerontol. 2016, 81, 65–75. [Google Scholar] [CrossRef] [PubMed]
- Nagase, M.; Yamamoto, Y.; Matsumoto, N.; Arai, Y.; Hirose, N. Increased oxidative stress and coenzyme Q10 deficiency in centenarians. J. Clin. Biochem. Nutr. 2018, 63, 129–136. [Google Scholar] [CrossRef] [PubMed]
- Niklowitz, P.; Onur, S.; Fischer, A.; Laudes, M.; Palussen, M.; Menke, T.; Döring, F. Coenzyme Q10 serum concentration and redox status in European adults: Influence of age, sex, and lipoprotein concentration. J. Clin. Biochem. Nutr. 2016, 58, 240–245. [Google Scholar] [CrossRef]
- Zaki, N.M. Strategies for oral delivery and mitochondrial targeting of CoQ10. Drug Deliv. 2016, 23, 1868–1881. [Google Scholar] [CrossRef]
- Ebadi, M.; Govitrapong, P.; Sharma, S.; Muralikrishnan, D.; Shavali, S.; Pellett, L.; Schafer, R.; Albano, C.; Eken, J. Ubiquinone (coenzyme q10) and mitochondria in oxidative stress of Parkinson’s disease. Biol. Signals Recept. 2001, 10, 224–253. [Google Scholar] [CrossRef]
- Wadsworth, T.L. Evaluation of coenzyme Q as an antioxidant strategy for Alzheimer’s disease. J. Alzheimer’s Dis. 2008, 14, 225–234. [Google Scholar] [CrossRef]
- Di Lorenzo, A.; Iannuzzo, G.; Parlato, A.; Cuomo, G.; Testa, C.; Coppola, M.; D‘Ambrosio, G.; Alessandro Oliviero, D.; Sarullo, S.; Vitale, G.; et al. Clinical Evidence for Q10 Coenzyme Supplementation in Heart Failure: From Energetics to Functional Improvemen. J. Clin. Med. 2020, 9, 1266. [Google Scholar] [CrossRef]
- Tatsuta, Y.; Kasai, K.; Maruyama, C.; Hamano, Y.; Matsuo, K.; Katano, H.; Taira, S. Imaging mass spectrometry analysis of ubiquinol localization in the mouse brain following short-term administration. Sci. Rep. 2017, 7, 12990. [Google Scholar] [CrossRef]
- Watanabe, K.; Nozaki, S.; Goto, M.; Kaneko, K.-I.; Hayashinaka, E.; Irie, S.; Nishiyama, A.; Kasai, K.; Fujii, K.; Wada, Y.; et al. PET imaging of 11C-labeled coenzyme Q10: Comparison of biodistribution between [11C]ubiquinol-10 and [11C]ubiquinone-10. Biochem. Biophys. Res. Commun. 2019, 7, 611–615. [Google Scholar] [CrossRef]
- Dabdoub, M.J.; Dabdoub, V.B.; Baroni, A.C.M. Hydrozirconation of Stannylacetylenes: A Novel and Highly Efficient Synthesis of 1,1-Diiodo-, 1,1-Dibromo-, and Mixed (Z)- or (E)-1-Iodo-1-bromo-1-alkenes Using 1,1-Hetero-Bimetallic Reagents. J. Am. Chem. Soc. 2001, 123, 9694–9695. [Google Scholar] [CrossRef] [PubMed]
- Roggenkamp, D.; Falkner, S.; Stäb, F.; Petersen, M.; Schmelz, M.; Neufang, G. Atopic keratinocytes induce increased neurite outgrowth in a coculture model of porcine dorsal root ganglia neurons and human skin cells. J. Invest. Dermatol. 2012, 132, 1892–1900. [Google Scholar] [CrossRef] [PubMed]
- Marcheggiani, F.; Kordes, S.; Cirilli, I.; Orlando, P.; Silvestri, S.; Vogelsang, A.; Möller, N.; Blatt, T.; Weise, J.M.; Damiani, E.; et al. Anti-aging effects of ubiquinone and ubiquinol in a senescence model of human dermal fibroblasts. Free Radic. Biol. Med. 2021, 165, 282–288. [Google Scholar] [CrossRef] [PubMed]
- Silvestri, S.; Orlando, P.; Armeni, T.; Padella, L.; Brugé, F.; Seddaiu, G.; Littaru, G.P.; Tiano, L. Coenzyme Q10 and α-lipoic acid: Antioxidant and pro-oxidant effects in plasma and peripheral blood lymphocytes of supplemented subjects. J. Clin. Biochem. Nutr. 2015, 57, 21–26. [Google Scholar] [CrossRef] [PubMed]
- Falkenberg, G.; Fleissner, G.; Fleissner, G.; Alraun, P.; Boesenberg, U.; Spiers, K. Large scale high-resolution micro-XRF analysis of histological structures in the skin of the pigeon beak. X-Ray Spectrom. 2017, 46, 467–473. [Google Scholar] [CrossRef]
- Schoonjans, T.; Brunetti, A.; Golosio, B.; Sanchez del Rio, M.; Armando Sole, V.; Ferrero, C.; Vincze, L. The xraylib library for X-ray-matter interactions. Recent developments. Spectrochim. Acta Part B At. Spectrosc. 2012, 66, 776–784. [Google Scholar] [CrossRef]
- Schneider, C.A.; Rasband, W.S.; Eliceiri, K.W. NIH Image to ImageJ: 25 years of image analysis. Nat. Methods 2012, 9, 671–675. [Google Scholar] [CrossRef]
- Hoppe, U.; Bergemann, J.; Diembeck, W.; Ennen, J.; Gohla, S.; Harris, I.; Jacob, J.; Kielholz, J.; Mei, W.; Pollet, D.; et al. Coenzyme Q10, a cutaneous antioxidant and energizer. Biofactors 1999, 9, 371–378. [Google Scholar] [CrossRef]
- Turunen, M.; Olsson, J.; Dallner, G. Metabolism and function of coenzyme Q. Biochim. Biophys. Acta 2004, 1660, 171–199. [Google Scholar] [CrossRef]
- Králova, J.; Jurášek, M.; Mikšátková, L.; Marešová, A.; Fähnrich, J.; Cihlárová, P.; Drašar, P.; Bartunek, P.; Král, V. Influence of fluorophore and linker length on the localization and trafficking of fluorescent sterol probes. Sci. Rep. 2020, 10, 22053. [Google Scholar] [CrossRef]
- Jin, Q.; Paunesku, T.; Lai, B.; Gleber, S.-C.; Chen, S.; Finney, L.; Vine, D.; Vogt, S.; Woloschak, G.; Jacobsen, C. Preserving elemental content in adherent mammalian cells for analysis by synchrotron-based x-ray fluorescence microscopy. J. Microsc. 2017, 265, 81–93. [Google Scholar] [CrossRef] [PubMed]
- Marcheggiani, F.; Cirilli, I.; Orlando, P.; Silvestri, S.; Vogelsang, A.; Knott, A.; Blatt, T.; Weise, J.M.; Tiano, L. Modulation of Coenzyme Q10 content and oxidative status in human dermal fibroblasts using HMG-CoA reductase inhibitor over a broad range of concentrations. From mitohormesis to mitochondrial dysfunction and accelerated aging. Aging 2019, 11, 2565–2582. [Google Scholar] [CrossRef] [PubMed]
- Blatt, T.; Littarru, G.P. Biochemical rationale and experimental data on the antiaging properties of CoQ(10) at skin level. Biofactors 2011, 37, 381–385. [Google Scholar] [CrossRef] [PubMed]
- Mohs, R.C.; Greig, N.H. Drug discovery and development: Role of basic biological research. Alzheimer’s Dement. Transl. Res. Clin. Interv. 2017, 3, 651–657. [Google Scholar] [CrossRef] [PubMed]


| Cell Pellet | Cell Number | Scan Duration [s] | Photons per Pixel | Resolution [mm] | Iodine/Cell [fg] |
|---|---|---|---|---|---|
| Donor 1, 50 μM I2-Q10 | 600,000 | 10 | 1.7 × 10¹² | 0.5 | 44.5 |
| Donor 2, 50 μM I2-Q10 | 600,000 | 10 | 1.7 × 10¹² | 0.5 | 48 |
| Donor 3, 50 μM I2-Q10 | 400,000 | 10 | 1.7 × 10¹² | 0.5 | 68.5 |
| Donor 1, no treatment | 750,000 | 10 | 1.7 × 10¹² | 0.5 | 0 |
| Donor 1, 50 μM Iodine | 1,000,000 | 10 | 7.5 × 10¹¹ | 1 | 9.1 |
| Donor 2, 50 μM Iodine | 1,000,000 | 10 | 7.5 × 10¹¹ | 1 | 9.6 |
| Donor 2, 8.5 μM Iodine | 1,000,000 | 10 | 7.5 × 10¹¹ | 1 | 0 |
| P06, DESY, Hamburg | ||
|---|---|---|
| Incident energy [keV] | 12 | |
| High-resolution condition | High-flux condition | |
| Photon flux [photons/sec] | 1.6 × 10¹⁰ | 6 × 10¹¹ |
| Beam size [μm2] | 0.33 × 0.24 | 2.40 × 2.40 |
Publisher’s Note: MDPI stays neutral with regard to jurisdictional claims in published maps and institutional affiliations. |
© 2022 by the authors. Licensee MDPI, Basel, Switzerland. This article is an open access article distributed under the terms and conditions of the Creative Commons Attribution (CC BY) license (https://creativecommons.org/licenses/by/4.0/).
Share and Cite
Staufer, T.; Schulze, M.L.; Schmutzler, O.; Körnig, C.; Welge, V.; Burkhardt, T.; Vietzke, J.-P.; Vogelsang, A.; Weise, J.M.; Blatt, T.; et al. Assessing Cellular Uptake of Exogenous Coenzyme Q10 into Human Skin Cells by X-ray Fluorescence Imaging. Antioxidants 2022, 11, 1532. https://doi.org/10.3390/antiox11081532
Staufer T, Schulze ML, Schmutzler O, Körnig C, Welge V, Burkhardt T, Vietzke J-P, Vogelsang A, Weise JM, Blatt T, et al. Assessing Cellular Uptake of Exogenous Coenzyme Q10 into Human Skin Cells by X-ray Fluorescence Imaging. Antioxidants. 2022; 11(8):1532. https://doi.org/10.3390/antiox11081532
Chicago/Turabian StyleStaufer, Theresa, Mirja L. Schulze, Oliver Schmutzler, Christian Körnig, Vivienne Welge, Thorsten Burkhardt, Jens-Peter Vietzke, Alexandra Vogelsang, Julia M. Weise, Thomas Blatt, and et al. 2022. "Assessing Cellular Uptake of Exogenous Coenzyme Q10 into Human Skin Cells by X-ray Fluorescence Imaging" Antioxidants 11, no. 8: 1532. https://doi.org/10.3390/antiox11081532