Article

Characterization of SOD and GPX Gene Families in the Soybeans in Response to Drought and Salinity Stresses

1
National Center for Soybean Improvement, State Key Laboratory of Crop Genetics and Germplasm Enhancement, Nanjing Agricultural University, Nanjing 210095, China
2
Center for Advanced Studies in Agriculture and Food Security (CAS-AFS), University of Agriculture, Faisalabad 38040, Pakistan
3
Barani Agricultural Research Station, Fatehjang 43350, Pakistan
4
Cotton Research Station, Ayub Agricultural Research Institute, Faisalabad 38040, Pakistan
5
Department of Botany, University of Agriculture, Faisalabad 38040, Pakistan
6
Department of Plant Breeding and Genetics, University of Agriculture, Faisalabad 38040, Pakistan
7
Instituto de Conservación y Mejora de la Agrodiversidad Valenciana, Universitat Politècnica de València, 46022 Valencia, Spain
8
Botany and Microbiology Department, College of Science, King Saud University, Riyadh 12546, Saudi Arabia
9
International Genome Center, Jiangsu University, Zhenjiang 212013, China
*
Authors to whom correspondence should be addressed.
Antioxidants 2022, 11(3), 460; https://doi.org/10.3390/antiox11030460
Submission received: 15 January 2022 / Revised: 5 February 2022 / Accepted: 6 February 2022 / Published: 25 February 2022

Abstract

:
Plant stresses causing accumulation of reactive oxidative species (ROS) are scavenged by effective antioxidant defense systems. Therefore, the present study performed genome-wide identification of superoxide dismutase (SOD) and glutathione peroxidase (GPX) gene families in cultivated and wild soybeans, and 11 other legume species. We identified a total of 101 and 95 genes of SOD and GPX, respectively, across thirteen legume species. The highest numbers of SODs and GPXs were identified in cultivated (Glycine max) and wild (Glycine soja). A comparative phylogenetic study revealed highest homology among the SODs and GPXs of cultivated and wild soybeans relative to other legumes. The exon/intron structure, motif and synteny blocks were conserved in both soybean species. According to Ka/Ks, purifying the selection played the major evolutionary role in these gene families, and segmental duplication are major driving force for SODs and GPXs expansion. In addition, the qRT-PCR analysis of the G. max and G. soja SOD and GPX genes revealed significant differential expression of these genes in response to oxidative, drought and salinity stresses in root tissue. In conclusion, our study provides new insights for the evolution of SOD and GPX gene families in legumes, and provides resources for further functional characterization of these genes for multiple stresses.

1. Introduction

Plants, being sessile, are often subjected to diverse environmental stress conditions such as abiotic and biotic stresses [1]. In this context, drought and salinity are the major abiotic stresses factors that plants face from germination to the harvesting stage [2]. Under these circumstances, limitation of CO2 intake due to stress-induced stomatal closure induces the photorespiratory production of reactive oxygen species (ROS). The main derivatives of ROS, including superoxide (O2•−), hydroxyl radical (OH), per hydroxy radical (HO2•), alkoxy radicals (RO), hydrogen peroxide (H2O2) and singlet oxygen (1O2) are produced by the over-reduced photosynthetic electron transport chain. Under stress conditions, excess accumulation of ROS causes oxidative stress, which leads to extensive damage to DNA, protein and lipids, hence disturbing the normal metabolism and cellular functions [3,4,5].
In order to alleviate the ROS induced oxidative damage to plant tissues, plants have developed an antioxidant defense machinery to protect themselves from this damage [2]. This antioxidant defense system comprises both enzymatic and non-enzymatic ROS scavengers. For example, enzymes namely glutathione peroxidase (GPX), superoxide dismutase (SOD), catalase (CAT), ascorbate peroxidase (APX), monodehydroascorbate reductase, dehydro-ascorbate reductase, peroxiredoxin, glutathione reductase and glutathione S-transferase are enzymatic antioxidants involved in ROS detoxification [6]. The SOD provides the first line of defense against ROS toxicity in cells by catalyzing the conversion or dismutation of O2●− radicals into H2O2 and molecular oxygen [3]. The SOD-mediated alleviation of the oxidative stress under different abiotic stresses has been reported in different plant species. For example, the transgenic rice overexpressing the Mn-SOD gene transformed from pea plant depicted improved resistance against drought stress, while in B. napus higher SOD activity was associated with salt tolerance [7,8]. Similarly, low expression of SOD enzyme under drought stress was found to be associated with more superoxide in Sulla coronaria (L.) Medik [9]. Increase in the expression of Cu-based SODs has been seen in B. juncea, while in B. rapa Mn- and Cu-based genes were found upregulated in response to heat stress [10]. The number of SOD genes has been reported to vary from seven to 29 in various species such as seven genes which were found in Arabidopsis thaliana and Zea mays [11]; 18 in Gossypium hirsutum [10,12]; 23 in Triticum aestivum [13]; and 29 in Brassica juncea [10].
To this end, the GPX is a non-heme containing peroxidase which plays a key role in the catalyzing of H2O2 along with other hydroperoxides into water and corresponding alcohols using reduced thioredoxin or other reducing equivalents as electron donors [14]. In various plant species, numerous genes encoding GPX have been identified and characterized. The effective role of GPXs has been recorded in protecting cells from oxidative damage by acting as efficient ROS scavengers under different abiotic stresses, e.g., salinity, heavy metal, cold and drought [15,16,17]. Salt tolerance ability of transgenic rice has been improved significantly by the overexpression of NnGPX gene, which is transformed from lotus [18]. In Lotus japonicus, the GPXs have been found as a major ROS scavenger in nodules as the overexpression of LjGPX1 and LjGPXs3 has been found to effectively provides protection against salt stress-induced oxidative damage especially in nodules [19]. Moreover, the GPX gene family has been recently characterized in the rapeseed, and they identified 25 GPX genes; moreover, their role in the multiple abiotic stress response and hormonal signaling has been documented [16]. Studies were also conducted to examine the changes in the levels of POD (glutathione) under salt and drought stresses in grass pea. Increase in POD (glutathione) activity was more exposed to drought in shoot while roots were under more salinity stress [20]. Genome-wide identification studies reported 13 GPX genes from G. hirsutum, and six in Cucumis sativus [21,22].
Legume (Fabaceae) is the third largest family of land plants with more than 20,000 species comprising of herbs, trees and shrubs [23,24]. Traditionally, based on the morphological characters, particularly floral ones, it has been further classified into three major subfamilies: Papilionoideae. Mimosoideae and Caesalpinieae. Furthermore, the Papilionoideae has been divided into four clades that consist mostly of economically important food and feed legumes [24]. Among them, soybean is the most important and cultivated legume with diverse uses such as its oil and protein consumption for humans and livestock, as well as feedstock for biofuel production. Soybean growth and development is badly affected by multiple abiotic stresses, i.e., drought, salinity and high temperature. The genus Glycine consists of two subgenera Glycine wild and Soja, and both these genera contain 28 species. Among these 28 species, the two annual species viz., G. soja (wild) and G. max (cultivated) are mostly consumed as food or feed either directly or indirectly. Wild soybean harbors precious genetic resources and an extraordinarily important gene pool responsible for resistance to abiotic (drought and high temperatures) and biotic stresses (disease and insect pest) [25].
By keeping the above into view, to date the SOD and GPX gene families have remained uncharacterized in cultivated and wild soybean as well as in other legumes. Hence, in the present study we carried out the genome-wide identification of SOD and GPX gene families in G. soja and G. max by employing bioinformatics approaches. Furthermore, the physicochemical properties, phylogenetic relationship, gene structure, protein motifs, promoter sequences, chromosome location, duplication and evolutionary sequence similarity were also analyzed for the identified SOD and GPX genes. Furthermore, expression analysis of randomly selected GsoSODs and GsoGPXs genes from wild soybean has been carried out to understand their response against drought, salinity and oxidative stresses.

2. Materials and Methods

2.1. Database Searches and Retrieval of SOD and GPX Genes

Genome sequences along with protein, gene sequences and annotation files of selected species were downloaded from their respective genomic databases are enlisted in Table 1. We filtered sequence files according to following criteria: (1) the longest transcript was selected to represent each locus, (2) coding sequences less than 150 bp were eliminated, and (3) the genes encoding the incomplete domain and truncated protein were discarded [26]. The sequences obtained after filtering were subjected to the Hidden Markov Model (HMM) of Pfam search of protein sequences to identify the protein domain family [27]. Furthermore, all the protein sequences were examined for the presence of SODs and the GPXs domain by the SMART tool [28]. For better understanding, the genes were named by following the approach; first three letters (i.e., Gso) representing the species name as Glycine soja, the next three letters (i.e., SOD or GPX) depicting the gene family, and the last two numbers represent as—1st digit represent chromosome number, and the second digit after the decimal represent gene number of gene family lying on a particular chromosome. For example, GsoGPX2.4 refers the GPX gene located on chromosome 2 in Glycine soja, while 4 indicates the fourth GPX genes on chromosome 2.

2.2. Physicochemical Characteristics and Subcellular Localization

Physicochemical properties of SODs and GPXs proteins such as molecular weight, protein length and isoelectric point were checked by the ProtParam online tool [29]. Subcellular localization was predicted by using WegoLoc [30] and CELLO v.2.5 [31].

2.3. Multiple Sequence Alignment and Phylogenetic Analysis

Multiple sequence alignment was carried out by Clustal omega software [32], and the sequences with <50% identity were filtered out. Phylogenetic analysis was carried out to determine the evolutionary relationship of SOD and GPX proteins among 14 different species viz., Glycine max, Glycine soja, Medicago truncatula, Lotus japonicus, Cicer arietinum, Pisum sativum, Arachis ipaensis, Arachis duranensis, Phaseolus vulgaris, Lupinus angustifolius, Vigna unguiculata, Vigna radiate, Vigna angularis and Cajanus cajan along with model plant Arabidopsis thaliana. The phylogenetic tree was constructed in MEGA7 software [33], by employing the neighbor-joining method with 1000 bootstraps along with the poison model.

2.4. Gene Structure and Promoter Analysis

For the analysis of the intron–exon structure, the Gene Structure Display Server (GSDS) web tool was used by comparing the coding (CDS) and genomic sequences of each SOD and GPX genes [34]. MEME tool was used for the identification of conserved motifs. By submitting the protein sequences, we identified a maximum of 10 motifs with a motif width range from 6 to 50 [35].
In the G. max and G. soja, the 2000 bp upstream sequences from the translation start site of each SOD and GPX gene were downloaded and were used for promoter analysis. The promoter regions of each gene were screened for the cis-elements by using the PLANTCARE online tool [36].

2.5. Chromosomal Localization and Gene Duplication Analysis

Positional information of the SOD and GPX genes in G. max, G. soja and Medicago truncatula was obtained from the gene annotation file. The map diagram showing the location of GPX and SOD genes on chromosomes was drawn by using MapChart software [37]. Tandem duplications were defined as the homologous genes separated by five or fewer genes, while the genes separated by >5 genes or scattered on the different chromosome are known as segmental duplication. Gene duplication between SOD and GPX genes was identified by using the sequence demarcation tool SDTv1.2 [38]. The sequences with more than 90% similarity were considered as duplicated sequences.

2.6. Syntenic and Evolutionary Relationship

Sequence similarity between the SODs and GPXs protein sequence in G. max, G. soja, and M. truncatula was also carried by Circoletto software [39]. The G. max was used as a query against a database of G. soja, Medicago truncatula and A. thaliana SOD and GPX genes. The E-value was kept at 1 × 10⁻¹⁰, and it only shows the sequences that produced hits using percentage (%) identity (Blue = 70%, Green = 80%, and Orange = 90%) by keeping the rest of the parameters as default. Multi-sequence pairwise alignment of duplicated SOD and GPX genes was also carried out by the Clustal Omega and PAM weight matrix of MEGA7 software [33]. The subsequent alignments followed the synonymous (Ks) and non-synonymous (Ka) analysis for calculating the Ks and Ka substitution rates, respectively [40]. The ratio of Ka/Ks was calculated by the SNAP web tool to explore which type of codon selection activated during evolution. Probable time of the duplication event should also be calculated by using the formula T = Ks/2λ, whereas the value of λ = 6.1 × 10⁻⁹ was used for soybean [41].

2.7. Expression Pattern Detected by Transcriptome Data

To study the expression of GmSOD and GmGPX genes in different tissues and organs, transcriptome data extracted from a public soybean database were used to investigate the differential expression of GmSOD and GmGPX genes [42]. RNA-seq data of soybean SOD and GPX genes in different tissues were shown in Supplementary Table S1. A heatmap showing tissue-specific expression profiles was generated using the log2-transformed (FPKM + 1) values of SOD and GPX genes. Finally, visualization of the expression levels of SOD and GPX genes was accomplished by using the MeV 4.9.0 program (Anghel Saligny Nr 2 400609, Cluj-Napoca, Romania)

2.8. Plant Materials, Stress Treatments and Tissue Sampling

Representative and vigorous seeds of wild soybean viz., Glycine soja were used as a plant material for stress response investigations. These seeds were first disinfected by using 70% (v/v) ethanol, and then surface-sterilized for 4 h with sodium hypochlorite and hydrochloric acid (100 + 15 mL). The seeds of G. soja (genotype W05) were further germinated in plastic trays containing a mixture of soil and vermiculite at the ratio of 1:1. Seed germination was carried out in the incubator under controlled conditions by maintaining the proper environmental conditions as follows, i.e., the temperature was maintained at 25/23 °C, with a photoperiod of 16/8 h and 70% relative humidity (RH). At the second trifoliolate stage (V2), the soybean seedlings were transferred to the Hoagland solution, and the uniform length seedlings were planted in pots with 40 mL half strength Hoagland solution in each pot. The various abiotic stress treatments viz., drought, salinity and oxidative stresses were imposed when the second trifoliate leaves were fully expanded. For drought stress, the 15% PEG 6000 treatment were used in the Hoagland solution [43,44]. However, for salt treatment, the seedlings were subjected to 250 mM NaCl treatment in the Hoagland solution. For oxidative stress, the soybean seedlings were sprayed with the 10 mM H2O2. After exposure to each studied stress, the roots were sampled at 0 h, 3 h, 6 h and 12 h, respectively, from the 40–45-day-old seedlings. The completely randomized block design (CRBD) was used to plant the soybean seedlings, and three biological replicates were used for each stress treatment. Harvested root samples were immediately frozen in liquid nitrogen and stored at −80 ℃ until RNA extraction for quantitative real-time PCR (qRT-PCR).

2.9. RNA Isolation and Quantitative Real-Time PCR Analysis

To check the expression profiles of SOD and GPX genes in wild soybean, total RNA was isolated from the roots of soybean plants using the protocol suggested by the RNAprep Pure Plant Kit (Tiangen, China). Purity and concentration of the total RNA was determined by a Nanodrop ND-1000 spectrophotometer, and RNA integrity number (RIN) was measured using an Agilent Bioanalyzer 2100. The cDNA was synthesized using the Prime Script™ RT Reagent Kit (TaKaRa, Japan) according to the manufacturer’s instructions. Quantitative real-time PCR (qRT-PCR) was performed for each cDNA template using AceQ qPCR SYBR Green Master Mix (Vazyme, China) following the standard protocol. PCR amplification conditions were set as: 95 °C for 3 min; 35 cycles of 95 °C for 30 s, 58 °C for 20 s, and 72 °C for 20 s in a 20 µL reaction mixture. For qRT-PCR assays, three biological replications were used, and three measurements were performed on each replicate. The polymerase chain reaction (PCR) results were normalized using the Ct value corresponding to the soybean actin gene GsoActin-11 (Glysoja.18G049932) as an internal control. Relative expression level for each gene was calculated by the 2−ΔΔCt method [45]. All primers used were designed by the gene script web tool (Supplementary Table S2).

3. Results

3.1. Identification and Distribution of SOD and GPX Genes

By removing the non-targeted, overlapping or truncated protein sequences, we identified a total of 101 and 95 genes of SOD and GPX, respectively, in the 13 legume species (Supplementary Table S5). Genes from both families vary considerably among the 13 different species. For example, the number of GPX genes varied from 13 (G. max and G. soja) to three (V. radiata) (Supplementary Table S5), while as the SOD genes varied from 14 in G. max to three in L. japonicus and P. vulgaris (Supplementary Table S5). All these 101 SODS identified in 13 legume species contain conserved PF00080, PF00081 and PF02777 SOD domains. The Fe-SODs and Mn-SODs possess Iron/manganese superoxide dismutases, alpha-hairpin (Pfam: 00081), and C-terminal (Pfam: 02777) domains. The Cu/Zn-SODs had a copper/zinc superoxide dismutase domain (Pfam: 00080). In addition, the heavy metal domain (PF00403) was observed in the GsoSOD5.1 and GmaSOD5.1 (Supplementary Table S5). All the 95 GPX gene encoded proteins possess the Glutathione peroxidase (Pfam: PF00255) as a conserved domain (Supplementary Table S5).
The SOD genes encoded protein varied in the length from 149 to 388 amino acid residues (average length 227.93), has molecular weight ranging from 15.10 to 44.64 kDa and pI values varied from 4.73 to 8.97 23 in all the studied species. The protein length of GPX ranged from 114 to 327 amino acids (average length 194 amino acids), and the molecular weight from 12.74 to 160.39 kDa. An average weight of 23.58 kDa was recorded for GPX proteins. Moreover, the pI value was found to vary from 4.44 to 9.75, indicating a transition from an acidic to a basic nature of proteins.
In G. max, the length of SOD proteins ranged from 152 to 310 amino acids, while in G. soja it varied from 152 to 313 amino acids. Length of GPX proteins varied from 166 to 240 in G. max, and from 166 to 327 in G. soja. The pI values showed the acidic to basic nature of SODs (Table 1). Our results showed that the some of the gene pairs such as GsoSOD2.1 vs. GmaSOD2.1 and GsoGPX5.1 vs. GmaGPX5.1 from G soja and G max belonging to the same number of chromosomes were more evolutionary compared to each other in terms of protein weight, molecular weight (MW) and isoelectric point (PI). Information related to gene ID, rename ID, domain family and description, protein length, molecular weight, isoelectric point, and localization of SOD and GPX genes of 14 species are listed in Supplementary Table S5.

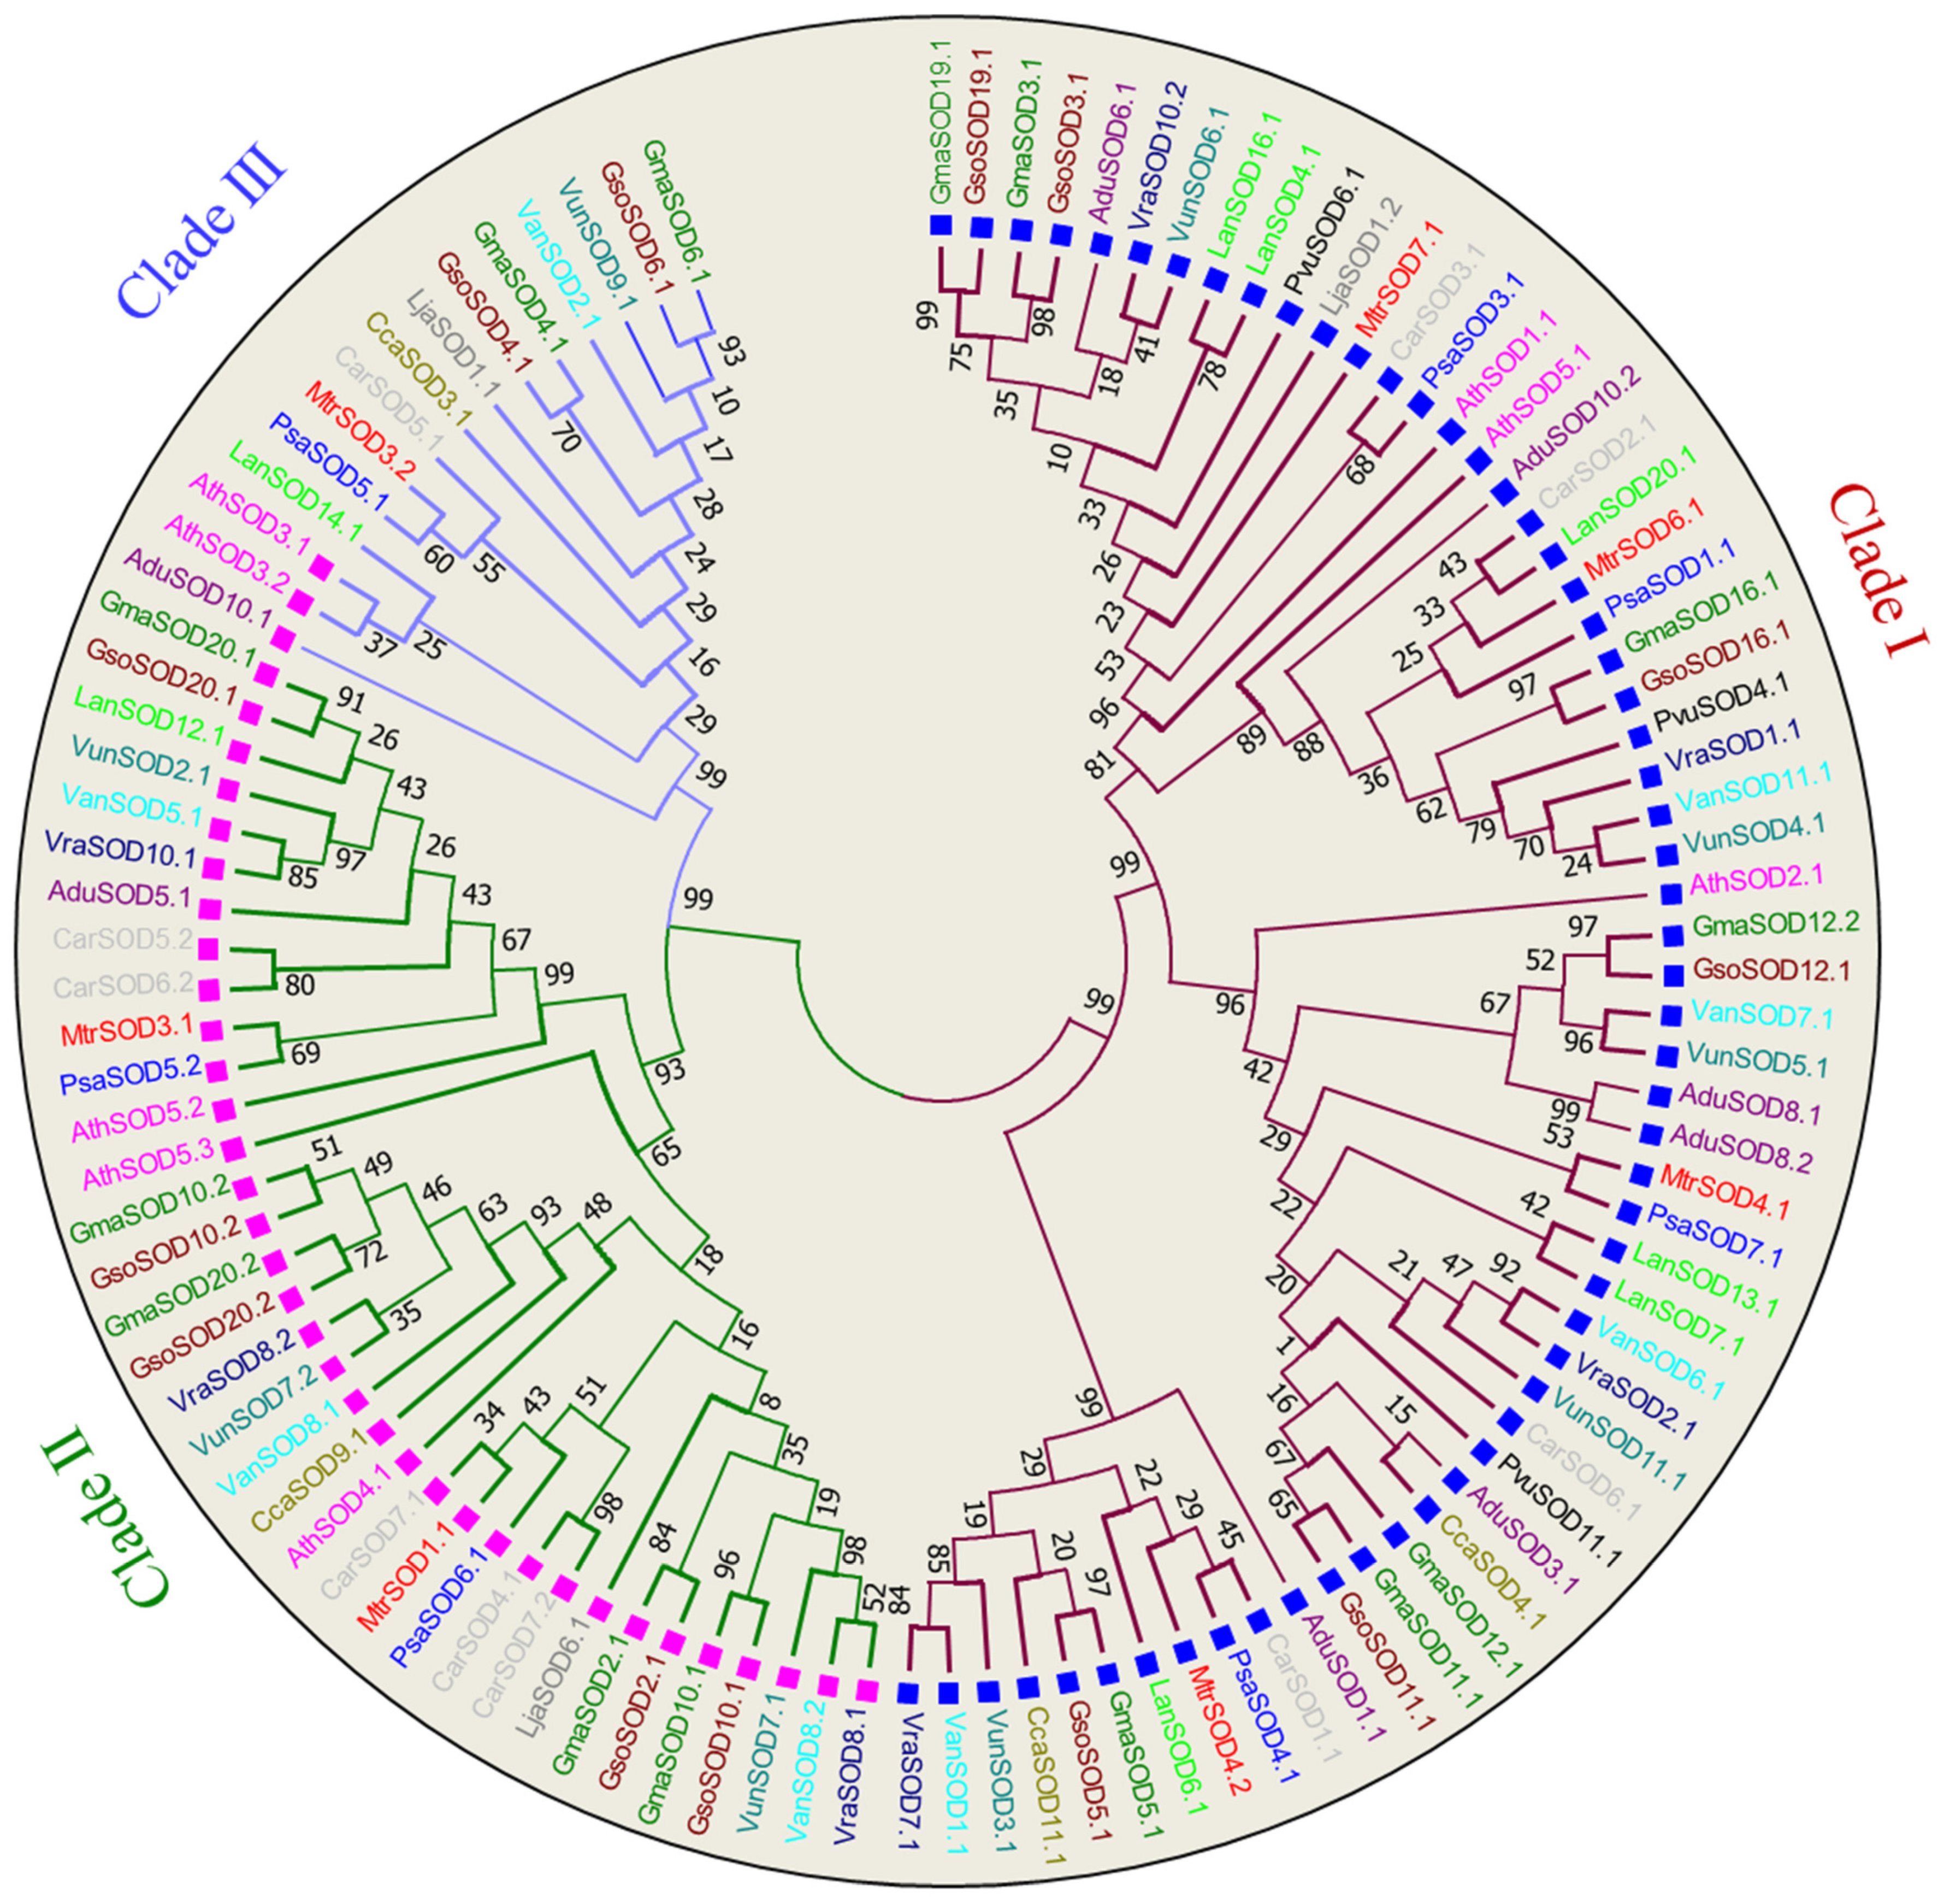
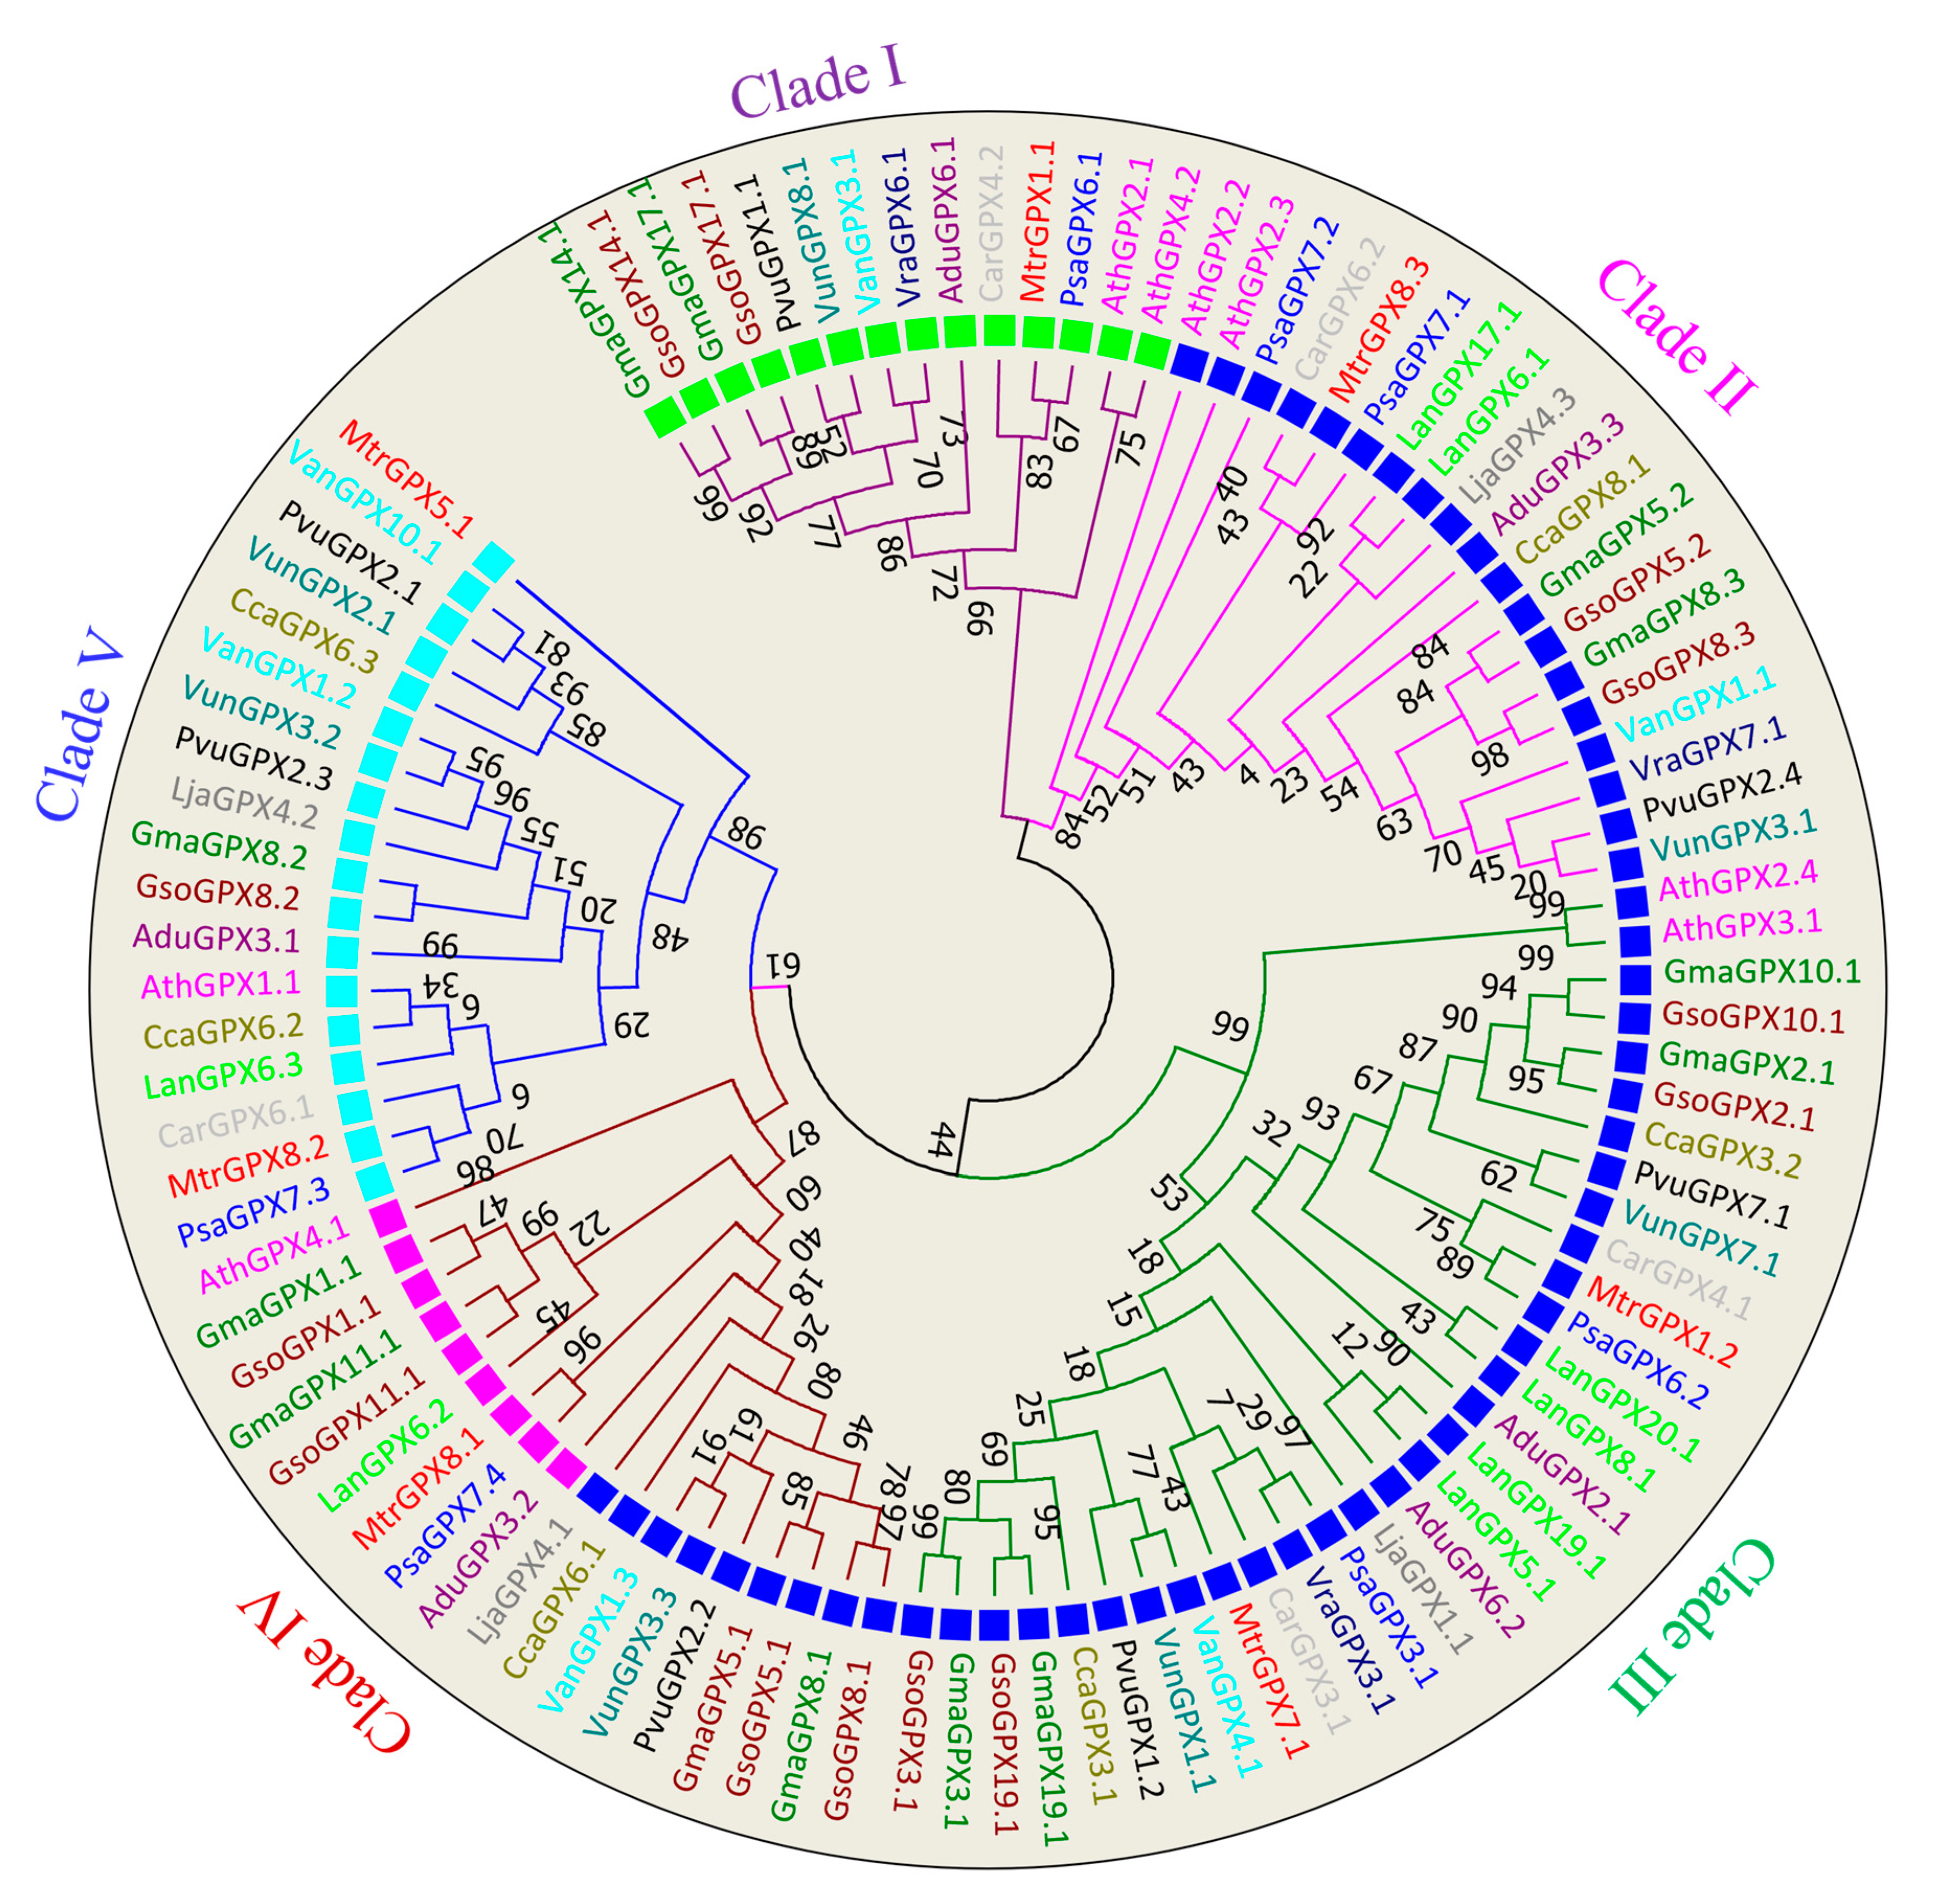
3.2. Phylogenetic Analysis of SOD and GPX Genes

Thirteen legume species along with model plant A. thaliana were selected to study the evolutionary history of SOD and GPX genes. Phylogenetic analysis of 109 SOD proteins was conducted to know the phylogenetic relationship among all the SOD genes of selected species. Based on tree topology, the SOD proteins of all species were categorized into three major groups viz., Cu/Zn-SODs (clade I), Fe-SODs (clade II) and Mn-SODs (clade III) (Figure 1). Clade I consisted of 59 Cu/Zn-SODs proteins, predicted to be localized in the cytoplasm, while Clade II clustered together 35 Fe-SODs that are localized in the chloroplast and Clade III was comprised of 15 Mn-SODs, suggested to be present in mitochondria. SOD genes belonging to Cu, Fe and Mn also varied between species. (Figure 1).
Phylogenetic analysis of GPXs members distributed them into five major clades, and each clade was represented with a different color of branch lines in Figure 2. Clade I consist of 14 members localized in the chloroplast; Clade II includes 19 members located in cytoplasm; Clade III is marked by thirty-one members with cytoplasmic localization, while Clade IV enclosed 18 members localized in both mitochondria and cytoplasm, such as mitochondrial (pink) and cytoplasm (blue). Clade V included 18 members with peroxisome localization. The clustering of the GPXs protein with different subcellular localization in the same group (clade II) depicts the gene duplication events leads to the formation of several GPX sequences. Tight clustering has been observed between G. max and G. soja genes compared other species, showing more similarity of G. max GPX genes with the G. soja genes compared to that of other legumes.

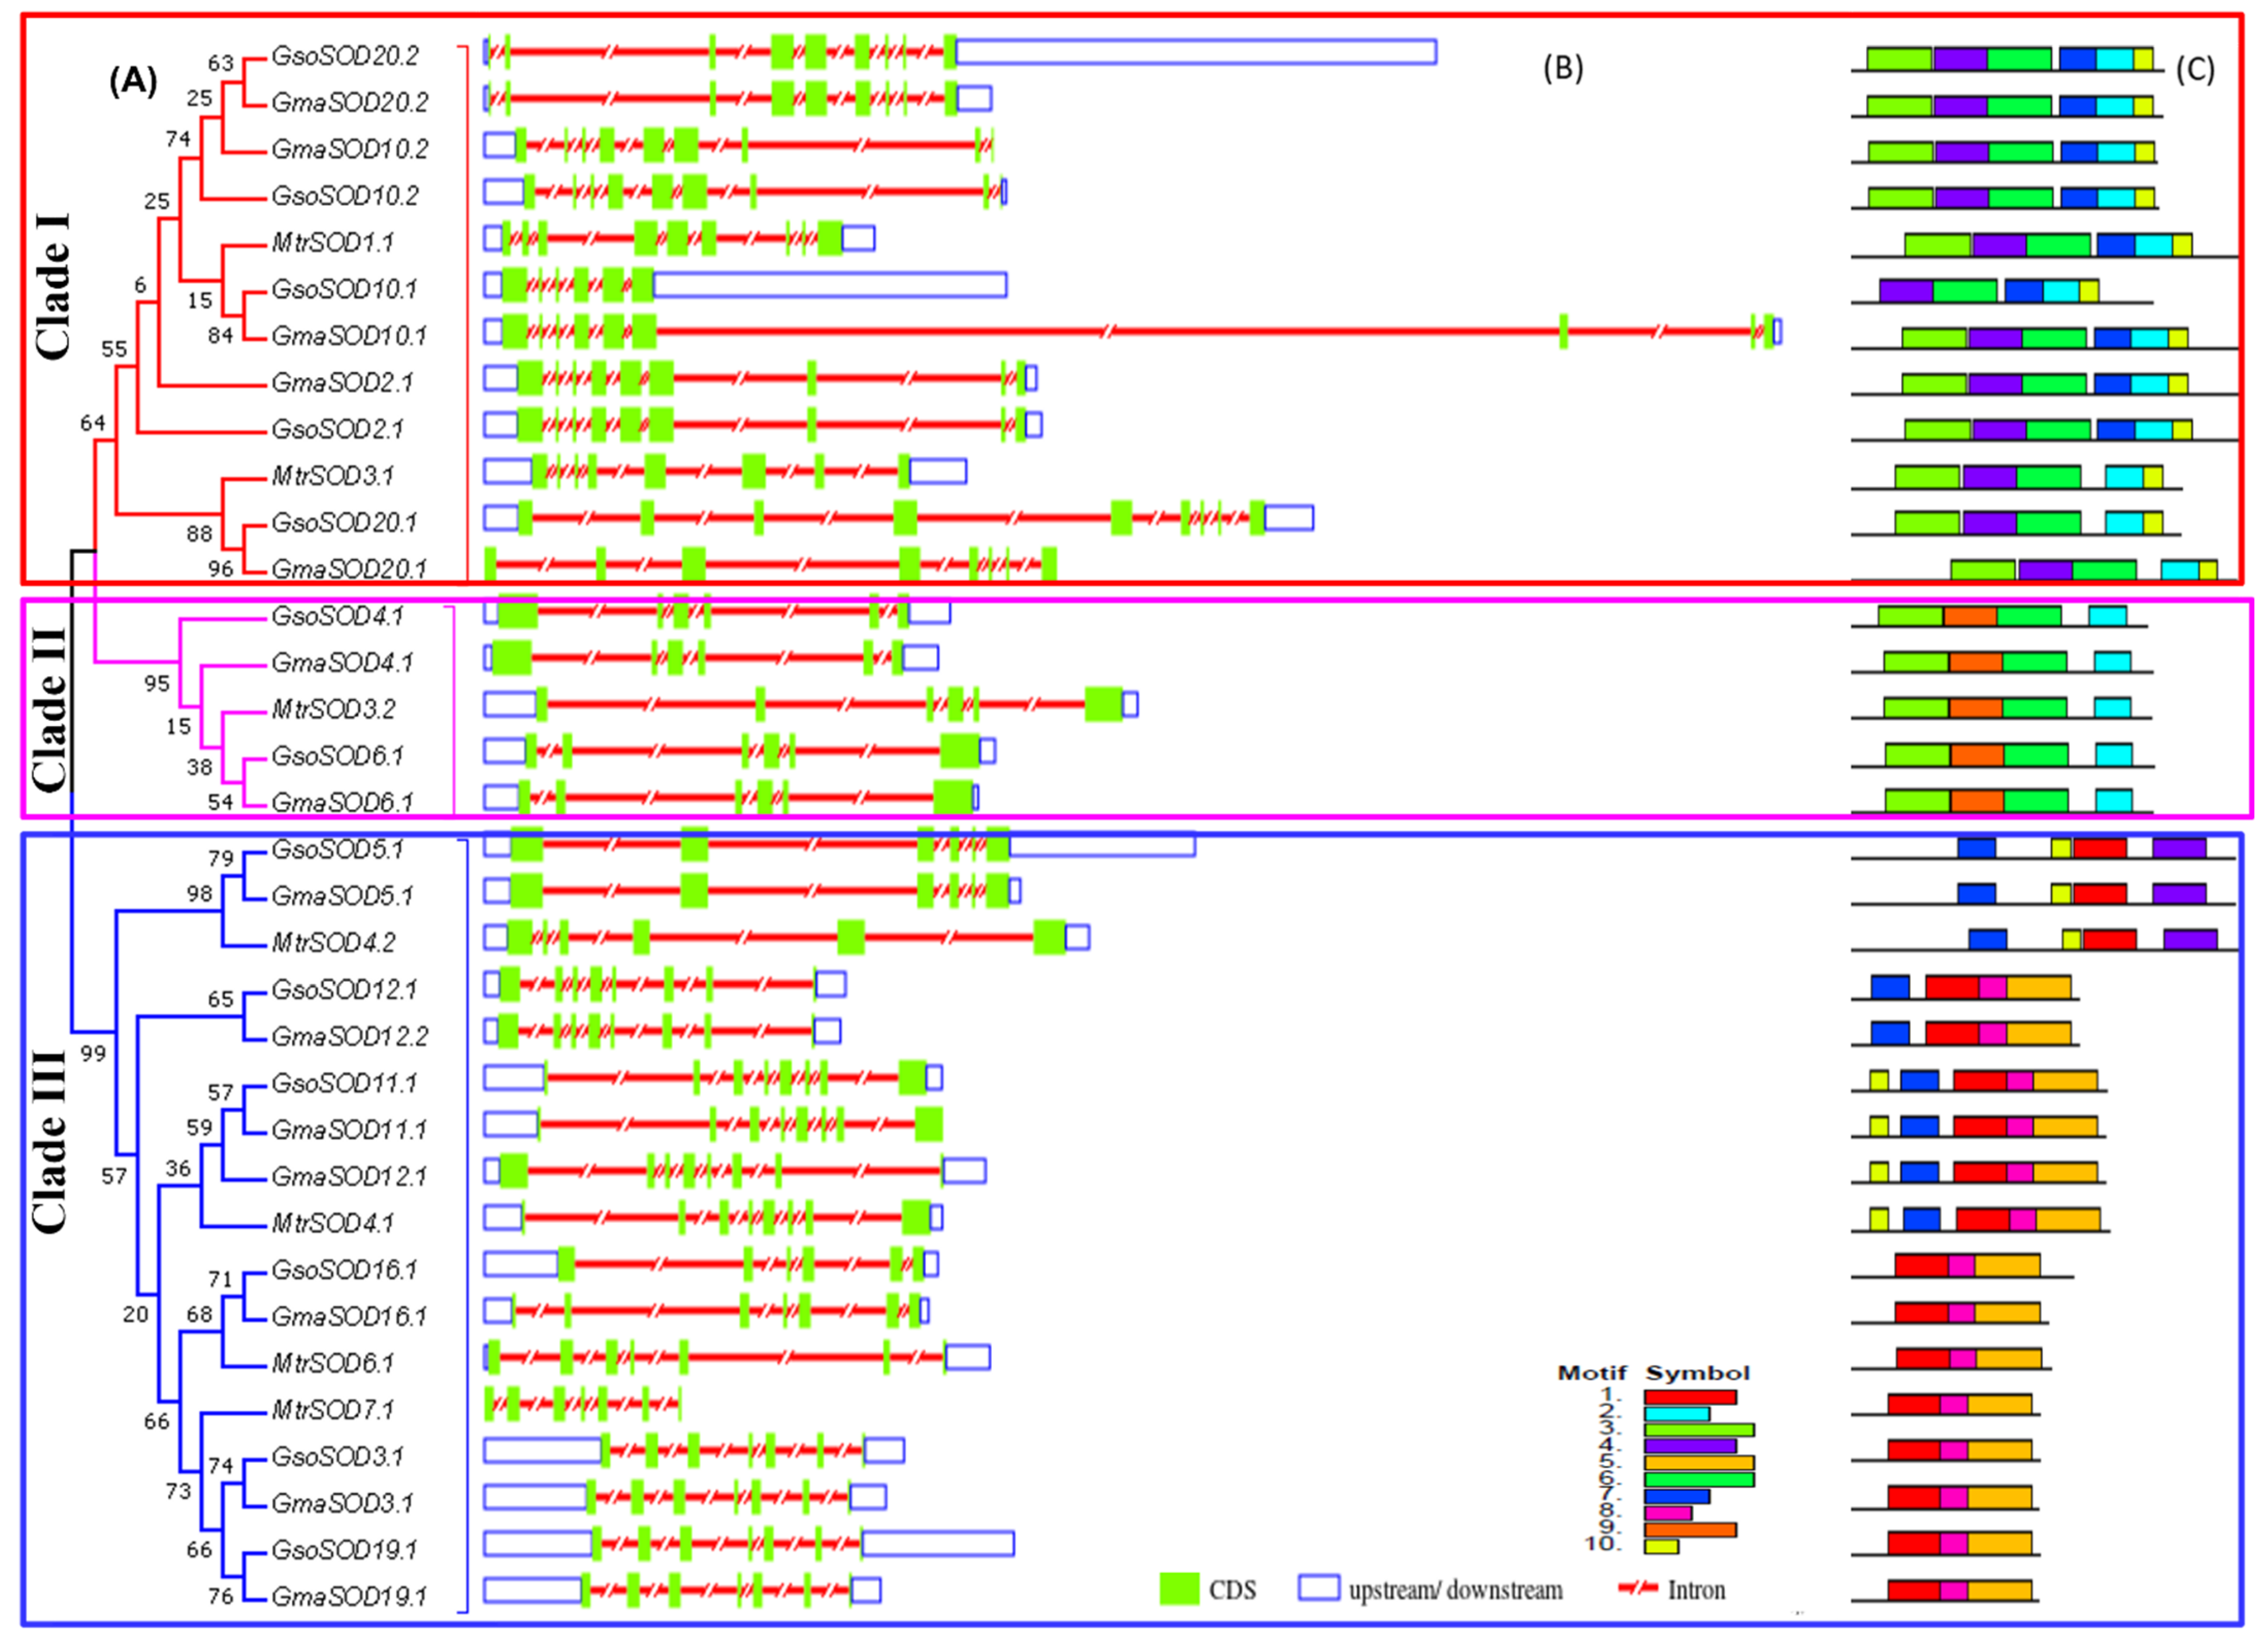
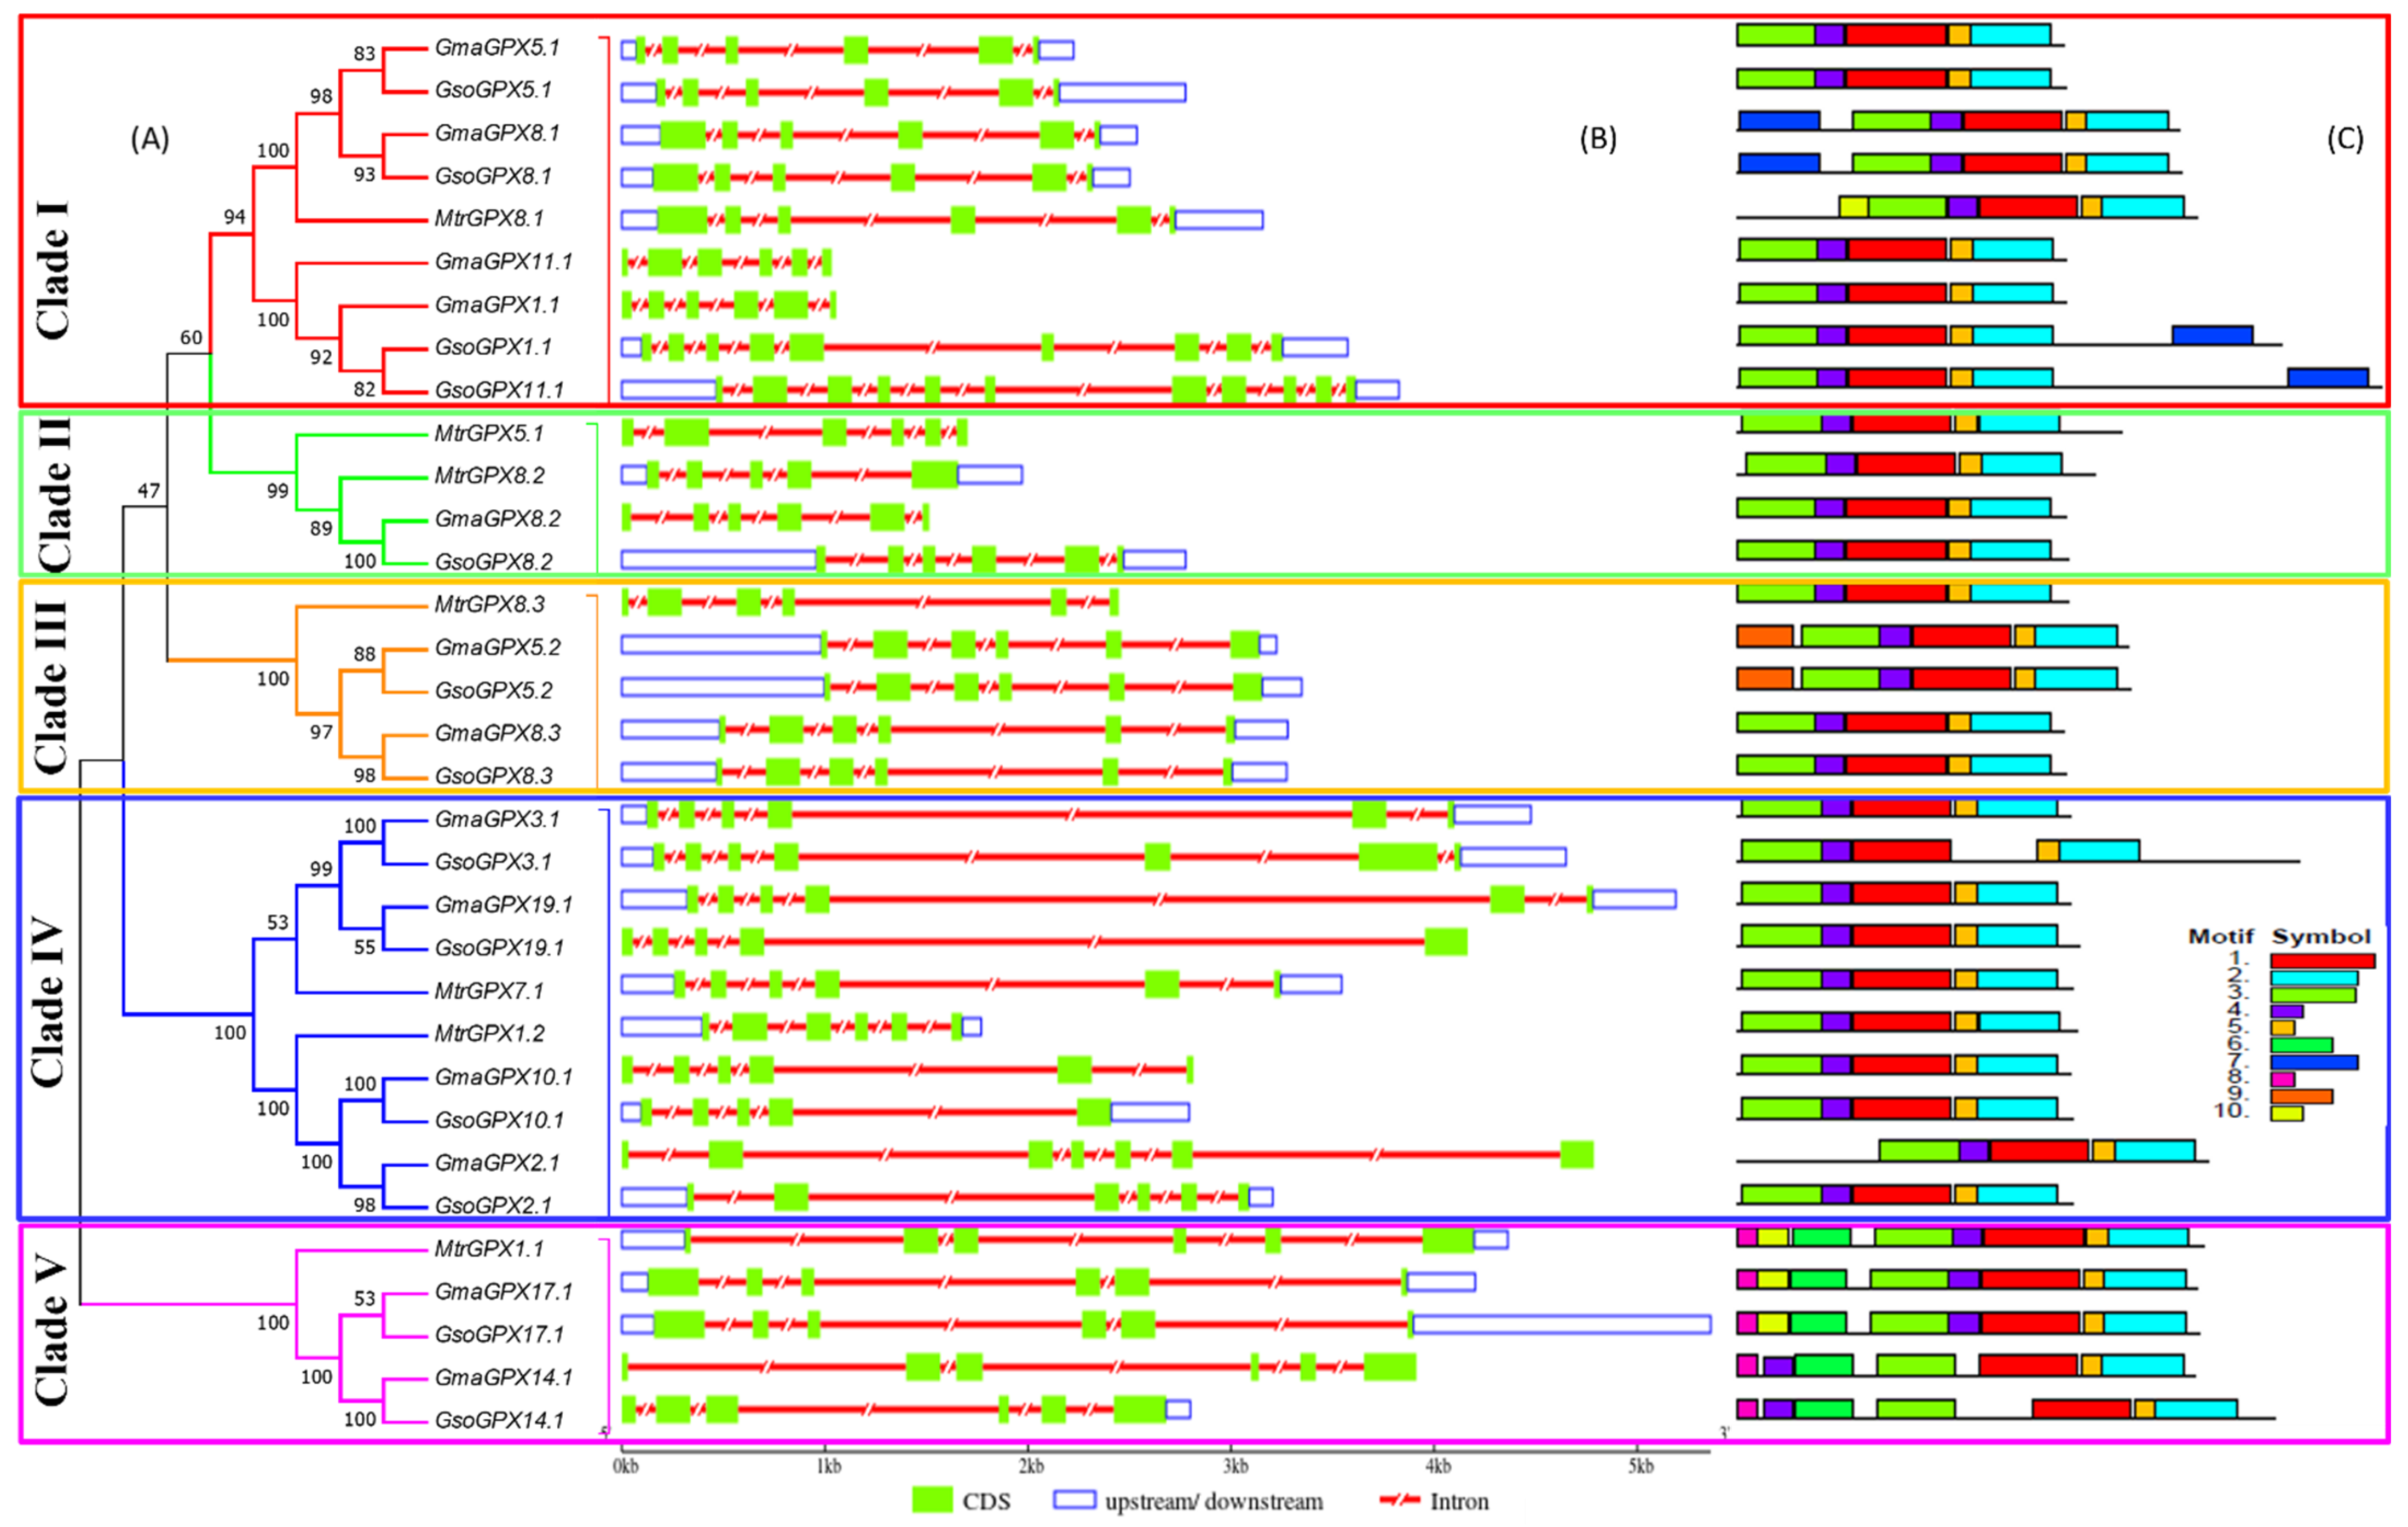
3.3. Exon–Intron Structures Analysis of SOD and GPX Genes in G. max, G. soja and Medicago truncatula

Gene structure diversity may guide understanding of the long-term evolution mechanism of multigene families. To obtain insight into structural features of SOD and GPX genes, a comparative analysis of exon–intron structure was executed for both soybean species along with Medicago truncatula as a model legume (Figure 3B and Figure 4B). Moreover, an unrooted phylogenetic tree of SOD and GPX genes was also constructed to view whether the exon/intron distribution pattern is consistent with the phylogenetic tree (Figure 3A and Figure 4A).
The SOD and GPX genes exhibited different exon–intron structures that were not in accordance with the phylogenetic clustering of these genes. The number of introns varied from five to seven in Cu/Zn SODs, five in Mn-SODs, and five to eight in Fe-SODs (Figure 3B). Species-wise, the number of introns varied from five to eight in all three species viz., G. max, G. soja, and Medicago truncatula for SOD genes, while it ranged from five to six in G. max, four to ten in G. soja and four to five in Medicago truncatula for GPX genes. For some of the genes, gene structure was conserved in wild and cultivated soybean, i.e., GmaSOD2.1/GsoSOD2.1, GmaGPX5.1/GsoGPX5.1, while some orthologue gene pairs showed different exon–intron structures such as GmaSOD16.1/GsoSOD16.1 and GmaGPX14.1/GsoGPX14.1. However, more variation was seen in the exon–intron structure of soybean and Medicago truncatula SOD and GPX genes (Figure 3B and Figure 4B).

3.4. Conserved Motifs of SOD and GPX Genes in G. max, G. soja and Medicago truncatula

The presence of conserved motifs in G. max, G. soja, and Medicago truncatula was also explored in all the SOD and GPX proteins (Figure 3C and Figure 4C). In SODs, the conservation of motifs was more similar in each clade. Motifs 2, 3, 4, 6, and 10 were found in all FeSOD proteins except GsoSOD10.1, which did not possess motif 3. Mn-SOD proteins showed 2, 3, 6, and 9 as conserved motifs, while in all Cu/ZnSODs proteins, motif 1 remained conserved (Figure 3C). A total of ten conserved motifs were identified in GPX genes of both Glycine max, Glycine soja, and Medicago truncatula (Figure 4C). All of the GPX genes from G. soja, G. max, and Medicago truncatula carried 1–5 conserved motifs, which carried the GPX signature. Besides this, GmaGPX8.1, GsoGPX8.1, GsoGPX1.1, and GsoGPX11.1 carried an additional motif 7 (Figure 4C). In group five, the GPX genes (MtrGPX1.1, GmaGPX17.1, GsoGPX17.1, GmaGPX14.1, and GsoGPX14.1) clustered together from G. max, G. soja, and Medicago truncatula, and they carried an additional motif 8. It is noteworthy that motif 9 was present in G. max and G. soja (GmaGPX5.2 and GsoGPX5.2) and absent in Medicago truncatula. Overall the SOD and GPX motif structure was more conserved in G. max, G.soja, than Medicago truncatula, and some closely related genes shared a similar pattern of motif distribution.

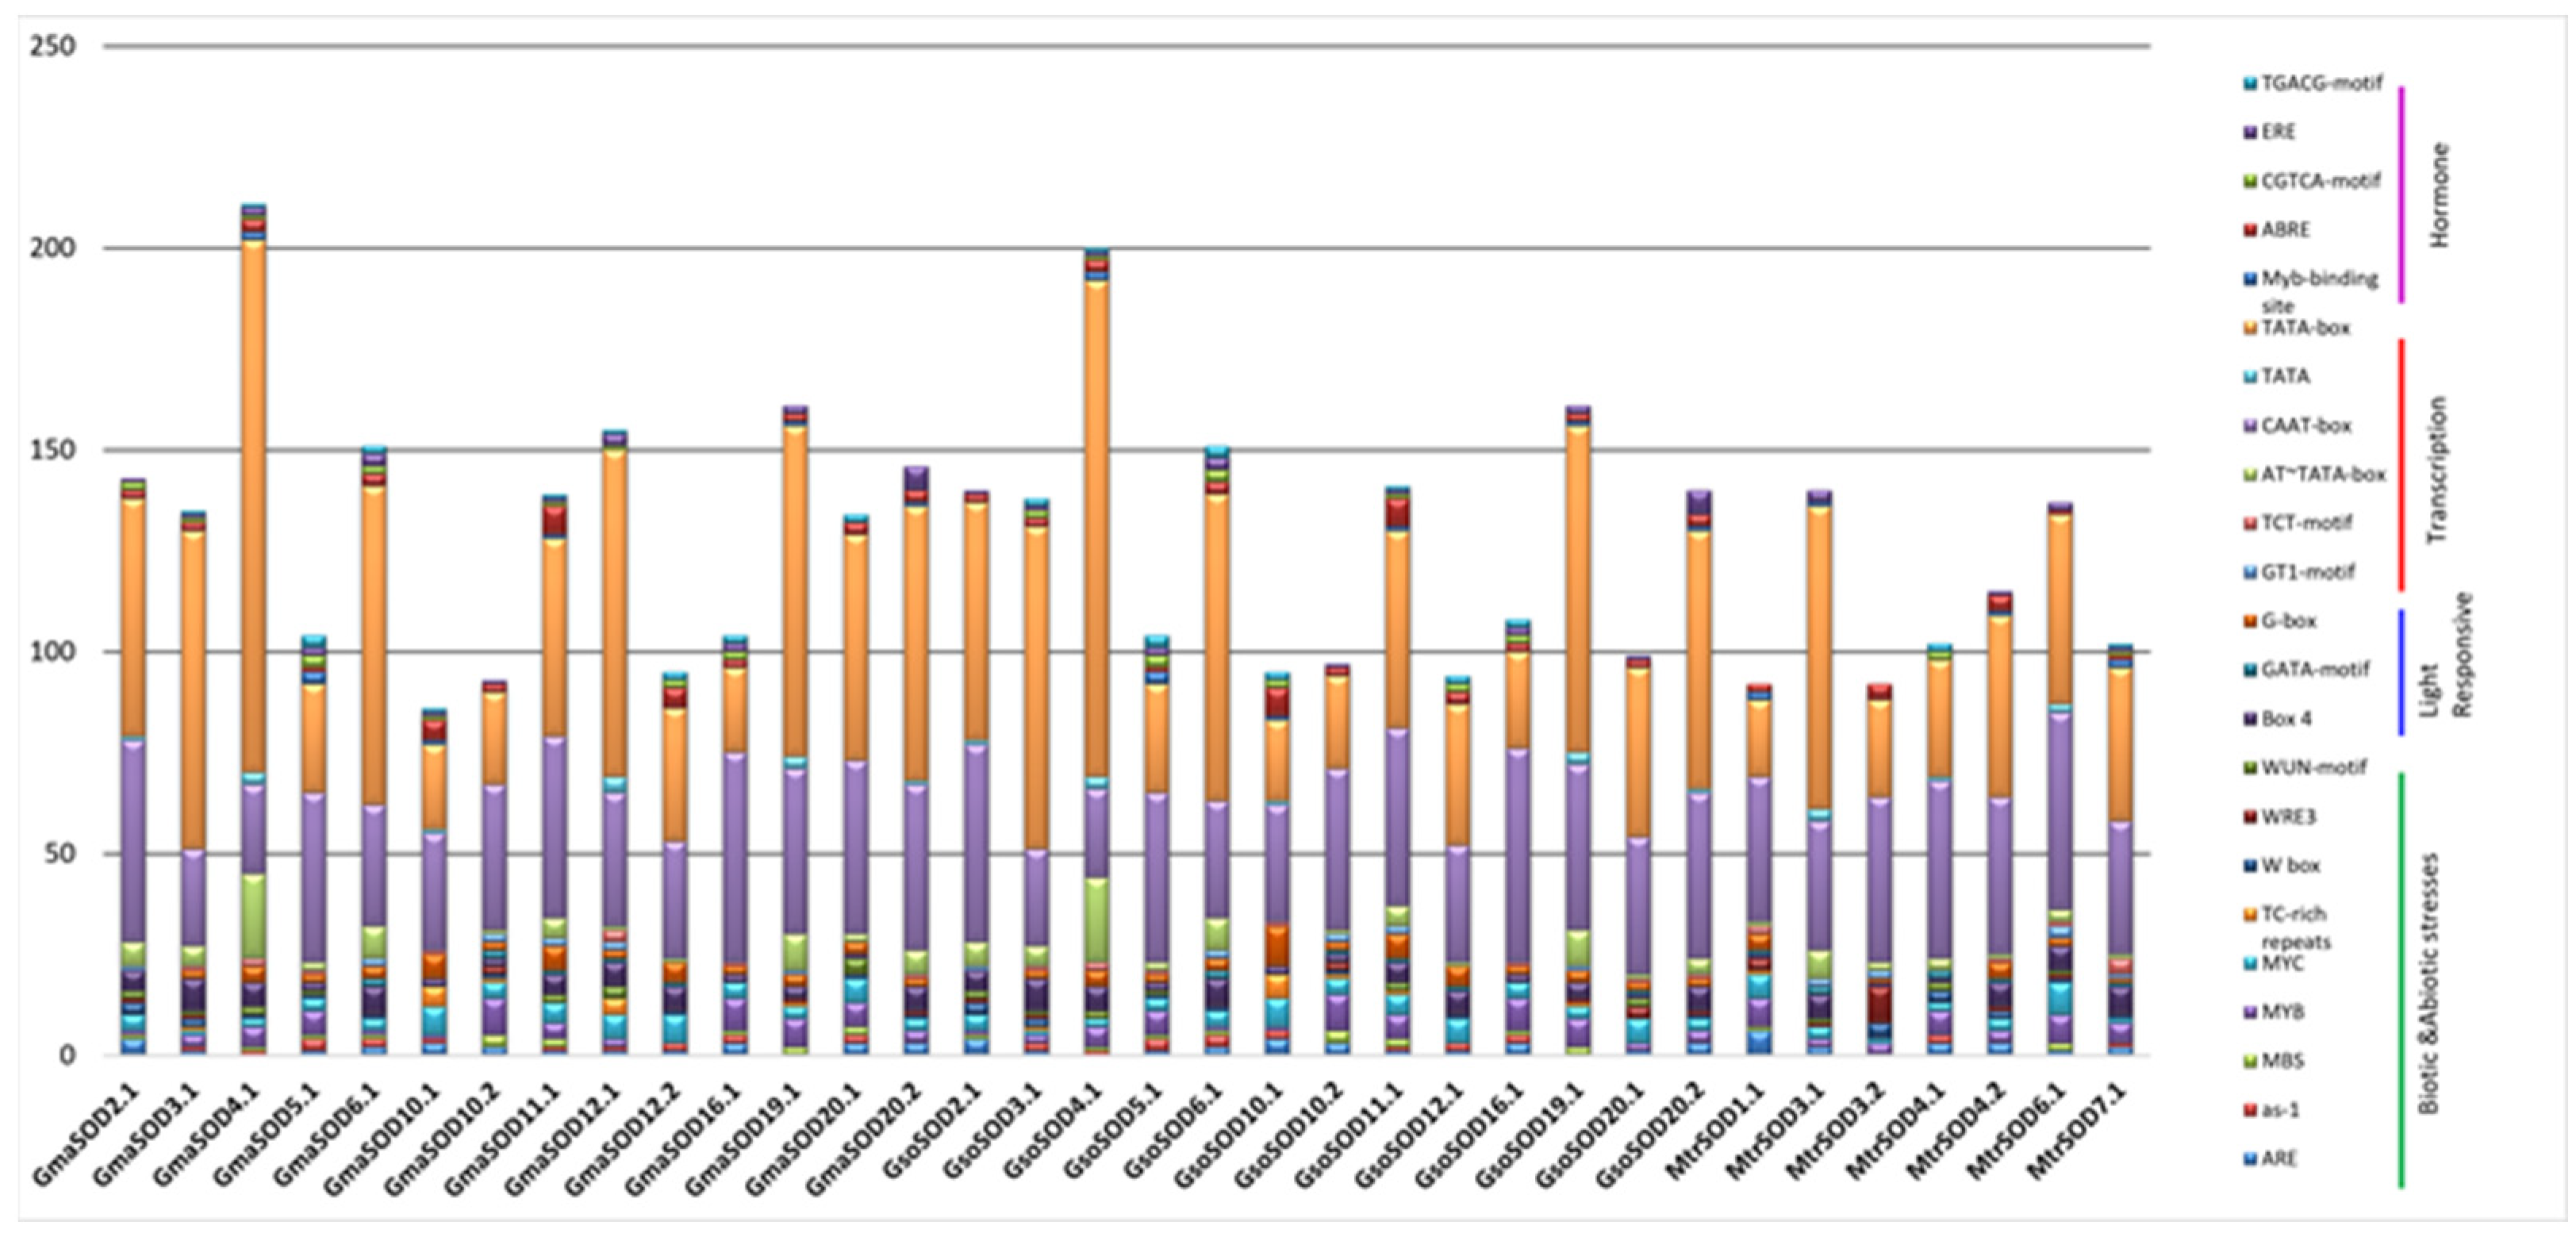
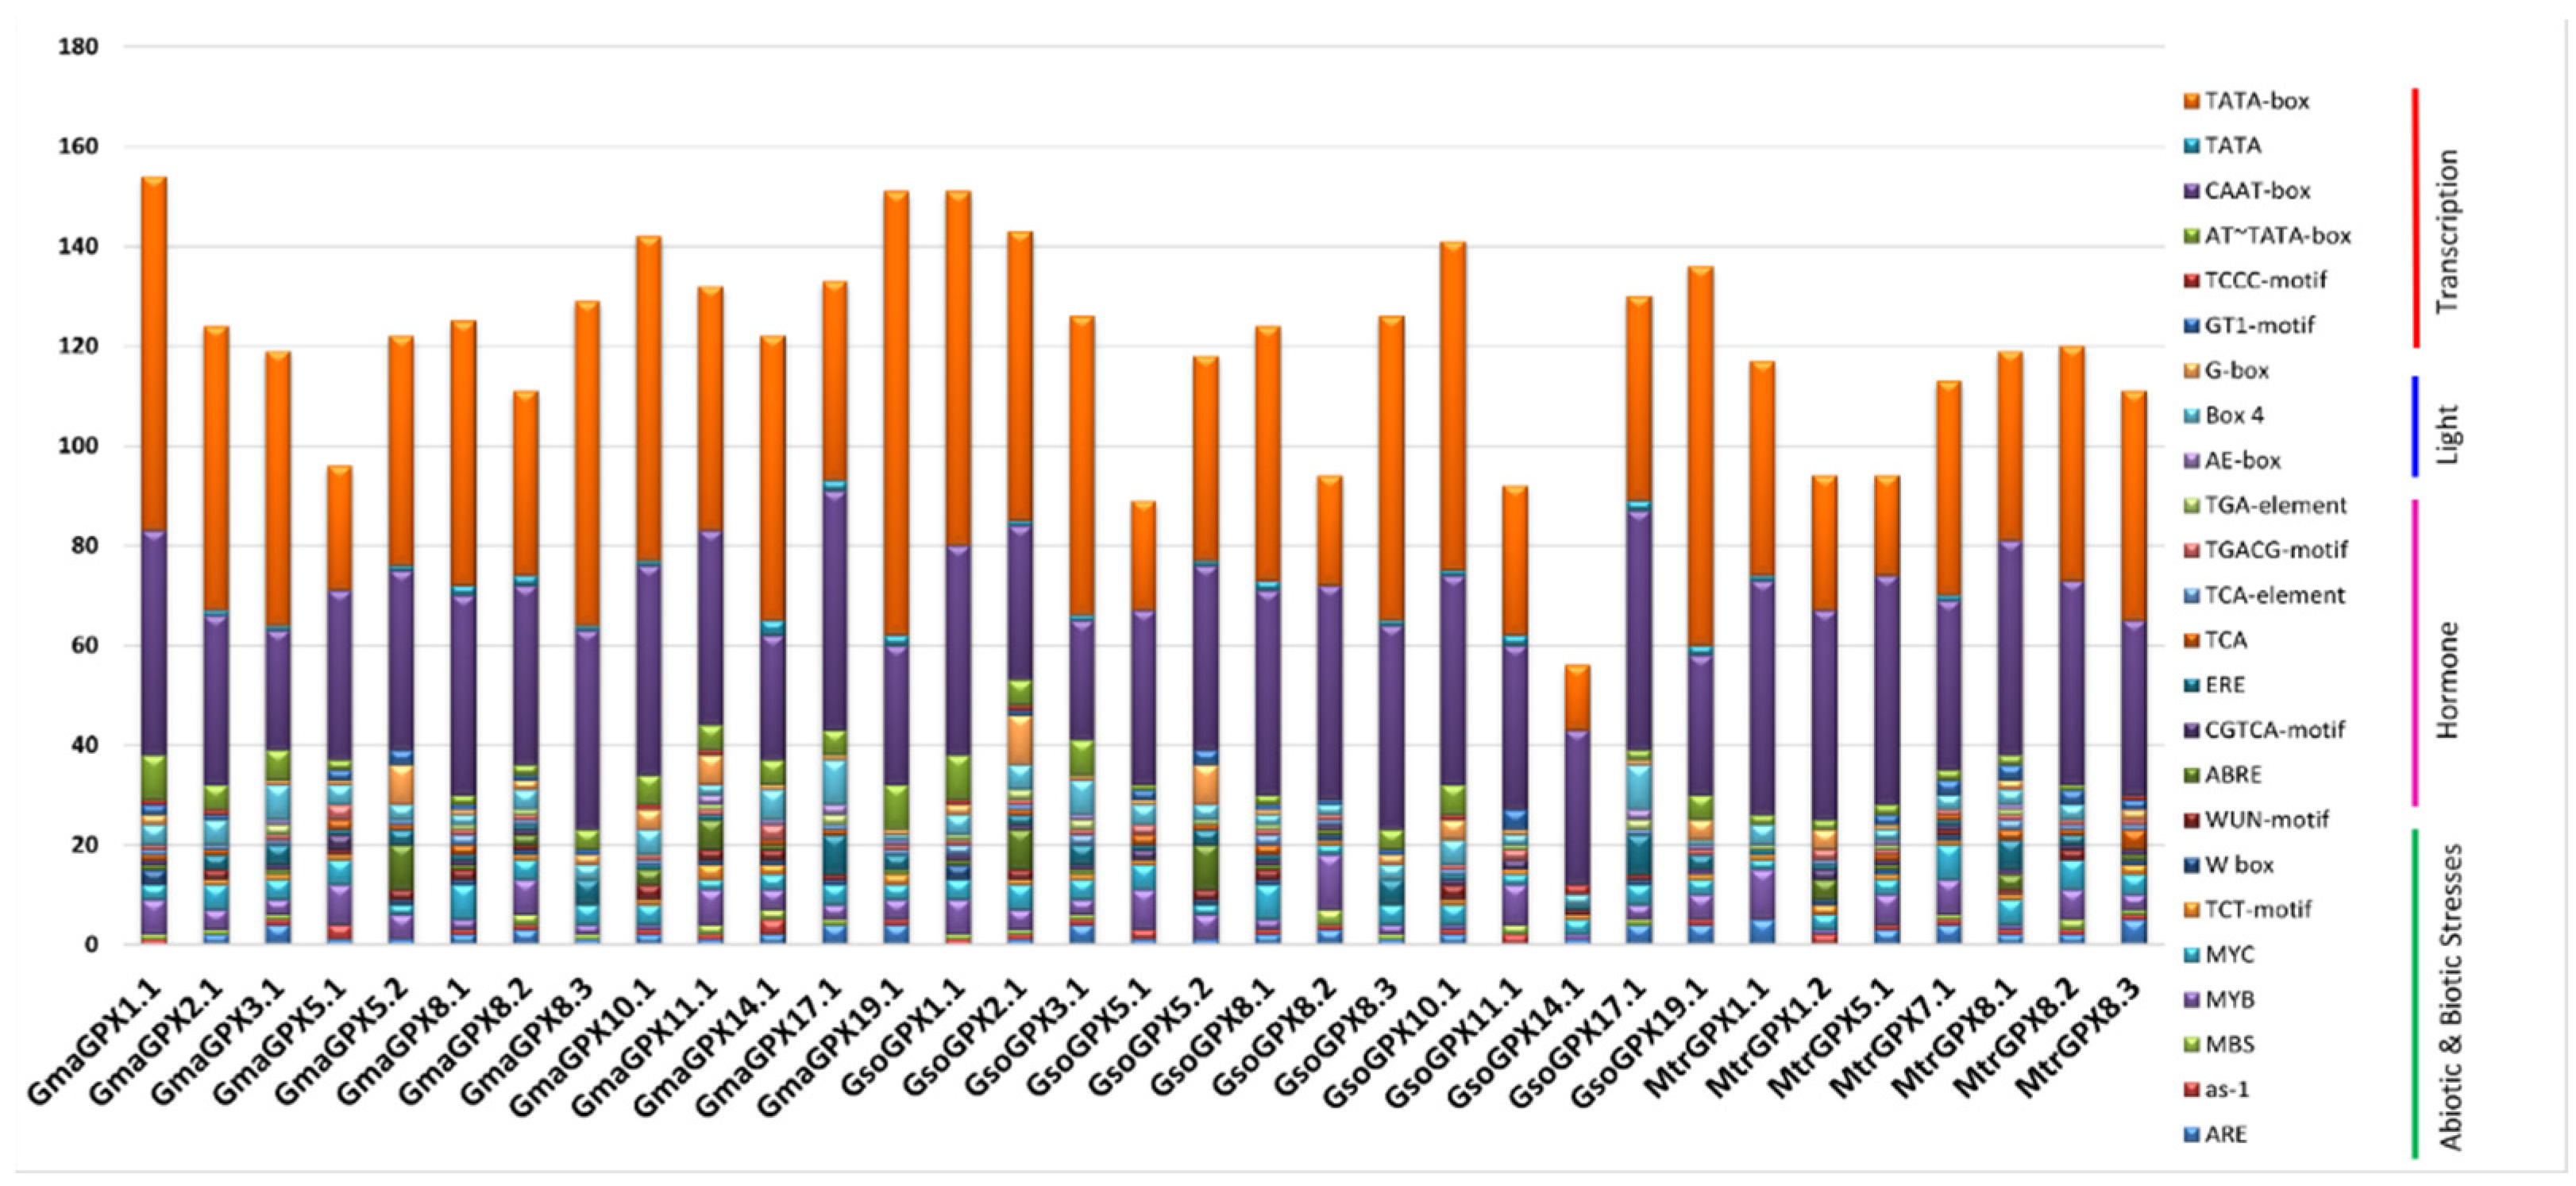
3.5. Promoter Analysis

The SOD and GPX genes play a vital role in response to environmental stresses. We analyzed the promoter of G. max, G. soja and Medicago truncatula SODs and GPXs by using 2000 bp upstream sequences to explore their putative cis-acting regulatory elements which play a key role in stress and hormone signaling. The results depicted that 77 types of putative cis-elements were present in the promoter region of all SOD genes of targeted species and seven were unknown elements (Supplementary Table S3).
The cis-acting regulatory elements involved in abiotic stress such as drought-responsive elements (as-1, DRE, MYC and MYB recognition sites), water-responsive element (MYB), and low temperature-responsive element (LTR) were found in the promoter region of SOD genes of soybean. Similarly to SODs, the abiotic stress-related cis-elements such as drought (MBS, as-1, and MYC), water (MYB), anoxia (ARE), and defense (TCT-motif), were identified in the promoter of G. max, G. soja and Medicago truncatula. Within the hormones regulating category, elements related to abscisic acid responsiveness (ABRE, ABRE2, ABRE3a, ABRE4 and CARE), gibberellin-responsive element (GARE-motif, P-box, and TATC-box), in salicylic acid responsiveness (TCA), auxin responsiveness (AuxRR-core, TCA, TGA, and TGA), methyl jasmonate (CGTCA-motif, TGACG-motif), circadian control (circadian) and ethylene-responsive element (ERE) were the most abundant in the promoter region of SOD genes, while in GPX the methyl jasmonate (TGACG-motif and CGTCA-motif), abscisic acid (ABRE), ethylene-responsive elements (ERE), salicylic acid responsiveness (TCA and TCA element), and auxin-responsive elements (TGA-element) were most common in both Soybean species (Supplementary Table S3). Furthermore, GPX from G. max, G. soja and Medicago truncatula harbored at least one type of hormone-regulating cis-element showing that GPXs are associated with the hormonal response. All 34 SODs in G. max, G. soja, and Medicago truncatula have conserved drought-responsive (MYC) and light-responsive cis-elements (Box-4), while G. soja also carried light responsive (G-box) and abscisic acid-responsive (ABRE) cis-elements in all SOD genes (Supplementary Table S3).
The putative 23 cis-elements (with a number greater than 15) identified in SOD and GPX genes promoter are presented in Figure 5 and Figure 6.

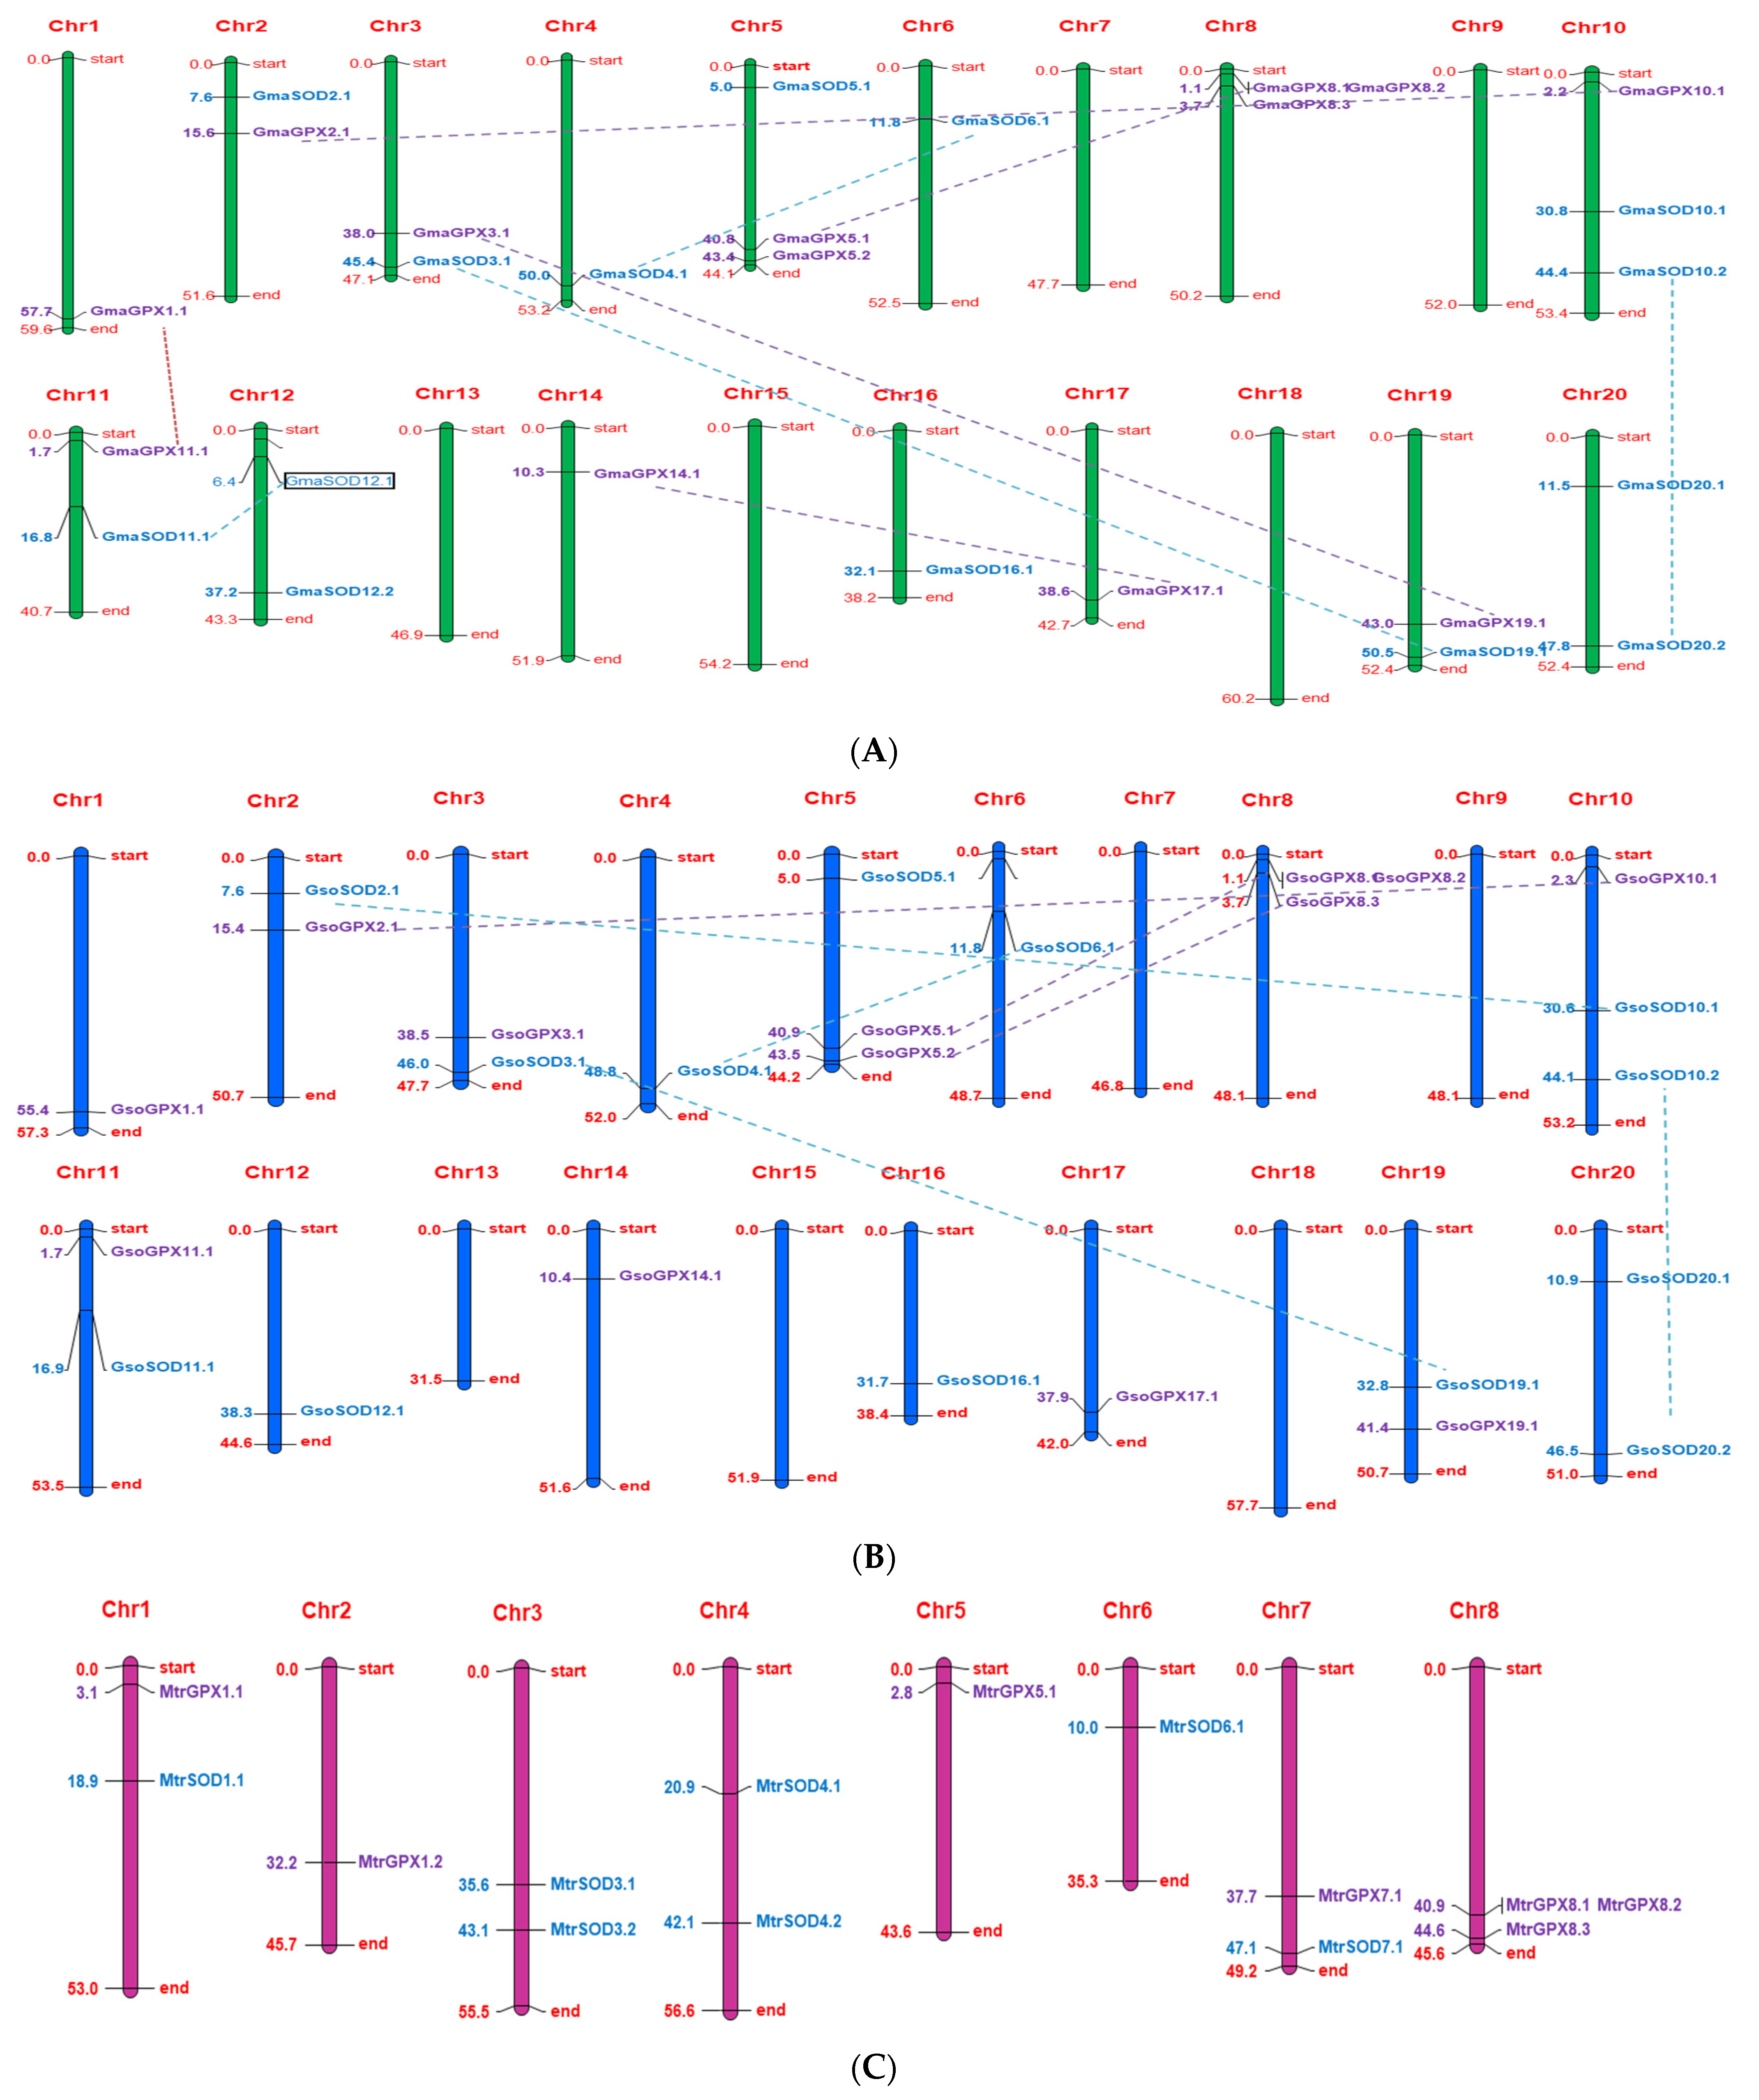
3.6. Chromosome Localization

In G. max, out of total 20 pairs of chromosomes, the SOD genes were present only on 11 chromosomes. However, the eight chromosomes viz., 2, 3, 4, 5, 6, 11, 16 and 19 each carried one SOD gene, while chromosomes viz., 10, 12 and 20 possessed two SOD genes, and the rest of the chromosomes do not possess any SOD genes (Figure 7). In G. soja, the 13 SOD genes were mapped on 10 chromosomes (2, 3, 4, 6, 10, 11, 12, 16, 19, and 20), and among them chromosome 10 and 20 each contained two SOD genes similar to G. max, except chromosome 12. The occurrence of two genes on chromosome 12 in G. max compared to wild species may be due to gene duplication in G. max during domestication, as GmaSOD12.1 and GmaSOD12.2 shared a 100% similar sequence (Supplementary Table S4).
All the GPX genes were found to be unevenly distributed across different chromosomes of G. max, G. soja, and M. truncatula. Interestingly, G. max and G. soja not only shared an equal number of GPX genes (13 in number) but also depicted a similar distribution pattern of these genes in the genome (Figure 7). In both species, out of 20 chromosomes, all GPXs were organized across 10 different chromosomes. In G. max and G. soja, chromosome 1, 2, 3, 10, 11, 14, 17, and 19 carried one GPX gene, chromosome 5 possessed two, while chromosome 8 carried the maximum number of GPX genes (three). However, the rest of the chromosomes did not carry any GPX gene in both these species. In M. truncatula, seven GPX genes were arranged on five different chromosomes (1, 2, 5, 7, and 8), each carried one gene except chromosome 8 on which a cluster of three genes was found (Figure 7).

3.7. Gene Duplication

Due to genome duplication, tetrad, triplet, or paired homologous regions are accumulated in Glycine, and gene duplication events led to higher sequence similarity. Segmental duplication has been identified as a major driving force in the expansion of SOD and GPX genes in soybean. Three segmental duplications were identified in G. max: GmaSOD12.1/GmaSOD11.1, GmaSOD4.1/GmaSOD6.1 and GmaSOD20.2/GmaSOD10.2, while four were found in G. soja: GsoSOD3.1/GsoSOD19.1, GsoSOD4.1/GsoSOD6.1, GsoSOD10.2/GsoSOD20.2 and GsoSOD10.1/GsoSOD2.1 in the SOD gene family, while a total of five segmental duplication events in G. max, and three in G. soja were observed in GPX genes (Table 2). Duplicate gene pairs are presented by dotted lines in Figure 7. No duplicated gene pairs were observed in M. truncatula.
Furthermore, through comparative study of G. max and G. soja, the 11 orthologue gene pairs have been identified in SOD genes, and five in GPX genes, that are 100% similar to each other in both species (Supplementary Table S4).

3.8. Divergence Rate of SOD Genes in G. max and G. soja

After gene duplication, the ratio of the nonsynonymous substitution rate (Ka) to the synonymous substitution rate (Ks) is employed to envisage the mechanism of gene divergence. The Ka/Ks ratio investigates the selection pressure in a gene pair. Moreover, the Ka/Ks < 1 represents the purifying selection, Ka/Ks = 1 shows the neutral selection, and Ka/Ks > 1 depicts positive selection [41]. We also calculated the Ka/Ks value of duplicated paralogous gene pairs in the G. soja and G. max genome. In G. soja, the Ka/Ks ratio of four duplicated SOD gene pairs ranged from 0.5 to 0.8, and it showed these duplicated gene pairs were subjected to purifying selection, while in GPX three duplicated gene pairs (Ka/Ks ratio from 0.079 to 0.197) were evolved mainly under strong purifying selection pressure, with less functional divergence after duplication (Table 2). In G. max, two gene pairs of both SOD and GPX genes were subject to purifying selection (0.7–0.8). One gene pair (GmaGPX3.1/GmaGPX19.1) showed only neutral selection (Ka/Ks = 0.970 ≈ 1), while, in the rest of the gene pairs of SOD and GPX genes, the Ka/Ks ratio was greater than 1, which seemed to have undergone strong positive selection (Table 2). Divergence time of these duplicated gene pairs varied from 0.00 to 10.46 Mya. After duplication, positive selection is regarded as one of the main forces for the evolution of new motifs or functions.

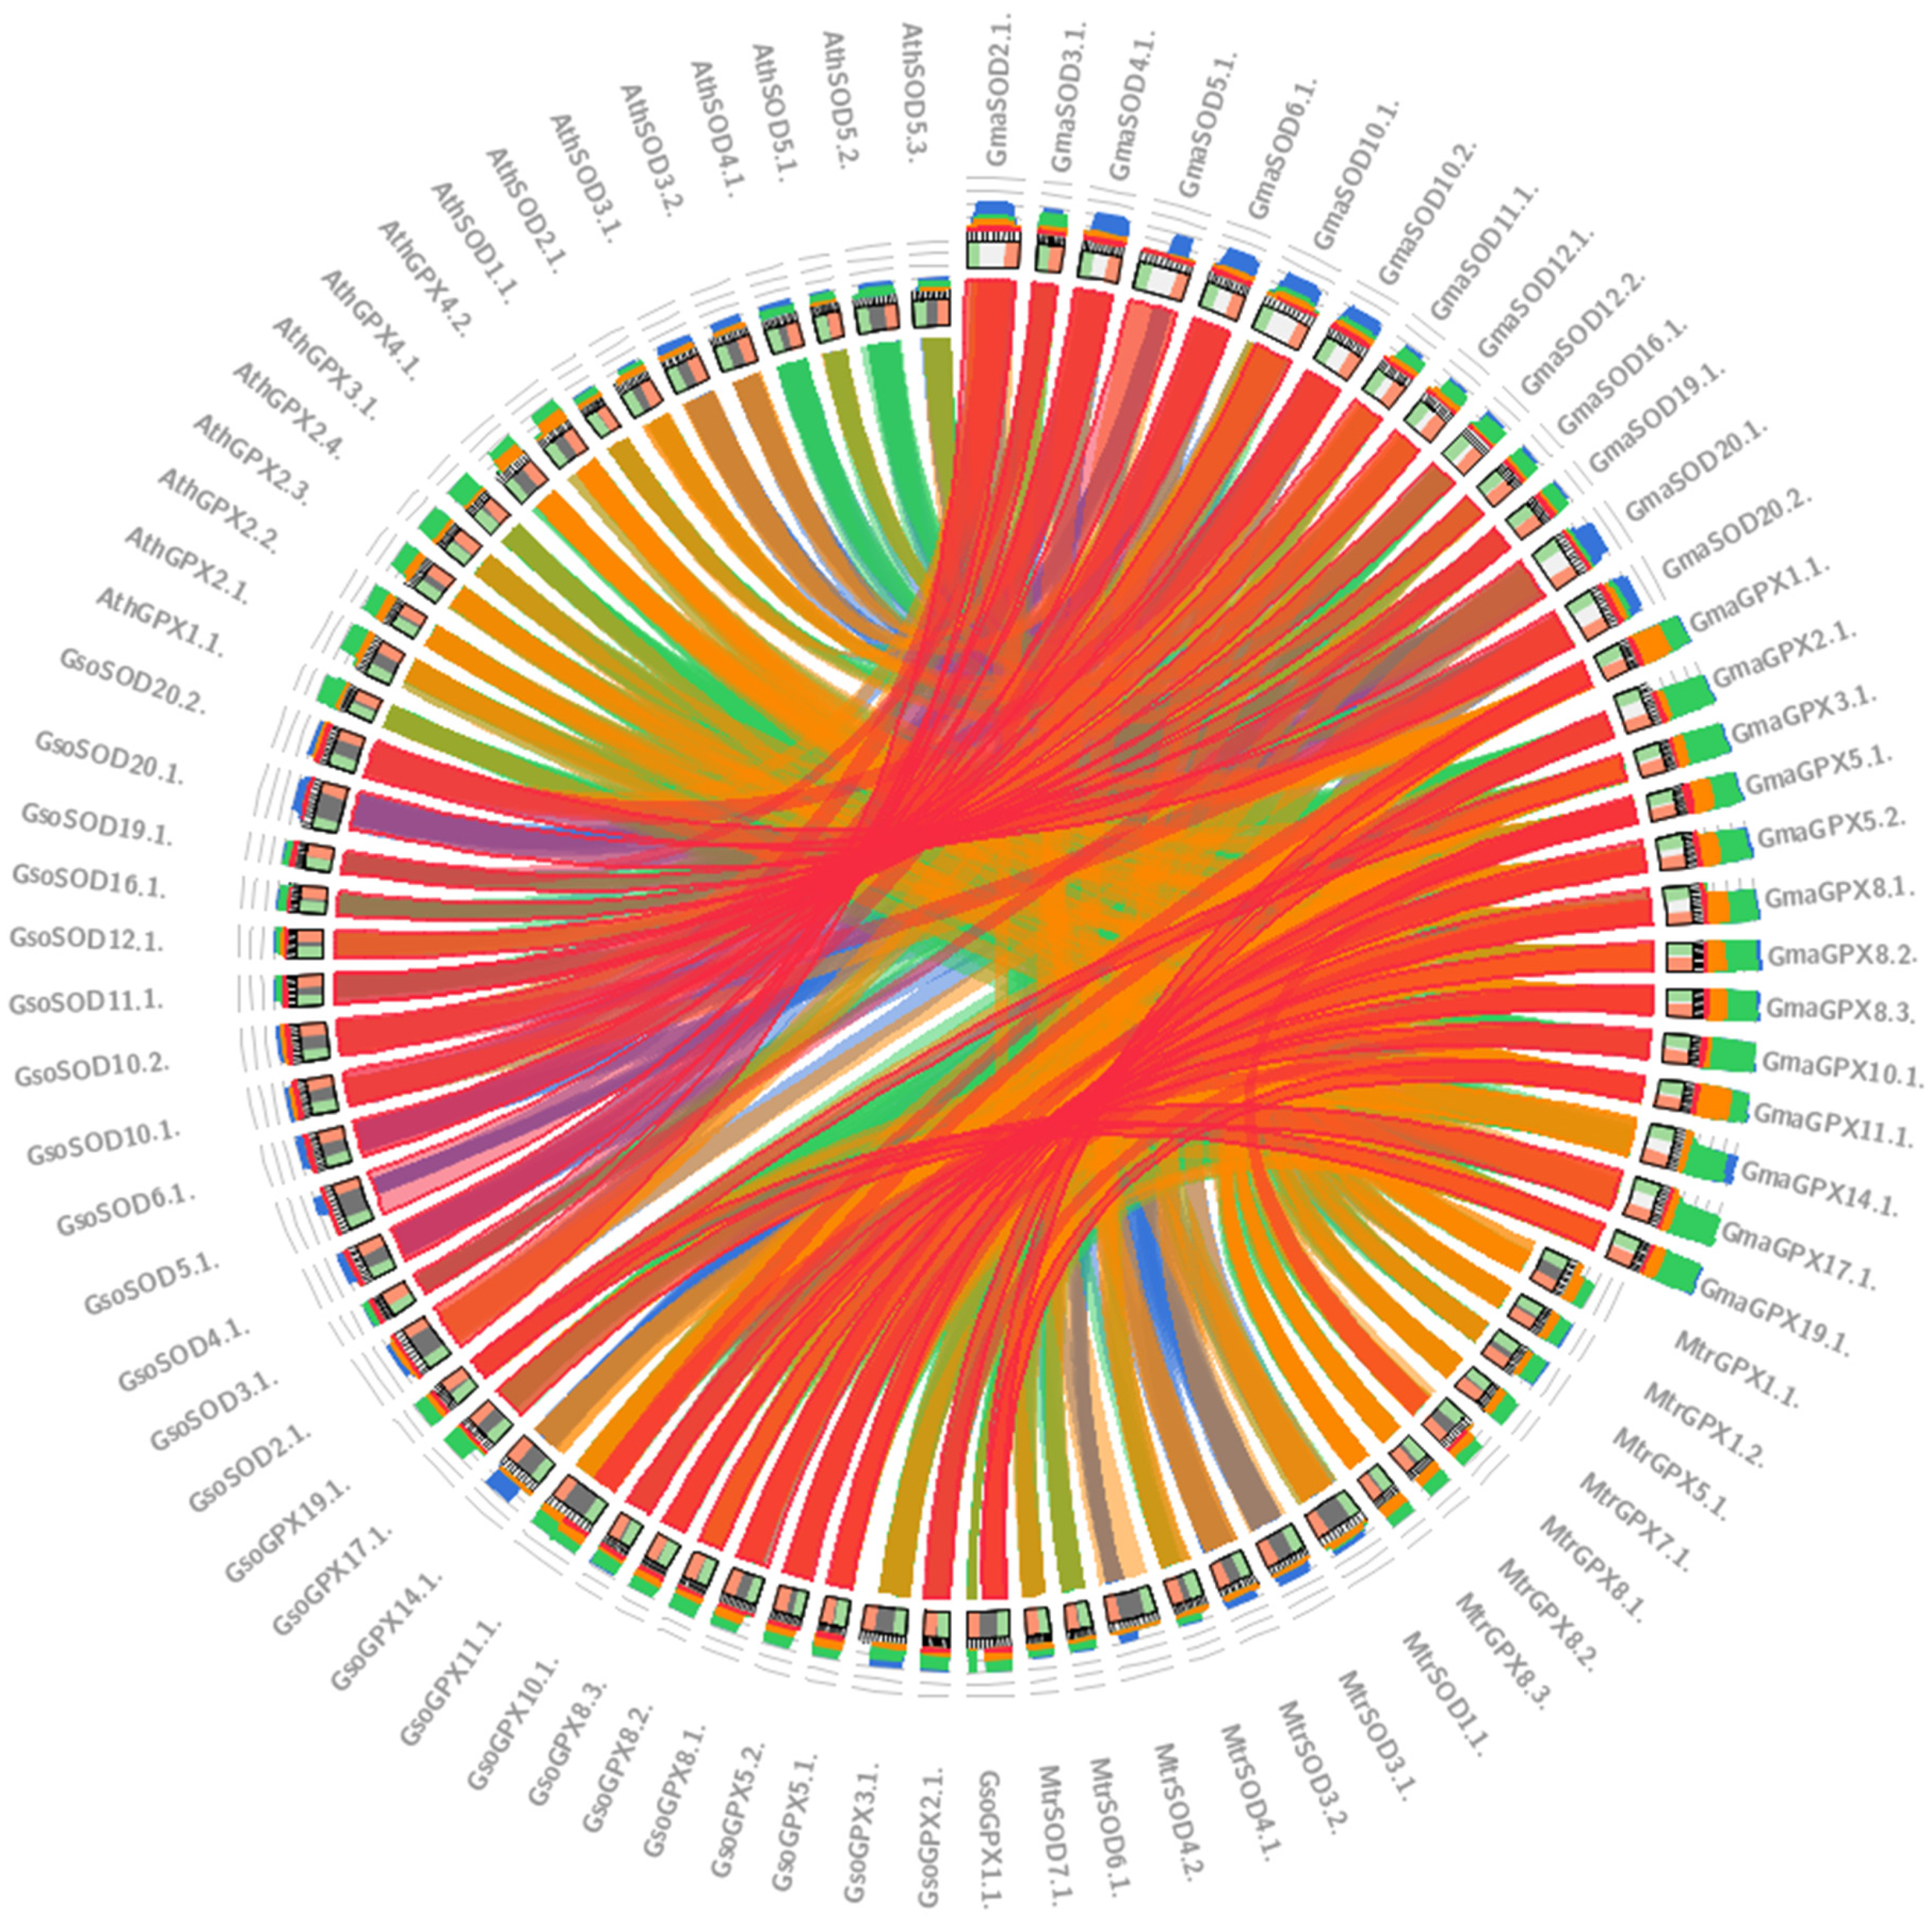
3.9. Relationships between GmaSODs with GsoSODs, MtrSODs and AthSODs

Comparative genomics assists in revealing the evolutionary relationship among the different species. Synteny was visualized among SOD and GPX genes of the four species viz., G. max, G. soja, Medicago truncatula and A. thaliana. The SODs and GPXs belonging to G. max and G. soja are mostly connected via red lines showing more than 90% identity. As G. soja is considered as the progenitor of the G. max, the same thing was supported by our results where some antioxidants gene sequences of G. max were 100% identical to G. soja genes, whereas the majority showed more than 90% similarity (Figure 8).

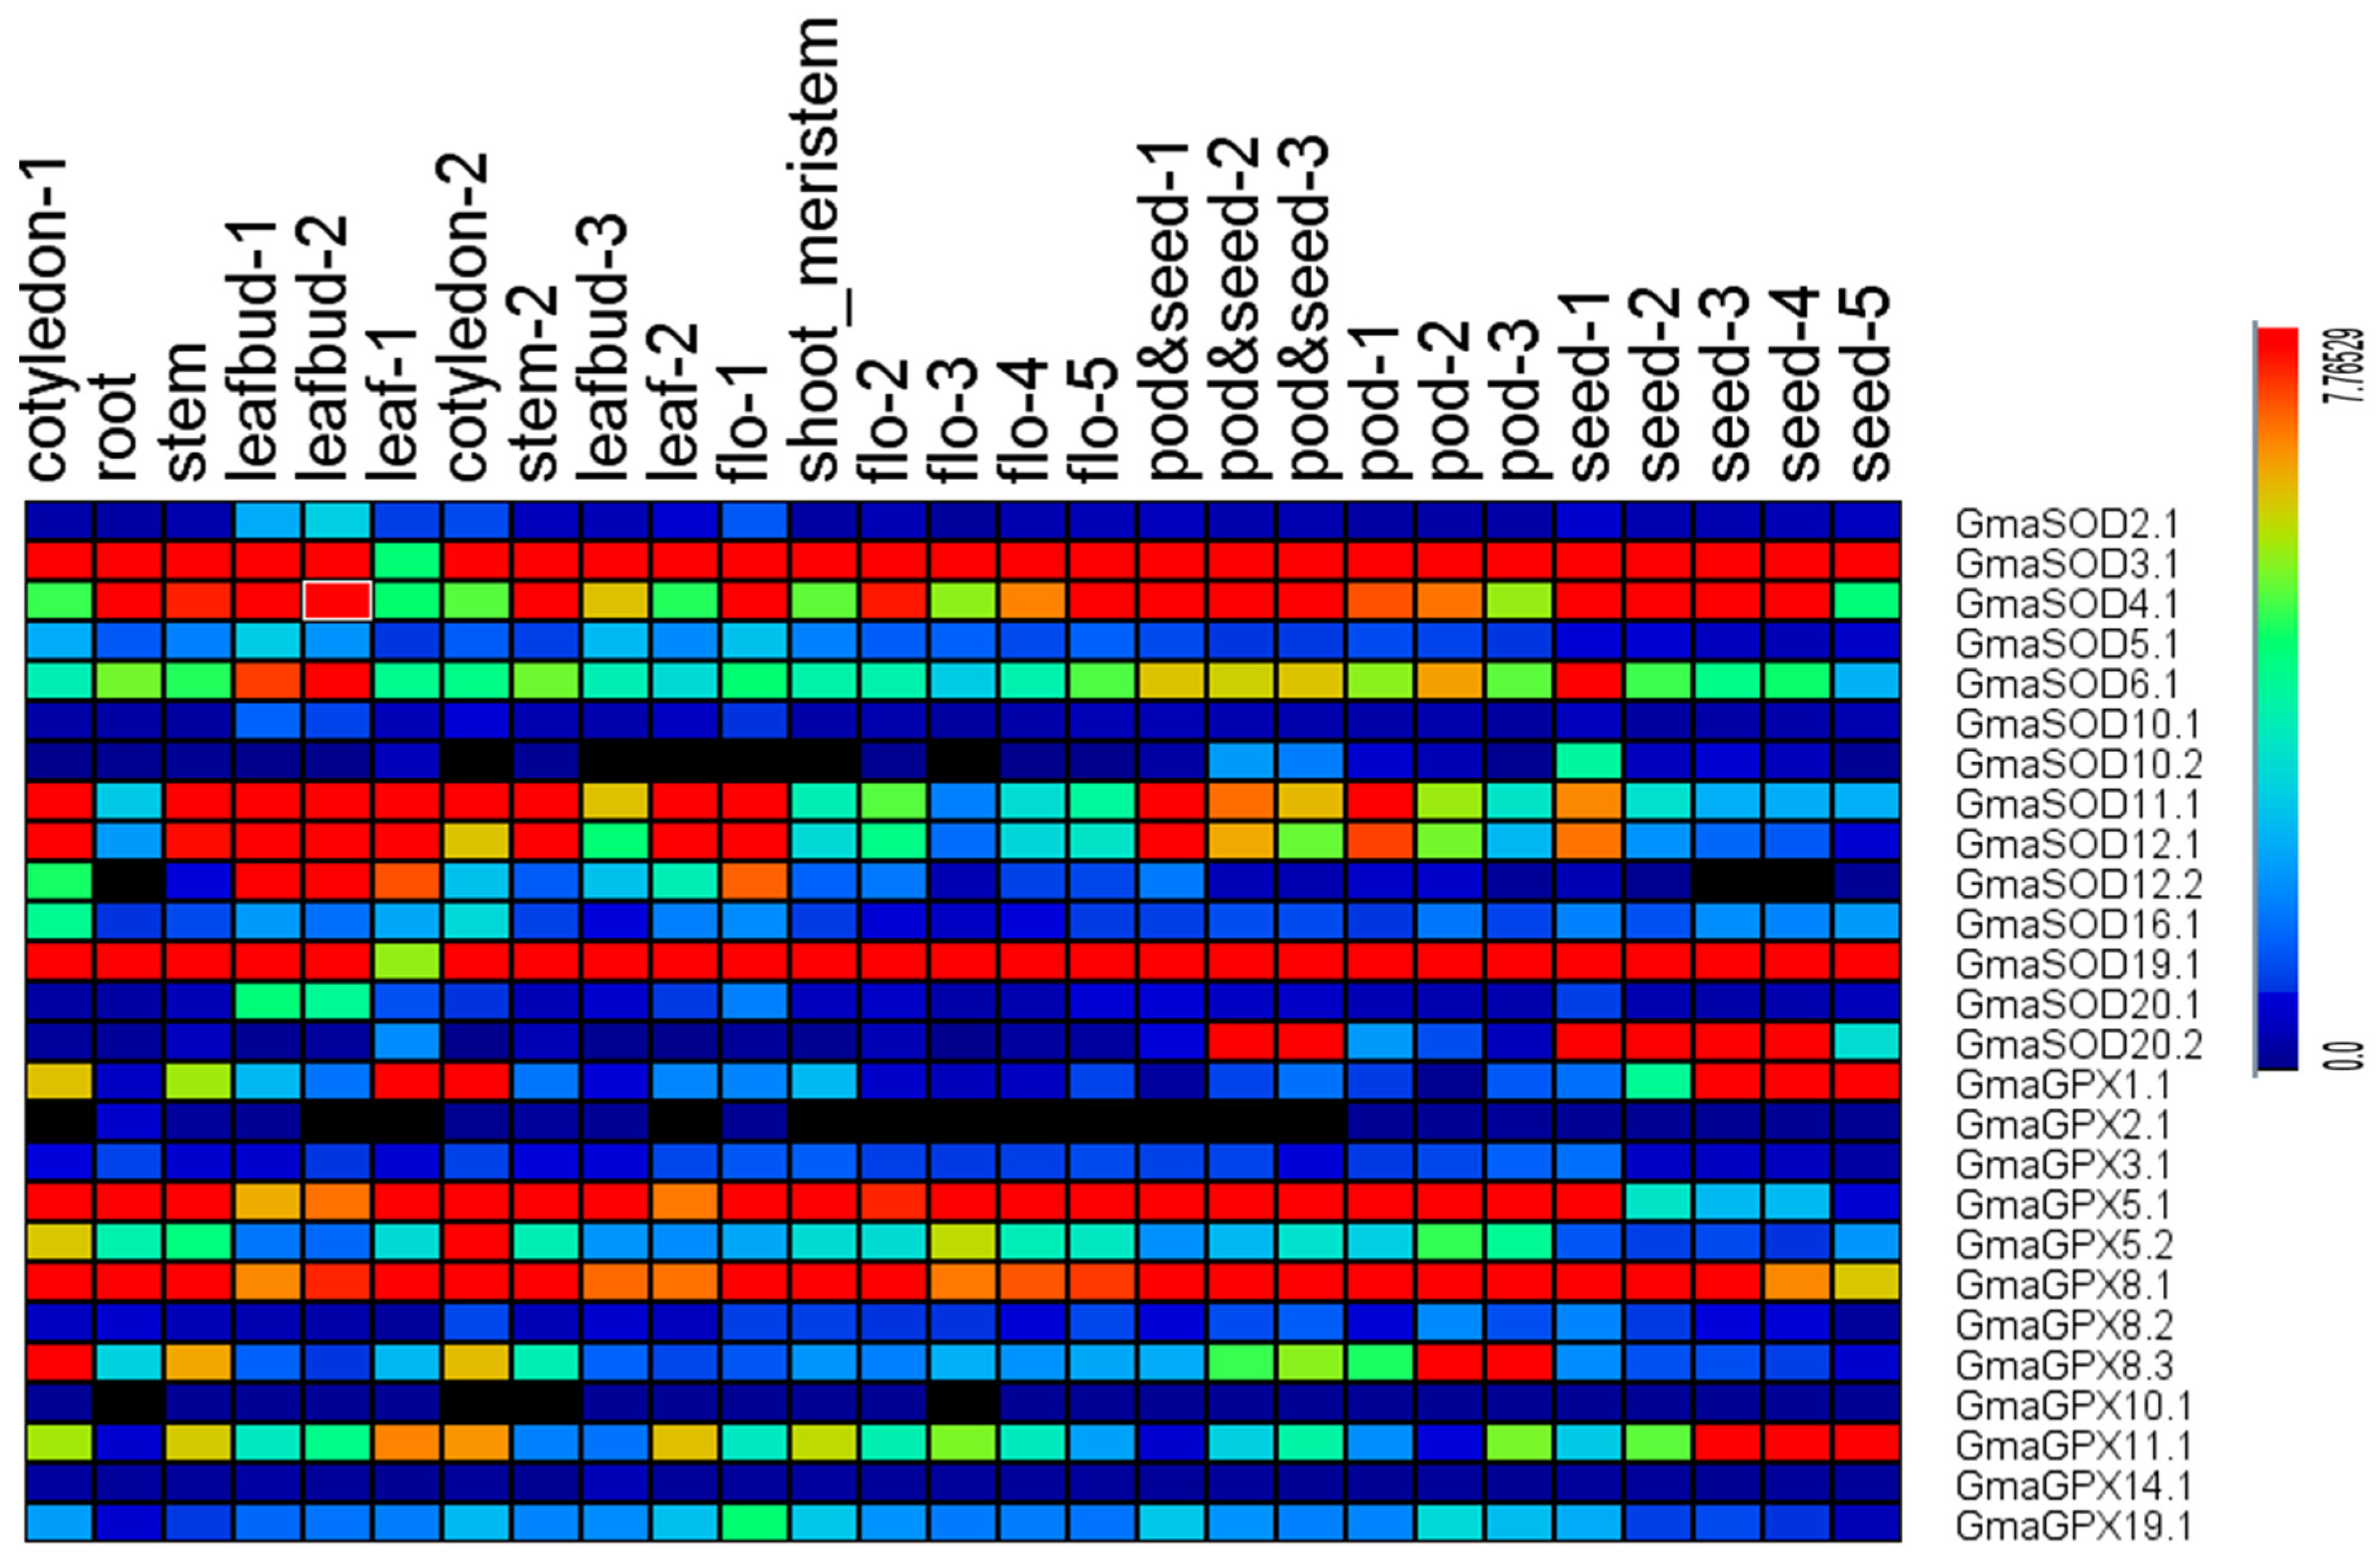
3.10. Expression Profiling of SOD and GPX Genes in Different Soybean (Glycine max L.) Tissues

The expression profiling of all SOD and GPX genes from 27 tissues were investigated in the present study using the free available RNA-seq data from SoyBase. Results of our study revealed that two genes (GmaSOD19.1 and GmaSOD3.1) displayed a striking expression levels among all tissues and organs except leaf, implicating their vital roles for soybean, whereas the genes viz., GmaSOD11.1, GmaSOD12.1 and GmaSOD12.2 expressed higher values in leaf than in other tissues, suggesting their participation in the leaf’s developing or functioning (Figure 9). Among GPX genes, the GmaGPX5.1 showed a higher expression pattern in almost all tissues and organs except seed, while GmaGPX11.1 was highly expressed in seed as compared to other tissues. Moreover, the rest of the genes showed either moderate or weak expression in all the selected tissues and organs, speculating their limited response in soybean.

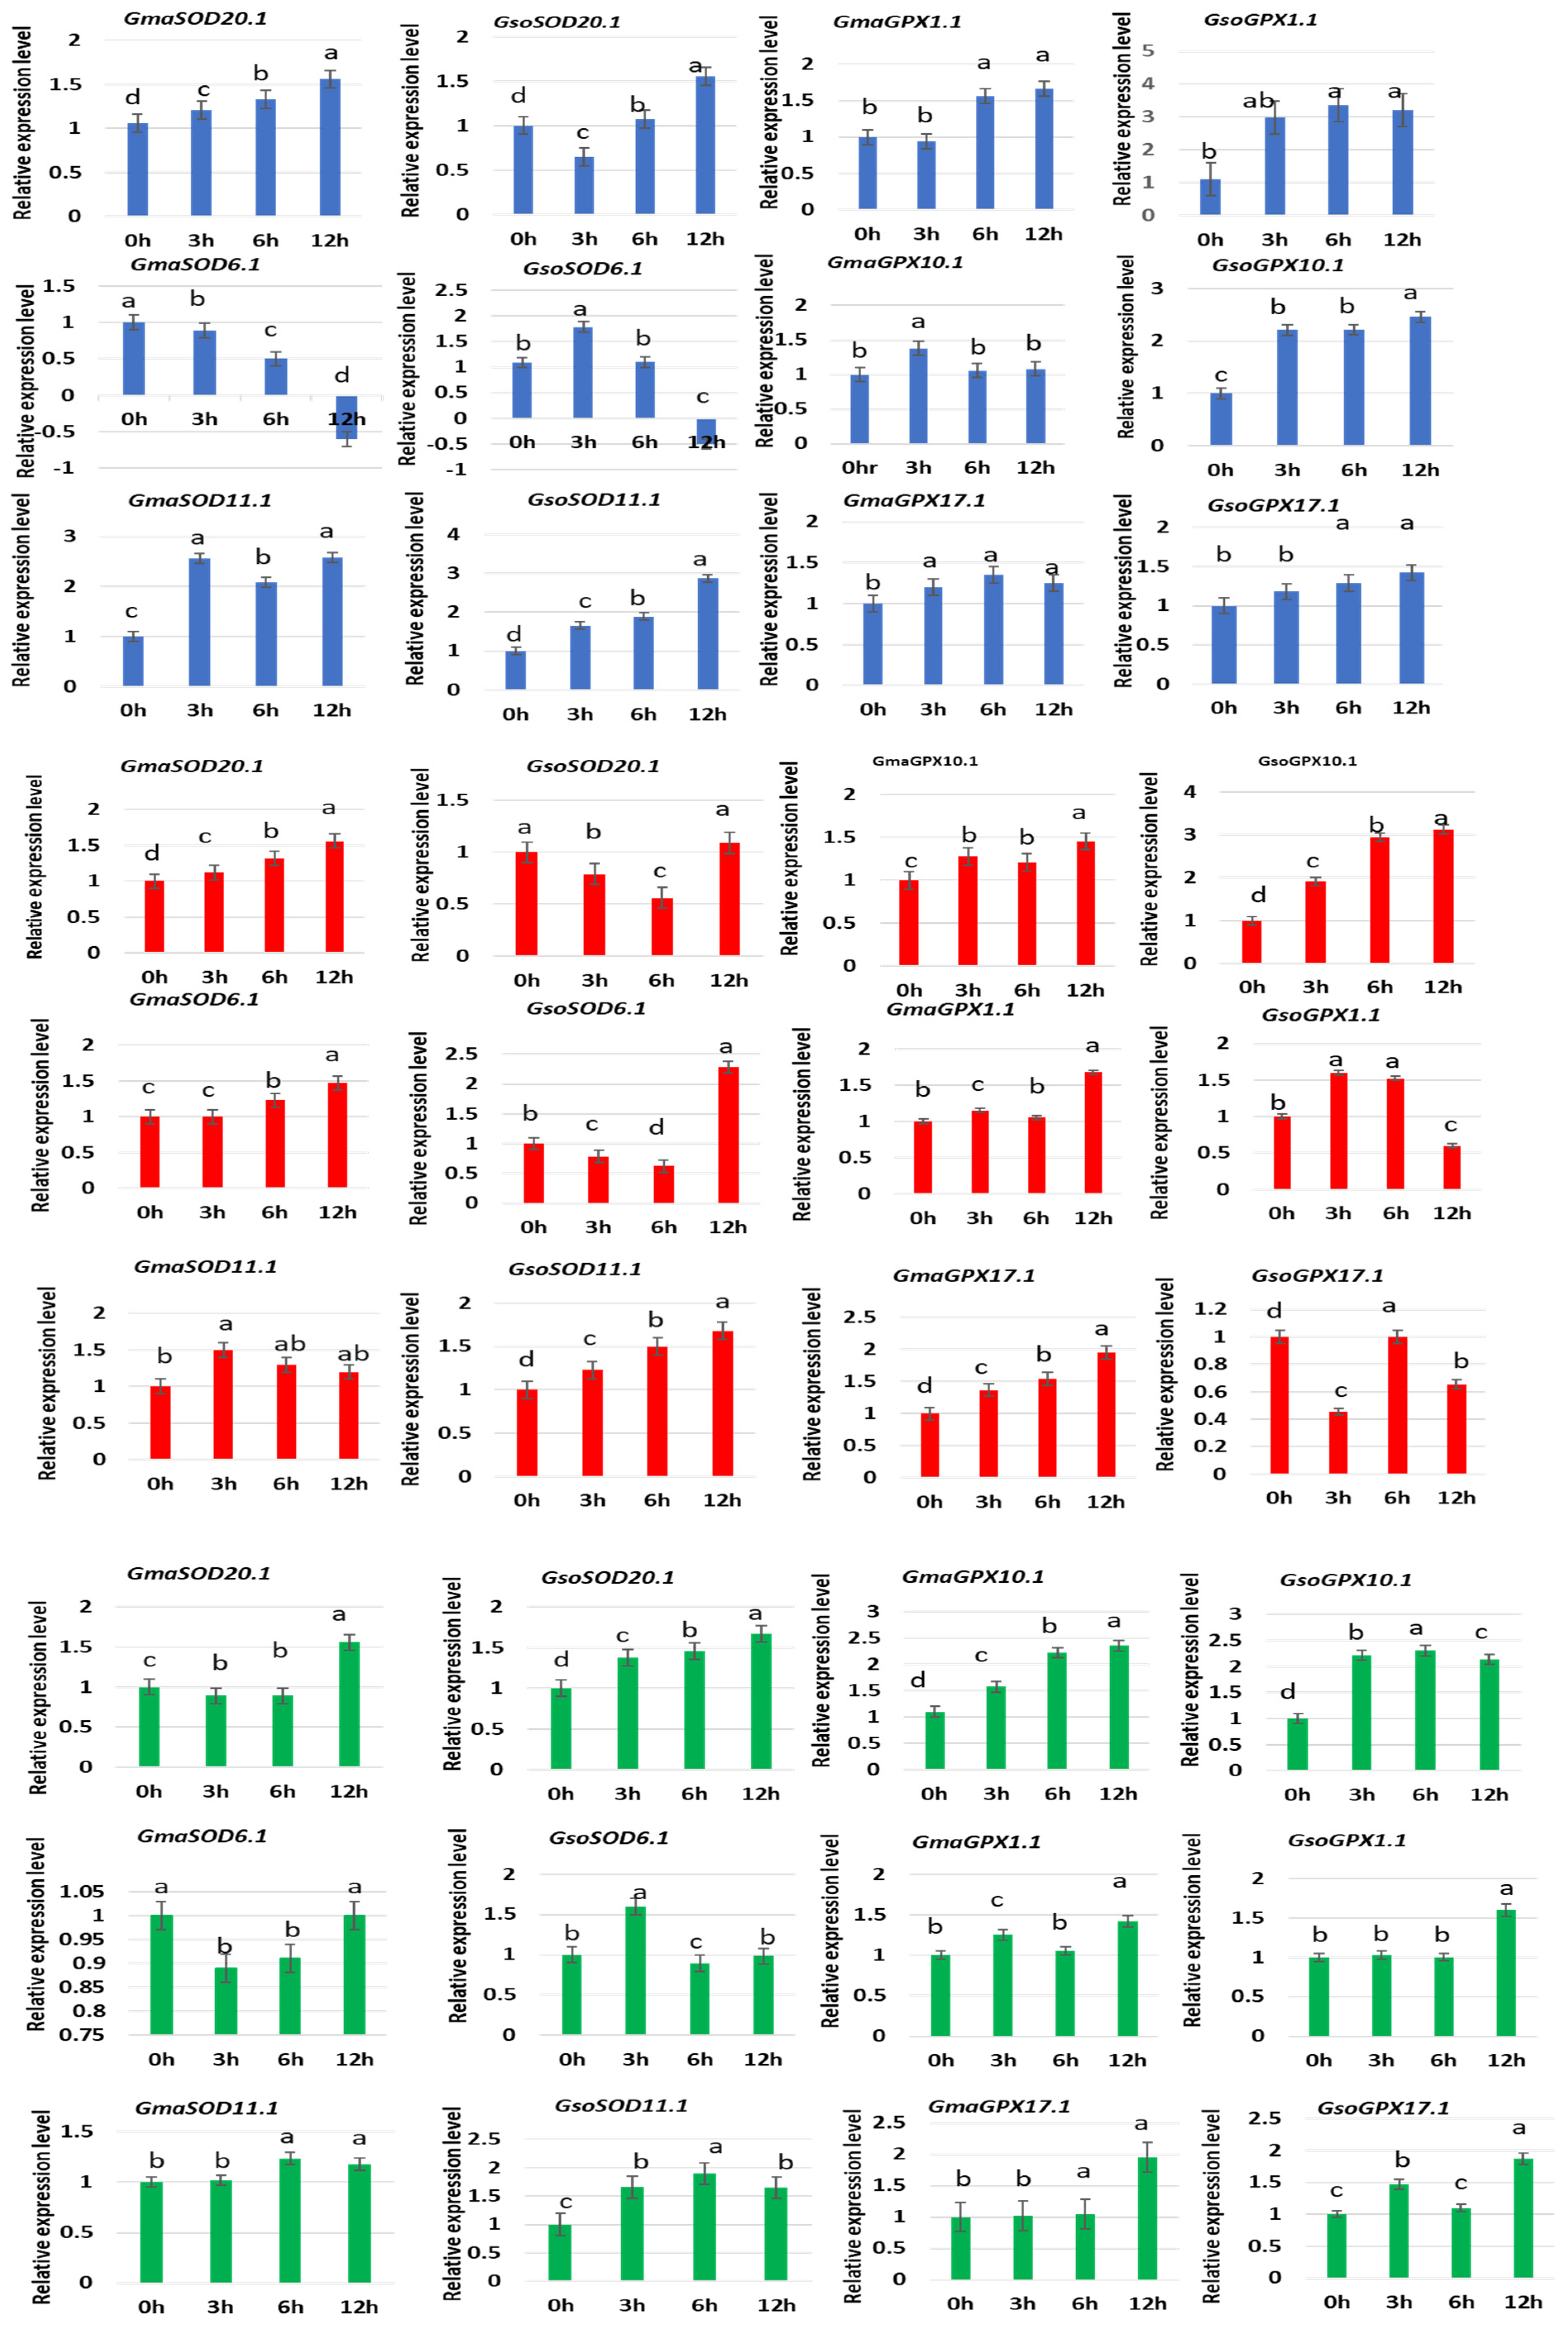
3.11. Response of GsoSOD and GsoGPX Genes to Different Abiotic Stresses

In the present study, we randomly selected three genes of each G. max and G. soja SOD and GPX from different groups (Figure 10), and made sure their response towards oxidative, salt and drought stress treatments. Under H2O2, treatment, some of the genes were upregulated and some were downregulated at some treatment points. GmaSOD20.1 and GsoSOD11.1 were upregulated in response to oxidative stress at 3 h, 6 h, 12 h as compared to the control (0 h) (Figure 10). Most of the GPX genes also showed an increase in expression in response to oxidative stress while only GsoGPX17.1 showed a continuous up-regulation at all treatment points (3 h, 6 h, 9 h) as compared to the control 0 h (Figure 10).
Under NaCl treatment, GmaSOD20.1, GsoSOD11.1, GmaGPX17.1, and GsoGPX10.1 showed continuous up-regulation response as compared to the control 0 h and showed maximum expression at 12 h (Figure 10). Under PEG treatment, selected genes from both gene families showed a highly variegated response. GsoSOD20.1 showed continuous upregulated response as compared to 0 h. In GPX genes, GmaGPX10.1 showed continuous increase in expression as compared to control 0 h. Regarding G. soja, GsoGPX1.1 and GsoGPX17.1 showed more expression at 12 h compared to 0 h (Figure 10).

4. Discussion

The proteins encoded by the SOD and GPX genes are an important component of the antioxidant defense system, which plays a key role in the detoxification of stress-induced ROS, thereby protecting the cell from oxidative damage. Thus, systematic and comprehensive analysis of the SODs and GPX gene families in different legumes such as cultivated (Glycine max) and wild (Glycine soja) soybean provides the basis for the understanding of their abiotic stress response in these crop species. The availability of complete genome assemblies of wild and cultivated soybean as well as other legumes has made it possible to survey the SOD and GPX genes at the whole genome level. In this study, we performed a comprehensive analysis of SOD and GPX family genes in wild and cultivated soybean as well as other 11 legume species. The phylogeny relationship among the SOD and GPX genes of wild and cultivated soybeans with other legumes and Arabidopsis has been studied; besides, the gene structures, conserved motifs, cis-elements analysis, chromosomal location, gene duplication, divergence rate of duplicated genes, along with their syntenic relationship and expression profiles were also compared between cultivated and wild soybean.
In total, we identified a total of 14 and 13 genes of GmSODs and GmGPXs, respectively, in the G. max, while 13 each of GsSODs and GsGPX were identified in G. soja, which were higher compared to other legumes studied in the present study (Supplementary Table S5), as well as previously reported in Arabidopsis, Vitis vinifera, Camellia sinensis, G. raimondii and G. arboretum [46,47,48]. Our results showed that Fe-SODs and Mn-SODs are clustered together, suggesting more similarity between Mn-SODs and Fe-SODs. This similarity might be because they shared a common ancestor. However, the Cu/Zn SODs have evolved independently in eukaryotes. Similar to our findings, the Kliebenstein, Monde and Last [11] also documented the same similarity among Mn-SODs and Fe-SODs relative to other Cu/Zn-SODs, which showed considerable divergence. On the basis of function, the clustering of SOD genes into three groups is similar to that previously observed by other studies [46,48]; they also reported three groups of SOD genes based on function and metal factor. To this end, the GPX genes of all the studied legumes were clustered into five major clades, similar to as previously reported by [22]; they also reported five clusters of GPX genes in cucumber. The G. max and G. soja shared an equal number of GPX genes in all clades, and almost positioned near to each other in each clade, and it suggested that GPX protein sequence remained conserved during the domestication of cultivated soybean from wild species. Clustering of GPXs protein together with different subcellular localization in the same group (clade II) suggests that gene duplication events lead to the formation of several GPX sequences [49]. Furthermore, the variation in the number of introns in the gene structure of SODs and GPXs genes indicates that diversity exists in both gene families, which suggests that members of both the gene families are functionally diversified. Furthermore, conservation of some motifs such as 1 and 2 in all SODs, and 1–5 in all GPX genes of G. max and G. soja shows the conservation of SOD and GPX gene structures in these both soybean species. Genes in G. max and G. soja showing similar gene structure also shared a similar motif composition. However, the difference in the number and structure of conserved motif sequences in different species can be seen; in cucumber the 1–4 conserved motifs were identified in all GPXs, as compared to 1–5 in our study [22]; besides, in wheat seven motifs (1, 2, 3,6,10, 11 and 17) were identified as conserved in SODs [50].
Gene duplications are considered as one of the important driving forces in the evolution of the genome, and it provides novel genetic material with entirely diverse functions via different mechanisms of evolution such as selection, mutation and drift [51]. This in turn increases the buffering capacity of genomes in adaptation towards changing environments [52]. Gene duplication includes the segmental and tandem duplications and is the primary mechanism for gene diversification. In different legume species, the difference in the number of SOD genes may be due to this force [53]. In soybean, the paralogs present within a gene family were mainly derived from genome duplication events, which occurred almost 13 MYA [41]. In G. max and G. soja, the greater number of SODs and GPXs as compared to the model legume Medicago truncatula (7 SODs) arises mainly due to segmental duplication. Overall, four and three segmental events are recorded in the SOD genes of G. max and G. soja, respectively. Furthermore, the one extra gene (GmaSOD12.1) in cultivated soybean as compared to the wild one (G. soja) might have evolved during the evolutionary processes by segmental gene duplication from GmaSOD11.1 as GmaSOD12.1, and shows more than 90% similarity to GmaSOD11.1. Furthermore, five segmental duplications were recorded in G. max, and three in G. soja, while no duplication event has been identified in Medicago truncatula. Similarly, segmental duplications for GPXs genes were reported for A. thaliana, Brachypodium distachyon, P. Beauv, Gossypium raimondii, Vitis vinifera, Oryza sativa, Physcomitrella patens and Prunus persica [27]. In the cucumber, both the segmental as well as tandem duplication has been reported as the responsible forces for the expansion of the GPXs family [22]. In contrast, the segmental duplication has been recorded as the main force responsible for the expansion of related gene families in previous studies such as PRX in maize [54], SODs in Gossiypum raimondii [48] and ROS in cotton [55].
The divergence time for these segmental duplicated events were estimated to be ranged from 0.00 to 10.46 MYA. These inferences are consistent with the duplication in Glycine lineage that occurred around 13 MYA [41]. Ka/Ks ratios of GPXs and SODs duplicated gene pairs of G. soja showed that negative or purifying selection may be responsible for the evolution of GPXs and SODs genes, as 100% and 75% purifying selection were recorded for the SODs and GPXs duplicated gene pairs, respectively. In G. max positive, neutral, negative and purifying selection is found to be responsible for the evolution of the GPXs and SODs. Hence, the purifying and positive selection play an equal role for the evolution of these gene families in cultivated soybean. A total of 40% of the purifying and positive selection is reported for GPXs duplicated gene pairs, and 50% for SODs. The Ka/Ks ratios of GsoSOD3.1/19.1, GmaSOD11.1/12.1, GmaSOD3.1/19.1, GmaGPX8.1/5.1, GmaGPX2.1/10.1, and GmaGPX11.1/1.1 gene pairs are relatively high, showing that these genes might experience rapid evolutionary diversification following duplication. These results are similar to the previous findings in cotton, where purifying selection is found as the main driving force for ROS genes including SODs and GPXs [55]
The SOD and GPX belonging to the antioxidant defense system are often induced in response to the plant stresses. Previous studies have reported the role of SODs and GPXs in response to various abiotic stresses including drought, cold, heat and salinity. We screened the upstream regions of SOD and GPX genes to identify cis-elements. Cis-elements viz., as-1, DRE, MYC, MYB, MYB, LTR recognition site, box S, W box, WRE3 and WUN-motif involved in abiotic and biotic stress signaling have been identified in the promoter region of SODs, hence suggesting their important role in the stress response. Furthermore, in case of GPXs, the cis-elements related to drought (MBS, as-1, and MYC), water (MYB) and anoxia (ARE) have been identified in both cultivated and wild soybeans. Along with stress-responsive elements, hormonal regulating cis-elements, i.e., jasmonate (TGACG-motif and CGTCA-motif), abscisic acid (ABRE), ethylene-responsive elements (ERE), salicylic acid responsiveness (TCA and TCA element) and auxin-responsive elements (TGA-element) have also been found in the promoter of both the SODs and GPXs genes. Identification of hormone related cis-elements in the promoter regions of these two families, indicating that both the families may be associated with hormonal response. These results are similar as reported by previous studies in other plant species such as Arabidopsis thaliana, Boea hygrometrica, Selaginella moellendorffii, Selaginella lepidophylla, Oropetium thomaeum, Xerophyta viscosa, Camellia sinensis, Vitis vinifera and C. sativus; they also suggested that SODs and GPX genes are mostly engaged in hormonal signaling, light, abiotic stress like drought, defense and development [6,19,22,46,56].
We analyzed the evolution of the SODs and GPXs among cultivated soybean, wild soybean, model legume Medicago truncatula and Arabidopsis. This comparison showed a high level of similarity between cultivated and wild soybean as compared to Medicago truncatula and Arabidopsis. The orthologues pairs of SOD and GPX genes in G. max and G. soja which are show more than 90% similarity in the Circo-letto radial diagram also correspond to the gene pairs that were identified in duplication analysis. Furthermore, only a single orthologue gene pair (GmaGPX5.1, MtrGPX8.1) has been identified in G. max and Medicago truncatula. The results are in accordance; as observed by [47], they also identified a higher number of orthologous genes among closely related species in cotton G. arboretum and G. raimondi as compared to Arabidopsis.
Survival of the plants is disturbed by a variety of environmental cues, such as salinity, extreme low/high temperature and drought, which adversely affects plant growth and development, and results in the low productivity to complete plant death [57]. In the present study, we randomly selected three genes of each G. max and G. soja SOD and GPX, and our results showed that the significant differential response of these genes under the multiple treatments viz., oxidative (H2O2), drought (PEG) and salinity (NaCl) stresses. Taken together, most of these G. max and G. soja SOD and GPX genes were significantly induced/repressed by these stress treatments. It is speculated that distinct SOD and GPX members had specific functions and allows the plant to adopt different stresses. Many earlier reports have documented the function of the SOD and GPX in the alleviation of the different abiotic stress in plants such as Arabidopsis, cotton, canola and tomato (as reviewed by Verma, Lakhanpal and Singh [10]). As the major effect of the various biotic stresses such as salinity, drought and heat is the induction of the excess accumulation of the ROS in the plant cells and tissues, which in turn leads to the oxidative stress and damage. The SOD and GPX being the important component of the plant antioxidant defense system, and their increased gene expression will in turn assists in the scavenging of the excess ROS [16], thus preventing the oxidative damage of the plant tissues resulting from the various abiotic stresses [19].
To date, no comparative study has been conducted regarding the genome-wide characterization of GPX and SOD genes in G. max and G. soja. Therefore, this is the first comprehensive and systematic research for the characterization of these gene families in both cultivated and wild soybean, and also including the Medicago truncatula as a model legume. Overall, this study may also provide new opportunities to uncover soybean tolerance mechanisms under stress conditions. The outcome of our bioinformatics analysis offers basic resources for analyzing the molecular mechanism and function of the SOD and GPX family members in the plant growth development as well as stress response in soybean. In addition, the comparative study between cultivated and wild soybean as well as other legume species provides useful information to study the function of SODs and GPXs. That in turn assists harnessing of the agronomic, ecological and economic benefits for the soybean crop.

5. Conclusions

The current study identified a total of 101 and 95 genes of SOD and GPX, respectively, in cultivated and wild soybeans, and 11 other legume species via genome-wide analysis. These genes were highest in the G. max and G. soja relative to other legumes, and the SOD and GPX genes of wild and cultivated soybeans showed the highest homology with each other relative to other legumes. The role of the purifying selection in the evolution of these genes families were more prominent, and the expansion of these gene families results mainly through segmental duplication. Moreover, the qRT-PCR analysis revealed the response of these genes in the wild and cultivated soybeans under different abiotic stresses. In conclusion, the present study characterized the SOD and GPX gene families in the soybeans and other legumes, which provide the novel resource for their future functional characterization in response to different plant stresses.

Supplementary Materials

The following supporting information can be downloaded at: https://www.mdpi.com/article/10.3390/antiox11030460/s1, Table S1: RNA-seq data of GmaSOD and GmaGPX genes from different soybean tissues freely available in the SOYBASE; Table S2: Details of the primers used in the qRT-PCR analysis of SOD and GPX genes of G. soja; Table S3: Cis-regulatory elements identified in the promoter regions of the GPX genes of G. max, G. soja and M. trancatula; Table S4: Similarities of the the SOD and GPX genes of G. max and G. soja; and similarities of the SOD and GPX genes of G. max and G. soja with model legume M. truncatula; Table S5: Details of SOD and GPX genes in studied sppecies.

Author Contributions

Conceptualization, J.A.B., P.A., D.Y. and H.W.; methodology, M.A. (Muqadas Aleem); software, S.A.; validation, I.S., Z.W. and A.S.; formal analysis, M.A. (Maida Aleem); investigation, A.T.; resources, R.M.A.; data curation, H.M.N.C.; writing—original draft preparation, M.N.A.; writing—review and editing, P.K.; visualization, S.L.; supervision, P.A.; project administration, M.N.A.; funding acquisition, J.A.B. All authors have read and agreed to the published version of the manuscript.

Funding

This research was funded by the National Natural Science Foundation of China, Grant no. 32072080, and King Saud University, Riyadh, Saudi Arabia, Grant no. (RSP-2021/180).

Institutional Review Board Statement

Not applicable.

Informed Consent Statement

Not applicable.

Data Availability Statement

Data is contained within the article and Supplementary Material.

Acknowledgments

The authors would like to extend their sincere appreciation to the Researchers Supporting Project Number (RSP-2021/180), King Saud University, Riyadh, Saudi Arabia. Javaid Akhter Bhat thanks International Genome Center, Jiangsu University for their research project support.

Conflicts of Interest

The authors declare no conflict of interest.

References

  1. Bhat, J.A.; Shivaraj, S.; Singh, P.; Navadagi, D.B.; Tripathi, D.K.; Dash, P.K.; Solanke, A.U.; Sonah, H.; Deshmukh, R. Role of silicon in mitigation of heavy metal stresses in crop plants. Plants 2019, 8, 71. [Google Scholar] [CrossRef] [PubMed] [Green Version]
  2. Bhat, J.A.; Deshmukh, R.; Zhao, T.; Patil, G.; Deokar, A.; Shinde, S.; Chaudhary, J. Harnessing High-throughput Phenotyping and Genotyping for Enhanced Drought Tolerance in Crop Plants. J. Biotechnol. 2020, 324, 248–260. [Google Scholar] [CrossRef] [PubMed]
  3. Das, K.; Roychoudhury, A. Reactive oxygen species (ROS) and response of antioxidants as ROS-scavengers during environmental stress in plants. Front. Environ. Sci. 2014, 2, 53. [Google Scholar] [CrossRef] [Green Version]
  4. Molassiotis, A.; Job, D.; Ziogas, V.; Tanou, G. Citrus plants: A model system for unlocking the secrets of NO and ROS-inspired priming against salinity and drought. Front. Plant Sci. 2016, 7, 229. [Google Scholar] [CrossRef] [Green Version]
  5. Foyer, C.H.; Noctor, G. Redox homeostasis and antioxidant signaling: A metabolic interface between stress perception and physiological responses. Plant Cell 2005, 17, 1866–1875. [Google Scholar] [CrossRef] [Green Version]
  6. Gupta, S.; Dong, Y.; Dijkwel, P.P.; Mueller-Roeber, B.; Gechev, T.S. Genome-Wide Analysis of ROS Antioxidant Genes in Resurrection Species Suggest an Involvement of Distinct ROS Detoxification Systems during Desiccation. Int. J. Mol. Sci. 2019, 20, 3101. [Google Scholar] [CrossRef] [Green Version]
  7. Wang, F.-Z.; Wang, Q.-B.; Kwon, S.-Y.; Kwak, S.-S.; Su, W.-A. Enhanced drought tolerance of transgenic rice plants expressing a pea manganese superoxide dismutase. J. Plant Physiol. 2005, 162, 465–472. [Google Scholar] [CrossRef]
  8. Jalali-e-Emam, S.M.S.; Alizadeh, B.; Zaefizadeh, M.; Zakarya, R.A.; Khayatnezhad, M. Superoxide dismutase (SOD) activity in NaCl stress in salt-sensitive and salt-tolerance genotypes of Colza (Brassica napus L.). Middle East J. Sci. Res. 2011, 7, 7–11. [Google Scholar]
  9. De Rossi, S.; Di Marco, G.; Bruno, L.; Gismondi, A.; Canini, A. Investigating the drought and salinity effect on the redox components of Sulla Coronaria (L.) Medik. Antioxidants 2021, 10, 1048. [Google Scholar] [CrossRef]
  10. Verma, D.; Lakhanpal, N.; Singh, K. Genome-wide identification and characterization of abiotic-stress responsive SOD (superoxide dismutase) gene family in Brassica juncea and B. rapa. BMC Genom. 2019, 20, 227. [Google Scholar] [CrossRef] [Green Version]
  11. Kliebenstein, D.J.; Monde, R.-A.; Last, R.L. Superoxide dismutase in Arabidopsis: An eclectic enzyme family with disparate regulation and protein localization. Plant Physiol. 1998, 118, 637–650. [Google Scholar] [CrossRef] [PubMed] [Green Version]
  12. Wang, W.; Zhang, X.; Deng, F.; Yuan, R.; Shen, F. Genome-wide characterization and expression analyses of superoxide dismutase (SOD) genes in Gossypium hirsutum. BMC Genom. 2017, 18, 376. [Google Scholar] [CrossRef] [PubMed] [Green Version]
  13. Tyagi, S.; Sharma, S.; Taneja, M.; Kumar, R.; Sembi, J.K.; Upadhyay, S.K. Superoxide dismutases in bread wheat (Triticum aestivum L.): Comprehensive characterization and expression analysis during development and, biotic and abiotic stresses. Agric. Gene 2017, 6, 1–13. [Google Scholar] [CrossRef]
  14. Bela, K.; Horváth, E.; Gallé, Á.; Szabados, L.; Tari, I.; Csiszár, J. Plant glutathione peroxidases: Emerging role of the antioxidant enzymes in plant development and stress responses. J. Plant Physiol. 2015, 176, 192–201. [Google Scholar] [CrossRef]
  15. Avsian-Kretchmer, O.; Gueta-Dahan, Y.; Lev-Yadun, S.; Gollop, R.; Ben-Hayyim, G. The salt-stress signal transduction pathway that activates the gpx1 promoter is mediated by intracellular H2O2, different from the pathway induced by extracellular H2O2. Plant Physiol. 2004, 135, 1685–1696. [Google Scholar] [CrossRef] [Green Version]
  16. Li, W.; Huai, X.; Li, P.; Raza, A.; Mubarik, M.S.; Habib, M.; Fiaz, S.; Zhang, B.; Pan, J.; Khan, R.S.A. Genome-wide characterization of glutathione peroxidase (GPX) gene family in rapeseed (brassica napus L.) revealed their role in multiple abiotic stress response and hormone signaling. Antioxidants 2021, 10, 1481. [Google Scholar] [CrossRef]
  17. Zhang, L.; Wu, M.; Teng, Y.; Jia, S.; Yu, D.; Wei, T.; Chen, C.; Song, W. Overexpression of the glutathione peroxidase 5 (RcGPX5) gene from rhodiola crenulata increases drought tolerance in Salvia miltiorrhiza. Front. Plant Sci. 2019, 9, 1950. [Google Scholar] [CrossRef]
  18. Diao, Y.; Xu, H.; Li, G.; Yu, A.; Yu, X.; Hu, W.; Zheng, X.; Li, S.; Wang, Y.; Hu, Z. Cloning a glutathione peroxidase gene from Nelumbo nucifera and enhanced salt tolerance by overexpressing in rice. Mol. Biol. Rep. 2014, 41, 4919–4927. [Google Scholar] [CrossRef]
  19. Matamoros, M.A.; Saiz, A.; Penuelas, M.; Bustos-Sanmamed, P.; Mulet, J.M.; Barja, M.V.; Rouhier, N.; Moore, M.; James, E.K.; Dietz, K.J.; et al. Function of glutathione peroxidases in legume root nodules. J. Exp. Bot. 2015, 66, 2979–2990. [Google Scholar] [CrossRef] [Green Version]
  20. Tokarz, B.; Wójtowicz, T.; Makowski, W.; Jędrzejczyk, R.J.; Tokarz, K.M. What is the Difference between the Response of Grass Pea (Lathyrus sativus L.) to Salinity and Drought Stress?—A Physiological Study. Agronomy 2020, 10, 833. [Google Scholar] [CrossRef]
  21. Chen, M.; Li, K.; Li, H.; Song, C.P.; Miao, Y. The Glutathione Peroxidase Gene Family in Gossypium hirsutum: Genome-Wide Identification, Classification, Gene Expression and Functional Analysis. Sci. Rep. 2017, 7, 44743. [Google Scholar] [CrossRef] [PubMed] [Green Version]
  22. Zhou, Y.; Hu, L.; Ye, S.; Jiang, L.; Liu, S. Genome-wide identification of glutathione peroxidase (GPX) gene family and their response to abiotic stress in cucumber. 3 Biotech 2018, 8, 159. [Google Scholar] [CrossRef] [PubMed]
  23. Dash, S.; Campbell, J.D.; Cannon, E.K.; Cleary, A.M.; Huang, W.; Kalberer, S.R.; Karingula, V.; Rice, A.G.; Singh, J.; Umale, P.E. Legume information system (LegumeInfo. org): A key component of a set of federated data resources for the legume family. Nucleic Acids Res. 2015, 44, D1181–D1188. [Google Scholar] [CrossRef] [PubMed] [Green Version]
  24. Gepts, P.; Beavis, W.D.; Brummer, E.C.; Shoemaker, R.C.; Stalker, H.T.; Weeden, N.F.; Young, N.D. Legumes as a model plant family. Genomics for food and feed report of the Cross-Legume Advances Through Genomics Conference. Plant Physiol. 2005, 137, 1228–1235. [Google Scholar] [CrossRef] [PubMed] [Green Version]
  25. Nawaz, M.A.; Yang, S.H.; Chung, G. Wild soybeans: An opportunistic resource for soybean improvement. In Rediscovery of Landraces as a Resource for the Future; Intech Open: London, UK, 2018. [Google Scholar]
  26. Ma, T.; Wang, J.; Zhou, G.; Yue, Z.; Hu, Q.; Chen, Y.; Liu, B.; Qiu, Q.; Wang, Z.; Zhang, J. Genomic insights into salt adaptation in a desert poplar. Nat. Commun. 2013, 4, 2797. [Google Scholar] [CrossRef] [PubMed]
  27. Ozyigit, I.I.; Filiz, E.; Vatansever, R.; Kurtoglu, K.Y.; Koc, I.; Ozturk, M.X.; Anjum, N.A. Identification and Comparative Analysis of H2O2-Scavenging Enzymes (Ascorbate Peroxidase and Glutathione Peroxidase) in Selected Plants Employing Bioinformatics Approaches. Front. Plant Sci. 2016, 7, 301. [Google Scholar] [CrossRef] [Green Version]
  28. Schultz, J.; Copley, R.R.; Doerks, T.; Ponting, C.P.; Bork, P. SMART: A web-based tool for the study of genetically mobile domains. Nucleic Acids Res. 2000, 28, 231–234. [Google Scholar] [CrossRef] [PubMed]
  29. Gasteiger, E.; Hoogland, C.; Gattiker, A.; Wilkins, M.R.; Appel, R.D.; Bairoch, A. Protein identification and analysis tools on the ExPASy server. In The Proteomics Protocols Handbook; Springer: Berlin/Heidelberg, Germany, 2005; pp. 571–607. [Google Scholar]
  30. Chi, S.-M.; Nam, D. WegoLoc: Accurate prediction of protein subcellular localization using weighted Gene Ontology terms. Bioinformatics 2012, 28, 1028–1030. [Google Scholar] [CrossRef]
  31. Yu, C.S.; Chen, Y.C.; Lu, C.H.; Hwang, J.K. Prediction of protein subcellular localization. Proteins Struct. Funct. Bioinform. 2006, 64, 643–651. [Google Scholar] [CrossRef]
  32. Sievers, F.; Higgins, D.G. Clustal Omega for making accurate alignments of many protein sequences. Protein Sci. 2018, 27, 135–145. [Google Scholar] [CrossRef] [Green Version]
  33. Kumar, S.; Stecher, G.; Tamura, K. MEGA7: Molecular evolutionary genetics analysis version 7.0 for bigger datasets. Mol. Biol. Evol. 2016, 33, 1870–1874. [Google Scholar] [CrossRef] [PubMed] [Green Version]
  34. Hu, B.; Jin, J.; Guo, A.-Y.; Zhang, H.; Luo, J.; Gao, G. GSDS 2.0: An upgraded gene feature visualization server. Bioinformatics 2014, 31, 1296–1297. [Google Scholar] [CrossRef] [PubMed] [Green Version]
  35. Bailey, T.L.; Williams, N.; Misleh, C.; Li, W.W. MEME: Discovering and analyzing DNA and protein sequence motifs. Nucleic Acids Res. 2006, 34, W369–W373. [Google Scholar] [CrossRef] [PubMed]
  36. Lescot, M.; Déhais, P.; Thijs, G.; Marchal, K.; Moreau, Y.; Van de Peer, Y.; Rouzé, P.; Rombauts, S. PlantCARE, a database of plant cis-acting regulatory elements and a portal to tools for in silico analysis of promoter sequences. Nucleic Acids Res. 2002, 30, 325–327. [Google Scholar] [CrossRef] [PubMed]
  37. Voorrips, R. MapChart: Software for the graphical presentation of linkage maps and QTLs. J. Hered. 2002, 93, 77–78. [Google Scholar] [CrossRef] [Green Version]
  38. Mifsud, W.; Bateman, A. Membrane-bound progesterone receptors contain a cytochrome b 5-like ligand-binding domain. Genome Biol. 2002, 3, research0068. [Google Scholar] [CrossRef] [PubMed]
  39. Darzentas, N. Circoletto: Visualizing sequence similarity with Circos. Bioinformatics 2010, 26, 2620–2621. [Google Scholar] [CrossRef]
  40. Korber, B. Computational analysis of HIV molecular sequences. In HIV Signature and Sequence Variation Analysis; Kluwer Academic Publishers: Dordrecht, The Netherlands, 2000; p. 55. [Google Scholar]
  41. Lynch, M.; Conery, J.S. The evolutionary fate and consequences of duplicate genes. Science 2000, 290, 1151–1155. [Google Scholar] [CrossRef] [Green Version]
  42. Shen, Y.; Du, H.; Liu, Y.; Ni, L.; Wang, Z.; Liang, C.; Tian, Z. Update soybean Zhonghuang 13 genome to a golden reference. Sci. China Life Sci. 2019, 62, 1257–1260. [Google Scholar] [CrossRef] [PubMed]
  43. Hoagland, D.R.; Arnon, D.I. The water-culture method for growing plants without soil. Circular. Calif. Agric. Exp. Stn. 1950, 347, 32. [Google Scholar]
  44. Li, Y.; Chen, Q.; Nan, H.; Li, X.; Lu, S.; Zhao, X.; Liu, B.; Guo, C.; Kong, F.; Cao, D. Overexpression of GmFDL19 enhances tolerance to drought and salt stresses in soybean. PLoS ONE 2017, 12, e0179554. [Google Scholar] [CrossRef] [PubMed] [Green Version]
  45. Livak, K.J.; Schmittgen, T.D. Analysis of relative gene expression data using real-time quantitative PCR and the 2−ΔΔCT method. Methods 2001, 25, 402–408. [Google Scholar] [CrossRef] [PubMed]
  46. Zhou, C.; Zhu, C.; Fu, H.; Li, X.; Chen, L.; Lin, Y.; Lai, Z.; Guo, Y. Genome-wide investigation of superoxide dismutase (SOD) gene family and their regulatory miRNAs reveal the involvement in abiotic stress and hormone response in tea plant (Camellia sinensis). PLoS ONE 2019, 14, e0223609. [Google Scholar] [CrossRef] [PubMed]
  47. Wang, W.; Xia, M.; Chen, J.; Deng, F.; Yuan, R.; Zhang, X.; Shen, F. Genome-wide analysis of superoxide dismutase gene family in Gossypium raimondii and G. arboreum. Plant Gene 2016, 6, 18–29. [Google Scholar] [CrossRef] [Green Version]
  48. Hu, X.; Hao, C.; Cheng, Z.M.; Zhong, Y. Genome-Wide Identification, Characterization, and Expression Analysis of the Grapevine Superoxide Dismutase (SOD) Family. Int. J. Genom. 2019, 2019, 7350414. [Google Scholar] [CrossRef]
  49. Mok, D.; Peloquin, S. Breeding value of 2n pollen (diplandroids) in tetraploid x diploid crosses in potatoes. Theor. Appl. Genet. 1975, 46, 307–314. [Google Scholar] [CrossRef]
  50. Jiang, W.; Yang, L.; He, Y.; Zhang, H.; Li, W.; Chen, H.; Ma, D.; Yin, J. Genome-wide identification and transcriptional expression analysis of superoxide dismutase (SOD) family in wheat (Triticum aestivum). PeerJ 2019, 7, e8062. [Google Scholar] [CrossRef] [Green Version]
  51. Kondrashov, F.A. Gene duplication as a mechanism of genomic adaptation to a changing environment. Proc. R. Soc. B Biol. Sci. 2012, 279, 5048–5057. [Google Scholar] [CrossRef] [Green Version]
  52. Bhat, J.A.; Shivaraj, S.; Ali, S.; Mir, Z.A.; Islam, A.; Deshmukh, R. Genomic resources and omics-assisted breeding approaches for pulse crop improvement. In Pulse Improvement; Springer: Cham, Switzerland, 2018; pp. 13–55. [Google Scholar]
  53. Magadum, S.; Banerjee, U.; Murugan, P.; Gangapur, D.; Ravikesavan, R. Gene duplication as a major force in evolution. J. Genet. 2013, 92, 155–161. [Google Scholar] [CrossRef]
  54. Wang, Y.; Wang, Q.; Zhao, Y.; Han, G.; Zhu, S. Systematic analysis of maize class III peroxidase gene family reveals a conserved subfamily involved in abiotic stress response. Gene 2015, 566, 95–108. [Google Scholar] [CrossRef]
  55. Xu, Y.; Magwanga, R.O.; Cai, X.; Zhou, Z.; Wang, X.; Wang, Y.; Zhang, Z.; Jin, D.; Guo, X.; Wei, Y.; et al. Deep Transcriptome Analysis Reveals Reactive Oxygen Species (ROS) Network Evolution, Response to Abiotic Stress, and Regulation of Fiber Development in Cotton. Int. J. Mol. Sci. 2019, 20, 1863. [Google Scholar] [CrossRef] [PubMed] [Green Version]
  56. Milla, M.A.R.; Maurer, A.; Huete, A.R.; Gustafson, J.P. Glutathione peroxidase genes in Arabidopsis are ubiquitous and regulated by abiotic stresses through diverse signaling pathways. Plant J. 2003, 36, 602–615. [Google Scholar] [CrossRef] [PubMed]
  57. Abdel-Wahab, A.; Shabeb, M.; Younis, M. Studies on the effect of salinity, drought stress and soil type on nodule activities of Lablab purpureus (L.) sweet (Kashrangeeg). J. Arid. Environ. 2002, 51, 587–602. [Google Scholar] [CrossRef]
Figure 1. Phylogenic tree of SOD proteins. The tree was constructed in MEGA 7 by using the neighbor-joining method with 1000 bootstraps. Different clades of tree are marked with different colors: Clade I (Mahron), Clade II (Green), Clade III (Blue). The square shaped boxes represent the cellular localization: blue (cytoplasm) and pink (mitochondria).
Antioxidants 11 00460 g001
Figure 2. Phylogenic tree of GPX proteins. The tree was constructed in MEGA 7 by using the neighbor-joining method with 1000 bootstraps. Different clades of tree are marked with different colors of branch lines: Clade I (red), Clade II (pink), Clade III (green), Clade IV (mahroon) and Clade V (blue). The square shaped boxes represent the cellular localization: aqua (peroxisome), blue (cytoplasm) and green (chloroplast) and pink (mitochondria).
Antioxidants 11 00460 g002
Figure 3. Phylogenetic relationship, exon–intron distribution/gene structure and conserved motifs in the SOD gene family in G. max, G. soja and M. truncatula. (A) The phylogenetic tree of the SOD gene family classified in to three clade: Clade I = Fe-SODs, Clade II = Mn-SODs, Clade III = Cu-SODs. (B) The untranslated region (UTRs), intron and exon distribution represented with the unfilled blue box, red shrinked line and green boxes, respectively. (C) Identification of the conserved motifs in SOD genes. Each motif is presented with a particular color.
Antioxidants 11 00460 g003
Figure 4. Phylogenetic relationship, exon–intron distribution/gene structure and conserved motifs in the GPX gene family in G. max, G. soja and M. truncatula. (A) The phylogenetic tree of GPX gene family classified into 5 clades represented with different colors of boxes on the phylogenetic tree (Clade I–V). (B) The untranslated region (UTRs), intron and exon distribution is represented with unfilled blue boxes, red shrinked lines and green boxes, respectively. (C) Identification of the conserved motifs in GPX genes. Each motif is presented with a particular color.
Antioxidants 11 00460 g004
Figure 5. An overview of cis-regulatory elements in SOD family members of G. max and G. soja.
Antioxidants 11 00460 g005
Figure 6. An overview of cis-regulatory elements in GPX family members of G. max and G. soja.
Antioxidants 11 00460 g006
Figure 7. Chromosomal locations and gene duplication events of SOD and GPX genes of G. max (A), G. soja (B) and M. truncatula (C). The scale on the left side of chromosome is the position of the genes in megabases and on the right side of each chromosome gene names correspond to the approximate locations of each SOD and GPX gene. Furthermore, the segmentally duplicated genes are connected by dashed lines represented by the same color as SOD and GPX genes.
Antioxidants 11 00460 g007
Figure 8. The synteny relationship between SOD and GPX gene families in A. thialana, G. max, G. soja and M. truncatula by using Circos tool. The blue, green, orange and red colors represent ≤50%, ≤70%, ≤90% and >90% identity, respectively.
Antioxidants 11 00460 g008
Figure 9. Expression profiles of the SOD and GPX genes in soybean, including different organs, tissues, and developmental stages. Data were normalized based on the mean expression value of each gene in all tissues analyzed. Flo-1: 1st flower, Flo-2: 2nd flower, Flo-3: 3rd flower, Flo-4: 4th flower, Flo-5: 5th flower.
Antioxidants 11 00460 g009
Figure 10. Expression of different selected SOD and GPX genes of G. soja under different stresses viz H2O2 (blue color), NaCl (red color) and PEG (green color). Data represent mean and standard deviation of three repeats (n = 3). Data with the same letters in lowercase (a, b, c and d) above bars indicate no significant differences at the 0.05 level at different time intervals in the soybean genotype according to the Duncan’s multiple range test.
Antioxidants 11 00460 g010
Table 1. List of studied species along with their genome database link.
Sr. No.Crop PlantSpecies StudiedAbbreviation of Spp. NameLinkLink Last Accessed Date
1Cultivated SoybeanGlycine maxG. maxhttps://soybase.org/12 October 2021
2Wild SoybeanGlycine sojaG. sojahttps://soybase.org/12 October 2021
3Barrel cloverMedicago truncatulaM. truncatulahttp://www.medicagogenome.org/download8 April 2021
4ChickpeaCiser arientinumC. arientinumhttps://legumeinfo.org/22 August 2021
5PigeonpeaCajanus cajanC. cajanhttps://legumeinfo.org/22 August 2021
6Wild peanutArachis duranensisduranishttps://legumeinfo.org/22 August 2021
7PeaPisum sativumP. sativumhttps://legumeinfo.org/22 August 2021
8CowpeaVigna. unguiculataV. unguiculatahttps://legumeinfo.org/22 August 2021
9MungbeanVigna radiateV. radiatahttps://legumeinfo.org/22 August 2021
10Birdsfoot trefoilLotus japonicusL. japonicushttps://legumeinfo.org/22 August 2021
11Narrowleaf lupinLupinus angustifoliusL angustifoliushttps://legumeinfo.org/22 August 2021
12Adzuki beanVigna angularisVigna angularishttps://legumeinfo.org/22 August 2021
13Common beanPhaseolus vulgarisP. vulgarishttps://legumeinfo.org/22 August 2021
14ArabidopsisArabidopsis thalianaA. thalianahttps://www.arabidopsis.org/2 May 2021
Table 2. Ka/Ks analysis and estimated divergence time for the duplicated SOD and GPX genes in paralogs of G. max and G. soja.
Duplicated PairKaKsKa/KsDuplicate Type Time (Mya *)Purifying Selection Type
GsoSOD3.1 GsoSOD19.10.0670.0511.298Segmental 4.18YesPositive selection
GsoSOD4.1 GsoSOD6.10.0220.0340.656Segmental 2.79YesNegative or purifying selection
GsoSOD10.2 GsoSOD20.20.0270.0850.311Segmental 6.97YesNegative or purifying selection
GsoSOD2.1 GsoSOD10.10.0480.0620.773Segmental5.08YesNegative or purifying selection
GmaSOD11.1 GmaSOD12.10.0340.0152.182Segmental 1.23NoPositive selection
GmaSOD10. GmaSOD20.20.0360.0540.666Segmental 4.43YesNegative or purifying selection
GmaSOD3.1 GmaSOD19.10.0660.0371.811Segmental 3.03NoPositive selection
GmaSOD4.1 GmaSOD6.10.0250.0310.807Segmental 2.54Yes Negative or purifying selection
GsoGPX5.2 GsoGPX8.30.0180.0900.197Segmental 7.38YesNegative or purifying selection
GsoGPX5.1 GsoGPX8.10.0050.0750.069Segmental 6.15YesNegative or purifying selection
GsoGPX2.1 GsoGPX10.10.0170.1360.128Segmental 11.15YesNegative or purifying selection
GmaGPX8.1 GmaGPX5.10.0210.0201.051Segmental 1.64NoPositive selection
GmaGPX14.1 GmaGPX17.10.0590.0620.941Segmental 5.08YesNegative or purifying selection
GmaGPX5.2 GmaGPX8.30.0330.0000.000Segmental 0.00YesNegative or purifying selection
GmaGPX2.1 GmaGPX10.10.0500.0192.637Segmental 1.56NoPositive selection
GmaGPX11.1 GmaGPX1.10.0130.0101.306Segmental 0.82NoPositive selection
GmaGPX3.1 GmaGPX19.10.0610.0630.970Segmental 5.16NoNeutral selection
* Mya, million years ago.
Publisher’s Note: MDPI stays neutral with regard to jurisdictional claims in published maps and institutional affiliations.

