

Flavonoid-Conjugated Gadolinium Complexes as Anti-Inflammatory Theranostic Agents
 , , , , ,
Abstract
:1. Introduction
2. Materials and Methods
2.1. Materials
2.2. Instrument
2.3. Synthesis and Characterization
2.4. Relaxivity
2.5. Octanol-Water Partition Coefficients
2.6. Stability Measurement: Transmetalation Kinetics and pH Stability
2.7. LPS-Induced Inflammatory Animal Models
2.8. In Vivo MR Imaging
2.9. Biodistribution
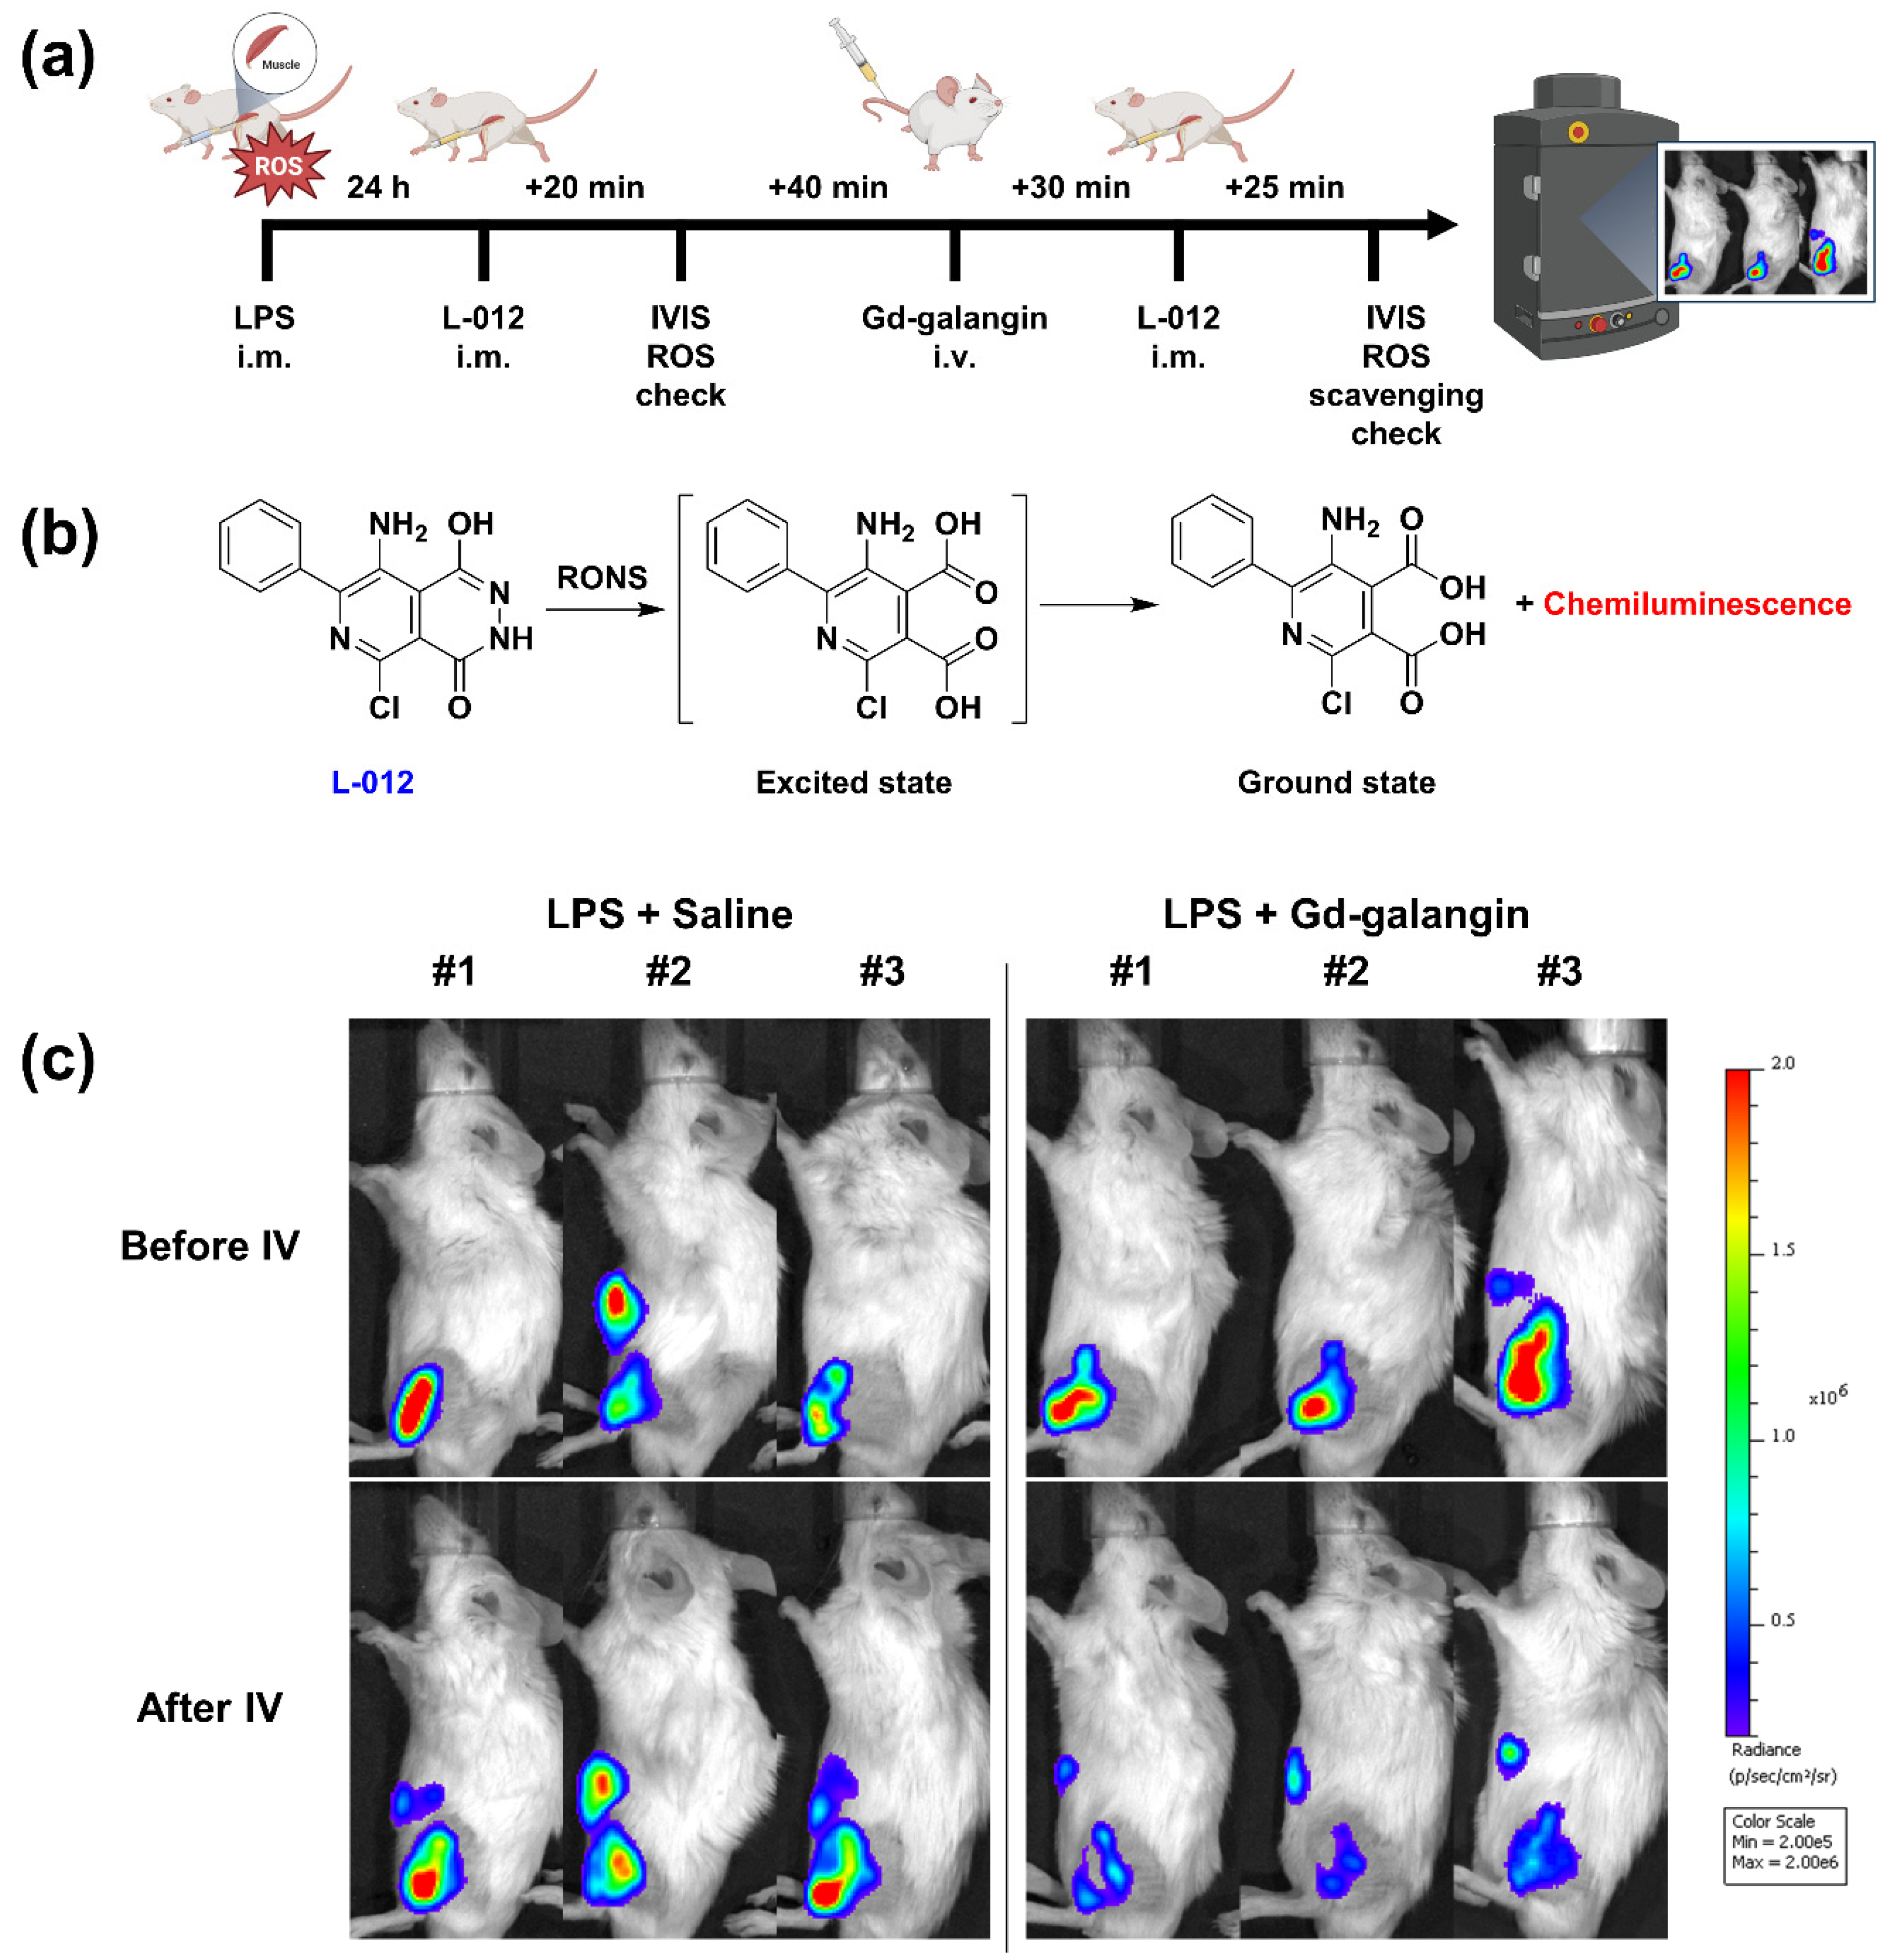
2.10. In Vivo IVIS Imaging
2.11. Cell Culture
2.12. Cell Viability Assay
2.13. Cell Fractionation
2.14. Reactive Oxygen Species Measurement
2.15. Nitric Oxide Assay
2.16. Western Blot Analysis
2.17. Statistical Analysis
3. Results
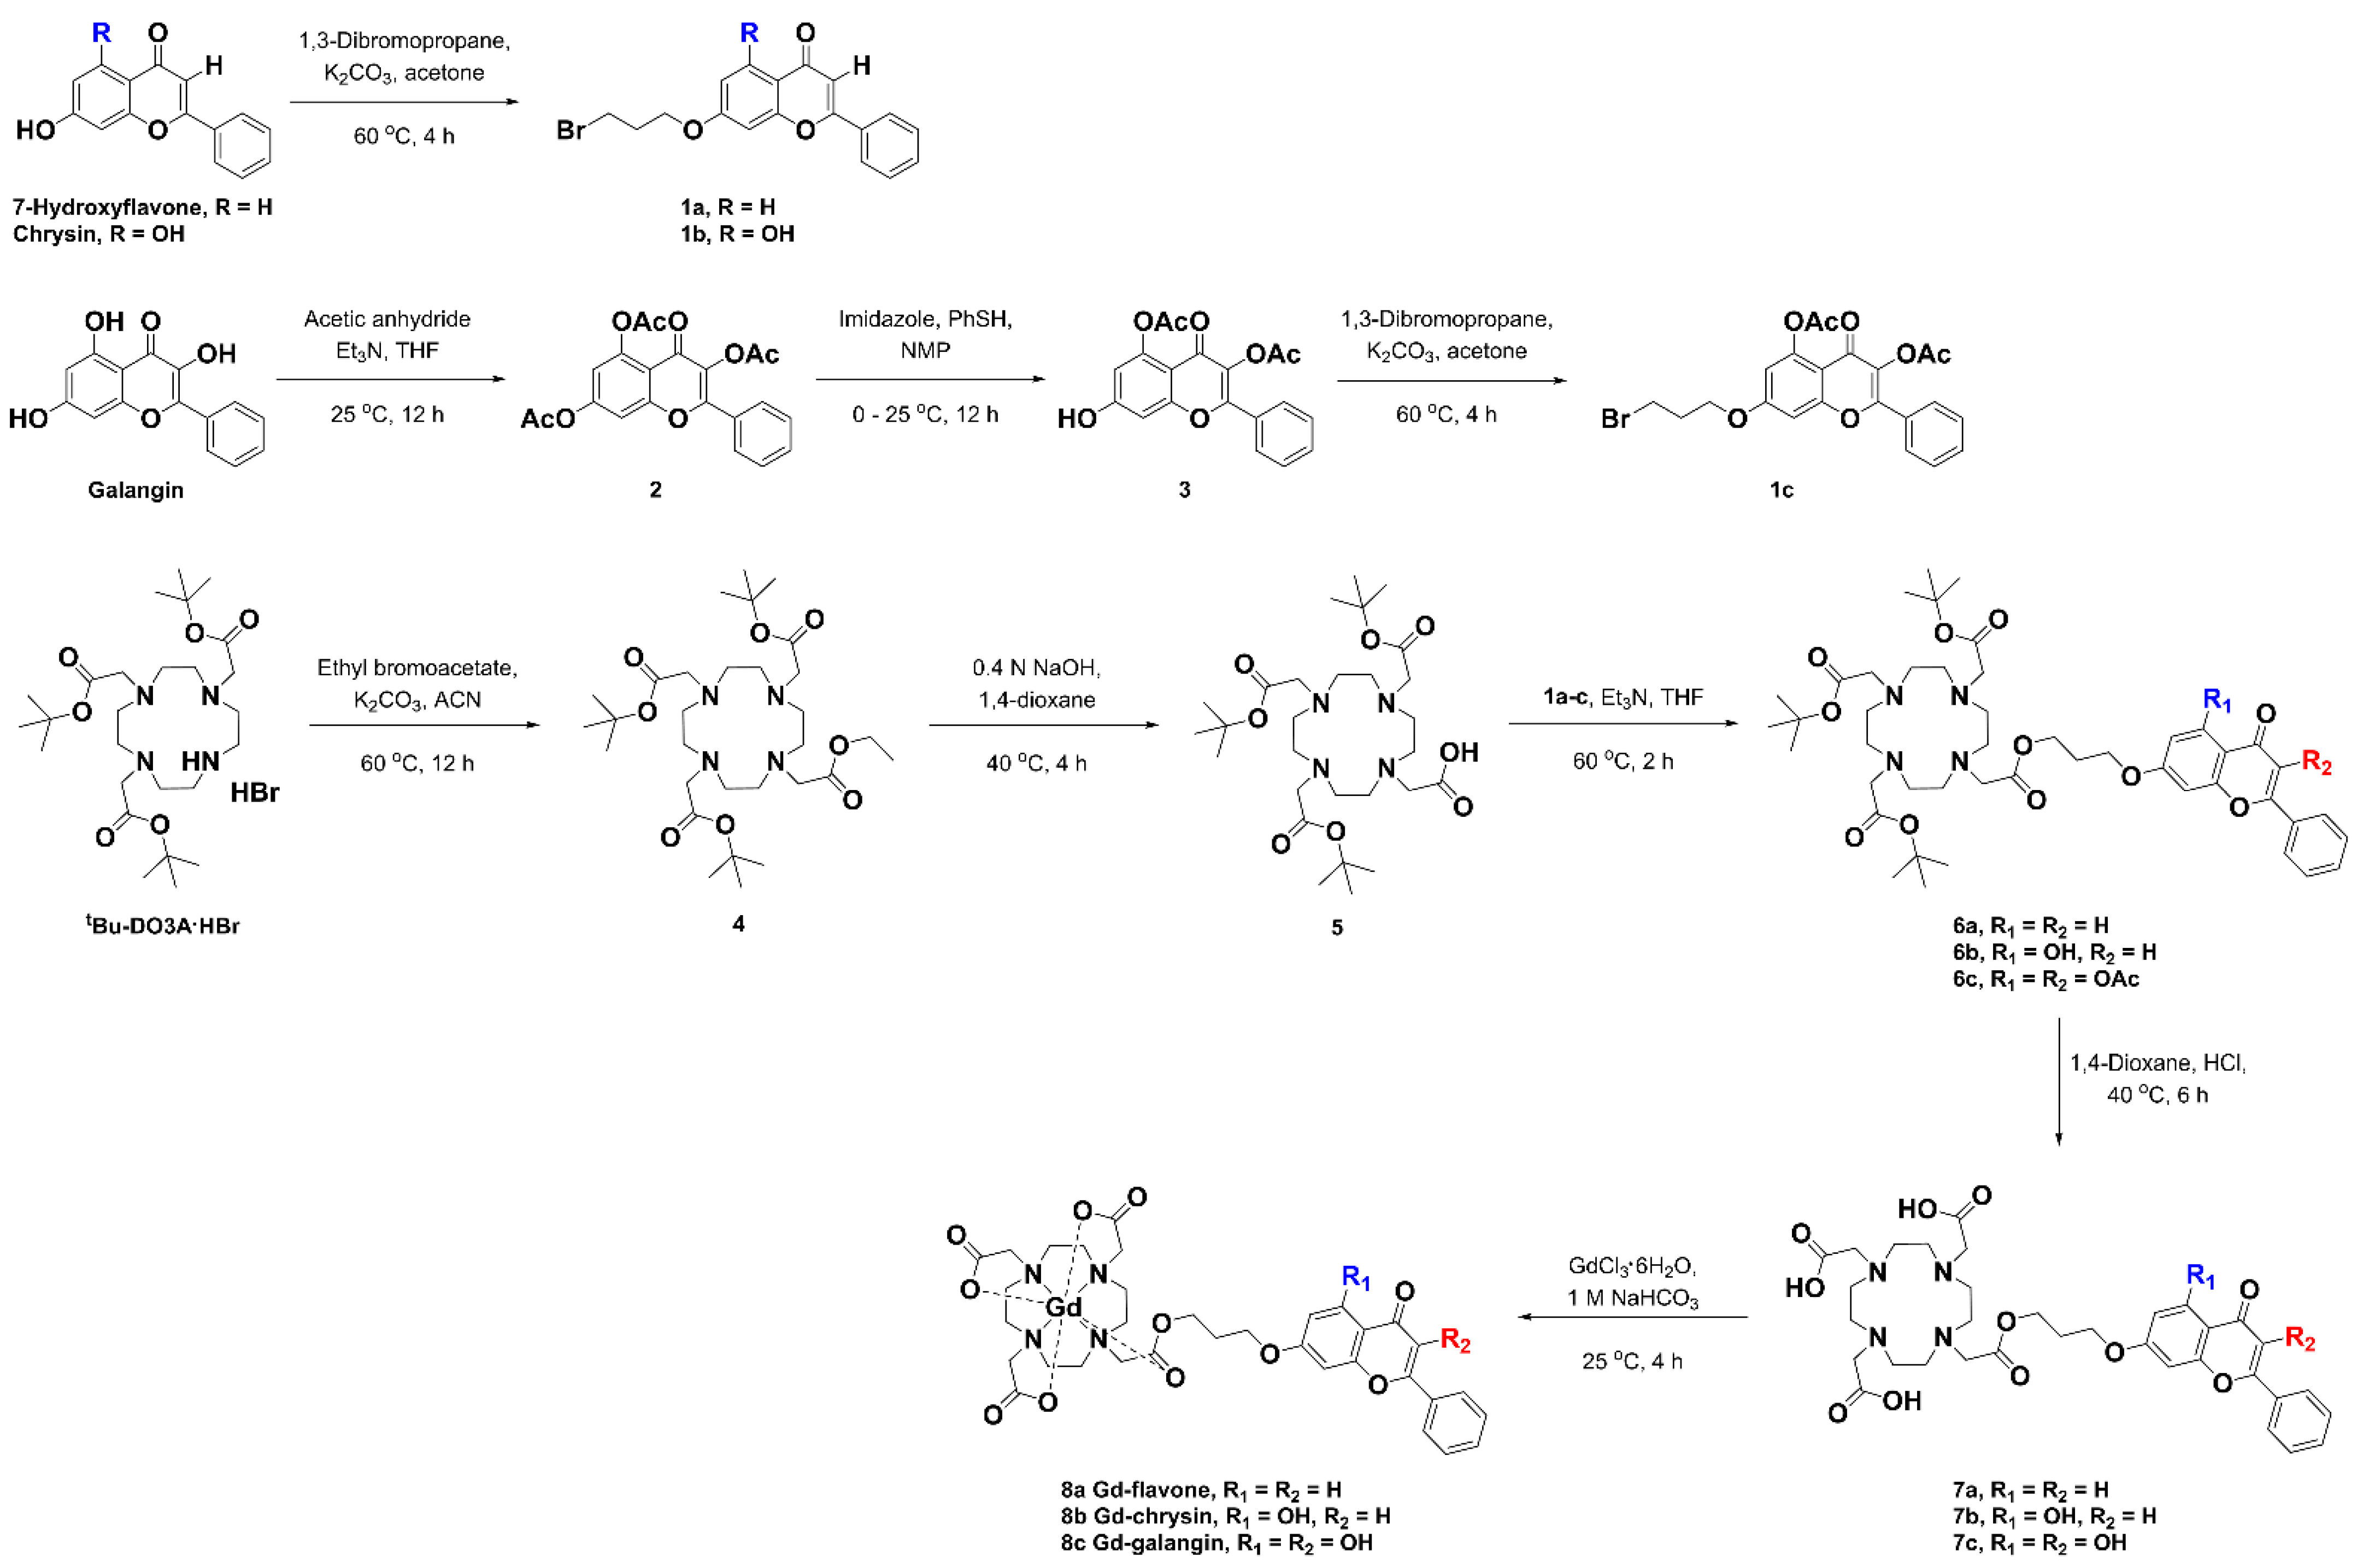
3.1. Synthesis
3.2. Physicochemical Characterization
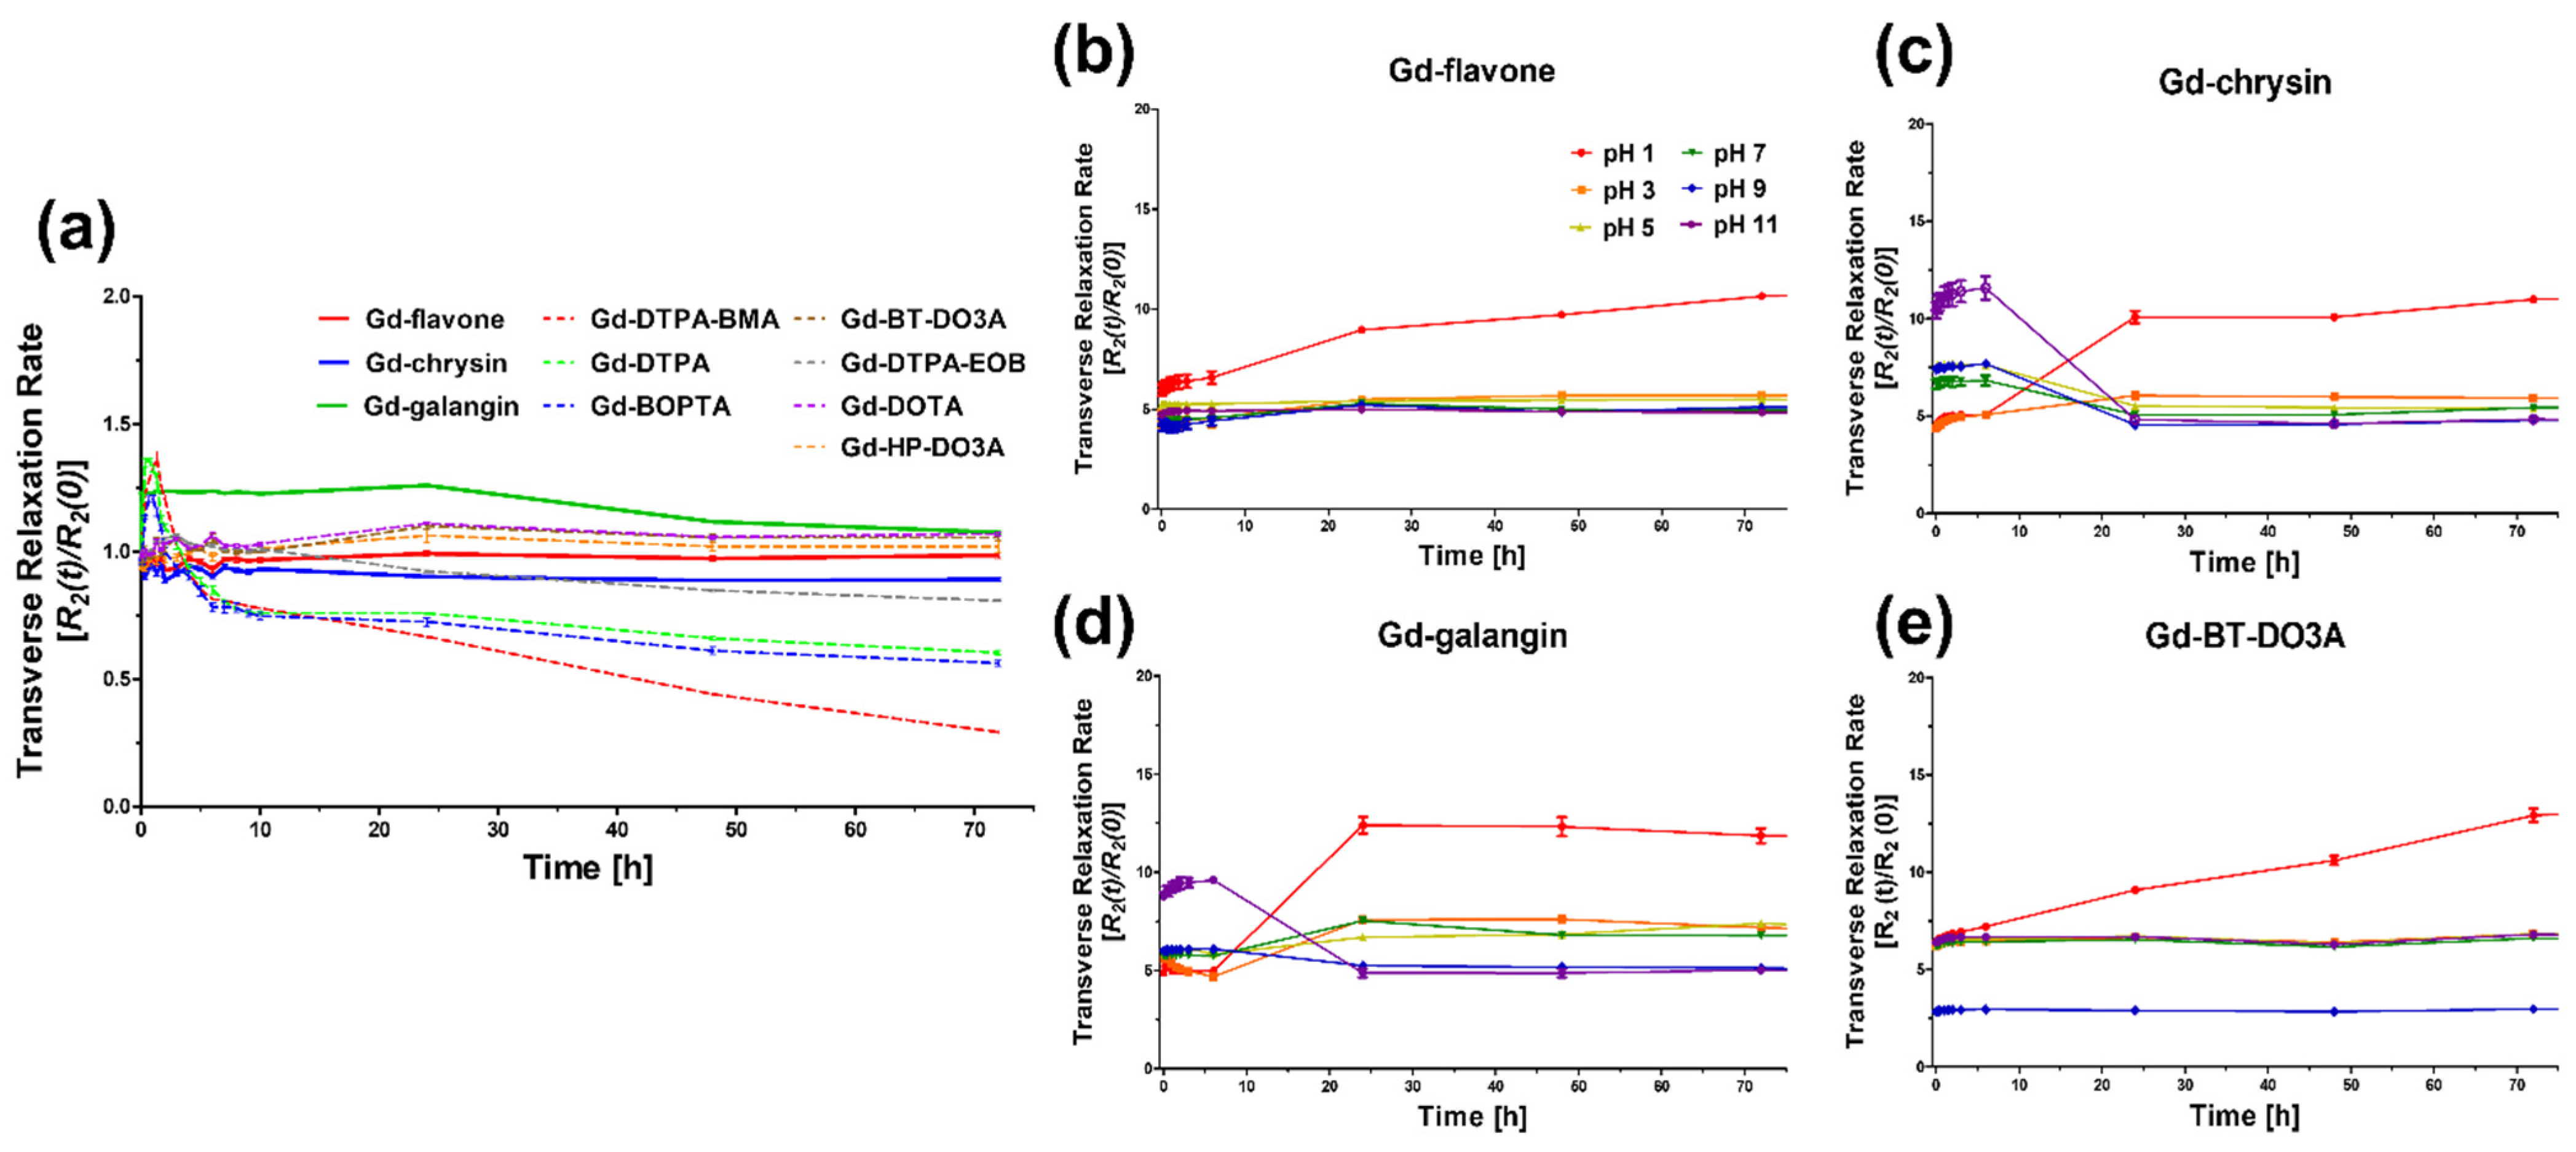
3.3. Kinetic Stability (Transmetalation Kinetics and pH Stability)
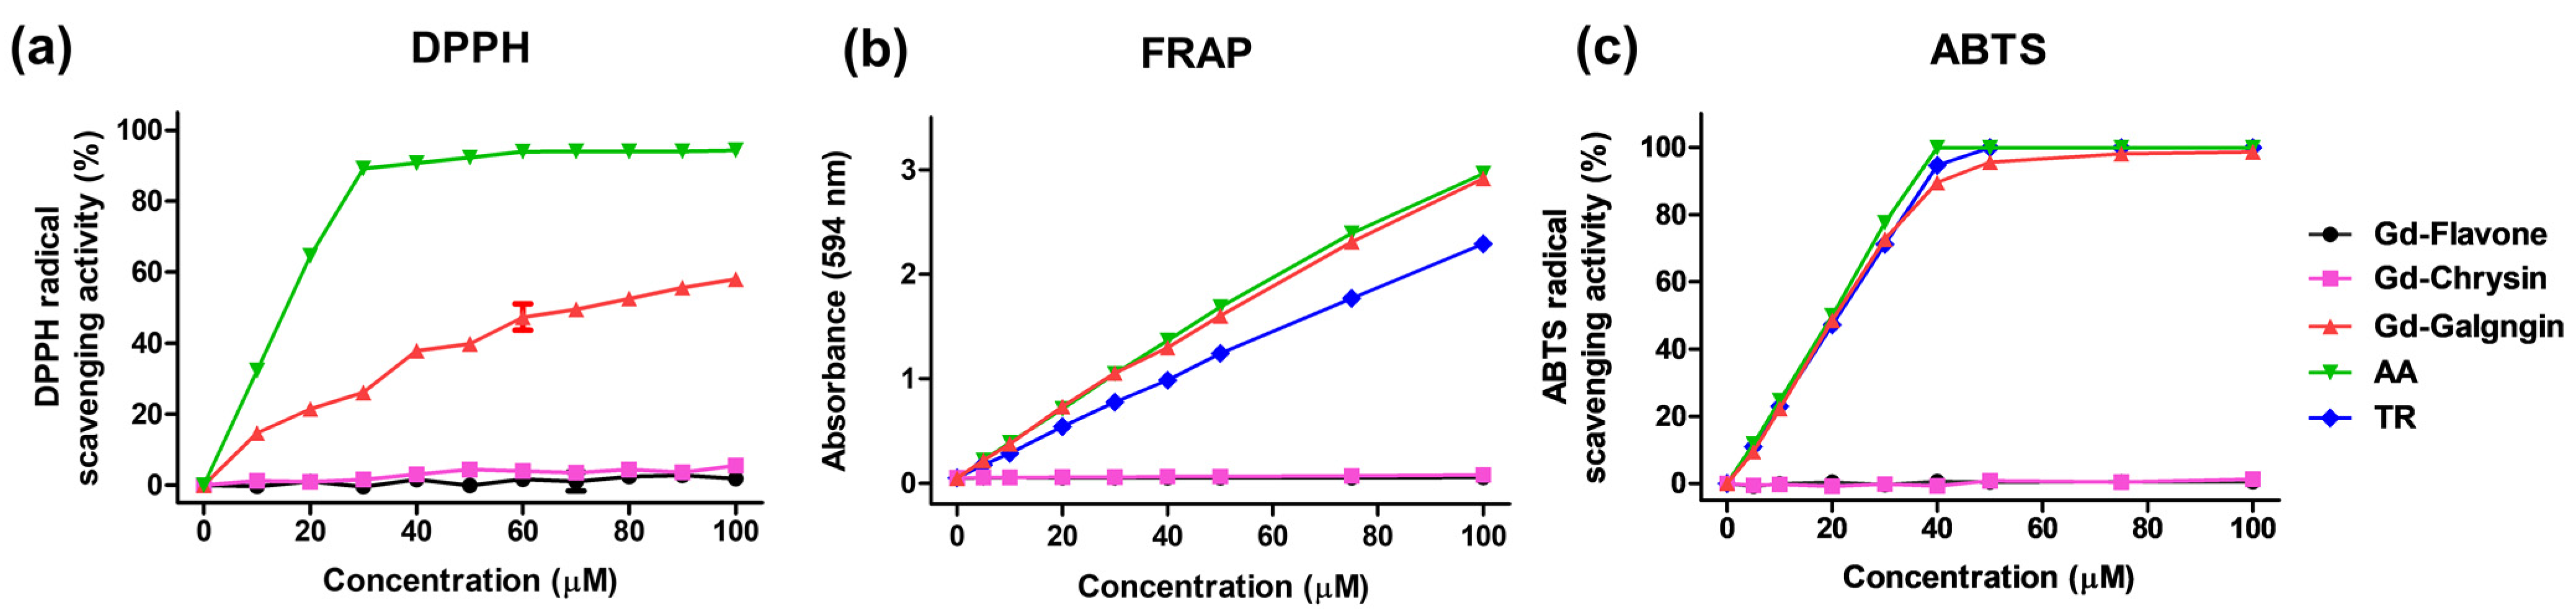
3.4. DPPH, FRAP, ABTS Free Radical Scavenging Activity
3.5. In Vitro Cell Toxicity
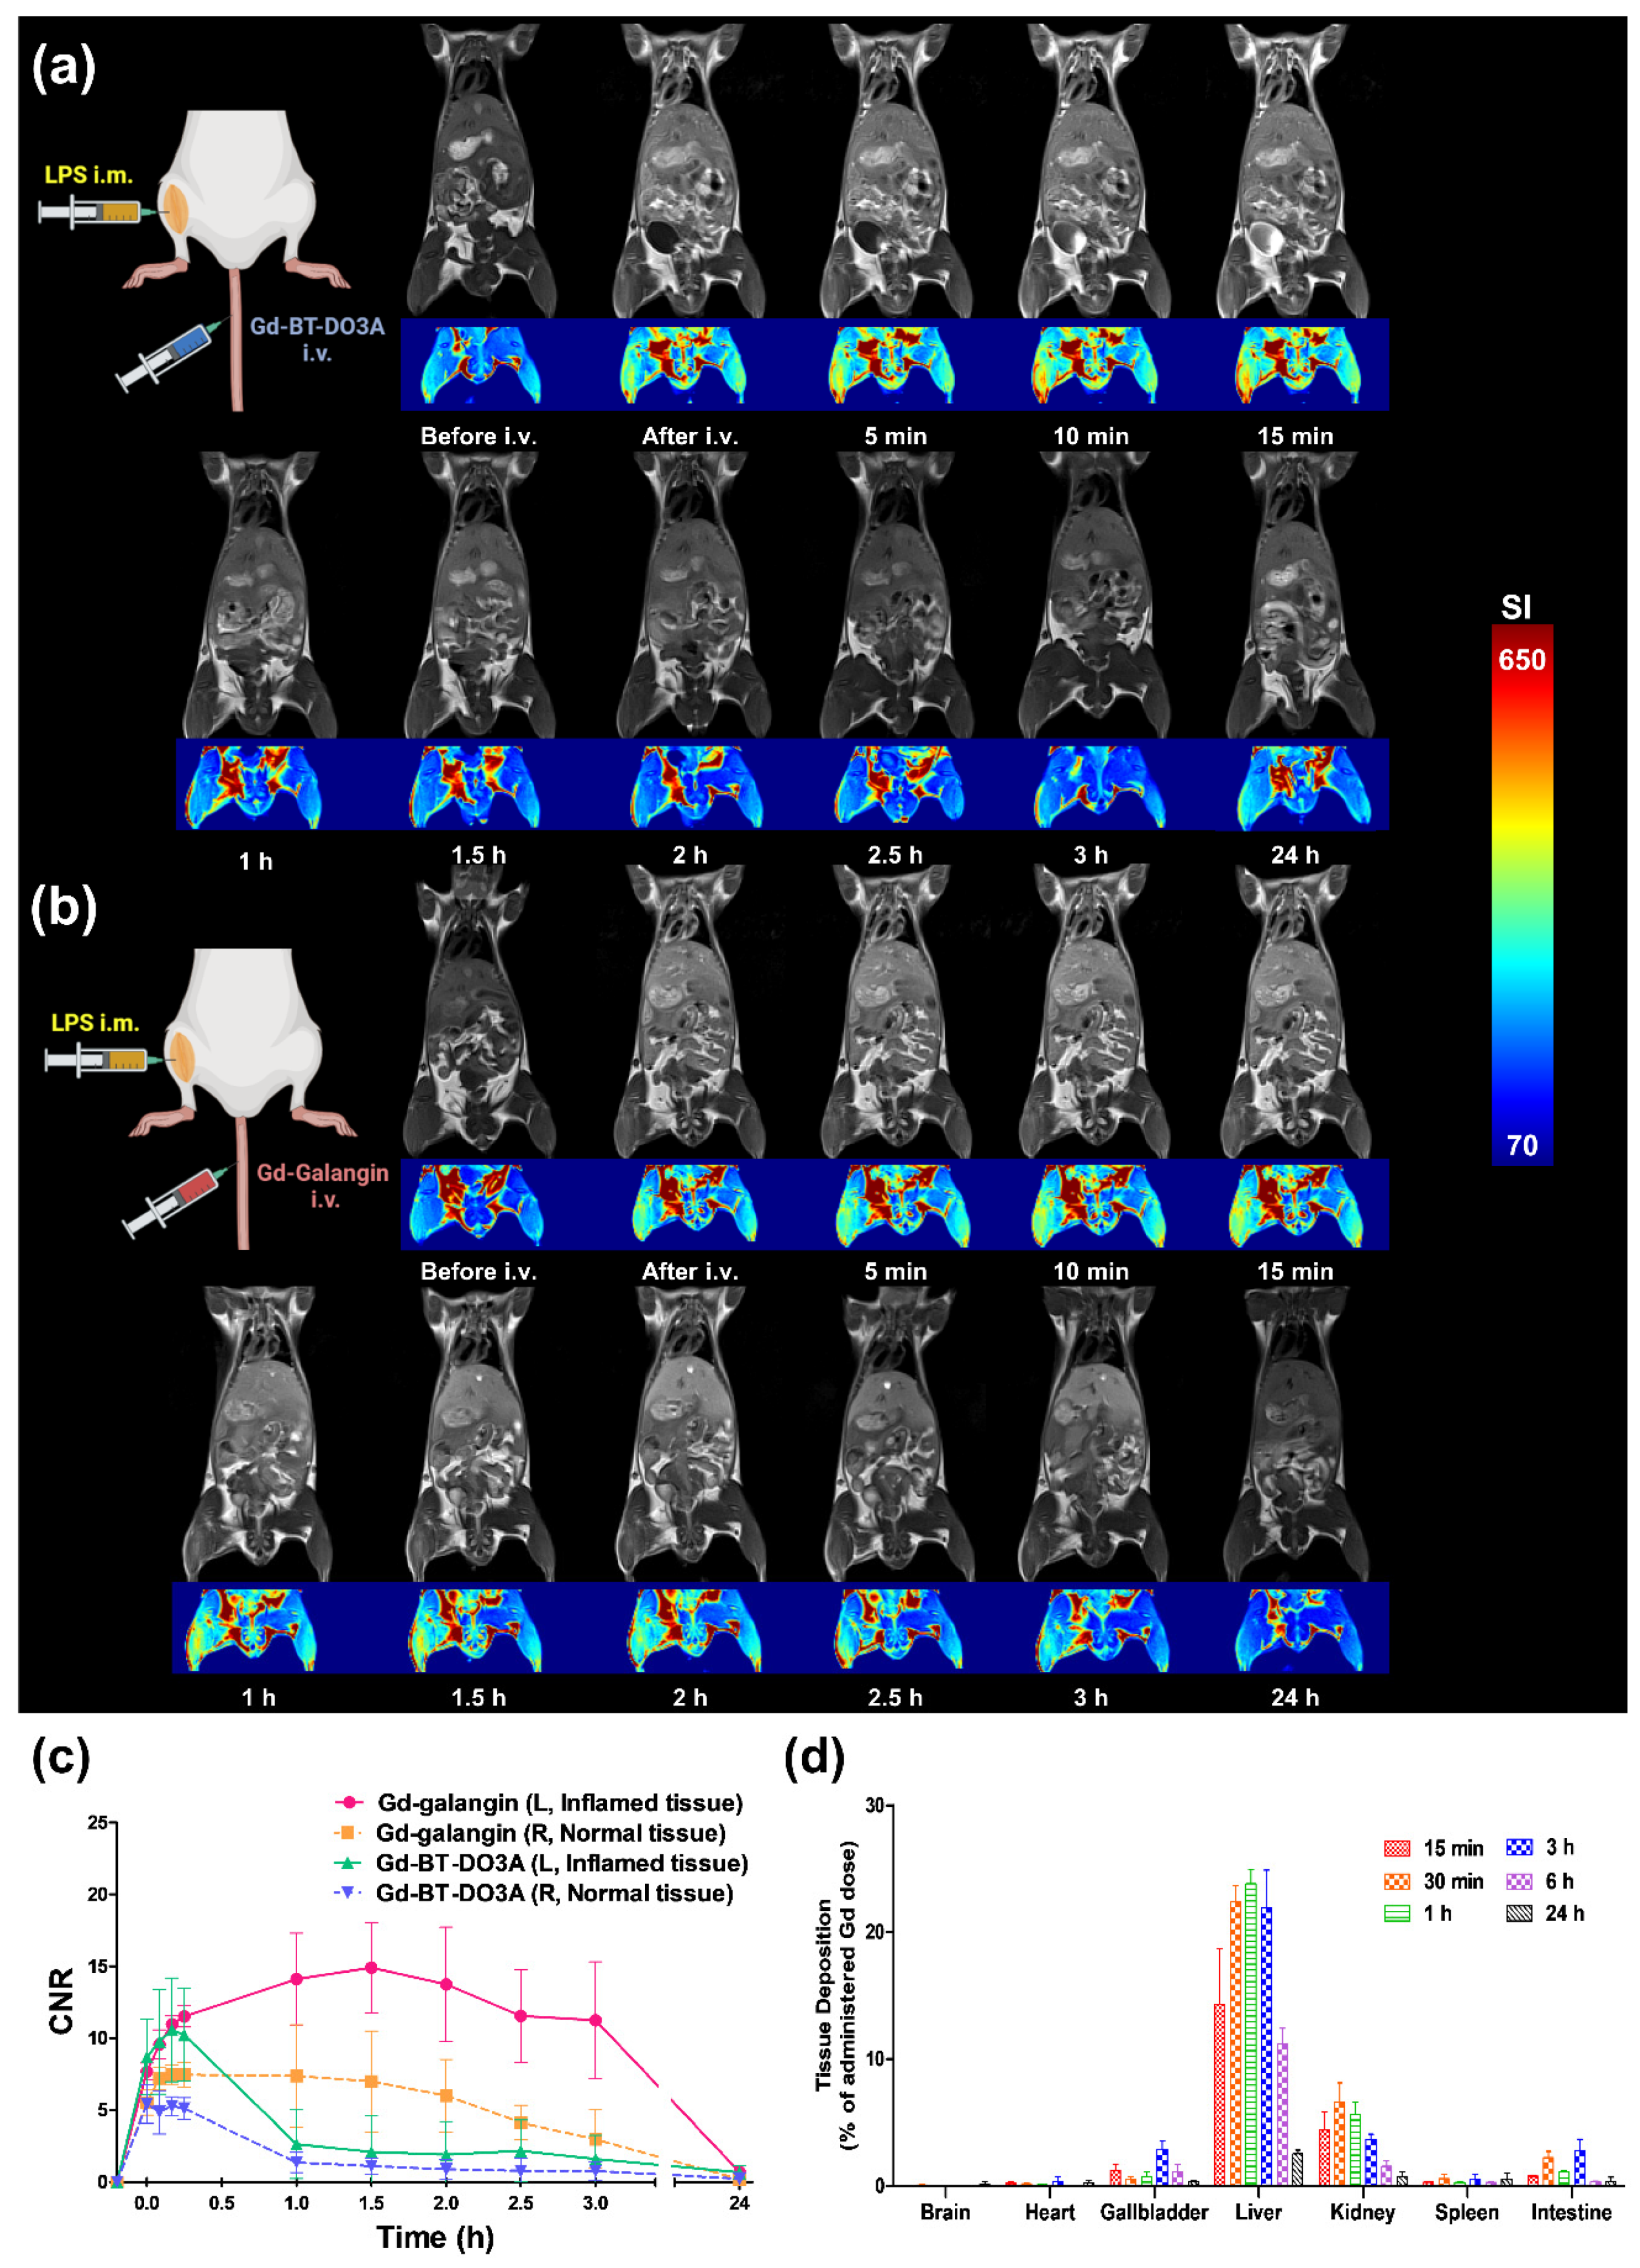
3.6. In Vivo Elvaluation of MR Diagnosic Target in Inflammatoion
3.7. In Vivo Evaluation of ROS Scavenging Affinity
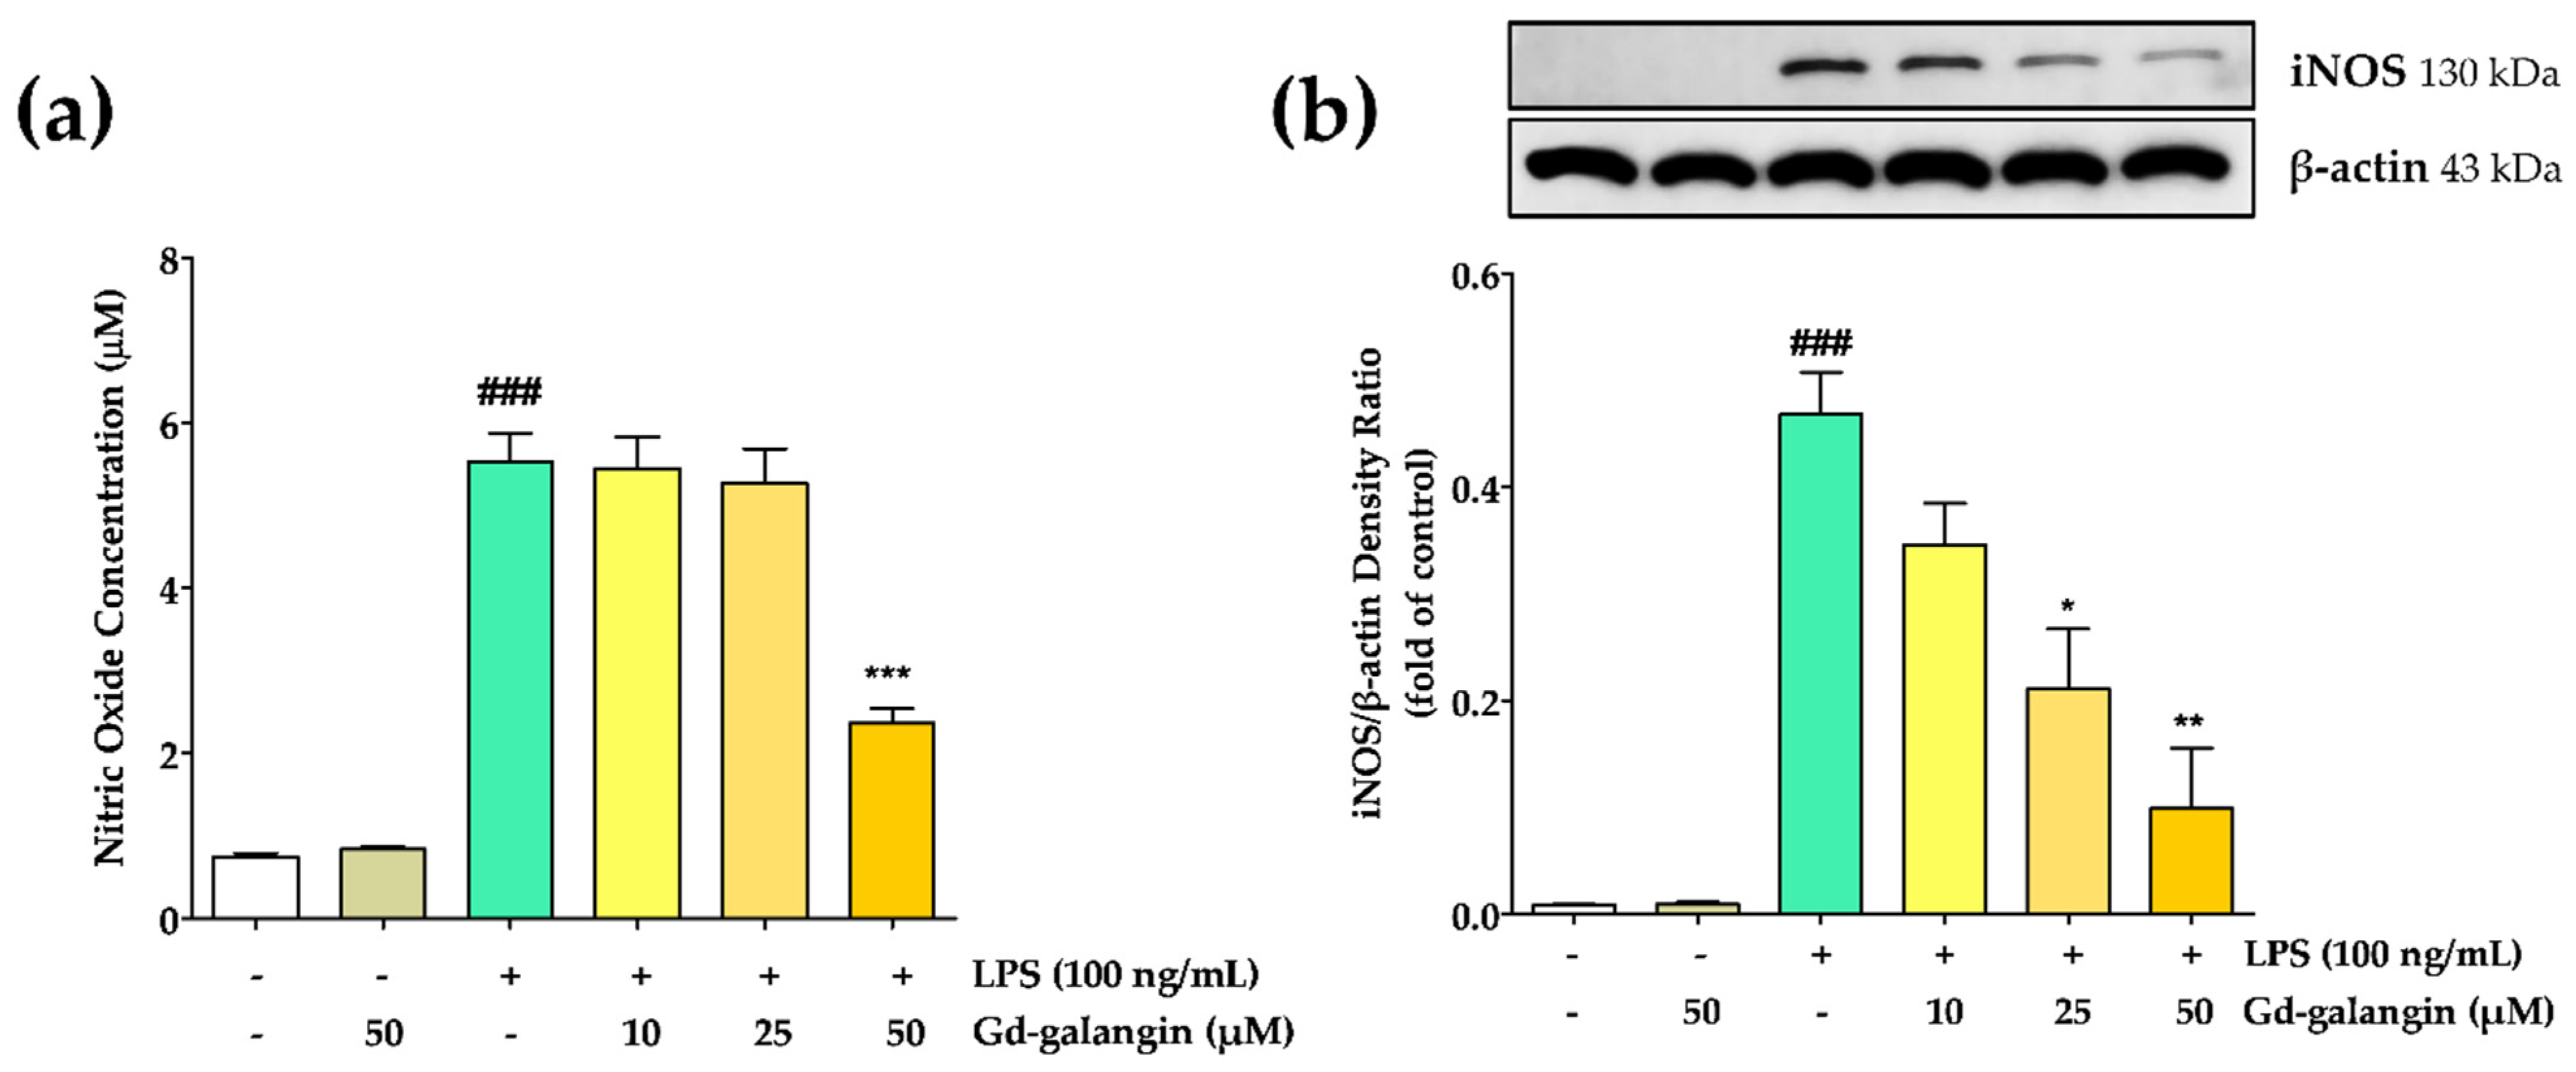
3.8. Effect of Gd-Galangin on LPS-Induced NO Production and iNOS Inhibition
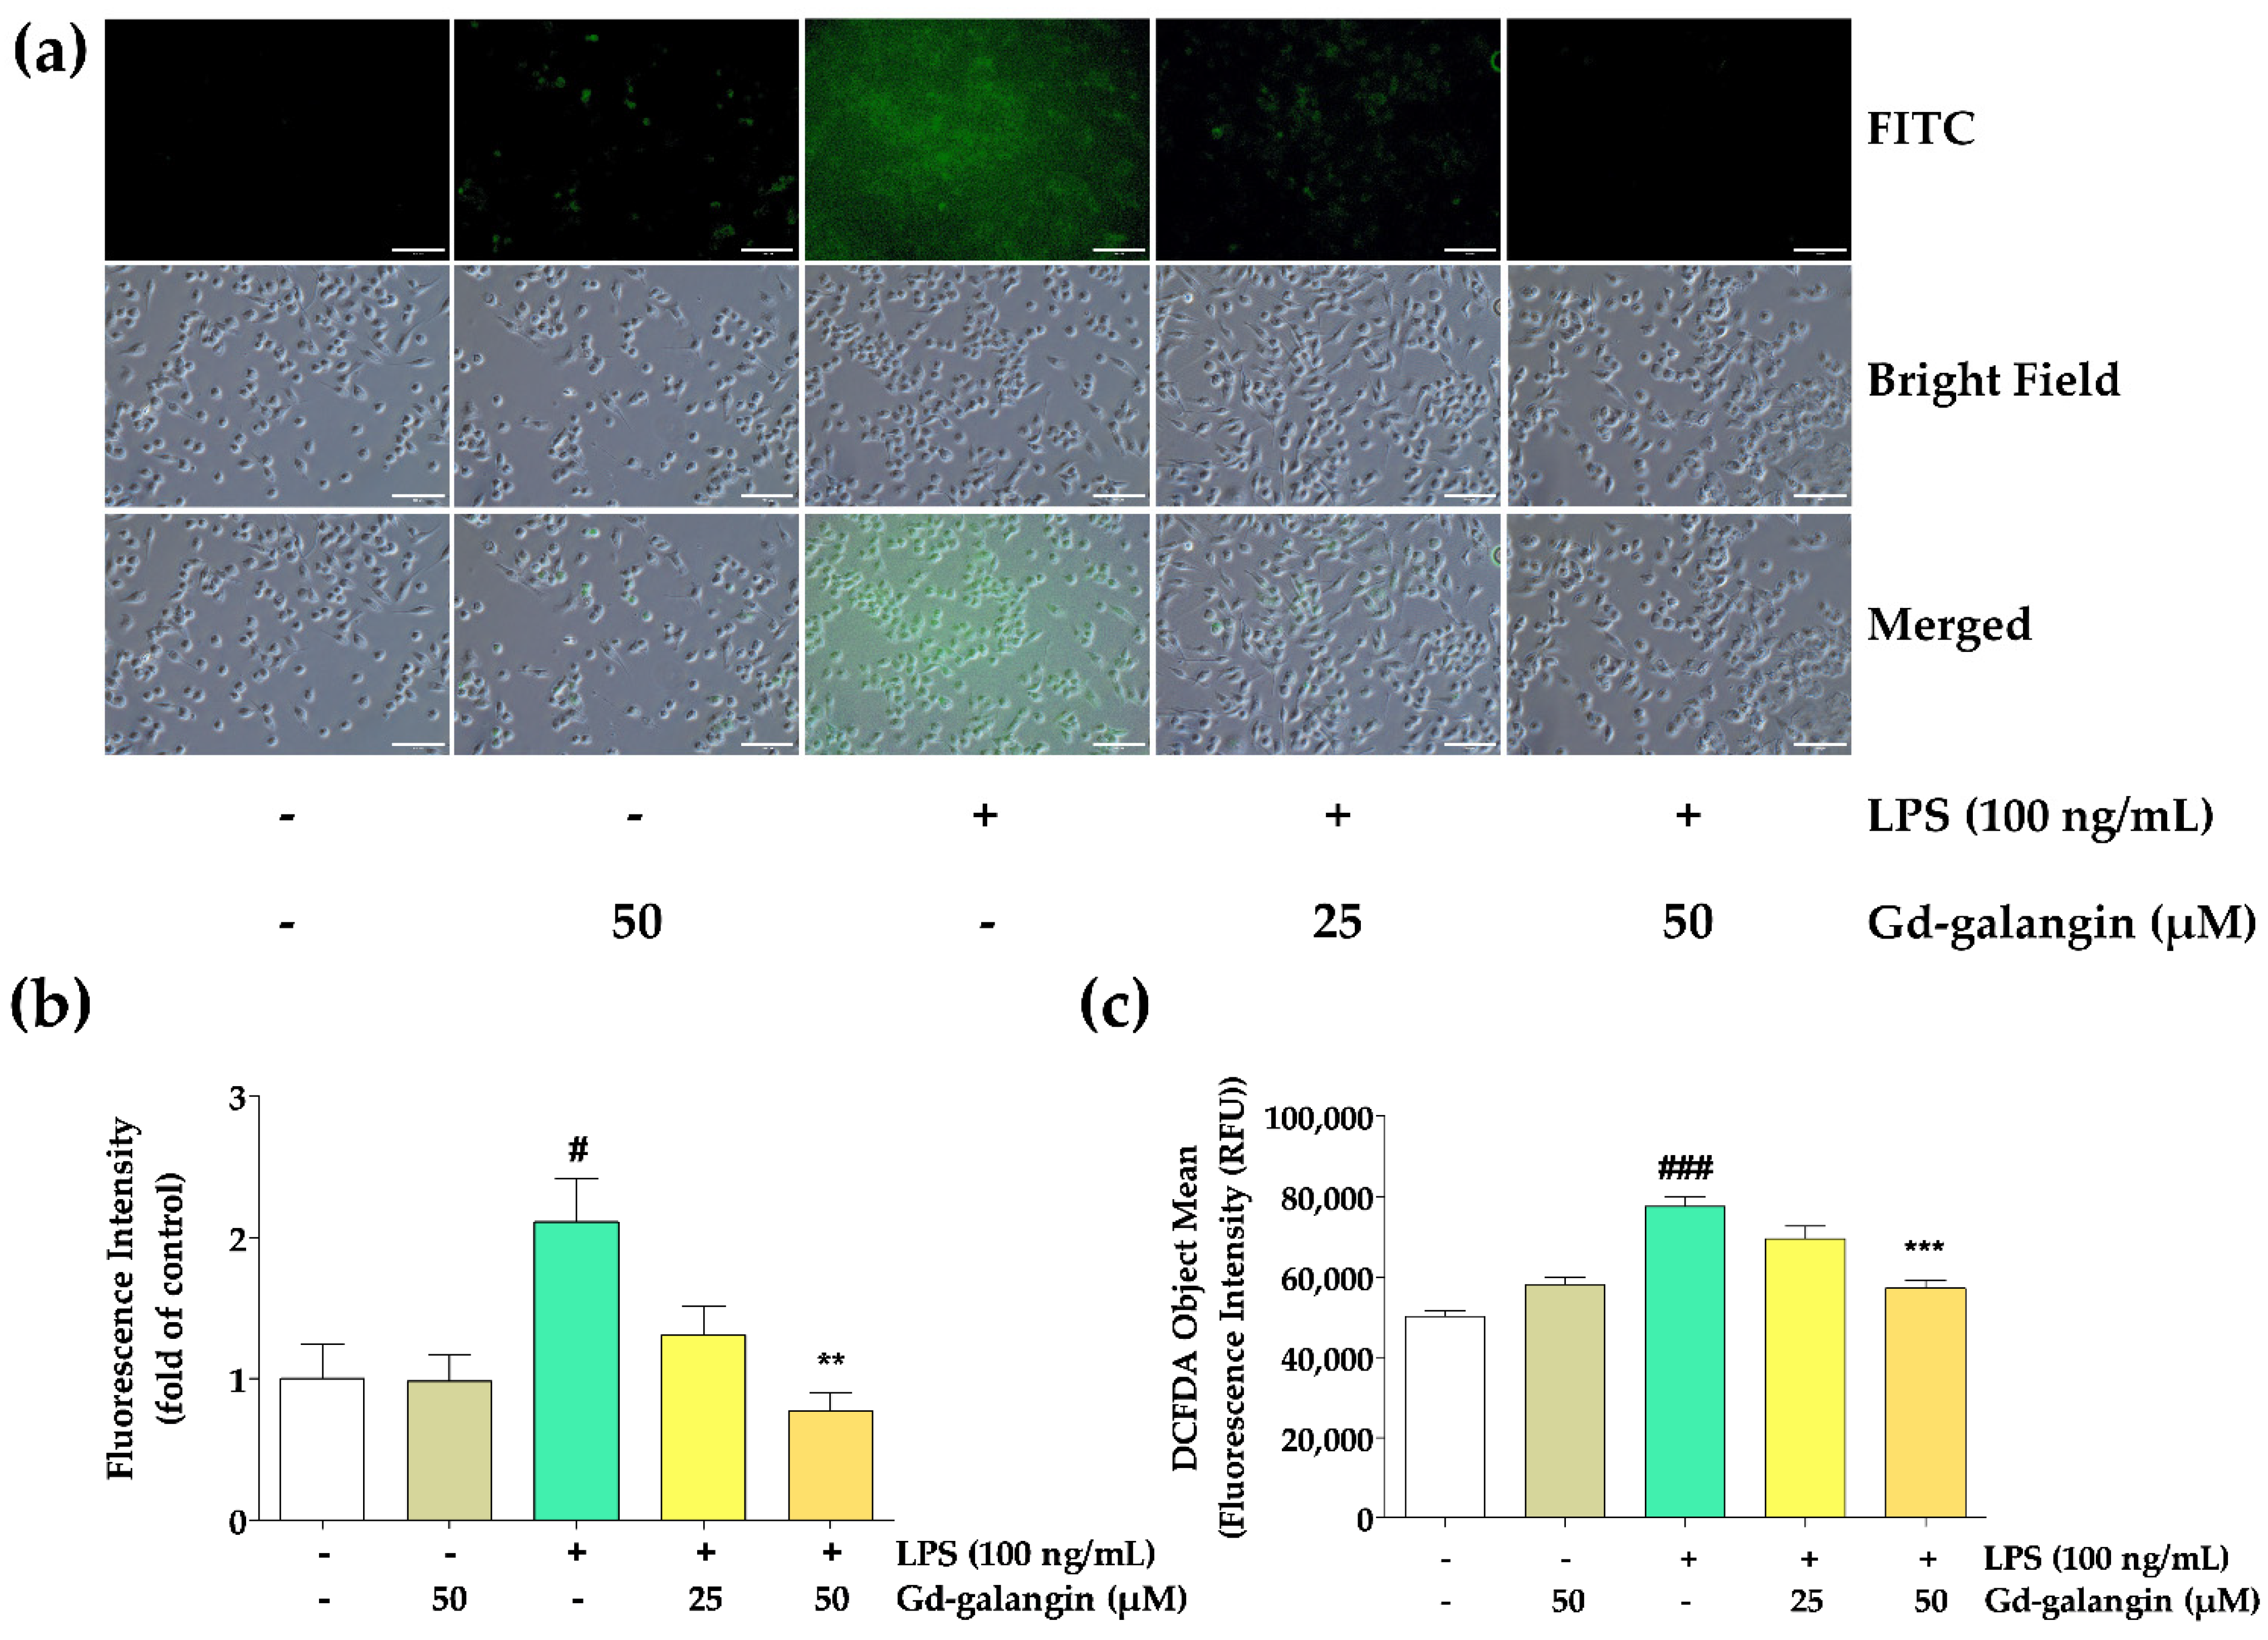
3.9. ROS Scavenging Effect of Gd-Galangin
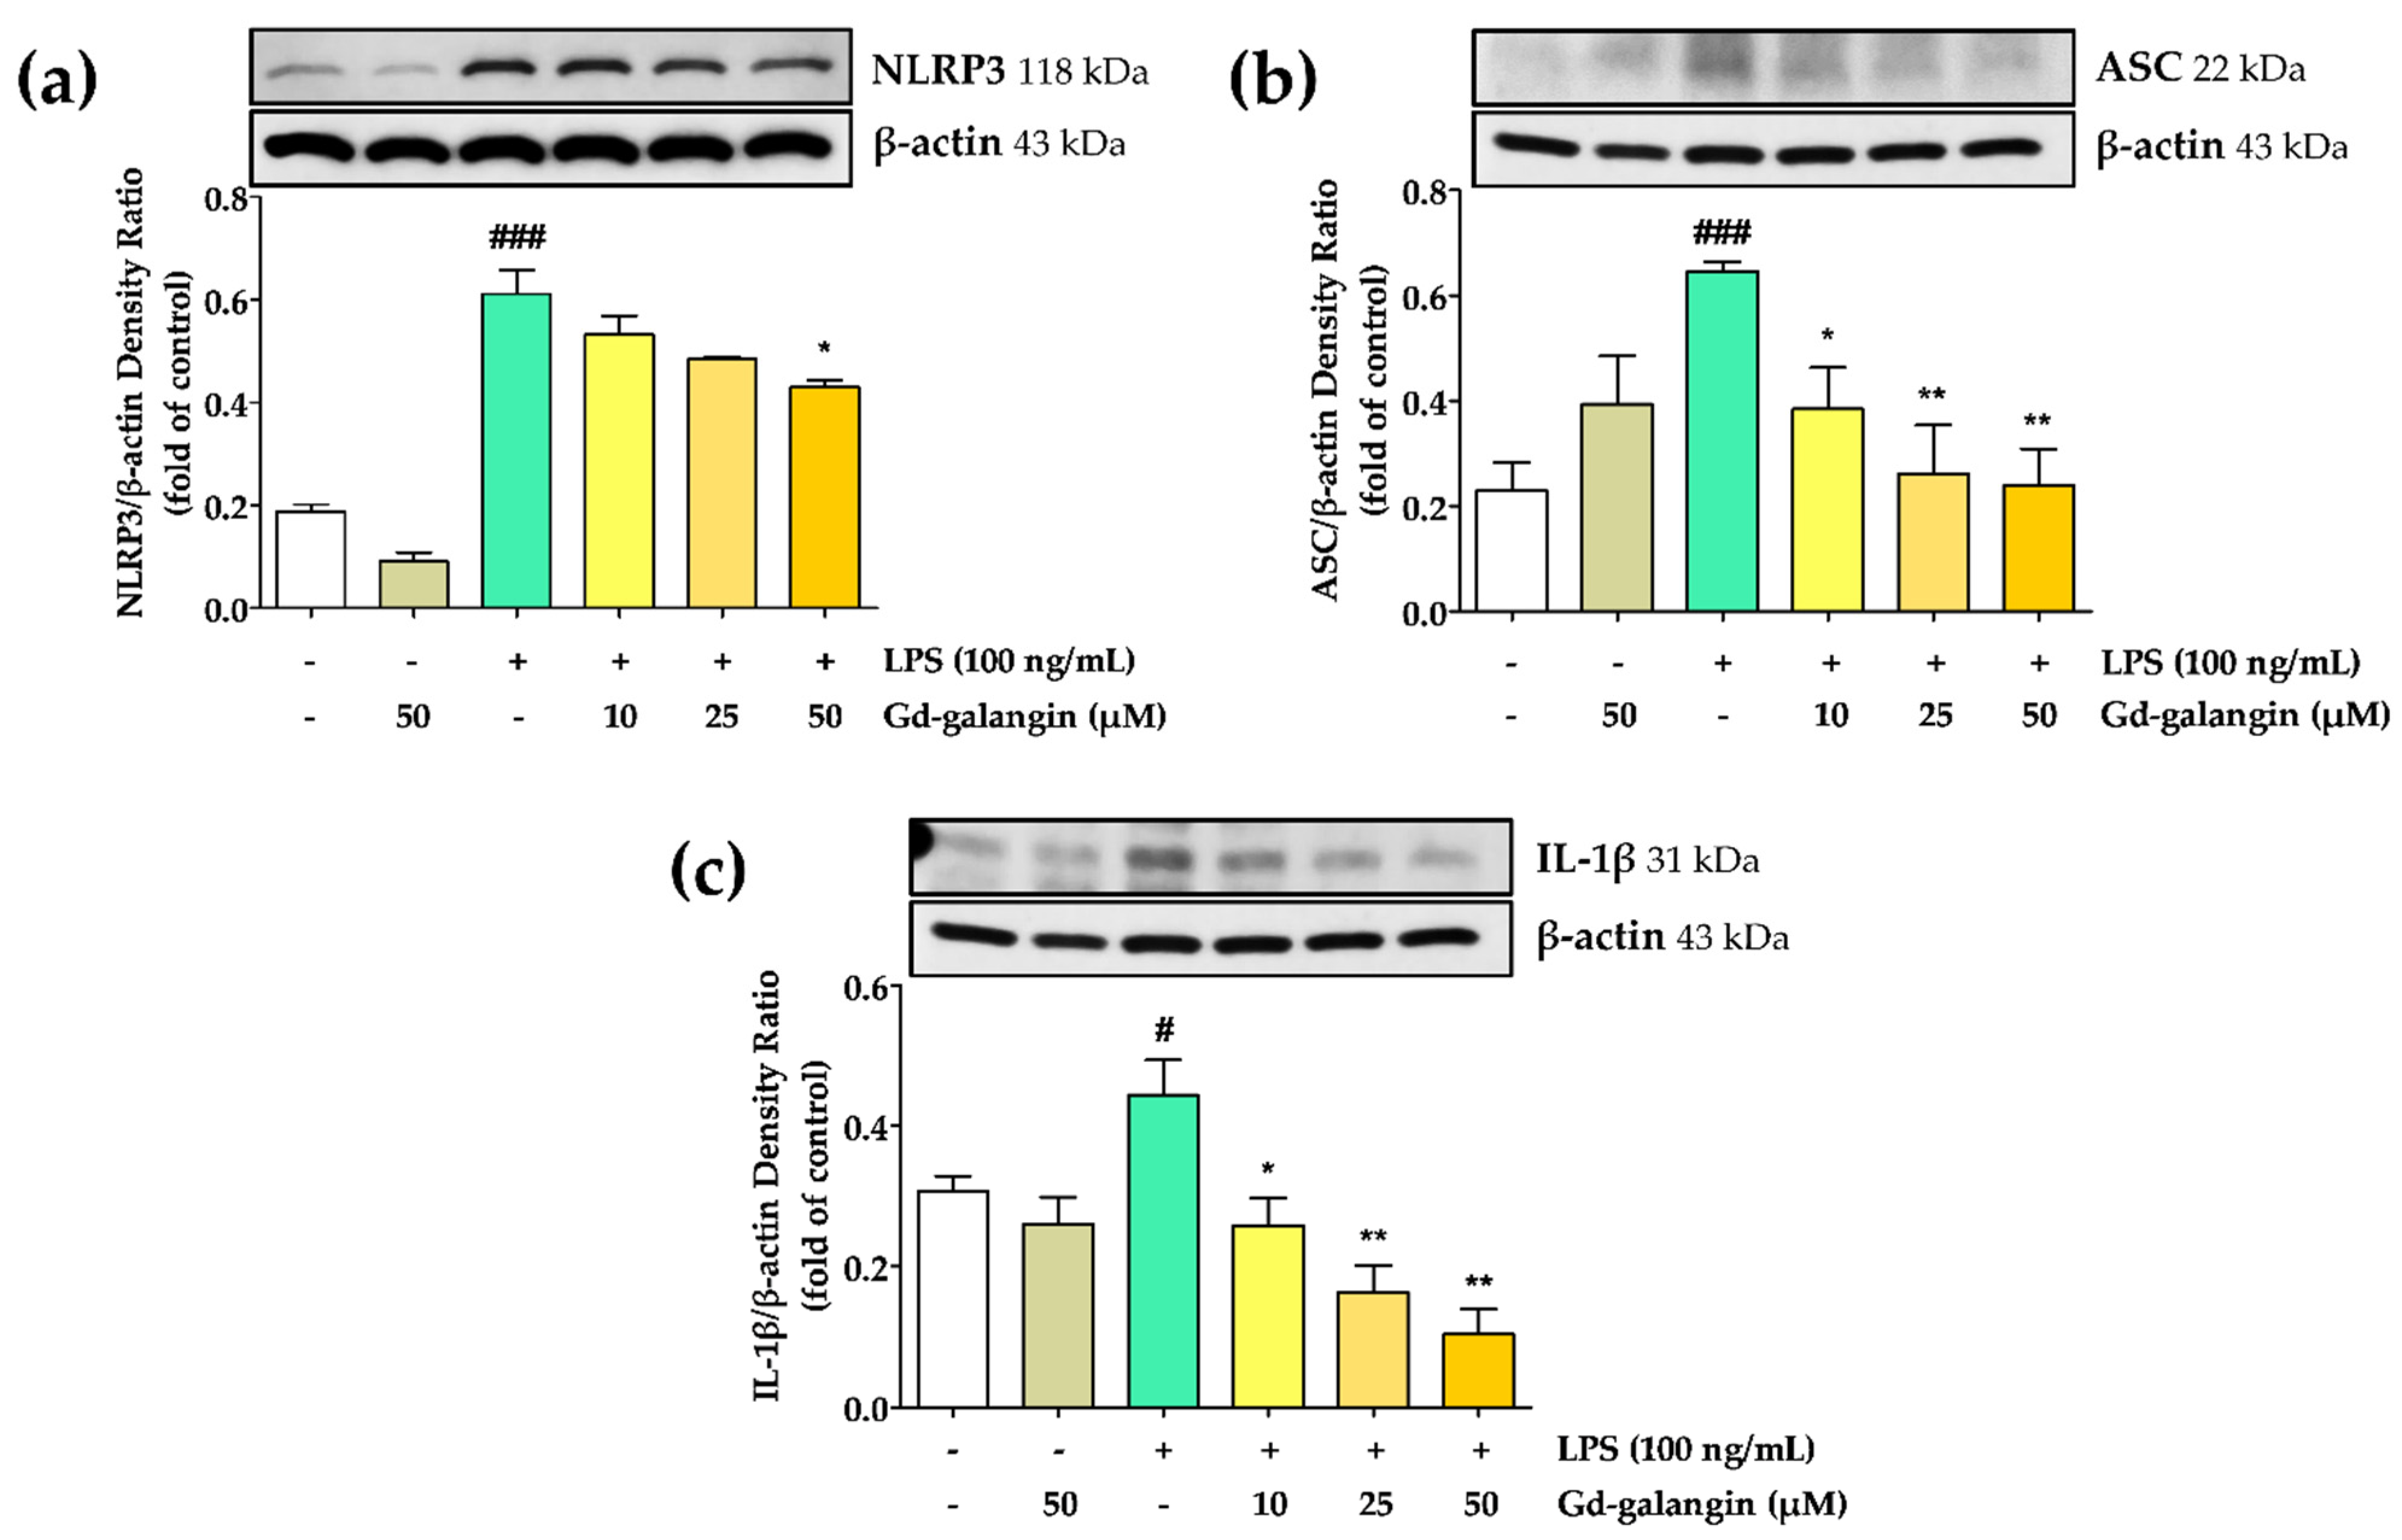
3.10. Anti-Inflammatory Effect of Gd-Galangin
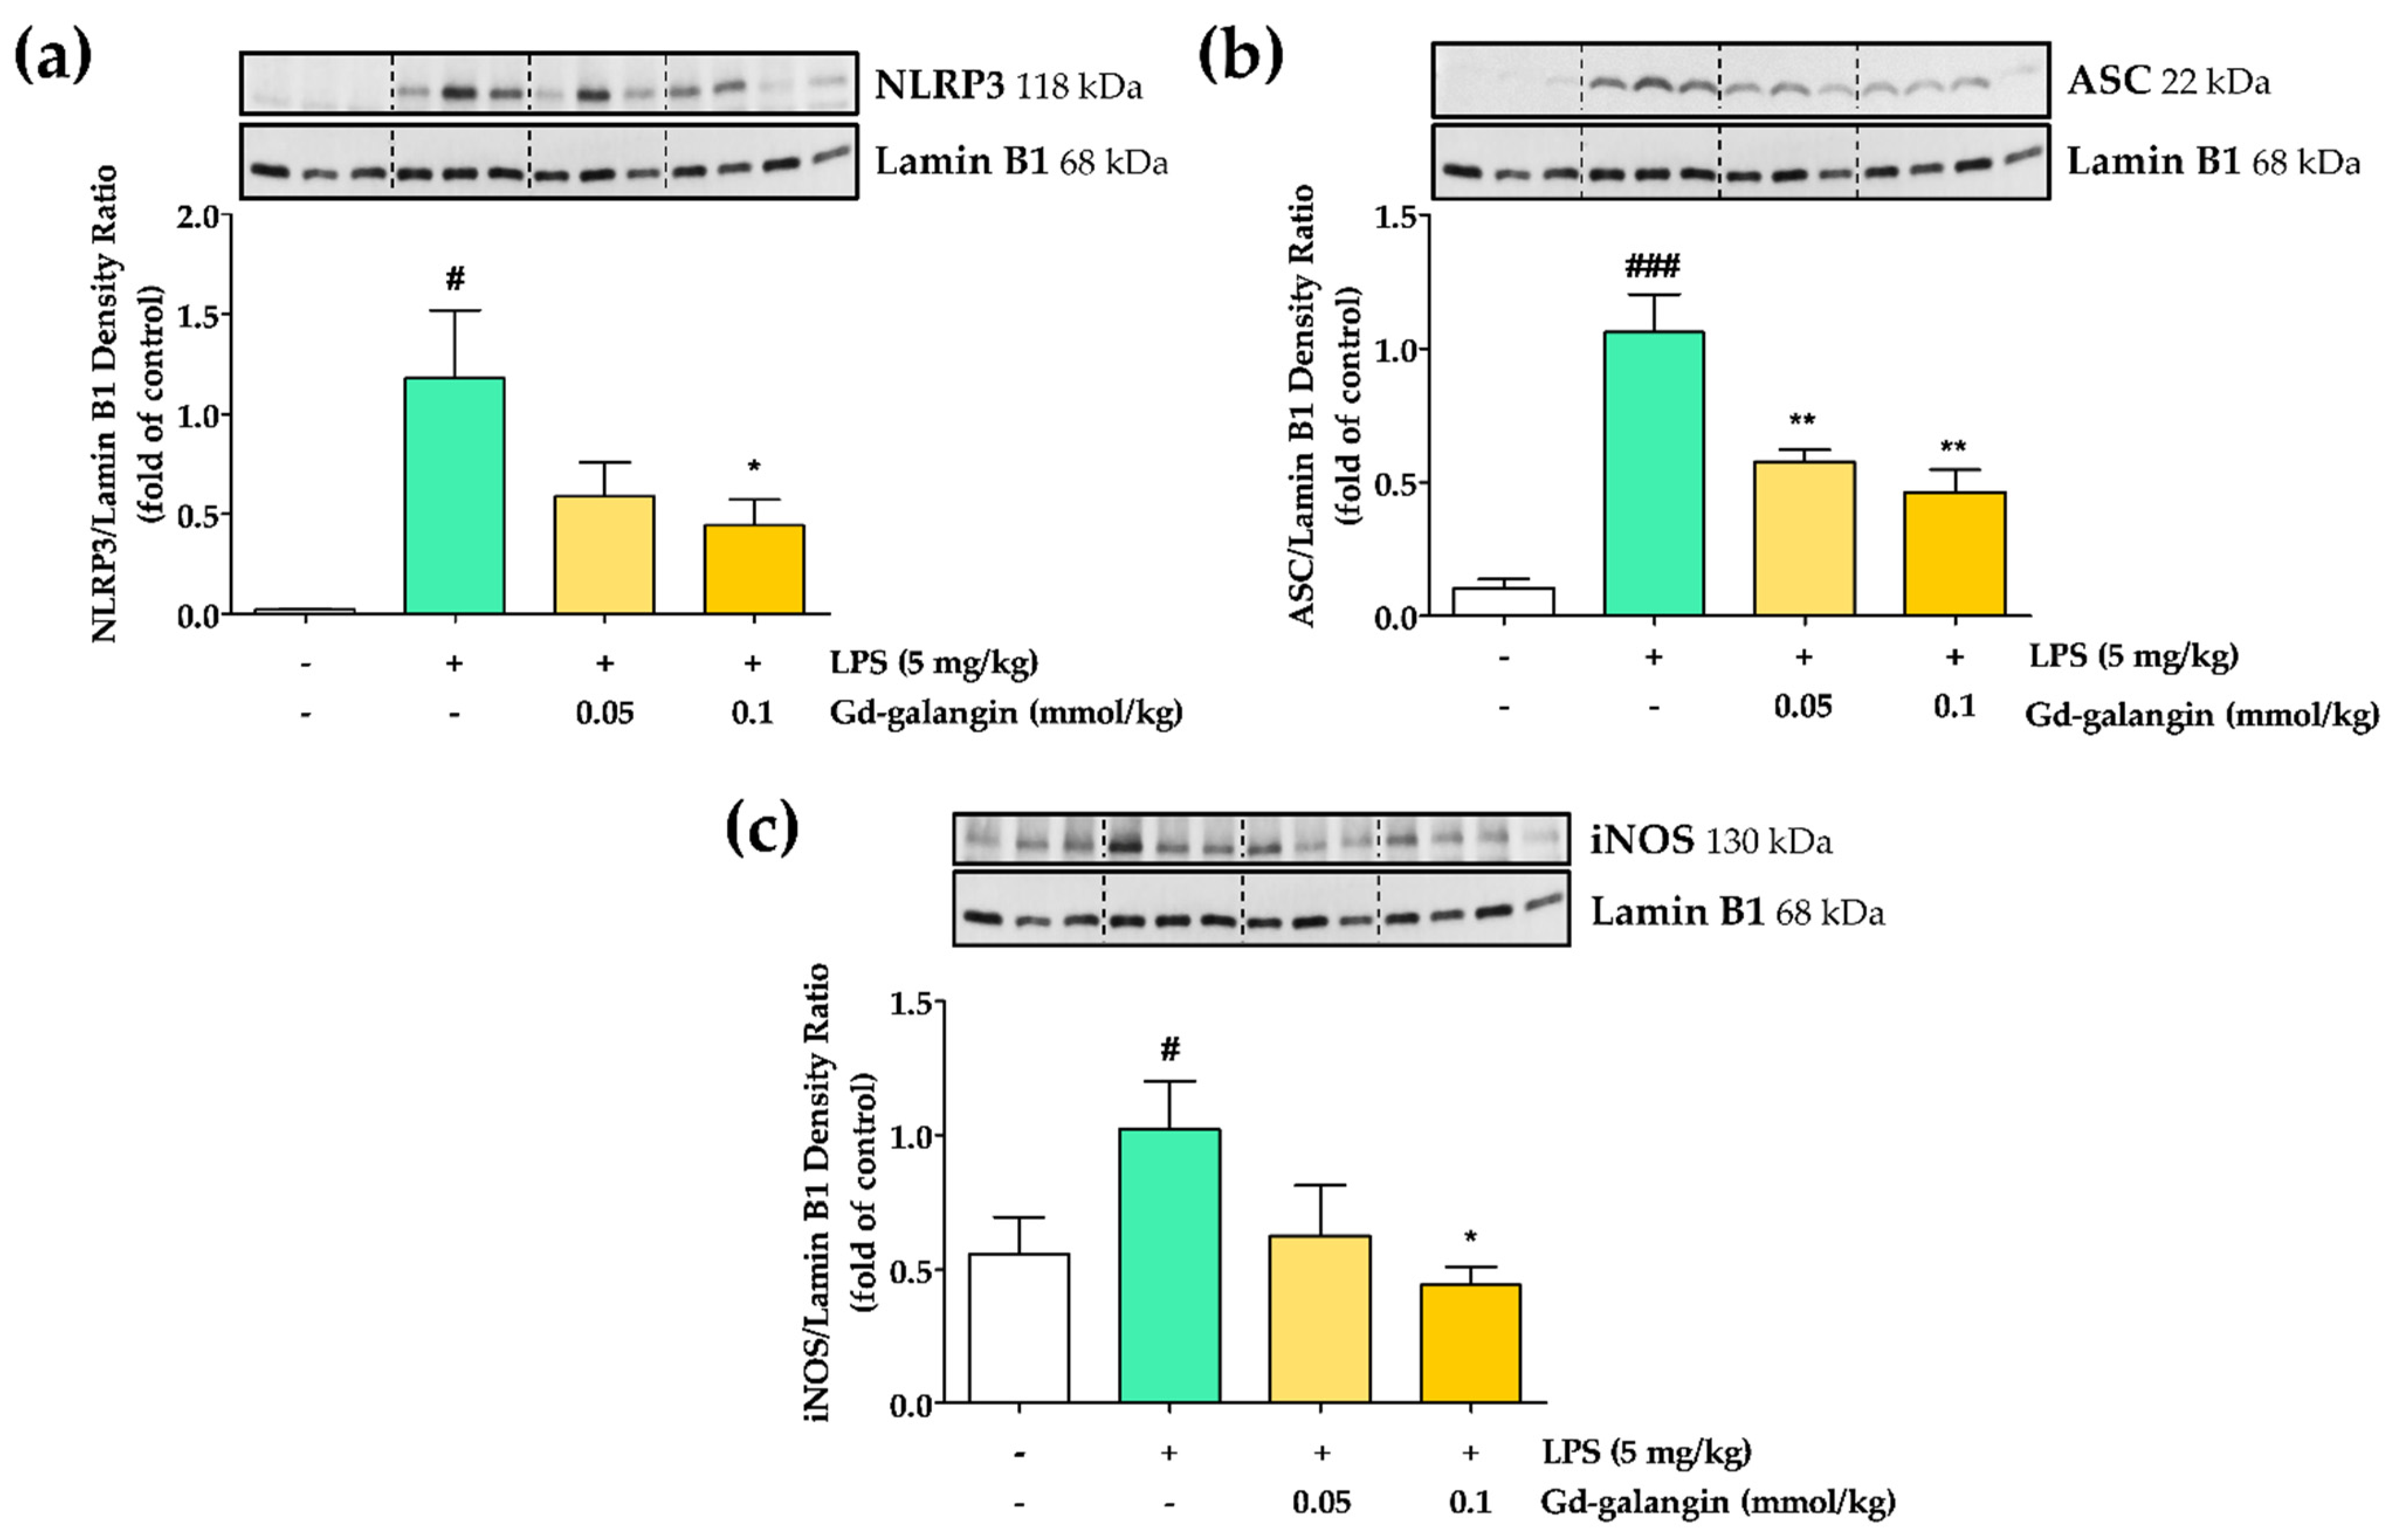
3.11. In Vivo Anti-Inflammatory Effect of Gd-Galangin
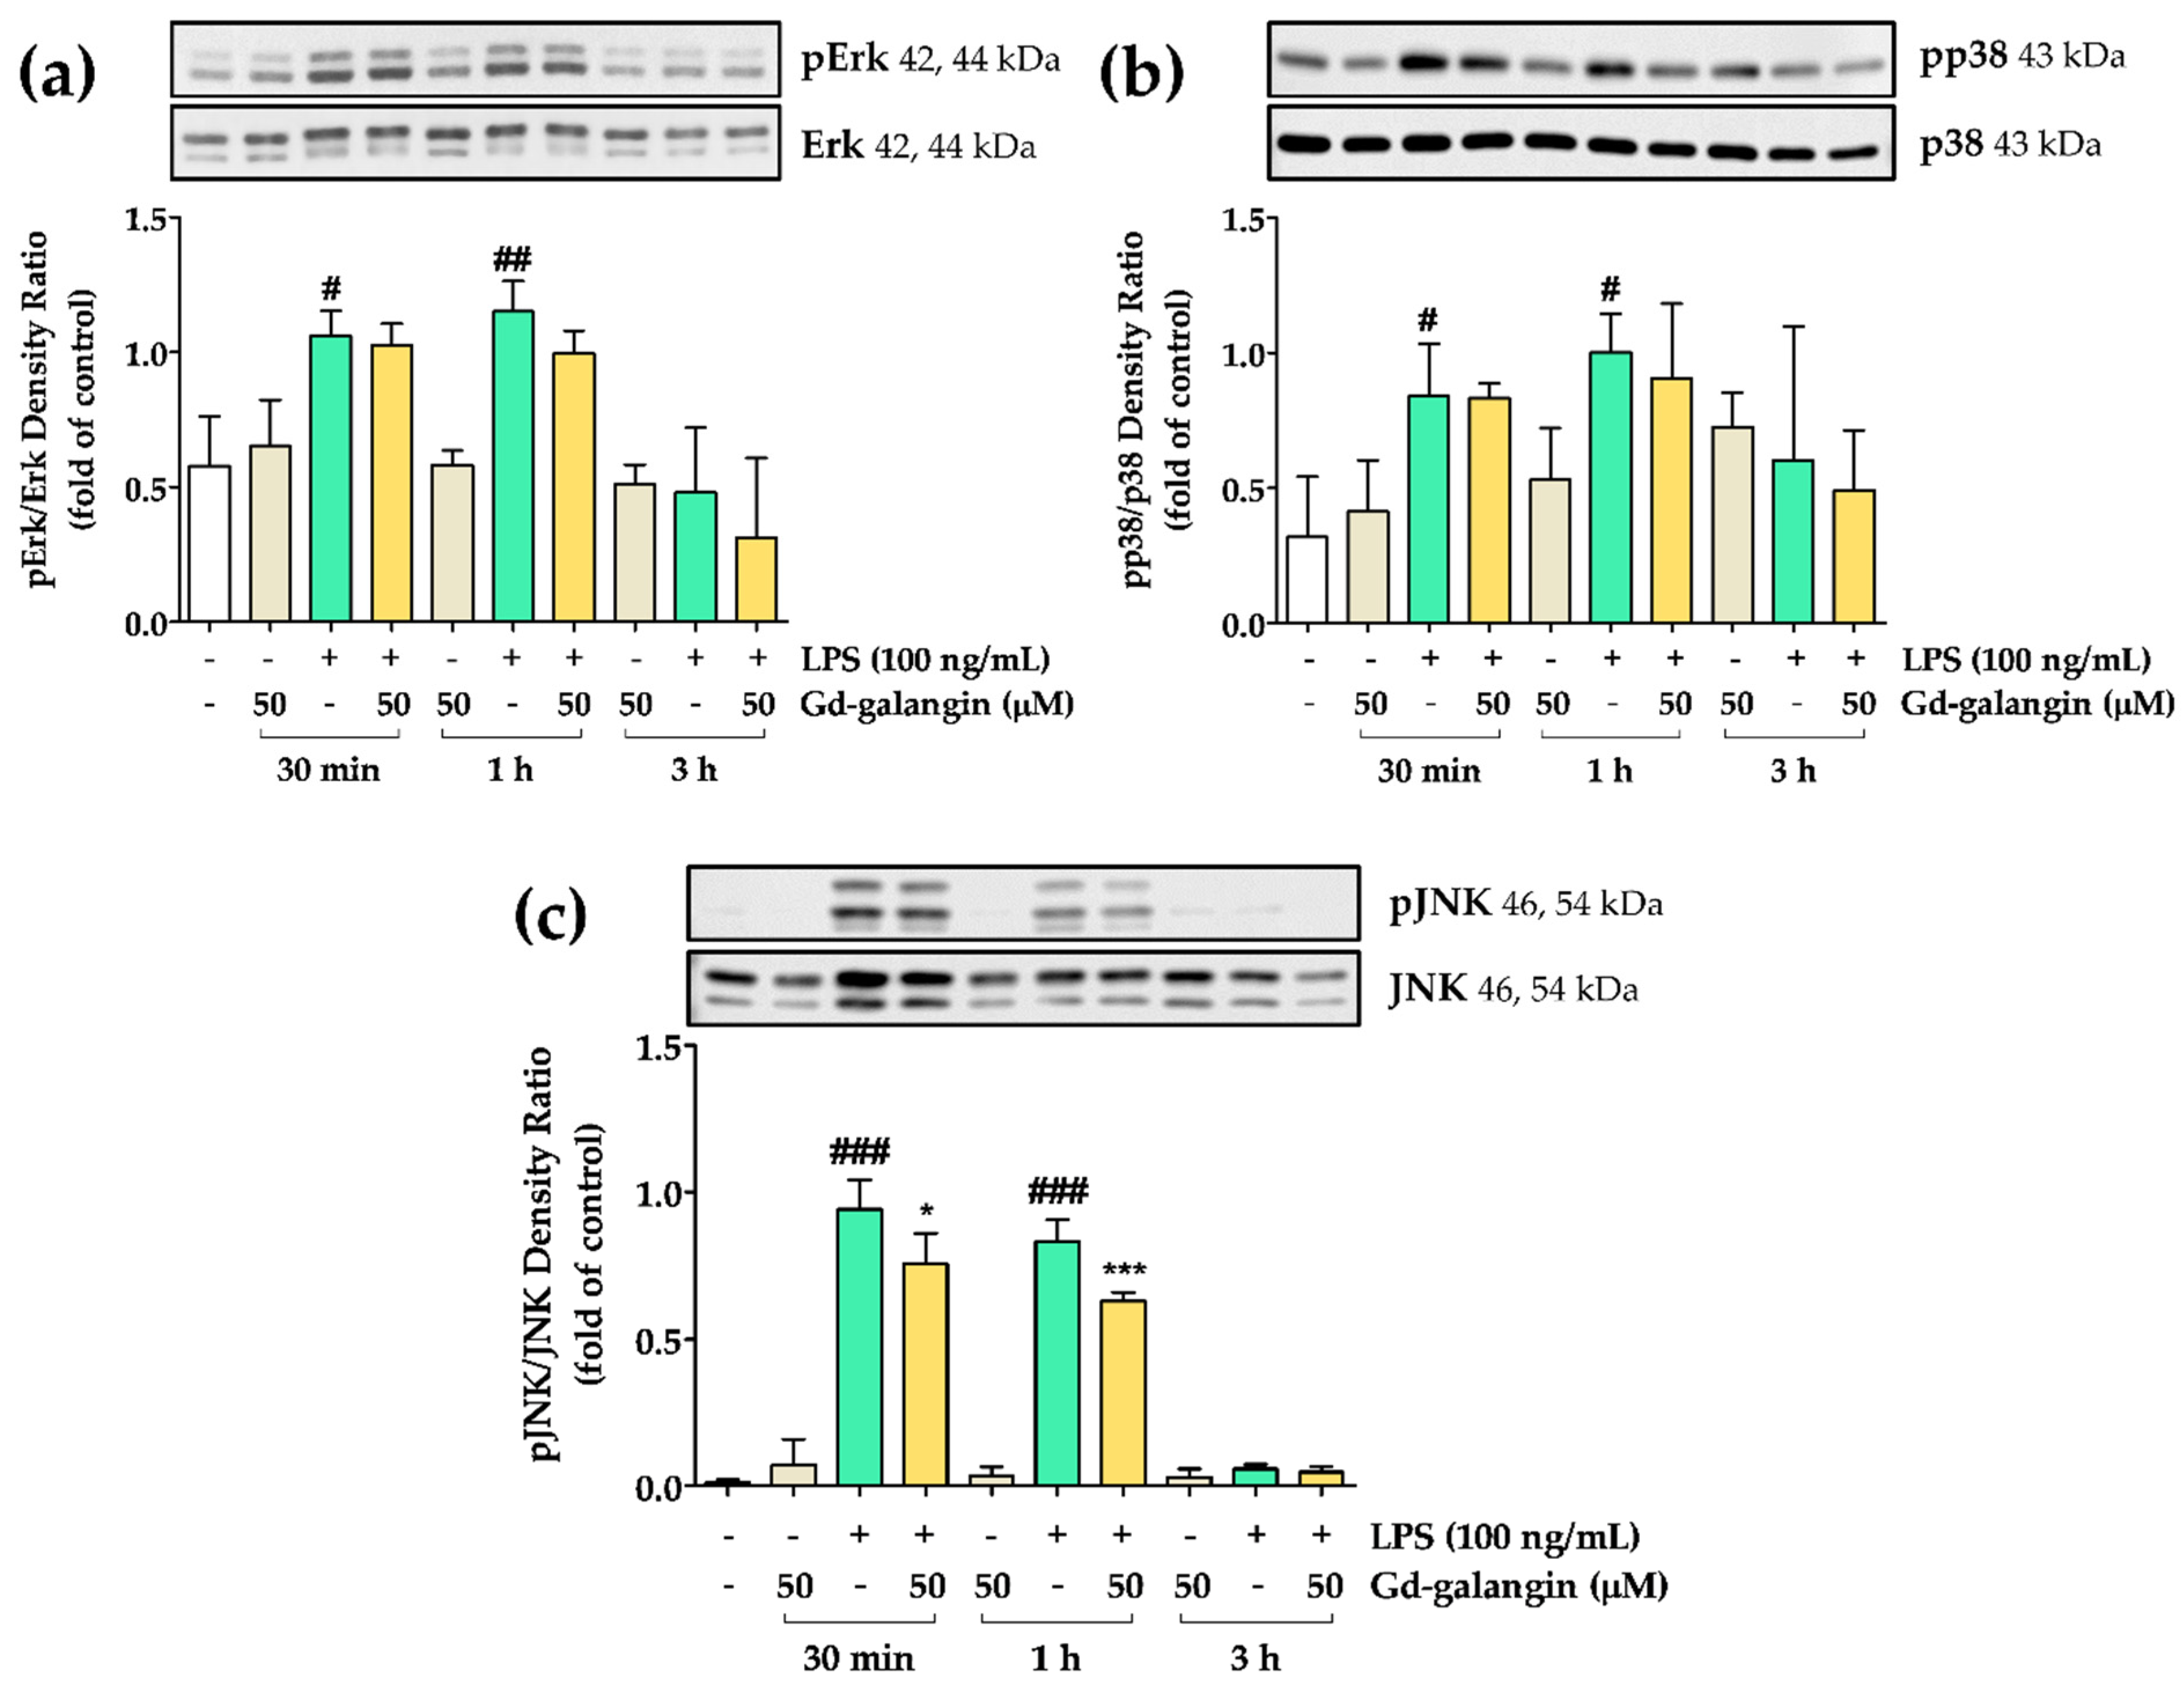
3.12. The Effect of Gd-Galangin on LPS-Induced MAPK Signaling Pathway
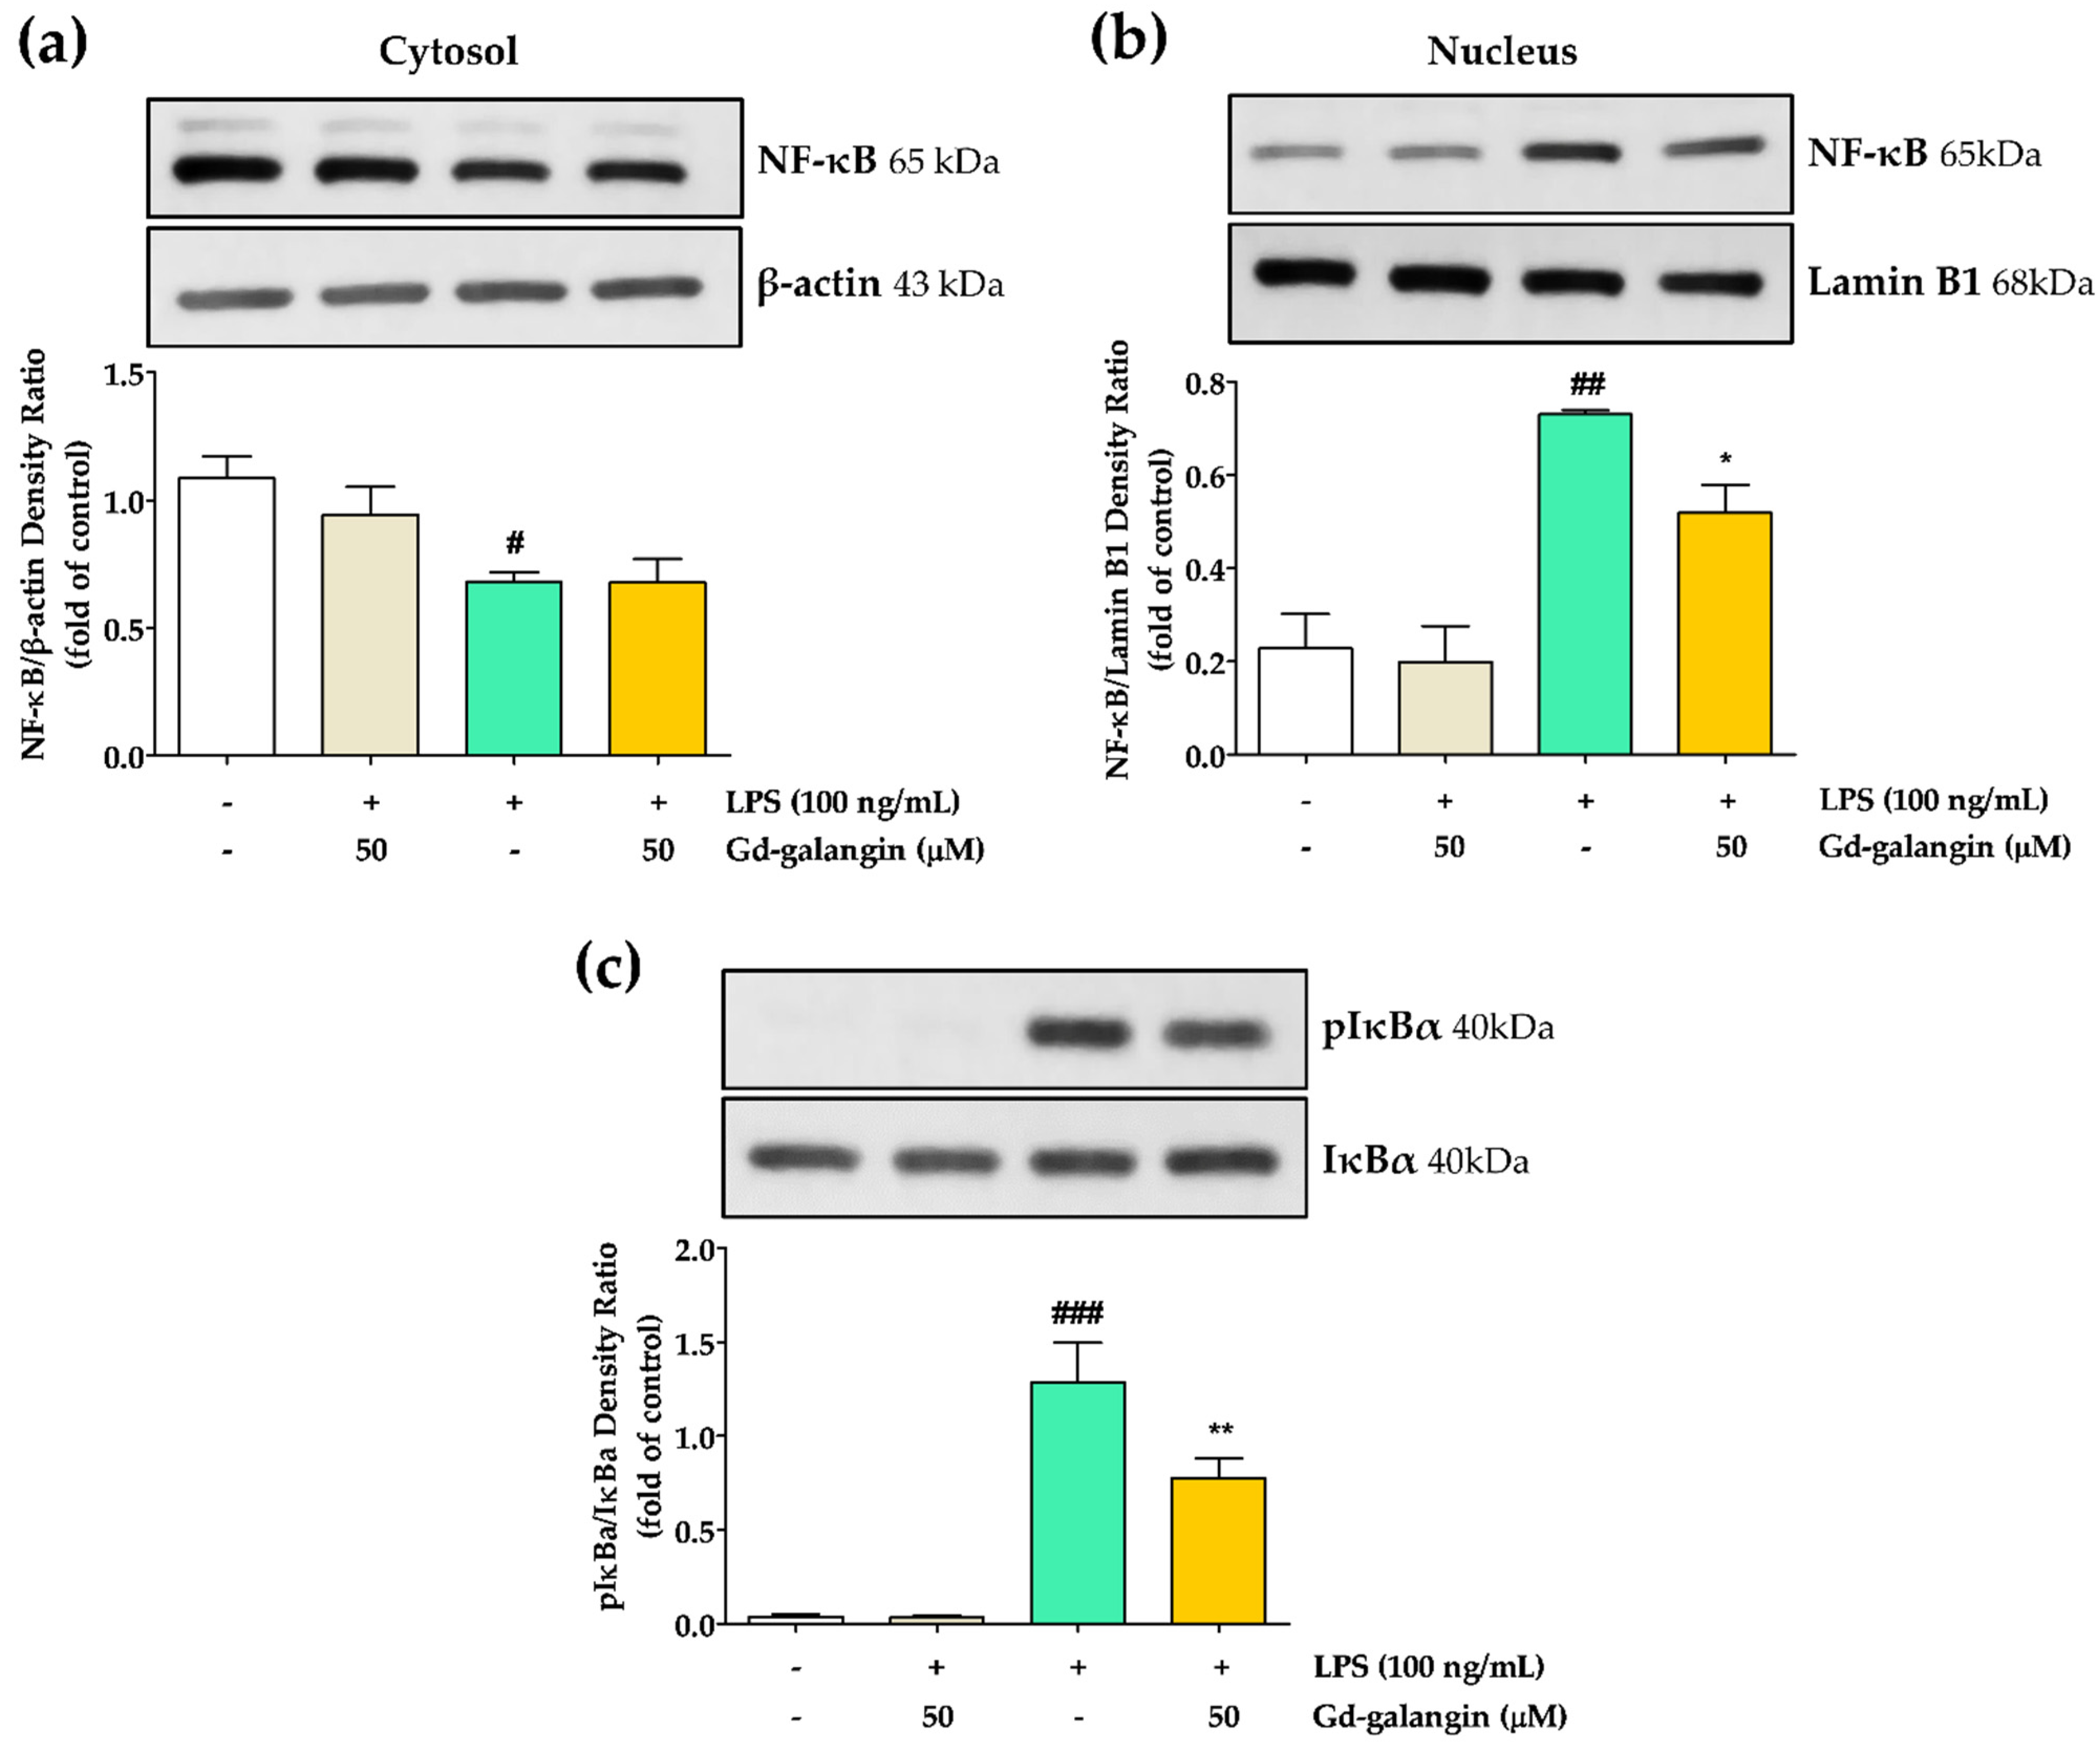
3.13. Anti-Inflammatory Effect of Gd-galangin through Inhibiting Translocation of NF-κB and Phosphorylation of IκBα
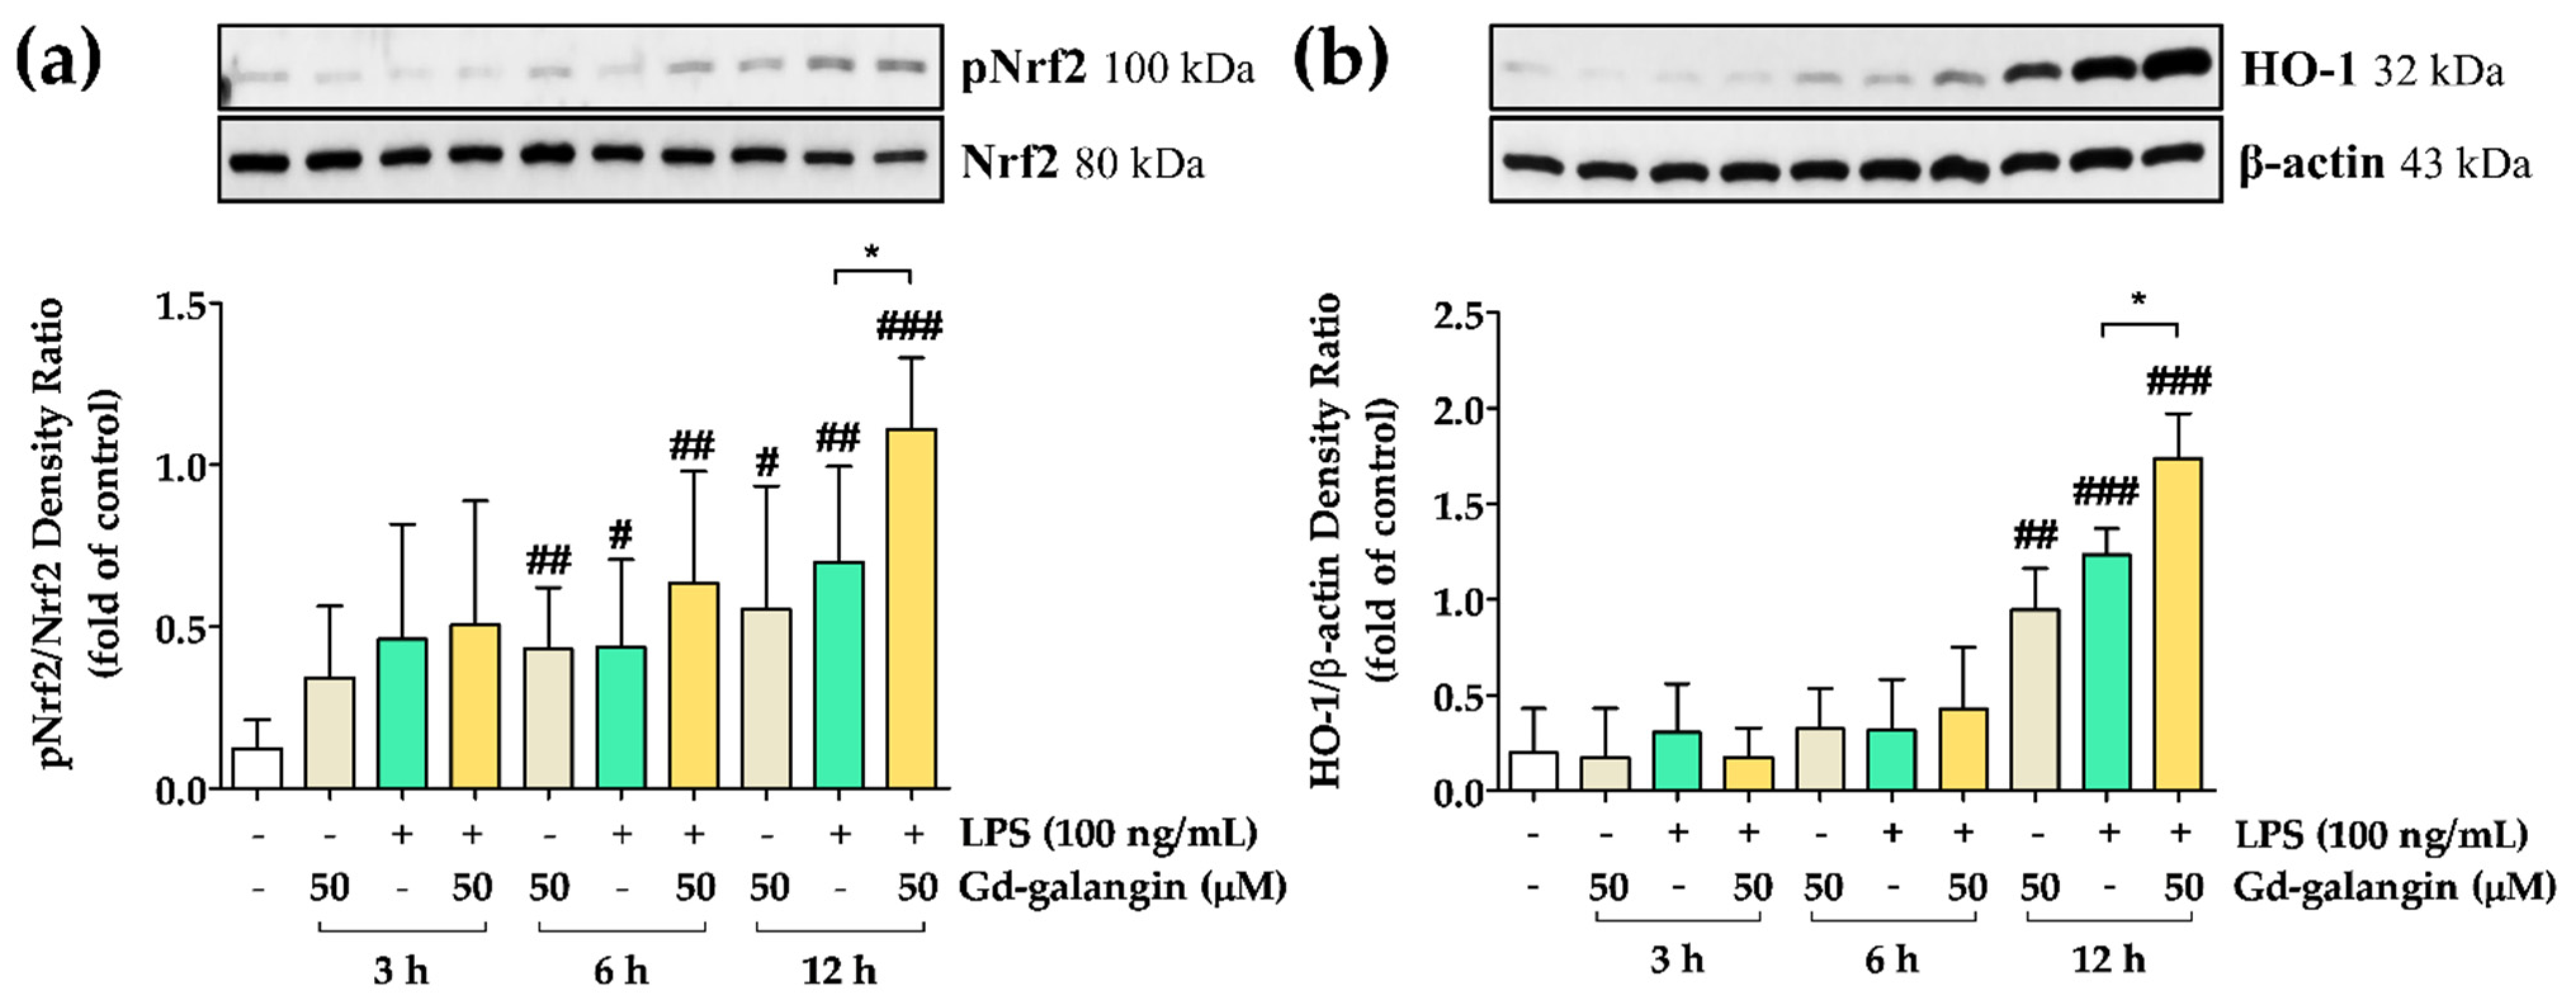
3.14. Anti-Inflammatory Effect of Gd-Galangin through Nrf2 and HO-1 Expression
4. Discussion
5. Conclusions
Supplementary Materials
Author Contributions
Funding
Institutional Review Board Statement
Informed Consent Statement
Data Availability Statement
Conflicts of Interest
Abbreviations
| ROS | reactive oxygen species |
| iNOS | inducible nitric oxide synthase |
| NF-κB | nuclear transcription factor kappa B |
| TNF-α | tumor necrosis factor-α |
| IL-1β | interleukin-1β |
| IL-6 | interleukin-6 |
| NO | nitric oxide |
| JNK | p-c-Jun N-terminal kinase |
| IκBα | nuclear factor of kappa light polypeptide gene enhancer in B-cells inhibitor |
| Erk | extracellular signal-regulated kinase |
| HO-1 | heme oxygenase-1 |
| Nrf2 | nuclear factor erythroid-2-related factor 2 |
| NLRP3 | nucleotide binding and oligomerization domain-like receptor family pyrin domain-containing protein 3 |
| MAPK | mitogen-activated protein kinase |
| LPS | lipopolysaccharide |
| MRI | magnetic resonance imaging |
| HSA | human serum albumin |
| SE | spin echo |
| TE | echo time |
| NEX | number of excitations |
| FOV | field of view |
| TR | repetition time |
| SNR | signal-to-noise ratio |
| CNR | contrast-to-noise ratio |
| NSF | nephrogenic systemic fibrosis |
References
- Das, R.; Mehta, D.K.; Dhanawat, M. Medicinal plants in cancer treatment: Contribution of nuclear factor-kappa B (NF-kB) inhibitors. Mini Rev. Med. Chem. 2022, 22, 1938–1962. [Google Scholar] [CrossRef] [PubMed]
- Khan, A.; Ikram, M.; Hahm, J.R.; Kim, M.O. Antioxidant and anti-inflammatory effects of citrus flavonoid hesperetin: Special focus on neurological disorders. Antioxidants 2020, 9, 609. [Google Scholar] [CrossRef] [PubMed]
- Chien, S.-T.; Shi, M.-D.; Lee, Y.-C.; Te, C.-C.; Shih, Y.-W. Galangin, a novel dietary flavonoid, attenuates metastatic feature via PKC/ERK signaling pathway in TPA-treated liver cancer HepG2 cells. Cancer Cell Int. 2015, 15, 15. [Google Scholar] [CrossRef] [PubMed] [Green Version]
- Hewage, S.R.K.M.; Piao, M.J.; Kang, K.A.; Ryu, Y.S.; Fernando, P.M.D.J.; Oh, M.C.; Park, J.E.; Shilnikova, K.; Moon, Y.J.; Shin, D.O. Galangin activates the ERK/AKT-driven Nrf2 signaling pathway to increase the level of reduced glutathione in human keratinocytes. Biomol. Ther. 2017, 25, 427. [Google Scholar] [CrossRef] [PubMed] [Green Version]
- Honmore, V.S.; Kandhare, A.D.; Kadam, P.P.; Khedkar, V.M.; Sarkar, D.; Bodhankar, S.L.; Zanwar, A.A.; Rojatkar, S.R.; Natu, A.D. Isolates of Alpinia officinarum Hance as COX-2 inhibitors: Evidence from anti-inflammatory, antioxidant and molecular docking studies. Int. Immunopharmacol. 2016, 33, 8–17. [Google Scholar] [CrossRef]
- Tungmunnithum, D.; Thongboonyou, A.; Pholboon, A.; Yangsabai, A. Flavonoids and other phenolic compounds from medicinal plants for pharmaceutical and medical aspects: An overview. Medicines 2018, 5, 93. [Google Scholar] [CrossRef]
- Vuolo, M.M.; Lima, V.S.; Junior, M.R.M. Phenolic compounds: Structure, classification, and antioxidant power. In Bioactive Compounds; Elsevier: Amsterdam, The Netherlands, 2019; pp. 33–50. [Google Scholar]
- Dehghani, S.; Hosseini, M.; Haghgoo, S.; Changizi, V.; Akbari Javar, H.; Khoobi, M.; Riahi Alam, N. Multifunctional MIL-Cur@ FC as a theranostic agent for magnetic resonance imaging and targeting drug delivery: In vitro and in vivo study. J. Drug Target. 2020, 28, 668–680. [Google Scholar] [CrossRef]
- Jeelani, S.; Reddy, R.J.; Maheswaran, T.; Asokan, G.; Dany, A.; Anand, B. Theranostics: A treasured tailor for tomorrow. J. Pharm. Bioallied Sci. 2014, 6, S6. [Google Scholar] [CrossRef]
- Maheswaran, T.; Ganapathy, N.; DineshShankar, J.; Mohanapriya, S.; Ilayaraja, V.; Yoithapprabhunath, T.R.; Yamunadevi, A.M. Theranostics an emerging paradigm—A review. IOSR J. Dent. Med. Sci. 2018, 17, 19–24. [Google Scholar]
- Yang, Z.; Lin, H.; Huang, J.; Li, A.; Sun, C.; Richmond, J.; Gao, J. A gadolinium-complex-based theranostic prodrug for in vivo tumour-targeted magnetic resonance imaging and therapy. Chem. Commun. 2019, 55, 4546–4549. [Google Scholar] [CrossRef]
- Li, Y.; Kumar, P.S.; Tan, S.; Huang, C.; Xiang, Z.; Qiu, J.; Tan, X.; Luo, J.; He, M. Anticancer and antibacterial flavonoids from the callus of Ampelopsis grossedentata; a new weapon to mitigate the proliferation of cancer cells and bacteria. RSC Adv. 2022, 12, 24130–24138. [Google Scholar] [CrossRef] [PubMed]
- Uebel, T.; Wilken, M.; Chi, H.V.; Esselen, M. In vitro combinatory cytotoxicity of hepatocarcinogenic asarone isomers and flavonoids. Toxicol. Vitr. 2019, 60, 19–26. [Google Scholar] [CrossRef] [PubMed]
- Di, L.; Fish, P.V.; Mano, T. Bridging solubility between drug discovery and development. Drug Discov. Today 2012, 17, 486–495. [Google Scholar] [CrossRef]
- Martínez-Alonso, E.; Escobar-Peso, A.; Aliena-Valero, A.; Torregrosa, G.; Chioua, M.; Fernández-Serra, R.; González-Nieto, D.; Ouahid, Y.; Salom, J.B.; Masjuan, J. Preclinical characterization of antioxidant quinolyl nitrone QN23 as a new candidate for the treatment of ischemic stroke. Antioxidants 2022, 11, 1186. [Google Scholar] [CrossRef] [PubMed]
- Kim, H.-K.; Hwang, S.; Sung, B.; Kim, Y.-H.; Chang, Y. Gd-complex of a rosmarinic acid conjugate as an anti-inflammatory theranostic agent via reactive oxygen species scavenging. Antioxidants 2020, 9, 744. [Google Scholar] [CrossRef]
- MacRenaris, K.W.; Ma, Z.; Krueger, R.L.; Carney, C.E.; Meade, T.J. Cell-permeable esterase-activated Ca (II)-sensitive MRI contrast agent. Bioconjugate Chem. 2016, 27, 465–473. [Google Scholar] [CrossRef] [Green Version]
- Kim, S.; Kim, H.-K.; Baek, A.R.; Sung, B.; Yang, B.W.; Kim, Y.-H.; Lee, J.-j.; Yang, J.-u.; Shin, C.-H.; Jung, H. Rose bengal conjugated gadolinium complex as a new multimodal imaging agent targeting presynaptic vesicular glutamate transporters. J. Ind. Eng. Chem. 2021, 95, 83–91. [Google Scholar] [CrossRef]
- Laurent, S.; Vander Elst, L.; Henoumont, C.; Muller, R. How to measure the transmetallation of a gadolinium complex. Contrast Media Mol. Imaging 2010, 5, 305–308. [Google Scholar] [CrossRef]
- Wang, H.; Yu, D.; Li, B.; Liu, Z.; Ren, J.; Qu, X. Ultrasensitive magnetic resonance imaging of systemic reactive oxygen species in vivo for early diagnosis of sepsis using activatable nanoprobes. Chem. Sci. 2019, 10, 3770–3778. [Google Scholar] [CrossRef] [Green Version]
- Baek, A.; Kim, H.-k.; Yang, J.-u.; Choi, G.; Kim, M.; Cho, A.E.; Kim, Y.-h.; Kim, S.; Sung, B.; Yang, B.W. High-performance hepatobiliary dysprosium contrast agent for ultra-high-field magnetic resonance imaging. J. Ind. Eng. Chem. 2020, 85, 297–307. [Google Scholar] [CrossRef]
- Lee, H.; Bae, K.; Baek, A.-R.; Kwon, E.-B.; Kim, Y.-H.; Nam, S.-W.; Lee, G.H.; Chang, Y. Glioblastoma-Derived Exosomes as Nanopharmaceutics for Improved Glioma Treatment. Pharmaceutics 2022, 14, 1002. [Google Scholar] [CrossRef]
- Pierce Biotechnology, Inc. NE-PER™ Nuclear and Cytoplasmic Extraction Reagents. Available online: https://www.thermofisher.com/document-connect/document-connect.html?url=https://assets.thermofisher.com/TFS-Assets%2FLSG%2Fmanuals%2FMAN0011398_NEPER_Nuc_Cytoplasmic_Extract_Reag_UG.pdf (accessed on 11 November 2022).
- Molecular Probes, Inc. Griess Reagen Kit for Nitrite Quantitation. Available online: https://www.thermofisher.com/document-connect/document-connect.html?url=https://assets.thermofisher.com/TFS-Assets%2FLSG%2Fmanuals%2Fmp07921.pdf (accessed on 9 July 2003).
- Thermo Fisher Scientifics. User Guide: Pierce BCA Protein Assay Kit. Available online: http://cuts.kr/RqBRM (accessed on 30 January 2020).
- Musialik, M.; Kuzmicz, R.; Pawłowski, T.S.; Litwinienko, G. Acidity of hydroxyl groups: An overlooked influence on antiradical properties of flavonoids. J. Org. Chem. 2009, 74, 2699–2709. [Google Scholar] [CrossRef]
- Spiegel, M.; Andruniów, T.; Sroka, Z. Flavones’ and flavonols’ antiradical structure–activity relationship—A quantum chemical study. Antioxidants 2020, 9, 461. [Google Scholar] [CrossRef]
- Kim, J.-Y.; Lee, H.-S.; Park, K.-s.; Chong, Y.-H. Unexpected Desilylative-alkylation of 3-O-tert-Butyl-dimethylsilyl Galangin. Bull. Korean Chem. Soc. 2008, 29, 1667–1668. [Google Scholar]
- Li, M.; Han, X.; Yu, B. Facile synthesis of flavonoid 7-O-glycosides. J. Org. Chem. 2003, 68, 6842–6845. [Google Scholar] [CrossRef]
- Chilla, S.N.M.; Zemek, O.; Kotek, J.; Boutry, S.; Larbanoix, L.; Sclavons, C.; Vander Elst, L.; Lukes, I.; Muller, R.N.; Laurent, S. Synthesis and characterization of monophosphinic acid DOTA derivative: A smart tool with functionalities for multimodal imaging. Bioorganic Med. Chem. 2017, 25, 4297–4303. [Google Scholar] [CrossRef] [PubMed]
- Rogosnitzky, M.; Branch, S. Gadolinium-based contrast agent toxicity: A review of known and proposed mechanisms. Biometals 2016, 29, 365–376. [Google Scholar] [CrossRef] [Green Version]
- Laurent, S.; Vander Elst, L.; Copoix, F.; Muller, R.N. Stability of MRI paramagnetic contrast media: A proton relaxometric protocol for transmetallation assessment. Investig. Radiol. 2001, 36, 115–122. [Google Scholar] [CrossRef] [PubMed]
- Zielonka, J.; Lambeth, J.D.; Kalyanaraman, B. On the use of L-012, a luminol-based chemiluminescent probe, for detecting superoxide and identifying inhibitors of NADPH oxidase: A reevaluation. Free Radic. Biol. Med. 2013, 65, 1310–1314. [Google Scholar] [CrossRef] [PubMed] [Green Version]
- Kim, H.-K.; Lee, J.-J.; Choi, G.; Sung, B.; Kim, Y.-H.; Baek, A.R.; Kim, S.; Song, H.; Kim, M.; Cho, A.E. Gadolinium-based neuroprognostic magnetic resonance imaging agents suppress COX-2 for prevention of reperfusion injury after stroke. J. Med. Chem. 2020, 63, 6909–6923. [Google Scholar] [CrossRef]
- Du, P.; Song, J.; Qiu, H.; Liu, H.; Zhang, L.; Zhou, J.; Jiang, S.; Liu, J.; Zheng, Y.; Wang, M. Polyphenols Extracted from Shanxi-Aged Vinegar Inhibit Inflammation in LPS-Induced RAW264. 7 Macrophages and ICR Mice via the Suppression of MAPK/NF-κB Pathway Activation. Molecules 2021, 26, 2745. [Google Scholar] [CrossRef] [PubMed]
- Choi, S.-I.; Lee, J.S.; Lee, S.; Lee, H.J.; Kim, B.-J.; Yeo, J.; Jung, T.-D.; Cho, B.-Y.; Choi, S.-H.; Lee, J.-H. Antioxidant and anti-aging effects of extracts from leaves of Castanea crenata Siebold & Zucc. in human dermal fibroblast. J. Food Hyg. Saf. 2017, 32, 243–248. [Google Scholar]
- Saha, S.; Buttari, B.; Panieri, E.; Profumo, E.; Saso, L. An overview of Nrf2 signaling pathway and its role in inflammation. Molecules 2020, 25, 5474. [Google Scholar] [CrossRef] [PubMed]
- Zhao, C.; Wang, F.; Tang, B.; Han, J.; Li, X.; Lian, G.; Li, X.; Hao, S. Anti-inflammatory effects of kaempferol-3-O-rhamnoside on HSV-1 encephalitis in vivo and in vitro. Neurosci. Lett. 2021, 765, 136172. [Google Scholar] [CrossRef]
- Shi, S.; Zheng, X.; Suzuki, R.; Li, Z.; Shiota, T.; Wang, J.; Hirai-Yuki, A.; Liu, Q.; Muramatsu, M.; Song, S.-J. Novel flavonoid hybrids as potent antiviral agents against hepatitis A: Design, synthesis and biological evaluation. Eur. J. Med. Chem. 2022, 238, 114452. [Google Scholar] [CrossRef]
- Guan, F.; Wang, Q.; Bao, Y.; Chao, Y. Anti-rheumatic effect of quercetin and recent developments in nano formulation. RSC Adv. 2021, 11, 7280–7293. [Google Scholar] [CrossRef]
- Imran, M.; Rauf, A.; Abu-Izneid, T.; Nadeem, M.; Shariati, M.A.; Khan, I.A.; Imran, A.; Orhan, I.E.; Rizwan, M.; Atif, M. Luteolin, a flavonoid, as an anticancer agent: A review. Biomed. Pharmacother. 2019, 112, 108612. [Google Scholar] [CrossRef]
- Jalili-Baleh, L.; Babaei, E.; Abdpour, S.; Bukhari, S.N.A.; Foroumadi, A.; Ramazani, A.; Sharifzadeh, M.; Abdollahi, M.; Khoobi, M. A review on flavonoid-based scaffolds as multi-target-directed ligands (MTDLs) for Alzheimer’s disease. Eur. J. Med. Chem. 2018, 152, 570–589. [Google Scholar] [CrossRef]
- Hu, Q.; Uversky, V.N.; Huang, M.; Kang, H.; Xu, F.; Liu, X.; Lian, L.; Liang, Q.; Jiang, H.; Liu, A. Baicalein inhibits α-synuclein oligomer formation and prevents progression of α-synuclein accumulation in a rotenone mouse model of Parkinson’s disease. Biochim. Biophys. Acta (BBA)-Mol. Basis Dis. 2016, 1862, 1883–1890. [Google Scholar] [CrossRef]
- Zhao, J.; Yang, J.; Xie, Y. Improvement strategies for the oral bioavailability of poorly water-soluble flavonoids: An overview. Int. J. Pharm. 2019, 570, 118642. [Google Scholar] [CrossRef]
- Das, S.; Chaudhury, A. Recent advances in lipid nanoparticle formulations with solid matrix for oral drug delivery. Aaps Pharmscitech 2011, 12, 62–76. [Google Scholar] [CrossRef] [PubMed] [Green Version]
- Kerns, E.; Di, L. Drug-like Properties: Concepts, Structure Design and Methods; Academic Press: San Diego, CA, USA, 2008. [Google Scholar]
- Lopes, C.M.; Bettencourt, C.; Rossi, A.; Buttini, F.; Barata, P. Overview on gastroretentive drug delivery systems for improving drug bioavailability. Int. J. Pharm. 2016, 510, 144–158. [Google Scholar] [CrossRef] [PubMed]
- Jornada, D.H.; dos Santos Fernandes, G.F.; Chiba, D.E.; De Melo, T.R.F.; Dos Santos, J.L.; Chung, M.C. The prodrug approach: A successful tool for improving drug solubility. Molecules 2015, 21, 42. [Google Scholar] [CrossRef] [PubMed]
- Flores-Ramos, M.; Ibarra-Velarde, F.; Hernández-Campos, A.; Vera-Montenegro, Y.; Jung-Cook, H.; Cantó-Alarcón, G.J.; Del Rivero, L.M.; Castillo, R. A highly water soluble benzimidazole derivative useful for the treatment of fasciolosis. Bioorg. Med. Chem. Lett. 2014, 24, 5814–5817. [Google Scholar] [CrossRef]
- Kumar, S.; Pandey, A.K. Chemistry and biological activities of flavonoids: An overview. Sci. World J. 2013, 2013, 162750. [Google Scholar] [CrossRef] [Green Version]
- Wang, T.-y.; Li, Q.; Bi, K.-s. Bioactive flavonoids in medicinal plants: Structure, activity and biological fate. Asian J. Pharm. Sci. 2018, 13, 12–23. [Google Scholar] [CrossRef]
- Ouyang, X.; Li, X.; Lu, W.; Zhao, X.; Chen, D. A null B-ring improves the antioxidant levels of Flavonol: A comparative study between Galangin and 3, 5, 7-Trihydroxychromone. Molecules 2018, 23, 3083. [Google Scholar] [CrossRef] [Green Version]
- Haedicke, I.E.; Li, T.; Zhu, Y.L.K.; Martinez, F.; Hamilton, A.M.; Murrell, D.H.; Nofiele, J.T.; Cheng, H.-L.M.; Scholl, T.J.; Foster, P.J. An enzyme-activatable and cell-permeable Mn III-porphyrin as a highly efficient T 1 MRI contrast agent for cell labeling. Chem. Sci. 2016, 7, 4308–4317. [Google Scholar] [CrossRef] [Green Version]
- Fukami, T.; Kariya, M.; Kurokawa, T.; Iida, A.; Nakajima, M. Comparison of substrate specificity among human arylacetamide deacetylase and carboxylesterases. Eur. J. Pharm. Sci. 2015, 78, 47–53. [Google Scholar] [CrossRef] [PubMed]
- Klein, V.G.; Bond, A.G.; Craigon, C.; Lokey, R.S.; Ciulli, A. Amide-to-ester substitution as a strategy for optimizing PROTAC permeability and cellular activity. J. Med. Chem. 2021, 64, 18082–18101. [Google Scholar] [CrossRef] [PubMed]
- Arioz, B.I.; Tarakcioglu, E.; Olcum, M.; Genc, S. The Role of Melatonin on NLRP3 Inflammasome Activation in Diseases. Antioxidants 2021, 10, 1020. [Google Scholar] [CrossRef]
- Jo, E.-K.; Kim, J.K.; Shin, D.-M.; Sasakawa, C. Molecular mechanisms regulating NLRP3 inflammasome activation. Cell. Mol. Immunol. 2016, 13, 148–159. [Google Scholar] [CrossRef] [Green Version]
- Zhang, X.; Xu, A.; Lv, J.; Zhang, Q.; Ran, Y.; Wei, C.; Wu, J. Development of small molecule inhibitors targeting NLRP3 inflammasome pathway for inflammatory diseases. Eur. J. Med. Chem. 2020, 185, 111822. [Google Scholar] [CrossRef]
- De Nardo, D.; Latz, E. NLRP3 inflammasomes link inflammation and metabolic disease. Trends Immunol. 2011, 32, 373–379. [Google Scholar] [CrossRef] [Green Version]
- Kim, J.-S.; Oh, J.-M.; Choi, H.; Kim, S.W.; Kim, S.W.; Kim, B.G.; Cho, J.H.; Lee, J.; Lee, D.C. Activation of the Nrf2/HO-1 pathway by curcumin inhibits oxidative stress in human nasal fibroblasts exposed to urban particulate matter. BMC Complement. Med. Ther. 2020, 20, 1–8. [Google Scholar] [CrossRef] [PubMed] [Green Version]
- Chang, L.; Karin, M. Mammalian MAP kinase signalling cascades. Nature 2001, 410, 37–40. [Google Scholar] [CrossRef]
- Huang, Y.-C.; Tsai, M.-S.; Hsieh, P.-C.; Shih, J.-H.; Wang, T.-S.; Wang, Y.-C.; Lin, T.-H.; Wang, S.-H. Galangin ameliorates cisplatin-induced nephrotoxicity by attenuating oxidative stress, inflammation and cell death in mice through inhibition of ERK and NF-kappaB signaling. Toxicol. Appl. Pharmacol. 2017, 329, 128–139. [Google Scholar] [CrossRef] [PubMed]
- Ren, Q.; Guo, F.; Tao, S.; Huang, R.; Ma, L.; Fu, P. Flavonoid fisetin alleviates kidney inflammation and apoptosis via inhibiting Src-mediated NF-κB p65 and MAPK signaling pathways in septic AKI mice. Biomed. Pharmacother. 2020, 122, 109772. [Google Scholar] [CrossRef] [PubMed]
- Li, C.; Winnard Jr, P.; Bhujwalla, Z.M. Facile synthesis of 1-(acetic acid)-4, 7, 10-tris (tert-butoxycarbonylmethyl)-1, 4, 7, 10-tetraazacyclododecane: A reactive precursor chelating agent. Tetrahedron Lett. 2009, 50, 2929–2931. [Google Scholar] [CrossRef] [Green Version]
- Du, Q.; Li, B. Identification of antioxidant compounds of Mucuna sempervirens by high-speed counter-current chromatographic separation–DPPH radical scavenging detection and their oestrogenic activity. Food Chem. 2012, 131, 1181–1186. [Google Scholar] [CrossRef]
- Sethi, S.; Joshi, A.; Arora, B.; Bhowmik, A.; Sharma, R.; Kumar, P. Significance of FRAP, DPPH, and CUPRAC assays for antioxidant activity determination in apple fruit extracts. Eur. Food Res. Technol. 2020, 246, 591–598. [Google Scholar] [CrossRef]
- Alcalde, B.; Granados, M.; Saurina, J. Exploring the antioxidant features of polyphenols by spectroscopic and electrochemical methods. Antioxidants 2019, 8, 523. [Google Scholar] [CrossRef] [PubMed]


| Contrast Agents | r1 (mM−1 s−1) | r2 (mM−1 s−1) | log P oct/wat | ||||
|---|---|---|---|---|---|---|---|
| Water | PBS | HSA | Water | PBS | HSA | ||
| Gd-flavone | 3.70 ± 0.21 | 3.94 ± 0.06 | 4.11 ± 0.08 | 4.35 ± 0.21 | 4.30 ± 0.10 | 7.29 ± 0.08 | −1.40 |
| Gd-chrysin | 4.16 ± 0.22 | 4.41 ± 0.07 | 4.82 ± 0.10 | 4.82 ± 0.27 | 5.41 ± 0.13 | 10.11 ± 0.11 | −0.91 |
| Gd-galangin | 4.76 ± 0.30 | 4.13 ± 0.09 | 4.53 ± 0.07 | 5.85 ± 0.44 | 6.83 ± 0.32 | 12.19 ± 0.19 | −0.74 |
| Gd-BT-DO3A | 3.80 ± 0.16 | 4.57 ± 0.06 | 4.30 ± 0.08 | 4.62 ± 0.15 | 5.20 ± 0.05 | 6.51 ± 0.07 | −3.13 |
| Gd-DOTA | 3.33 ± 0.14 | 3.99 ± 0.04 | - | 3.87 ± 0.14 | 4.31 ± 0.15 | - | −3.09 |
| Gd-BOPTA | 4.75 ± 0.17 | 5.49 ± 0.07 | - | 5.33 ± 0.20 | 6.13 ± 0.13 | - | −2.90 |
| Gd-DTPA-EOB | 6.07 ± 0.22 | 7.46 ± 0.08 | - | 6.86 ± 0.20 | 8.27 ± 0.05 | - | −3.19 |
| Gd-HP-DO3A | 3.29 ± 0.15 | 4.04 ± 0.08 | - | 4.24 ± 0.13 | 4.44 ± 0.17 | - | - |
| Gd-DTPA-BMA | 3.33 ± 0.14 | 3.98 ± 0.06 | - | 4.00 ± 0.30 | 4.72 ± 0.08 | - | - |
| Gd-DTPA | 3.77 ± 0.20 | 4.59 ± 0.07 | - | 4.55 ± 0.29 | 5.50 ± 0.07 | - | - |
Publisher’s Note: MDPI stays neutral with regard to jurisdictional claims in published maps and institutional affiliations. |
© 2022 by the authors. Licensee MDPI, Basel, Switzerland. This article is an open access article distributed under the terms and conditions of the Creative Commons Attribution (CC BY) license (https://creativecommons.org/licenses/by/4.0/).
Share and Cite
Yang, B.W.; Yang, S.; Kim, S.; Baek, A.R.; Sung, B.; Kim, Y.-H.; Lee, J.T.; Lee, S.Y.; Kim, H.-K.; Choi, G.; et al. Flavonoid-Conjugated Gadolinium Complexes as Anti-Inflammatory Theranostic Agents. Antioxidants 2022, 11, 2470. https://doi.org/10.3390/antiox11122470
Yang BW, Yang S, Kim S, Baek AR, Sung B, Kim Y-H, Lee JT, Lee SY, Kim H-K, Choi G, et al. Flavonoid-Conjugated Gadolinium Complexes as Anti-Inflammatory Theranostic Agents. Antioxidants. 2022; 11(12):2470. https://doi.org/10.3390/antiox11122470
Chicago/Turabian StyleYang, Byeong Woo, Sohyeon Yang, Soyeon Kim, Ah Rum Baek, Bokyung Sung, Yeoun-Hee Kim, Jung Tae Lee, Sang Yun Lee, Hee-Kyung Kim, Garam Choi, and et al. 2022. "Flavonoid-Conjugated Gadolinium Complexes as Anti-Inflammatory Theranostic Agents" Antioxidants 11, no. 12: 2470. https://doi.org/10.3390/antiox11122470