
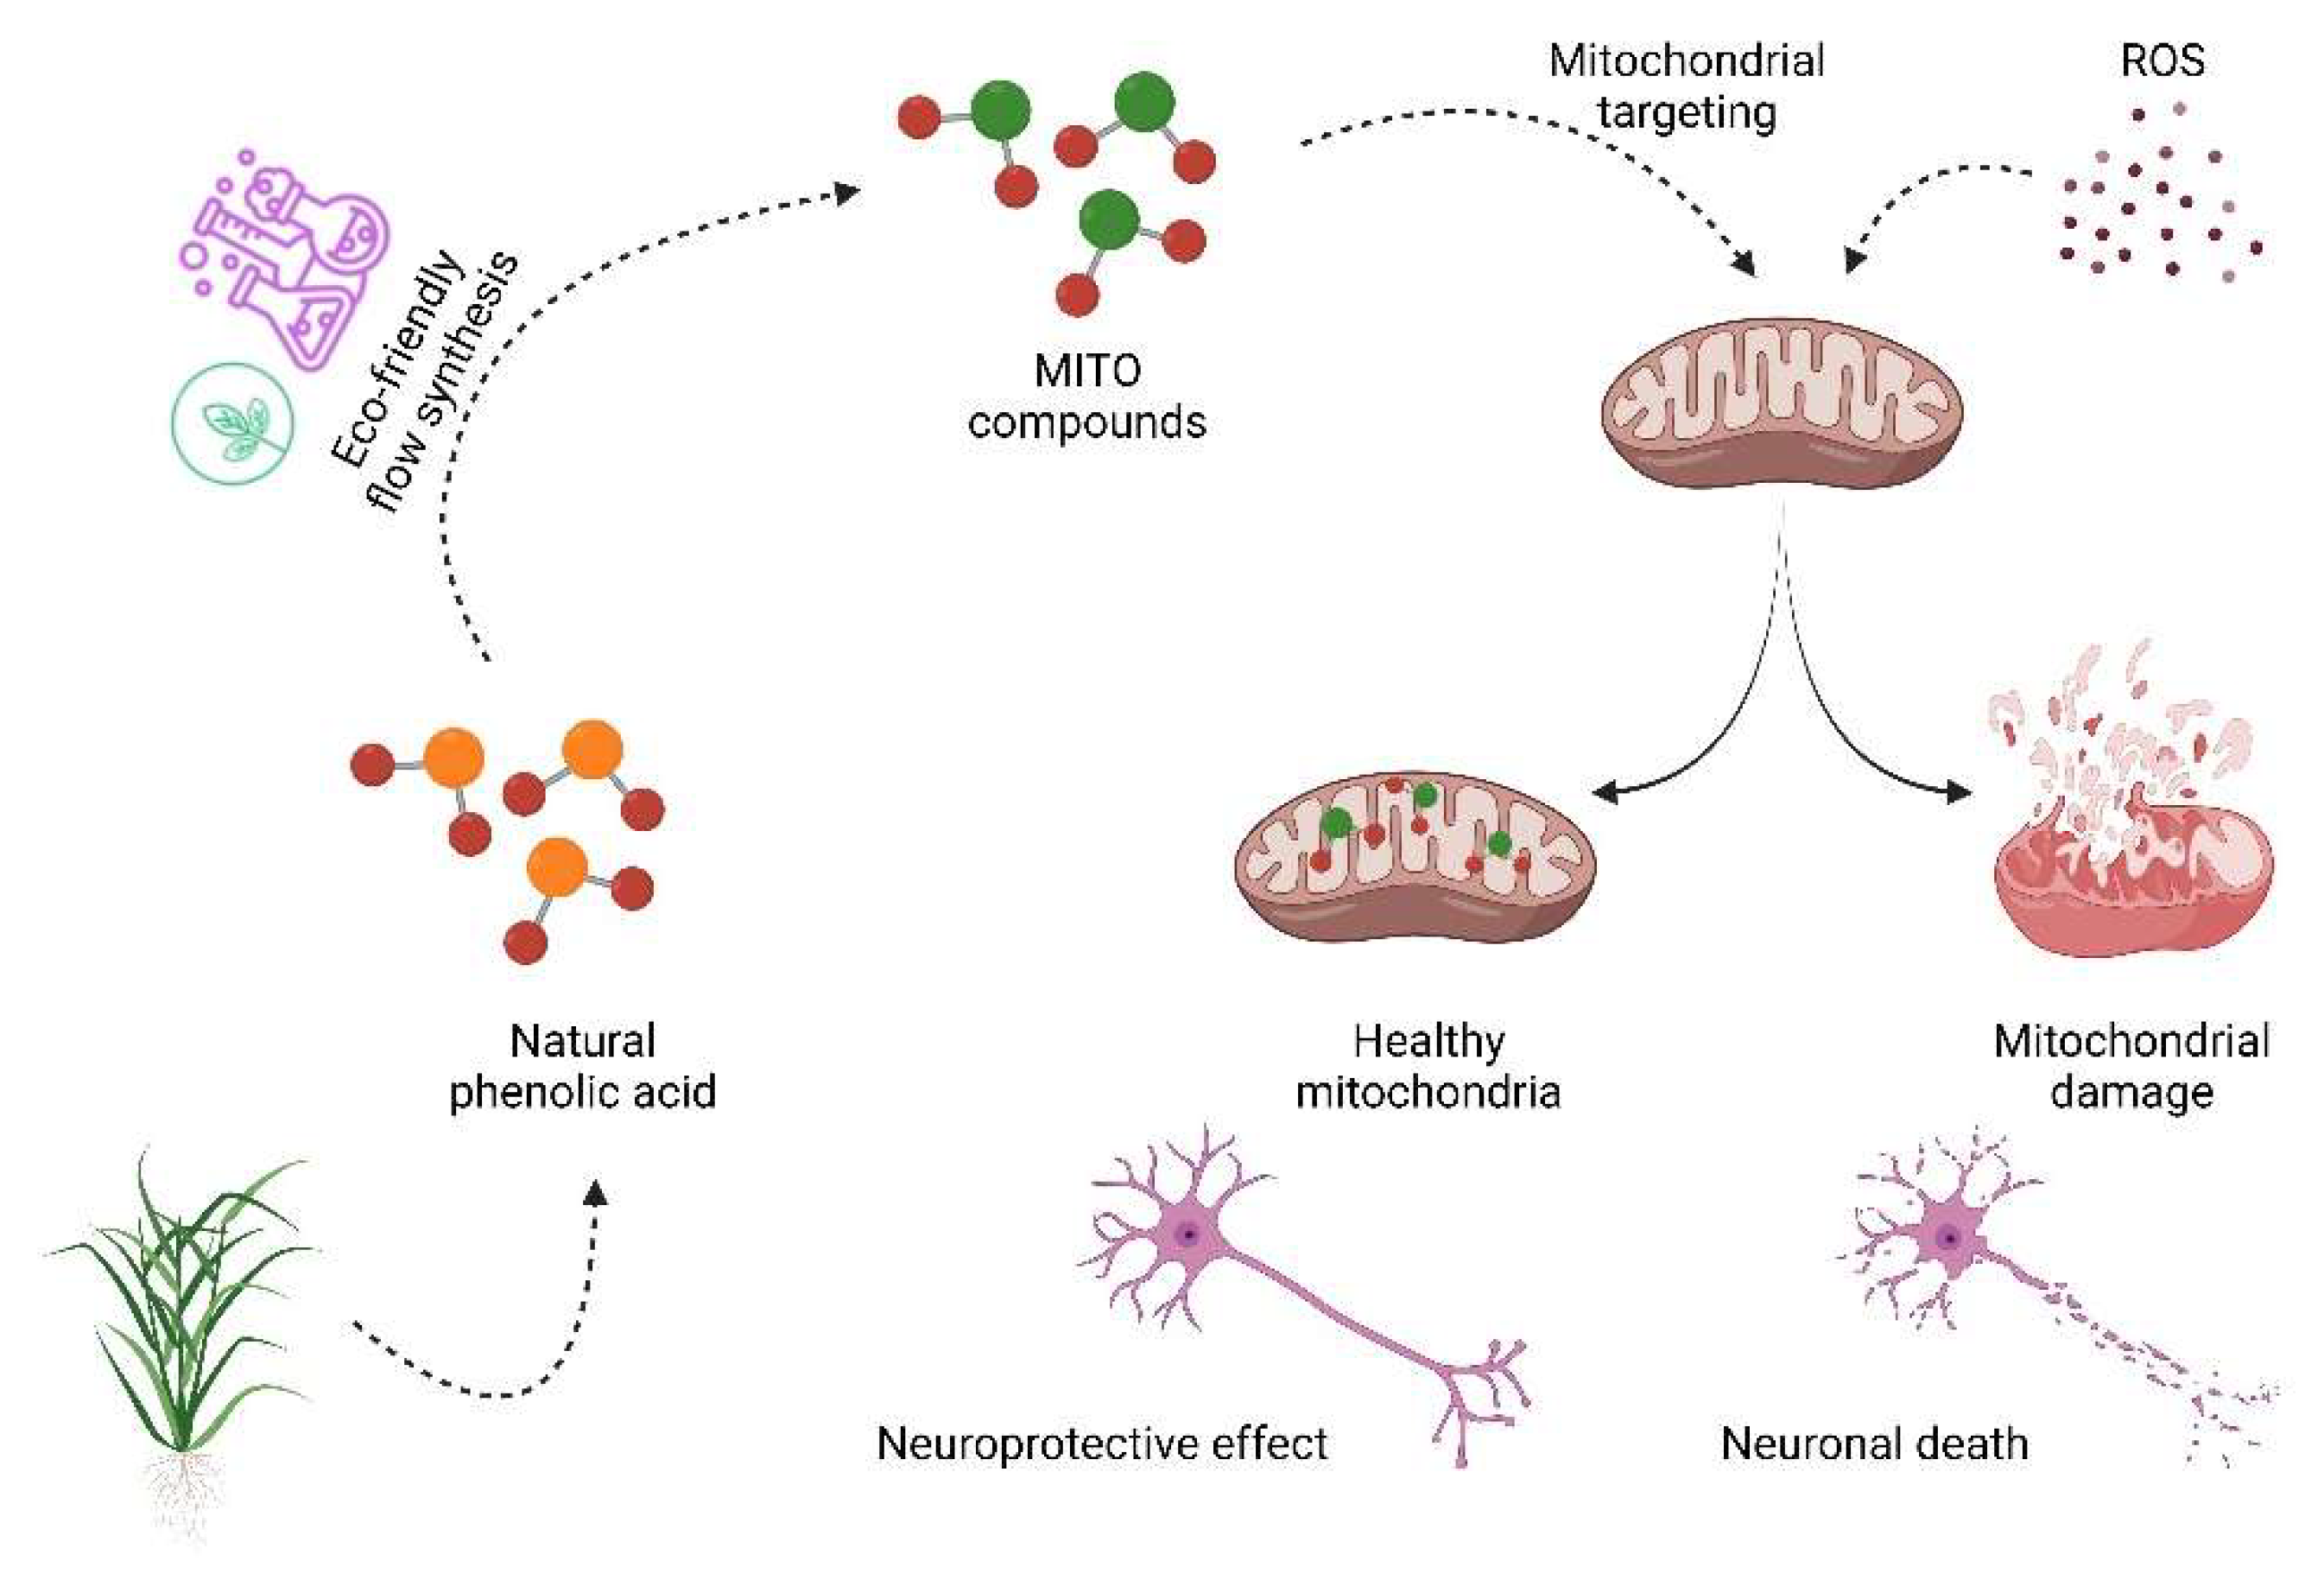
Flow Synthesis of Nature-Inspired Mitochondria-Targeted Phenolic Derivatives as Potential Neuroprotective Agents
 , ,
, ,  and
and 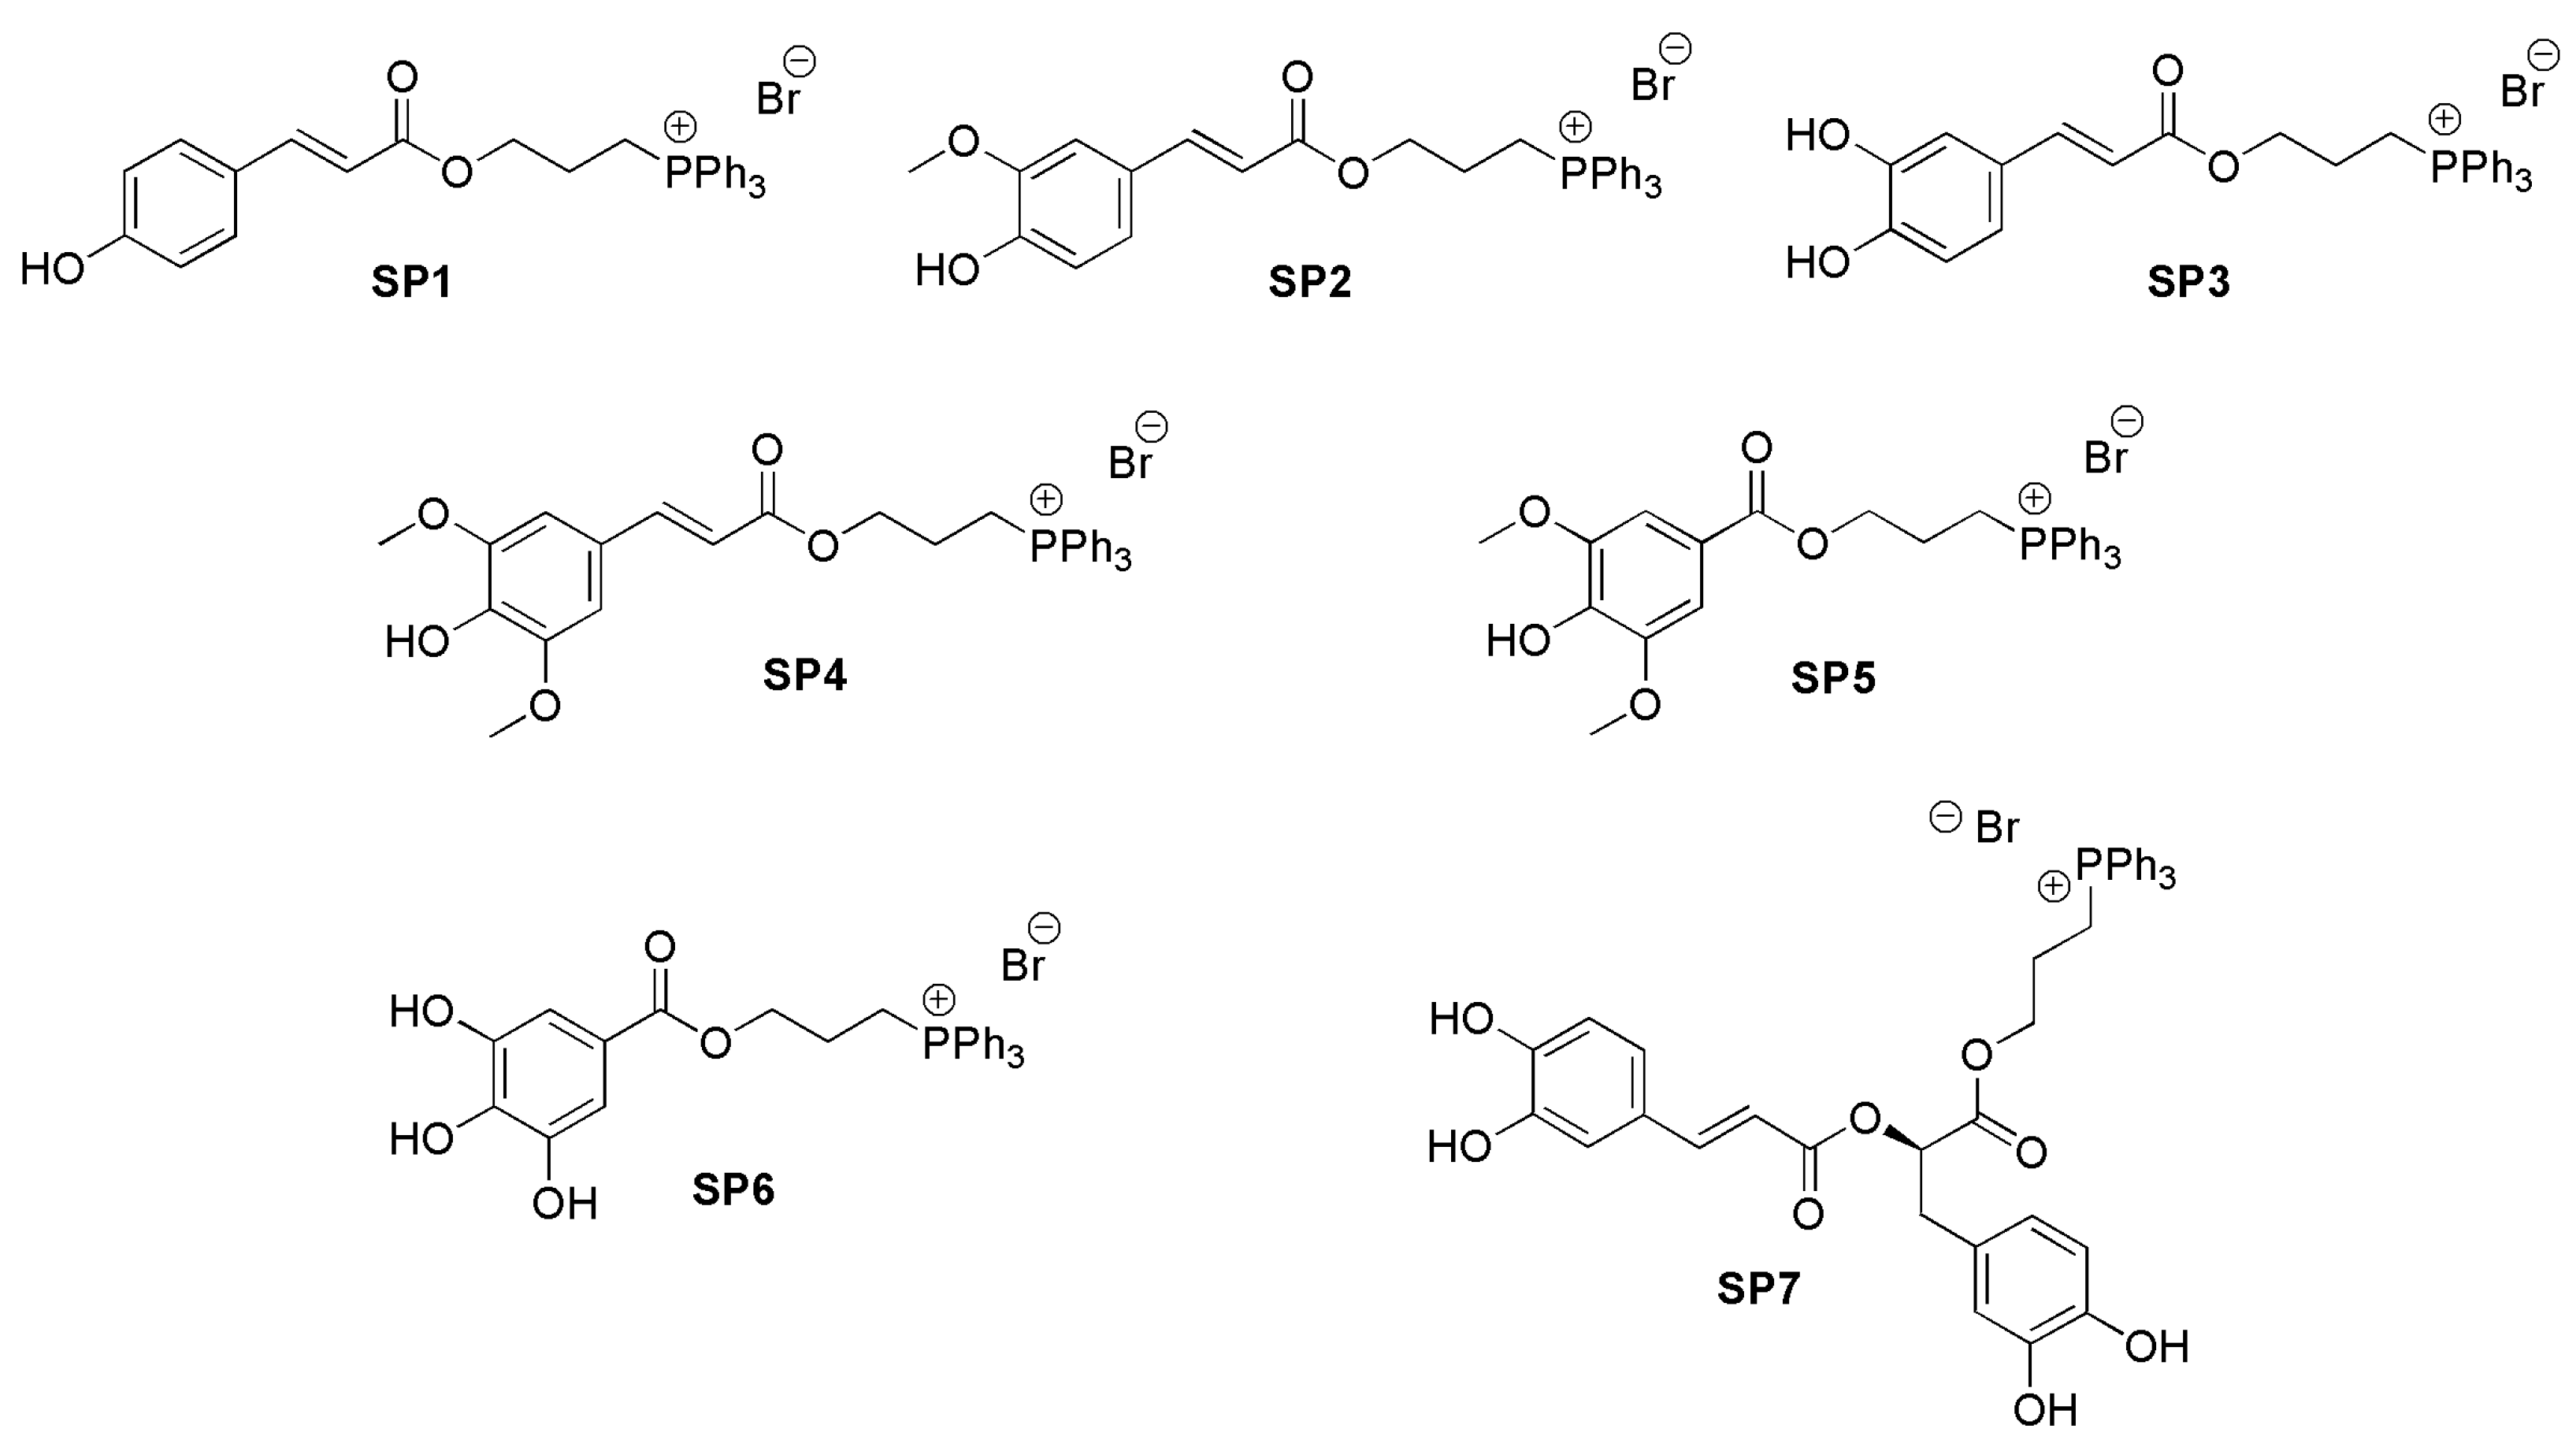
Abstract
:1. Introduction
2. Materials and Methods
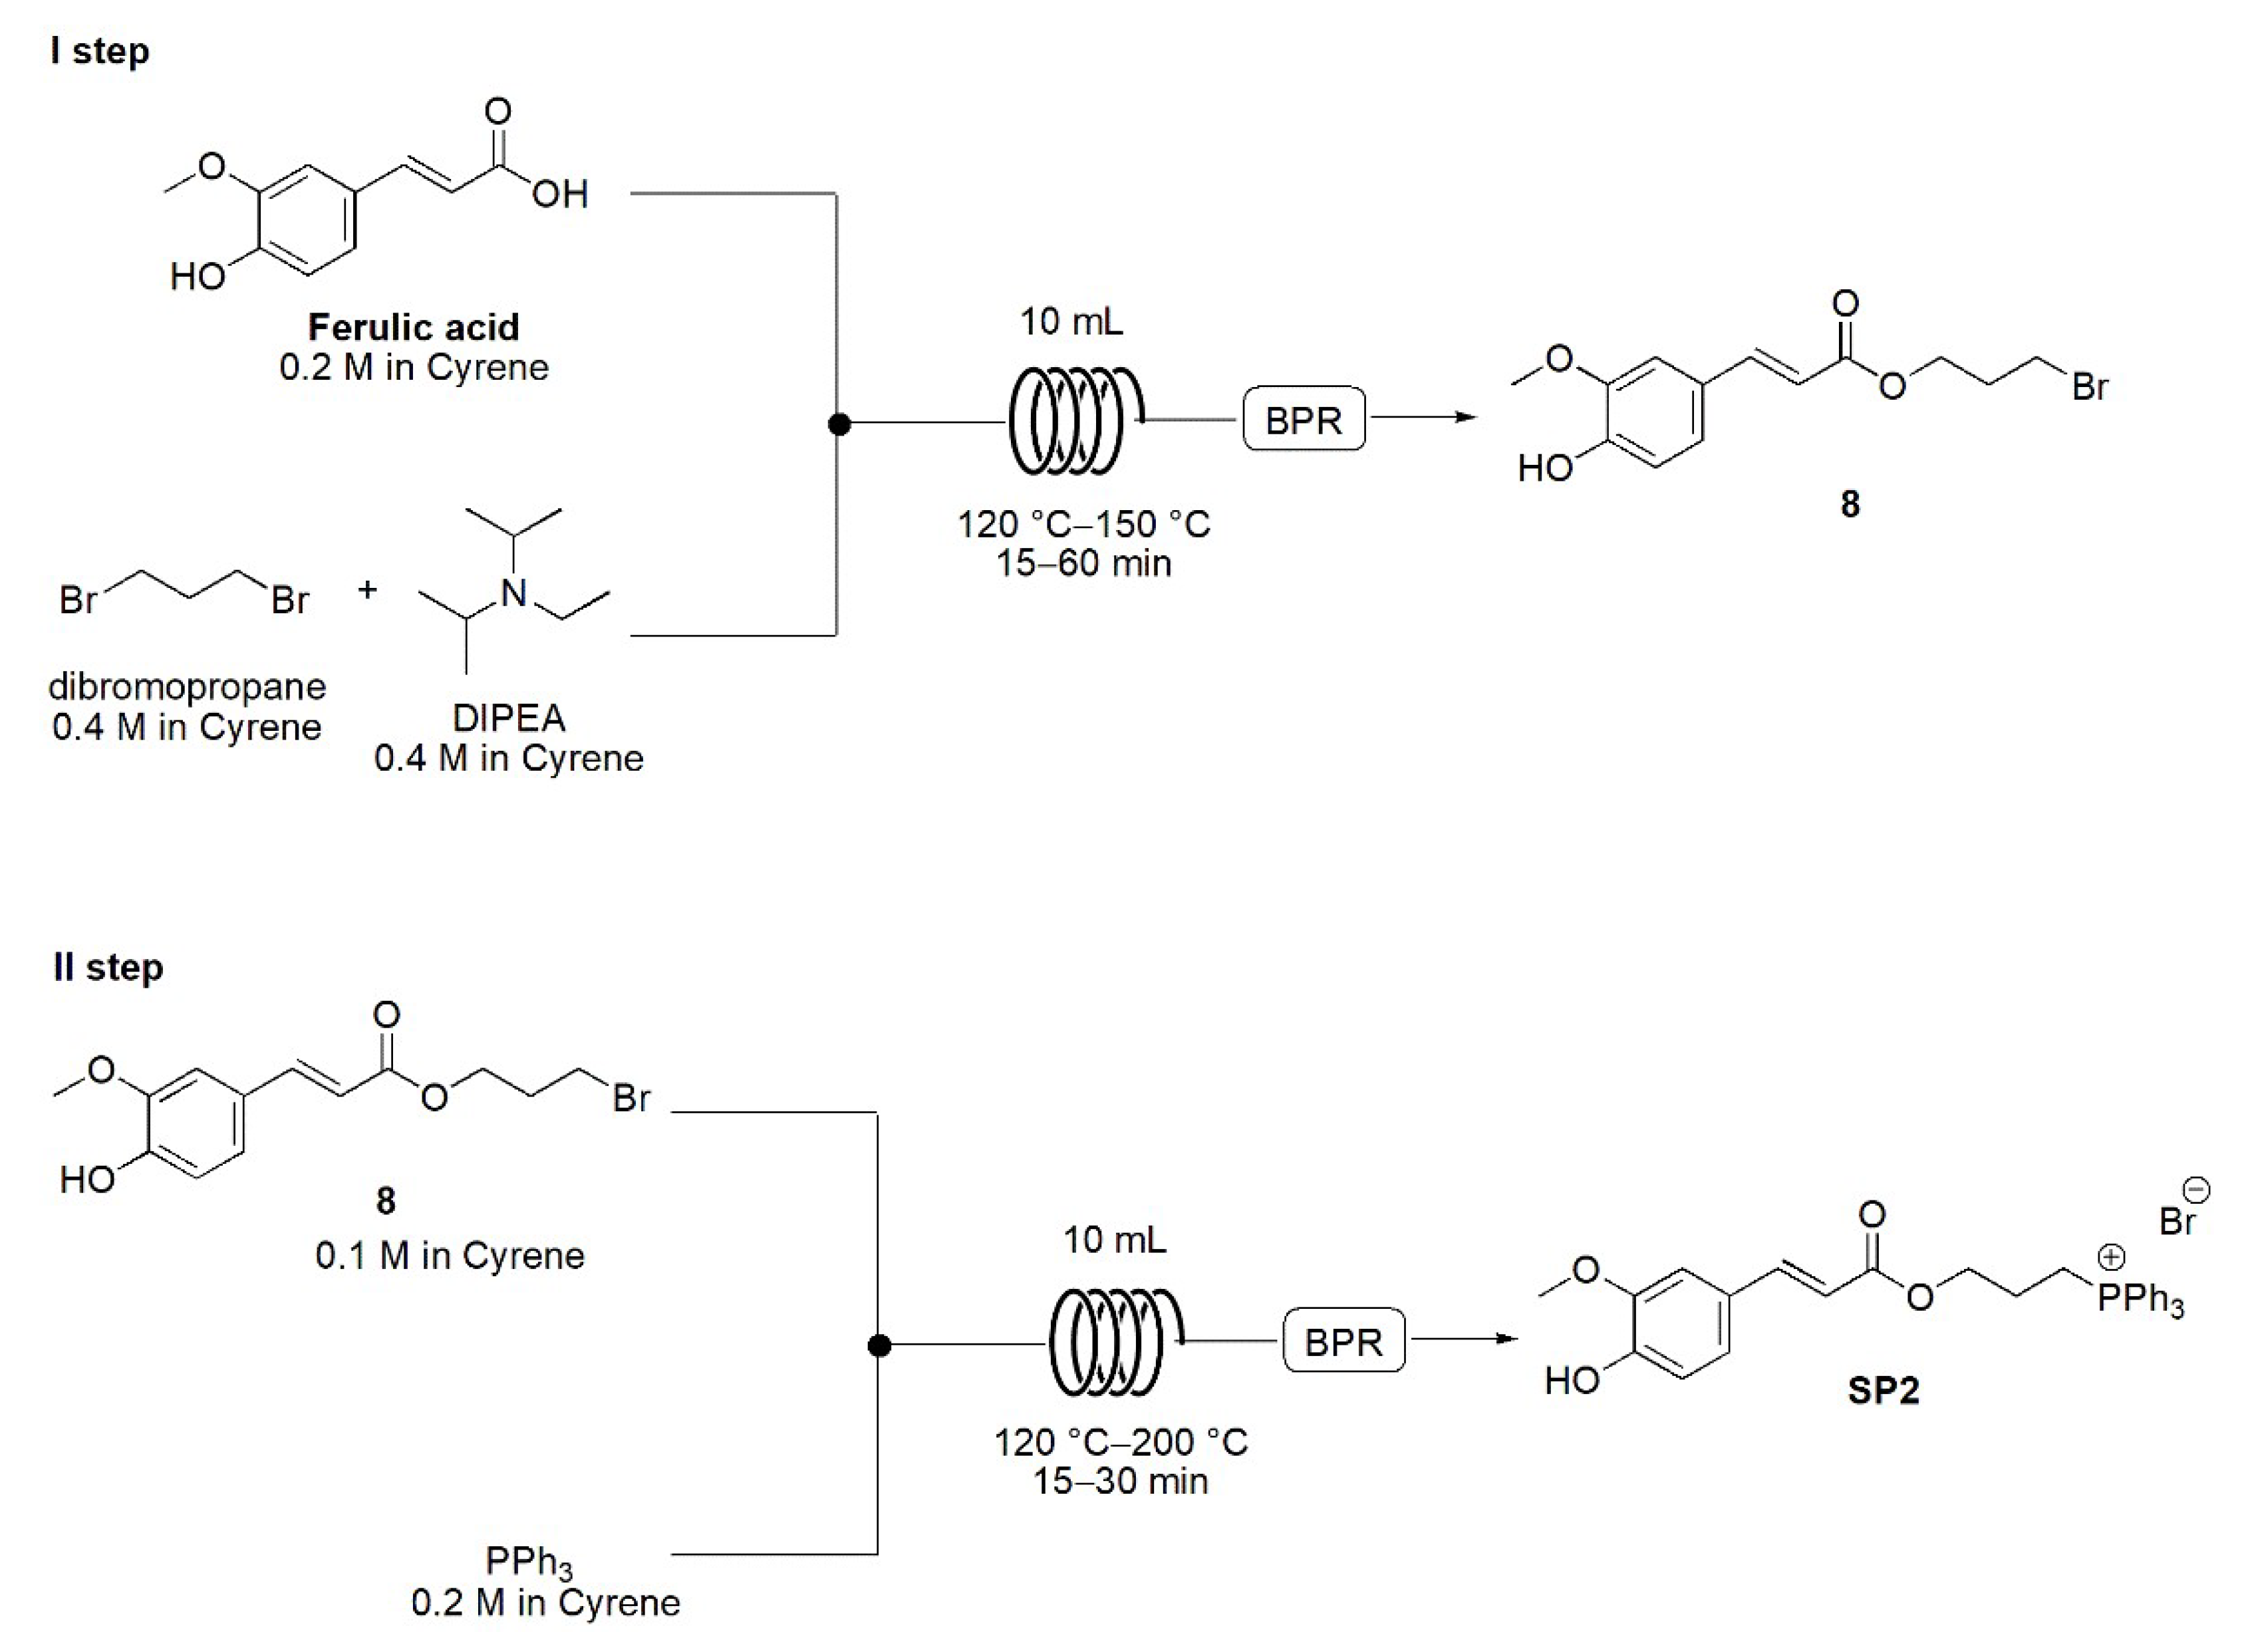
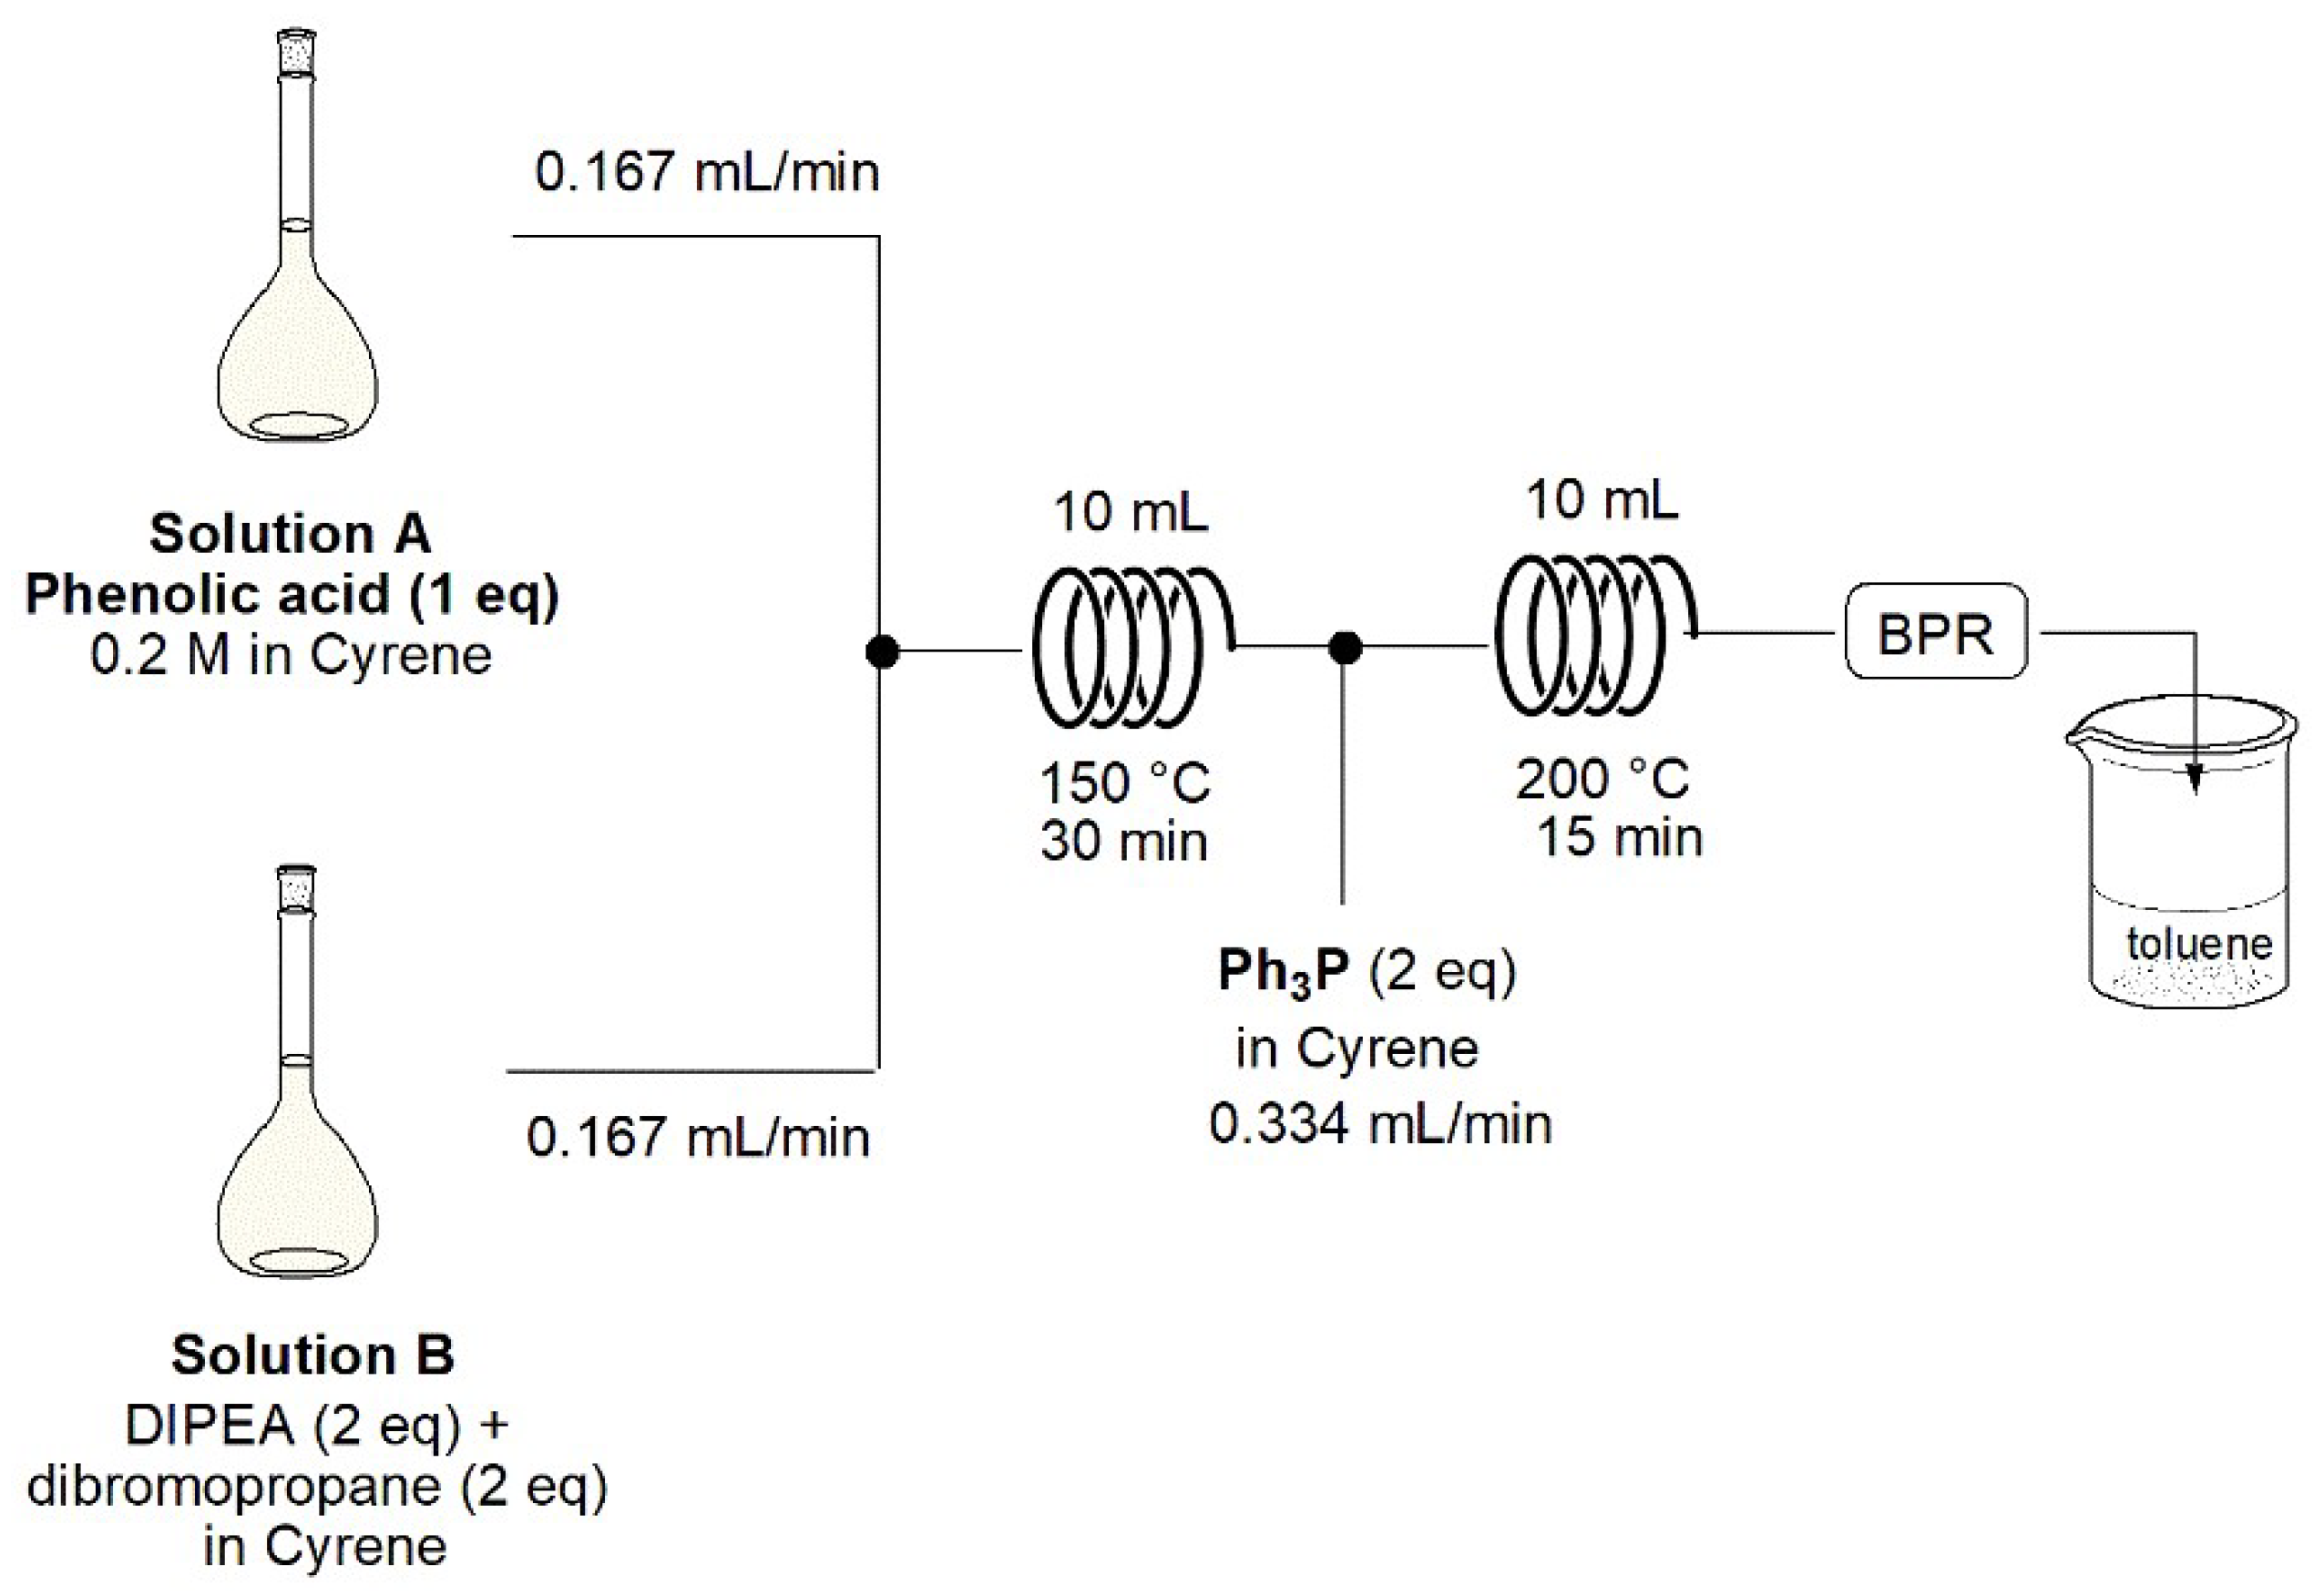
2.1. Two-Step Flow Procedure for the Synthesis of MITO Compounds SP1-7
2.2. Cell Cultures and Treatment
2.3. Cell Viability and Morphology
2.4. Cell Morphology
2.5. Statistical Analysis
3. Results and Discussion
3.1. Continuous Flow Synthesis of MITO Compounds SP1-7
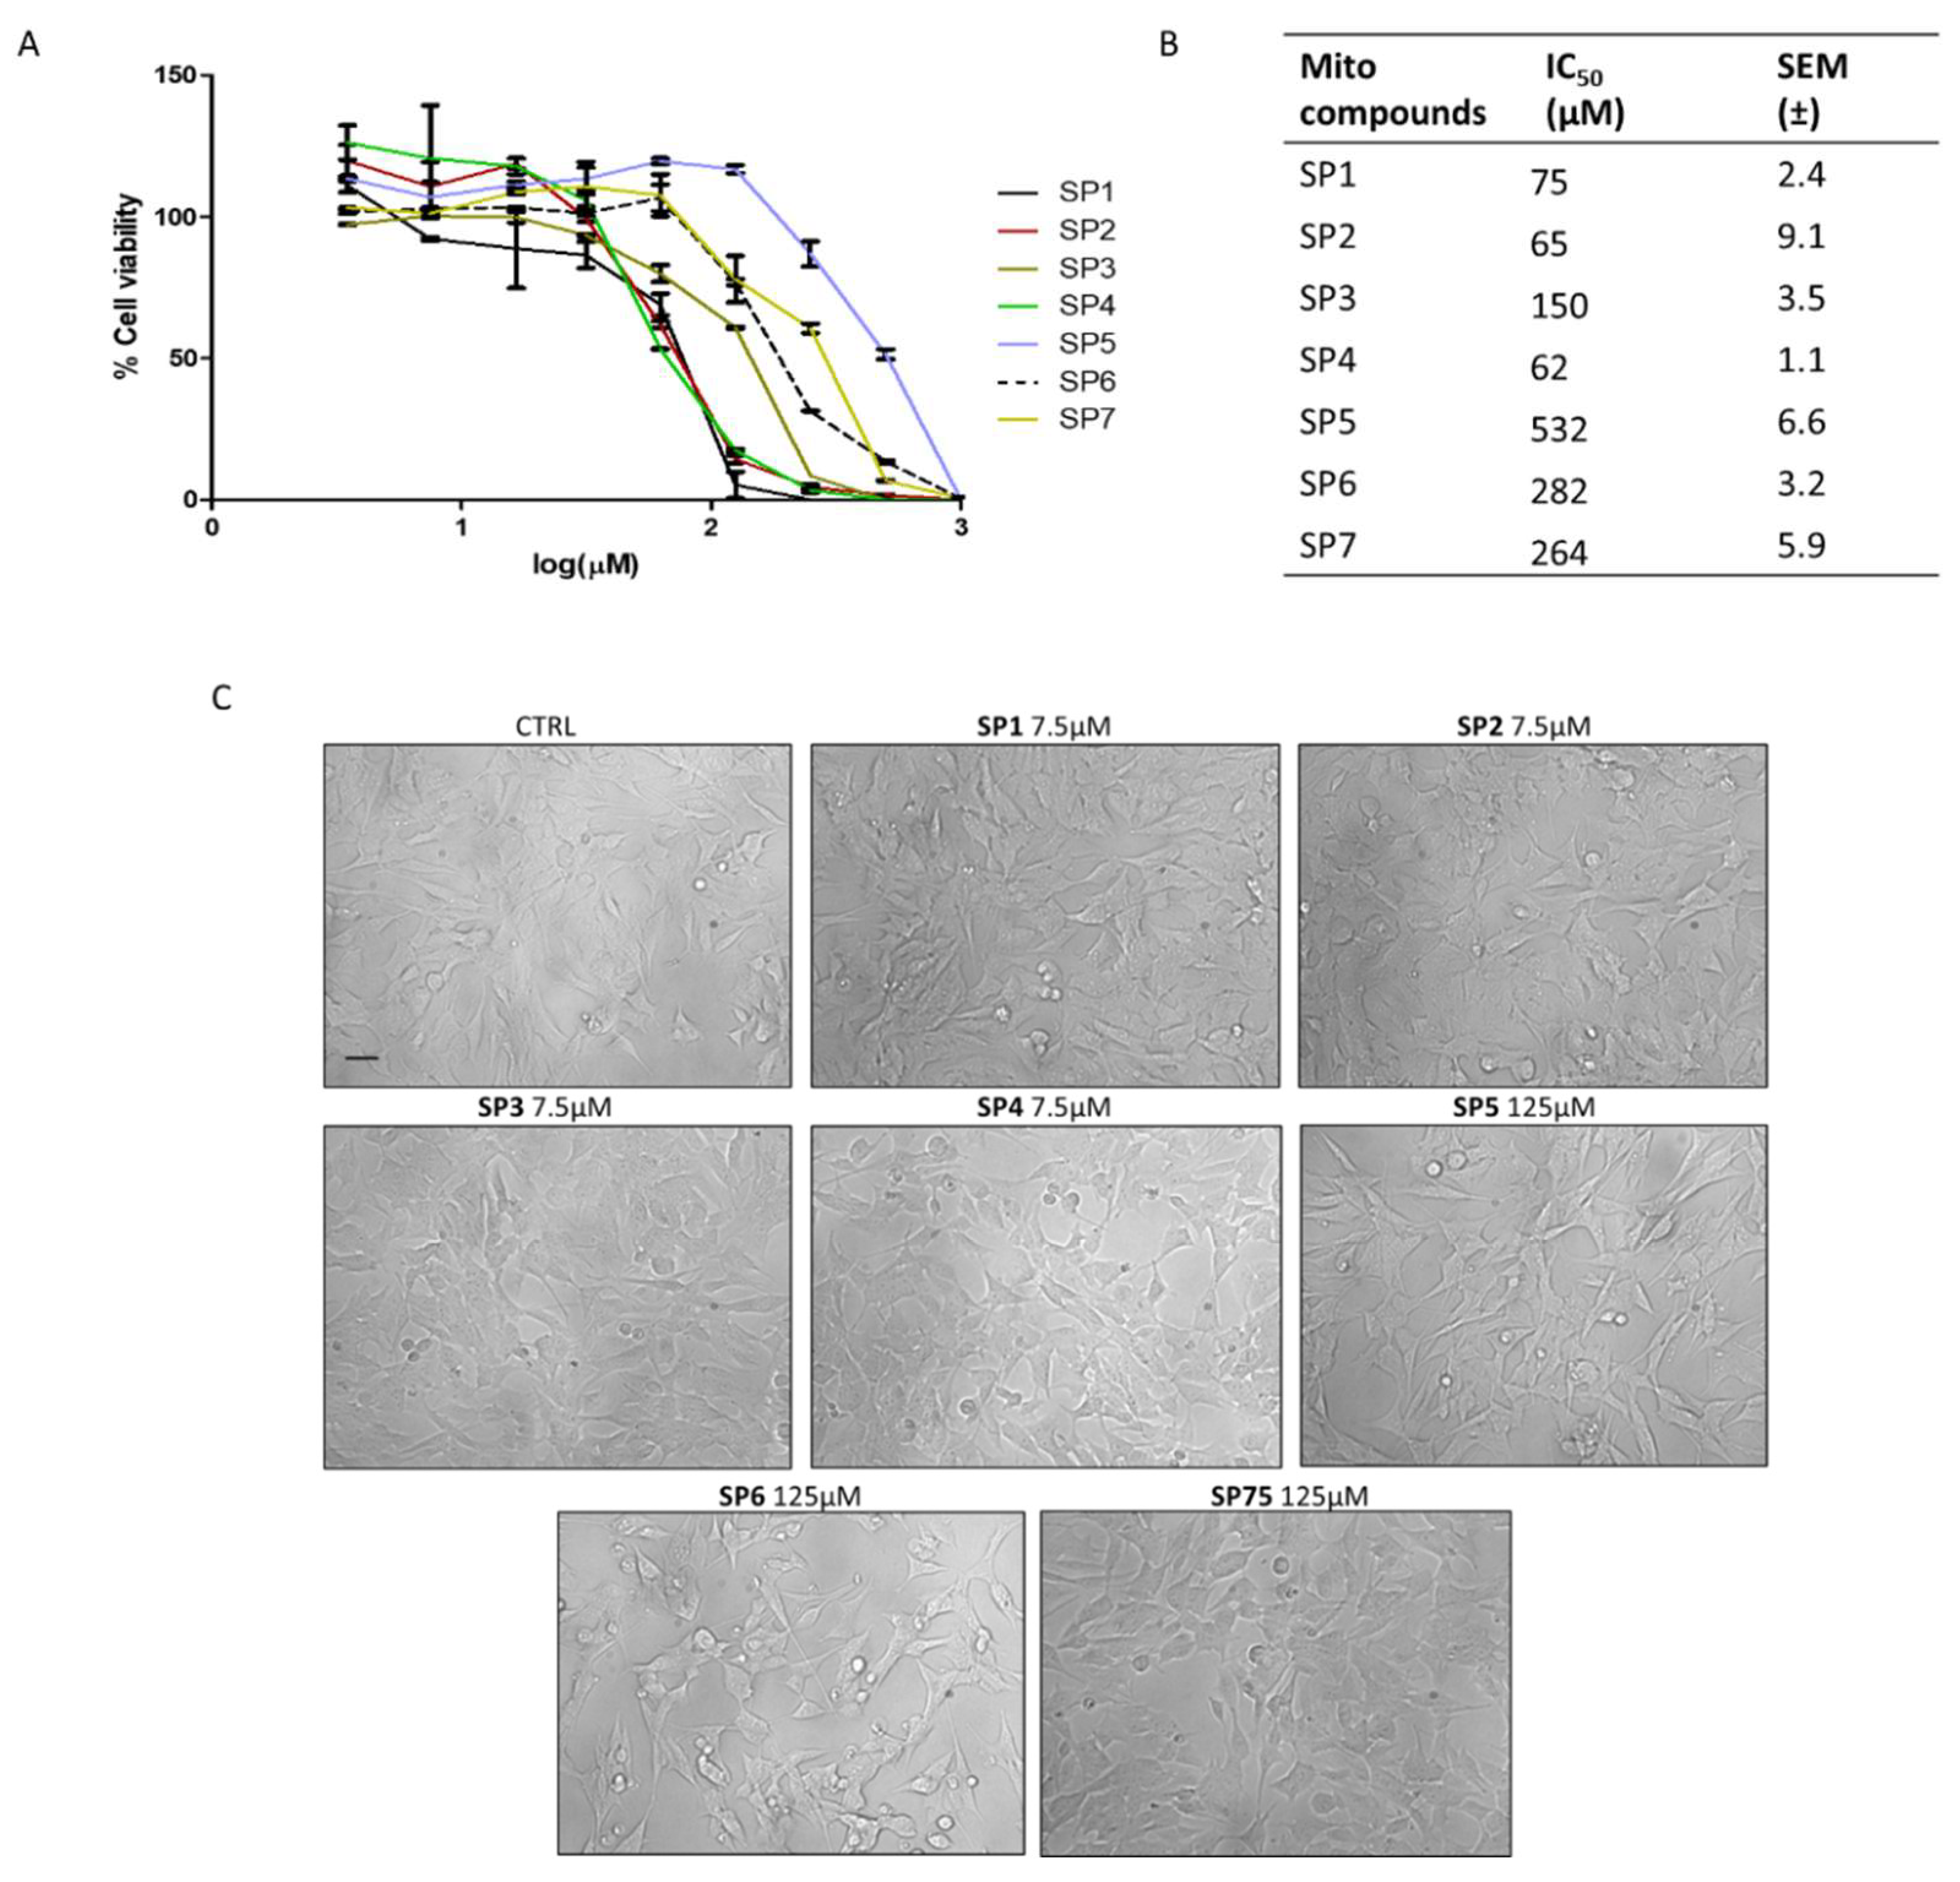
3.2. Effects of the MITO Compounds SP1-7 on Neuronal Cell Viability
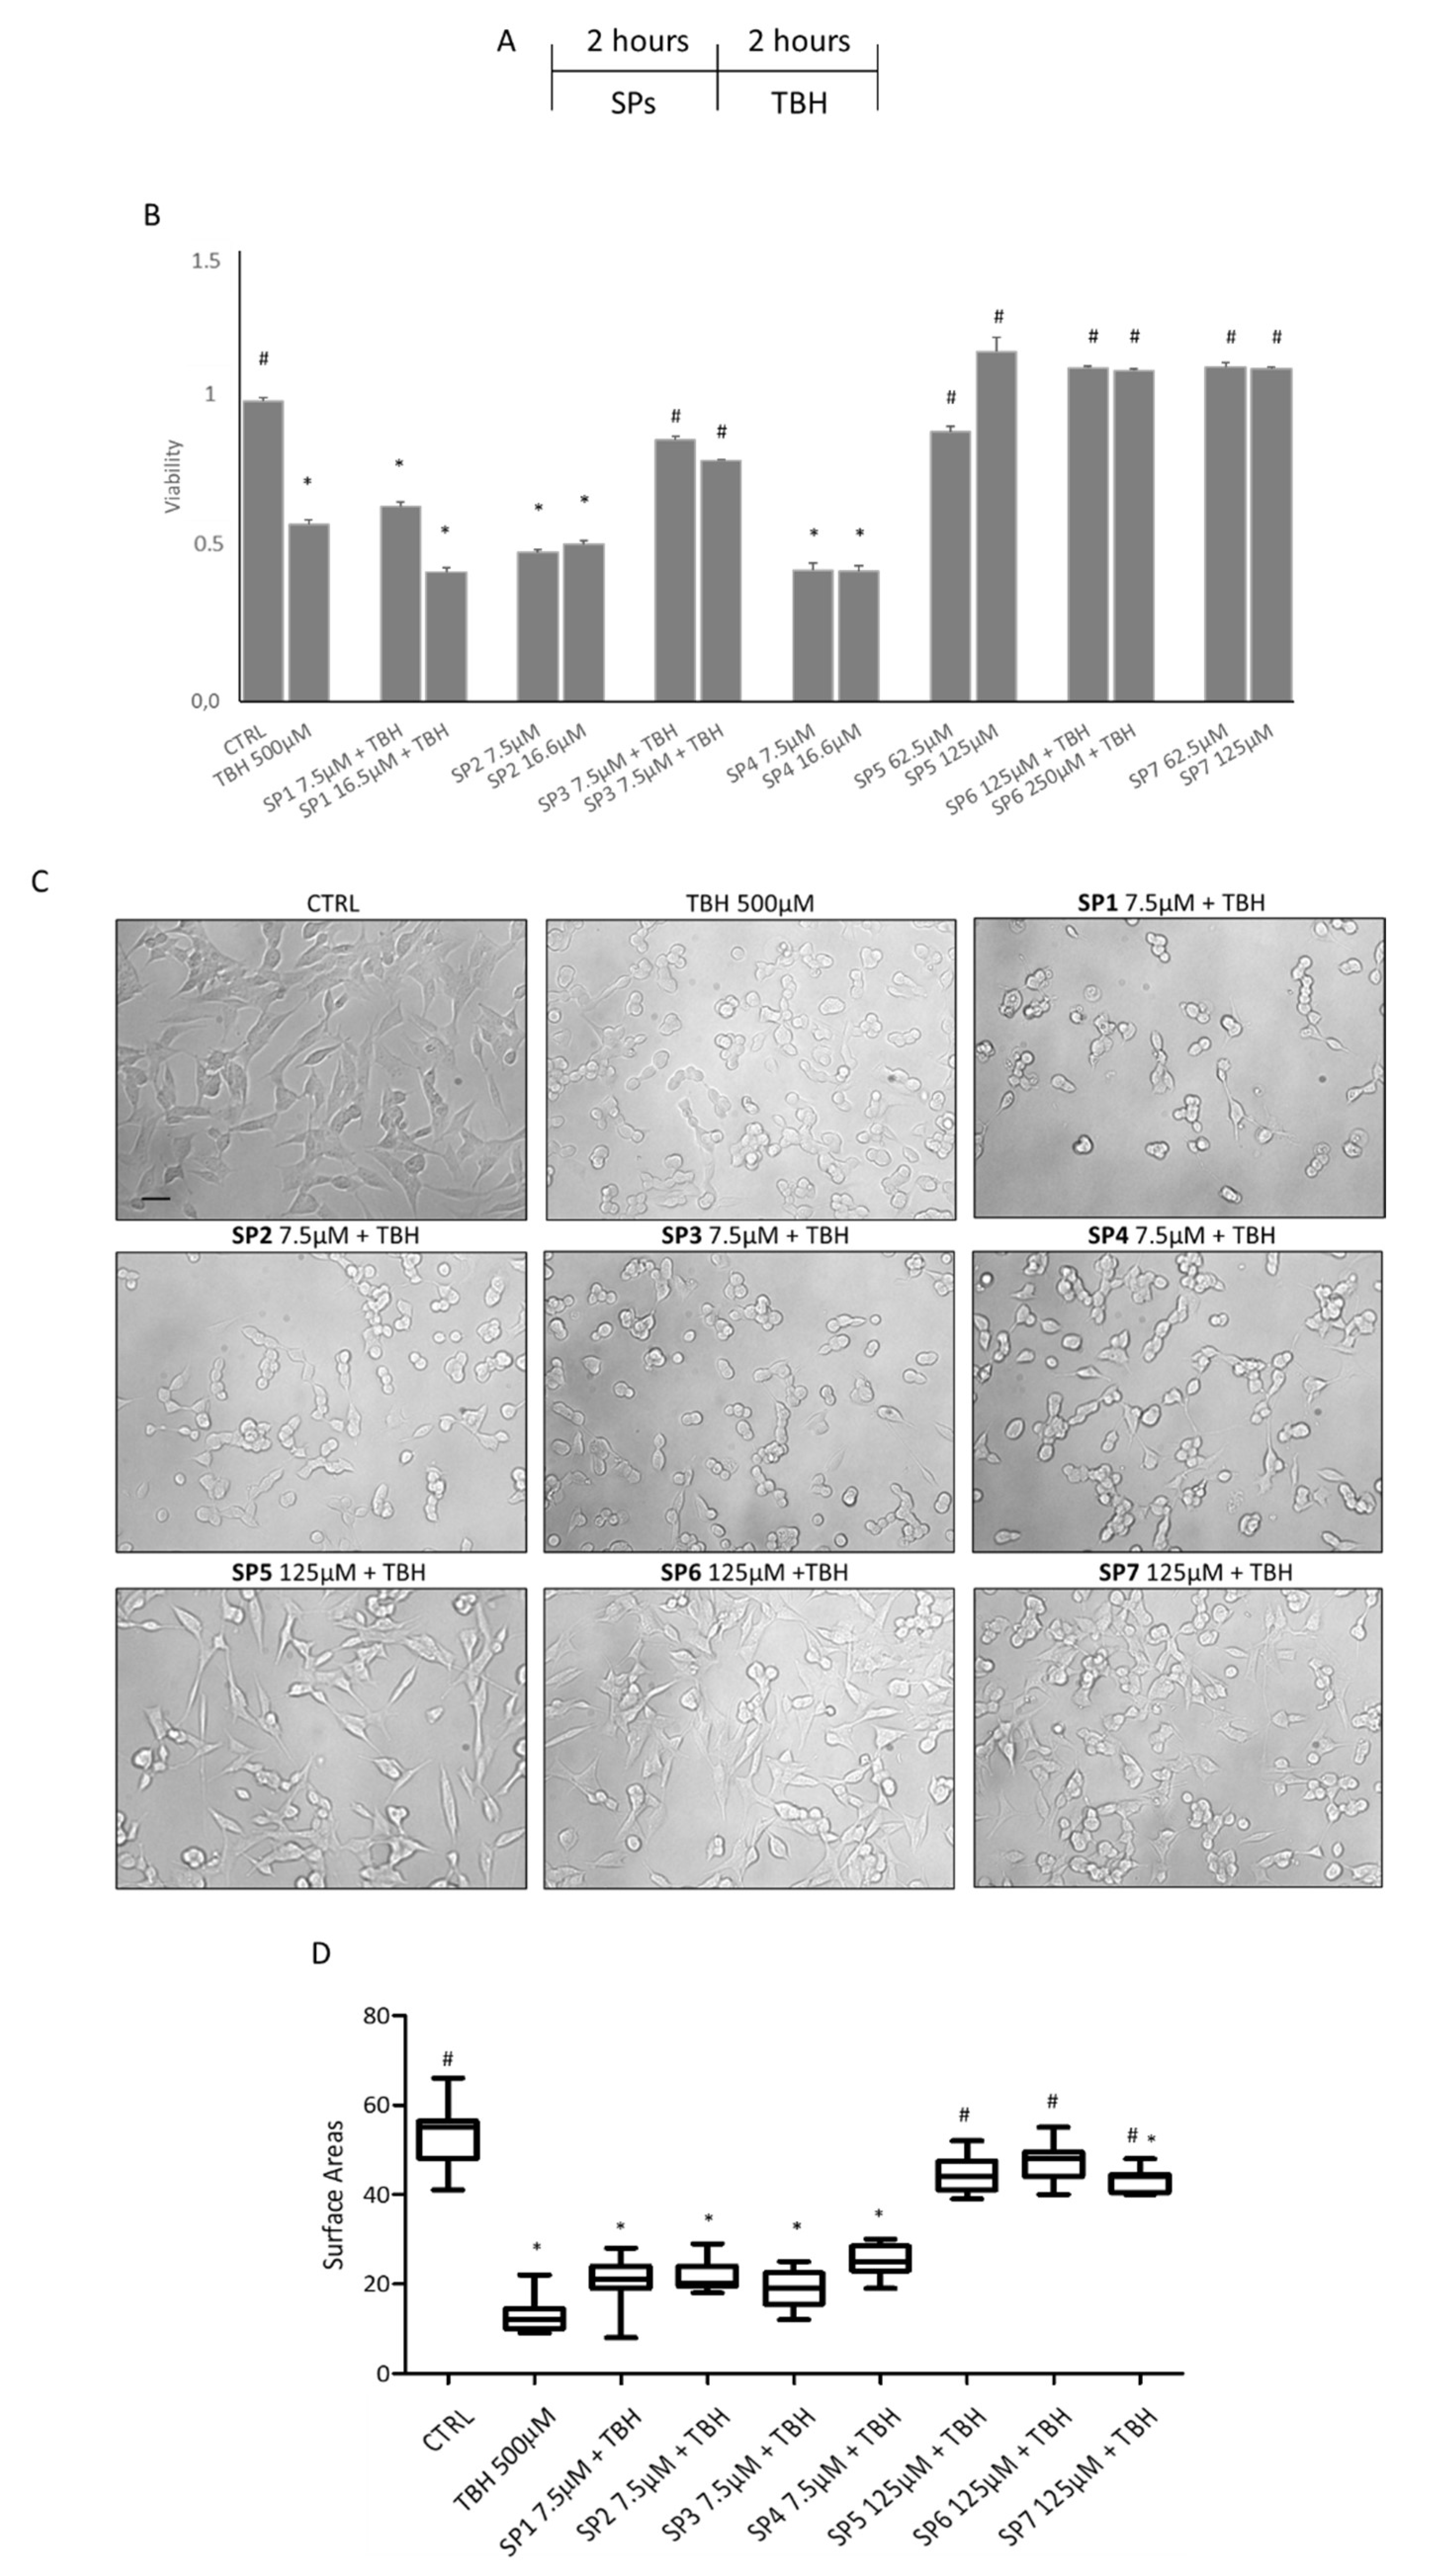
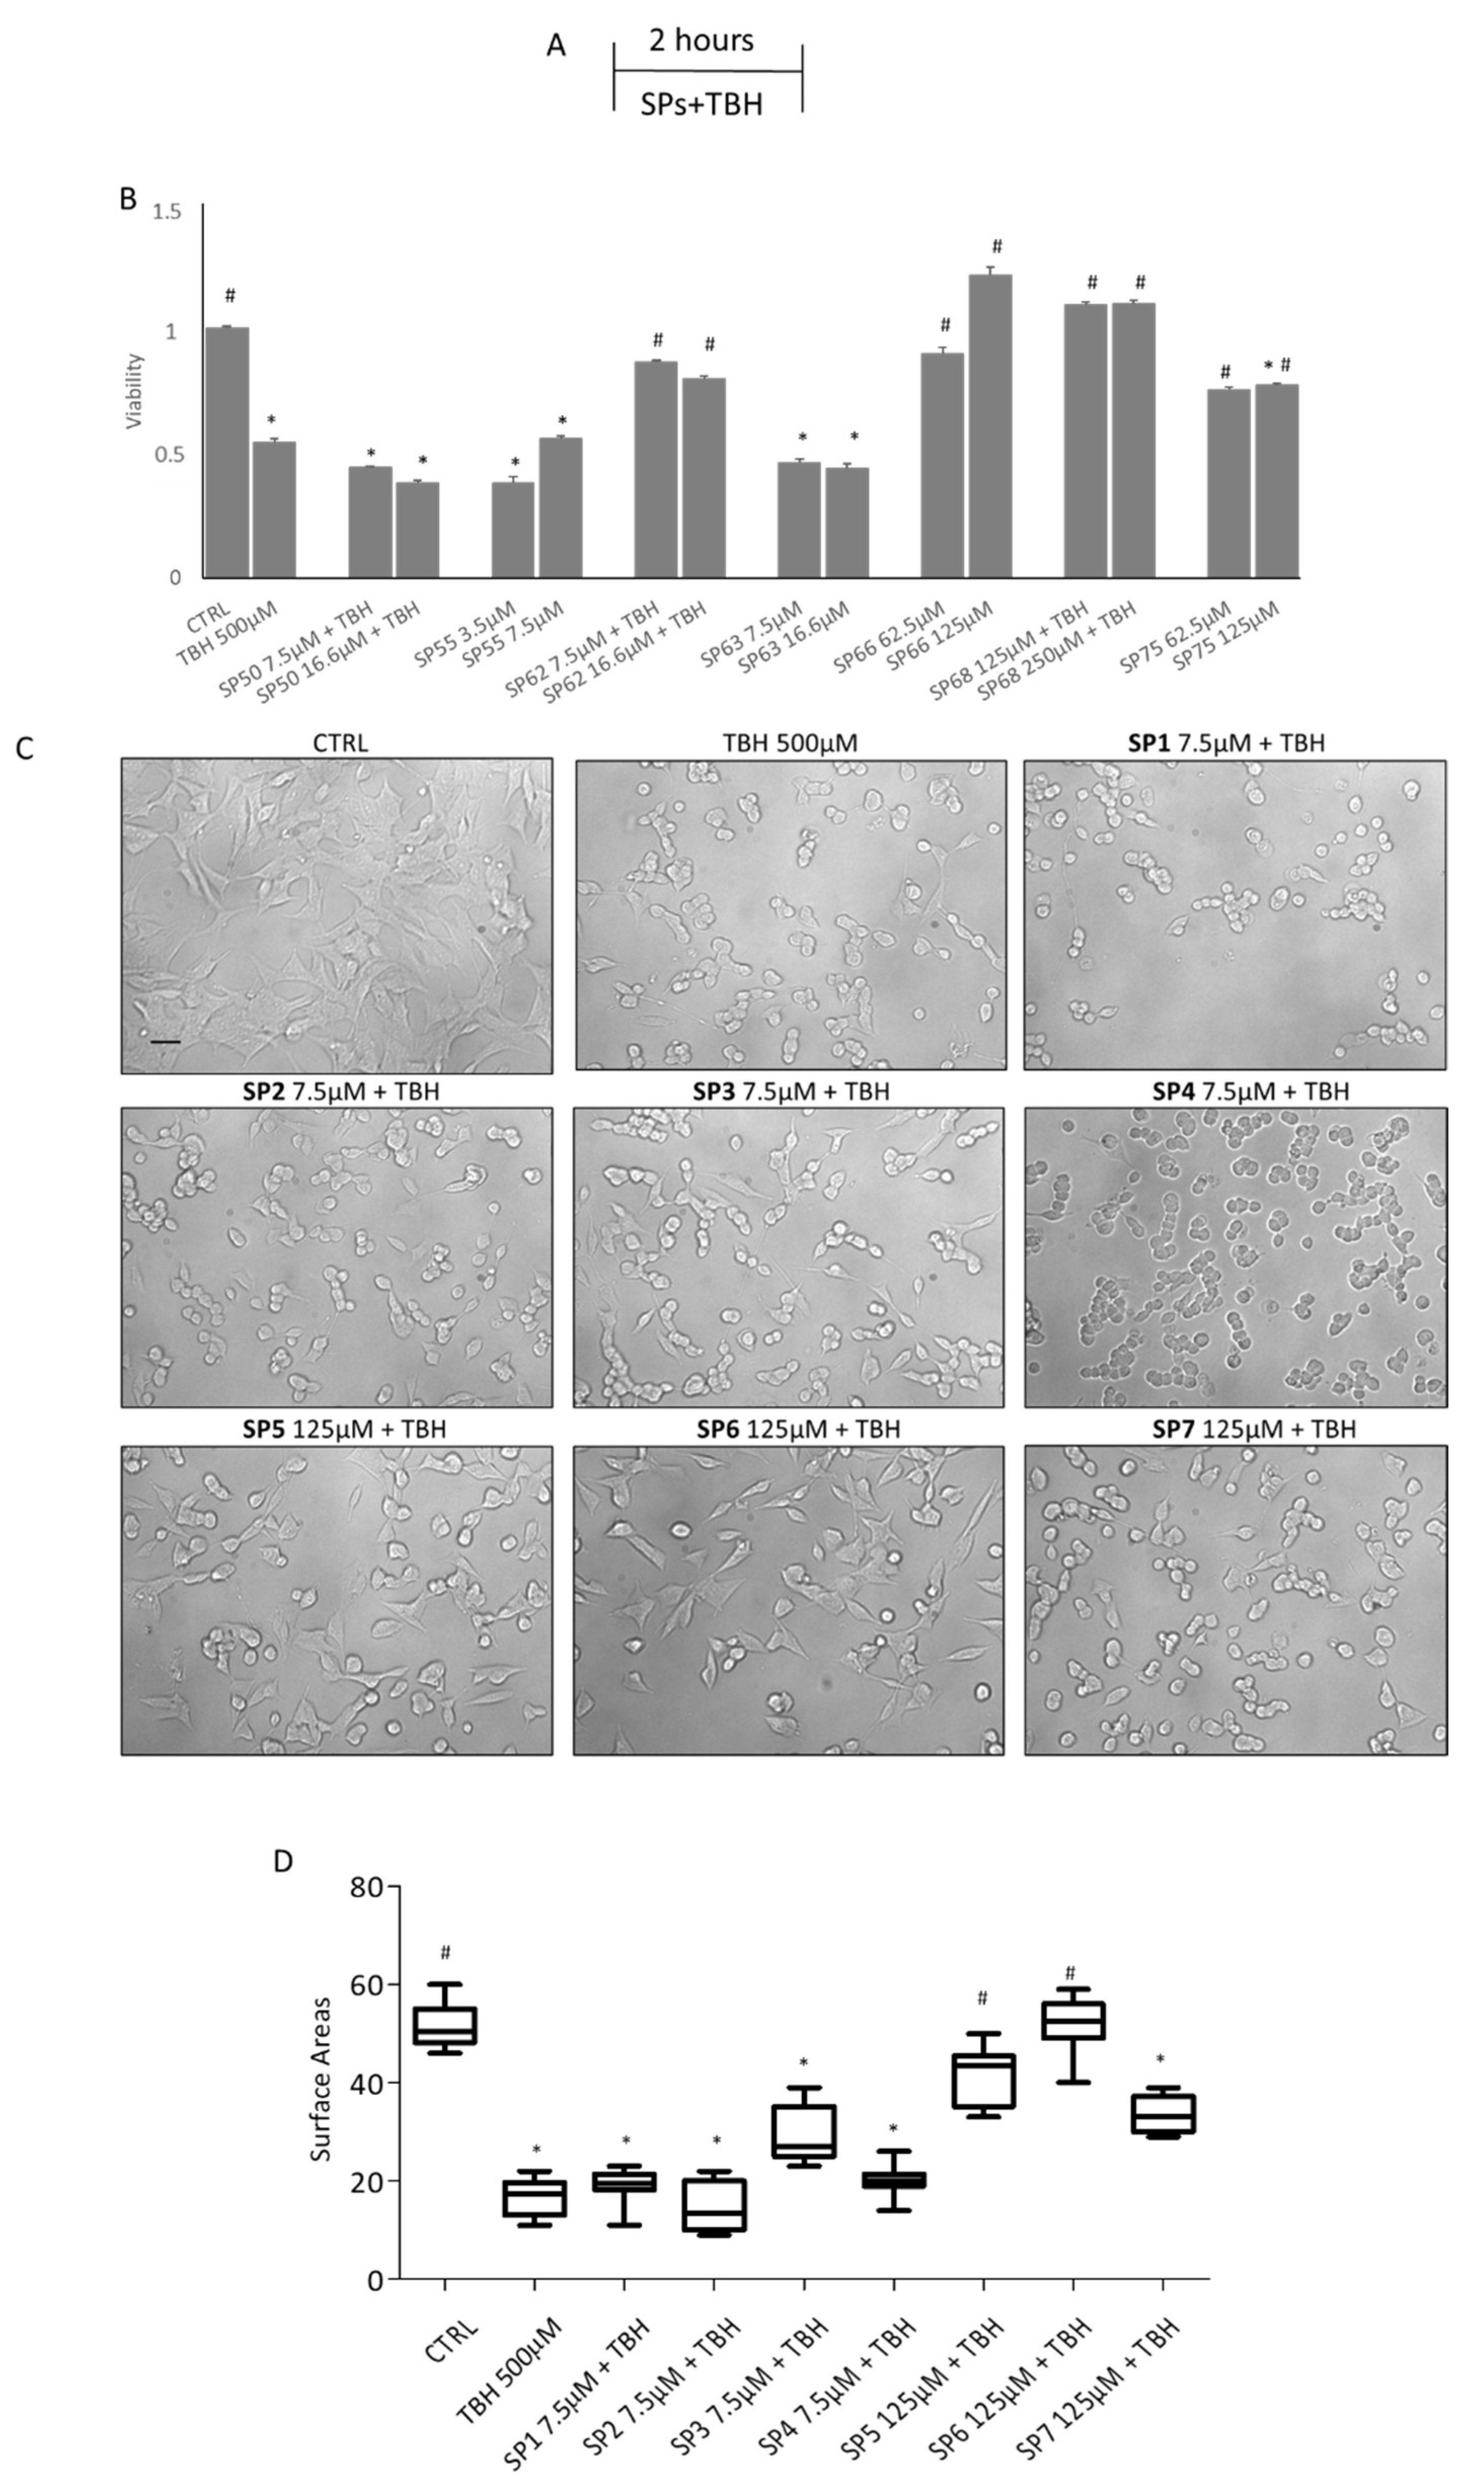
3.3. Biological Effects of the MITO Compounds SP1-7 on Neuronal Cells
4. Conclusions
Supplementary Materials
Author Contributions
Funding
Institutional Review Board Statement
Informed Consent Statement
Data Availability Statement
Acknowledgments
Conflicts of Interest
References
- Nunnari, J.; Suomalainen, A. Mitochondria: In Sickness and in Health. Cell 2012, 148, 1145–1159. [Google Scholar] [CrossRef] [PubMed] [Green Version]
- Cadonic, C.; Sabbir, M.G.; Albensi, B.C. Mechanisms of mitochondrial dysfunction in Alzheimer’s Disease. Mol. Neurobiol. 2016, 53, 6078–6090. [Google Scholar] [CrossRef] [PubMed]
- Bose, A.; Beal, M.F. Mitochondrial dysfunction in Parkinson’s Disease. J. Neurochem. 2016, 139, 216–231. [Google Scholar] [CrossRef] [PubMed]
- Di Carlo, M.; Giacomazza, D.; Picone, P.; Nuzzo, D.; San Biagio, P.L. Are oxidative stress and mitochondrial dysfunction the key players in the neurodegenerative diseases? Free Radic. Res. 2012, 46, 1327–1338. [Google Scholar] [CrossRef]
- Picone, P.; Nuzzo, D.; Caruana, L.; Scafidi, V.; Di Carlo, M. Mitochondrial dysfunction: Different routes to Alzheimer’s disease therapy. Oxidative Med. Cell. Longev. 2014, 2014, 780179. [Google Scholar] [CrossRef] [Green Version]
- Vasquez-Trincado, C.; Garcia-Carvajal, I.; Pennanen, C.; Parra, V.; Hill, J.A.; Rothermel, B.A.; Lavandero, S. Mitochondrial dynamics, mitophagy and cardiovascular disease. J. Physiol. 2016, 594, 509–525. [Google Scholar] [CrossRef]
- Zielonka, J.; Joseph, J.; Sikora, A.; Hardy, M.; Ouari, O.; Vasquez-Vivar, J.; Cheng, G.; Lopez, M.; Kalyanaraman, B. Mitochondria-targeted triphenylphosphonium-based compounds: Syntheses, mechanisms of action, and therapeutic and diagnostic applications. Chem. Rev. 2017, 117, 10043–10120. [Google Scholar] [CrossRef]
- Murphy, M.P. Selective targeting of bioactive compounds to mitochondria. Trends Biotechnol. 1997, 15, 326–330. [Google Scholar] [CrossRef]
- Lin, M.T.; Beal, M.F. Mitochondrial dysfunction and oxidative stress in neurodegenerative diseases. Nature 2006, 443, 787–795. [Google Scholar] [CrossRef]
- Picone, P.; Nuzzo, D.; Giacomazza, G.; Di Carlo, M. 4 β-Amyloid Peptide: The Cell Compartment Multi-faceted Interaction in Alzheimer’s Disease. Neurotox Res. 2020, 37, 250–263. [Google Scholar] [CrossRef]
- Nuzzo, D. Role of natural antioxidants on neuroprotection and neuroinflammation. Antioxidants 2021, 10, 608. [Google Scholar] [CrossRef]
- Kumar, N.; Goel, N. Phenolic acids: Natural versatile molecules with promising therapeutic applications. Biotechnol. Rep. 2019, 24, e00370. [Google Scholar] [CrossRef] [PubMed]
- Picone, P.; Nuzzo, D.; Caruana, L.; Messina, E.; Scafidi, V.; Di Carlo, M. Curcumin induces apoptosis in human neuroblastoma cells via inhibition of AKT and Foxo3a nuclear translocation. Free Radic. Res. 2014, 48, 1397–1408. [Google Scholar] [CrossRef] [PubMed]
- Nuzzo, D.; Presti, G.; Picone, P.; Galizzi, G.; Gulotta, E.; Giuliano, S.; Mannino, C.; Gambino, V.; Scoglio, S.; Di Carlo, M. Effects of the Aphanizomenon flos-aquae Extract (Klamin®) on a Neurodegeneration Cellular Model. Oxid. Med. Cell Longev. 2018, 2018, 9089016. [Google Scholar] [CrossRef] [Green Version]
- Reddy, C.A.; Somepalli, V.; Golakoti, T.; Kanugula, A.K.; Karnewar, S.; Rajendiran, K.; Vasagiri, N.; Prabhakar, S.; Kuppusamy, P.; Kotamraju, S.; et al. Mitochondrial-Targeted Curcuminoids: A Strategy to Enhance Bioavailability and Anticancer Efficacy of Curcumin. PLoS ONE 2014, 9, e89351. [Google Scholar] [CrossRef] [PubMed] [Green Version]
- Han, M.; Vakili, M.R.; Soleymani Abyaneh, H.; Molavi, O.; Lai, R.; Lavasanifar, A. Mitochondrial Delivery of Doxorubicin Via Triphenylphosphine Modification for Overcoming Drug Resistance in MDA-MB-435/DOX Cells. Mol. Pharm. 2014, 11, 2640–2649. [Google Scholar] [CrossRef]
- Millard, M.; Gallagher, J.D.; Olenyuk, B.Z.; Neamati, N.A. Selective Mitochondrial-Targeted Chlorambucil with Remarkable Cytotoxicity in Breast and Pancreatic Cancers. J. Med. Chem. 2013, 56, 9170–9179. [Google Scholar] [CrossRef] [PubMed]
- Gane, E.J.; Weilert, F.; Orr, D.W.; Keogh, G.F.; Gibson, M.; Lockhart, M.M.; Frampton, C.M.; Taylor, K.M.; Smith, R.A.; Murphy, M.P. The Mitochondria-targeted anti-oxidant Mitoquinone decreases liver damage in a phase II study of Hepatitis C patients. Liver Int. 2010, 30, 1019–1026. [Google Scholar] [CrossRef] [PubMed]
- Snow, B.J.; Rolfe, F.L.; Lockhart, M.M.; Frampton, C.M.; O’Sullivan, J.D.; Fung, V.; Smith, R.A.; Murphy, M.P.; Taylor, K.M. A Double-Blind, Placebo-Controlled Study to Assess the Mitochondria-Targeted Antioxidant MitoQ as a Disease-Modifying Therapy in Parkinson’s Disease. Mov. Disord. 2010, 25, 1670–1674. [Google Scholar] [CrossRef]
- Roby, M.H.H. Synthesis and Characterization of Phenolic Lipids. In Phenolic Compounds-Natural Sources, Importance and Applications; Soto-Hernandez, M., Palma-Tenango, M., del Rosario Garcia-Mateos, M., Eds.; IntechOpen: London, UK, 2017; pp. 89–116. [Google Scholar]
- Brouwer, T.; Schuur, B. Dihydrolevoglucosenone (Cyrene), a Biobased Solvent for Liquid−Liquid Extraction Applications. ACS Sustain. Chem. Eng. 2020, 8, 14807–14817. [Google Scholar] [CrossRef]
- Bousfield, T.W.; Pearce, K.P.R.; Nyamini, S.B.; Angelis-Dimakis, A.; Camp, J.E. Synthesis of amides from acid chlorides and amines in the bio-based solvent Cyrene™. Green Chem. 2019, 21, 3675. [Google Scholar] [CrossRef]
- Kong, D.; Dolzhenko, A.V. Cyrene: A bio-based sustainable solvent for organic synthesis. Sustain. Chem. Pharm. 2022, 25, 100591. [Google Scholar] [CrossRef]
- Cardullo, N.; Catinella, G.; Floresta, G.; Muccilli, V.; Rosselli, S.; Rescifina, A.; Bruno, M.; Tringali, C. Synthesis of Rosmarinic Acid Amides as Antioxidative and Hypoglycemic Agents. J. Nat. Prod. 2019, 82, 573–582. [Google Scholar] [CrossRef] [PubMed]
- Zhang, Y.-R.; Li, Y.-Y.; Wang, J.-Y.; Wang, H.-W.; Wang, H.-N.; Kang, X.-M.; Xu, W.-Q. Synthesis and Characterization of a Rosmarinic Acid Derivative that Targets Mitochondria and Protects against Radiation-Induced Damage In Vitro. Radiat. Res. 2017, 188, 264–275. [Google Scholar] [CrossRef]
- Lee, R.J.; Lindley, M.R.; Pritchard, G.J.; Kimber, M.C. A biosynthetically inspired route to substituted furans using the Appel reaction: Total synthesis of the furan fatty acid F5. Chem. Commun. 2017, 53, 6327–6330. [Google Scholar] [CrossRef] [Green Version]
- Orliac, A.; Gomez Pardo, D.; Bombrun, A.; Cossy, J. XtalFluor-E, an efficient coupling reagent for amidation of carboxylic acids. Org. Lett. 2013, 15, 902–905. [Google Scholar] [CrossRef]
- Lecomte, J.; Giraldo, L.J.L.; Laguerre, M.; Baréa, B.; Villeneuve, P. Synthesis, characterization and free radical scavenging properties of rosmarinic acid fatty esters. J. Am. Oil Chem. Soc. 2010, 87, 615–620. [Google Scholar] [CrossRef]
- Chen, L.; Zhang, Y.; Kong, X.; Peng, S.; Tian, J. Synthesis and biological evaluation of nitric oxide-releasing derivatives of oleanolic acid as inhibitors of HepG2 cell apoptosis. Bioorg. Med. Chem. Lett. 2007, 17, 2979–2982. [Google Scholar] [CrossRef]


Publisher’s Note: MDPI stays neutral with regard to jurisdictional claims in published maps and institutional affiliations. |
© 2022 by the authors. Licensee MDPI, Basel, Switzerland. This article is an open access article distributed under the terms and conditions of the Creative Commons Attribution (CC BY) license (https://creativecommons.org/licenses/by/4.0/).
Share and Cite
Pecora, D.; Annunziata, F.; Pegurri, S.; Picone, P.; Pinto, A.; Nuzzo, D.; Tamborini, L. Flow Synthesis of Nature-Inspired Mitochondria-Targeted Phenolic Derivatives as Potential Neuroprotective Agents. Antioxidants 2022, 11, 2160. https://doi.org/10.3390/antiox11112160
Pecora D, Annunziata F, Pegurri S, Picone P, Pinto A, Nuzzo D, Tamborini L. Flow Synthesis of Nature-Inspired Mitochondria-Targeted Phenolic Derivatives as Potential Neuroprotective Agents. Antioxidants. 2022; 11(11):2160. https://doi.org/10.3390/antiox11112160
Chicago/Turabian StylePecora, Desirée, Francesca Annunziata, Sergio Pegurri, Pasquale Picone, Andrea Pinto, Domenico Nuzzo, and Lucia Tamborini. 2022. "Flow Synthesis of Nature-Inspired Mitochondria-Targeted Phenolic Derivatives as Potential Neuroprotective Agents" Antioxidants 11, no. 11: 2160. https://doi.org/10.3390/antiox11112160