Article

Microglial Hemoxygenase-1 Deletion Reduces Inflammation in the Retina of Old Mice with Tauopathy

by
José A. Fernández-Albarral
1,†,
Elena Salobrar-García
1,2,†,
José A. Matamoros
1,2,
Cristina Fernández-Mendívil
3,4,
Eric del Sastre
3,4,
Lejing Chen
1,
Rosa de Hoz
1,2,
Inés López-Cuenca
1,
Lidia Sánchez-Puebla
1,
José M. Ramírez
1,5,
Juan J. Salazar
1,2,
Manuela G. Lopez
3,4,* and
Ana I. Ramírez
1,2,*
1
Instituto de Investigaciones Oftalmológicas Ramón Castroviejo, Grupo UCM 920105, IdISSC, Universidad Complutense de Madrid, 28040 Madrid, Spain
2
Facultad de Óptica y Optometría, Departamento de Inmunología, Oftalmología y ORL, Universidad Complutense de Madrid, 28037 Madrid, Spain
3
Instituto Teófilo Hernando for Drug Discovery, Department of Pharmacology, School of Medicine, Universidad Autónoma Madrid, 28029 Madrid, Spain
4
Instituto de Investigación Sanitario (IIS-IP), Hospital Universitario de La Princesa, 28006 Madrid, Spain
5
Facultad de Medicina, Departamento de Inmunología, Oftalmología y ORL, Universidad Complutense de Madrid, 28040 Madrid, Spain
*
Authors to whom correspondence should be addressed.
These authors contributed equally to this work.
Antioxidants 2022, 11(11), 2151; https://doi.org/10.3390/antiox11112151
Submission received: 11 October 2022 / Revised: 27 October 2022 / Accepted: 27 October 2022 / Published: 30 October 2022
(This article belongs to the Special Issue Experimental and Therapeutic Targeting of Heme Oxygenase)

Abstract

:
Tauopathies such as Alzheimer’s disease are characterized by the accumulation of neurotoxic aggregates of tau protein. With aging and, especially, in Alzheimer’s patients, the inducible enzyme heme oxygenase 1 (HO-1) progressively increases in microglia, causing iron accumulation, neuroinflammation, and neurodegeneration. The retina is an organ that can be readily accessed and can reflect changes that occur in the brain. In this context, we evaluated how the lack of microglial HO-1, using mice that do not express HO-1 in microglia (HMO-KO), impacts retinal macro and microgliosis of aged subjects (18 months old mice) subjected to tauopathy by intrahippocampal delivery of AAV-hTauP301L (TAU). Our results show that although tauopathy, measured as anti-TAUY9 and anti-AT8 positive immunostaining, was not observed in the retina of WT-TAU or HMO-KO+TAU mice, a morphometric study of retinal microglia and macroglia showed significant retinal changes in the TAU group compared to the WT group, such as: (i) increased number of activated microglia, (ii) retraction of microglial processes, (iii) increased number of CD68+ microglia, and (iv) increased retinal area occupied by GFAP (AROA) and C3 (AROC3). This retinal inflammatory profile was reduced in HMO-KO+TAU mice. Conclusion: Reduction of microglial HO-1 could be beneficial to prevent tauopathy-induced neuroinflammation.

1. Introduction

Neurodegenerative diseases (NDs) (Alzheimer’s disease (AD), Parkinson’s disease (PD), amyotrophic lateral sclerosis (ALS), among others) cause progressive degeneration of neurons leading to dementia. Their incidence increases with aging [1]. They also share some pathogenic mechanisms, such as DNA damage, epigenetic changes [2,3], metal accumulation, pathological protein aggregation and proteinopathy, oxidative stress, immune dysregulation, and microglial activation [4,5,6]. In NDs, the excessive accumulation of metals such as iron (Fe) can induce oxidative stress, mitochondrial dysfunction, DNA fragmentation, and apoptosis [2,7,8].
Tau protein accumulation (tauopathies) also occurs in many NDs, such as in AD and PD, among others [9,10]. Genetic mutations in tau protein can cause its hyperphosphorylation (p-tau), which alters microtubules and leads to the formation of pathological insoluble tau aggregates (neurofibrillary tangles), which are toxic to neurons [11,12]. These diseases are characterized by synaptic dysfunction, neuroinflammation, neuronal death, and dementia [13].
Neuroinflammation is a common process in NDs. In the inflammatory process of the central nervous system (CNS), glial cells (astroglia and microglia) play important roles and can respond and activate rapidly in the presence of any type of damage (reactive gliosis). However, chronic gliosis induces disease progression [14]. After injury, microglia proliferate, migrate to damaged areas, become more phagocytic, modify the expression of enzymes and receptors, and release a variety of inflammatory factors [15]. In addition, microglia activate and change their morphology (retract their processes, increase the soma size) and can adopt hyperamified, reactive, amoeboid, or even dystrophic forms. Dystrophic microglia is a phenotype especially related to aging and neurodegeneration and is associated with NDs [16,17,18,19]; it is characterized by cytoplasmic fragmentation and the release of proinflammatory cytokines associated with chronic neuroinflammation and parainflammation [20]. Microglia in the aging process and NDs show an increased inflammatory state and are referred to as primed microglia [21,22,23,24,25,26]. Activated microglia can exist in a continuum between two activation phenotypes, namely, the M1 and M2 [21,27]. The proinflammatory M1 state is associated with neurodegeneration and produces an intense inflammatory response characterized by the release of proinflammatory cytokines and inflammatory mediators, while in the M2 anti-inflammatory state, the release of anti-inflammatory cytokines and neurotrophic factors (BDNFs) occurs, contributing to neuronal survival [15,28,29,30]. Uncontrolled activation of the M1 phenotype can lead to a state of chronic inflammation that will cause progressive loss of neurons, as has been observed in some NDs [22,23].
After damage, astrocytes and Müller cells (macroglial cells in retina) respond by means of a process called reactive gliosis, which includes astrocyte proliferation and migration, an increase in soma size and processes, an increase in the number of astroglial processes [31], and an increase in the expression of gliofibrillary acidic protein (GFAP) [32]. This astrogliosis has been observed in NDs such as in EA [33] or PD [34]. Reactive astrocytes with a neurotoxic A1 phenotype have been described, which overexpress neuroinflammatory factors such as IL-1α and TNF-α, and complement proteins such as C1q or C3 [35], exhibiting neurotoxic and detrimental functions to the nervous system and destroying the synapse. These A1 astrocytes have been detected in several ND models, such as ALS, AD, prion disease, or Huntington’s disease [36].
The retina, as part of the CNS, is considered a window to the brain [37]. It has been observed that several NDs affecting the brain have retinal involvement and even precede brain damage [37]. Therefore, the study of the retina may be useful to indicate the progression of these NDs [38,39,40,41].
Within NDs, tauopathies can have retinal involvement. In the retina, tau protein is expressed in the plexiform layers [42]. In animal models of AD, increased tau phosphorylation has been observed in these layers compared to normal retinal tissues, in addition to microglial activation, loss of retinal ganglion cells (RGCs), and impaired retinal function. In some studies, these changes have preceded the formation of tau aggregates in the brain [43,44].
As we mentioned above, neuroinflammation is a key process in NDs, and therefore strategies for the control of inflammation are being developed. Iron and the neuroinflammatory process are bidirectionally related in such a way that iron modifies the inflammatory phenotype of microglia and, in turn, microglia secrete diffusible mediators that cause remodeling of neuronal iron homeostasis and also regulate the entry of iron into the brain [45]. Iron homeostasis involves a molecule called heme oxygenase (HO). This enzyme participates in the catabolism of the heme group, giving rise to three products, namely, carbon monoxide (CO); biliverdin, which is rapidly converted to bilirubin; and labile iron (Fe2+) [46,47]. HO-1 is an inducible enzyme known for its antioxidant, anti-inflammatory, and neuroprotective effects [48,49,50]. Under physiological conditions, HO-1 expression is found at very low levels in the CNS, but this expression can be rapidly induced, preferentially in glial cells, in response to stress and various oxidative stimuli, including metals, light exposure, and inflammatory cytokines (TNF-α, β-amyloid) [51,52,53]. However, chronic systemic inflammation that occurs with aging and in NDs increases HO-1 expression, mainly mediated by activated microglia [54,55], and has been related to disease progression [56]. This is associated with an accumulation of iron derived from HO-1 catabolism, together with alterations in iron transport and metabolism, contributing to exacerbate the neurodegenerative effect [52,57,58].
Genetic deletion of HO-1 or pharmacological inhibition of HO-1 activity may constitute interesting therapeutic approaches to reduce age-related pathological features and delay the development of NDs [55].
Knowing that the retina reflects the pathology of the brain and that microglial HO-1 deletion was protective in old subjects subjected to an inflammatory stimuli, the aim of this study was to evaluate how microglial deletion of HO-1 could impact the inflammatory process in the retina (analyzing microglia, astrocytes, and Müller glia) of old mice with brain tauopathy.

2. Materials and Methods

2.1. Animals and Experimental Groups

All animals were housed in the animal facility of the Faculty of Medicine of the Autónoma University of Madrid, subjected to a 12 h light/12 h dark cycle. The animals had access to food and water ad libitum. Every effort was made to minimize animal suffering and reduce the number of animals used. All experimental procedures were performed following the Guide for the Care and Use of Laboratory Animals and were previously approved by the Institutional Ethics Committee of the Autonomous University of Madrid and the Autonomous Community of Madrid, Spain (PROEX 218.5/20) following the European Guidelines for the use and care of animals of animals for research in accordance with the European Union Directive of 22 September 2010 (2010/63/EU) and with the Spanish Royal Decree of 1 February 2013 (53/2013).
Aged 15-month-old male C57BL/6 mice were used and distributed into the following study groups: Wild type (WT) control group (n = 6); Tauopathy (TAU) group (n = 6); HO-1 knockout group (HMO-KO) (n = 6); HO-1 knockout group with tauopathy (HMO-KO+TAU) (n = 6).

2.2. Generation of Hemoxygenase-1 Knockout Animals for the HMO-KO and HMO-KO+TAU Groups

Microglial cell-specific knockout (KO) mice for the HMOX1 gene (LyzMcreHMOX1f/f: HMOX1M-KO) were generated using the cre/LoxP system at the Autónoma University of Madrid. For this purpose, LyzMcre mice (The Jackson Laboratory: B6.129P2-Lyz2tm1(cre)Ifo/J, stock: 004781), which carry the cre recombinase under the control of a myeloid promoter; and HMOX1LoxP mice (RIKEN BioResource Center, stock.: RBRC03163) were crossed, giving rise to heterozygous offspring for both the cre recombinase and the LoxP site. Heterozygous mice were crossed and offspring homozygous for the LoxP site carrying the cre recombinase were used for experiments (HMO-KO). In these mice, cre recombinase mediates a specific deletion of the HMOX1 gene flanked by LoxP recombination sites in myeloid cells and thus in brain microglial cells. The WT group animals presented the LoxP recombination sites but not the Cre recombinase; therefore, in these mice, the deletion of the gene of interest does not occur, being considered WT control mice or littermates.

2.3. Generation of Animals with Tauopathy: TAU and HMO-KO+TAU Groups

Mice belonging to the TAU Group and HMO-KO+TAU Group were anesthetized with isofluorane (ISOFLO Isoflurane 100% w/w, Zoetis SL, Alcobendas, Madrid, Spain) at 5% under oxygen. Mice were placed in a stereotaxic and for intrahippocampal injections, a cranial midline incision was made, and the skull was drilled 1.94 mm posterior and 1.4 mm lateral to the bregma on both sides with a micromanipulator and a microdrill. For the tauopathy model, adenoassociated particles with the human tau protein mutated at P301L under the neuronal specific promoter, synapsin I (AAV-hTau (2 × 10¹² VP/mL)), were injected into both hippocampi at 1.8 mm below the dura mater (0.1 μL/min) with a Hamilton automatic syringe. Syringes were held in position for 2 min after each injection. For WT and HMO-KO mice, adeno-associated particles lacking the mutated human tau protein and containing the eGFP (enhanced green fluorescent protein) snitch gene under the SYN1 promoter (AAV-eGFP (2 × 10¹² VP/mL) were injected.

2.4. Immunohistochemistry

Mice were deeply anesthetized with 5% isofluorane. They were then transcardially perfused through the ascending aorta, first with saline (PBS) and then with 4% paraformaldehyde (PFA) in 0.1 M phosphate buffer (PBS, pH 7.4).
Subsequently, eyeballs were removed. The orientation of each eye was carefully maintained with a suture given in the upper eyelid before enucleation of the eyeballs. During eye dissection, the insertion of the rectus muscle and the nasal caruncle were used as additional landmarks. The eyes were postfixed for 24 h in the same fixative and then transferred to a 0.1 M PBS solution at 4 °C. The retinas were then separated from the rest of the ocular layers, and wholemounts were made. Subsequently, the retinas were cryoprotected in sucrose at increasing concentrations (10%, 20%, and 30%) at 1 h, 2 h, and overnight, respectively. They were then frozen in liquid nitrogen and kept at −80 °C until use.
In addition to the eyeballs, brains were also removed and kept overnight at 4 °C in 4% PFA. Then, the tissue was cryoprotected for 2 days in 30% sucrose, and 40 μm thick coronal slices were cut using a sliding microtome and collected in phosphate buffer (PB) 0.1 M.
For the immunohistochemical labeling of retinal wholemounts, retinas from left eyes were used for the microglial study, and retinas from right eyes were used for the macroglial study. Triple immunofluorescences were performed. In the right eyes the following primary antibodies were used: anti-GFAP to label macroglial cells (astrocytes and Müller glia), anti-C3 to label A1 phenotype astrocytes, and anti-TAUY9 to label phosphorylated tau protein from human tau protein (Table 1). In the left eyes, the antibodies used were: anti-Iba-1 (a microglial marker), anti-CD68 to label activated microglia with phagocytic capacity, and anti-AT8 to label injected human phosphorylated tau protein and mouse tau protein. Secondary antibodies that bound to their corresponding primary antibodies were used. Each secondary antibody was conjugated with a determined fluorochrome, as indicated in Table 1, which allowed for their detection during a double-labelling fluorescent immunohistochemistry study.
In addition, three negative controls were made to ensure the specificity of immunolabeling. In the first one, the primary antibodies were not added, and the retinas were incubated only in the secondary antibodies with their respective diluents. In the second control, the retinas were incubated in the primary antibodies with their diluents. In the third control, only the primary and secondary antibody diluents were added to the retinas to analyze the endogenous fluorescence of the tissue.
For immunofluorescence assays of brain sections, these were blocked with 5% goat or donkey-serum for 2 h. Afterwards, sections were incubated at 4 °C with the primary antibodies (Ty9: 1:1000 and AT8: 1:500) (Table 1). Sections were washed three times and then incubated with the appropriate secondary fluorescent antibodies for 1 h (Table 1). After three washes (Hoechst was added in the second wash: 1 μL/mL), sections were mounted and images taken using a Zeiss Axio Imager M.2 fluorescence optical microscope (Carl Zeiss AG, Oberkochen, Germany).

2.5. Morphometric Analysis of Retinal Wholemounts

Retinal wholemounts were analyzed and photographed using a Zeiss Axio Imager M.2 fluorescence optical microscope (Carl Zeiss AG, Oberkochen, Germany) equipped with the appropriate filters for different emission spectra: Alexa Fluor 488 (filter set 10, Zeiss), Alexa Fluor 594 (filter set 64, Zeiss), and Alexa Fluor 405 (filter set 49, Zeiss). The microscope was associated with the Apotome-2 module (Carl Zeiss AG, Oberkochen, Germany). Microphotographs were taken using a high-resolution Axio Cam 503 Mono digital camera (Carl Zeiss AG, Oberkochen, Germany) attached to the microscope. The Apotome-2 module allows high-quality photographs to be taken of thick tissue samples. Imaging of thick samples in fluorescence microscopy is compromised by signals originating outside the focal plane, causing a reduction in contrast and resolution of the axial dimension (Z-axis). The Apotome allows imaging like an optical section, improving contrast and resolution. Its principle is based on the theory of interferometry, projecting a grating on the focal plane of the objective that moves to three different positions on the sample. These images are then processed in real time by the software ZEN2 (Carl Zeiss AG, Oberkochen, Germany) of the microscope, and everything below and above the focus range is eliminated by the software. The result is an optimized image that resembles an optical section of the sample in the plane of focus.

2.5.1. Tau Protein Expression

In the retinas in which human tau had been injected and after immunohistochemical labelling with TAUY9 and AT8 antibodies, all retinal wholemounts were systematically analyzed (superior, inferior nasal, and temporal), and microphotographs were taken at 20×.

2.5.2. Microglial Characterization

For the qualitative and quantitative study of microglia, retinal wholemounts labelled with the primary anti-Iba-1 and anti-CD68 antibodies were used.
Microglial cells are arranged in the retina forming several plexuses: in the photoreceptor outer segment layer (OS), outer plexiform layer (OPL), inner plexiform layer (IPL), and nerve fiber layer (NFL)–ganglion cell layer (GCL). The microglia in the latter two layers are near each other and difficult to distinguish, so the layers were analyzed together and referred to as the inner retinal layer complex (ILC). Therefore, for quantitative analysis of Iba-1+ cells, three different plexuses were analyzed in the Z-axis of the retina: OS, OPL, and ILC.
Twelve areas were photographed at 20x in each plexus, 3 for each of the four sectors (superior, inferior, nasal, and temporal). Since 3 plexuses (OS, OPL, and ILC) were analyzed, a total of 12 × 3 = 36 microphotographs was obtained for each retinal wholemount. As 6 retinas per experimental group were analyzed for cellular measurements, a total of (36 × 6) 216 microphotographs was obtained and analyzed for each experimental group. The photographs were taken at 20× magnification, providing an area of 0.1502 mm2 per field. For the Z-axis images, the Extended Focus module of the ZEN2 software (Carl Zeiss AG, Oberkochen, Germany) was used, which allowed the extraction of focus details from images at different focal planes and the generation of an image with a greater depth of focus. Images were taken first in the red channel (Iba-1+), then in the green channel (CD68+), and the mixed image of both channels was obtained to obtain the colocalization of both antibodies.

Number of Microglia Iba-1+

On the images previously obtained at 20×, Iba-1+ microglia somas in each microphotograph were manually counted using the interactive manual counting tool included in the ZEN2 software, which is incorporated in the microscope.
In addition, in the OS layer, the number of dystrophic microglia (cells with fragmented cytoplasm) and the number of activated microglia (thickened or amoeboid), morphotypes that were only observed in this retinal layer, were also counted manually in the same images.

Number of Microglia Iba-1+/CD68+

The number of microglia with Iba-1+/CD68+ phagocytic capacity (colocalization of red and green channels) was counted manually in each microphotograph, using the interactive manual counting tool included in the ZEN2 software (Carl Zeiss AG, Oberkochen, Germany), which is incorporated in the microscope. The counting of dystrophic Iba-1+ microglia with CD68+ colocalization was also done in the OS layer.
Since the microglial cells had different levels of CD68+ labelling, a grading of phagocytic capacity was incorporated: (i) Low phagocytic capacity, where microglia had only a small, almost inappreciable point of CD68+ labelling. This grade was not considered in the counting, as it was present in most of the microglial cells. (ii) Medium phagocytic capacity (M). The microglia have one large spot or two or more spots of CD68+ labelling. (iii) High phagocytic capacity (H). Microglia have CD68+ labelling in almost the whole cell.

Area of Soma and Arbor Area of Iba-1+ Cell

The measurement of the soma area was performed on the OPL and ILC images using a semiautomatic method with the Interactive Measurement tool of the ZEN2 software (Carl Zeiss AG, Oberkochen, Germany). This tool allows thorough manual delimitation of the soma contour to know the value in μm2. For the measurement of the soma area, 3 to 5 microglia were selected in each image at 20×.
Measurements of the arbor area were performed with a procedure like that of the soma area, but we delimited the cell outline by joining the most distal tips of the primary and secondary processes. For arbor area measurements, all microglia that appeared complete in each image were analyzed at 20×.
These measurements were not performed in the OS because in this layer microglia possess great morphological variability, not possessing the classical branched appearance as in the OPL and ILC.

2.5.3. Macroglial Characterization

Retinal wholemounts labelled with the primary anti-GFAP and anti-C3 antibodies were used for the qualitative and quantitative study of macroglia. Twelve areas were systematically selected from each retinal whole mount, 3 for each sector (superior, inferior, nasal, and temporal), and photographed under the same capture parameters.

Retinal Area Occupied by GFAP+ Immunolabeling (AROA)

The AROA was quantified at 20× magnification in the nerve fiber layer–ganglion cell layer (NFL–GCL) where astrocytes are located. For this, a semi-automatic measurement was performed with the help of an algorithm developed in MATLAB®, which had a tool called “threshold“; a variable thresholding level based on a grey scale was applied to each image. The algorithm returned a value representing the percentage of the AROA with respect to the total area of the image. Each image captured at 20× corresponded to an area of 0.1502 mm2.

Retinal Area Occupied by C3+ Immunolabeling (AROC3)

For the study of AROC3, images were taken at 40× in the nerve fiber layer–ganglion cell layer (NFL–GCL), where astrocytes are located, of 3 different areas of each sector (superior, inferior, nasal, and temporal), and the same procedure used to measure AROA was employed. This was done at this magnification to prevent any macrophages, which are also labelled with C3, from being in the measurement field and falsifying the count. Each image captured at 40× corresponded to an area of 0.0376 mm2.

2.6. Statistical Analysis

The assessment of normal distribution of data was carried out with the Shapiro–Wilk test. Levene’s test was used to assess the homogeneity of variance between groups. Statistical significance between groups was assessed depending on the distribution by one- or two-way ANOVA with the Tukey post hoc test, for multiple comparisons, or the Kruskal–Wallis test. ANOVA post hoc tests were carried out only if F had a p < 0.05, and no significant variance inhomogeneity was found within analyzed groups. Differences were considered statistically significant for p values < 0.05. Statistical analysis was carried out with GraphPad Prism v.9 (GraphPad Software, La Jolla, CA, USA), and the same software was used to design graphs. The notations used for the different levels of significance were: * p < 0.05, ** p < 0.01, *** p < 0.001, **** p < 0.0001.

3. Results

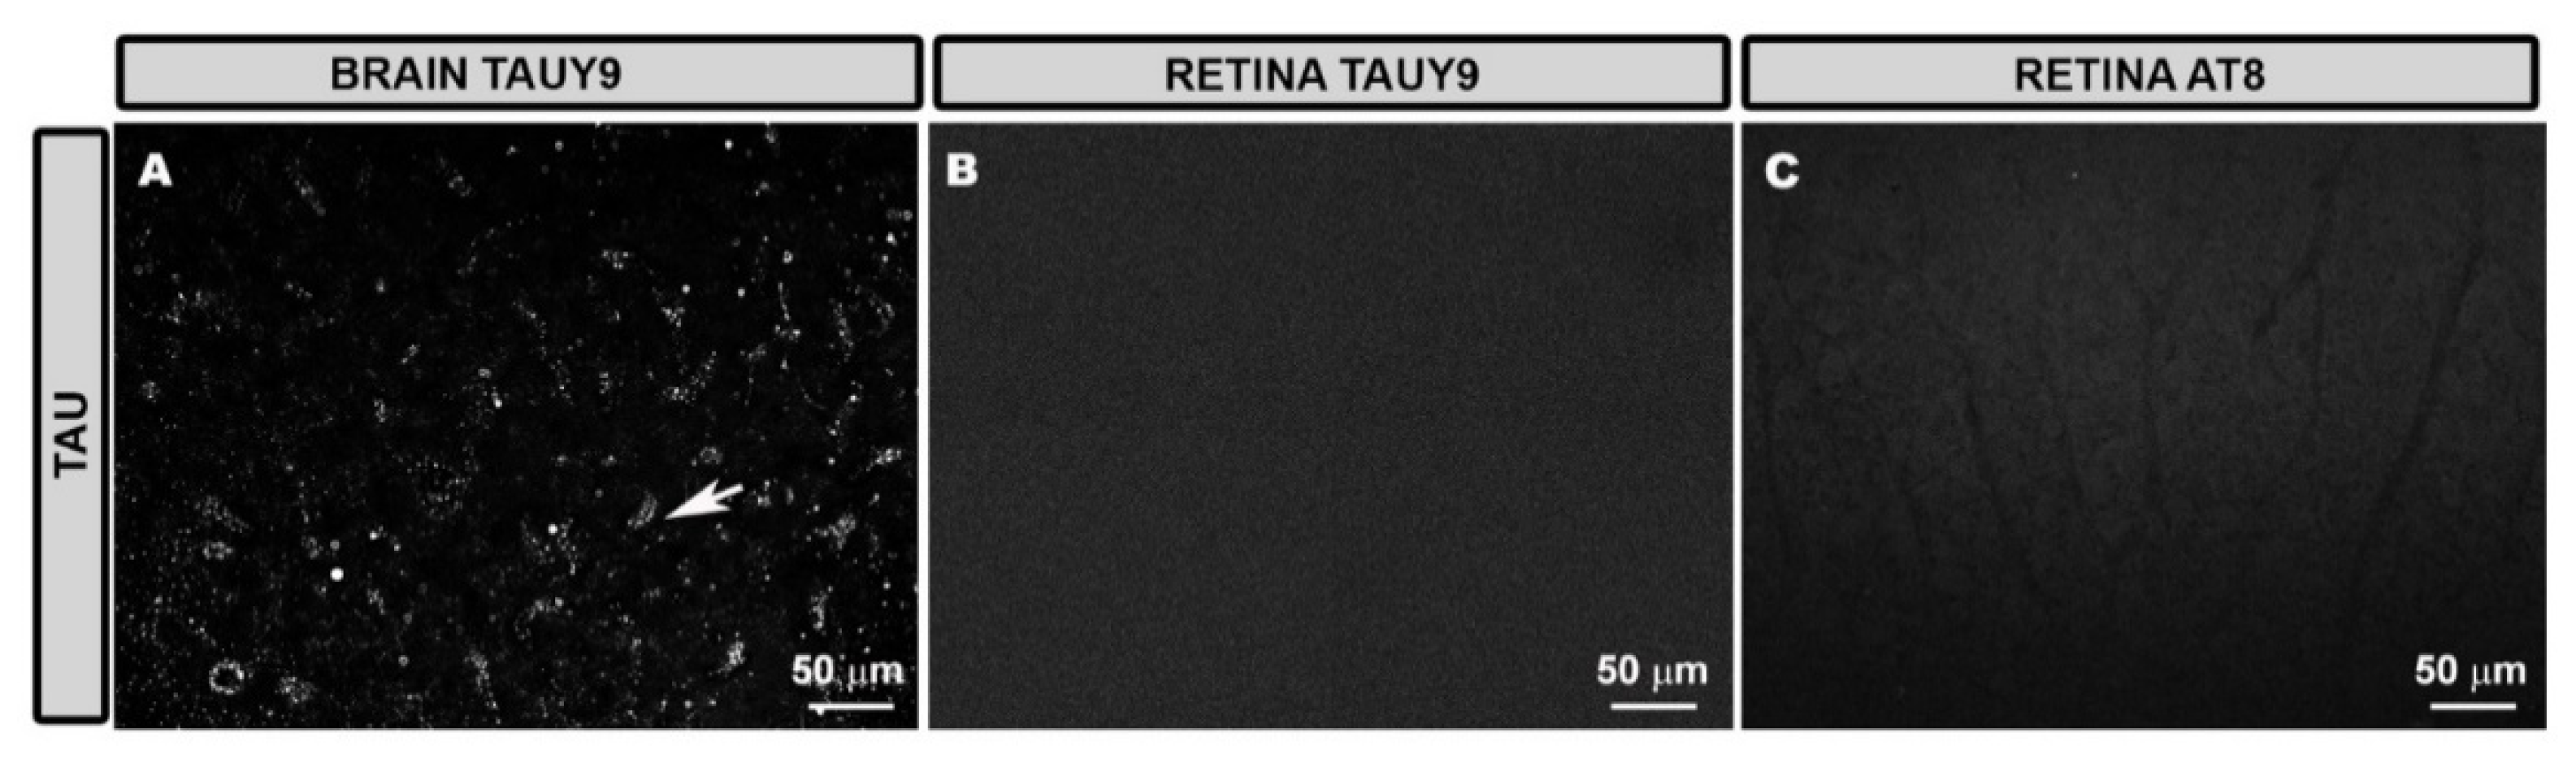
3.1. Tau Expression in Retinal Tissue

After injecting the adenoassociated virus containing the human tau protein with the P301L mutation (AAV-hTau) in the hippocampus (TAU group), TAUY9+ immunohistochemical labelling, which identifies human phosphorylated tau protein, was observed in the cells of this tissue (Figure 1A). However, when analyzing retinas, TAUY9 staining was not found in any of the TAU groups analyzed (Figure 1B) nor when using AT8 antibody labelling, which measures human and mouse phosphorylated tau protein (Figure 1C).

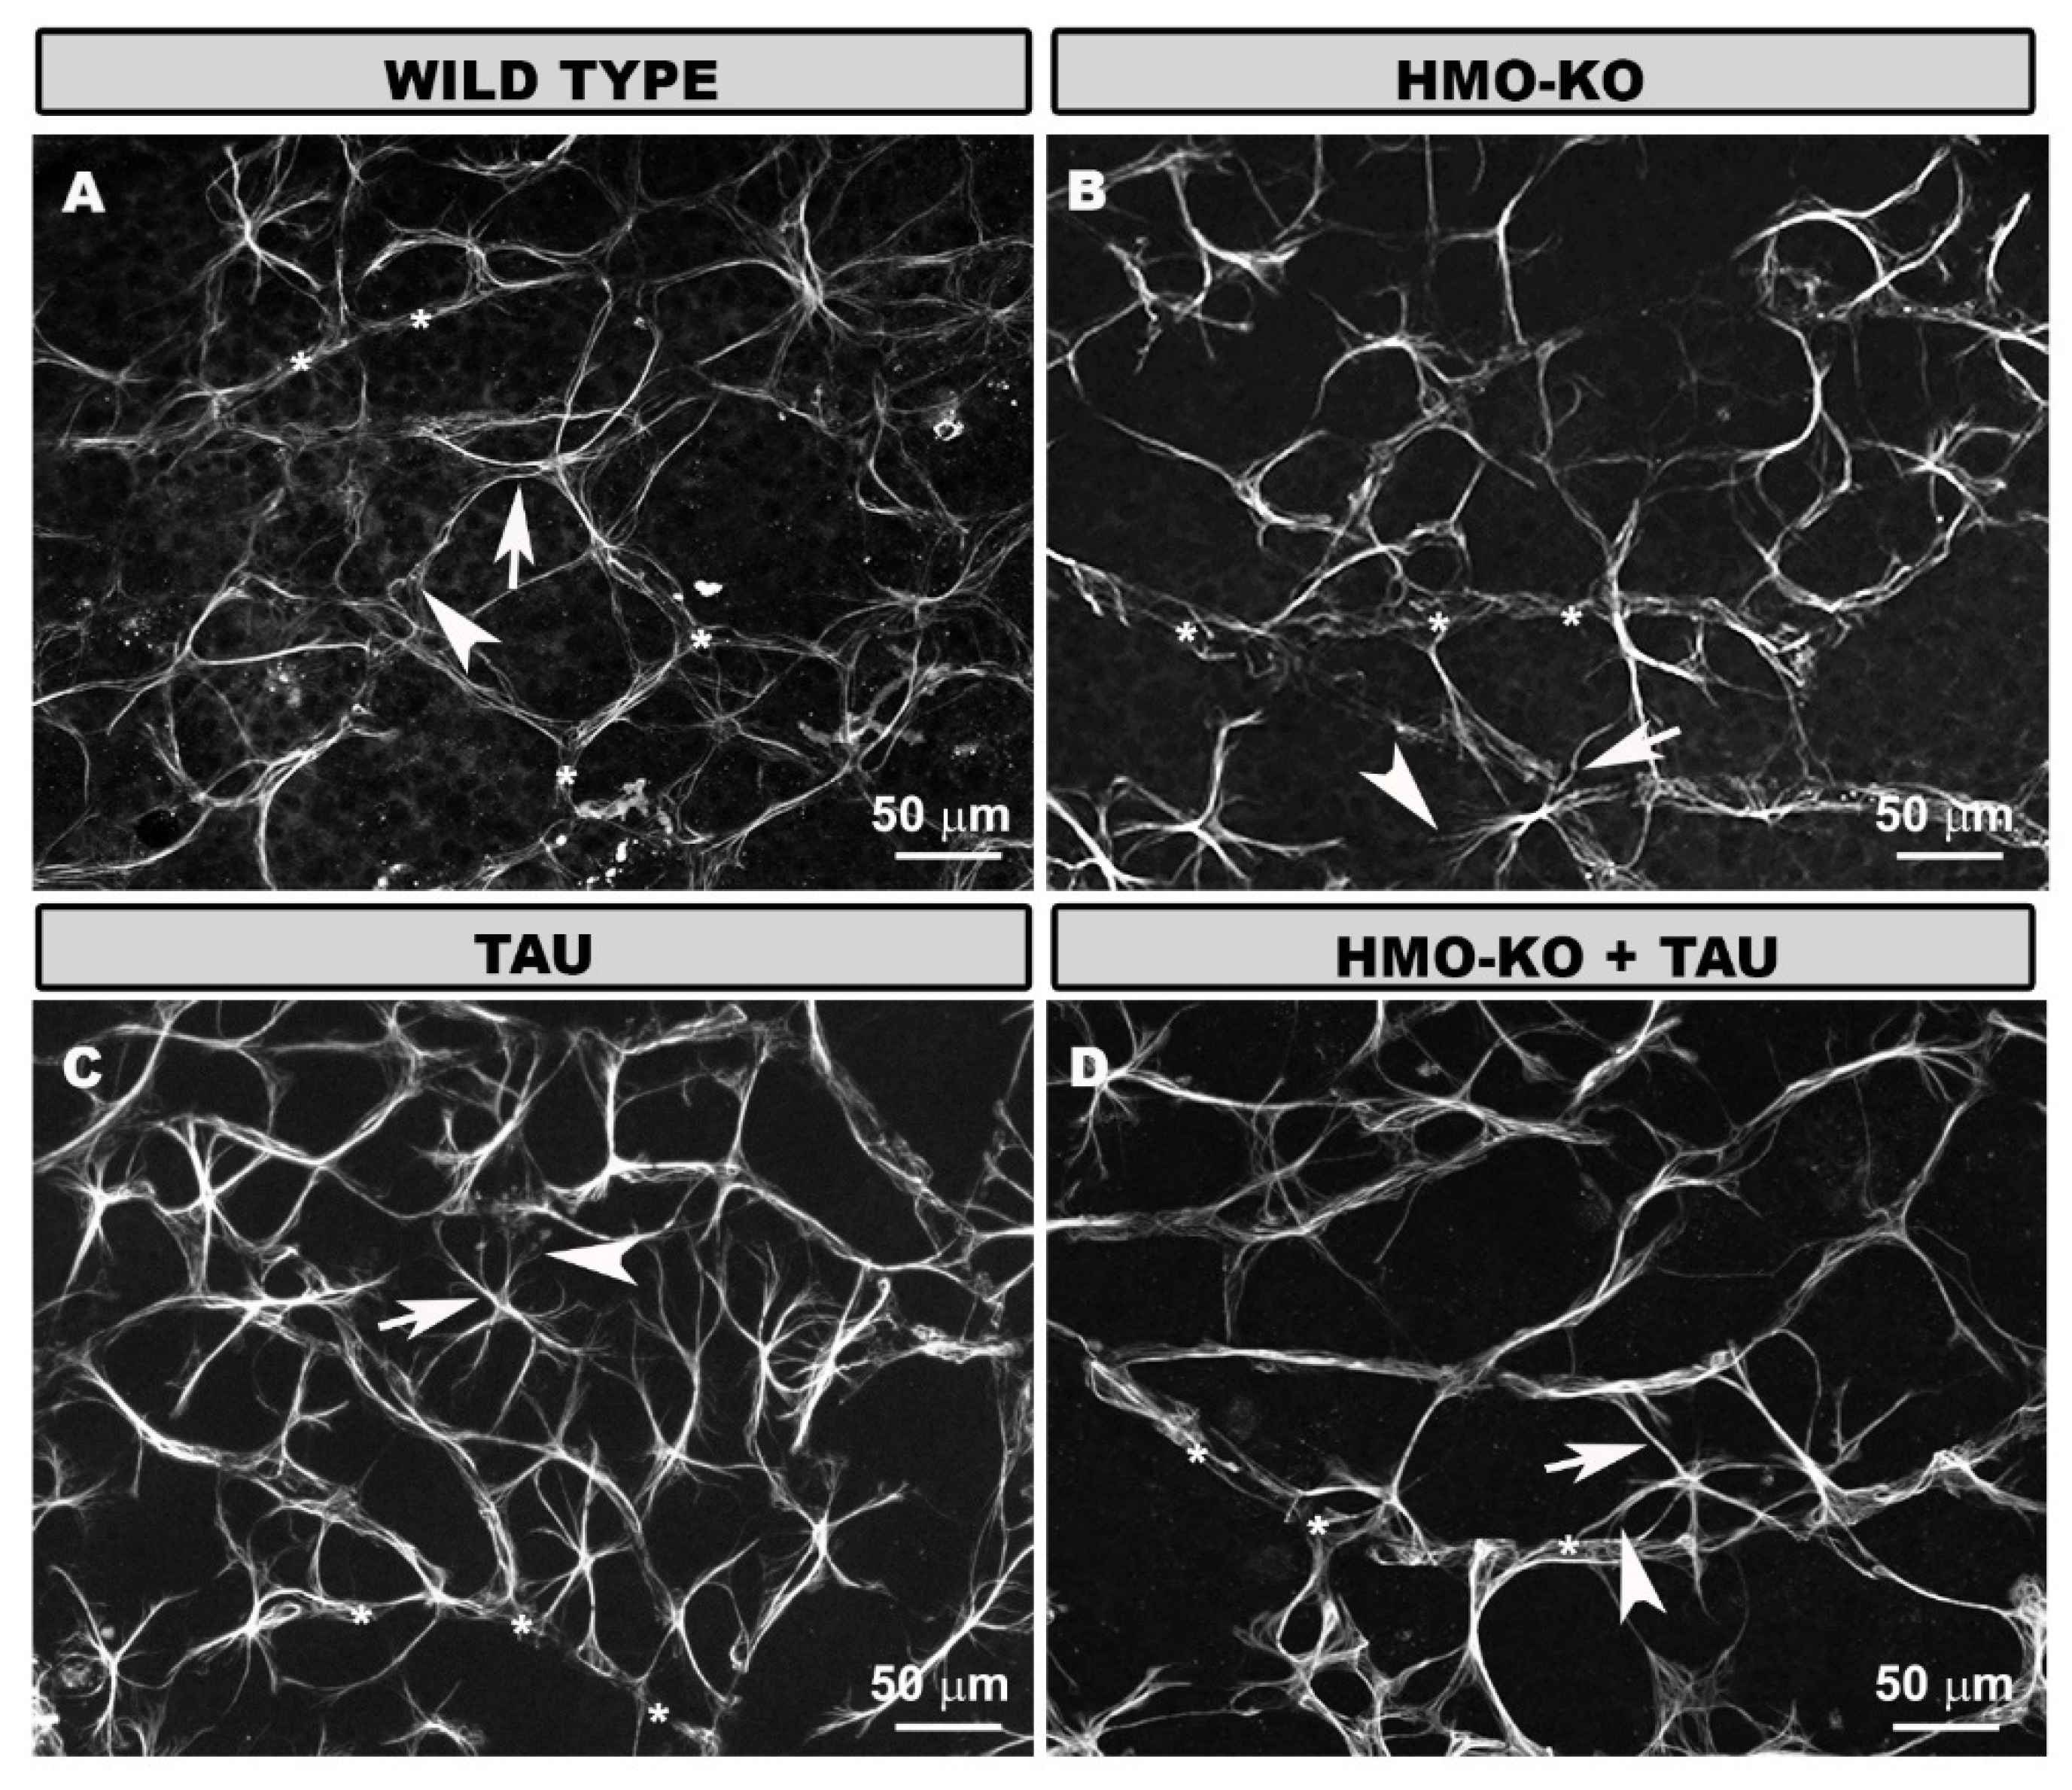
3.2. Morphology and Distribution of Retinal Microglia in the Different Study Groups

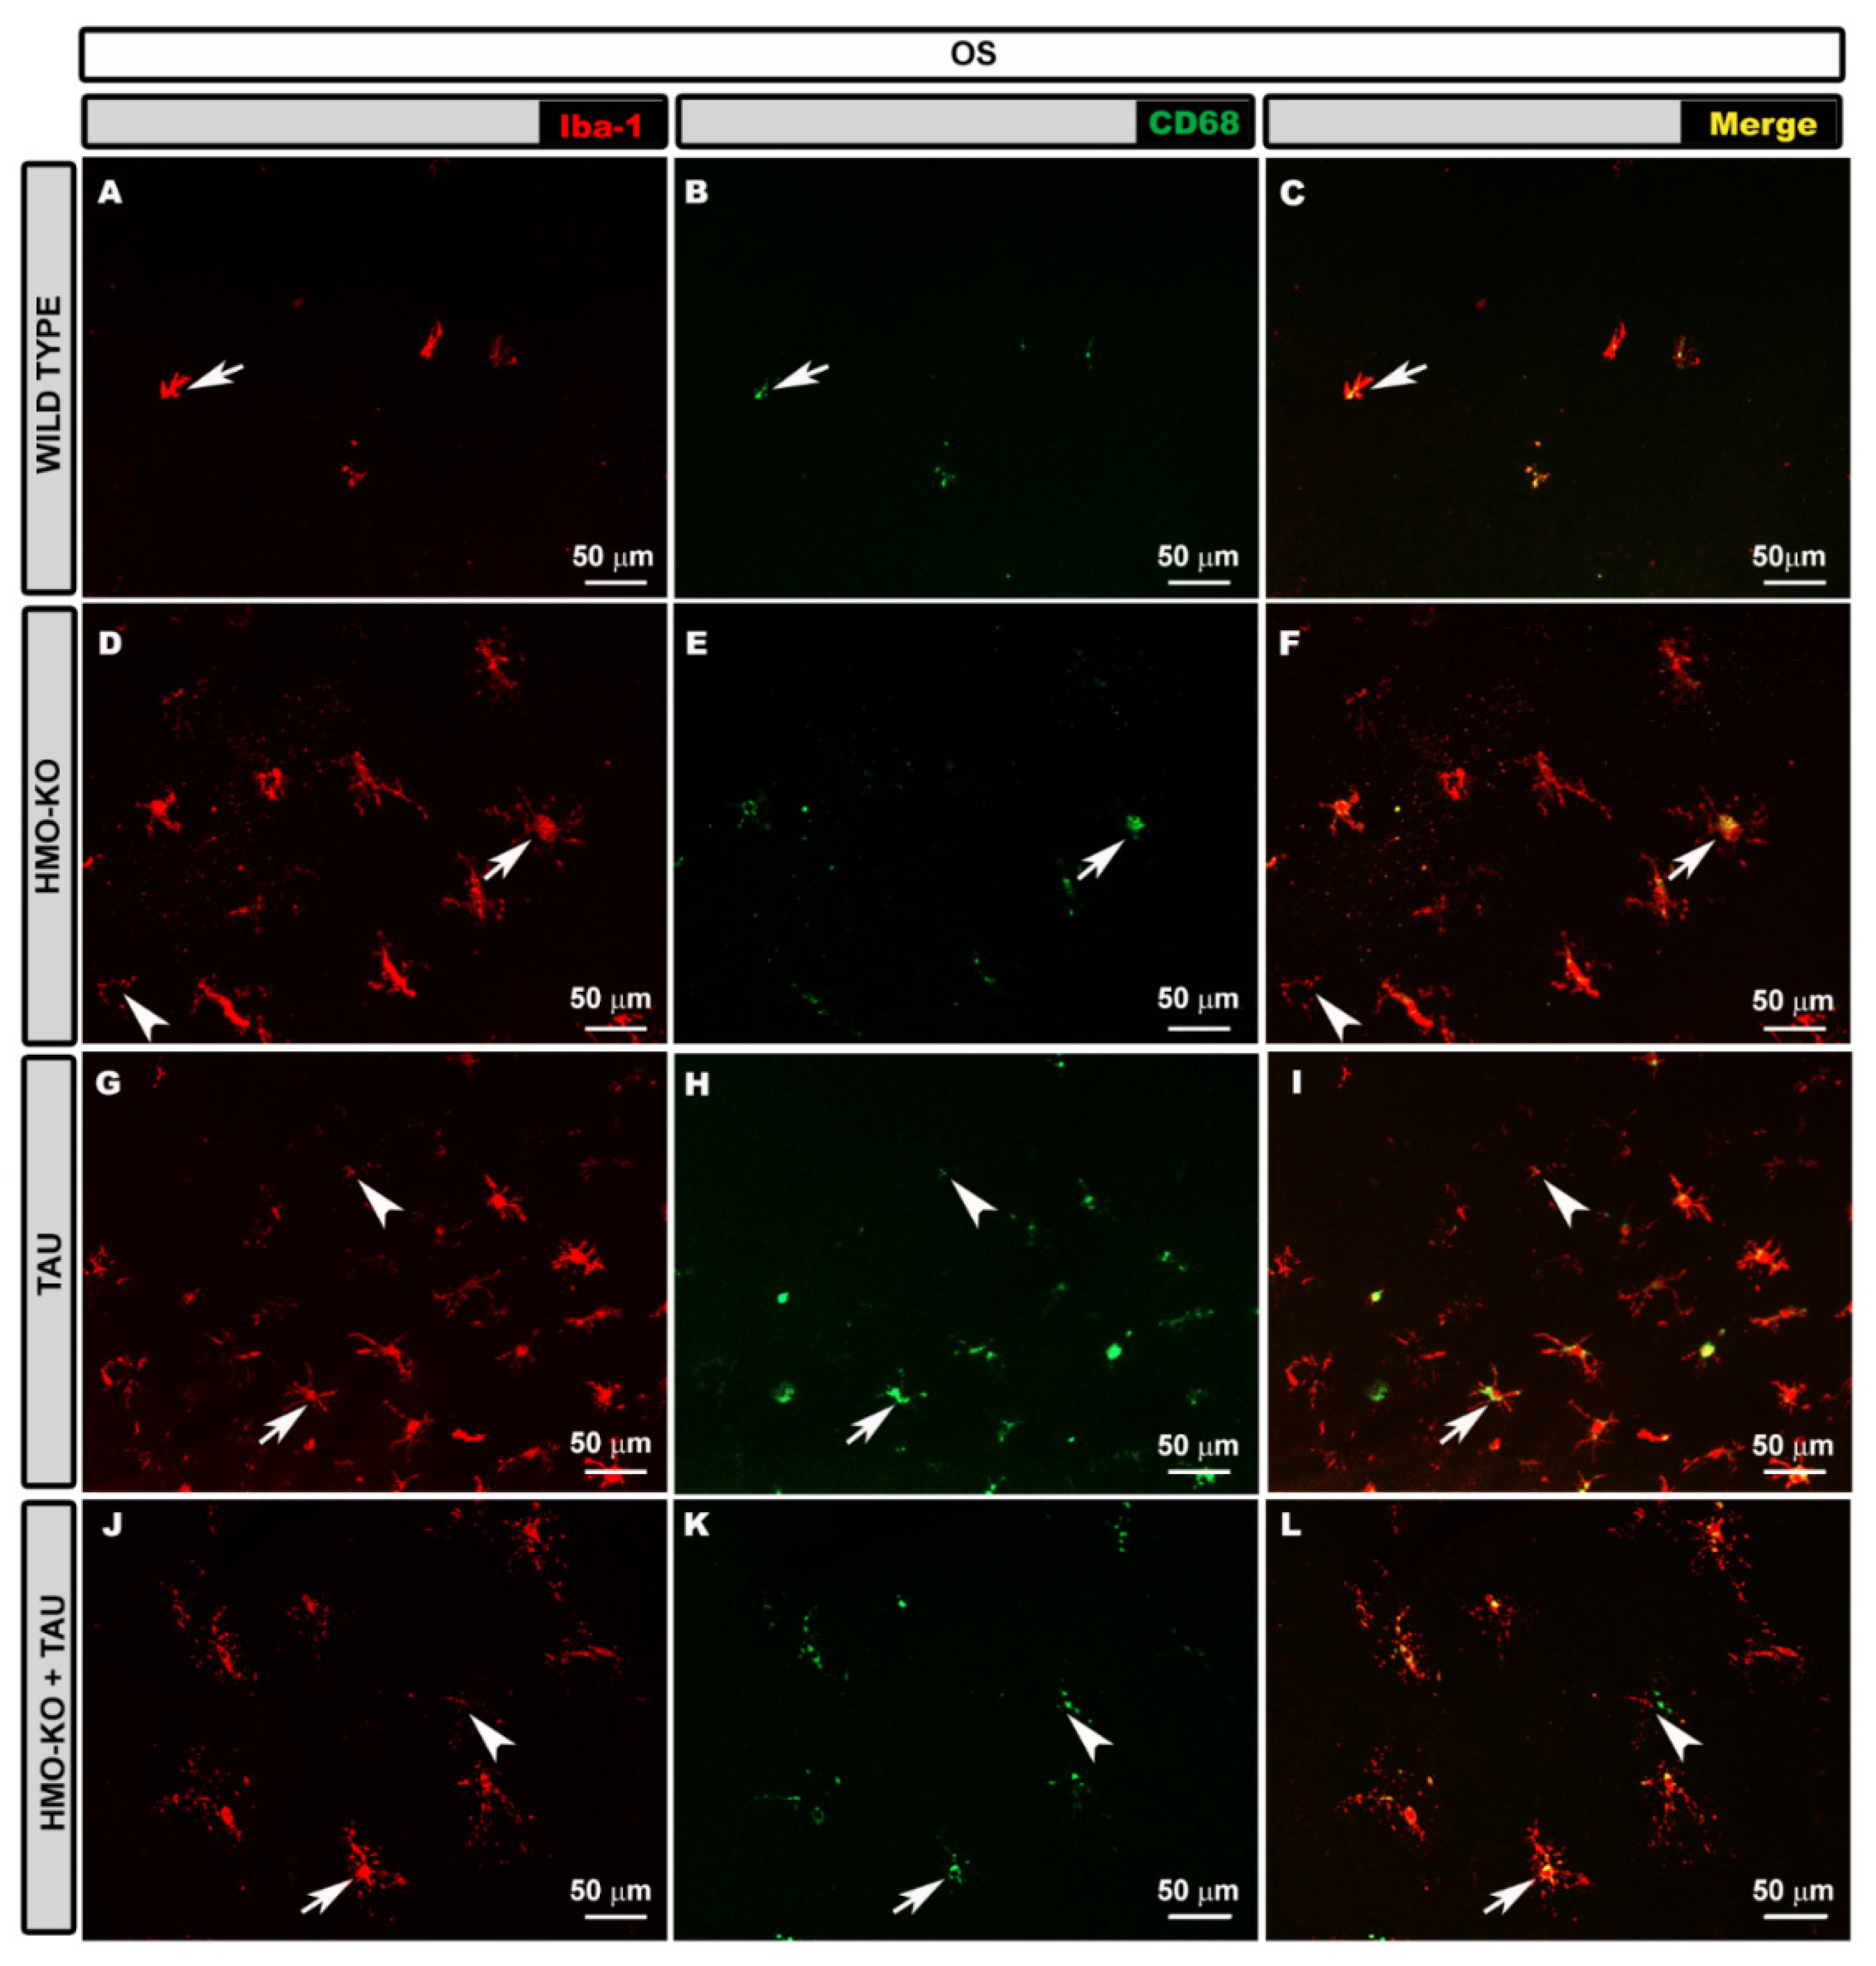
3.2.1. Outer Segment Layer (OS)

In the OS layer, in the WT group, microglia were not evenly distributed in the retina, being preferentially located in the peripheral areas. Iba-1+ cells with a different morphology were observed. There were cells with an ovoid soma from which processes originated from the same point, and they were arranged perpendicular to the retinal surface; and other cells were elongated, with a bipolar appearance, parallel to the retinal surface. We found other cells of similar appearance, but with thickened somas and more retracted processes (Figure 2A–C). We also observed cells in which the cytoplasmic processes were fragmented, and we frequently observed in them structures of beads or spheroids; these cells corresponded to dystrophic microglia.
In the HMO-KO group, more microglia were observed than in the WT, and the cells had a similar morphological appearance, but with thicker cell bodies and more branched and thickened processes. Numerous dystrophic microglia were also observed (Figure 2D–F). All these cells were preferentially located in the peripheral areas of the retina.
In the TAU group, more cells were apparently observed than in the WT group and in the HMO-KO group (Figure 2G–I). The morphology was similar to that of the HMO-KO group; however, the somas were thicker, and the processes were more branched, although more retracted. In general, many more dystrophic microglia were observed than in the rest of the groups, especially with respect to the WT group and the HMO-KO group.
In the HMO-KO+TAU group, the microglia were more similar to those in the HMO-KO group (Figure 2J–L), the somas were thickened, and the processes were branched, elongated, and less retracted than in the TAU group. In addition, fewer microglia were apparently observed than in the TAU group. Although dystrophic microglia were present, there appeared to be fewer of them than in the TAU group.

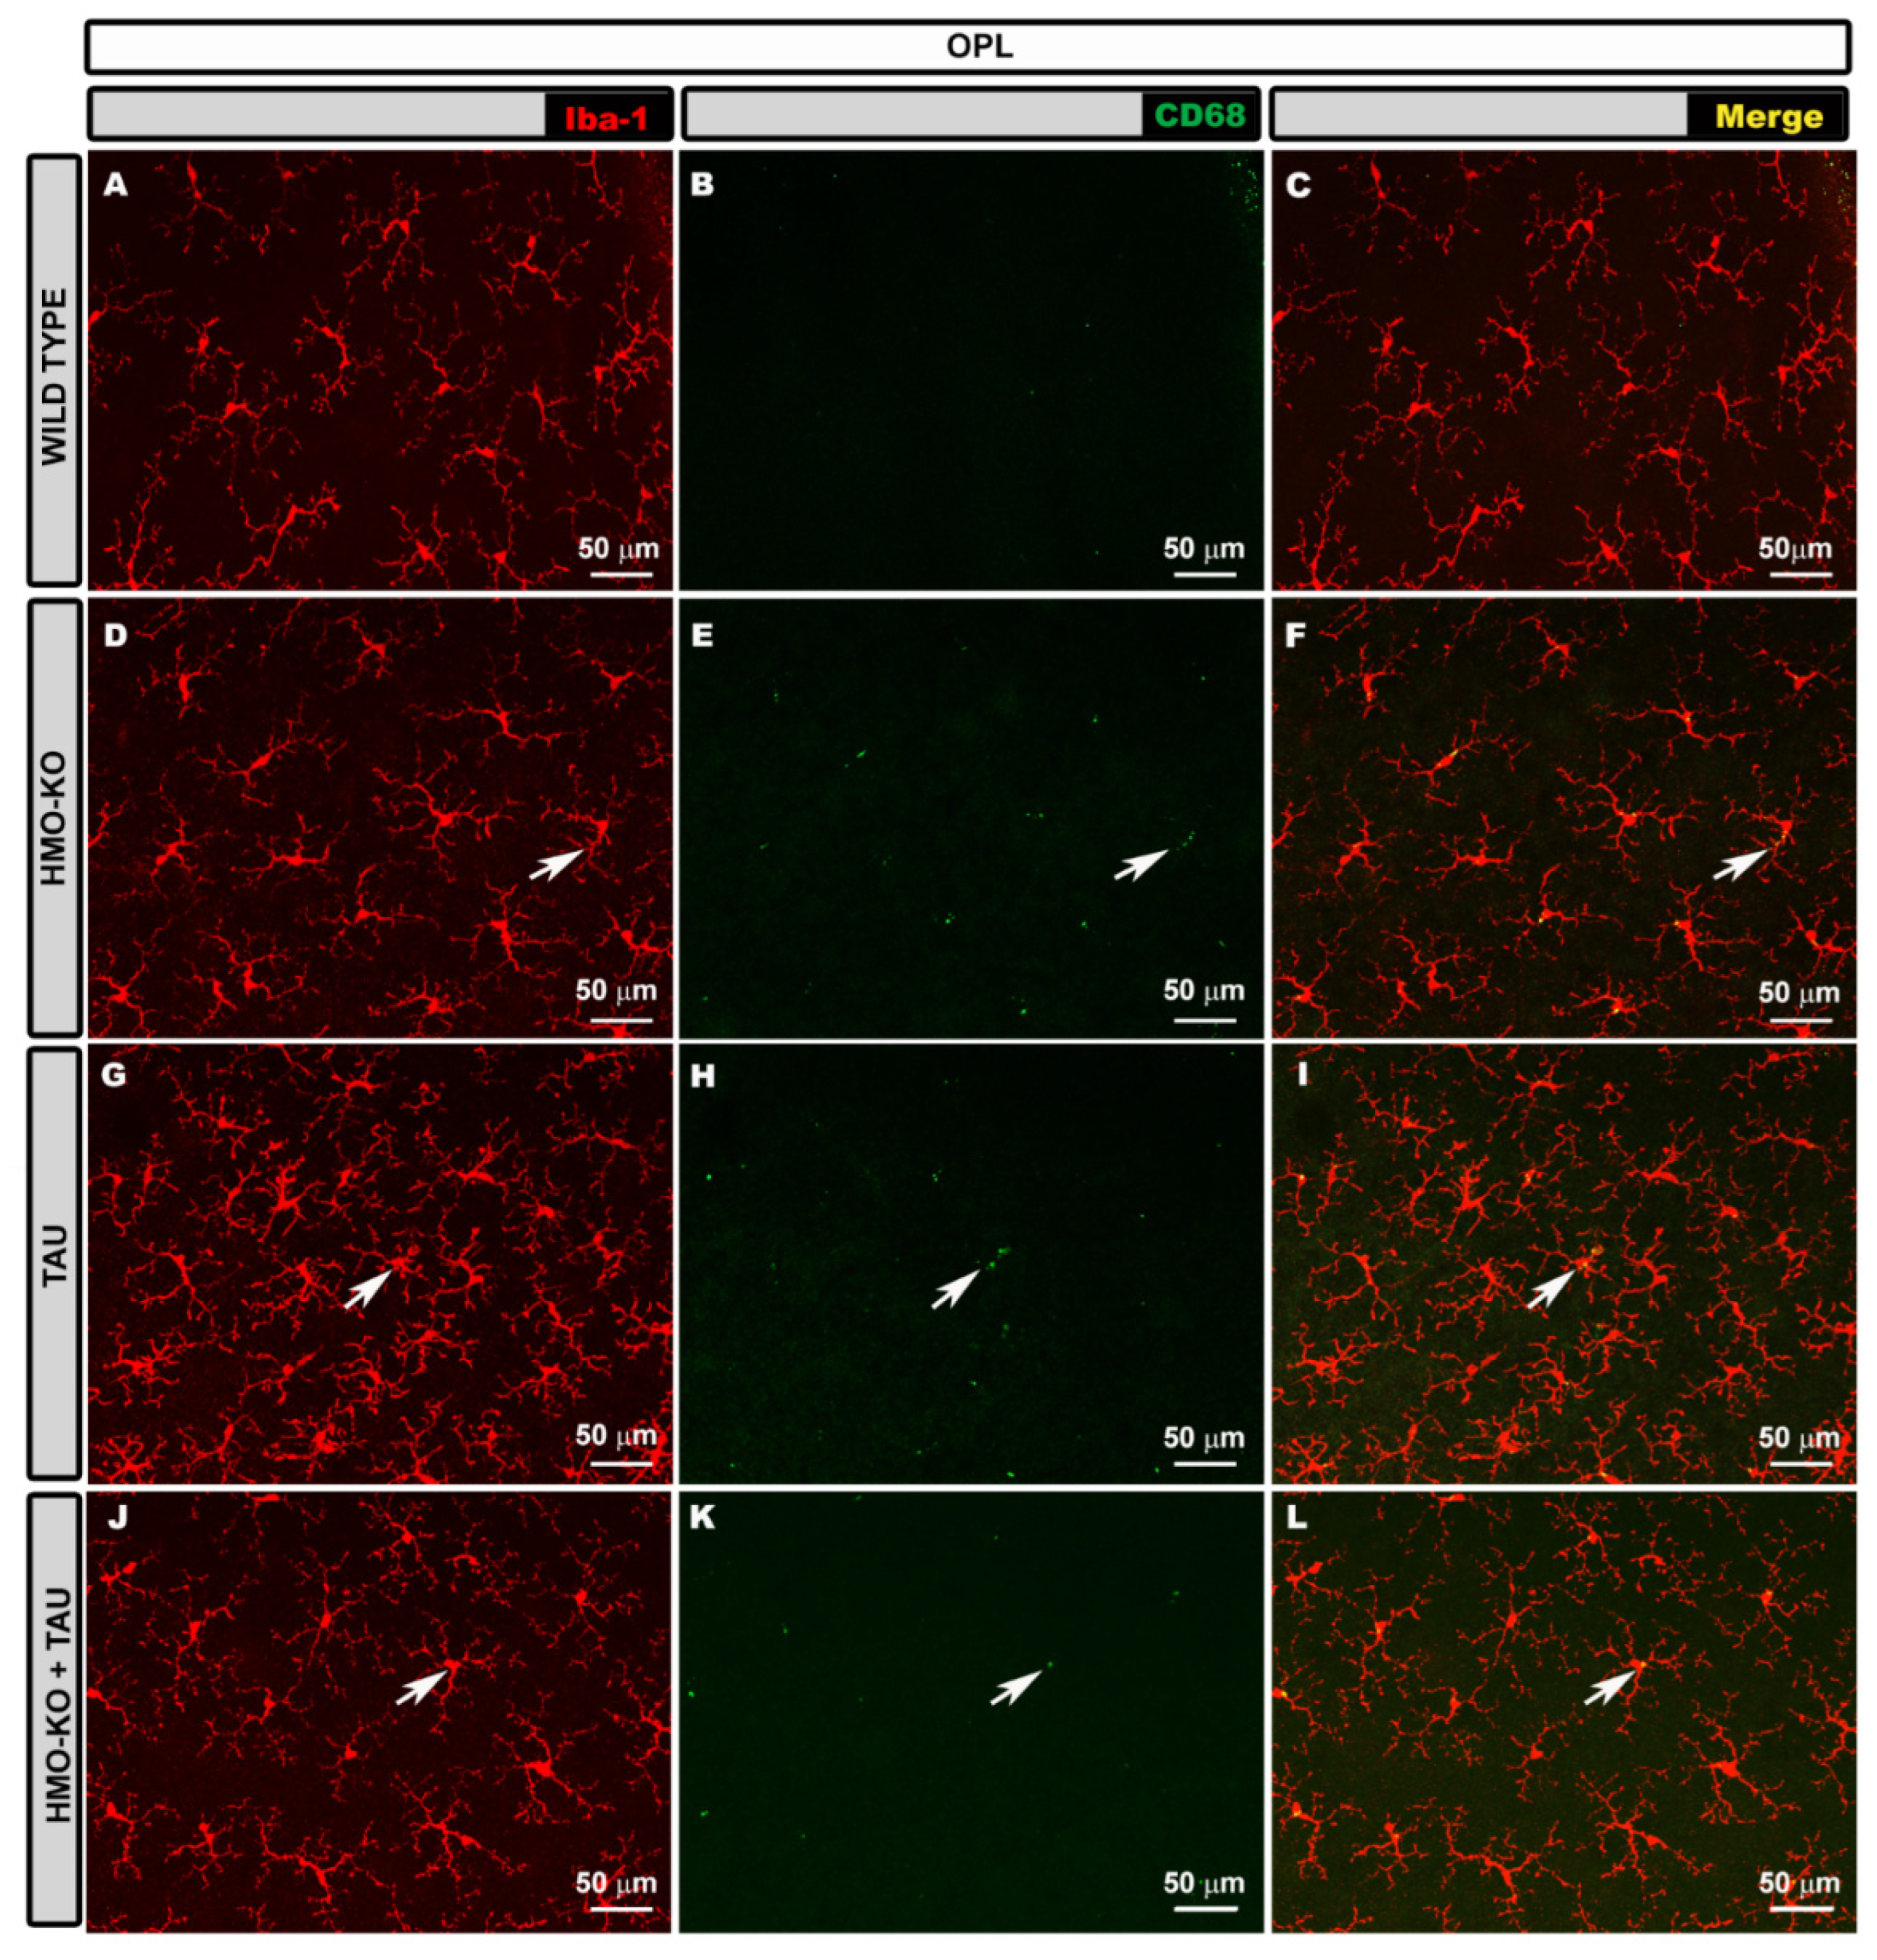
3.2.2. Outer Plexiform Layer (OPL)

In the OPL, the microglia of the WT group formed a regular mosaic-like plexus. The cells had small somas from which elongated primary processes emerged, which in turn divided into secondary and tertiary processes, giving the cell a branched appearance (Figure 3A–C).
In the HMO-KO group, the microglia formed a plexus similar to the WT group, but the cells had thicker somas and processes (Figure 3D–F).
In the TAU group, the microglial plexus was denser because the microglial cells were closer together, and there appeared to be more microglial cells. In addition, the somas appeared more thickened, as in the HMO-KO group, but the processes were more retracted than in the WT group and the HMO-KO group (Figure 3G–I).
In the HMO-KO+TAU group, the microglial plexus was more similar to that of WT and HMO KO, the microglia were less proximal, and their processes were less retracted than in the TAU group. However, the somas and processes were thickened, as in the HMO-KO group (Figure 3J–L).

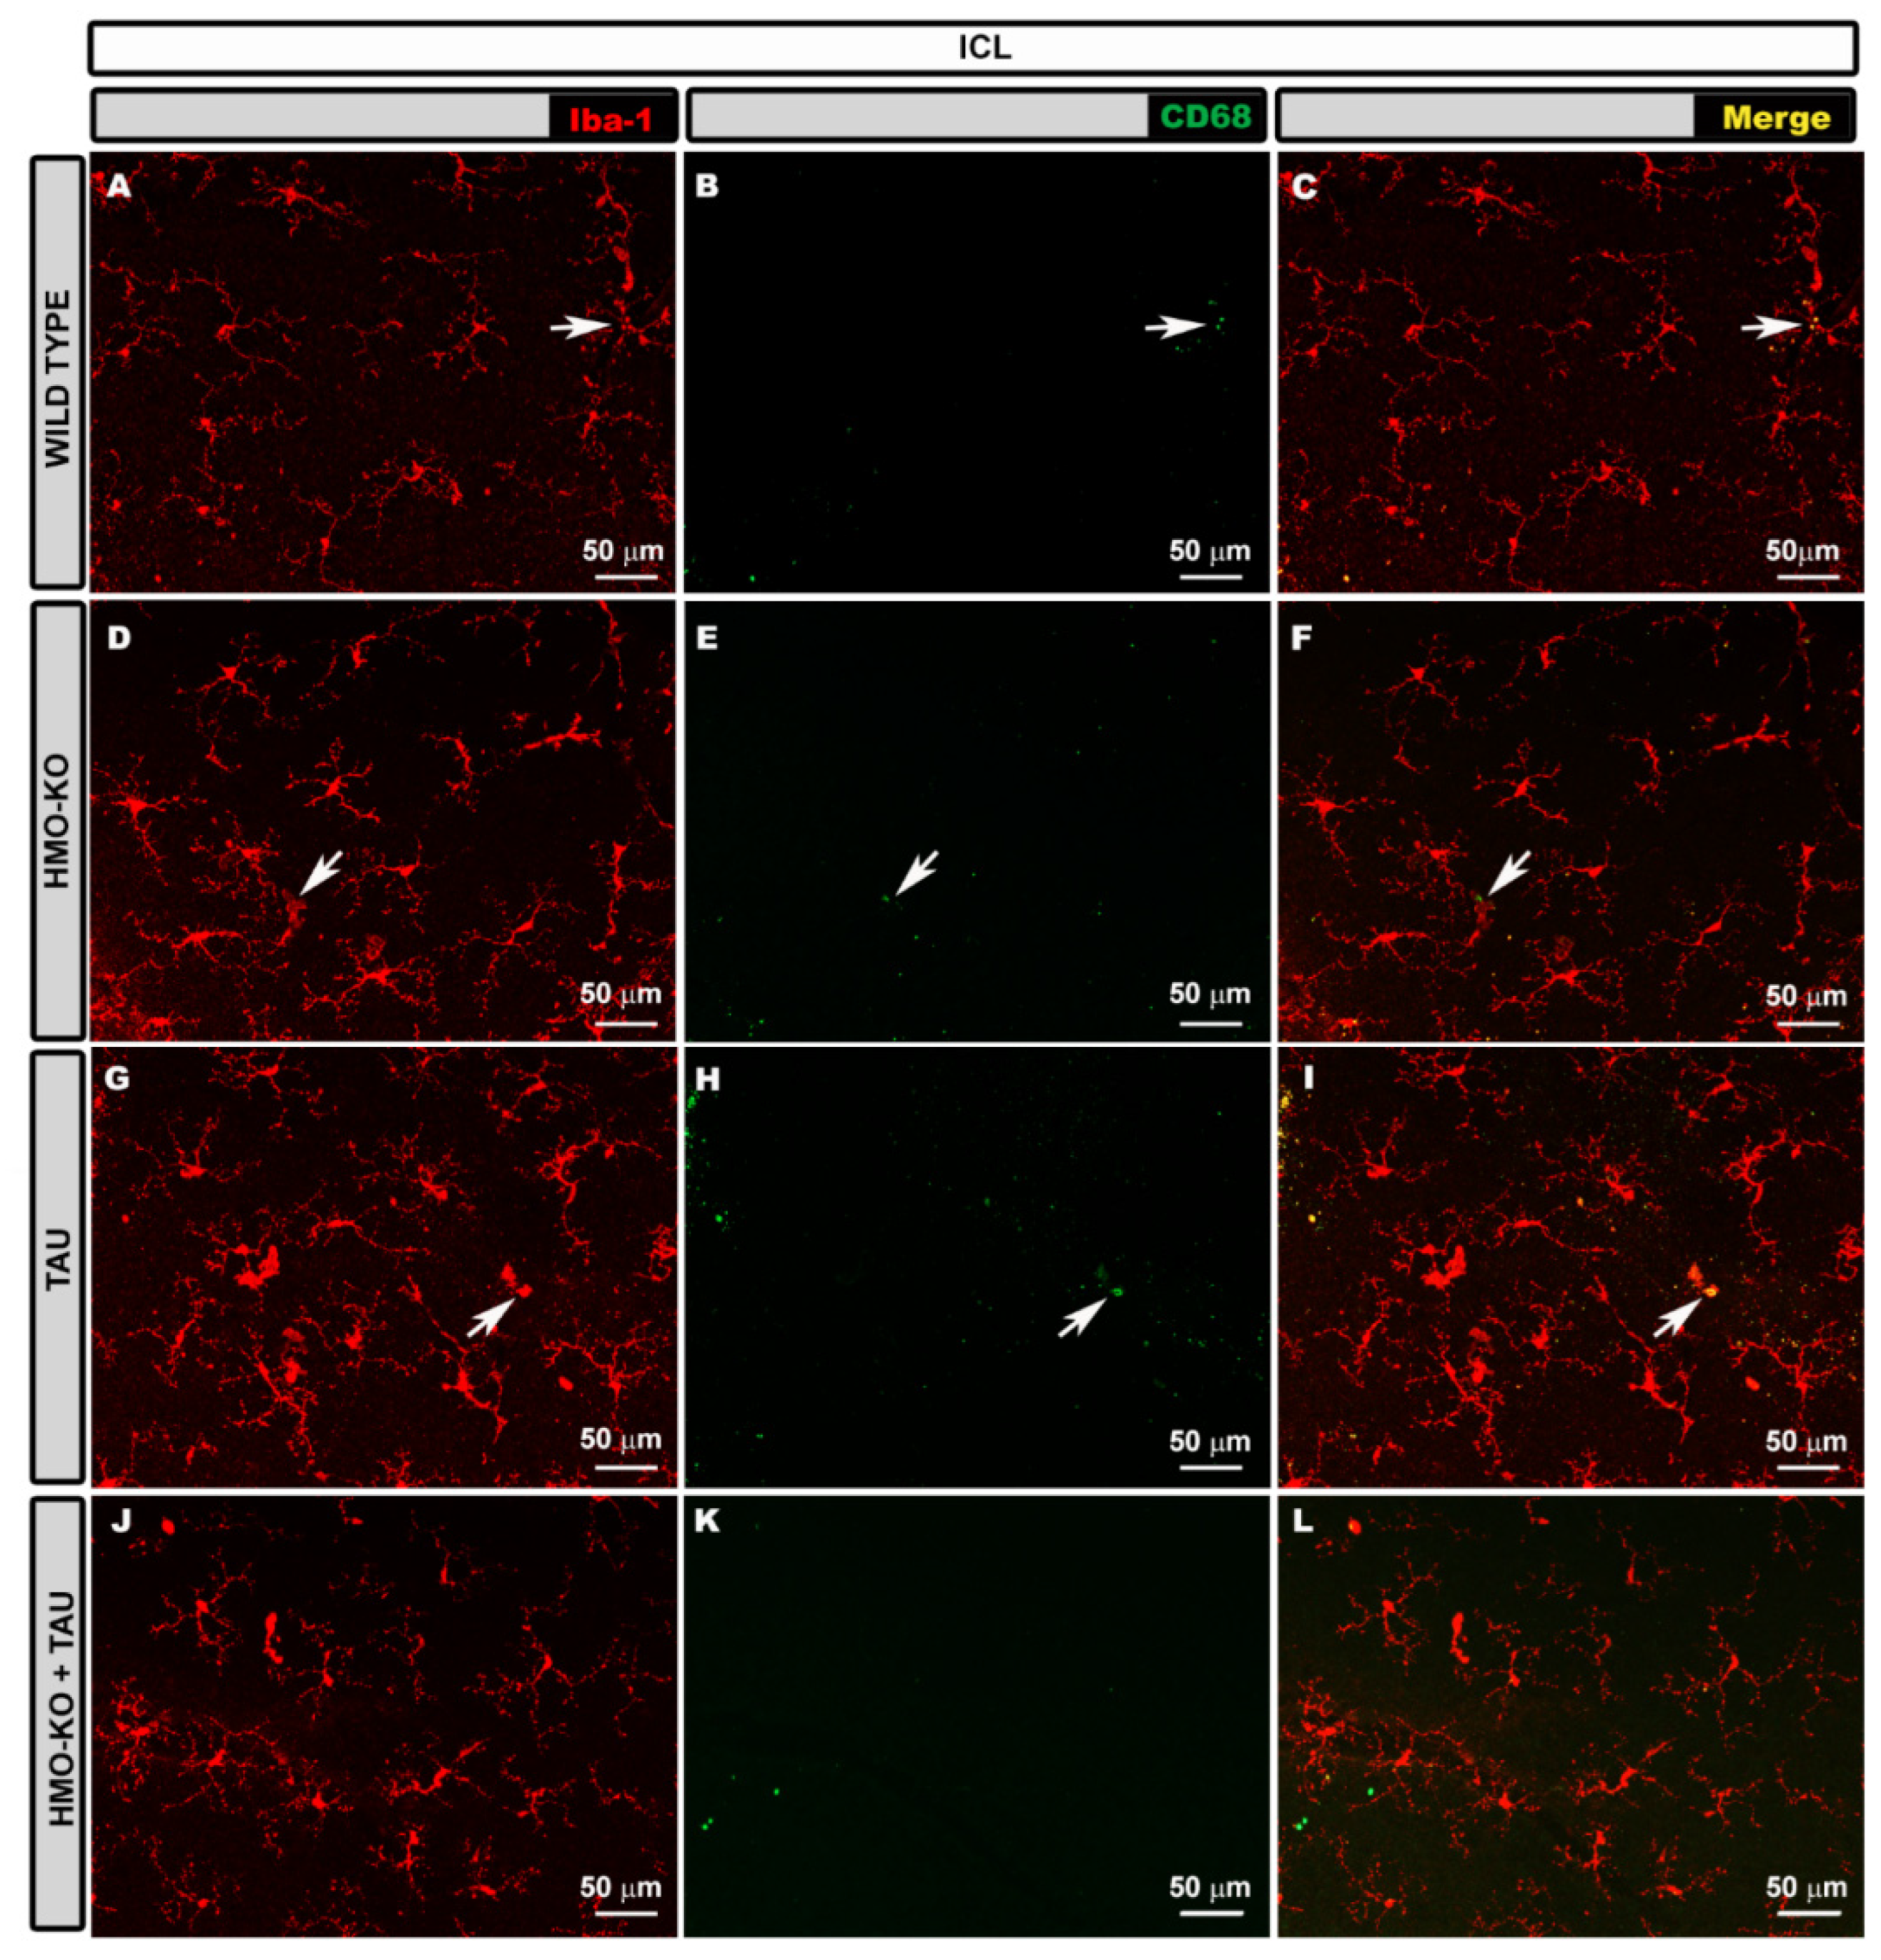
3.2.3. Inner Complex Layers (ICL)

In the ICL, in the WT group, the microglial plexus had a less regular appearance than in the OPL. The microglia also possessed small somas, from which primary, secondary, and tertiary processes emerged (Figure 4A–C).
In the HMO-KO group, the microglial plexus was similar to that of the WT group, but the microglial cells had thicker somas and processes (Figure 4D–F).
In the TAU group, the plexus was similar to that of the previous groups, but many microglia showed retraction of their processes, and even amoeboid cells were observed (Figure 4G–I).
In the HMO-KO+TAU group, the plexus was similar to the rest of the groups, but the appearance of the somas and processes were more similar to the WT, as they were less thickened than in the TAU group. In addition, the processes showed less retraction than in the TAU group (Figure 4J–L).

3.2.4. Microglial CD68 Expression

In the OS layer, in the WT group, some cells with some CD68+ vesicles were observed (Figure 2B,C). In the HMO-KO group, these cells with CD68+ vesicles were increased with respect to the WT group (Figure 2E,F). The group in which more CD68+ labelling was observed was the TAU group, where many cells had CD68+ labelling occupying the entire soma and processes (Figure 2H,I). This immunolabeling decreased in the HMO-KO+TAU group with respect to the TAU group, as the labelling was more punctate and did not fill the entire cell (Figure 2K,L).
In OPL, labelling was observed as small CD68+ vesicles within the cell. In the WT group, labelling was scarce (Figure 3B,C). This labelling increased in the rest of the groups, with more CD68+ vesicles being observed in the HMO-KO and TAU groups (Figure 3E,F). In the latter, some thicker vesicles were also observed (Figure 3H,I). In the HMO-KO+TAU group, smaller and sparser vesicles were observed than in the TAU group (Figure 3K,L).
In the ICL, labelling was scarce in the WT group (Figure 4B,C) and increased in the HMO-KO group (Figure 4E,F), but CD68+ vesicles were more abundant and thicker in the TAU group (Figure 4H,I), although they decreased considerably in the HMO-KO+TAU group (Figure 4K,L).

3.2.5. Quantitative Study of Retinal Microglial Cells

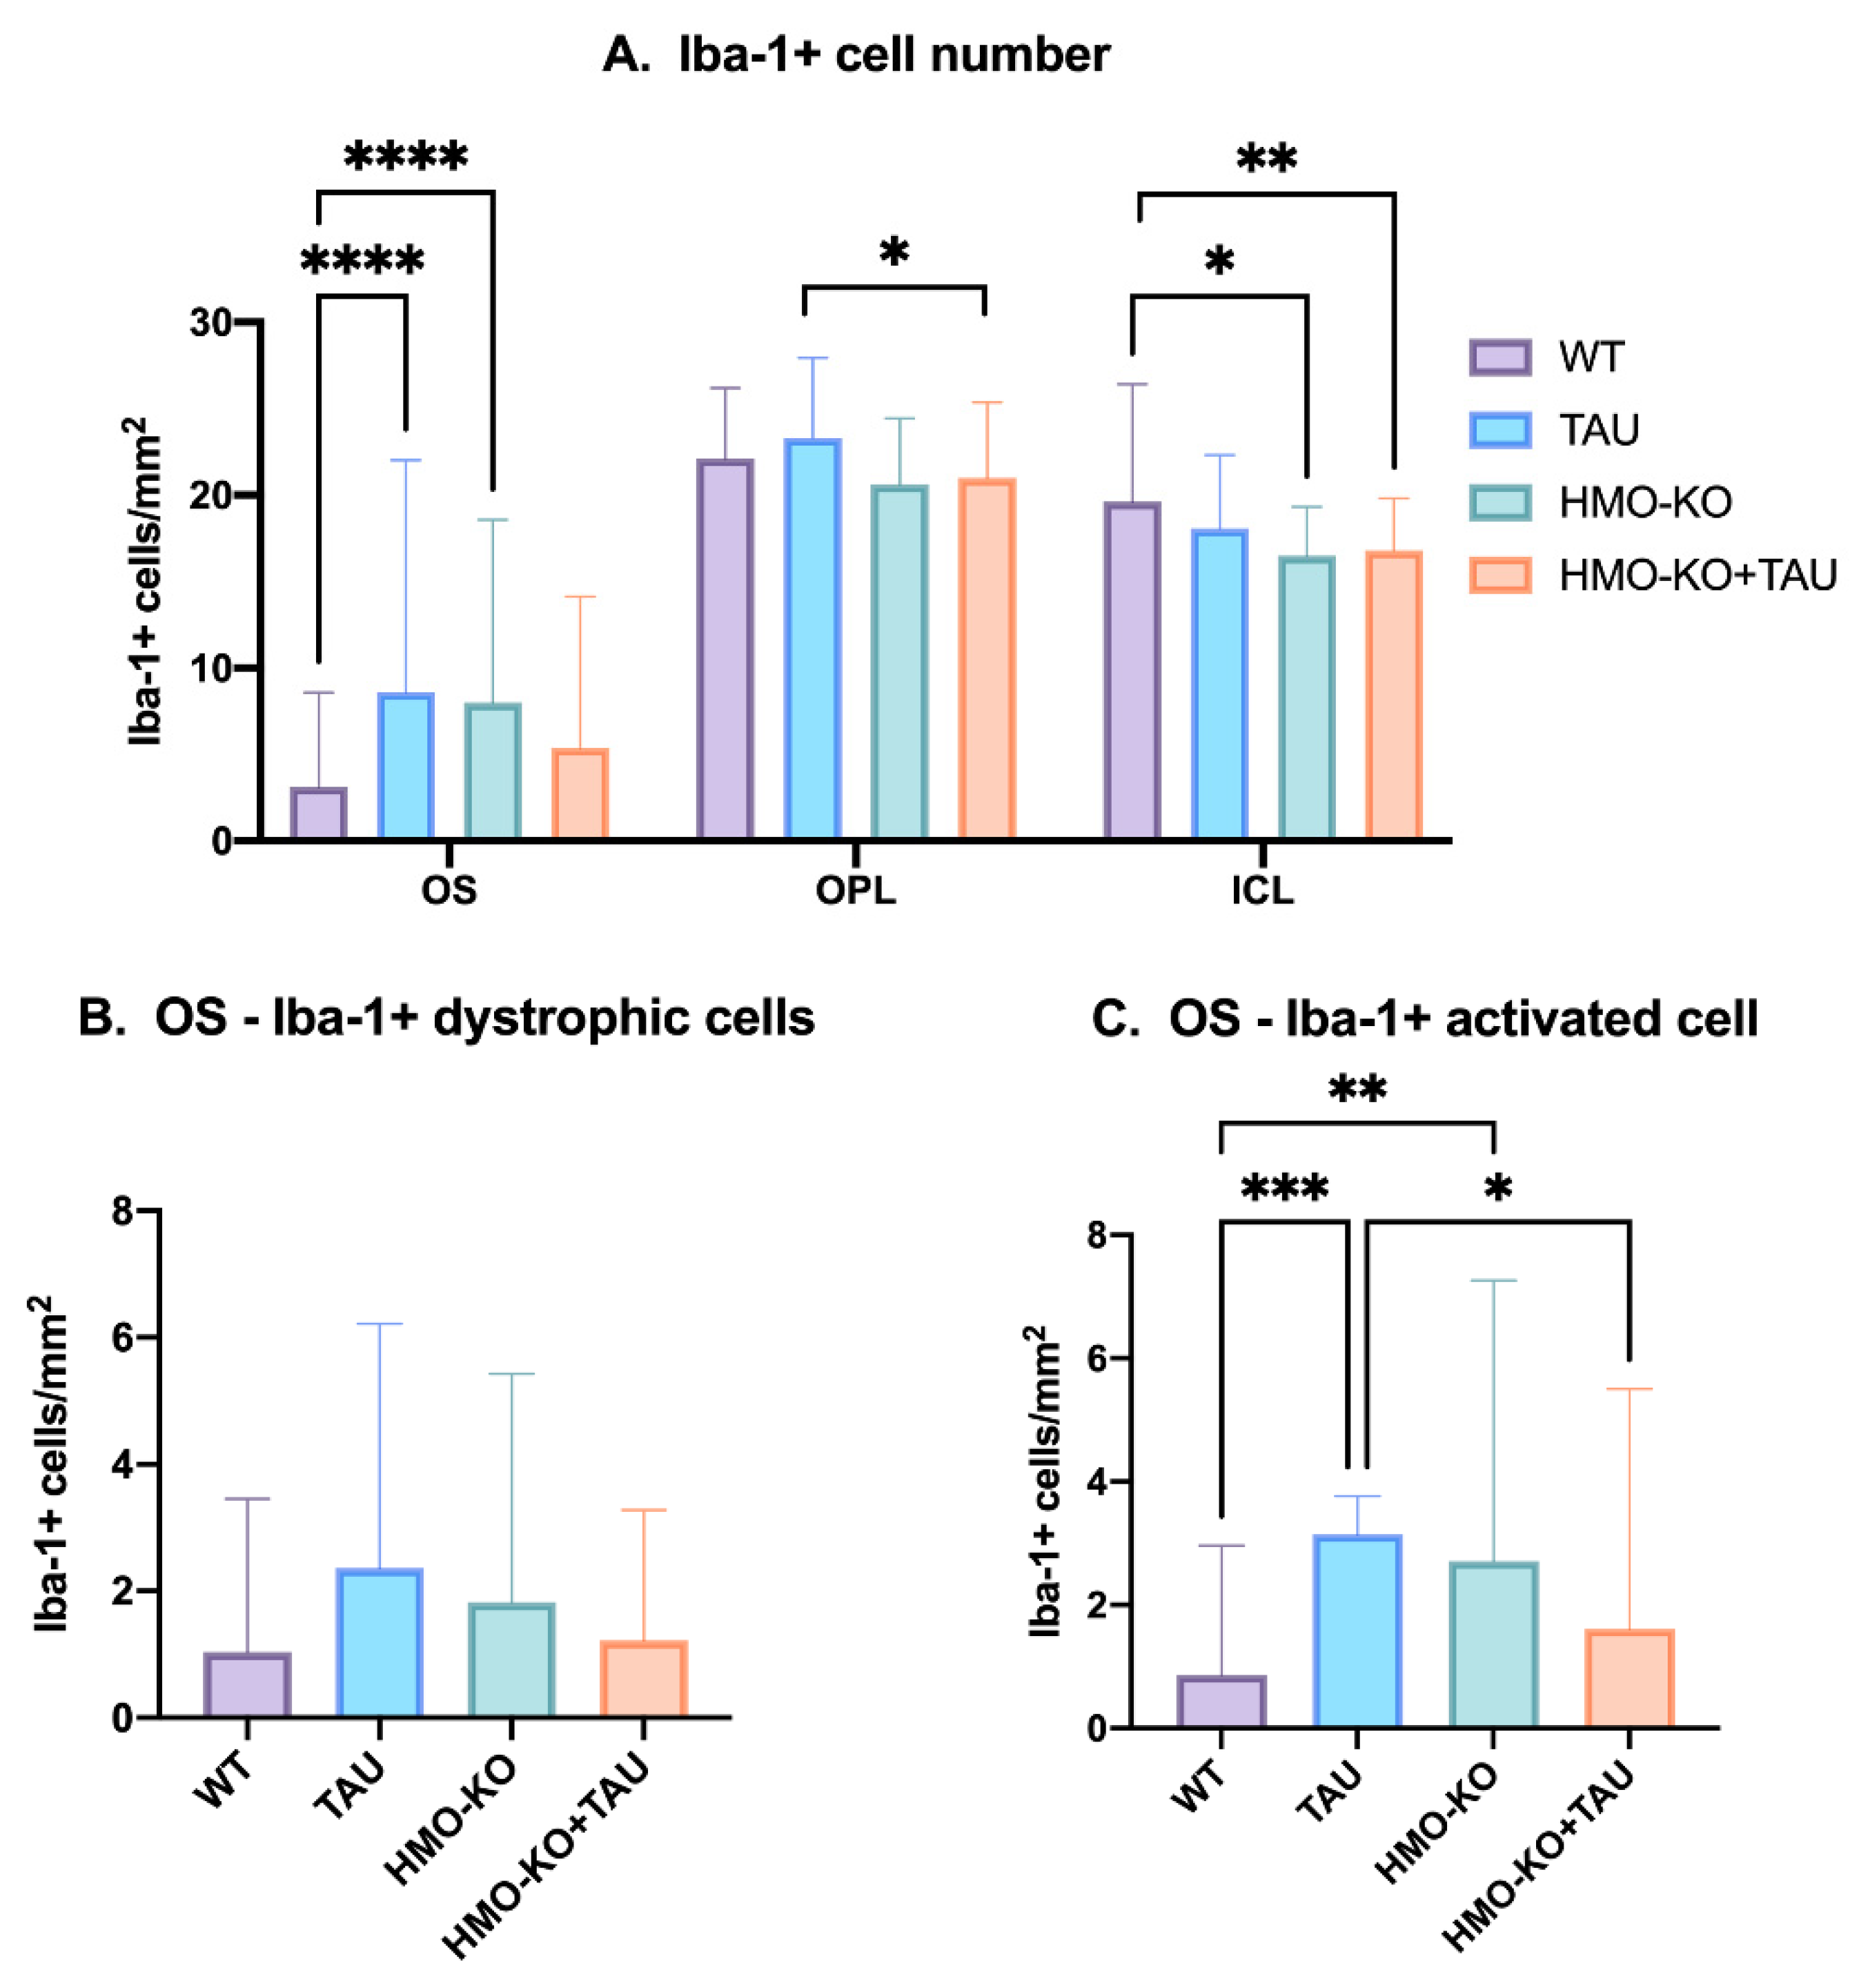
Microglial Cell Numbers

When analyzing the number of microglial cells per retinal layer (Figure 5A), in the OS layer in both the TAU and HMO-KO groups there was a significant increase in the number of Iba-1+ cells with respect to the WT group (p < 0.0001); this was not found in the HMO-KO+TAU group. In the OPL, there was a significant decrease in the number of Iba-1+ cells in the HMO-KO+TAU group with respect to the TAU group (p < 0.05). In ICL, there was a significant decrease of Iba-1+ cells in the HMO-KO group (p < 0.05) and the HMO-KO+TAU group (p < 0.01) with respect to WT.

Number of Dystrophic Iba-1+ Microglia and Iba-1+ Microglia Activated in OS Layer

In the OS layer, there was a non-significant increase of dystrophic microglia in the TAU group with respect to the WT group (p > 0.05). Additionally, a non-significant decrease was found in the HMO-KO+TAU group with respect to the TAU group (Figure 5B).
In the number of activated Iba1+ cells in the OS layer, there was a significant increase in activated microglia in the TAU group (p < 0,001) and in the HMO-KO (p < 0.01) with respect to the WT group, and a significant decrease in the HMO-KO+TAU group with respect to the TAU group (p < 0.05) (Figure 5C).

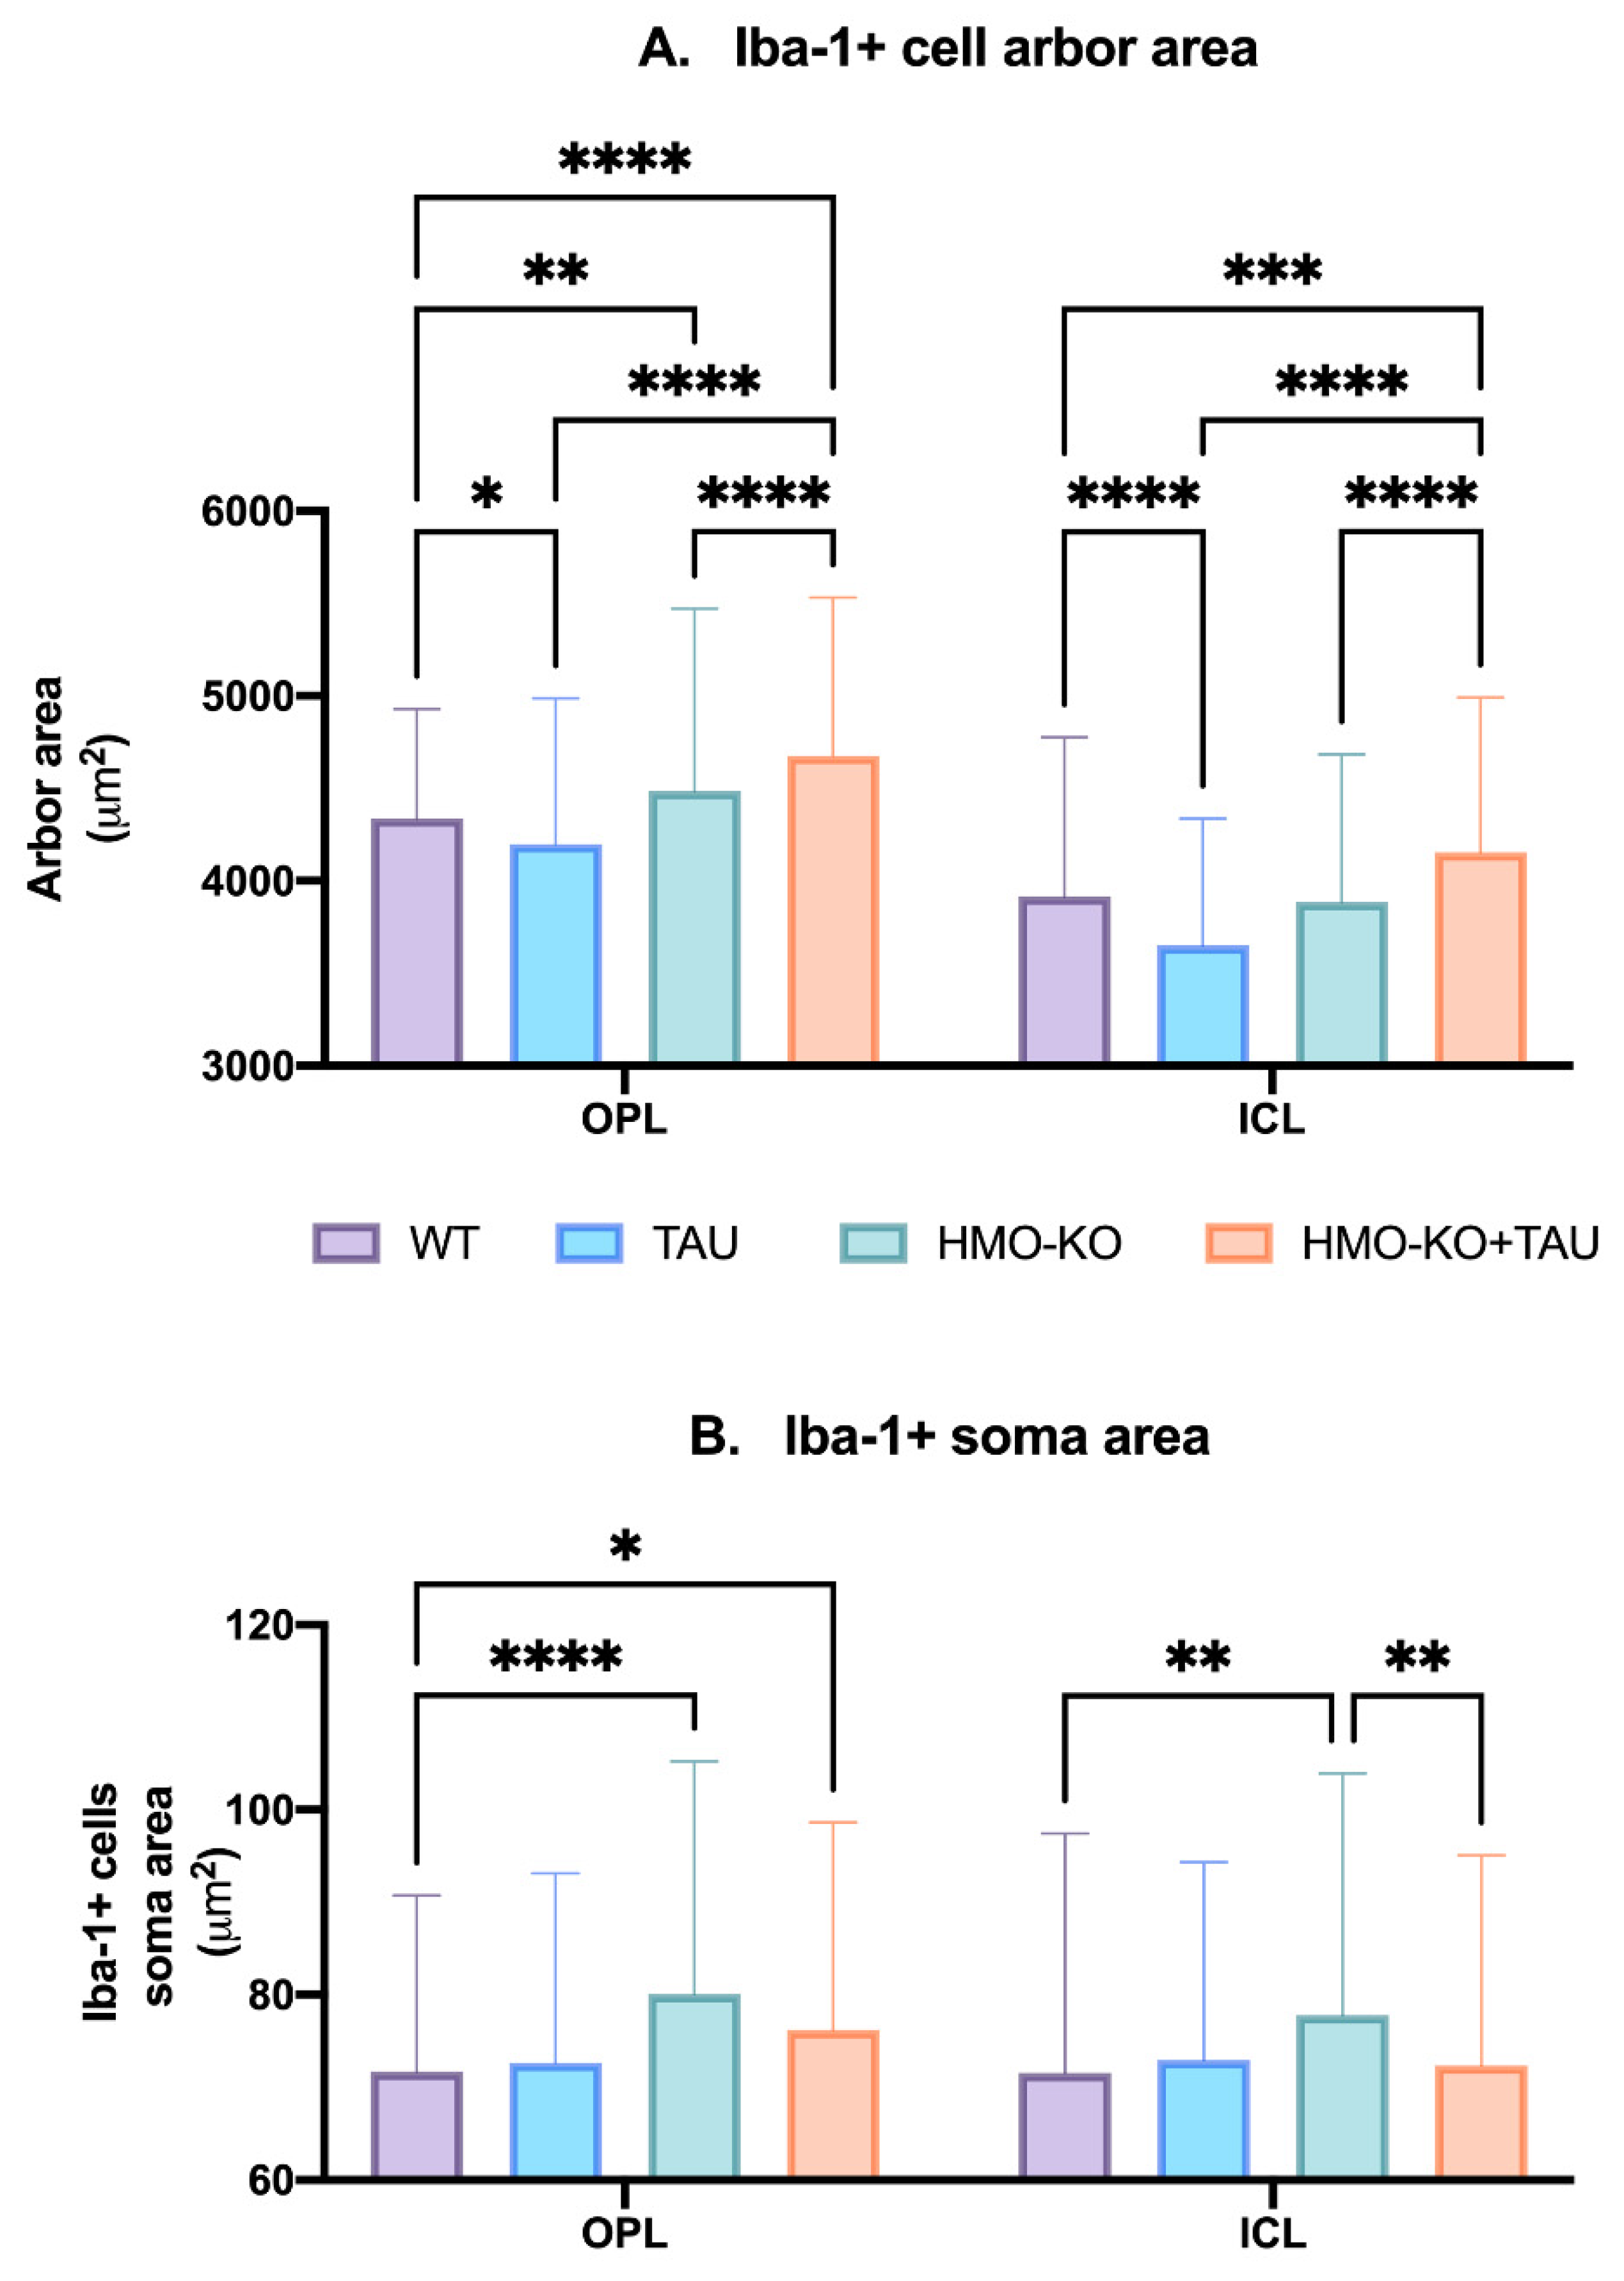
Microglial Arbor Area

The analysis of the OPL and ICL (Figure 6A) showed a significant decrease in the area of microglia arborization (indicating process retraction) in the TAU group compared to the WT group (p < 0.05). However, in the HMO-KO+TAU group, the area of arborization was significantly greater than in the WT group (p < 0.0001 in OPL and p < 0.001 in ICL), in the TAU group (p < 0.0001 in both layers), and in the HMO-KO group (p < 0.001 in both layers).

Microglial Soma Area

In OPL, there was a significant increase in the Iba-1+ soma area in the HMO-KO group and the HMO-KO+TAU group with respect to the WT group (p < 0.0001 and p < 0.05, respectively) (Figure 6B).
In ICL, there was a significant increase in the soma area of Iba-1+ cells in the HMO-KO group with respect to the WT group p < 0.01). There was a significant decrease in the soma area in the HMO-KO+TAU group with respect to the HMO-KO group (p < 0.01). No significant differences were observed between the TAU group and the HMO-KO+TAU group with the WT group (Figure 6B).

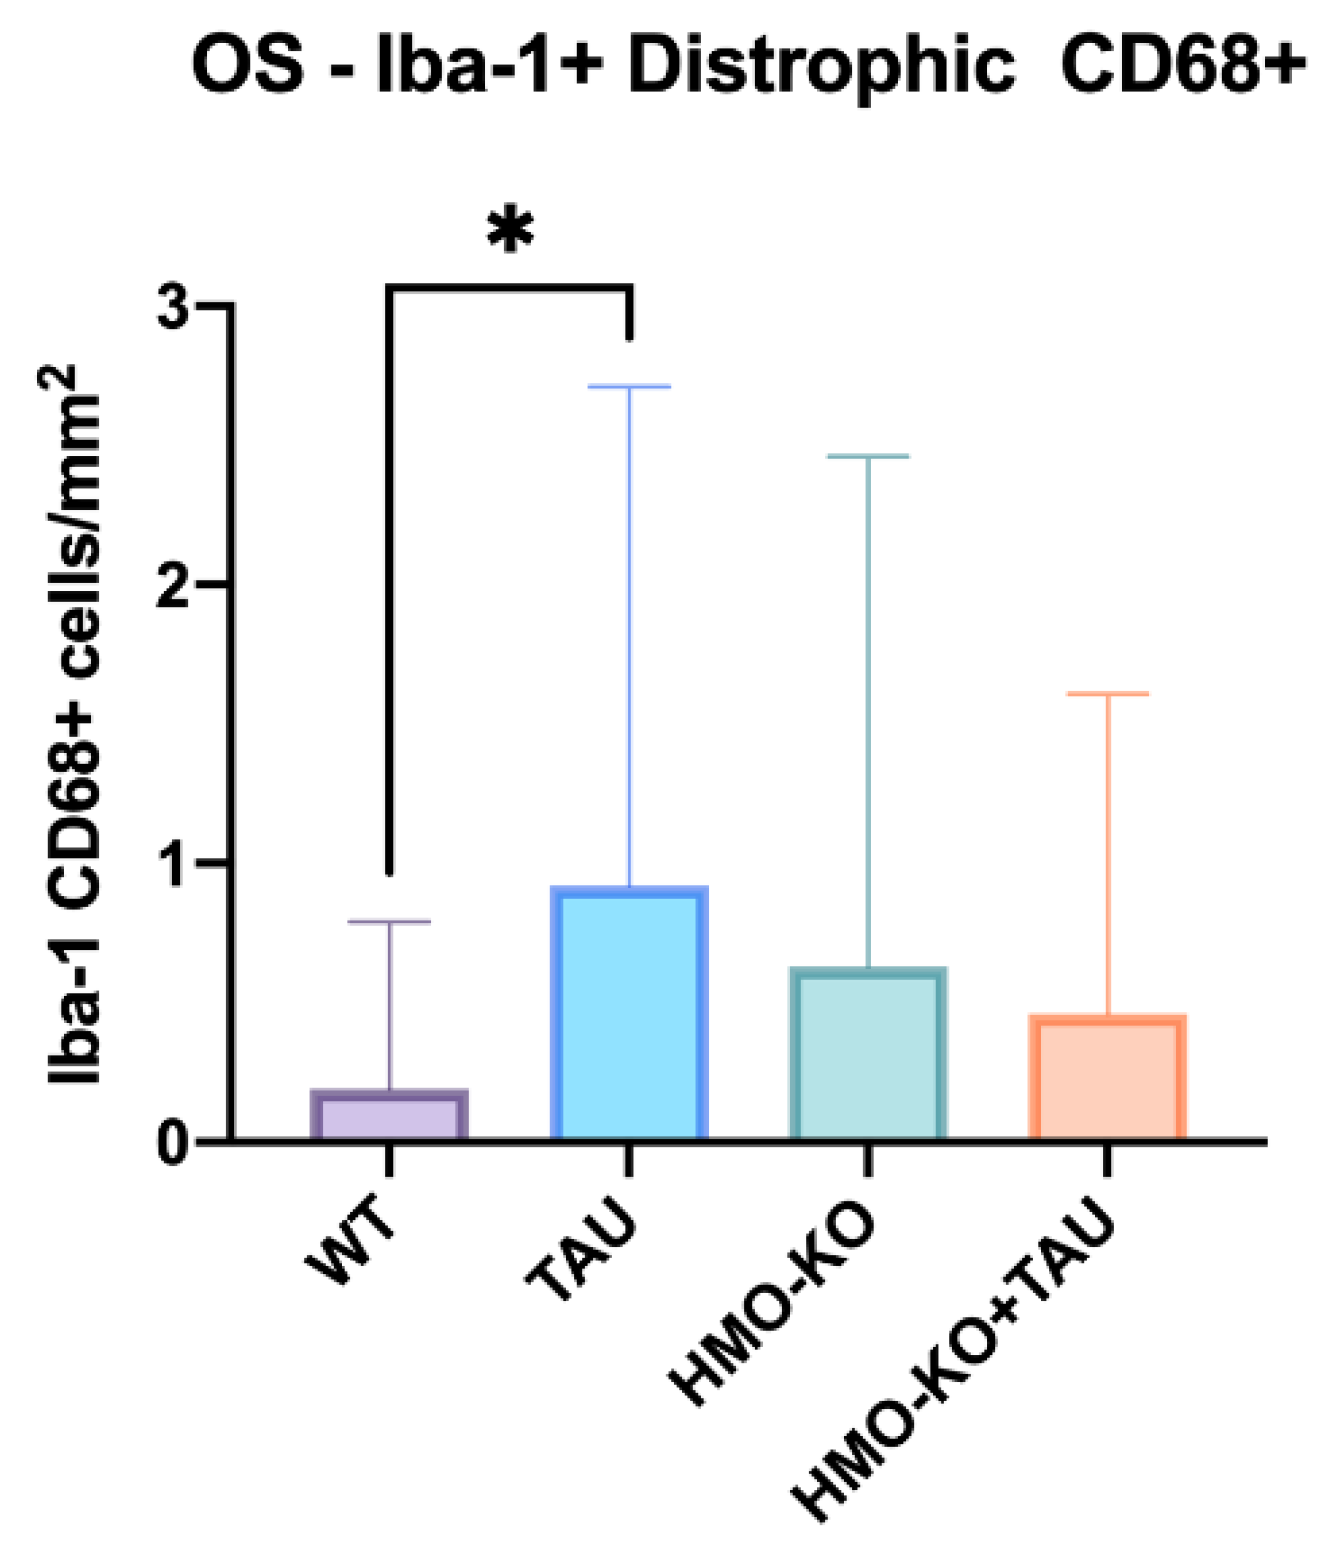
Number of Iba-1+/CD68+ Cells

In the OS layer, there was a significant increase in the number of CD68+ cells with high phagocytic capacity (H) in the TAU group with respect to the WT group (p < 0.0001) and HMO-KO+TAU (p < 0.001). Compared with the WT group, there was also a significant increase in the number of CD68+ cells with high phagocytic capacity in the HMO-KO (p < 0.05) and in the HMO-KO+TAU groups (p < 0.001) (Figure 7).
In OPL, there was a significant increase in the number of CD68+ cells with mean (M) phagocytic capacity in all three groups (TAU, HMO-KO, HMO-KO+TAU) with respect to the WT group (p < 0.0001). There was a significant decrease in the number of CD68+ cells with mean phagocytic capacity (M) in the HMO-KO+TAU group with respect to the TAU group (p < 0.001) and the HMO-KO group (p < 0.0001) (Figure 7). With respect to the number of CD68+ cells with high phagocytic capacity (H), there was a significant increase in the HMO-KO group with respect to the WT group and the HMO-KO+TAU group (p < 0.05, in both cases).
In ICL, there was a significant increase in the number of CD68+ cells with mean phagocytic capacity (M) in the TAU and HMO-KO groups with respect to the WT group (p < 0.0001). There was a significant decrease in the number of CD68+ cells with mean phagocytic capacity (M) in the HMO-KO+TAU group with respect to the TAU group (p < 0.0001) and the HMO-KO group (p < 0.0001). In the number of CD68+ cells with high phagocytic (H) capacity, there was also a significant increase in the TAU group with respect to the WT group (p < 0.01), and in the HMO-KO+TAU group with respect to the TAU group (p < 0.01) (Figure 7).
In the OS layer there was a significant increase of the CD68+ dystrophic cells in the TAU group compared with the WT group (p < 0.05), the increase being not significant compared to the other two groups (Figure 8).

3.3. Morphology and Distribution of Retinal Macroglia in the Different Study Groups

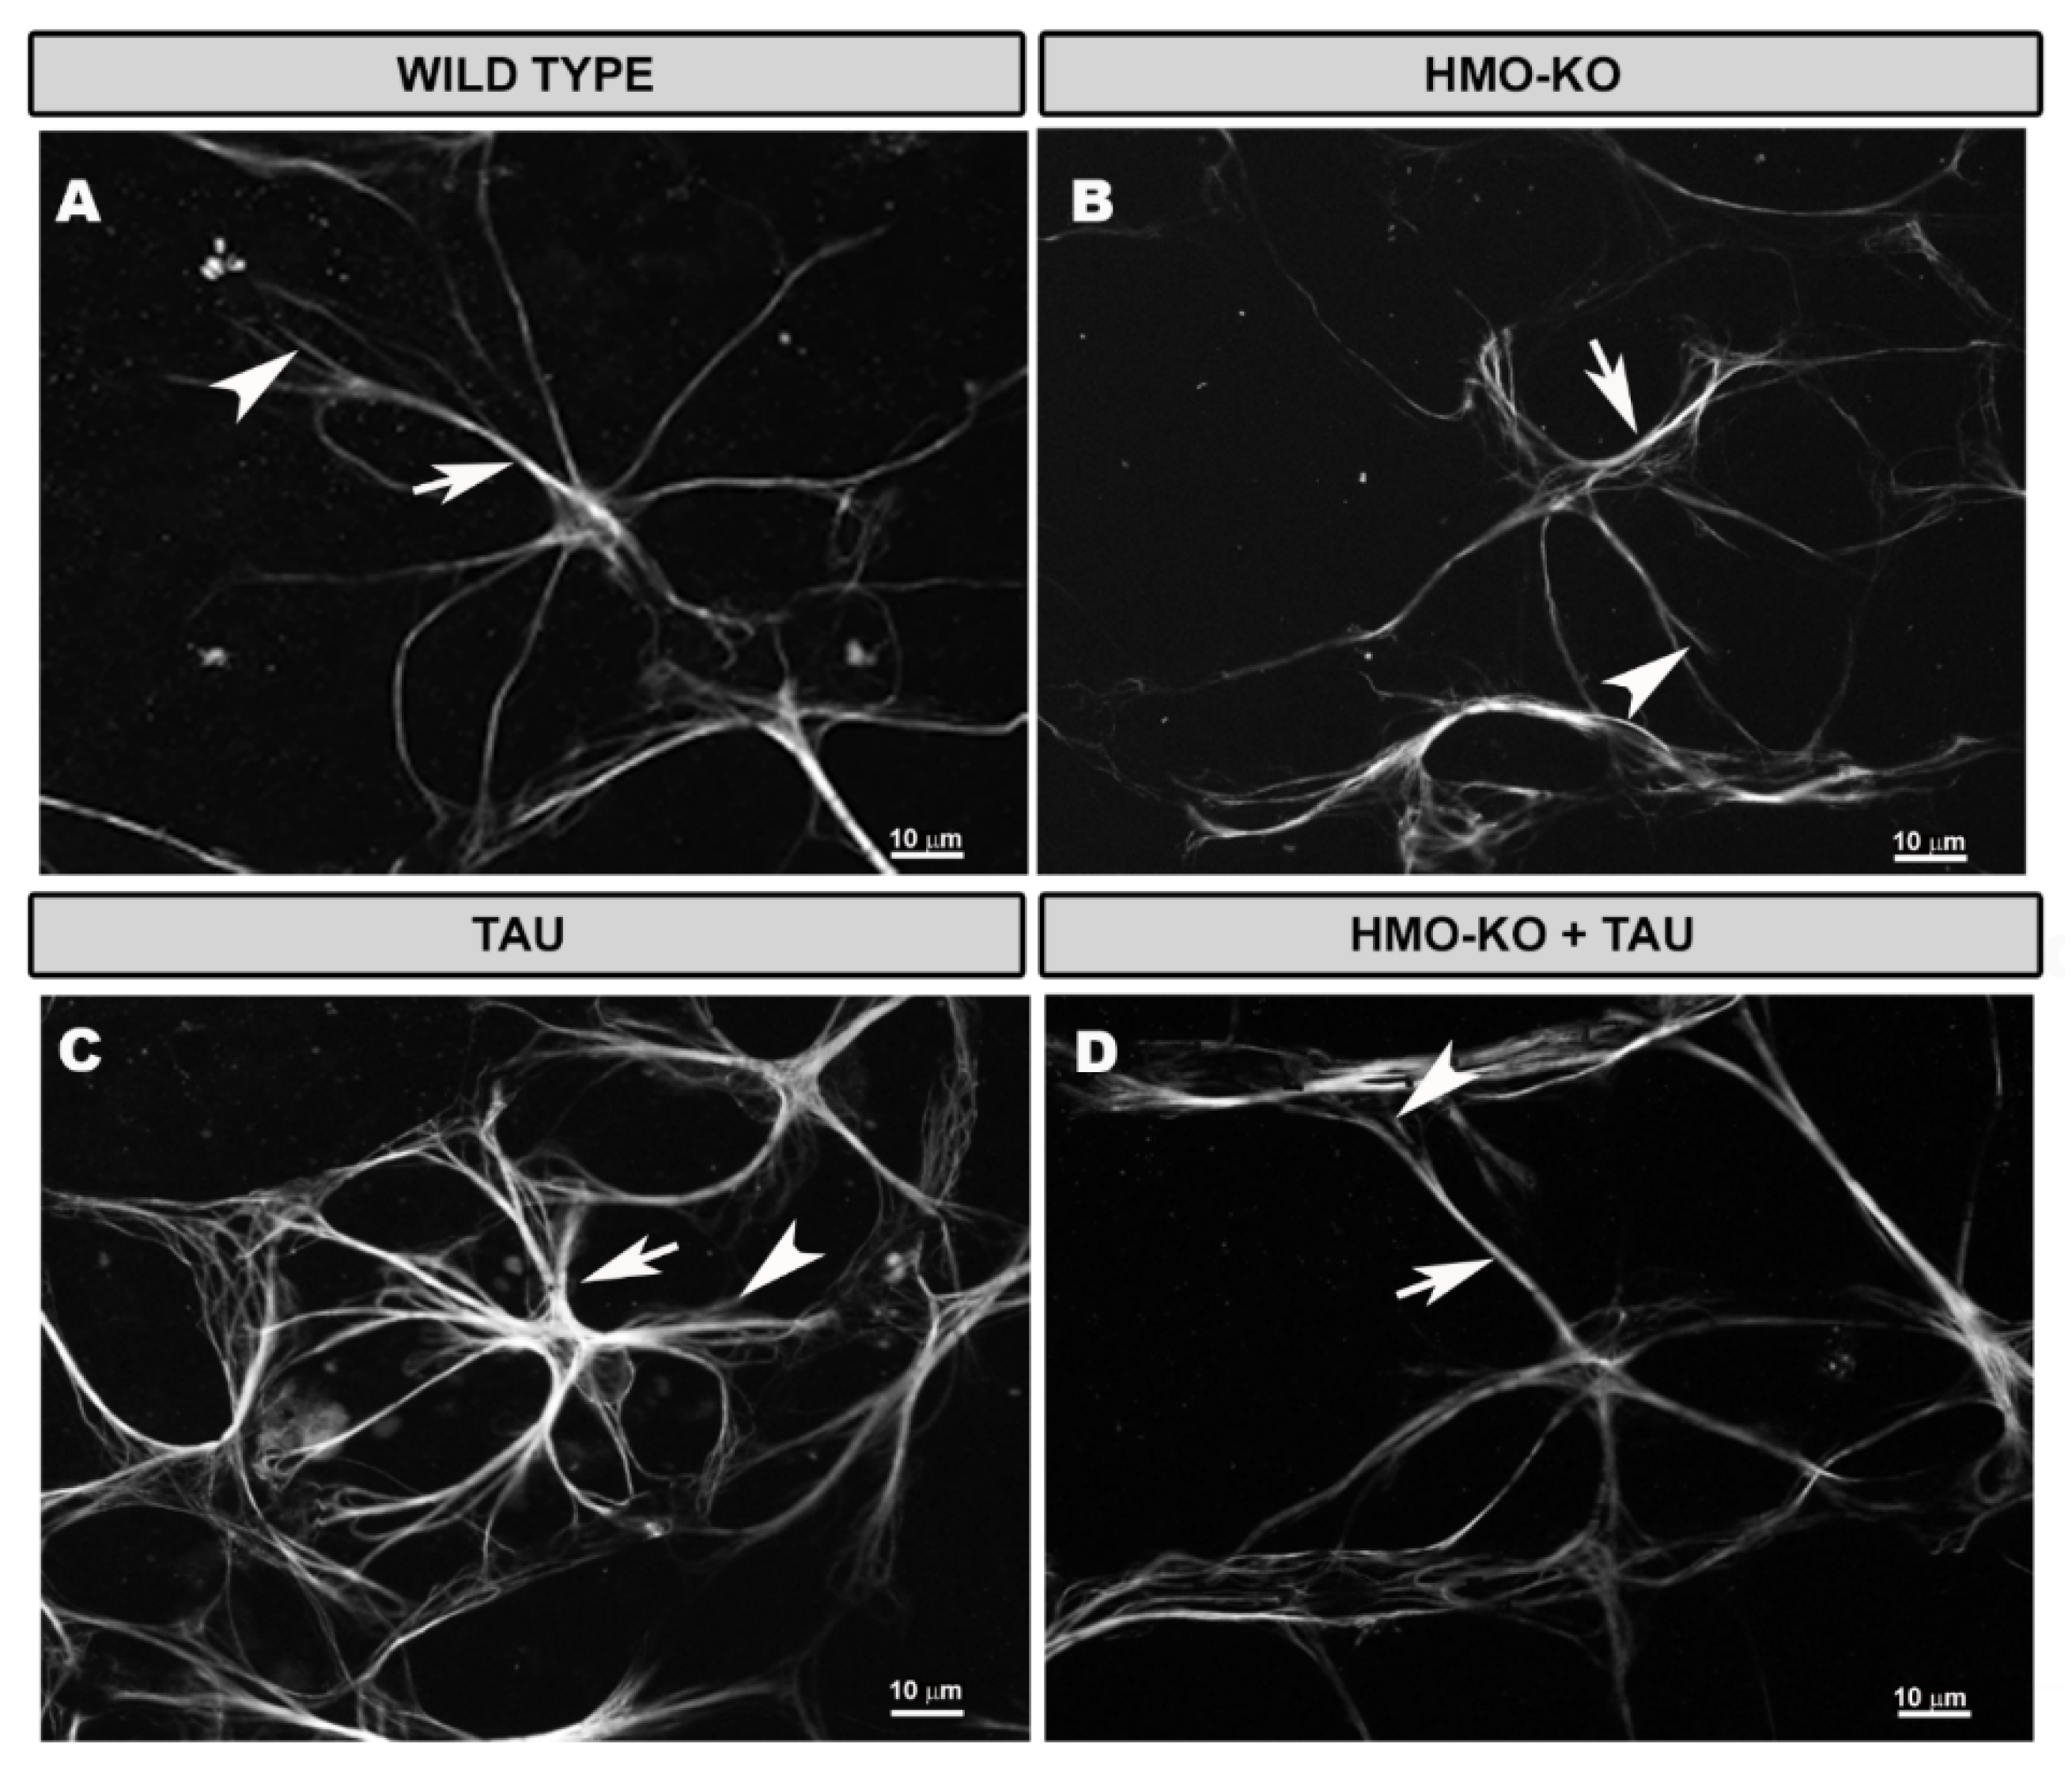
3.3.1. Morphological Study Using GFAP Antibody

In the 15-month-old WT group, astrocytes formed a honeycomb-like plexus of stellate-shaped cells distributed from the optic disc to the periphery of the retina in the NFL–GCL. In this plexus, the astrocytes could distinguish themselves from each other and send processes toward the blood vessels or arrange their somas on the blood vessels following the vascular trajectory (Figure 9A).
At a higher magnification, the astrocytes had a rounded cell body from which primary processes branched into smaller secondary processes, which could join other astrocyte processes or the surface of blood vessels (Figure 10A).
In the HMO-KO group, the astrocytes had characteristics similar to those of the WT group (Figure 10B), and the plexus they formed resembled that observed in WT group animals (Figure 9B).
In the TAU group, astrocytes were observed to have thicker somas and primary processes than in the WT group; in addition, they had numerous secondary processes, giving the cell a more branched appearance, and occupying more space in the retina (Figure 10C); this resulted in a denser astroglial plexus and closer honeycomb cells (Figure 9C).
In the HMO-KO+TAU group, the astrocytes were thinner and had fewer secondary processes compared to the TAU group (Figure 10D). Both the astrocytes and the astroglial plexus (which was less dense) were more similar to that of the WT group (Figure 9D).

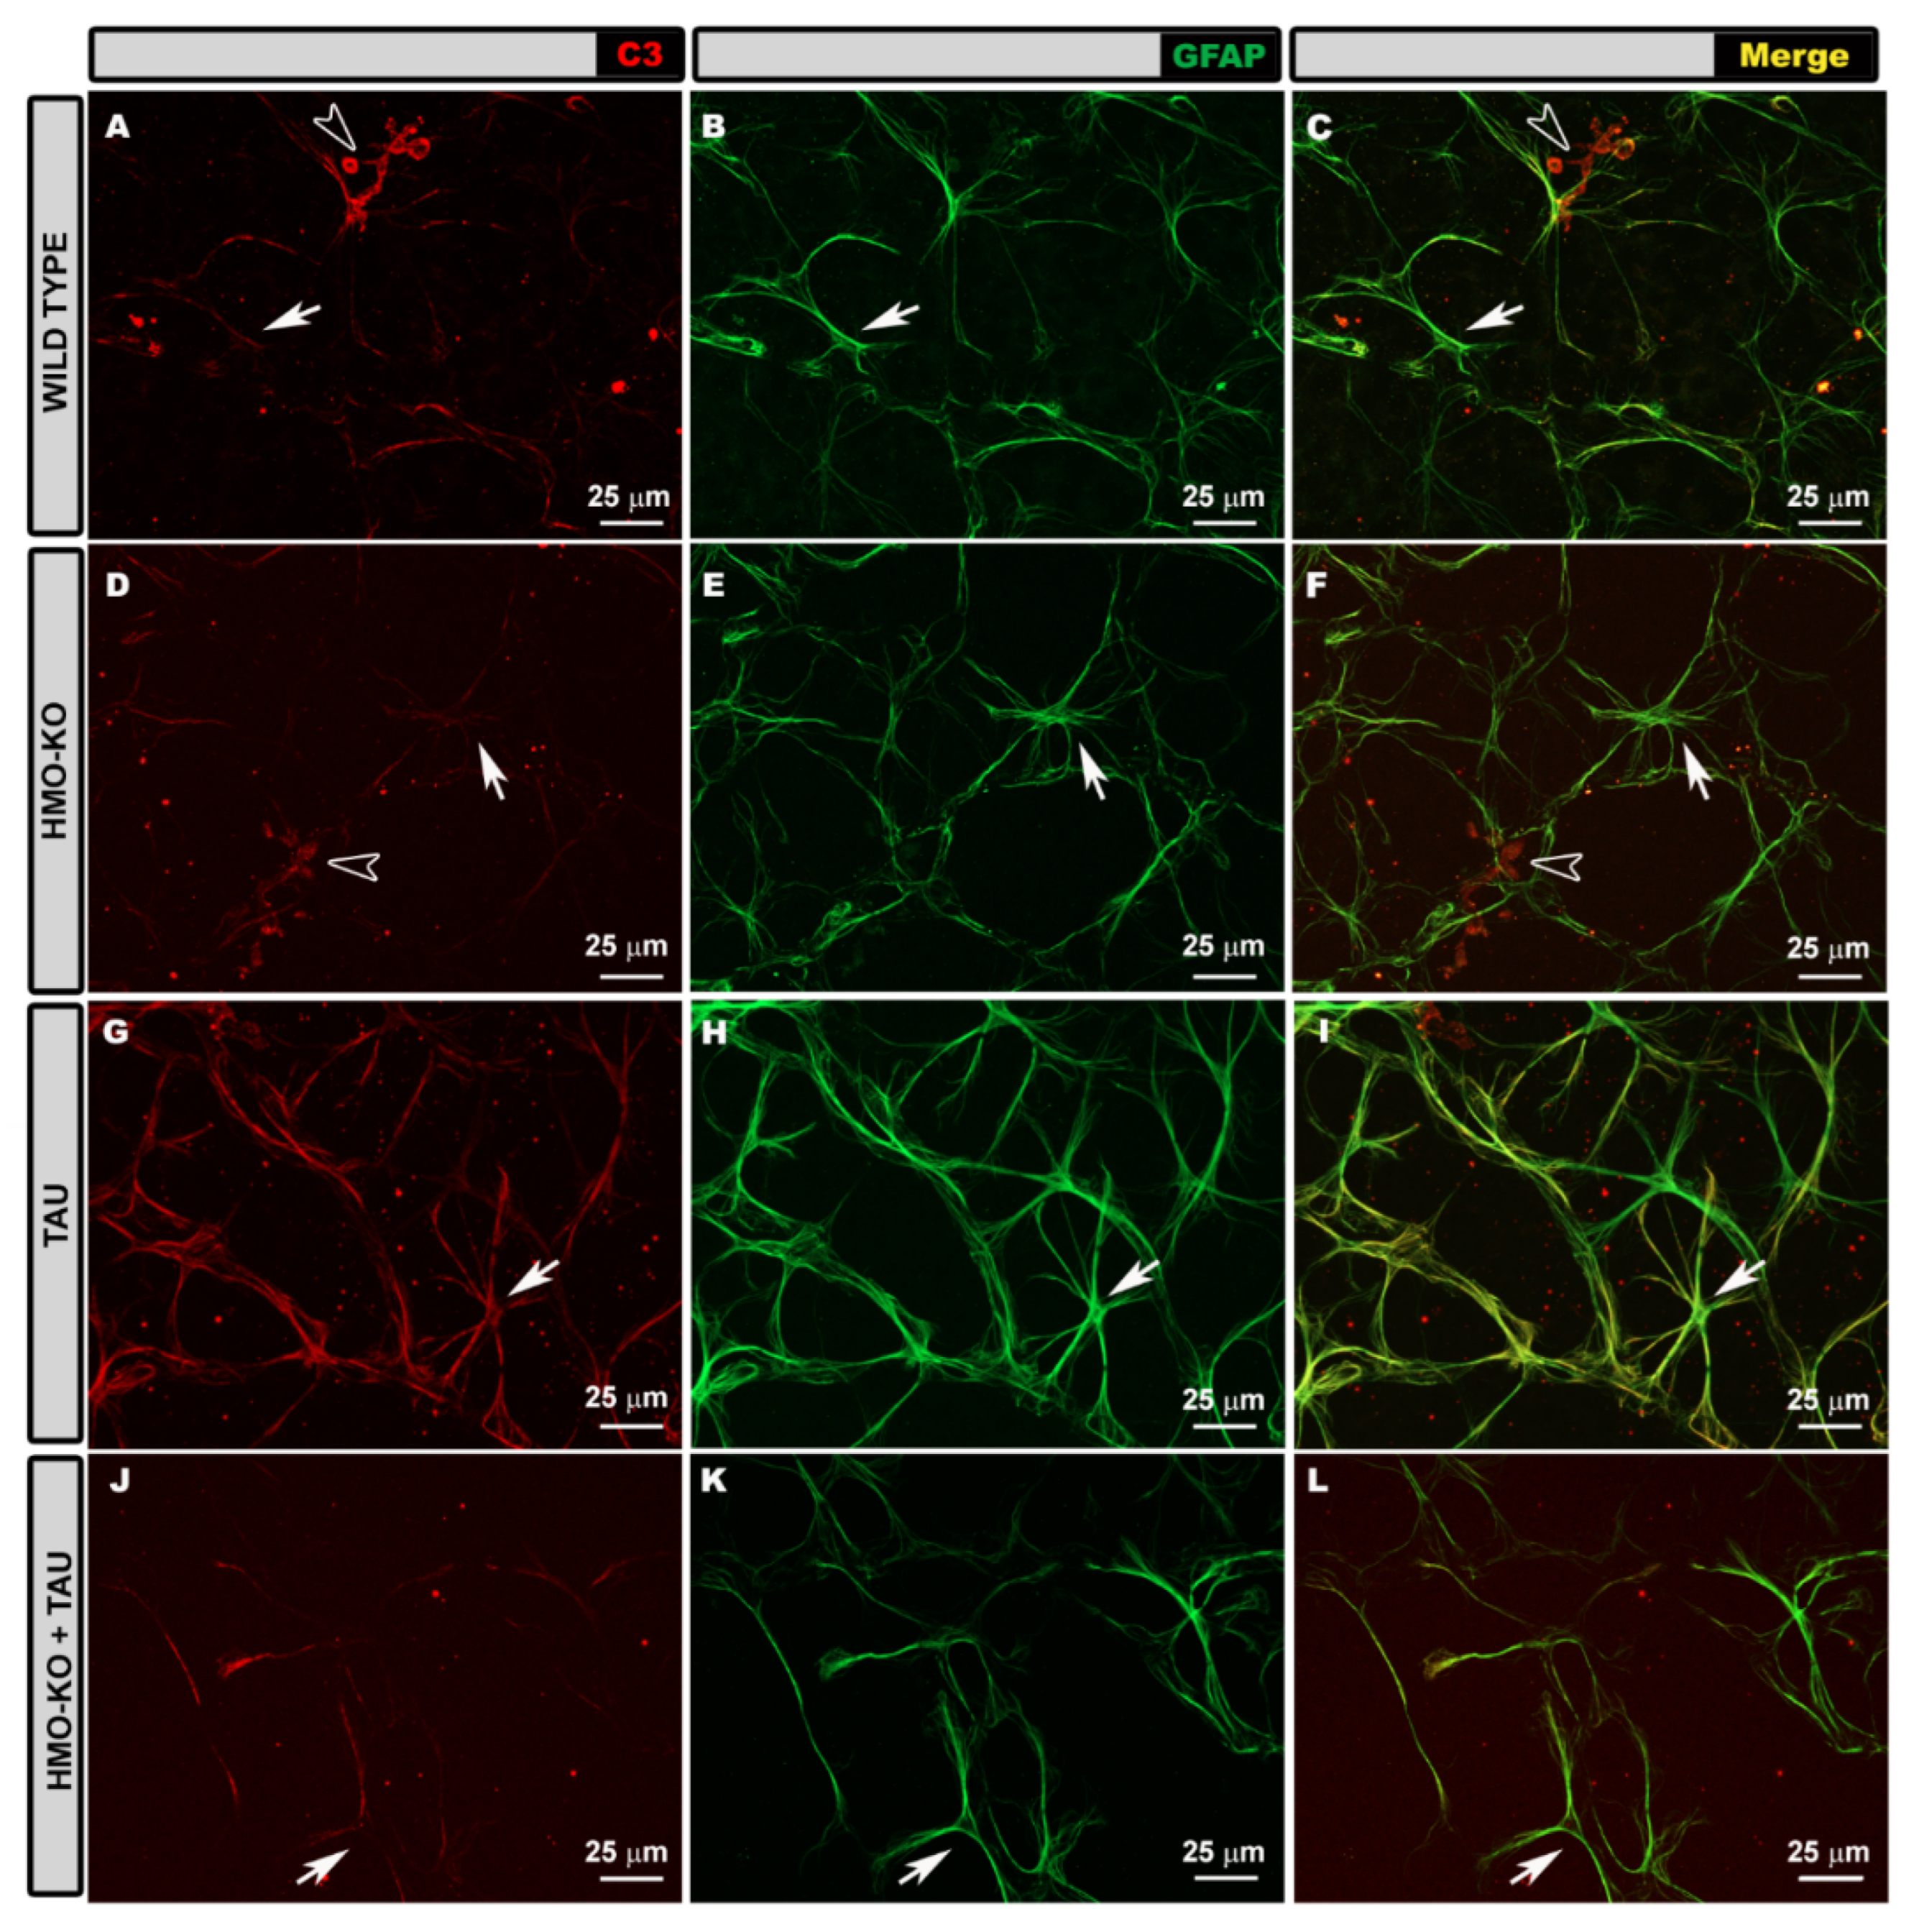
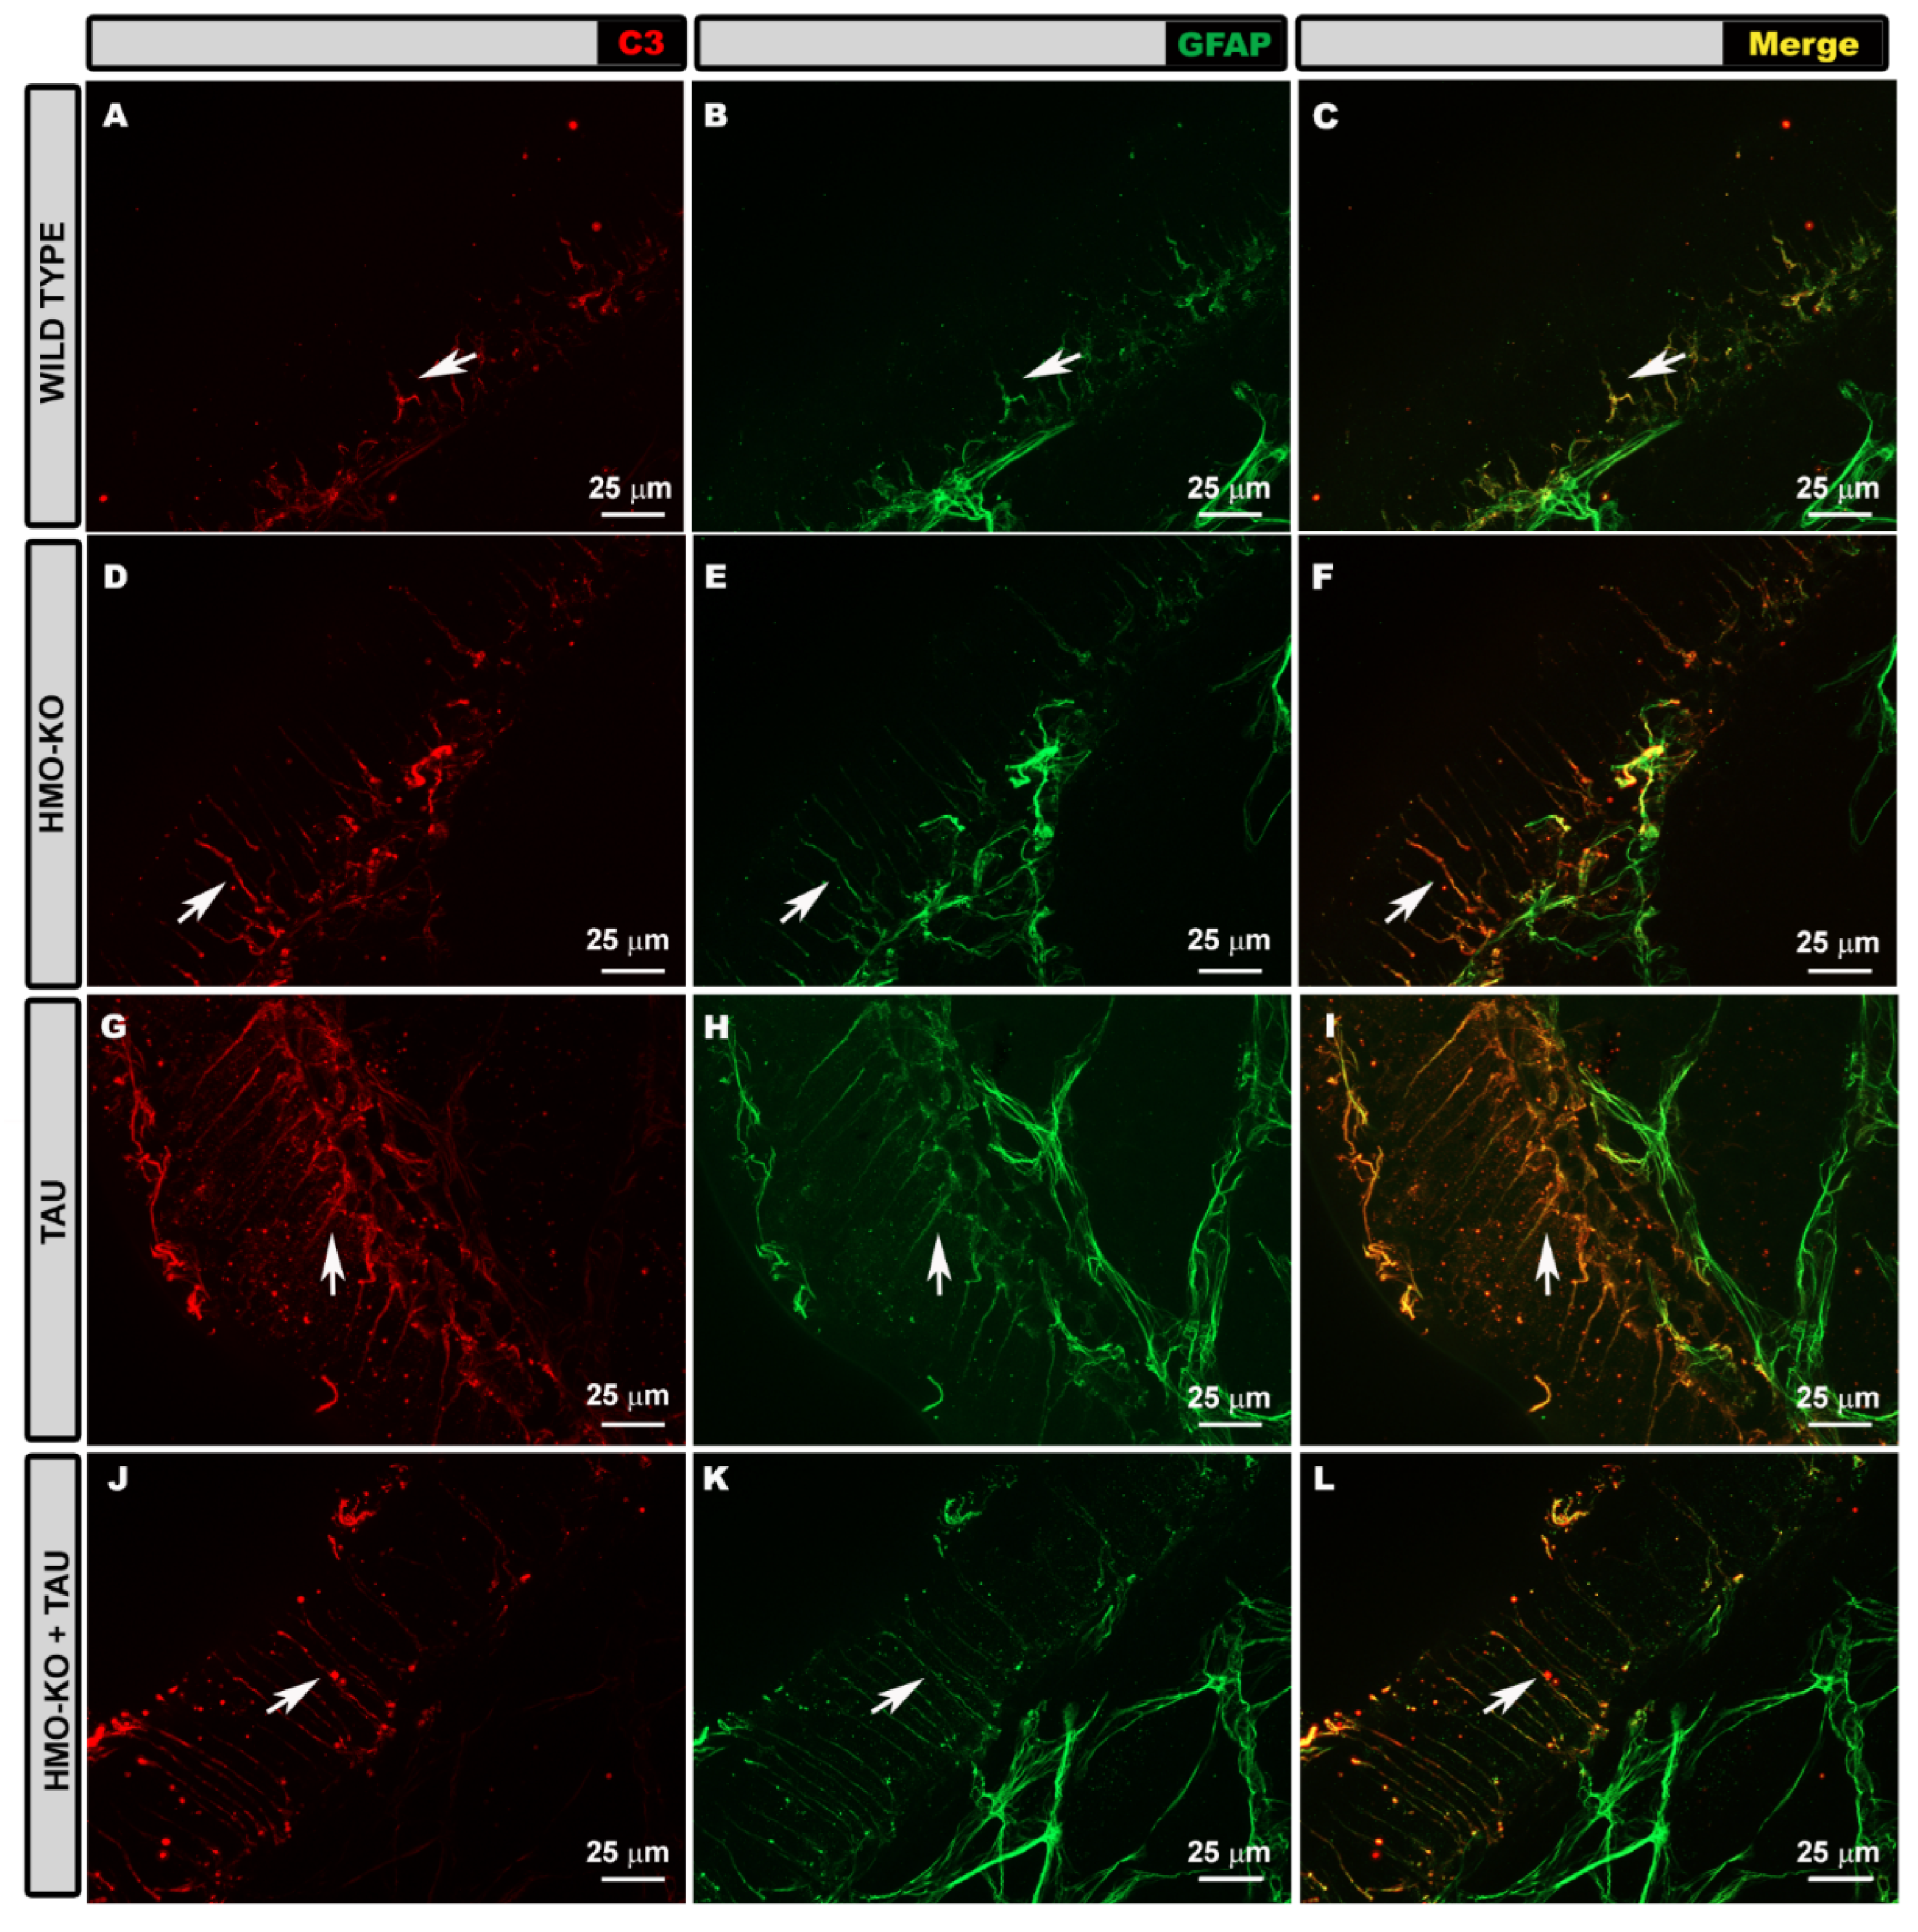
3.3.2. Morphological Study Using C3 Antibody

In the WT group, GFAP+ astrocytes showed a slight C3+ labelling, more evident in the somas and primary processes (Figure 11A–C). This labelling was not homogeneous throughout the retina, with areas of increased labelling and areas where no labelled cells were present. Macrophages were also stained with anti-C3 (Figure 11A,C).
Müller glia can be seen in their entirety in the retinal wholemount when analyzing the areas where we made a cut in the retina to facilitate flattening. In these areas, the flattening of the tissue due to the pressure of the coverslip produces an image similar to that of a histological slice, allowing the cell to be analyzed in its entirety as it is arranged radially in the retina. The Müller cells that were observed, due to low GFAP staining, were lightly labelled with anti-C3 (Figure 12A–C).
In the HMO-KO group the C3+ labelling of GFAP+ astrocytes was similar to that observed in the WT group (Figure 11D–F). In Müller cells, C3 labelling was also like the WT group (Figure 12D–F).
In the TAU group, GFAP+ astrocytes showed more intense C3+ labelling, both in the somas and in the primary and secondary processes, than in the other study groups (WT, HMO-KO, HMO-KO+TAU) (Figure 11G–I). Although the marking was not homogeneous throughout the retinal extent, the extent of the marking was greater than in the WT group. The C3+ labelling of the Müller cells was also more intense than in the other groups, and the entire cell was distinguishable (Figure 12G–I).
In the HMO-KO+TAU group, the C3+ labelling of astrocytes was lower than that observed in the TAU group (Figure 11J–L). Müller cells had lower labelling than in the TAU group (Figure 12J–L).

3.3.3. Quantitative Study of Retinal Macroglial Cells

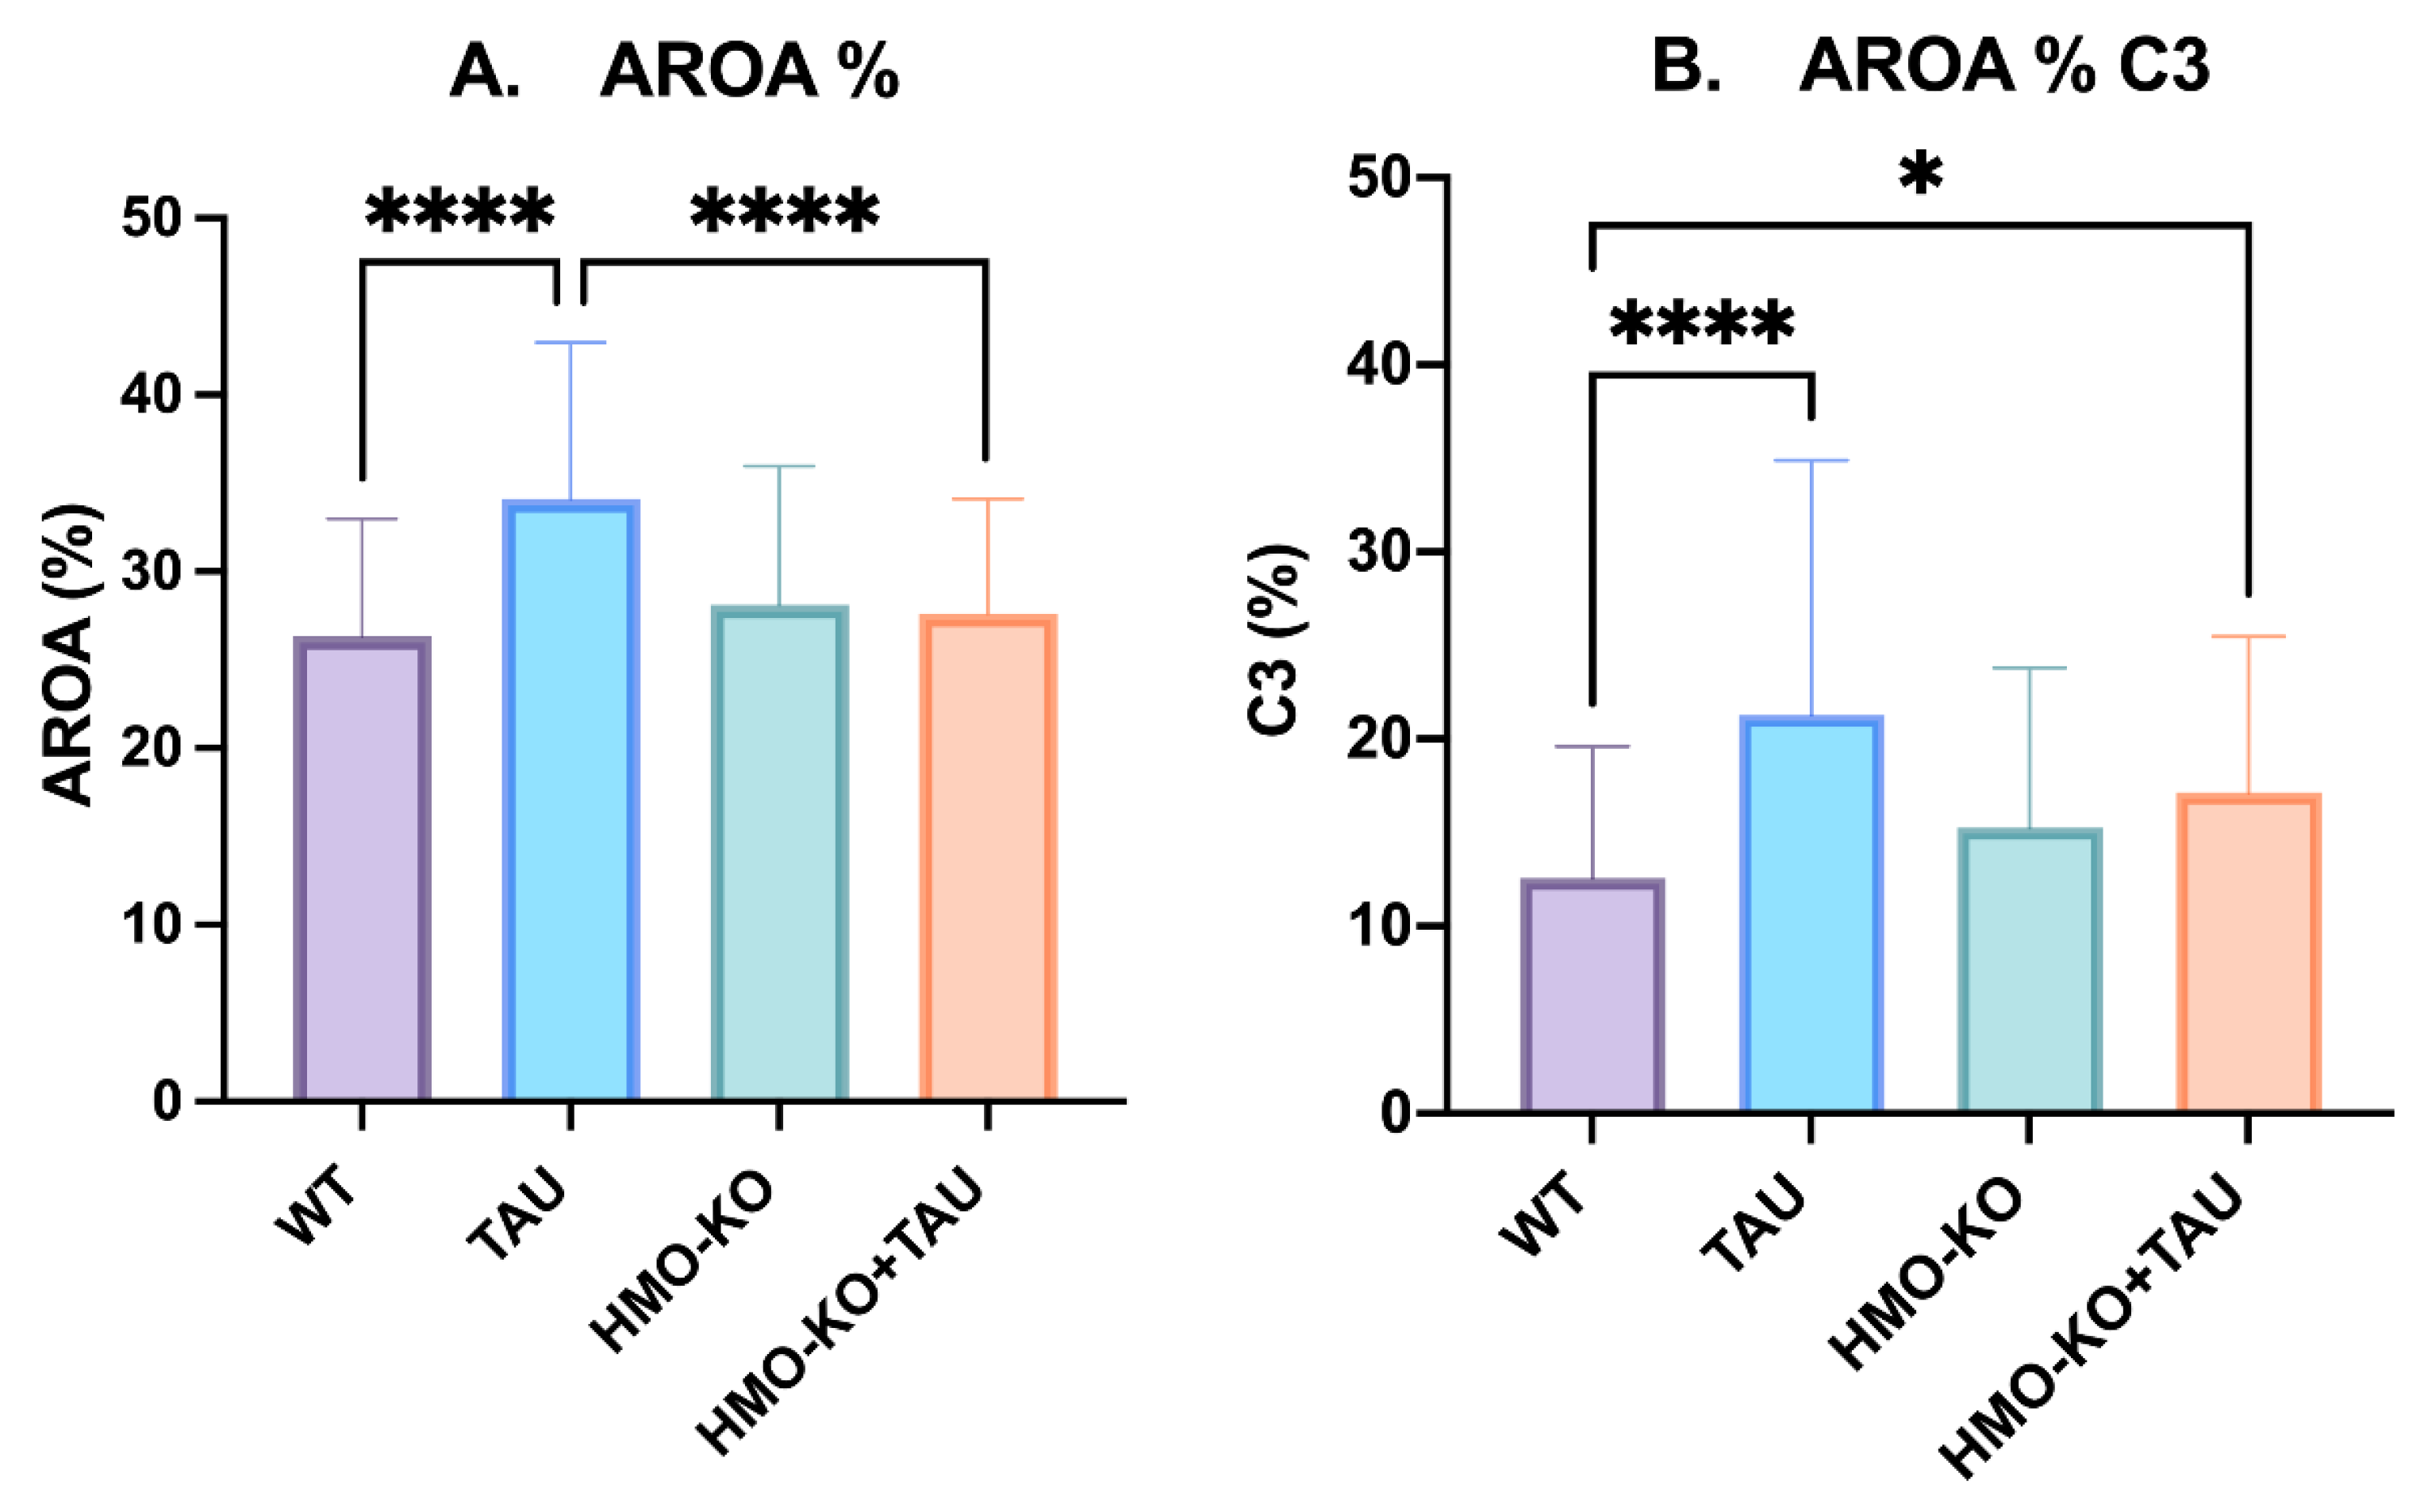
Area of Retina Occupied by GFAP (AROA)

In the TAU group, there was a significant increase in AROA with respect to the WT group and to the HMO-KO+TAU group (p < 0.0001, in both cases) (Figure 13A).

Area of Retina Occupied by C3 (AROC3)

There was a significant increase in AROC3 in the TAU group with respect to the WT group (p < 0.0001) that was observed to a lesser degree in the HMO-KO+TAU group (p < 0.05) and was not observed in the HMO-KO group. In addition, a nonsignificant decrease in AROC3 was observed in the HMO-KO+TAU group with respect to the TAU group (Figure 13B).

4. Discussion

This study demonstrates for the first time that glial activation (macroglial and microglial) occurs in the retina in an aged mouse model induced with tauopathy in the hippocampus and how this glial activation was reduced in old mice KO for microglial HO-1.
In the present study, 15-month-old mice were used. This postnatal stage in mice is considered an early stage in the aging process [59]. In a previous study [24], WT mice of this age were found to have morphological signs of microglial activation such as a non-significant increase in the number of Iba-1+ cells in the OS layer, a non-significant decrease in the arborization area of Iba-1+ cells in the OPL, and a significant increase in the cell body area of Iba-1+ cells in the OPL, IPL, and NFL–GCL. In addition, numerous CD68+-labelled amoeboid-type Iba-1+ cells were found in the aged animals compared to no labelling in the young animals [24]. Likewise, in older (18–24 months) CX3CR1+/GFP transgenic mice, Damani et al. [60] found more retracted and less branched processes and a significant increase in microglia cell density in the OPL and IPL compared to young mice. These microglial changes observed with the aging are due to microglia being in a state of chronic activation, called primed microglia [26]. In the brain, these microglia increase the release of proinflammatory cytokines such as IL-1β, IL-6, or TNF-α, and they increase the expression of inflammatory receptors. They also increase their phagocytic capacity (CD68) and the expression of MHC-II [25,61]. Thus, microglia in aged mice undergo low-grade inflammatory changes and are in a chronically activated state compared to young adult mice [62]. This primed phenotype causes microglia to respond more acutely to damage, as has been demonstrated in aged mice induced with ocular hypertension (OHT) [24].
In our study, we used an aged animal model in which hippocampal tauopathy was induced by bilateral injection of AAV-hTauP301L. Tauopathies are associated with neurodegenerative processes in which an inflammatory process occurs with glial activation, cytokine release, synapse loss, axonal transport impairment, mitochondrial dysfunction, oxidative stress, DNA damage, and epigenetic changes, which promote cell apoptosis [63,64]. In the brain, there is microglial activation related to tauopathy [65,66]. PS19 transgenic mice (tauopathy model) aged 4 or 8 months showed increased microglial activation in the hippocampus, characterized by thickened and branched processes. This activated microglia was located near the neurofibrillary tangles [65]. In AD mice [67], microglial activation has also been found, with a significant increase in Iba-1+ cells and colocalization with T22 tau oligomers observed in the cerebral cortex of these mice. In 24-month-old Htau mice, a model expressing all six human tau isoforms without expressing mouse tau, a significant increase in activated microglia relative to WT, and co-localization of these microglia with tau [67] has been reported.
Nilson et al. [67] found microglial activation and morphological changes in the retina of P301L transgenic mice (tauopathy model). The authors observed microglial activation throughout the retina near the tau oligomer deposits. They found microglial hyperactivation and proliferation in the OS layer and in the retinal pigment epithelium layer. Morphologically, microglia in the eyes of P310L mice showed smaller cell bodies and irregular and short processes.
In our model of tauopathy induced by injection of AAV-hTauP301L into the hippocampus, we did not find tau protein in the retina. Therefore, retinal microglial activation could come from brain microglial activation, since the retina is an extension of the brain [37]. Although there are studies that have detected the presence of tau aggregates at the retinal level in NDs such as AD [42,44], there are also studies that have not detected the presence of pathological aggregates of tau protein in the human retina of patients with AD or PD [68,69]. The absence of tauopathy in the retina in our model could be due to the fact that retinas were analyzed 35 days post-AAV-hTauP301L injection. Therefore, this time line may not be sufficient for tauopathy to propagate to the retina
Our results of the morphometric study of retinal microglia showed a significant increase in the number of Iba-1+ cells and activated Iba-1 microglia in the OS layer, with no significant increase in other retinal layers. This increase of Iba-1+ cells in animals with tauopathy could be comparable to those found in retina and brain by other authors [67]. In addition, we found a significant decrease in the arbor area of Iba-1+ cells in the OPL and ILC in the TAU group, with more branched but thickened and retracted processes compared to the WT group. Process thickening and increased branching of processes was described by Yoshiyama et al. in the brain in PS19 transgenic mice [65]. In addition, retraction of microglial processes was also found in P301L transgenic mice [67]. We observed a significant increase in CD68 expression in microglial cells of the OS layer, OPL, and ILC in the TAU group with respect to the WT group. All this reveals that increased phagocytosis by microglia is occurring in the retina of animals with tauopathy, which would indicate an increased microglial inflammatory process [70].
In this study, we also found an increase of CD68+ dystrophic microglia in the OS layer in the TAU group with respect to the WT group. When the cell loses its capacity to maintain iron homeostasis, it becomes dystrophic microglia [71]. Dystrophic microglia have a lower neuroprotective capacity and can secrete a greater amount of proinflammatory molecules, being related to ND and neurodegeneration [16].
Macroglial changes (astrocytes and Müller cells) have also been observed in association with tauopathy. In the brain of 6-month-old PS19 mice (tauopathy model) [65], a significant increase in GFAP labelling has been found in the hippocampus, amygdala, entorhinal cortex, and spinal cord. Studies by Nilson et al. [67] showed in frontal cortical sections of mice with frontotemporal lobar dementia (FTLD) and AD a significant increase in GFAP labelling with respect to their control group. In addition, by ELISA technique, the authors found a significantly higher level of GFAP in FTLD and AD mice. In 11-month-old Htau mice [67], fragmented astrocytes with reactive morphology were found in the brain. In addition, in 24-month-old Htau mice [67], astrocyte activation was further increased when higher levels of tau oligomers were present.
In the retina of P301L transgenic mice with tauopathy, the presence of reactive astrocytes [67] located in proximity to tau oligomers has been detected. This has also been observed in the retina of 3xTg-AD (AD model) mice [72,73]. The retina of AD patients [74] showed astrogliosis at the level of the RGC layer, together with a significant increase in the area occupied by GFAP with respect to control patients. In addition, astrocytes significantly overexpressed C3 with respect to the control. All this was associated with increased levels of hyperphosphorylated tau aggregates.
In our study, as in the previous models, a significant increase in the area occupied by GFAP (AROA) was found in the TAU group with respect to the WT group, indicating the activation and hypertrophy of astrocytes [75,76]. A significant increase in the area occupied by C3 (AROC3) was also found with respect to the WT group, indicating that astrocytes were in a neurotoxic or A1 phenotype in which the secretion of proinflammatory cytokines, such as IL-1α or TNF, and complement factors, such as C1q or C3 [35], is increased. In Müller cells, more intense GFAP and C3 labelling was also detected in the TAU group than in the WT group. In 3xTg-AD mice (animal model of AD) Rodrigues-Neves et al. [72] found by Western blotting a non-significant increase in retinal GFAP levels at 4 months of age and a significant decrease at 8 months of age with respect to their WT groups. However, our study showed a significant increase in GFAP levels in the TAU group with respect to the WT group. This difference between the data may be due to the different animal models studied and the difference between the ages, as our mice were old (15 months). Regarding Müller cells, the authors [72] did not detect evident changes in the distribution and morphology of these cells.
In ND, the inflammatory process and, therefore, glial activation result in a worsening of the neurodegenerative process. Therefore, strategies are being developed to decrease this neuroinflammation to increase neuronal survival.
With aging and in ND, overexpression of HO-1 has been reported [57,77], as this enzyme is involved in the catabolism of the heme group, and one of its products is iron [47]; iron can accumulate and cause neuroinflammation.
In a study by Fernández-Mendívil et al. [55], it was found that in the brains of aged WT mice there was a higher expression of HO-1 than in adult WT mice, and this increase was even greater when exposed to inflammatory stimuli such as LPS. In these brains there was an increase in iron deposition, a primed microglia phenotype, and an increase in inflammatory markers such as iNOS, p65, IL-1β, TNF-α, Caspase-1, and NLRP3. However, in KO mice of HO-1 in microglial cells, all these alterations were prevented. In line with this study [55], we found that microglial deletion of HO-1 was protective for the retina of aged subjects, as indicated by a reduction of inflammatory markers.
In our results, we found that the number of microglial cells in the HMO-KO+TAU group was significantly smaller than in the TAU group in the OPL layer and non-significantly in the OS and ILC, which would indicate lower microglial activation and less tissue damage. The area of microglial cell arborization in the HMO-KO+TAU group was significantly larger than in the TAU group, indicating less process retraction and thus lower microglial activation in the HMO-KO+TAU group.
One fact that we do not know how to explain was the significant increase in microglial soma size in the HMO-KO and HMO-KO+TAU groups in the OPL; we do not know why HO deletion increased microglial soma size without influencing other signs of microglial activation.
The HMO-KO+TAU group had significantly fewer microglia with phagocytic capacity (CD68+) than the TAU group, indicating that less phagocytosis and thus less inflammation occurred in the HMO-KO+TAU group than in the TAU group.
All the above data demonstrated that microglial activation in animals with tauopathy but without HO-1 (HMO-KO+TAU) was much lower than in animals with tauopathy (TAU group).
We also demonstrated lower macroglial activation in animals with tauopathy but without HO-1 (HMO-KO+TAU group). Morphologically, the thickened and more branched appearance of astrocytes in the TAU group was less in the HMO-KO+TAU group, resembling more the WT group. AROA was significantly lower in the HMO-KO+TAU group with respect to the TAU group, being almost at the same level as the WT group. This indicates lower macroglial activation in the HMO-KO+TAU group with respect to the TAU group. We also found that AROC3 in the HMO-KO+TAU group was lower than in the TAU group (not significant), which would indicate that astrocytes might be in a somewhat less neurotoxic phenotype in the HMO-KO+TAU group than in the TAU group.

5. Conclusions

This study demonstrates that in the retinal tissue of animals with tau protein accumulations in the brain, there is a significant increase in signs of microglial and macroglial activation. However, these signs of activation are much lower in animals with tauopathy but without HO-1 in microglial cells.
These data have not been previously described and could open a window for the control of inflammation in tauopathy processes, as well as a target for drug development.

Author Contributions

Conceptualization, J.A.F.-A., J.M.R., M.G.L. and A.I.R.; Data curation, J.A.F.-A., E.S.-G., J.A.M., C.F.-M., E.d.S., L.C., R.d.H., I.L.-C. and L.S.-P.; Formal analysis, J.A.F.-A., E.S.-G., J.A.M., C.F.-M., E.d.S., L.C., R.d.H., I.L.-C. and A.I.R.; Funding acquisition, R.d.H., J.M.R., J.J.S., M.G.L. and A.I.R.; Investigation, J.A.F.-A., E.S.-G., J.A.M., C.F.-M., E.d.S., L.C., R.d.H., I.L.-C., L.S.-P., J.M.R., J.J.S. and A.I.R.; Methodology, J.A.F.-A., E.S.-G., C.F.-M., E.d.S., R.d.H., J.M.R., J.J.S., M.G.L. and A.I.R.; Project administration, J.J.S.; Resources, J.J.S. and M.G.L.; Supervision, J.M.R., J.J.S., M.G.L. and A.I.R.; Writing—original draft, M.G.L. and A.I.R.; Writing—review and editing, J.A.F.-A., E.S.-G., J.A.M., C.F.-M., E.d.S., L.C., R.d.H., I.L.-C., L.S.-P., J.M.R., J.J.S., M.G.L. and A.I.R. All authors have read and agreed to the published version of the manuscript.

Funding

This research was funded by the Research Network RETIBRAIN (RED2018-102499-T) of the Spanish Ministry of Science and Innovation, and the Spanish Ministry of Science and Innovation Ref. RTI2018-095793-B-I00 and Ref. PID2021-125986OB-I00. J.A.F.-A. is currently supported by a Predoctoral Fellowship (FPU17/01023) from the Spanish Ministry of Science, Innovation, and Universities. E.d.S. is currently supported by a Predoctoral Fellowship (FPU18/00630) from the Spanish Ministry of Science, Innovation, and Universities. I.L.-C. is currently supported by a Predoctoral Fellowship (CT42/18-CT43/18) from the Complutense University of Madrid. L.S.-P. is currently supported by a Predoctoral Fellowship (CT82/20-CT83/20) from the Complutense University of Madrid. The sponsor or funding organization had no role in the design or conduct of this research.

Institutional Review Board Statement

Experimental designs and procedures were performed following the Guide for the Care and Use of Laboratory Animals and were previously approved by the Institutional Ethics Committee of the Autonomous University of Madrid and the Autonomous Community of Madrid, Spain (PROEX 218.5/20) in accordance with the European Commission regulations (2010/63/EU) for the use of laboratory animals, and the Spanish Royal Decree 53/2013, of 1 February, which sets out the basic rules to protect animals used in experiments and for other scientific purposes, including teaching.

Informed Consent Statement

Not applicable.

Data Availability Statement

The data supporting the findings of this study are available from the corresponding author upon request.

Acknowledgments

The authors would like to thank Desiree Contreras for technical assistance.

Conflicts of Interest

The authors declare no conflict of interest. The funders had no role in the design of the study; in the collection, analyses, or interpretation of data; in the writing of the manuscript; or in the decision to publish the results.

References

  1. Stephenson, J.; Nutma, E.; van der Valk, P.; Amor, S. Inflammation in CNS Neurodegenerative Diseases. Immunology 2018, 154, 204–219. [Google Scholar] [CrossRef] [PubMed] [Green Version]
  2. Chen, P.; Miah, M.R.; Aschner, M. Metals and Neurodegeneration. F1000Res 2016, 5, 366. [Google Scholar] [CrossRef] [PubMed] [Green Version]
  3. Wright, R.O.; Baccarelli, A. Metals and Neurotoxicology. J. Nutr. 2007, 137, 2809–2813. [Google Scholar] [CrossRef] [PubMed] [Green Version]
  4. Wyss-Coray, T. Ageing, Neurodegeneration and Brain Rejuvenation. Nature 2016, 539, 180–186. [Google Scholar] [CrossRef] [PubMed] [Green Version]
  5. Ransohoff, R.M. How Neuroinflammation Contributes to Neurodegeneration. Science 2016, 353, 777–783. [Google Scholar] [CrossRef]
  6. Barrientos, R.M.; Kitt, M.M.; Watkins, L.R.; Maier, S.F. Neuroinflammation in the Normal Aging Hippocampus. Neuroscience 2015, 309, 84–99. [Google Scholar] [CrossRef] [Green Version]
  7. Arruda, L.F.; Arruda, S.F.; Campos, N.A.; de Valencia, F.F.; de Almeida Siqueira, E.M. Dietary Iron Concentration May Influence Aging Process by Altering Oxidative Stress in Tissues of Adult Rats. PLoS ONE 2013, 8, e61058. [Google Scholar] [CrossRef] [Green Version]
  8. Salvador, G.A.; Uranga, R.M.; Giusto, N.M. Iron and Mechanisms of Neurotoxicity. Int. J. Alzheimers Dis. 2010, 2011, 720658. [Google Scholar] [CrossRef] [Green Version]
  9. Kovacs, G.G. Invited Review: Neuropathology of Tauopathies: Principles and Practice. Neuropathol. Appl. Neurobiol. 2015, 41, 3–23. [Google Scholar] [CrossRef]
  10. Goedert, M.; Eisenberg, D.S.; Crowther, R.A. Propagation of Tau Aggregates and Neurodegeneration. Annu. Rev. Neurosci. 2017, 40, 189–210. [Google Scholar] [CrossRef]
  11. Avila, J.; Lucas, J.J.; Pérez, M.; Hernández, F. Role of Tau Protein in Both Physiological and Pathological Conditions. Physiol. Rev. 2004, 84, 361–384. [Google Scholar] [CrossRef] [PubMed]
  12. Gupta, N.; Fong, J.; Ang, L.C.; Yücel, Y.H. Retinal Tau Pathology in Human Glaucomas. Can. J. Ophthalmol. 2008, 43, 53–60. [Google Scholar] [CrossRef] [PubMed]
  13. Rankovic, M.; Zweckstetter, M. Upregulated Levels and Pathological Aggregation of Abnormally Phosphorylated Tau-Protein in Children with Neurodevelopmental Disorders. Neurosci. Biobehav. Rev. 2019, 98, 1–9. [Google Scholar] [CrossRef] [PubMed]
  14. de Hoz, R.; Rojas, B.; Ramírez, A.I.; Salazar, J.J.; Gallego, B.I.; Triviño, A.; Ramírez, J.M. Retinal Macroglial Responses in Health and Disease. Biomed. Res. Int. 2016, 2016, 1–13. [Google Scholar] [CrossRef] [Green Version]
  15. Ramirez, A.I.; de Hoz, R.; Salobrar-Garcia, E.; Salazar, J.J.; Rojas, B.; Ajoy, D.; López-Cuenca, I.; Rojas, P.; Triviño, A.; Ramírez, J.M. The Role of Microglia in Retinal Neurodegeneration: Alzheimer’s Disease, Parkinson, and Glaucoma. Front. Aging Neurosci. 2017, 9, 214. [Google Scholar] [CrossRef] [PubMed] [Green Version]
  16. Streit, W.J.; Braak, H.; Xue, Q.-S.; Bechmann, I. Dystrophic (Senescent) Rather than Activated Microglial Cells Are Associated with Tau Pathology and Likely Precede Neurodegeneration in Alzheimer’s Disease. Acta Neuropathol. 2009, 118, 475–485. [Google Scholar] [CrossRef] [Green Version]
  17. Xue, Q.-S.; Streit, W.J. Microglial Pathology in Down Syndrome. Acta Neuropathol. 2011, 122, 455–466. [Google Scholar] [CrossRef]
  18. Simmons, D.A.; Casale, M.; Alcon, B.; Pham, N.; Narayan, N.; Lynch, G. Ferritin Accumulation in Dystrophic Microglia Is an Early Event in the Development of Huntington’s Disease. Glia 2007, 55, 1074–1084. [Google Scholar] [CrossRef]
  19. Streit, W.J.; Xue, Q.S. Microglia in Dementia with Lewy Bodies. Brain Behav. Immun. 2016, 55, 191–201. [Google Scholar] [CrossRef]
  20. Hoare, M.; Narita, M. Transmitting Senescence to the Cell Neighbourhood. Nat. Cell Biol. 2013, 15, 887–889. [Google Scholar] [CrossRef]
  21. Li, J.-W.; Zong, Y.; Cao, X.-P.; Tan, L.; Tan, L. Microglial Priming in Alzheimer’s Disease. Ann. Transl. Med. 2018, 6, 176. [Google Scholar] [CrossRef] [PubMed]
  22. Perry, V.H.; Holmes, C. Microglial Priming in Neurodegenerative Disease. Nat. Rev. Neurol. 2014, 10, 217–224. [Google Scholar] [CrossRef]
  23. Niraula, A.; Sheridan, J.F.; Godbout, J.P. Microglia Priming with Aging and Stress. Neuropsychopharmacology 2016, 42, 318–333. [Google Scholar] [CrossRef] [PubMed] [Green Version]
  24. Ramírez, A.I.; Fernández-Albarral, J.A.; de Hoz, R.; López-Cuenca, I.; Salobrar-García, E.; Rojas, P.; Valiente-Soriano, F.J.; Avilés-Trigueros, M.; Villegas-Pérez, M.P.; Vidal-Sanz, M.; et al. Microglial Changes in the Early Aging Stage in a Healthy Retina and an Experimental Glaucoma Model. Prog. Brain Res. 2020, 256, 125–149. [Google Scholar] [CrossRef] [PubMed]
  25. Conde, J.R.; Streit, W.J. Microglia in the Aging Brain. J. Neuropathol. Exp. Neurol. 2006, 65, 199–203. [Google Scholar] [PubMed] [Green Version]
  26. Norden, D.M.; Godbout, J.P. Review: Microglia of the Aged Brain: Primed to Be Activated and Resistant to Regulation. Neuropathol. Appl. Neurobiol. 2013, 39, 19–34. [Google Scholar] [CrossRef]
  27. Subhramanyam, C.S.; Wang, C.; Hu, Q.; Dheen, S.T. Microglia-Mediated Neuroinflammation in Neurodegenerative Diseases. Semin. Cell Dev. Biol. 2019, 94, 112–120. [Google Scholar] [CrossRef] [PubMed]
  28. Rojas, P.; Ramírez, A.I.; Cadena, M.; Fernández-Albarral, J.A.; Salobrar-García, E.; López-Cuenca, I.; Santos-García, I.; de Lago, E.; Urcelay-Segura, J.L.; Ramírez, J.M.; et al. Retinal Ganglion Cell Loss and Microglial Activation in a SOD1G93A Mouse Model of Amyotrophic Lateral Sclerosis. Int. J. Mol. Sci. 2021, 22, 1663. [Google Scholar] [CrossRef]
  29. Ramírez, A.I.; Rojas, B.; de Hoz, R.; Salazar, J.J.; Gallego, B.I.; Triviño, A.; Ramírez, J.M. Microglia, Inflammation, and Glaucoma. In Glaucoma; SM Group Open Access eBooks: Dover, DE, USA, 2015; pp. 1–16. [Google Scholar]
  30. Fernández-Albarral, J.A.; Salazar, J.J.; de Hoz, R.; Marco, E.M.; Martín-Sánchez, B.; Flores-Salguero, E.; Salobrar-García, E.; López-Cuenca, I.; Barrios-Sabador, V.; Avilés-Trigueros, M.; et al. Retinal Molecular Changes Are Associated with Neuroinflammation and Loss of RGCs in an Experimental Model of Glaucoma. Int. J. Mol. Sci. 2021, 22, 2066. [Google Scholar] [CrossRef]
  31. Pekny, M.; Pekna, M.; Messing, A.; Steinhäuser, C.; Lee, J.M.; Parpura, V.; Hol, E.M.; Sofroniew, M.V.; Verkhratsky, A. Astrocytes: A Central Element in Neurological Diseases. Acta Neuropathol. 2016, 131, 323–345. [Google Scholar] [CrossRef]
  32. Lewis, G.P.; Fisher, S.K. Up-Regulation of Glial Fibrillary Acidic Protein in Response to Retinal Injury: Its Potential Role in Glial Remodeling and a Comparison to Vimentin Expression. Int. Rev. Cytol. 2003, 230, 263–290. [Google Scholar] [CrossRef] [PubMed]
  33. Edwards, M.M.; Rodríguez, J.J.; Gutierrez-Lanza, R.; Yates, J.; Verkhratsky, A.; Lutty, G.A. Retinal Macroglia Changes in a Triple Transgenic Mouse Model of Alzheimer’s Disease. Exp. Eye Res. 2014, 127, 252–260. [Google Scholar] [CrossRef] [PubMed] [Green Version]
  34. Kumar, S.; Ho, G.; Zhang, Y.; Zhuo, L. In Vivo Imaging of Retinal Gliosis: A Platform for Diagnosis of PD and Screening of Anti-PD Compounds. In Proceedings of the 2010 Annual International Conference of the IEEE Engineering in Medicine and Biology, Buenos Aires, Argentina, 31 August–4 September 2010; pp. 3049–3052. [Google Scholar] [CrossRef]
  35. Liddelow, S.; Guttenplan, K.; Clarke, L.E.; Bennett, F.; Bohlen, C.; Schirmer, L.; Bennett, M.L.; Münch, A.E.; Chung, W.-S.; Peterson, T.; et al. Neurotoxic Reactive Astrocytes Are Induced by Activated Microglia. Nature 2017, 541, 481–487. [Google Scholar] [CrossRef] [Green Version]
  36. Sofroniew, M. v Astrocyte Reactivity: Subtypes, States, and Functions in CNS Innate Immunity. Trends Immunol. 2020, 41, 758–770. [Google Scholar] [CrossRef]
  37. London, A.; Benhar, I.; Schwartz, M. The Retina as a Window to the Brain-From Eye Research to CNS Disorders. Nat. Rev. Neurol. 2013, 9, 44–53. [Google Scholar] [CrossRef] [PubMed]
  38. Salobrar-Garcia, E.; Hoyas, I.; Leal, M.; Hoz, R.d.; Rojas, B.; Ramirez, A.I.; Salazar, J.J.; Yubero, R.; Gil, P.; Triviño, A.; et al. Analysis of Retinal Peripapillary Segmentation in Early Alzheimer’s Disease Patients. Biomed. Res. Int. 2015, 2015, 636548. [Google Scholar] [CrossRef] [PubMed] [Green Version]
  39. Rojas, P.; Ramírez, A.I.; Fernández-Albarral, J.A.; López-Cuenca, I.; Salobrar-García, E.; Cadena, M.; Elvira-Hurtado, L.; Salazar, J.J.; de Hoz, R.; Ramírez, J.M. Amyotrophic Lateral Sclerosis: A Neurodegenerative Motor Neuron Disease With Ocular Involvement. Front. Neurosci. 2020, 14, 566858. [Google Scholar] [CrossRef] [PubMed]
  40. Garcia-Martin, E.S.; Rojas, B.; Ramirez, A.I.; de Hoz, R.; Salazar, J.J.; Yubero, R.; Gil, P.; Triviño, A.; Ramirez, J.M. Macular Thickness as a Potential Biomarker of Mild Alzheimer’s Disease. Ophthalmology 2014, 121, 1149–1151.e3. [Google Scholar] [CrossRef] [Green Version]
  41. López-Cuenca, I.; Salobrar-García, E.; Elvira-Hurtado, L.; Fernández-Albarral, J.A.; Sánchez-Puebla, L.; Salazar, J.J.; Ramírez, J.M.; Ramírez, A.I.; de Hoz, R. The Value of OCT and OCTA as Potential Biomarkers for Preclinical Alzheimer’s Disease: A Review Study. Life 2021, 11, 712. [Google Scholar] [CrossRef]
  42. Gupta, V.B.; Chitranshi, N.; den Haan, J.; Mirzaei, M.; You, Y.; Lim, J.K.H.; Basavarajappa, D.; Godinez, A.; Angelantonio, S.d.; Sachdev, P.; et al. Retinal Changes in Alzheimer’s Disease—Integrated Prospects of Imaging, Functional and Molecular Advances. Prog. Retin. Eye Res. 2021, 82, 100899. [Google Scholar] [CrossRef]
  43. Gupta, V.K.; Chitranshi, N.; Gupta, B.; Golzan, M.; Dheer, Y.; Wall, R.v.; Georgevsky, D.; King, A.E.; Vickers, J.C.; Chung, R.; et al. Amyloid Accumulation and Inner Retinal Degenerative Changes in Alzheimer’s Disease Transgenic Mouse. Neurosci. Lett. 2016, 623, 52–56. [Google Scholar] [CrossRef] [PubMed]
  44. Chiasseu, M.; Alarcon-Martinez, L.; Belforte, N.; Quintero, H.; Dotigny, F.; Destroismaisons, L.; vande Velde, C.; Panayi, F.; Louis, C.; di Polo, A. Tau Accumulation in the Retina Promotes Early Neuronal Dysfunction and Precedes Brain Pathology in a Mouse Model of Alzheimer’s Disease. Mol. Neurodegener. 2017, 12, 1–20. [Google Scholar] [CrossRef] [PubMed] [Green Version]
  45. Urrutia, P.J.; Bórquez, D.A.; Núñez, M.T. Inflaming the Brain with Iron. Antioxidants 2021, 10, 61. [Google Scholar] [CrossRef]
  46. Matsui, T.; Masaki, U.; Masao, I.S. Heme Oxygenase Reveals Its Strategy for Catalyzing Three Successive Oxygenation Reactions. Acc. Chem. Res. 2010, 43, 240–247. [Google Scholar] [CrossRef] [PubMed]
  47. Drummond, G.S.; Baum, J.; Greenberg, M.; Lewis, D.; Abraham, N.G. HO-1 Overexpression and Underexpression: Clinical Implications. Arch. Biochem. Biophys. 2019, 673, 108073. [Google Scholar] [CrossRef] [PubMed]
  48. Zeynalov, E.; Shah, Z.A.; chi Li, R.; Doré, S. Heme Oxygenase 1 Is Associated with Ischemic Preconditioning-Induced Protection against Brain Ischemia. Neurobiol. Dis. 2009, 35, 264–269. [Google Scholar] [CrossRef] [PubMed] [Green Version]
  49. Bhardwaj, M.; Deshmukh, R.; Kaundal, M.; Reddy, B.V.K. Pharmacological Induction of Hemeoxygenase-1 Activity Attenuates Intracerebroventricular Streptozotocin Induced Neurocognitive Deficit and Oxidative Stress in Rats. Eur. J. Pharmacol. 2016, 772, 43–50. [Google Scholar] [CrossRef]
  50. Li, L.; Du, G.P.; Wang, D.J.; Zhou, J.; Jiang, G.; Jiang, H. Overexpression of Heme Oxygenase-1 in Mesenchymal Stem Cells Augments Their Protection on Retinal Cells in Vitro and Attenuates Retinal Ischemia/Reperfusion Injury in Vivo against Oxidative Stress. Stem. Cells Int. 2017, 2017, 4985323. [Google Scholar] [CrossRef] [Green Version]
  51. Schipper, H.M.; Song, W.; Tavitian, A.; Cressatti, M. The Sinister Face of Heme Oxygenase-1 in Brain Aging and Disease. Prog. Neurobiol. 2019, 172, 40–70. [Google Scholar] [CrossRef]
  52. Nitti, M.; Piras, S.; Brondolo, L.; Marinari, U.M.; Pronzato, M.A.; Furfaro, A.L. Heme Oxygenase 1 in the Nervous System: Does It Favor Neuronal Cell Survival or Induce Neurodegeneration? Int. J. Mol. Sci. 2018, 19, 2260. [Google Scholar] [CrossRef] [Green Version]
  53. Kutty, R.K.; Kutty, G.; Wiggert, B.; Chader, G.J.; Darrow, R.M.; Organisciak, D.T. Induction of Heme Oxygenase 1 in the Retina by Intense Visible Light: Suppression by the Antioxidant Dimethylthiourea. Proc. Natl. Acad. Sci. USA 1995, 92, 1177–1181. [Google Scholar] [CrossRef] [PubMed] [Green Version]
  54. Fernández-Mendívil, C.; Arreola, M.A.; Hohsfield, L.A.; Green, K.N.; Lopez, M.G. Aging and Progression of Beta-Amyloid Pathology in Alzheimer’s Disease Correlates with Microglial Heme-Oxygenase-1 Overexpression. Antioxidants 2020, 9, 644. [Google Scholar] [CrossRef] [PubMed]
  55. Fernández-Mendívil, C.; Luengo, E.; Trigo-Alonso, P.; García-Magro, N.; Negredo, P.; López, M.G. Protective Role of Microglial HO-1 Blockade in Aging: Implication of Iron Metabolism. Redox Biol. 2021, 38, 101789. [Google Scholar] [CrossRef] [PubMed]
  56. Vo, T.K.D.; Godard, P.; de Saint-Hubert, M.; Morrhaye, G.; Swine, C.; Geenen, V.; Martens, H.J.; Debacq-Chainiaux, F.; Toussaint, O. Transcriptomic Biomarkers of the Response of Hospitalized Geriatric Patients with Infectious Diseases. Immun. Ageing 2010, 7, 9. [Google Scholar] [CrossRef] [Green Version]
  57. Wang, D.; Yang, H.; Yahui, P.; Tang, L.; Jin, J.; He, R.; Li, Y.; Zhang, S.; Li, L.; Zhou, Y.; et al. Overexpression of Heme Oxygenase 1 Causes Cognitive Decline and Affects Pathways for Tauopathy in Mice. J. Alzheimer’s Dis. 2015, 43, 519–534. [Google Scholar] [CrossRef]
  58. Gozzelino, R.; Arosio, P. Iron Homeostasis in Health and Disease. Int. J. Mol. Sci. 2016, 17, 130. [Google Scholar] [CrossRef] [Green Version]
  59. Dutta, S.; Sengupta, P. Men and Mice: Relating Their Ages. Life Sci. 2016, 152, 244–248. [Google Scholar] [CrossRef]
  60. Damani, M.R.; Zhao, L.; Fontainhas, A.M.; Amaral, J.; Fariss, R.N.; Wong, W.T. Age-Related Alterations in the Dynamic Behavior of Microglia. Aging Cell 2011, 10, 263–276. [Google Scholar] [CrossRef] [Green Version]
  61. Lucin, K.M.; Wyss-Coray, T. Immune Activation in Brain Aging and Neurodegeneration: Too Much or Too Little? Neuron 2009, 64, 110–122. [Google Scholar] [CrossRef]
  62. Sierra, A.; Gottfried-Blackmore, A.C.; Mcewen, B.S.; Bulloch, K. Microglia Derived from Aging Mice Exhibit an Altered Inflammatory Profile. Glia 2007, 55, 412–424. [Google Scholar] [CrossRef]
  63. Frost, B.; Götz, J.; Feany, M.B. Connecting the Dots between Tau Dysfunction and Neurodegeneration. Trends Cell Biol. 2015, 25, 46–53. [Google Scholar] [CrossRef] [PubMed] [Green Version]
  64. Jin, M.; Shiwaku, H.; Tanaka, H.; Obita, T.; Ohuchi, S.; Yoshioka, Y.; Jin, X.; Kondo, K.; Fujita, K.; Homma, H.; et al. Tau Activates Microglia via the PQBP1-CGAS-STING Pathway to Promote Brain Inflammation. Nat. Commun. 2021, 12, 1–22. [Google Scholar] [CrossRef] [PubMed]
  65. Yoshiyama, Y.; Higuchi, M.; Zhang, B.; Huang, S.M.; Iwata, N.; Saido, T.C.C.; Maeda, J.; Suhara, T.; Trojanowski, J.Q.; Lee, V.M.Y. Synapse Loss and Microglial Activation Precede Tangles in a P301S Tauopathy Mouse Model. Neuron 2007, 53, 337–351. [Google Scholar] [CrossRef] [PubMed] [Green Version]
  66. Metcalfe, M.J.; Figueiredo-Pereira, M.E. Relationship Between Tau Pathology and Neuroinflammation in Alzheimer’s Disease. Mt. Sinai. J. Med. 2010, 77, 50–58. [Google Scholar] [CrossRef] [PubMed]
  67. Nilson, A.N.; English, K.C.; Gerson, J.E.; Whittle, T.B.; Crain, C.N.; Xue, J.; Sengupta, U.; Castillo-Carranza, D.L.; Zhang, W.; Gupta, P.; et al. Tau Oligomers Associate with Inflammation in the Brain and Retina of Tauopathy Mice and in Neurodegenerative Diseases. J. Alzheimers Dis. 2017, 55, 1083–1099. [Google Scholar] [CrossRef] [Green Version]
  68. Ho, C.-Y.; Troncoso, J.C.; Knox, D.; Stark, W.; Eberhart, C.G.; Eberhart, C. Beta-Amyloid, Phospho-Tau and Alpha-Synuclein Deposits Similar to Those in the Brain Are Not Identified in the Eyes of Alzheimer’s and Parkinson’s Disease Patients. Brain Pathol. 2014, 24, 25–32. [Google Scholar] [CrossRef] [Green Version]
  69. Williams, E.A.; McGuone, D.; Frosch, M.P.; Hyman, B.T.; Laver, N.; Stemmer-Rachamimov, A. Absence of Alzheimer Disease Neuropathologic Changes in Eyes of Subjects With Alzheimer Disease. J. Neuropathol. Exp. Neurol. 2017, 76, 376–383. [Google Scholar] [CrossRef] [Green Version]
  70. Doorn, K.J.; Moors, T.; Drukarch, B.; van de Berg, W.D.J.; Lucassen, P.J.; van Dam, A.M. Microglial Phenotypes and Toll-like Receptor 2 in the Substantia Nigra and Hippocampus of Incidental Lewy Body Disease Cases and Parkinson’s Disease Patients. Acta Neuropathol. Commun. 2014, 2, 1–17. [Google Scholar] [CrossRef] [Green Version]
  71. Shahidehpour, R.K.; Higdon, R.E.; Crawford, N.G.; Neltner, J.H.; Lghodaro, E.T.; Patel, E.; Price, D.; Nelson, P.T.; Bachstetter, A.D. Dystrophic Microglia Are Associated with Neurodegenerative Disease and Not Healthy Aging in the Human Brain. Neurobiol. Aging 2021, 99, 19–27. [Google Scholar] [CrossRef]
  72. Rodrigues-Neves, A.C.; Carecho, R.; Correia, S.C.; Carvalho, C.; Campos, E.J.; Baptista, F.I.; Moreira, P.I.; Ambrósio, A.F. Retina and Brain Display Early and Differential Molecular and Cellular Changes in the 3xTg-AD Mouse Model of Alzheimer’s Disease. Mol. Neurobiol. 2021, 58, 3043–3060. [Google Scholar] [CrossRef]
  73. Grimaldi, A.; Brighi, C.; Peruzzi, G.; Ragozzino, D.; Bonanni, V.; Limatola, C.; Ruocco, G.; Angelantonio, S. di Inflammation, Neurodegeneration and Protein Aggregation in the Retina as Ocular Biomarkers for Alzheimer’s Disease in the 3xTg-AD Mouse Model. Cell Death Dis. 2018, 9, 1–10. [Google Scholar] [CrossRef] [PubMed] [Green Version]
  74. Grimaldi, A.; Pediconi, N.; Oieni, F.; Pizzarelli, R.; Rosito, M.; Giubettini, M.; Santini, T.; Limatola, C.; Ruocco, G.; Ragozzino, D.; et al. Neuroinflammatory Processes, A1 Astrocyte Activation and Protein Aggregation in the Retina of Alzheimer’s Disease Patients, Possible Biomarkers for Early Diagnosis. Front. Neurosci. 2019, 13, 925. [Google Scholar] [CrossRef] [PubMed] [Green Version]
  75. Vanguilder, H.D.; Bixler, G.v.; Brucklacher, R.M.; Farley, J.A.; Yan, H.; Warrington, J.P.; Sonntag, W.E.; Freeman, W.M. Concurrent Hippocampal Induction of MHC II Pathway Components and Glial Activation with Advanced Aging Is Not Correlated with Cognitive Impairment. J. Neuroinflammation 2011, 8, 138. [Google Scholar] [CrossRef] [PubMed] [Green Version]
  76. Bernal, G.M.; Peterson, D.A. Phenotypic and Gene Expression Modification with Normal Brain Aging in GFAP-Positive Astrocytes and Neural Stem Cells. Aging Cell 2011, 10, 466–482. [Google Scholar] [CrossRef] [PubMed] [Green Version]
  77. Song, W.; Cressatti, M.; Zukor, H.; Liberman, A.; Galindez, C.; Schipper, H.M. Parkinsonian Features in Aging GFAP.HMOX1 Transgenic Mice Overexpressing Human HO-1 in the Astroglial Compartment. Neurobiol. Aging 2017, 58, 163–179. [Google Scholar] [CrossRef] [PubMed]
Figure 1. TAUY9 labeling in the hippocampus (arrow) (A), absence of TAUY9 (B), and AT8 (C) labelling in retinal tissue. (B,C) correspond to the inner complex retinal layers (ICL) of animals from the TAU group.
Antioxidants 11 02151 g001
Figure 2. Retinal wholemount. Double immunolabeling with anti-Iba-1 (red) and anti-CD68 (green) in OS layer in the different study groups: WT (AC), HMO-KO (DF), TAU (GI), HMO-KO+TAU (JL); 20× magnification. Microglia with CD68+ labelling (arrows). Dystrophic microglia (arrowheads). The images correspond to the retinal periphery. Number of retinas used in the experiment: WT n = 6, HMO-KO n = 6, TAU n = 6, and HMO-KO+TAU n = 6.
Antioxidants 11 02151 g002
Figure 3. Retinal wholemount. Double immunostaining with anti-Iba-1 (red) and anti-CD68 (green) in OPL in the different study groups: WT (AC), HMO-KO (DF), TAU (GI), HMO-KO+TAU (JL); 20× magnification. Arrows indicate microglial cells with CD68+ labelling. Number of retinas used in the experiment: WT n = 6, HMO-KO n = 6, TAU n = 6, and HMO-KO+TAU n = 6.
Antioxidants 11 02151 g003
Figure 4. Retinal wholemount. Double immunostaining with anti-Iba-1 (red) and anti-CD68 (green) in ICL in the different study groups: WT (AC), HMO-KO (DF), TAU (GI), HMO-KO+TAU (JL); 20× magnification. Arrows indicate microglial cells with CD68+ labelling. Number of retinas used in the experiment: WT n = 6, HMO-KO n = 6, TAU n = 6, and HMO-KO+TAU n = 6.
Antioxidants 11 02151 g004
Figure 5. Microglial cell numbers. (A) Number of Iba-1+ microglial cells per retinal area of 0.1502 mm2 in the different retinal layers in each of the study groups; two-way ANOVA. (B) Number of dystrophic Iba-1+ cells in OS layer in the different study groups; one-way ANOVA. (C) Number of activated Iba-1+ cells in OS layer in the different study groups; one-way ANOVA. All data are expressed as mean value (±SD). * p < 0.05, ** p < 0.01, *** p < 0.001, **** p < 0.0001. Number of retinas used in the experiment: WT n = 6, HMO-KO n = 6, TAU n = 6, and HMO-KO+TAU n = 6.
Antioxidants 11 02151 g005
Figure 6. (A) Arbor area of Iba-1+ microglia in OPL and ICL in the different study groups. (B) Area of the Iba-1+ soma in OPL and ICL in the different study groups. Two-way ANOVA. Data expressed as mean value (±SD). * p < 0.05, ** p < 0.01, *** p < 0.001, **** p < 0.0001. Number of retinas used in the experiment: WT n = 6, HMO-KO n = 6, TAU n = 6, and HMO-KO+TAU n = 6.
Antioxidants 11 02151 g006
Figure 7. Number of Iba-1+/CD68+ microglial cells per retinal area of 0.1502 mm2 in the different retinal layers in each of the study groups, expressed as mean value (±DS). Two-way ANOVA; H: high phagocytic capacity; M: mean phagocytic capacity; * p < 0.05, ** p < 0.01, *** p < 0.001, **** p < 0.0001. Number of retinas used in the experiment: WT n = 6, HMO-KO n = 6, TAU n = 6, and HMO-KO+TAU n = 6.
Antioxidants 11 02151 g007
Figure 8. Number of Iba-1+/CD68+ dystrophic microglial cells per retinal area of 0.1502 mm2 in the OS layer in each of the study groups, expressed as mean value (± SD). One-way ANOVA; * p < 0.05. Number of retinas used in the experiment: WT n = 6, HMO-KO n = 6, TAU n = 6, and HMO-KO+TAU n = 6.
Antioxidants 11 02151 g008
Figure 9. Retinal wholemount. GFAP+ astrocytes in the different study groups: WT (A), HMO-KO (B), TAU (C), HMO-KO+TAU (D); 20× magnification. Arrows point to primary astrocyte processes; arrowheads point to secondary astrocyte processes. Asterisks (*) demarcate the course of blood vessels. Number of retinas used in the experiment: WT n = 6, HMO-KO n = 6, TAU n = 6, and HMO-KO+TAU n = 6.
Antioxidants 11 02151 g009
Figure 10. Retinal wholemount. GFAP+ astrocytes in the different study groups: WT (A), HMO-KO (B), TAU (C), HMO-KO+TAU (D); 63× magnification. Arrows indicate primary astrocyte processes; arrowheads indicate secondary astrocyte processes. Number of retinas used in the experiment: WT n = 6, HMO-KO n = 6, TAU n = 6, and HMO-KO+TAU n = 6.
Antioxidants 11 02151 g010
Figure 11. Retinal wholemount. Double immunohistochemical staining with GFAP (green) and C3 (red) in the different study groups: WT (AC), HMO-KO (DF), TAU (GI), HMO-KO+TAU (JL); 40× magnification. Arrows point to astrocytes; hollow arrowheads point to macrophages. Number of retinas used in the experiment: WT n = 6, HMO-KO n = 6, TAU n = 6, and HMO-KO+TAU n = 6.
Antioxidants 11 02151 g011
Figure 12. Retinal wholemount. Double immunohistochemical staining with anti-GFAP (green) and anti-C3 (red) in Müller cells in the different study groups: WT (AC), HMO-KO (DF), TAU (GI), HMO-KO+TAU (JL); 40× magnification. Arrows point to Müller cells. The image shows an edge of the retina, and therefore the entire thickness of the retina can be observed, allowing differentiation of the whole Müller cell as if it were a histological section. Number of retinas used in the experiment: WT n = 6, HMO-KO n = 6, TAU n = 6, and HMO-KO+TAU n = 6.
Antioxidants 11 02151 g012
Figure 13. (A) Area of retina occupied by GFAP (AROA) in the different study groups. (B) Area of retina occupied by C3 (AROC3) in the different study groups. Data are expressed as mean values (±SD). One-way ANOVA; * p < 0.05, **** p < 0.0001. Number of retinas used in the experiment: WT n = 6, HMO-KO n = 6, TAU n = 6, and HMO-KO+TAU n = 6.
Antioxidants 11 02151 g013
Table 1. Antibodies employed for the immunostaining analysis and their corresponding information.
AntibodyConcentrationHostReferenceCompany
Primary antibodiesIba-11:600Rabbit01919741Wako
AT81:200MouseMN1020Thermo Fisher
CD681:40RatMCA1957GABio Rad
TAUY91:400RabbitBML-TA3119-0100Enzo lifesciences
GFAP-GA51:150MouseMAB3402Millipore
C31:15RatHM1045Hycult Biotech
Secondary antibodiesAlexa Fluor® 405 Anti-Mouse 1:150Goat31553Invitrogen
Alexa Fluor® 405 Anti-Rabbit 1:100GoatA31556Invitrogen
Alexa Fluor® 488 Anti-Rat1:150DonkeyA21208Invitrogen
Alexa Fluor® 488 Anti-Mouse1:200GoatA11001Invitrogen
Alexa Fluor® 594 Anti-Rabbit1:800DonkeyA21207Invitrogen
Alexa Fluor® 594 Anti-Rat1:500Goat405422Biolegend
Abbreviations: ionized calcium binding adaptor molecule 1 polyclonal antibody (Iba-1); phospho-tau (Ser202, Thr205) monoclonal antibody (AT8); heavily glycosylated type I transmembrane glycoprotein antibody (CD68); Tau (human) polyclonal antibody (ATY9); glial fibrillary acidic protein monoclonal antibody (GFAP-GA5); complement component C3 monoclonal antibody (C3).
Publisher’s Note: MDPI stays neutral with regard to jurisdictional claims in published maps and institutional affiliations.

