
HO-1 Modulates Aerobic Glycolysis through LDH in Prostate Cancer Cells

 , , , , , , , , and
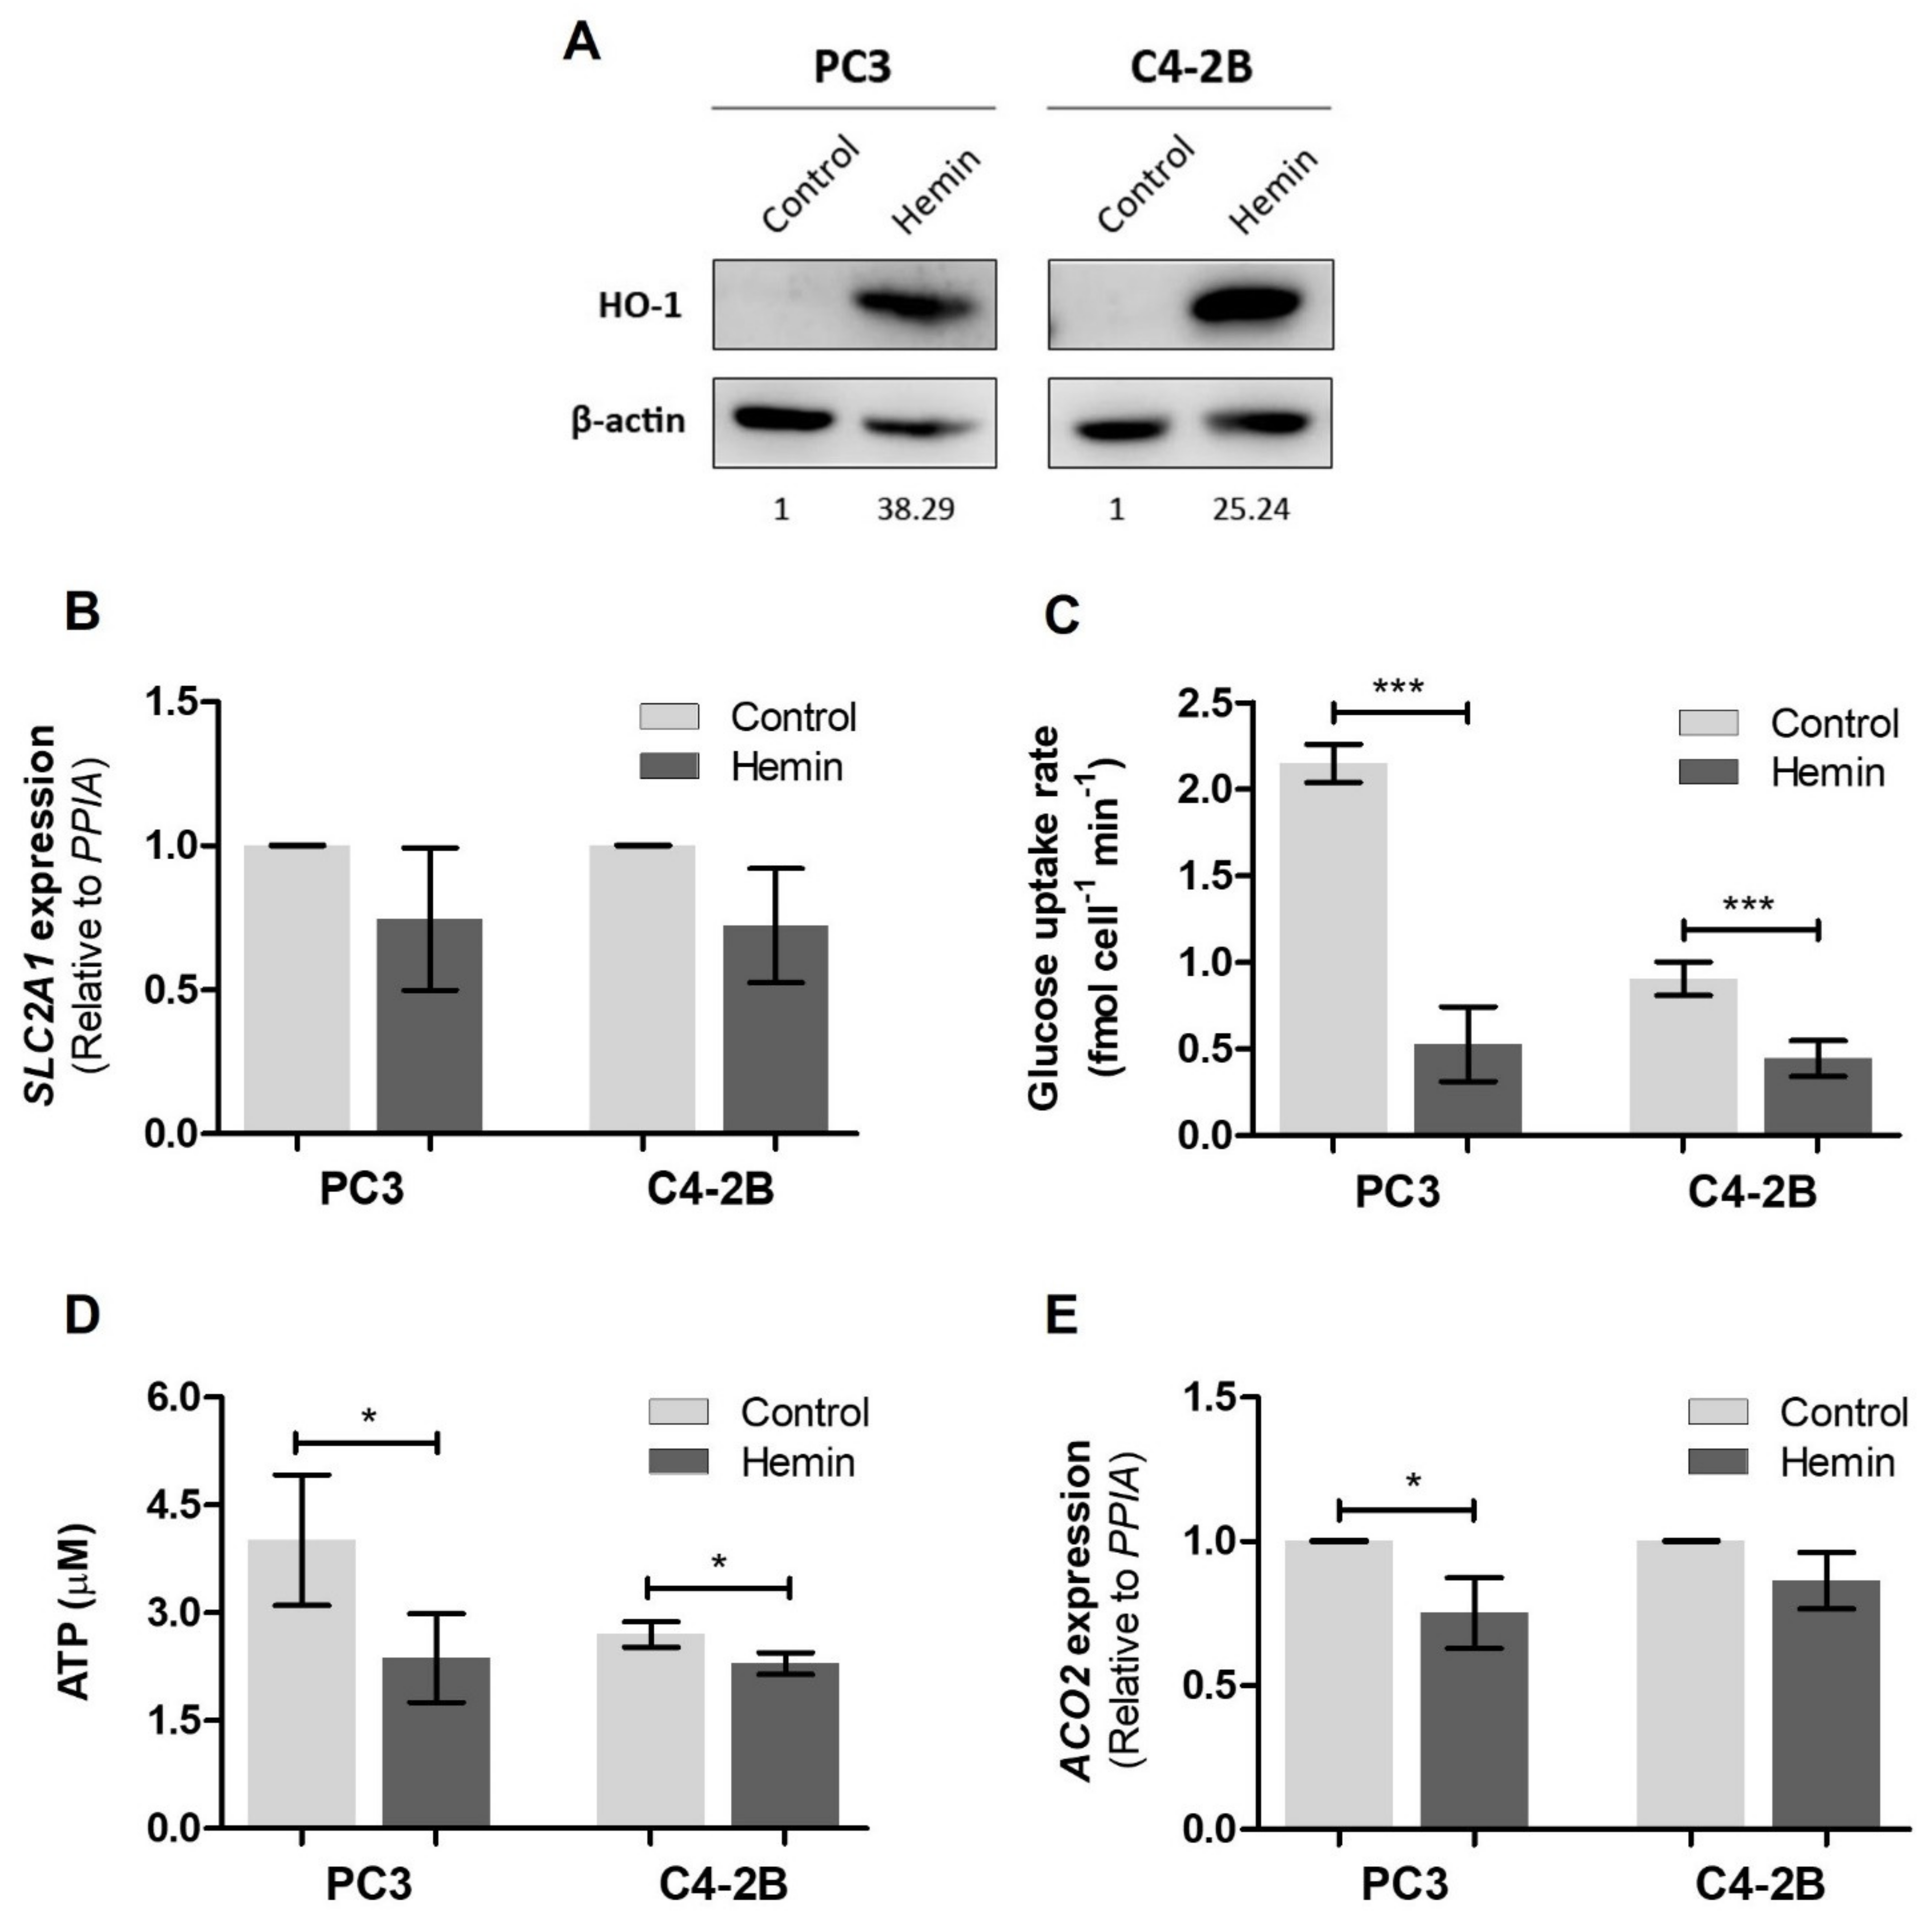
Abstract
:1. Introduction
2. Materials and Methods
2.1. Cell Culture and Treatments
2.2. Glucose Uptake
2.3. ATP Production
2.4. Oxygen Consumption Rate and Extracellular Acidification Rate
2.5. Lactate Production
2.6. Mitochondrial Membrane Potential
2.7. Total Mitochondrial Mass
2.8. RNA Isolation, cDNA Synthesis and RT-qPCR
2.9. Western Blot
2.10. NAD(P)+ and NAD(P)H Measurement
2.11. Enzymatic Activity of Lactate Dehydrogenase (LDH)
2.12. Statistical Analysis
2.13. Bioinformatics Analysis
3. Results
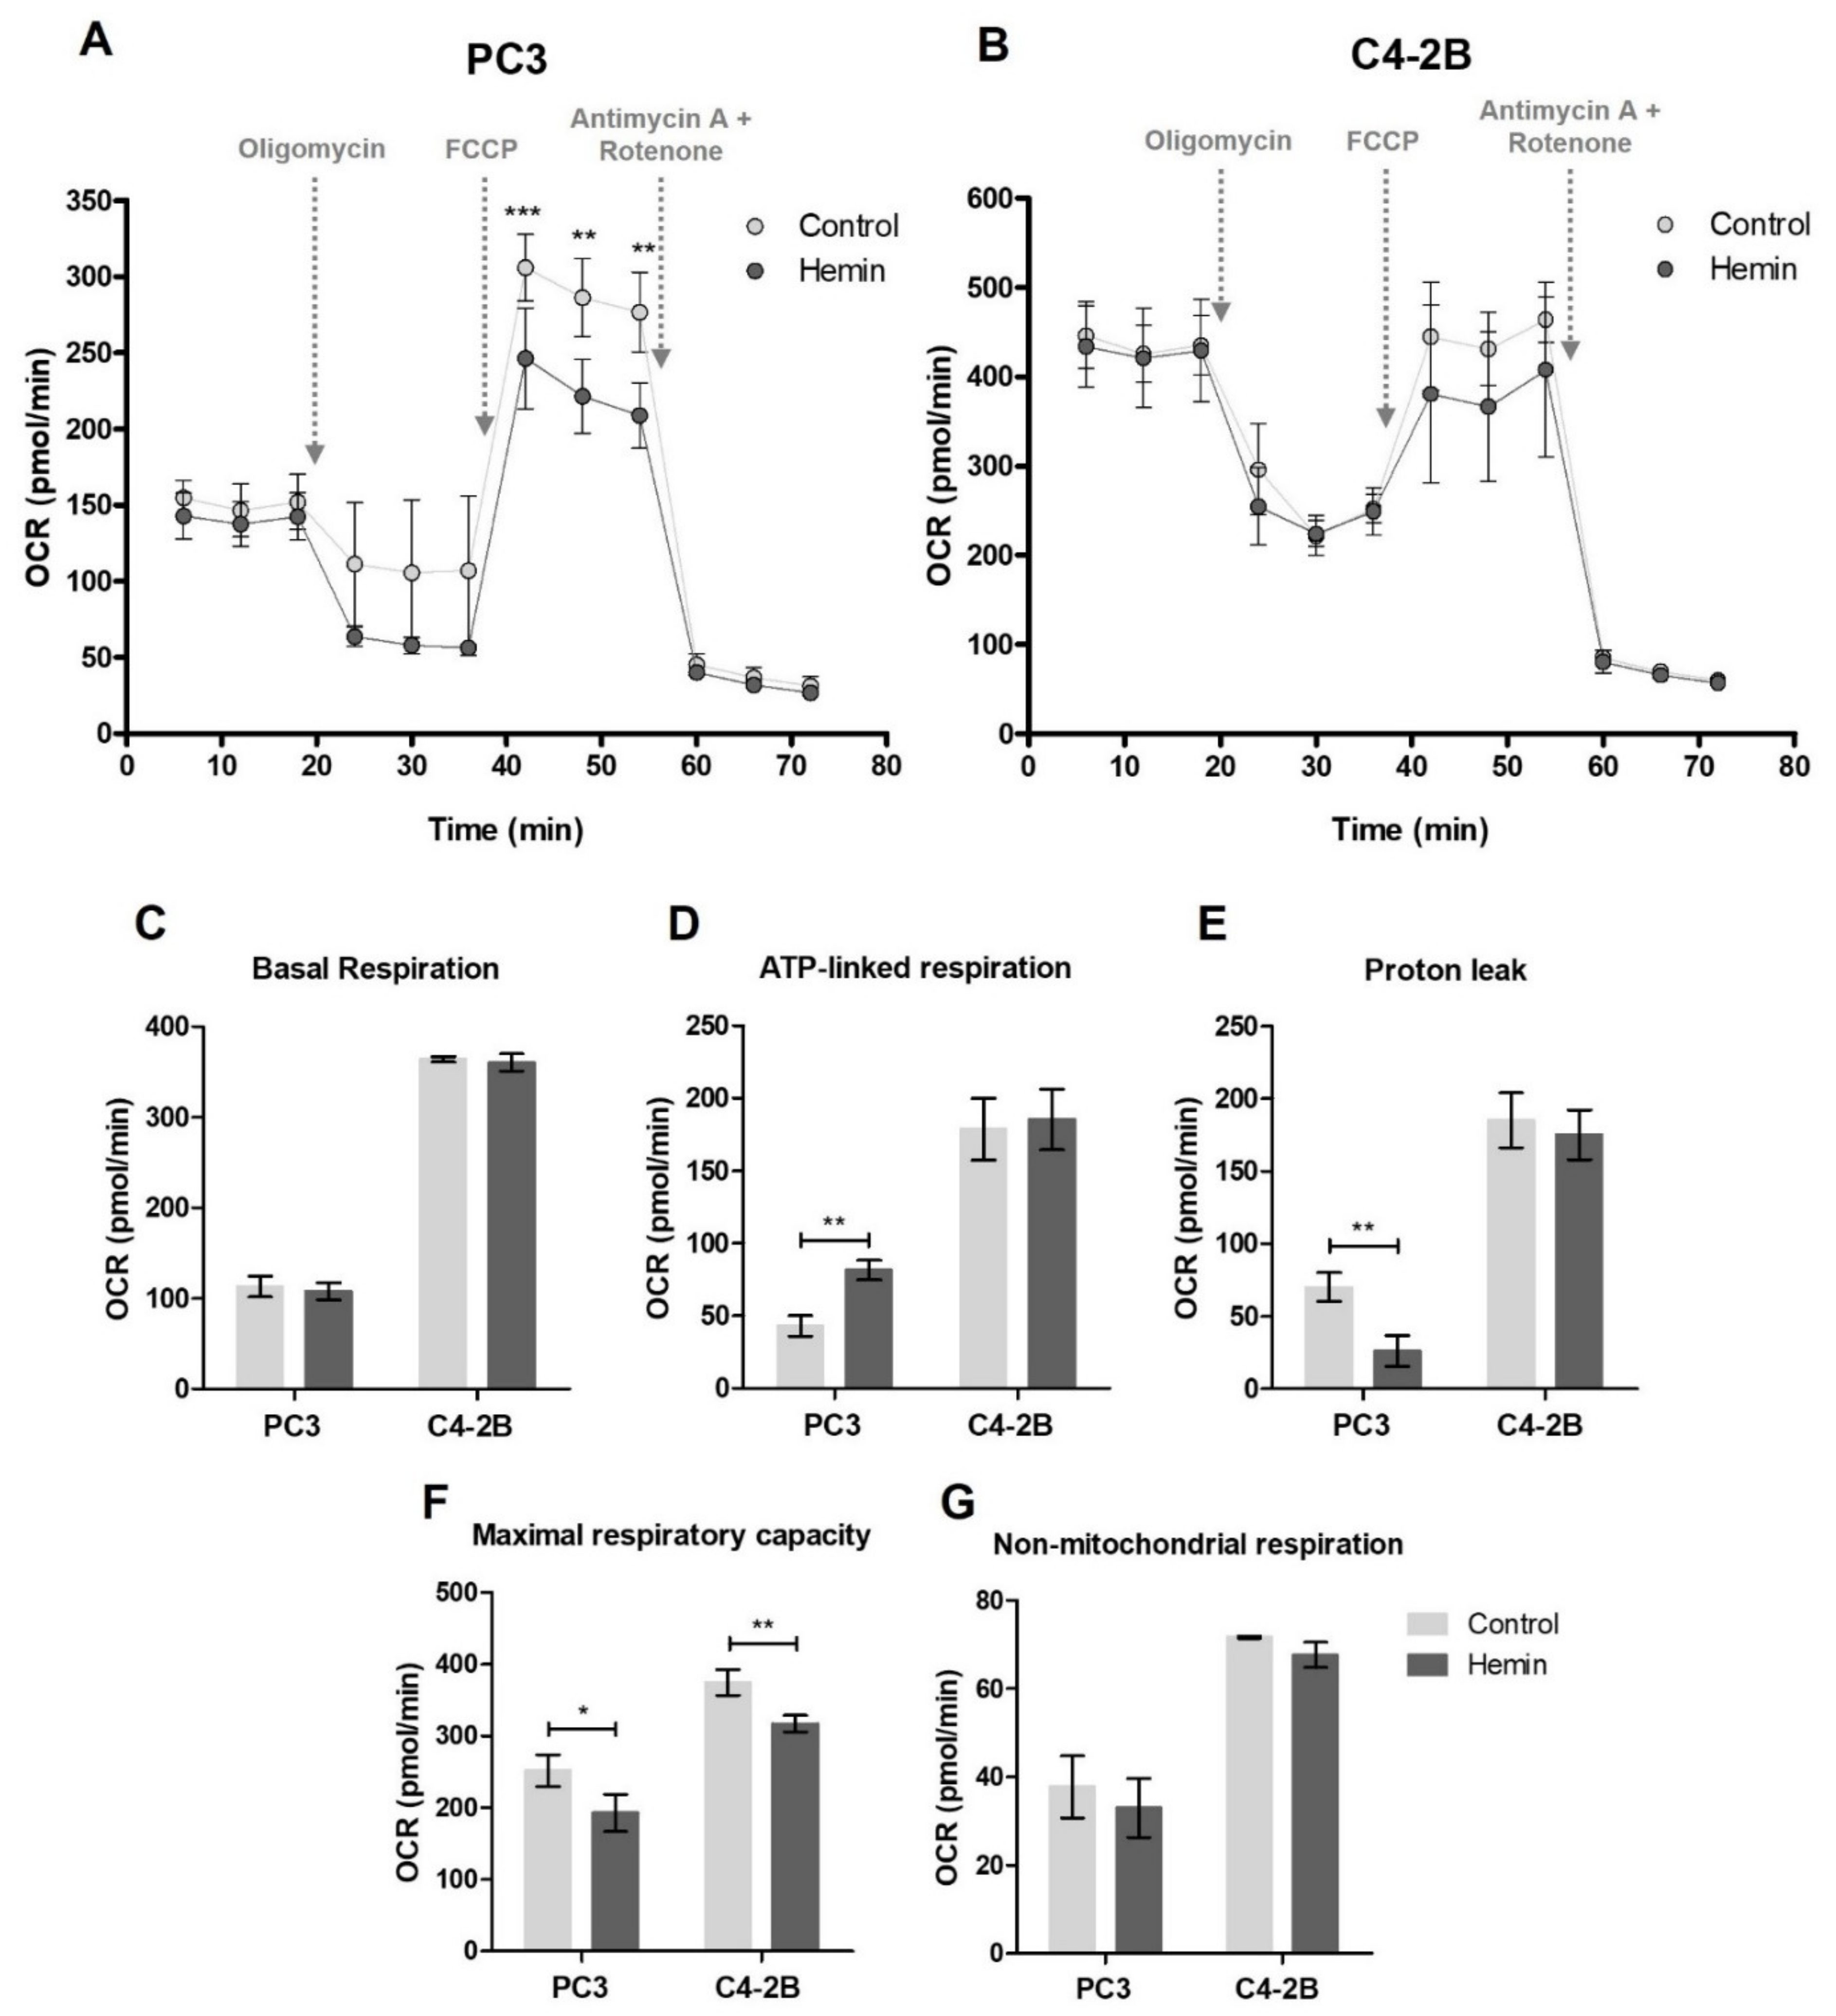
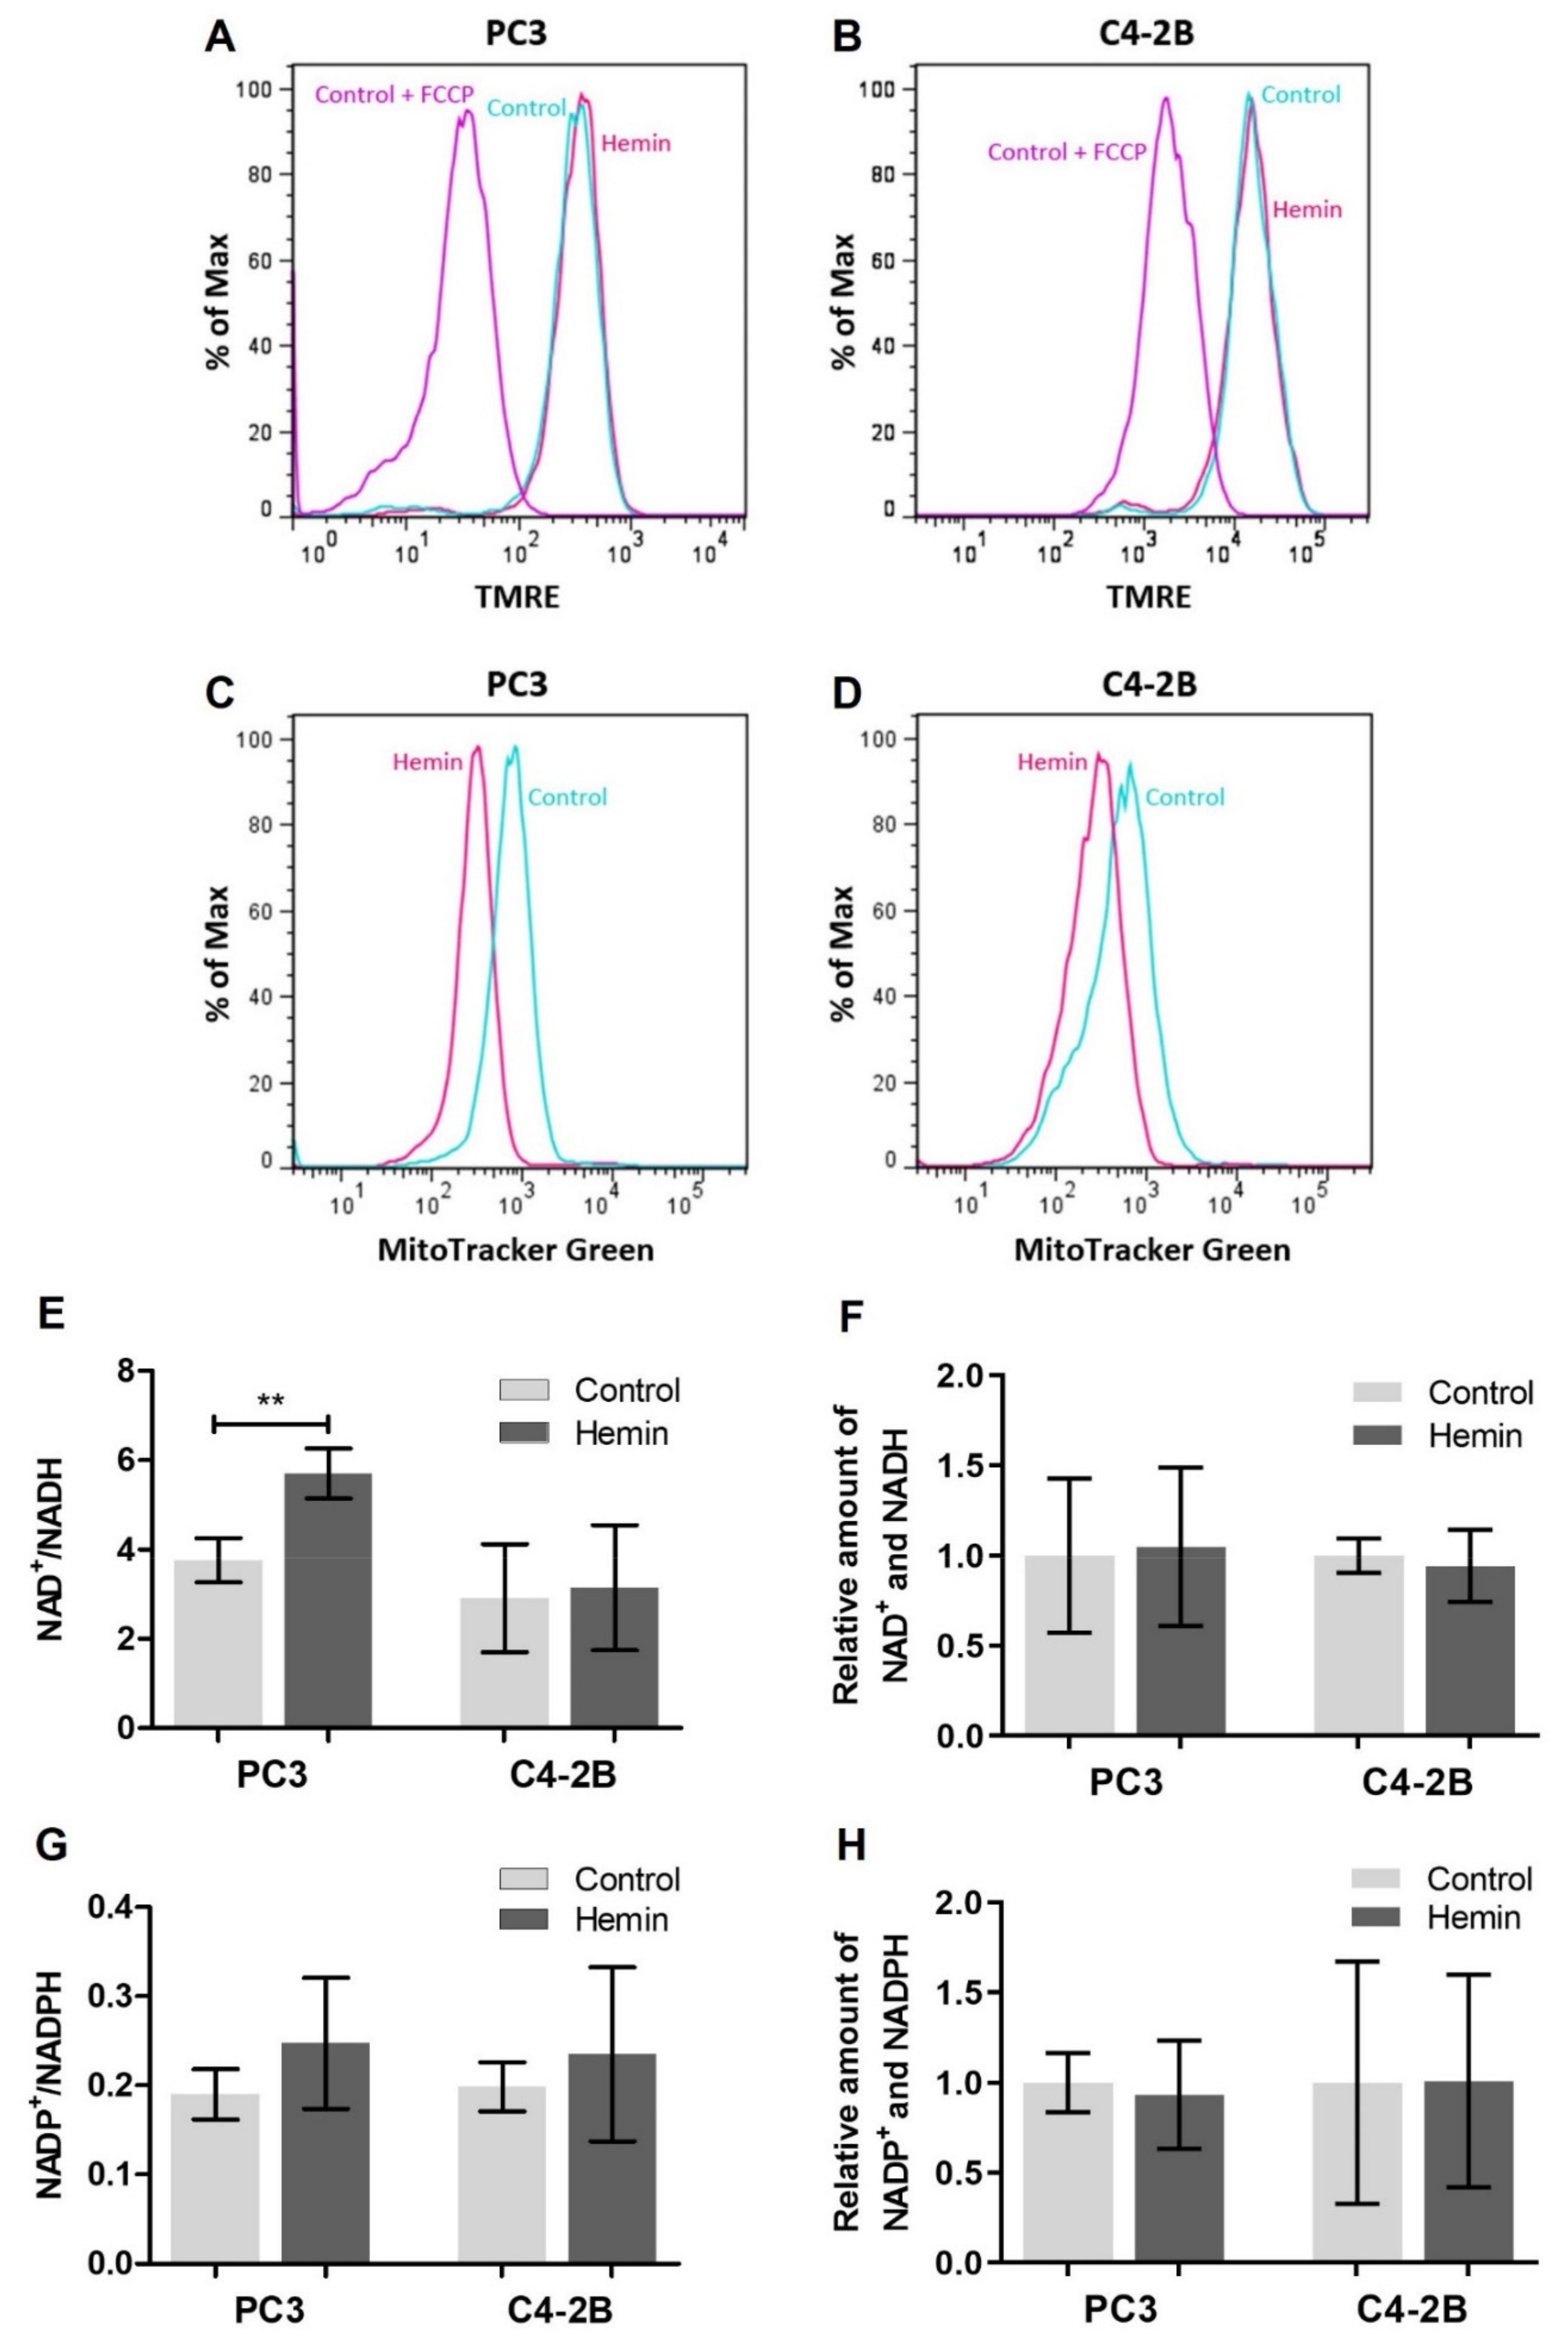
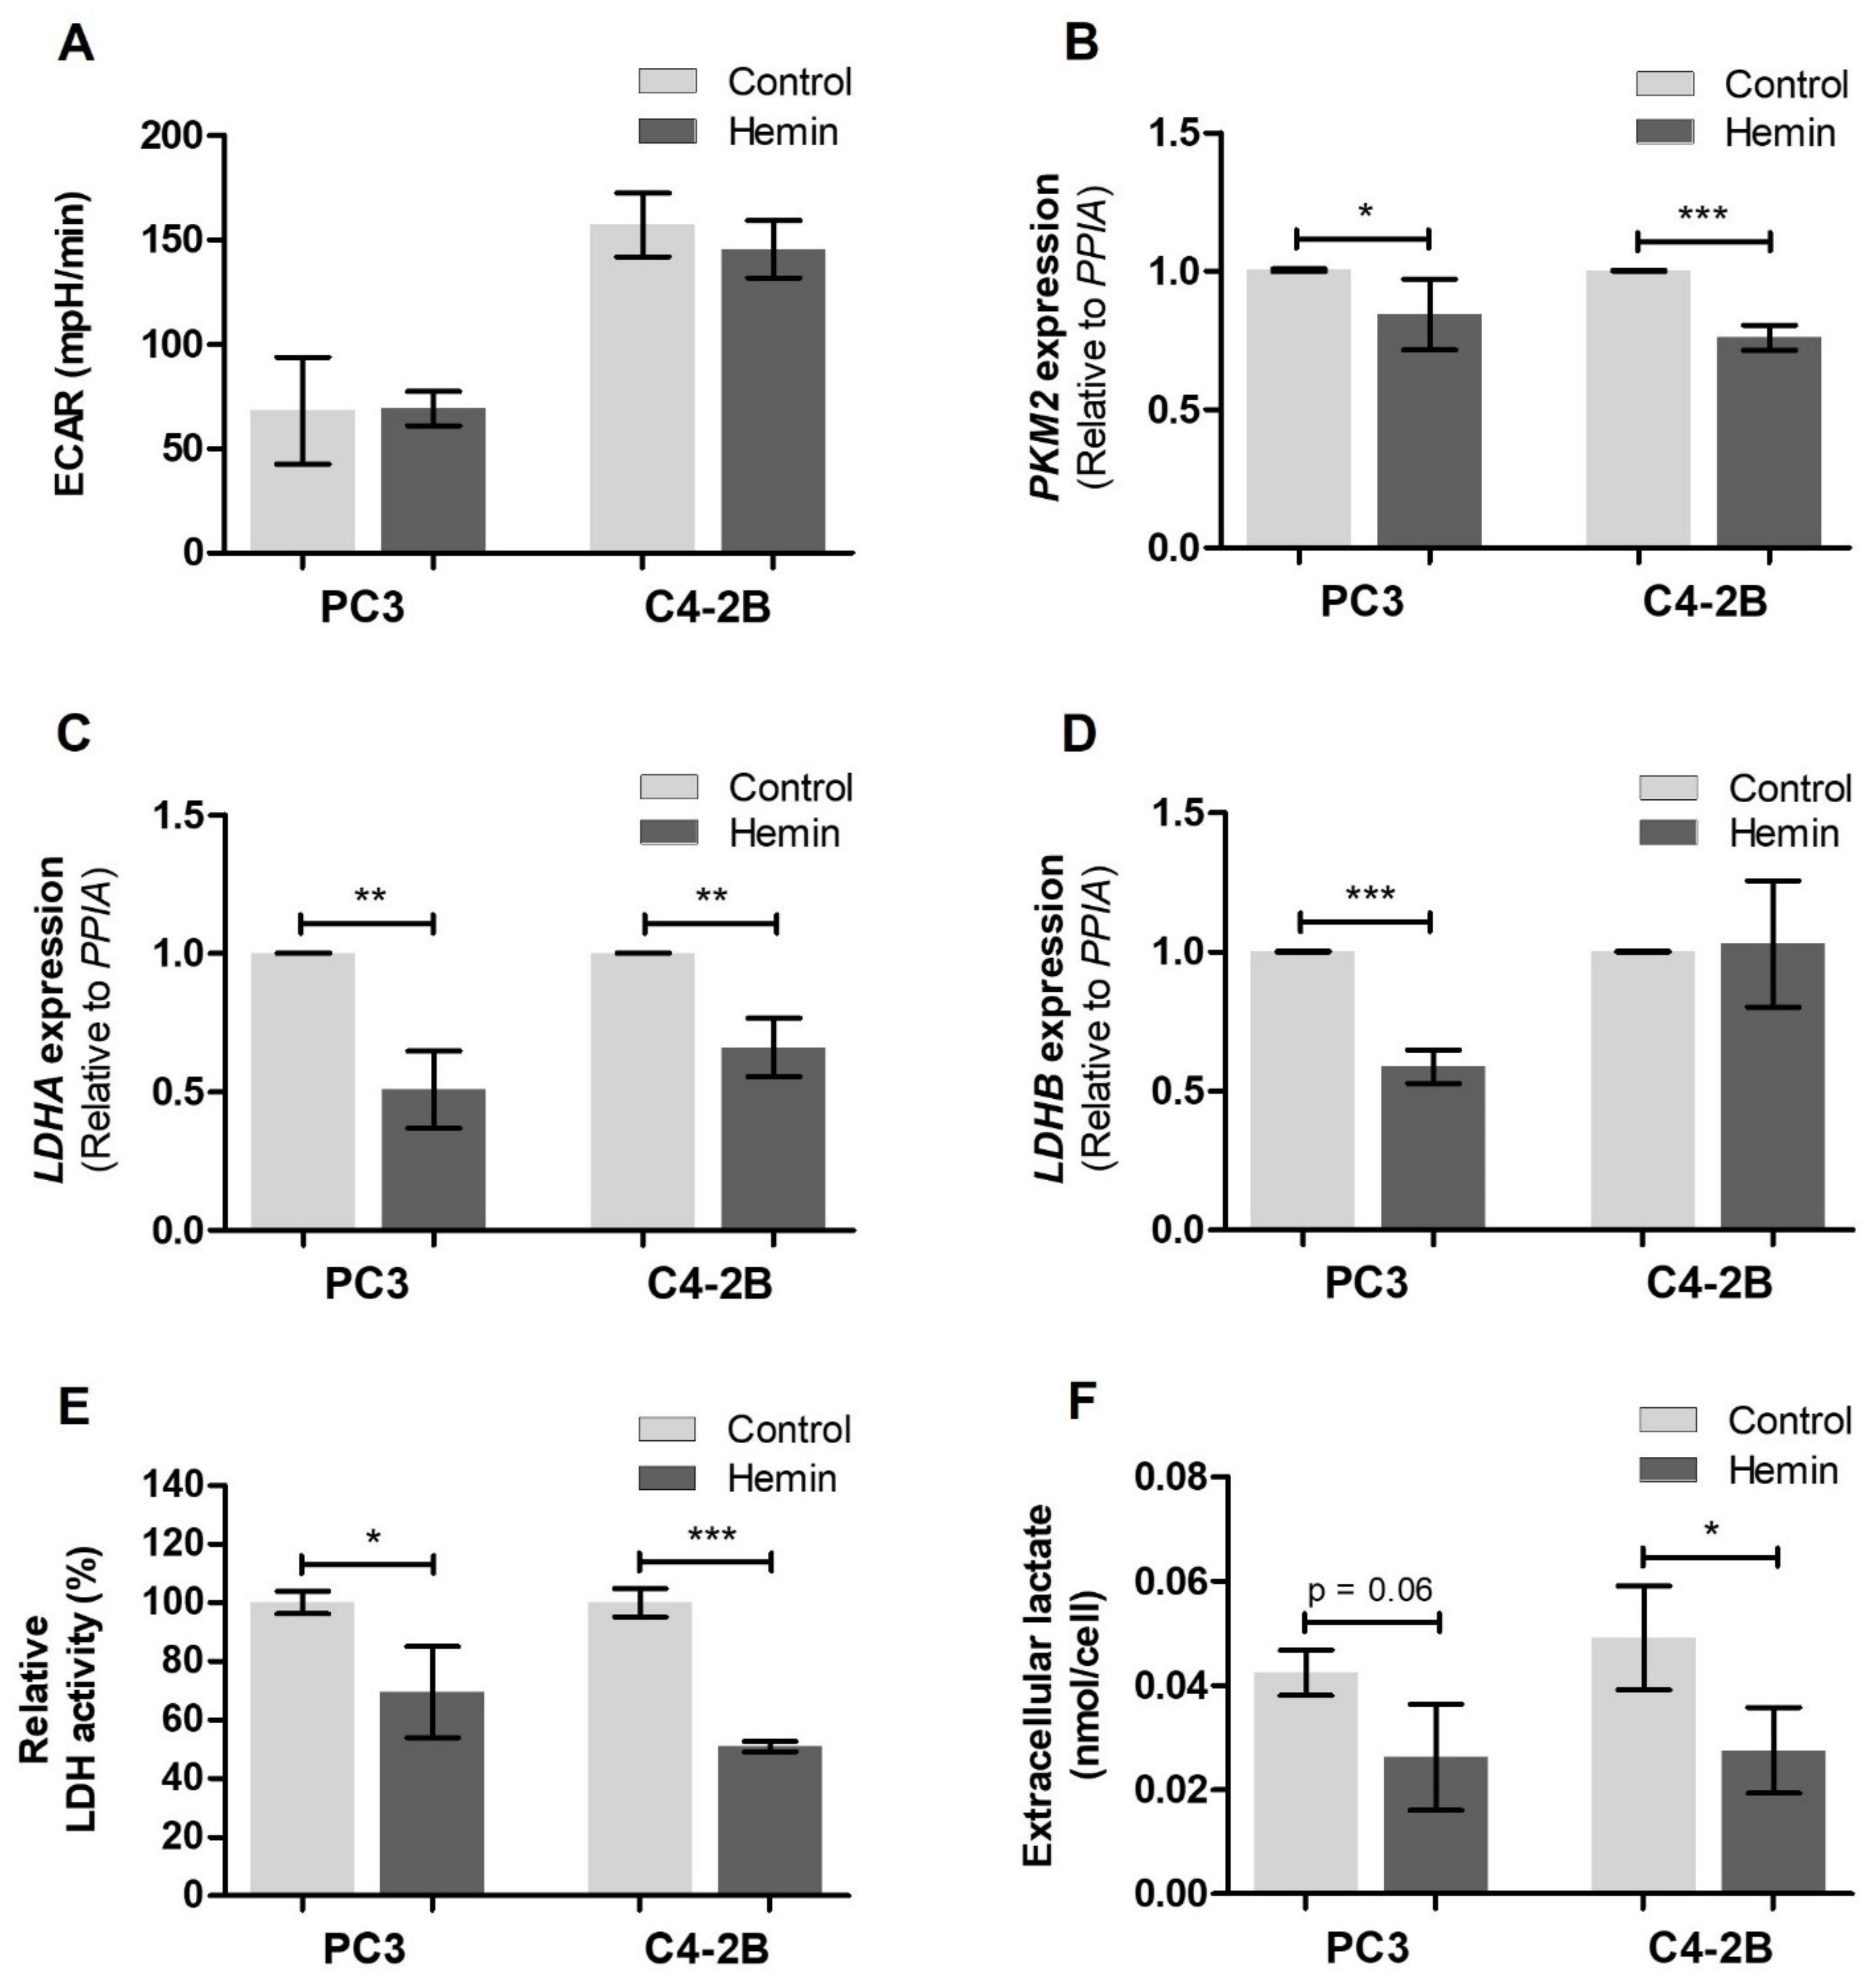
3.1. HO-1 Impairs the Metabolic Status of PCa Cells
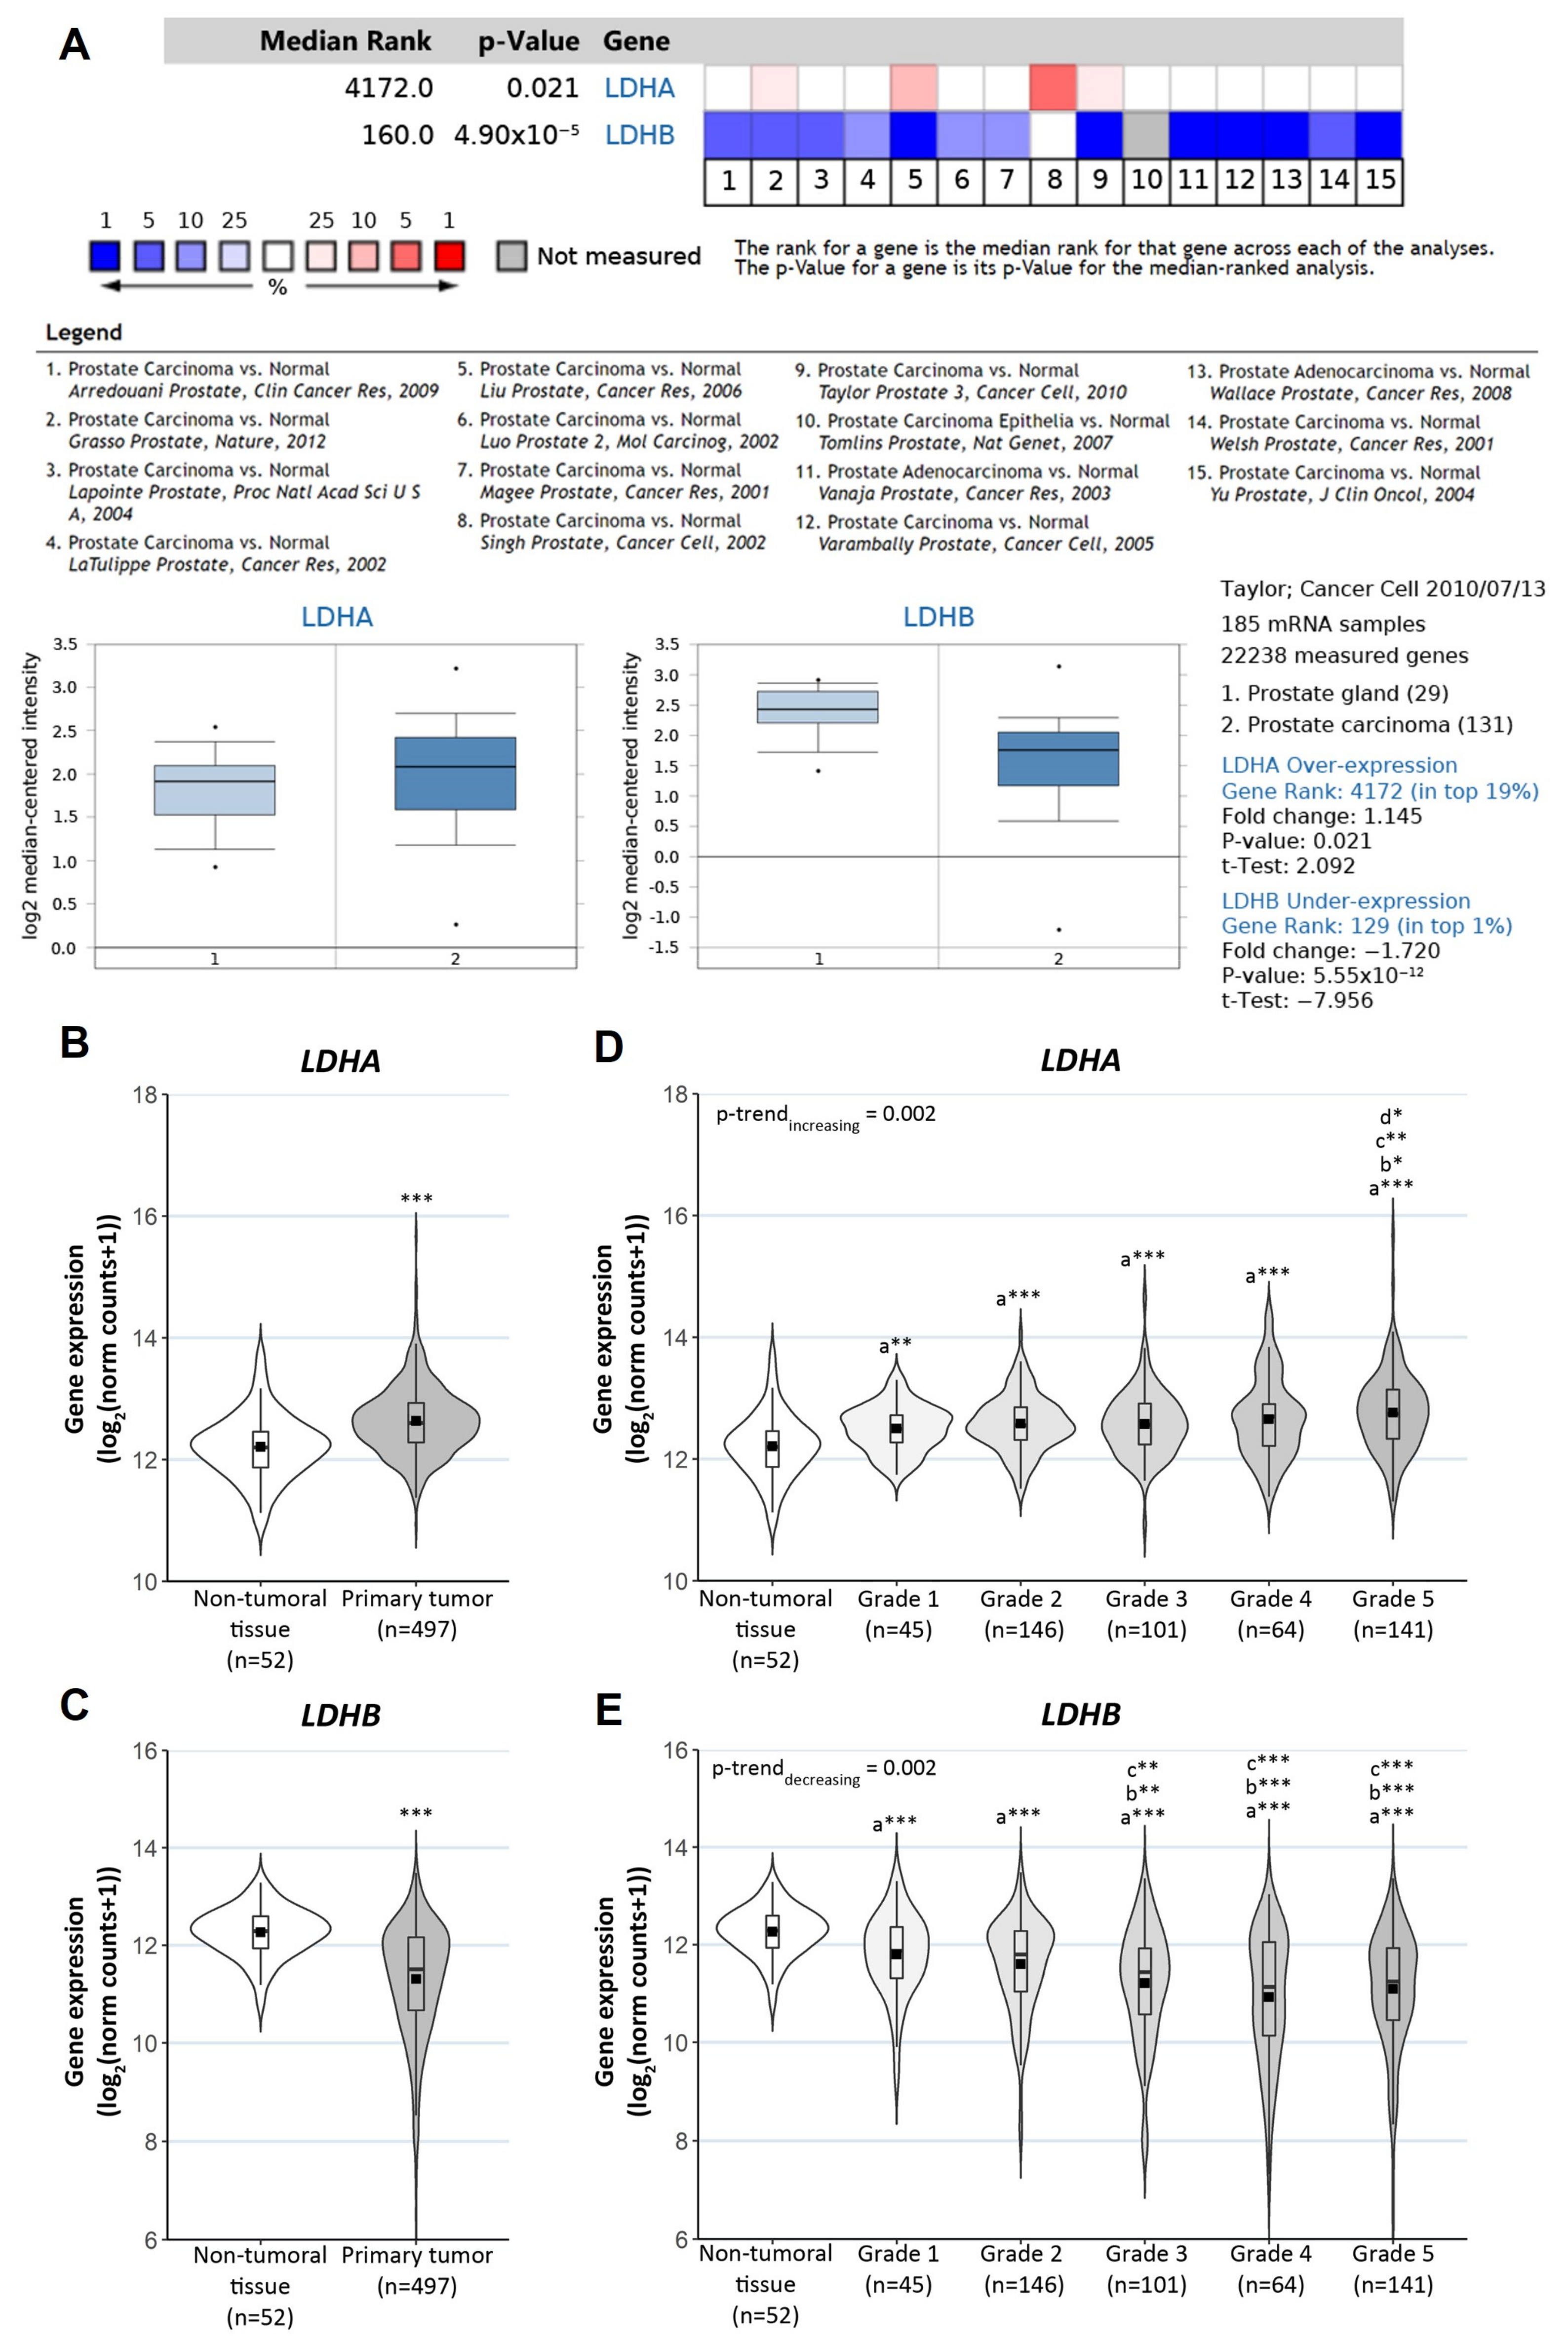
3.2. Clinical Relevance of LDHA, LDHB and HMOX1 in PCa
4. Discussion
5. Conclusions
Supplementary Materials
Author Contributions
Funding
Institutional Review Board Statement
Informed Consent Statement
Data Availability Statement
Acknowledgments
Conflicts of Interest
References
- Bray, F.; Ferlay, J.; Soerjomataram, I.; Siegel, R.L.; Torre, L.A.; Jemal, A. Global cancer statistics 2018: GLOBOCAN estimates of incidence and mortality worldwide for 36 cancers in 185 countries. CA Cancer J. Clin. 2018. [Google Scholar] [CrossRef] [PubMed] [Green Version]
- Shoag, J.; Barbieri, C. Clinical variability and molecular heterogeneity in prostate cancer. Asian J. Androl. 2016, 18, 543–548. [Google Scholar]
- Hanahan, D.; Weinberg, R.A. The hallmarks of cancer. Cell 2000, 100, 57–70. [Google Scholar] [CrossRef] [Green Version]
- Hanahan, D.; Weinberg, R.A. Hallmarks of cancer: The next generation. Cell 2011, 144, 646–674. [Google Scholar] [CrossRef] [PubMed] [Green Version]
- Warburg, O. On the origin of cancer cells. Science 1956, 123, 309–314. [Google Scholar] [CrossRef] [PubMed]
- Weinhouse, S.; Warburg, O.; Burk, D.; Schade, A.L. On respiratory impairment in cancer cells. Science 1956, 124, 267–272. [Google Scholar] [CrossRef]
- Cairns, R.A.; Harris, I.S.; Mak, T.W. Regulation of cancer cell metabolism. Nat. Rev. Cancer 2011, 11, 85–95. [Google Scholar] [CrossRef] [Green Version]
- Doherty, J.R.; Cleveland, J.L. Targeting lactate metabolism for cancer therapeutics. J. Clin. Invest. 2013, 123, 3685–3692. [Google Scholar] [CrossRef]
- Valvona, C.J.; Fillmore, H.L.; Nunn, P.B.; Pilkington, G.J. The Regulation and Function of Lactate Dehydrogenase A: Therapeutic Potential in Brain Tumor. Brain Pathol. 2016, 26, 3–17. [Google Scholar] [CrossRef] [Green Version]
- De la Cruz-López, K.G.; Castro-Muñoz, L.J.; Reyes-Hernández, D.O.; García-Carrancá, A.; Manzo-Merino, J. Lactate in the Regulation of Tumor Microenvironment and Therapeutic Approaches. Front. Oncol. 2019, 9, 1143. [Google Scholar] [CrossRef] [Green Version]
- Jiang, B. Aerobic glycolysis and high level of lactate in cancer metabolism and microenvironment. Genes Dis. 2017, 4, 25–27. [Google Scholar] [CrossRef]
- Bertrand, G.; Vladesco, R. Intervention probable du zinc dans les phaenomens de fecondation chez les animaux vertebrates. CR Acad. Sci. (Paris) 1921, 17, 176–179. [Google Scholar]
- Kolenko, V.; Teper, E.; Kutikov, A.; Uzzo, R. Zinc and zinc transporters in prostate carcinogenesis. Nat. Rev. Urol. 2013, 10, 219–226. [Google Scholar] [CrossRef] [Green Version]
- Costello, L.C.; Franklin, R.B.; Feng, P. Mitochondrial function, zinc, and intermediary metabolism relationships in normal prostate and prostate cancer. Mitochondrion 2005, 5, 143–153. [Google Scholar] [CrossRef] [PubMed] [Green Version]
- Costello, L.C.; Franklin, R.B. The clinical relevance of the metabolism of prostate cancer; zinc and tumor suppression: Connecting the dots. Mol. Cancer 2006, 5, 17. [Google Scholar] [CrossRef] [PubMed] [Green Version]
- Cutruzzolà, F.; Giardina, G.; Marani, M.; Macone, A.; Paiardini, A.; Rinaldo, S.; Paone, A. Glucose metabolism in the progression of prostate cancer. Front. Physiol. 2017, 8, 97. [Google Scholar] [CrossRef] [Green Version]
- Bader, D.A.; McGuire, S.E. Tumour metabolism and its unique properties in prostate adenocarcinoma. Nat. Rev. Urol. 2020, 17, 214–231. [Google Scholar] [CrossRef]
- Mayers, J.R.; Vander Heiden, M.G. Nature and nurture: What determines tumor metabolic phenotypes? Cancer Res. 2017, 77, 3131–3134. [Google Scholar] [CrossRef] [Green Version]
- Costello, L.C.; Franklin, R.B. A comprehensive review of the role of zinc in normal prostate function and metabolism; and its implications in prostate cancer. Arch. Biochem. Biophys. 2016, 611, 100–112. [Google Scholar] [CrossRef] [Green Version]
- Zadra, G.; Photopoulos, C.; Loda, M. The fat side of prostate cancer. Biochim. Biophys. Acta Mol. Cell Biol. Lipids 2013, 1831, 1518–1532. [Google Scholar] [CrossRef] [Green Version]
- Otterbein, L.E.; Soares, M.P.; Yamashita, K.; Bach, F.H. Heme oxygenase-1: Unleashing the protective properties of heme. Trends Immunol. 2003, 24, 449–455. [Google Scholar] [CrossRef]
- Matsumoto, H.; Ishikawa, K.; Itabe, H.; Maruyama, Y. Carbon monoxide and bilirubin from heme oxygenase-1 suppresses reactive oxygen species generation and plasminogen activator inhibitor-1 induction. Mol. Cell. Biochem. 2006, 291, 21–28. [Google Scholar] [CrossRef] [PubMed]
- Dulak, J.; Jozkowicz, A. Novel faces of heme oxygenase-1: Mechanisms and therapeutic potentials. Antioxid. Redox Signal. 2014, 20, 1673–1676. [Google Scholar] [CrossRef] [Green Version]
- Son, Y.; Lee, J.H.; Chung, H.T.; Pae, H.O. Therapeutic roles of heme oxygenase-1 in metabolic diseases: Curcumin and resveratrol analogues as possible inducers of heme oxygenase-1. Oxid. Med. Cell. Longev. 2013, 2013. [Google Scholar] [CrossRef] [Green Version]
- Wegiel, B.; Nemeth, Z.; Correa-Costa, M.; Bulmer, A.C.; Otterbein, L.E. Heme oxygenase-1: A metabolic nike. Antioxid. Redox Signal. 2014, 20, 1709–1722. [Google Scholar] [CrossRef] [Green Version]
- Jozkowicz, A.; Was, H.; Dulak, J. Heme oxygenase-1 in tumors: Is it a false friend? Antioxid. Redox Signal. 2007, 9, 2099–2117. [Google Scholar] [CrossRef] [PubMed] [Green Version]
- Nitti, M.; Piras, S.; Marinari, U.M.; Moretta, L.; Pronzato, M.A.; Furfaro, A.L. HO-1 induction in cancer progression: A matter of cell adaptation. Antioxidants 2017, 6, 29. [Google Scholar] [CrossRef] [PubMed]
- Chiang, S.K.; Chen, S.E.; Chang, L.C. A dual role of heme oxygenase-1 in cancer cells. Int. J. Mol. Sci. 2019, 20, 39. [Google Scholar] [CrossRef] [PubMed] [Green Version]
- Gueron, G.; De Siervi, A.; Ferrando, M.; Salierno, M.; De Luca, P.; Elguero, B.; Meiss, R.; Navone, N.; Vazquez, E.S. Critical role of endogenous heme oxygenase 1 as a tuner of the invasive potential of prostate cancer cells. Mol. Cancer Res. 2009, 7, 1745–1755. [Google Scholar] [CrossRef] [Green Version]
- Ferrando, M.; Gueron, G.; Elguero, B.; Giudice, J.; Salles, A.; Leskow, F.C.; Jares-Erijman, E.A.; Colombo, L.; Meiss, R.; Navone, N.; et al. Heme oxygenase 1 (HO-1) challenges the angiogenic switch in prostate cancer. Angiogenesis 2011, 14, 467–479. [Google Scholar] [CrossRef]
- Elguero, B.; Gueron, G.; Giudice, J.; Toscani, M.A.; De Luca, P.; Zalazar, F.; Coluccio-Leskow, F.; Meiss, R.; Navone, N.; De Siervi, A.; et al. Unveiling the association of STAT3 and HO-1 in prostate cancer: Role beyond heme degradation. Neoplasia 2012, 14, 1043–1056. [Google Scholar] [CrossRef] [PubMed] [Green Version]
- Paez, A.V.; Pallavicini, C.; Schuster, F.; Valacco, M.P.; Giudice, J.; Ortiz, E.G.; Anselmino, N.; Labanca, E.; Binaghi, M.; Salierno, M.; et al. Heme oxygenase-1 in the forefront of a multi-molecular network that governs cell-cell contacts and filopodia-induced zippering in prostate cancer. Cell Death Dis. 2016, 7, e2570. [Google Scholar] [CrossRef] [PubMed]
- Gueron, G.; Giudice, J.; Valacco, P.; Paez, A.; Elguero, B.; Toscani, M.; Jaworski, F.; Leskow, F.C.; Cotignola, J.; Marti, M.; et al. Heme-oxygenase-1 implications in cell morphology and the adhesive behavior of prostate cancer cells. Oncotarget 2014, 5, 4087–4102. [Google Scholar] [CrossRef] [PubMed] [Green Version]
- Jaworski, F.M.; Gentilini, L.D.; Gueron, G.; Meiss, R.P.; Ortiz, E.G.; Berguer, P.M.; Ahmed, A.; Navone, N.; Rabinovich, G.A.; Compagno, D.; et al. In Vivo Hemin Conditioning Targets the Vascular and Immunologic Compartments and Restrains Prostate Tumor Development. Clin. Cancer Res. 2017, 23, 5135–5148. [Google Scholar] [CrossRef] [Green Version]
- Anselmino, N.; Starbuck, M.; Labanca, E.; Cotignola, J.; Navone, N.; Gueron, G.; Zenclussen, A.C.; Vazquez, E. Heme Oxygenase-1 Is a Pivotal Modulator of Bone Turnover and Remodeling: Molecular Implications for Prostate Cancer Bone Metastasis. Antioxid. Redox Signal. 2020, 32, 1243–1258. [Google Scholar] [CrossRef] [PubMed]
- Anselmino, N.; Bizzotto, J.; Sanchis, P.; Lage-Vickers, S.; Ortiz, E.; Valacco, P.; Paez, A.; Labanca, E.; Meiss, R.; Navone, N.; et al. HO-1 interactors involved in the colonization of the bone niche: Role of ANXA2 in prostate cancer progression. Biomolecules 2020, 10, 467. [Google Scholar] [CrossRef] [Green Version]
- Navone, N.M.; Olive, M.; Ozen, M.; Davis, R.; Troncoso, P.; Tu, S.M.; Johnston, D.; Pollack, A.; Pathak, S.; von Eschenbach, A.C.; et al. Establishment of two human prostate cancer cell lines derived from a single bone metastasis. Clin. Cancer Res. 1997, 3, 2493–2500. [Google Scholar] [PubMed]
- Livak, K.J.; Schmittgen, T.D. Analysis of relative gene expression data using real-time quantitative PCR and the 2-ΔΔCT method. Methods 2001, 25, 402–408. [Google Scholar] [CrossRef]
- Goldman, M.J.; Craft, B.; Hastie, M.; Repečka, K.; McDade, F.; Kamath, A.; Banerjee, A.; Luo, Y.; Rogers, D.; Brooks, A.N.; et al. Visualizing and interpreting cancer genomics data via the Xena platform. Nat. Biotechnol. 2020, 38, 675–678. [Google Scholar] [CrossRef]
- Epstein, J.I.; Egevad, L.; Amin, M.B.; Delahunt, B.; Srigley, J.R.; Humphrey, P.A. The 2014 international society of urological pathology (ISUP) consensus conference on gleason grading of prostatic carcinoma definition of grading patterns and proposal for a new grading system. Am. J. Surg. Pathol. 2016, 40, 244–252. [Google Scholar] [CrossRef]
- Ross-Adams, H.; Lamb, A.; Dunning, M.; Halim, S.; Lindberg, J.; Massie, C.; Egevad, L.; Russell, R.; Ramos-Montoya, A.; Vowler, S.; et al. Integration of copy number and transcriptomics provides risk stratification in prostate cancer: A discovery and validation cohort study. EBioMedicine 2015, 2, 1133–1144. [Google Scholar] [CrossRef] [Green Version]
- Xiao, H.; Wang, J.; Yan, W.; Cui, Y.; Chen, Z.; Gao, X.; Wen, X.; Chen, J. GLUT1 regulates cell glycolysis and proliferation in prostate cancer. Prostate 2018, 78, 86–94. [Google Scholar] [CrossRef] [PubMed]
- Jans, J.; van Dijk, J.H.; van Schelven, S.; van der Groep, P.; Willems, S.H.; Jonges, T.N.; van Diest, P.J.; Bosch, J.L.H.R. Expression and Localization of Hypoxia Proteins in Prostate Cancer: Prognostic Implications after Radical Prostatectomy. Urology 2010, 75, 786–792. [Google Scholar] [CrossRef] [PubMed]
- Gaude, E.; Frezza, C. Defects in mitochondrial metabolism and cancer. Cancer Metab. 2014, 2, 10. [Google Scholar] [CrossRef] [PubMed] [Green Version]
- Ying, W. NAD+/NADH and NADP+/NADPH in cellular functions and cell death: Regulation and biological consequences. Antioxid. Redox Signal. 2008, 10, 179–206. [Google Scholar] [CrossRef] [Green Version]
- Jorgenson, T.C.; Zhong, W.; Oberley, T.D. Redox imbalance and biochemical changes in cancer. Cancer Res. 2013, 73, 6118–6123. [Google Scholar] [CrossRef] [Green Version]
- Da Veiga Moreira, J.; Hamraz, M.; Abolhassani, M.; Bigan, E.; Pérès, S.; Paulevé, L.; Nogueira, M.L.; Steyaert, J.M.; Schwartz, L. The redox status of cancer cells supports mechanisms behind the Warburg effect. Metabolites 2016, 6, 33. [Google Scholar] [CrossRef]
- Yang, W.; Lu, Z. Pyruvate kinase M2 at a glance. J. Cell Sci. 2015, 128, 1655–1660. [Google Scholar] [CrossRef] [Green Version]
- DeBerardinis, R.J.; Lum, J.J.; Hatzivassiliou, G.; Thompson, C.B. The biology of cancer: Metabolic reprogramming fuels cell growth and proliferation. Cell Metab. 2008, 7, 11–20. [Google Scholar] [CrossRef] [PubMed] [Green Version]
- Antico Arciuch, V.G.; Gueron, G.; Cotignola, J.; Vázquez, E.S. Altered signaling pathways in prostate cancer drive metabolic fate. Int. J. Sci. Res. 2017, 6, 614–619. [Google Scholar]
- Loboda, A.; Jozkowicz, A.; Dulak, J. HO-1/CO system in tumor growth, angiogenesis and metabolism-Targeting HO-1 as an anti-tumor therapy. Vasc. Pharmacol. 2015, 74, 11–22. [Google Scholar] [CrossRef] [PubMed]
- Sacca, P.; Meiss, R.; Casas, G.; Mazza, O.; Calvo, J.C.; Navone, N.; Vazquez, E. Nuclear translocation of haeme oxygenase-1 is associated to prostate cancer. Br. J. Cancer 2007, 97, 1683–1689. [Google Scholar] [CrossRef]
- Biswas, C.; Shah, N.; Muthu, M.; La, P.; Fernando, A.P.; Sengupta, S.; Yang, G.; Dennery, P.A. Nuclear heme oxygenase-1 (HO-1) modulates subcellular distribution and activation of Nrf2, impacting metabolic and anti-oxidant defenses. J. Biol. Chem. 2014, 289, 26882–26894. [Google Scholar] [CrossRef] [PubMed] [Green Version]
- Krzeptowski, W.; Chudy, P.; Sokołowski, G.; Żukowska, M.; Kusienicka, A.; Seretny, A.; Kalita, A.; Czmoczek, A.; Gubała, J.; Baran, S.; et al. Proximity ligation assay detection of protein–dna interactions—Is there a link between heme oxygenase-1 and g-quadruplexes? Antioxidants 2021, 10, 94. [Google Scholar] [CrossRef]
- Gandini, N.A.; Alonso, E.N.; Fermento, M.E.; Mascaró, M.; Abba, M.C.; Coló, G.P.; Arévalo, J.; Ferronato, M.J.; Guevara, J.A.; Núñez, M.; et al. Heme Oxygenase-1 Has an Antitumor Role in Breast Cancer. Antioxid. Redox Signal. 2019, 30, 2030–2049. [Google Scholar] [CrossRef] [PubMed]
- Chiang, K.C.; Chang, K.S.; Hsu, S.Y.; Sung, H.C.; Feng, T.H.; Chao, M.; Juang, H.H. Human heme oxygenase-1 induced by interleukin-6 via JAK/STAT3 pathways is a tumor suppressor gene in hepatoma cells. Antioxidants 2020, 9, 251. [Google Scholar] [CrossRef] [PubMed] [Green Version]
- Becker, J.C.; Fukui, H.; Imai, Y.; Sekikawa, A.; Kimura, T.; Yamagishi, H.; Yoshitake, N.; Pohle, T.; Domschke, W.; Fujimori, T. Colonic expression of heme oxygenase-1 is associated with a better long-term survival in patients with colorectal cancer. Scand. J. Gastroenterol. 2007, 42, 852–858. [Google Scholar] [CrossRef]
- Andrés, N.C.; Fermento, M.E.; Gandini, N.A.; Romero, A.L.; Ferro, A.; Donna, L.G.; Curino, A.C.; Facchinetti, M.M. Heme oxygenase-1 has antitumoral effects in colorectal cancer: Involvement of p53. Exp. Mol. Pathol. 2014, 97, 321–331. [Google Scholar] [CrossRef]
- Gandini, N.A.; Fermento, M.E.; Salomón, D.G.; Blasco, J.; Patel, V.; Gutkind, J.S.; Molinolo, A.A.; Facchinetti, M.M.; Curino, A.C. Nuclear localization of heme oxygenase-1 is associated with tumor progression of head and neck squamous cell carcinomas. Exp. Mol. Pathol. 2012, 93, 237–245. [Google Scholar] [CrossRef]
- Degese, M.S.; Mendizabal, J.E.; Gandini, N.A.; Gutkind, J.S.; Molinolo, A.; Hewitt, S.M.; Curino, A.C.; Coso, O.A.; Facchinetti, M.M. Expression of heme oxygenase-1 in non-small cell lung cancer (NSCLC) and its correlation with clinical data. Lung Cancer 2012, 77, 168–175. [Google Scholar] [CrossRef]
- Gandini, N.A.; Fermento, M.E.; Salomón, D.G.; Obiol, D.J.; Andrés, N.C.; Zenklusen, J.C.; Arevalo, J.; Blasco, J.; López Romero, A.; Facchinetti, M.M.; et al. Heme oxygenase-1 expression in human gliomas and its correlation with poor prognosis in patients with astrocytoma. Tumor Biol. 2014, 35, 2803–2815. [Google Scholar] [CrossRef]
- Luu Hoang, K.N.; Anstee, J.E.; Arnold, J.N. The Diverse Roles of Heme Oxygenase-1 in Tumor Progression. Front. Immunol. 2021, 12, 1037. [Google Scholar]
- Mascaró, M.; Alonso, E.N.; Alonso, E.G.; Lacunza, E.; Curino, A.C.; Facchinetti, M.M. Nuclear localization of heme oxygenase-1 in pathophysiological conditions: Does it explain the dual role in cancer? Antioxidants 2021, 10, 87. [Google Scholar] [CrossRef]
- Bussolati, B.; Mason, J.C. Dual role of VEGF-induced heme-oxygenase-1 in angiogenesis. Antioxid. Redox Signal. 2006, 8, 1153–1163. [Google Scholar] [CrossRef]
- Loboda, A.; Jazwa, A.; Grochot-Przeczek, A.; Rutkowski, A.J.; Cisowski, J.; Agarwal, A.; Jozkowicz, A.; Dulak, J. Heme oxygenase-1 and the vascular bed: From molecular mechanisms to therapeutic opportunities. Antioxid. Redox Signal. 2008, 10, 1767–1812. [Google Scholar] [CrossRef]
- Rochette, L.; Zeller, M.; Cottin, Y.; Vergely, C. Redox Functions of Heme Oxygenase-1 and Biliverdin Reductase in Diabetes. Trends Endocrinol. Metab. 2018, 29, 74–85. [Google Scholar] [CrossRef]
- Kim, H.J.; Joe, Y.; Surh, Y.J.; Chung, H.T. Metabolic signaling functions of the heme oxygenase/CO system in metabolic diseases. Cell. Mol. Immunol. 2018, 15, 1085–1087. [Google Scholar] [CrossRef] [Green Version]
- Kishimoto, Y.; Kondo, K.; Momiyama, Y. The protective role of heme oxygenase-1 in atherosclerotic diseases. Int. J. Mol. Sci. 2019, 20, 3628. [Google Scholar] [CrossRef] [Green Version]
- Waldman, M.; Nudelman, V.; Shainberg, A.; Zemel, R.; Kornwoski, R.; Aravot, D.; Peterson, S.J.; Arad, M.; Hochhauser, E. The role of heme oxygenase 1 in the protective effect of caloric restriction against diabetic cardiomyopathy. Int. J. Mol. Sci. 2019, 20, 2427. [Google Scholar] [CrossRef] [Green Version]
- Lilljebjörn, L.V.; Csizmadia, E.; Hedblom, A.; Canesin, G.; Kalbasi, A.; Li, M.; Kramer, F.; Bornfeldt, K.E.; Wegiel, B. A Role of the Heme Degradation Pathway in Shaping Prostate Inflammatory Responses and Lipid Metabolism. Am. J. Pathol. 2020, 190, 830–843. [Google Scholar] [CrossRef]
- Converso, D.P.; Taillé, C.; Carreras, M.C.; Jaitovich, A.; Poderoso, J.J.; Boczkowski, J. HO-1 is located in liver mitochondria and modulates mitochondrial heme content and metabolism. FASEB J. 2006, 20, 1236–1238. [Google Scholar] [CrossRef] [Green Version]
- Slebos, D.-J.; Ryter, S.W.; van der Toorn, M.; Liu, F.; Guo, F.; Baty, C.J.; Karlsson, J.M.; Watkins, S.C.; Kim, H.P.; Wang, X.; et al. Mitochondrial localization and function of heme oxygenase-1 in cigarette smoke-induced cell death. Am. J. Respir. Cell Mol. Biol. 2007, 36, 409–417. [Google Scholar] [CrossRef] [Green Version]
- Massie, C.E.; Lynch, A.; Ramos-Montoya, A.; Boren, J.; Stark, R.; Fazli, L.; Warren, A.; Scott, H.; Madhu, B.; Sharma, N.; et al. The androgen receptor fuels prostate cancer by regulating central metabolism and biosynthesis. EMBO J. 2011, 30, 2719–2733. [Google Scholar] [CrossRef] [Green Version]
- Vousden, K.H.; Ryan, K.M. P53 and metabolism. Nat. Rev. Cancer 2009, 9, 691–700. [Google Scholar] [CrossRef]
- Yamamoto, T.; Takano, N.; Ishiwata, K.; Ohmura, M.; Nagahata, Y.; Matsuura, T.; Kamata, A.; Sakamoto, K.; Nakanishi, T.; Kubo, A.; et al. Reduced methylation of PFKFB3 in cancer cells shunts glucose towards the pentose phosphate pathway. Nat. Commun. 2014, 5. [Google Scholar] [CrossRef] [Green Version]
- Gorojod, R.M.; Alaimo, A.; Porte Alcon, S.; Martinez, J.H.; Cortina, M.E.; Vazquez, E.S.; Kotler, M.L. Heme Oxygenase-1 protects astroglia against manganese-induced oxidative injury by regulating mitochondrial quality control. Toxicol. Lett. 2018, 295, 357–368. [Google Scholar] [CrossRef]
- Hull, T.D.; Boddu, R.; Guo, L.; Tisher, C.C.; Traylor, A.M.; Patel, B.; Joseph, R.; Prabhu, S.D.; Suliman, H.B.; Piantadosi, C.A.; et al. Heme oxygenase-1 regulates mitochondrial quality control in the heart. JCI Insight 2016, 1. [Google Scholar] [CrossRef] [Green Version]
- Santidrian, A.F.; Matsuno-Yagi, A.; Ritland, M.; Seo, B.B.; LeBoeuf, S.E.; Gay, L.J.; Yagi, T.; Felding-Habermann, B. Mitochondrial complex I activity and NAD+/NADH balance regulate breast cancer progression. J. Clin. Investig. 2013, 123, 1068–1081. [Google Scholar] [CrossRef] [Green Version]
- Scher, H.I.; Jia, X.; de Bono, J.S.; Fleisher, M.; Pienta, K.J.; Raghavan, D.; Heller, G. Circulating tumour cells as prognostic markers in progressive, castration-resistant prostate cancer: A reanalysis of IMMC38 trial data. Lancet Oncol. 2009, 10, 233–239. [Google Scholar] [CrossRef] [Green Version]
- Sartor, O.; Coleman, R.E.; Nilsson, S.; Heinrich, D.; Helle, S.I.; O’Sullivan, J.M.; Vogelzang, N.J.; Bruland, O.; Kobina, S.; Wilhelm, S.; et al. An exploratory analysis of alkaline phosphatase, lactate dehydrogenase, and prostate-specific antigen dynamics in the phase 3 ALSYMPCA trial with radium-223. Ann. Oncol. 2017, 28, 1090–1097. [Google Scholar] [CrossRef]


Publisher’s Note: MDPI stays neutral with regard to jurisdictional claims in published maps and institutional affiliations. |
© 2021 by the authors. Licensee MDPI, Basel, Switzerland. This article is an open access article distributed under the terms and conditions of the Creative Commons Attribution (CC BY) license (https://creativecommons.org/licenses/by/4.0/).
Share and Cite
Cascardo, F.; Anselmino, N.; Páez, A.; Labanca, E.; Sanchis, P.; Antico-Arciuch, V.; Navone, N.; Gueron, G.; Vázquez, E.; Cotignola, J. HO-1 Modulates Aerobic Glycolysis through LDH in Prostate Cancer Cells. Antioxidants 2021, 10, 966. https://doi.org/10.3390/antiox10060966
Cascardo F, Anselmino N, Páez A, Labanca E, Sanchis P, Antico-Arciuch V, Navone N, Gueron G, Vázquez E, Cotignola J. HO-1 Modulates Aerobic Glycolysis through LDH in Prostate Cancer Cells. Antioxidants. 2021; 10(6):966. https://doi.org/10.3390/antiox10060966
Chicago/Turabian StyleCascardo, Florencia, Nicolás Anselmino, Alejandra Páez, Estefanía Labanca, Pablo Sanchis, Valeria Antico-Arciuch, Nora Navone, Geraldine Gueron, Elba Vázquez, and Javier Cotignola. 2021. "HO-1 Modulates Aerobic Glycolysis through LDH in Prostate Cancer Cells" Antioxidants 10, no. 6: 966. https://doi.org/10.3390/antiox10060966