
Upregulation of a Small-World Brain Network Improves Inhibitory Control: An fNIRS Neurofeedback Training Study
 ,
,
Abstract
:
1. Introduction
2. Materials and Methods
2.1. Trial Setting and Sample Size
2.2. Participants
2.3. Brain Imaging Tools and Region of Interest Definition
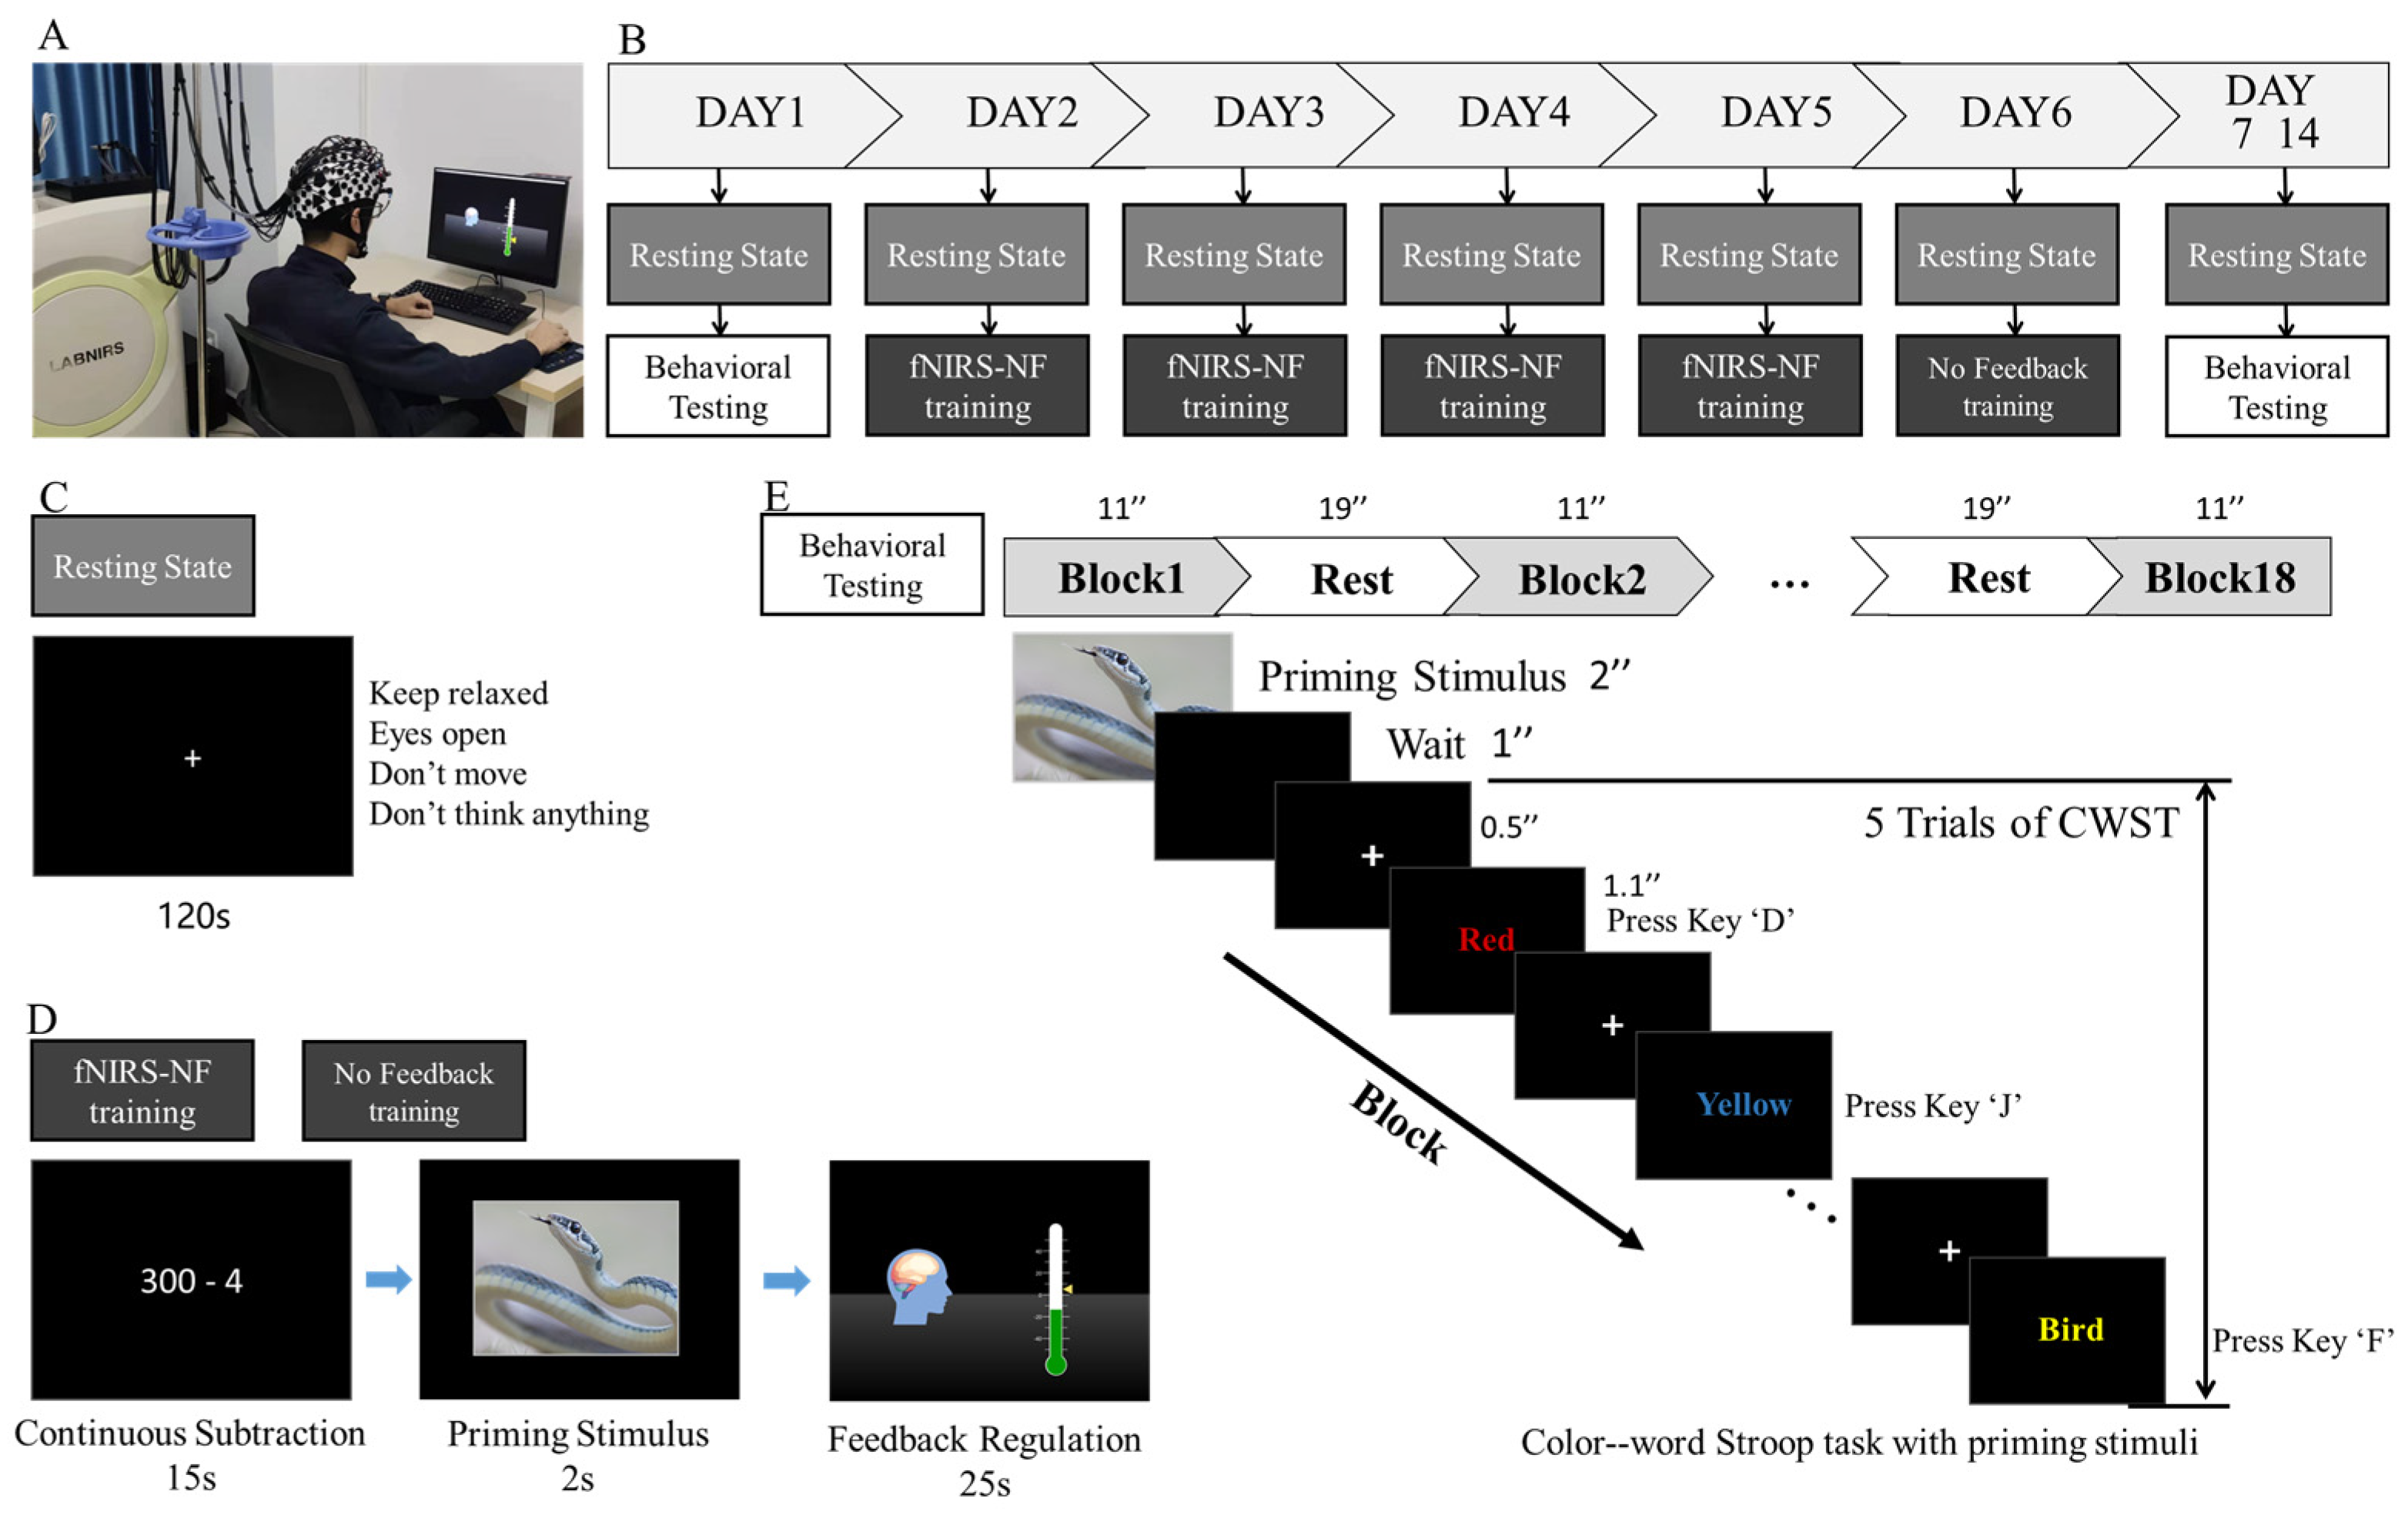
2.4. Training Procedures and Behavioral Testing
2.5. Online Calculation of the Feedback Score
2.6. Offline Data Analyses
3. Results
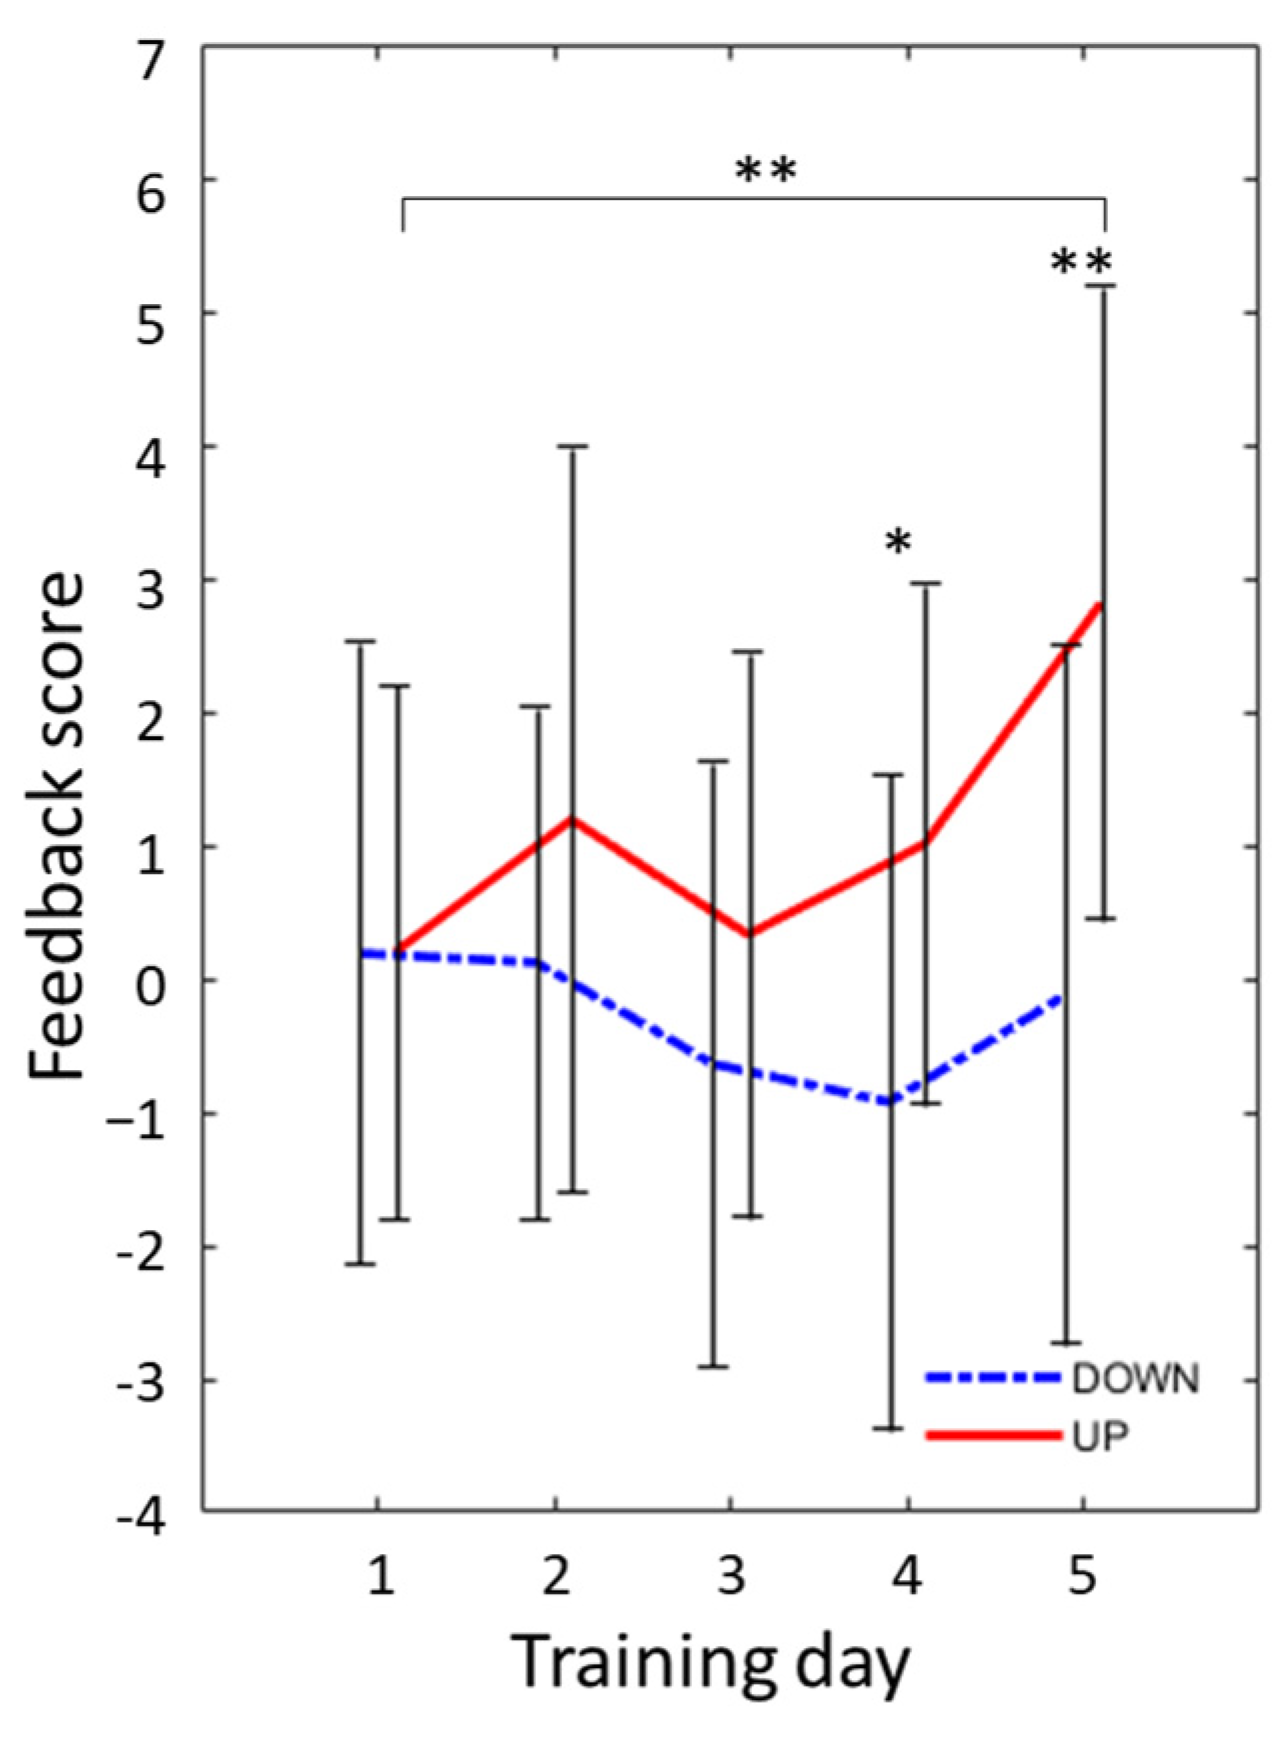
3.1. Change in Feedback Score
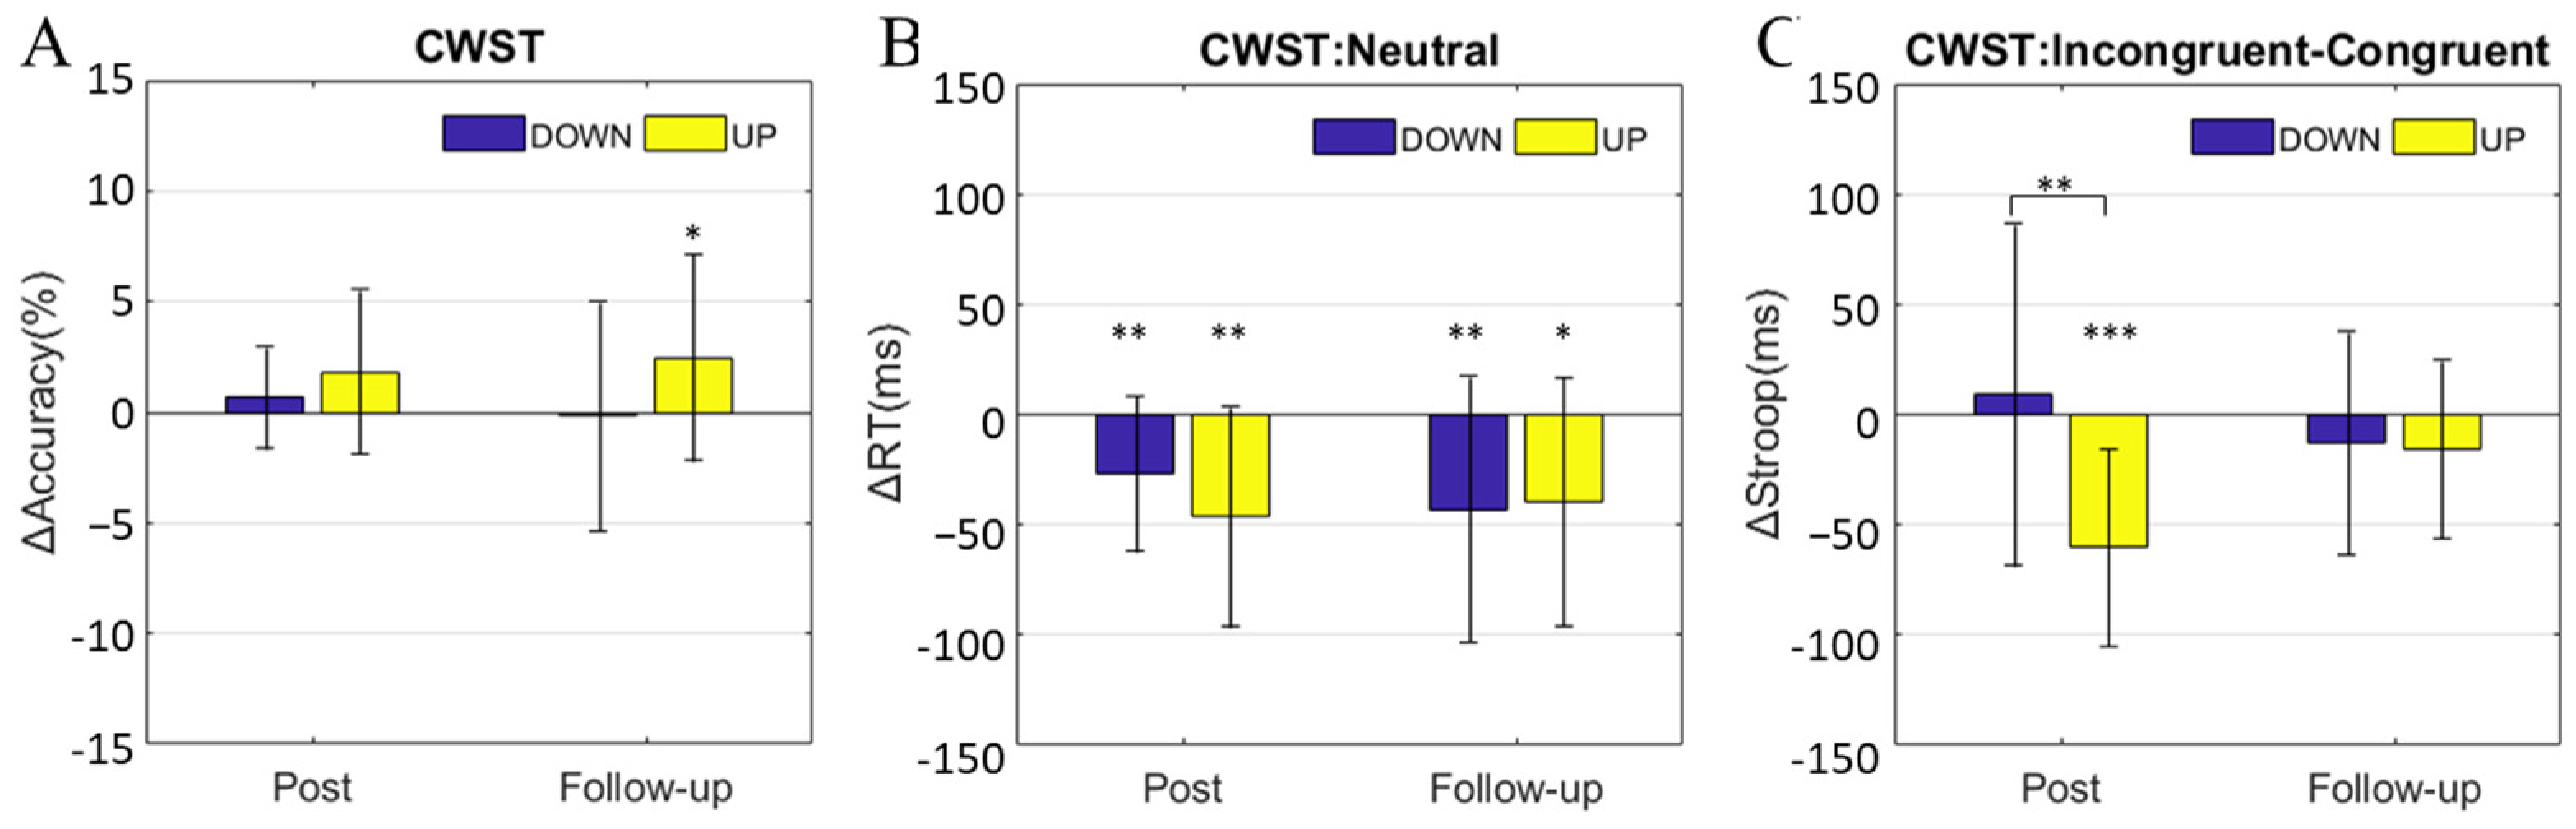
3.2. Change in Cognitive Performance
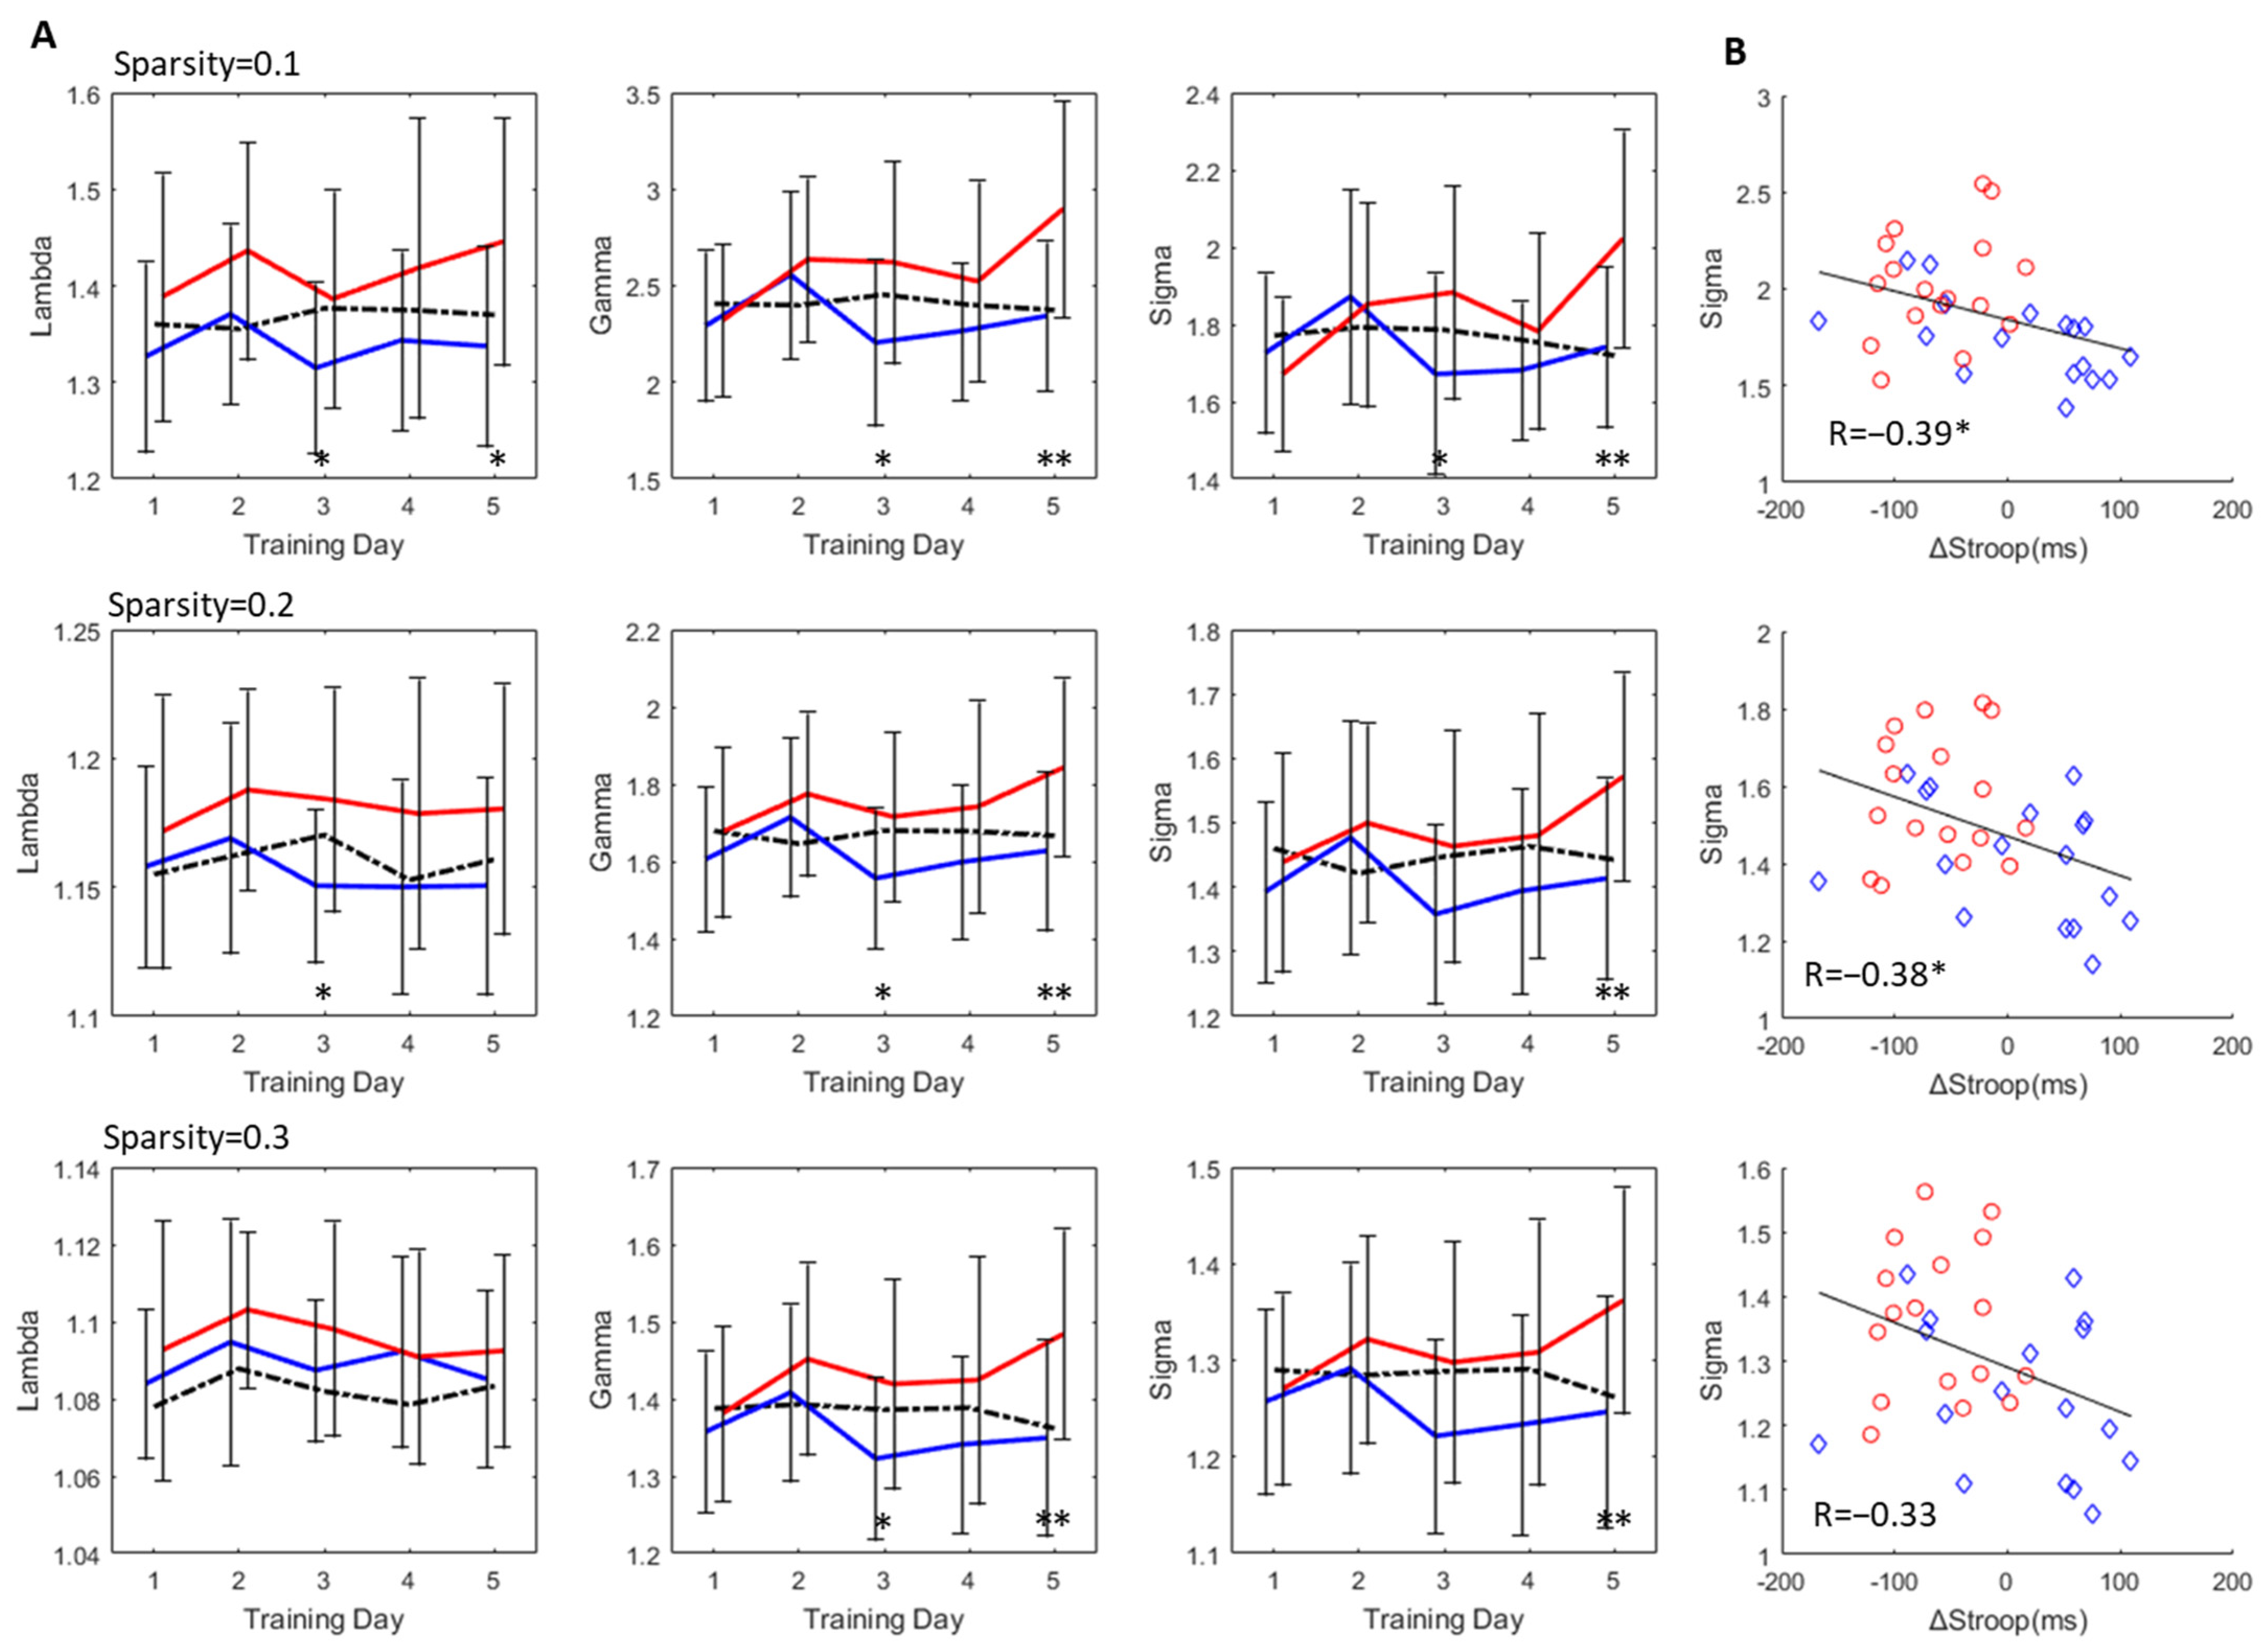
3.3. Change in Small-World Properties
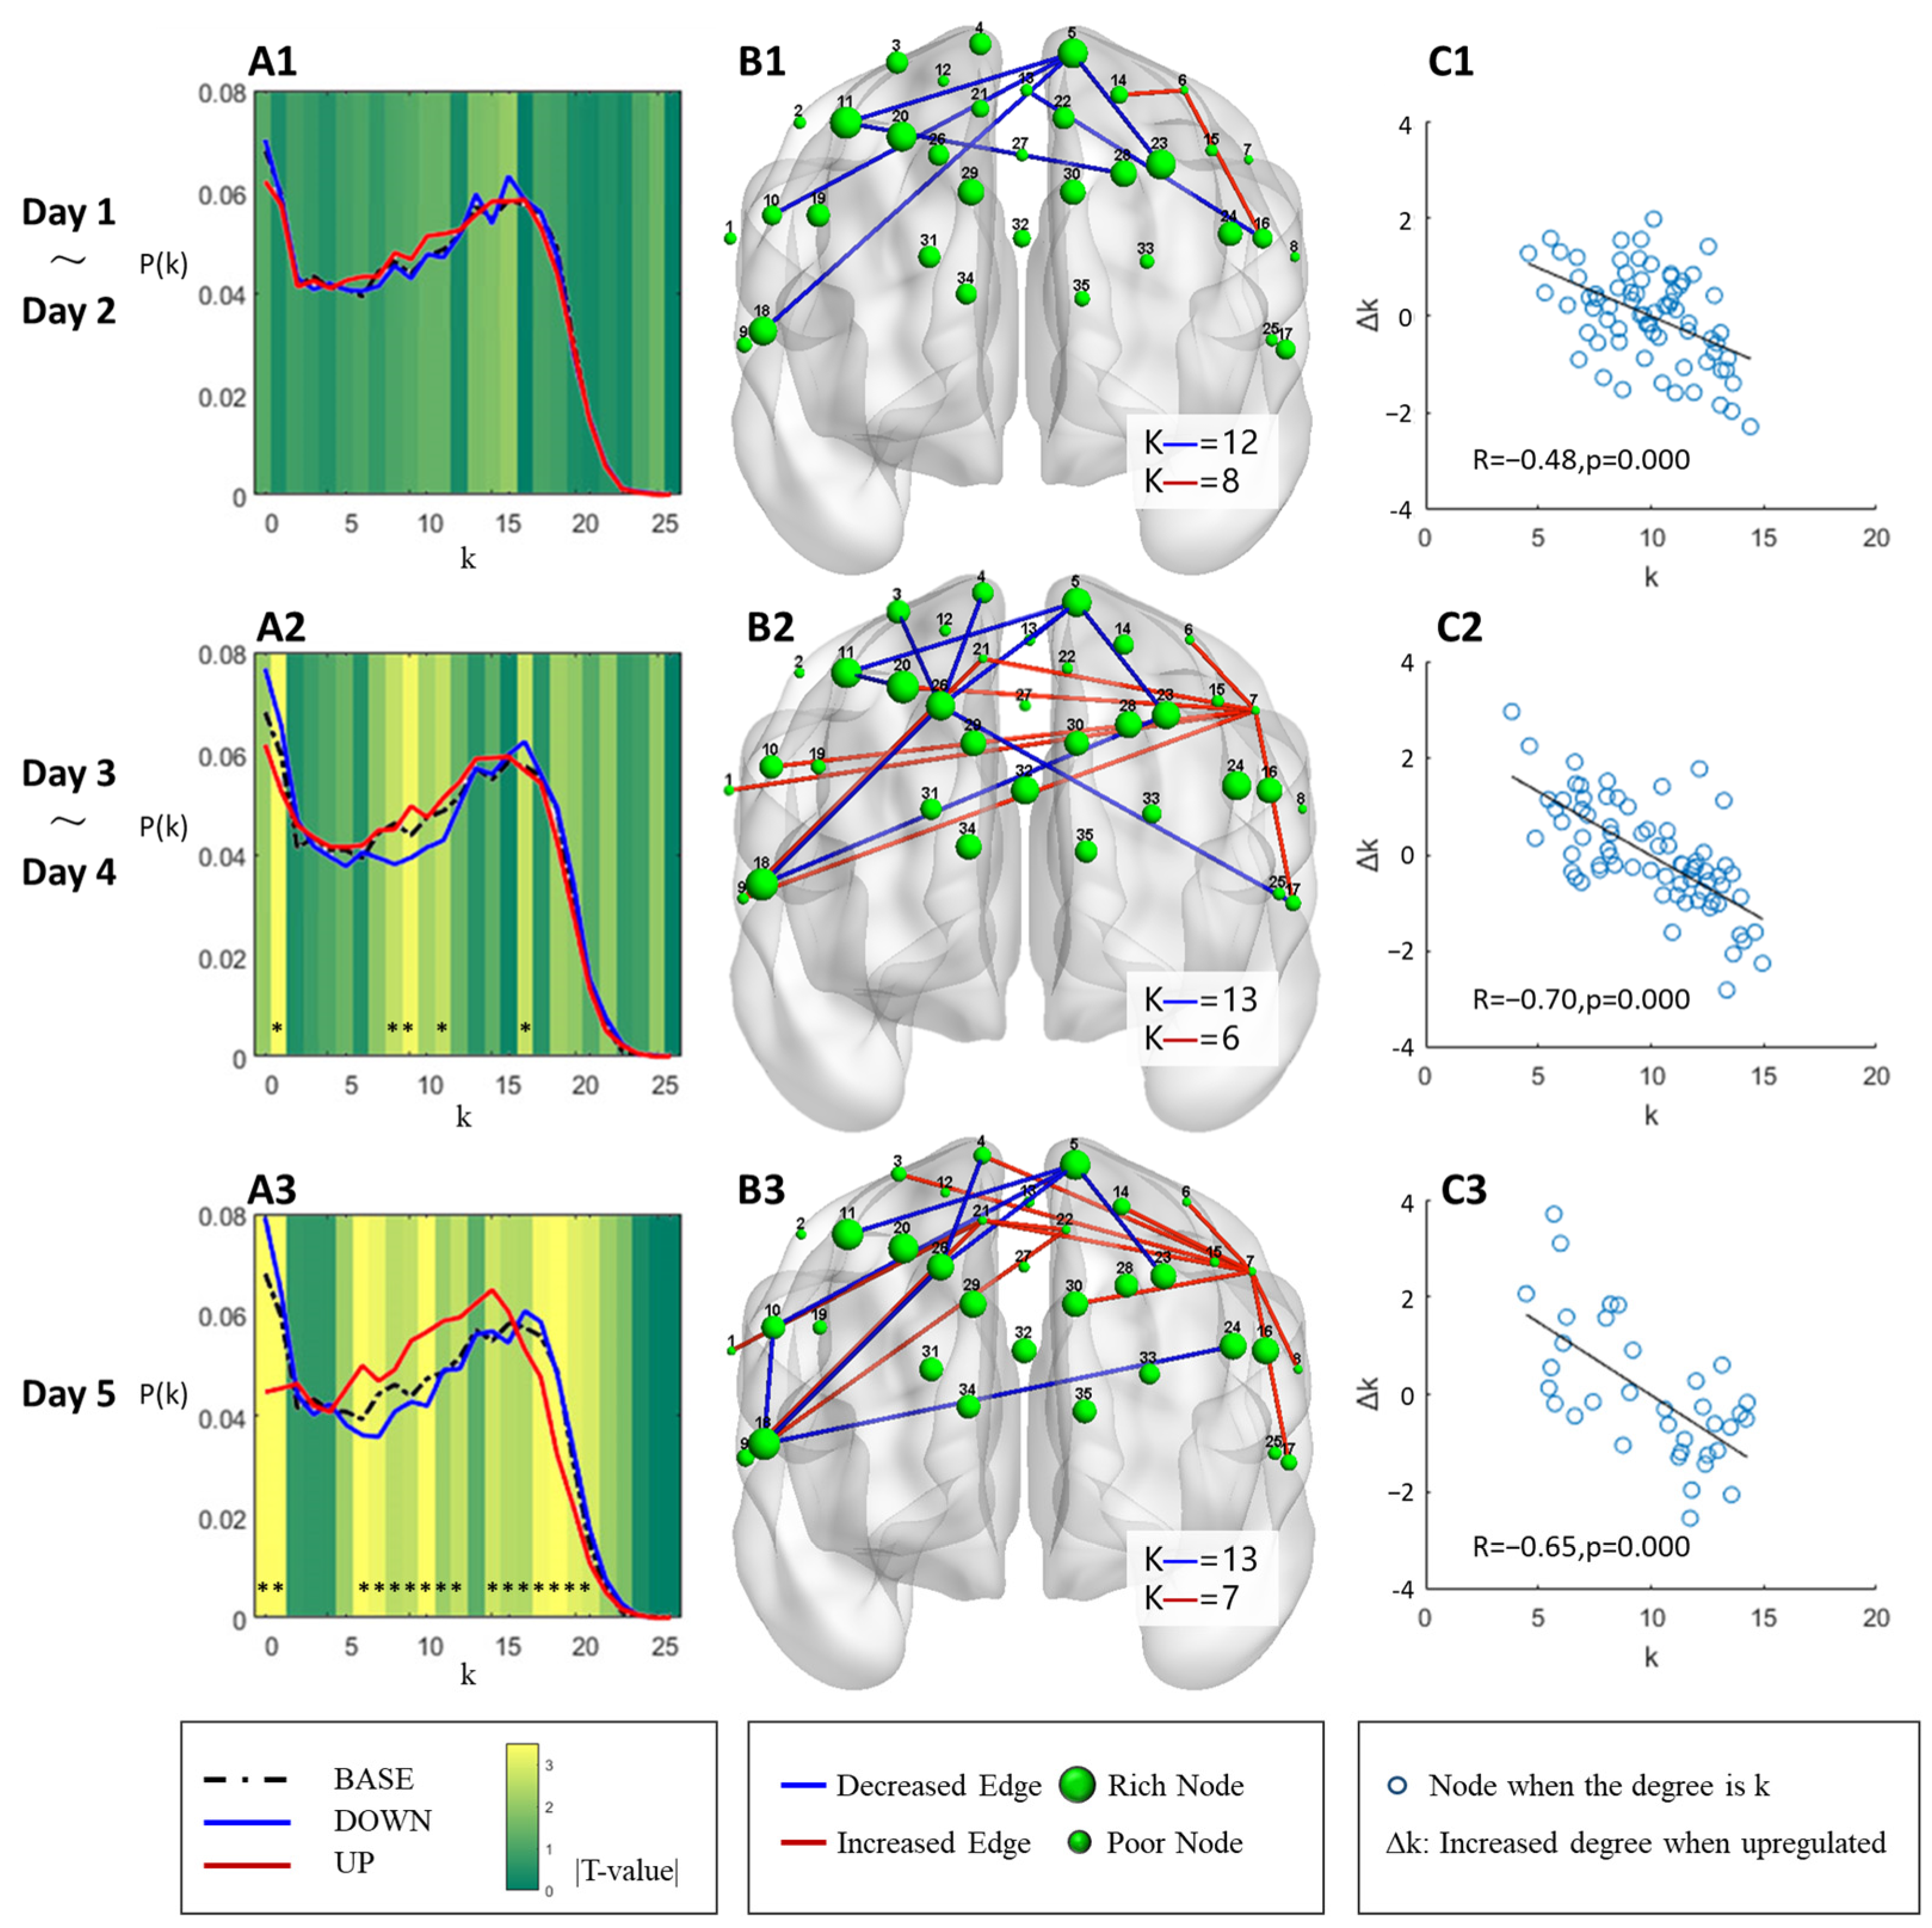
3.4. Degree Distribution and Edge Analysis
3.5. Inference on the Evolution of the Brain Network
4. Discussion
4.1. Reducing the Randomness of the Brain Network Accompanied by Improved Inhibitory Control
4.2. Changes in the Small-World Brain Network and Causal Inference
4.3. Limitations
5. Conclusions
Author Contributions
Funding
Institutional Review Board Statement
Informed Consent Statement
Data Availability Statement
Acknowledgments
Conflicts of Interest
References
- Bassett, D.S.; Bullmore, E.T. Small-world brain networks revisited. Neurosci. A Rev. J. Bringing Neurobiol. Neurol. Psychiatry 2016, 23, 499–516. [Google Scholar] [CrossRef]
- Bassett, D.S.; Bullmore, E. Small-world brain networks. Neuroscientist 2006, 12, 512–523. [Google Scholar] [CrossRef]
- Meunier, D.; Lambiotte, R.; Bullmore, E.T. Modular and hierarchically modular organization of brain networks. Front. Neurosci. 2010, 4, 200. [Google Scholar] [CrossRef] [PubMed]
- Cao, M.; Shu, N.; Cao, Q.; Wang, Y.; He, Y. Imaging functional and structural brain connectomics in attention-deficit/hyperactivity disorder. Mol. Neurobiol. 2014, 50, 1111–1123. [Google Scholar] [CrossRef] [PubMed]
- Cao, Q.; Shu, N.; An, L.; Wang, P.; Sun, L.; Xia, M.R.; Wang, J.-H.; Gong, G.-L.; Zang, Y.-F.; Wang, Y.-F. Probabilistic diffusion tractography and graph theory analysis reveal abnormal white matter structural connectivity networks in drug-naive boys with attention deficit/hyperactivity disorder. J. Neurosci. 2013, 33, 10676–10687. [Google Scholar] [CrossRef] [PubMed]
- Wang, L.; Zhu, C.; He, Y.; Zang, Y.; Cao, Q.; Zhang, H.; Zhong, Q.; Wang, Y. Altered small-world brain functional networks in children with attention-deficit/hyperactivity disorder. Hum. Brain Mapp. 2009, 30, 638–649. [Google Scholar] [CrossRef] [PubMed]
- Zhang, J.; Lin, X.; Fu, G.; Sai, L.; Chen, H.; Yang, J.; Wang, M.; Liu, Q.; Yang, G.; Zhang, J.; et al. Mapping the small-world properties of brain networks in deception with functional near-infrared spectroscopy. Sci. Rep. 2016, 6, 25297. [Google Scholar] [CrossRef]
- Baumeister, R.F.; Vohs, K.D.; Tice, D.M. The strength model of self-control. Curr. Dir. Psychol. Sci. 2007, 16, 351–355. [Google Scholar] [CrossRef]
- Diamond, A. Executive functions. Annu. Rev. Psychol. 2013, 64, 135–168. [Google Scholar] [CrossRef]
- Oaten, M.; Cheng, K. Improved self-control: The benefits of a regular program of academic study. Basic Appl. Soc. Psychol. 2006, 28, 1–16. [Google Scholar] [CrossRef]
- Liao, X.; Vasilakos, A.V.; He, Y. Small-world human brain networks: Perspectives and challenges. Neurosci. Biobehav. Rev. 2017, 77, 286–300. [Google Scholar] [CrossRef] [PubMed]
- Kohl, S.H.; Mehler, D.M.A.; Lührs, M.; Thibault, R.T.; Sorger, B. The potential of functional near-infrared spectroscopy-based neurofeedback—A systematic review and recommendations for best practice. Front. Neurosci. 2020, 14, 594. [Google Scholar] [CrossRef] [PubMed]
- Viviani, G.; Vallesi, A. EEG-neurofeedback and executive function enhancement in healthy adults: A systematic review. Psychophysiology 2021, 58, e13874. [Google Scholar] [CrossRef]
- Sulzer, J.; Haller, S.; Scharnowski, F.; Weiskopf, N.; Birbaumer, N.; Blefari, M.L.; Bruehl, A.; Cohen, L.; Decharms, R.; Gassert, R.; et al. Real-time FMRI neurofeedback: Progress and challenges. Neuroimage 2013, 76, 386–399. [Google Scholar] [CrossRef] [PubMed]
- Shibata, K.; Watanabe, T.; Sasaki, Y.; Kawato, M. Perceptual learning incepted by decoded FMRI neurofeedback without stimulus presentation. Science 2011, 334, 1413–1415. [Google Scholar] [CrossRef]
- Sitaram, R.; Ros, T.; Stoeckel, L.; Haller, S.; Scharnowski, F.; Lewis-Peacock, J.; Weiskopf, N.; Blefari, M.L.; Rana, M.; Oblak, E.; et al. Closed-loop brain training: The science of neurofeedback. Nat. Rev. Neurosci. 2017, 18, 86–100. [Google Scholar] [CrossRef] [PubMed]
- Birbaumer, N.; Ruiz, S.; Sitaram, R. Learned regulation of brain metabolism. Trends Cogn. Sci. 2013, 17, 295–302. [Google Scholar] [CrossRef]
- Herrmann, C.S.; Strüber, D.; Helfrich, R.F.; Engel, A.K. EEG oscillations: From correlation to causality. Int. J. Psychophysiol. 2016, 103, 12–21. [Google Scholar] [CrossRef]
- Siddiqi, S.H.; Kording, K.P.; Parvizi, J.; Fox, M.D. Causal mapping of human brain function. Nature reviews. Neuroscience 2022, 23, 361–375. [Google Scholar] [CrossRef] [PubMed]
- Brühl, A.B.; Scherpiet, S.; Sulzer, J.; Stämpfli, P.; Seifritz, E.; Herwig, U. Real-time neurofeedback using functional MRI could improve down-regulation of amygdala activity during emotional stimulation: A proof-of-concept study. Brain Topogr. 2014, 27, 138–148. [Google Scholar] [CrossRef]
- Ramot, M.; Kimmich, S.; Gonzalez-Castillo, J.; Roopchansingh, V.; Popal, H.; White, E.; Gotts, S.J.; Martin, A. Direct modulation of aberrant brain network connectivity through real-time neurofeedback. eLife 2017, 6, e28974. [Google Scholar] [CrossRef]
- Xia, M.; Xu, P.; Yang, Y.; Jiang, W.; Wang, Z.; Gu, X.; Yang, M.; Li, D.; Li, S.; Dong, G.; et al. Frontoparietal connectivity neurofeedback training for promotion of working memory: An fNIRS study in healthy male participants. IEEE Access 2021, 9, 62316–62331. [Google Scholar] [CrossRef]
- Konicar, L.; Veit, R.; Eisenbarth, H.; Barth, B.; Tonin, P.; Strehl, U.; Birbaumer, N. Brain self-regulation in criminal psychopaths. Sci. Rep. 2015, 5, 9426. [Google Scholar] [CrossRef] [PubMed]
- Raine, A. Autonomic nervous system factors underlying disinhibited, antisocial, and violent behavior. Biosocial perspectives and treatment implications. Ann. N. Y. Acad. Sci. 2010, 794, 46–59. [Google Scholar] [CrossRef]
- Rubia, K.; Criaud, M.; Wulff, M.; Alegria, A.; Brinson, H.; Barker, G.; Stahl, D.; Giampietro, V. Functional connectivity changes associated with FMRI neurofeedback of right inferior frontal cortex in adolescents with ADHD. Neuroimage 2019, 188, 43–58. [Google Scholar] [CrossRef]
- Beauchamp, K.G.; Kahn, L.E.; Berkman, E.T. Does inhibitory control training transfer?: Behavioral and neural effects on an untrained emotion regulation task. Soc. Cogn. Affect. Neurosci. 2016, 11, 1374–1382. [Google Scholar] [CrossRef] [PubMed]
- Tang, Y.; Chen, Z.; Jiang, Y.; Zhu, C.; Chen, A. From reversal to normal: Robust improvement in conflict adaptation through real-time functional near infrared spectroscopy-based neurofeedback training. Neuropsychologia 2021, 157, 107866. [Google Scholar] [CrossRef] [PubMed]
- Li, K.; Jiang, Y.; Gong, Y.; Zhao, W.; Zhao, Z.; Liu, X.; Kendrick, K.M.; Zhu, C.; Becker, B. Functional near-infrared spectroscopy (fNIRS) informed neurofeedback: Regional-specific modulation of lateral orbitofrontal activation and cognitive flexibility. Neurophotonics 2019, 6, 025011. [Google Scholar] [CrossRef]
- Thiebaut De Schotten, M.; Forkel, S.J. The emergent properties of the connected brain. Science 2022, 378, 505–510. [Google Scholar] [CrossRef]
- Humphries, M.D.; Gurney, K. Network ‘small-world-ness’: A quantitative method for determining canonical network equivalence. PLoS ONE 2008, 3, e2051. [Google Scholar] [CrossRef]
- Sydnor, V.J.; Larsen, B.; Seidlitz, J.; Adebimpe, A.; Alexander-Bloch, A.F.; Bassett, D.S.; Bertolero, M.A.; Cieslak, M.; Covitz, S.; Fan, Y.; et al. Intrinsic activity development unfolds along a sensorimotor-association cortical axis in youth. Nat. Neurosci. 2023, 26, 638–649. [Google Scholar] [CrossRef] [PubMed]
- Menon, V.; D’Esposito, M. The role of PFC networks in cognitive control and executive function. Neuropsychopharmacology 2022, 47, 90–103. [Google Scholar] [CrossRef] [PubMed]
- Yamashita, A.; Hayasaka, S.; Kawato, M.; Imamizu, H. Connectivity neurofeedback training can differentially change functional connectivity and cognitive performance. Cereb. Cortex 2017, 27, 4960–4970. [Google Scholar] [CrossRef]
- Da Silva, J.C.; De Souza, M.L. Neurofeedback training for cognitive performance improvement in healthy subjects: A systematic review. Psychol. Neurosci. 2021, 14, 262. [Google Scholar] [CrossRef]
- Oldfield, R.C. The assessment and analysis of handedness: The edinburgh inventory. Neuropsychologia 1971, 9, 97–113. [Google Scholar] [CrossRef]
- Macduffie, K.E.; Jeff, M.I.; Dickerson, K.C.; Eddington, K.M.; Strauman, T.J.; Alison, A.R. Single session real-time FMRI neurofeedback has a lasting impact on cognitive behavioral therapy strategies. NeuroImage Clin. 2018, 19, 868–875. [Google Scholar] [CrossRef]
- Hart, S.J.; Green, S.R.; Casp, M.; Belger, A. Emotional priming effects during stroop task performance. Neuroimage 2010, 49, 2662–2670. [Google Scholar] [CrossRef]
- Yuan, J.; Xu, S.; Yang, J.; Liu, Q.; Chen, A.; Zhu, L.; Chen, J.; Li, H. Pleasant mood intensifies brain processing of cognitive control: ERP correlates. Biol. Psychol. 2011, 87, 17–24. [Google Scholar] [CrossRef]
- Constantinescu, A.C.; Wolters, M.; Moore, A.B.; Macpherson, S. A cluster-based approach to selecting representative stimuli from the international affective picture system (iaps) database. Behav. Res. Methods 2016, 49, 896–912. [Google Scholar] [CrossRef] [PubMed]
- Tyng, C.M.; Amin, H.U.; Saad, M.N.M.; Malik, A.S. The influences of emotion on learning and memory. Front. Psychol. 2017, 8, 1454. [Google Scholar] [CrossRef]
- Wang, J.; Wang, X.; Xia, M.; Liao, X.; Evans, A.; He, Y. Corrigendum: GRETNA: A graph theoretical network analysis toolbox for imaging connectomics. Front. Hum. Neurosci. 2015, 9, 458. [Google Scholar] [CrossRef]
- Huppert, T.J.; Diamond, S.G.; Franceschini, M.A.; Boas, D.A. Homer: A review of time-series analysis methods for near-infrared spectroscopy of the brain. Applied optics. Opt. Technol. Biomed. Opt. 2009, 48, D280. [Google Scholar] [CrossRef]
- Pinti, P.; Scholkmann, F.; Hamilton, A.; Burgess, P.; Tachtsidis, I. Current status and issues regarding pre-processing of fNIRS neuroimaging data: An investigation of diverse signal filtering methods within a general linear model framework. Front. Hum. Neurosci. 2019, 12, 505. [Google Scholar] [CrossRef] [PubMed]
- Chiarelli, A.M.; Perpetuini, D.; Filippini, C.; Cardone, D.; Merla, A. Differential pathlength factor in continuous wave functional near-infrared spectroscopy: Reducing hemoglobin’s cross talk in high-density recordings. Neurophotonics 2019, 6, 035005. [Google Scholar] [CrossRef]
- Benjamini, Y.; Hochberg, Y. On the adaptive control of the false discovery rate in multiple testing with independent statistics. J. Educ. Behav. Stat. 2000, 25, 60–83. [Google Scholar] [CrossRef]
- Cortese, A.; Amano, K.; Koizumi, A.; Lau, H.; Kawato, M. Decoded FMRI neurofeedback can induce bidirectional confidence changes within single participants. Neuroimage 2017, 149, 323–337. [Google Scholar] [CrossRef]
- Shibata, K.; Watanabe, T.; Kawato, M.; Sasaki, Y. Differential activation patterns in the same brain region led to opposite emotional states. PLoS Biol. 2016, 14, e1002546. [Google Scholar] [CrossRef] [PubMed]
- Reuter-Lorenz, P.A.; Park, D.C. How does it STAC up? Revisiting the scaffolding theory of aging and cognition. Neuropsychol. Rev. 2014, 24, 355–370. [Google Scholar] [CrossRef]
- Dravida, S.; Noah, J.A.; Zhang, X.; Hirsch, J. Comparison of oxyhemoglobin and deoxyhemoglobin signal reliability with and without global mean removal for digit manipulation motor tasks. Neurophotonics 2018, 5, 011006. [Google Scholar] [CrossRef]
- Veit, R.; Singh, V.; Sitaram, R.; Caria, A.; Rauss, K.; Birbaumer, N. Using real-time FMRI to learn voluntary regulation of the anterior insula in the presence of threat-related stimuli. Soc. Cogn. Affect. Neurosci. 2012, 7, 623–634. [Google Scholar] [CrossRef]
- DeCharms, R.C.; Maeda, F.; Glover, G.H.; Ludlow, D.; Pauly, J.M.; Soneji, D.; Gabrieli, J.D.E.; Mackey, S.C. Control over brain activation and pain learned by using real-time functional MRI. Proc. Natl. Acad. Sci. USA 2005, 102, 18626–18631. [Google Scholar] [CrossRef]
- Lithari, C.; Frantzidis, C.A.; Papadelis, C.; Klados, M.A.; Pappas, C.; Bamidis, P.D. Small-world properties of brain functional connectivity networks are affected by emotional stimuli. In Proceedings of the 10th IEEE International Conference on Information Technology and Applications in Biomedicine, Corfu, Greece, 3–5 November 2010; pp. 1–4. [Google Scholar] [CrossRef]
- Bullmore, E.; Sporns, O. The economy of brain network organization. Nat. Rev. Neurosci. 2012, 13, 336–349. [Google Scholar] [CrossRef] [PubMed]
- Kitzbichler, M.G.; Henson, R.N.A.; Smith, M.L.; Nathan, P.J.; Bullmore, E.T. Cognitive effort drives workspace configuration of human brain functional networks. J. Neurosci. 2011, 31, 8259–8270. [Google Scholar] [CrossRef]
- Micheloyannis, S.; Pachou, E.; Stam, C.J.; Vourkas, M.; Erimaki, S.; Tsirka, V. Using graph theoretical analysis of multi channel EEG to evaluate the neural efficiency hypothesis. Neurosci. Lett. 2006, 402, 273–277. [Google Scholar] [CrossRef] [PubMed]
- Young, M.P.; Stephan, K.E.; Hilgetag, C.; Burns, G.A.P.C.; O’Neill, M.A.; Young, M.P.; Kotter, R. Computational analysis of functional connectivity between areas of primate cerebral cortex. Philos. Trans. R. Soc. Lond. Ser. B Biol. Sci. 2000, 355, 111–126. [Google Scholar] [CrossRef]
- Wang, X.; Zhao, X.; Jiang, H.; Xi, Q.; Wang, P. Small-worldness of brain fMRI network in patients with mild cognitive impairment. Chin. J. Med. Imaging Technol. 2014, 30, 790–793. [Google Scholar]
- Megumi, F.; Yamashita, A.; Kawato, M.; Imamizu, H. Functional MRI neurofeedback training on connectivity between two regions induces long-lasting changes in intrinsic functional network. Front. Hum. Neurosci. 2015, 9, 160. [Google Scholar] [CrossRef]
- Sporns, O.; Zwi, J.D. The small world of the cerebral cortex. Neuroinformatics 2004, 2, 145–162. [Google Scholar] [CrossRef] [PubMed]
- Barahona, M.; Pecora, L.M. Synchronization in small-world systems. Phys. Rev. Lett. 2002, 89, 054101. [Google Scholar] [CrossRef] [PubMed]
- Hong, H.; Choi, M.Y.; Kim, B.J. Synchronization on small-world networks. Phys. Rev. E 2002, 65, 26139. [Google Scholar] [CrossRef] [PubMed]
- Lago-Fernandez, L.F.; Huerta, R.; Corbacho, F.; Siguenza, J.A. Fast response and temporal coding on coherent oscillations in small-world networks. arXiv 1999, arXiv:9909379. [Google Scholar]
- Gallos, L.K.; Sigman, M.; Makse, H.A. The conundrum of functional brain networks: Small-world efficiency or fractal modularity. Front. Physiol. 2012, 3, 123. [Google Scholar] [CrossRef] [PubMed]


| Number of Participants | Age (SD) in Years | Education Years (SD) | |
|---|---|---|---|
| DOWN | 17 (10 female) | 21.53 (2.00) | 15.24 (1.78) |
| UP | 17 (9 females) | 20.82 (1.55) | 14.36 (1.56) |
| p-Value | -- | 0.26 | 0.13 |
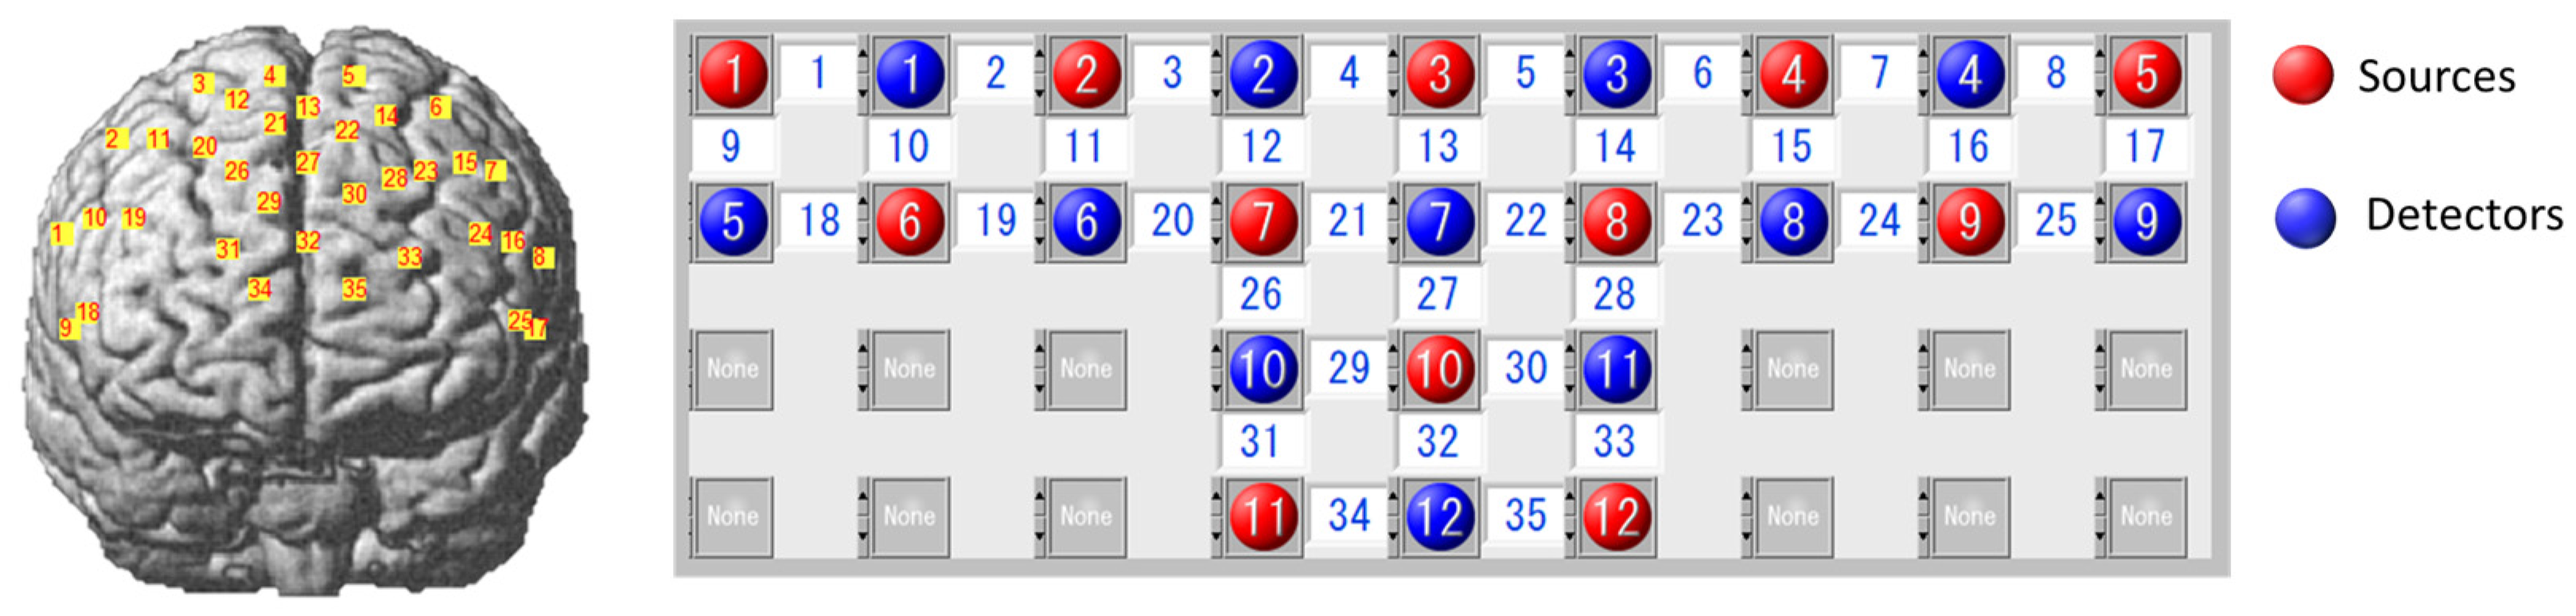
| Brodmann Area | Right Hemisphere | Left Hemisphere |
|---|---|---|
| Dorsolateral prefrontal cortex | 1, 10, 18, 19, 29 | 16, 24, 25, 28, 30 |
| Premotor and supplementary motor cortex | 2, 3, 4, 12 | 5, 6, 13 |
| Frontal eye fields | 11, 20, 21, 26 | 7, 14, 15, 22, 23, 27 |
| Pars triangularis Broca’s area | 9 | 8, 17 |
| Frontopolar area | 31, 34 | 32, 33, 35 |
| Parameter | Value |
|---|---|
| Type of matrix sign | Absolute |
| Method of thresholding | Sparsity |
| Threshold sequence | 0.3 |
| Type of network | Binary |
| Number of random networks | 30 |
| Algorithm to estimate clustering coefficient | 1 |
Disclaimer/Publisher’s Note: The statements, opinions and data contained in all publications are solely those of the individual author(s) and contributor(s) and not of MDPI and/or the editor(s). MDPI and/or the editor(s) disclaim responsibility for any injury to people or property resulting from any ideas, methods, instructions or products referred to in the content. |
© 2023 by the authors. Licensee MDPI, Basel, Switzerland. This article is an open access article distributed under the terms and conditions of the Creative Commons Attribution (CC BY) license (https://creativecommons.org/licenses/by/4.0/).
Share and Cite
Zeng, L.; Wang, C.; Sun, K.; Pu, Y.; Gao, Y.; Wang, H.; Liu, X.; Wen, Z. Upregulation of a Small-World Brain Network Improves Inhibitory Control: An fNIRS Neurofeedback Training Study. Brain Sci. 2023, 13, 1516. https://doi.org/10.3390/brainsci13111516
Zeng L, Wang C, Sun K, Pu Y, Gao Y, Wang H, Liu X, Wen Z. Upregulation of a Small-World Brain Network Improves Inhibitory Control: An fNIRS Neurofeedback Training Study. Brain Sciences. 2023; 13(11):1516. https://doi.org/10.3390/brainsci13111516
Chicago/Turabian StyleZeng, Lingwei, Chunchen Wang, Kewei Sun, Yue Pu, Yuntao Gao, Hui Wang, Xufeng Liu, and Zhihong Wen. 2023. "Upregulation of a Small-World Brain Network Improves Inhibitory Control: An fNIRS Neurofeedback Training Study" Brain Sciences 13, no. 11: 1516. https://doi.org/10.3390/brainsci13111516