
A Single Session of SMR-Neurofeedback Training Improves Selective Attention Emerging from a Dynamic Structuring of Brain–Heart Interplay

 ,
,
Abstract
:1. Introduction
2. Materials and Methods
2.1. Participants
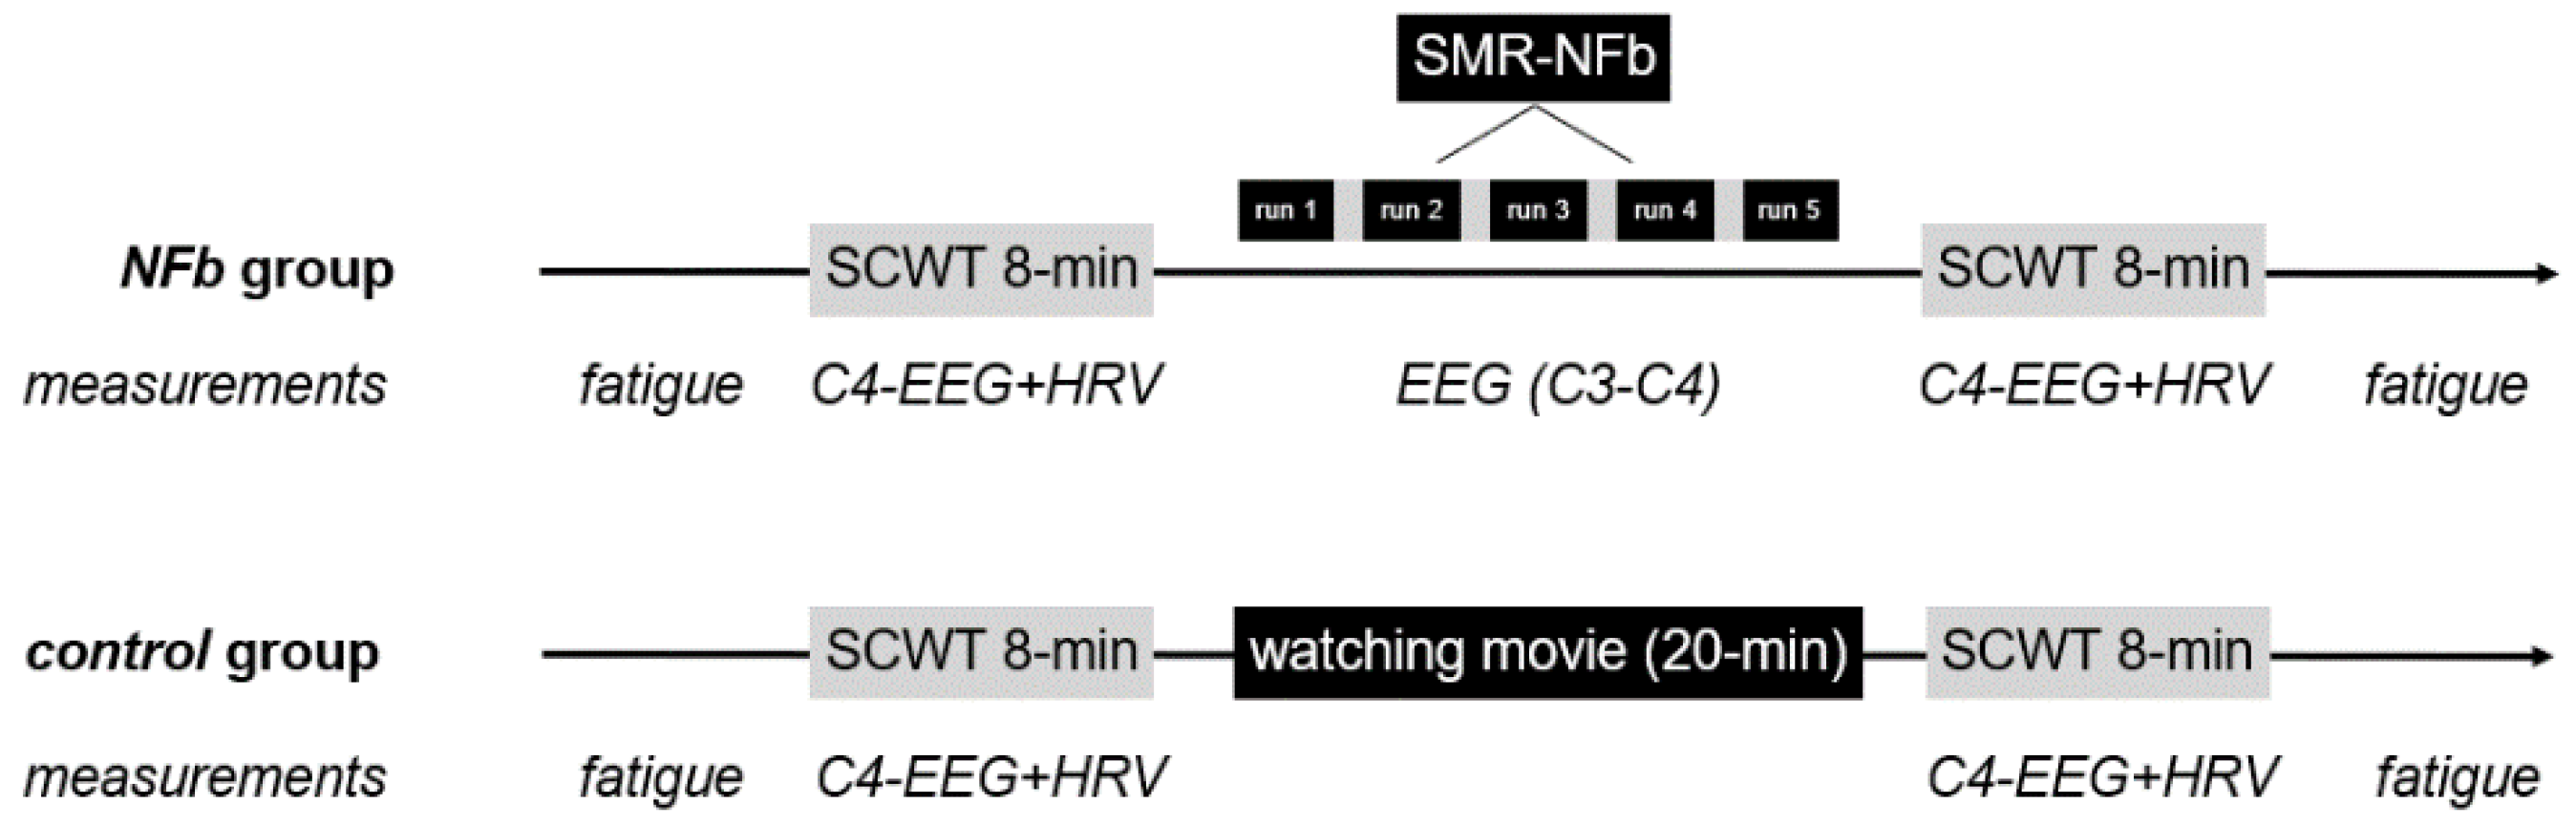
2.2. Procedure
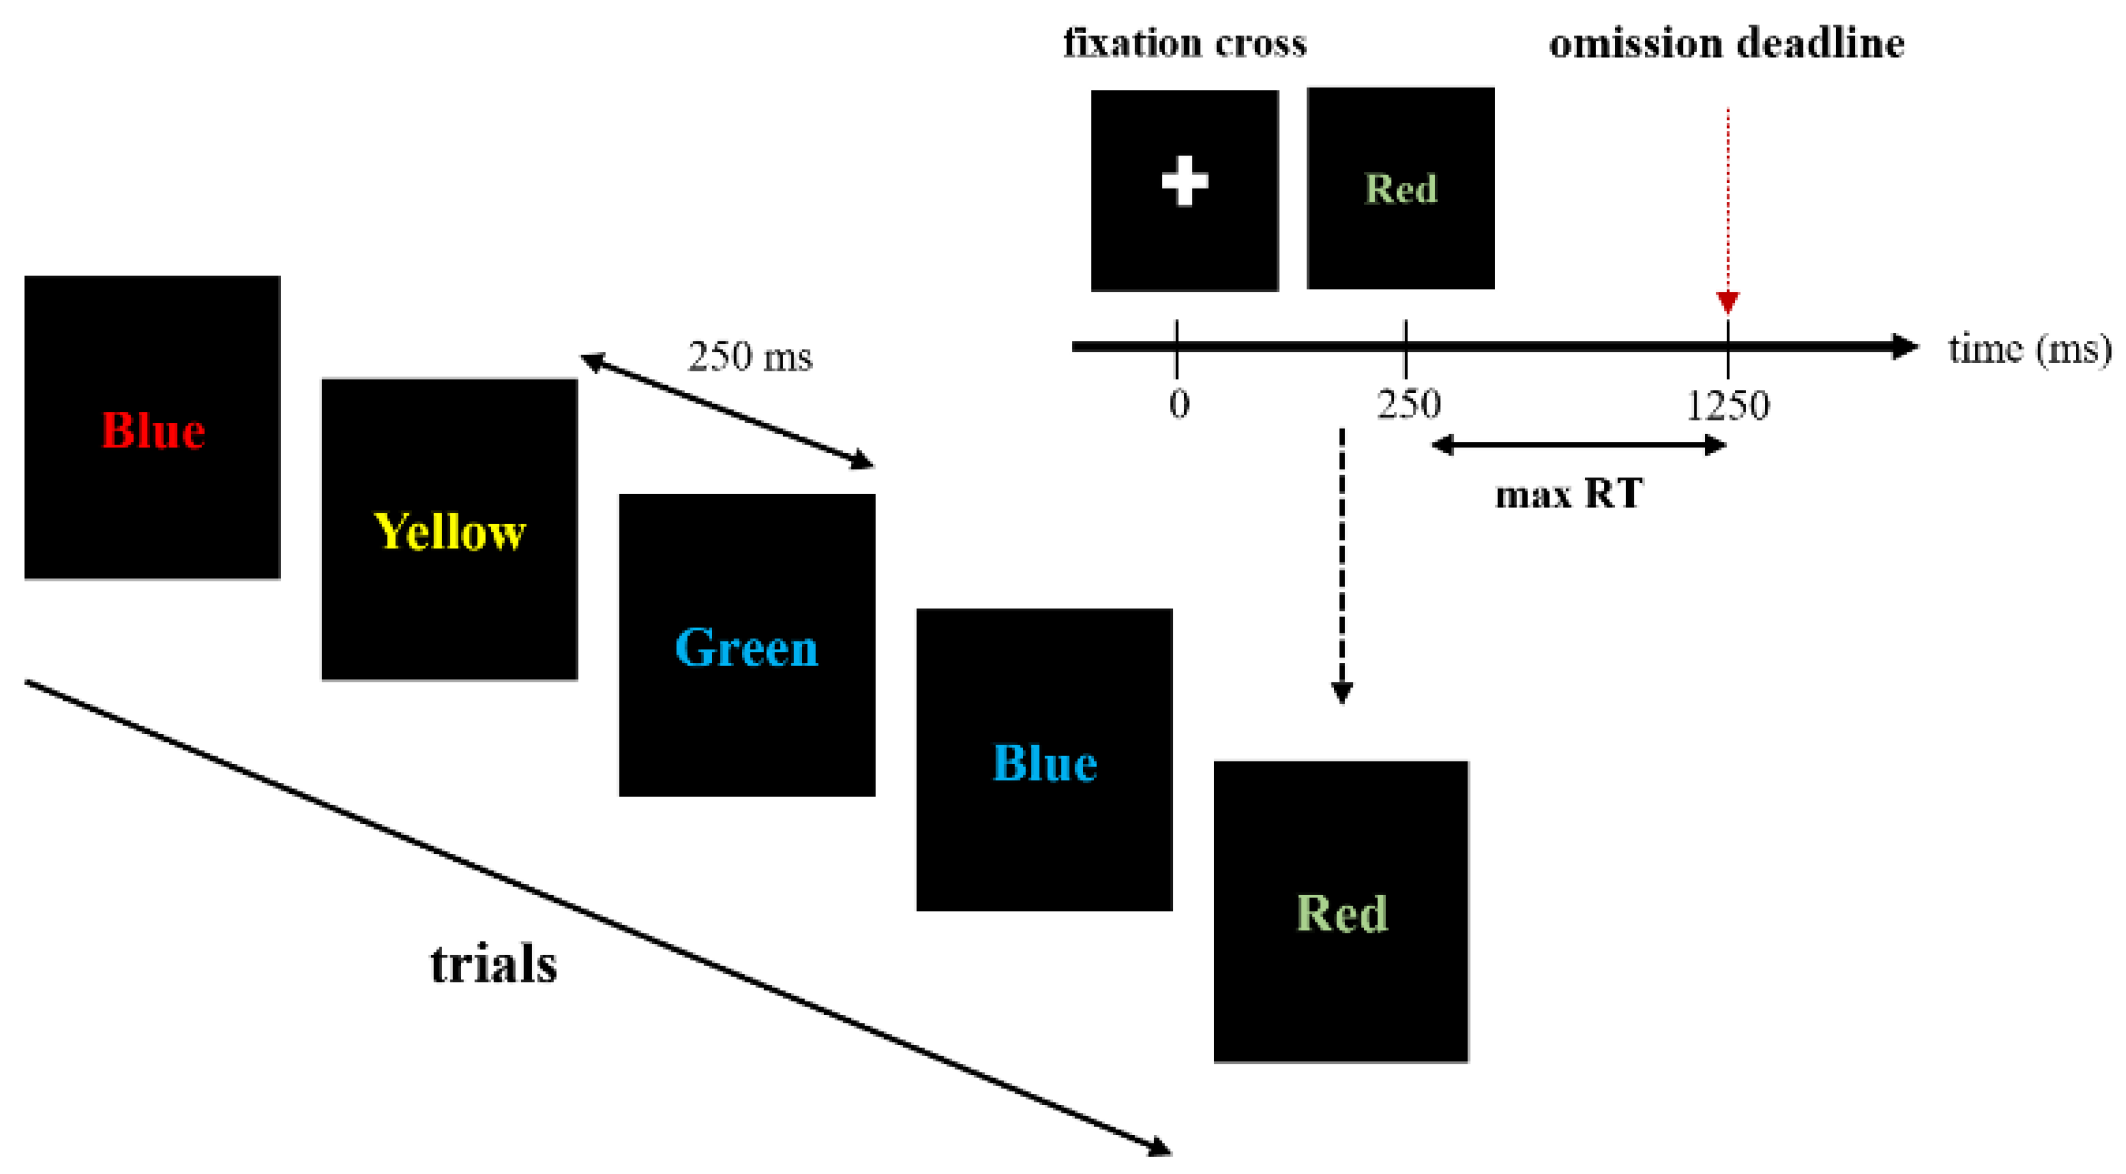
2.3. Stroop Color and Word Test (SCWT)
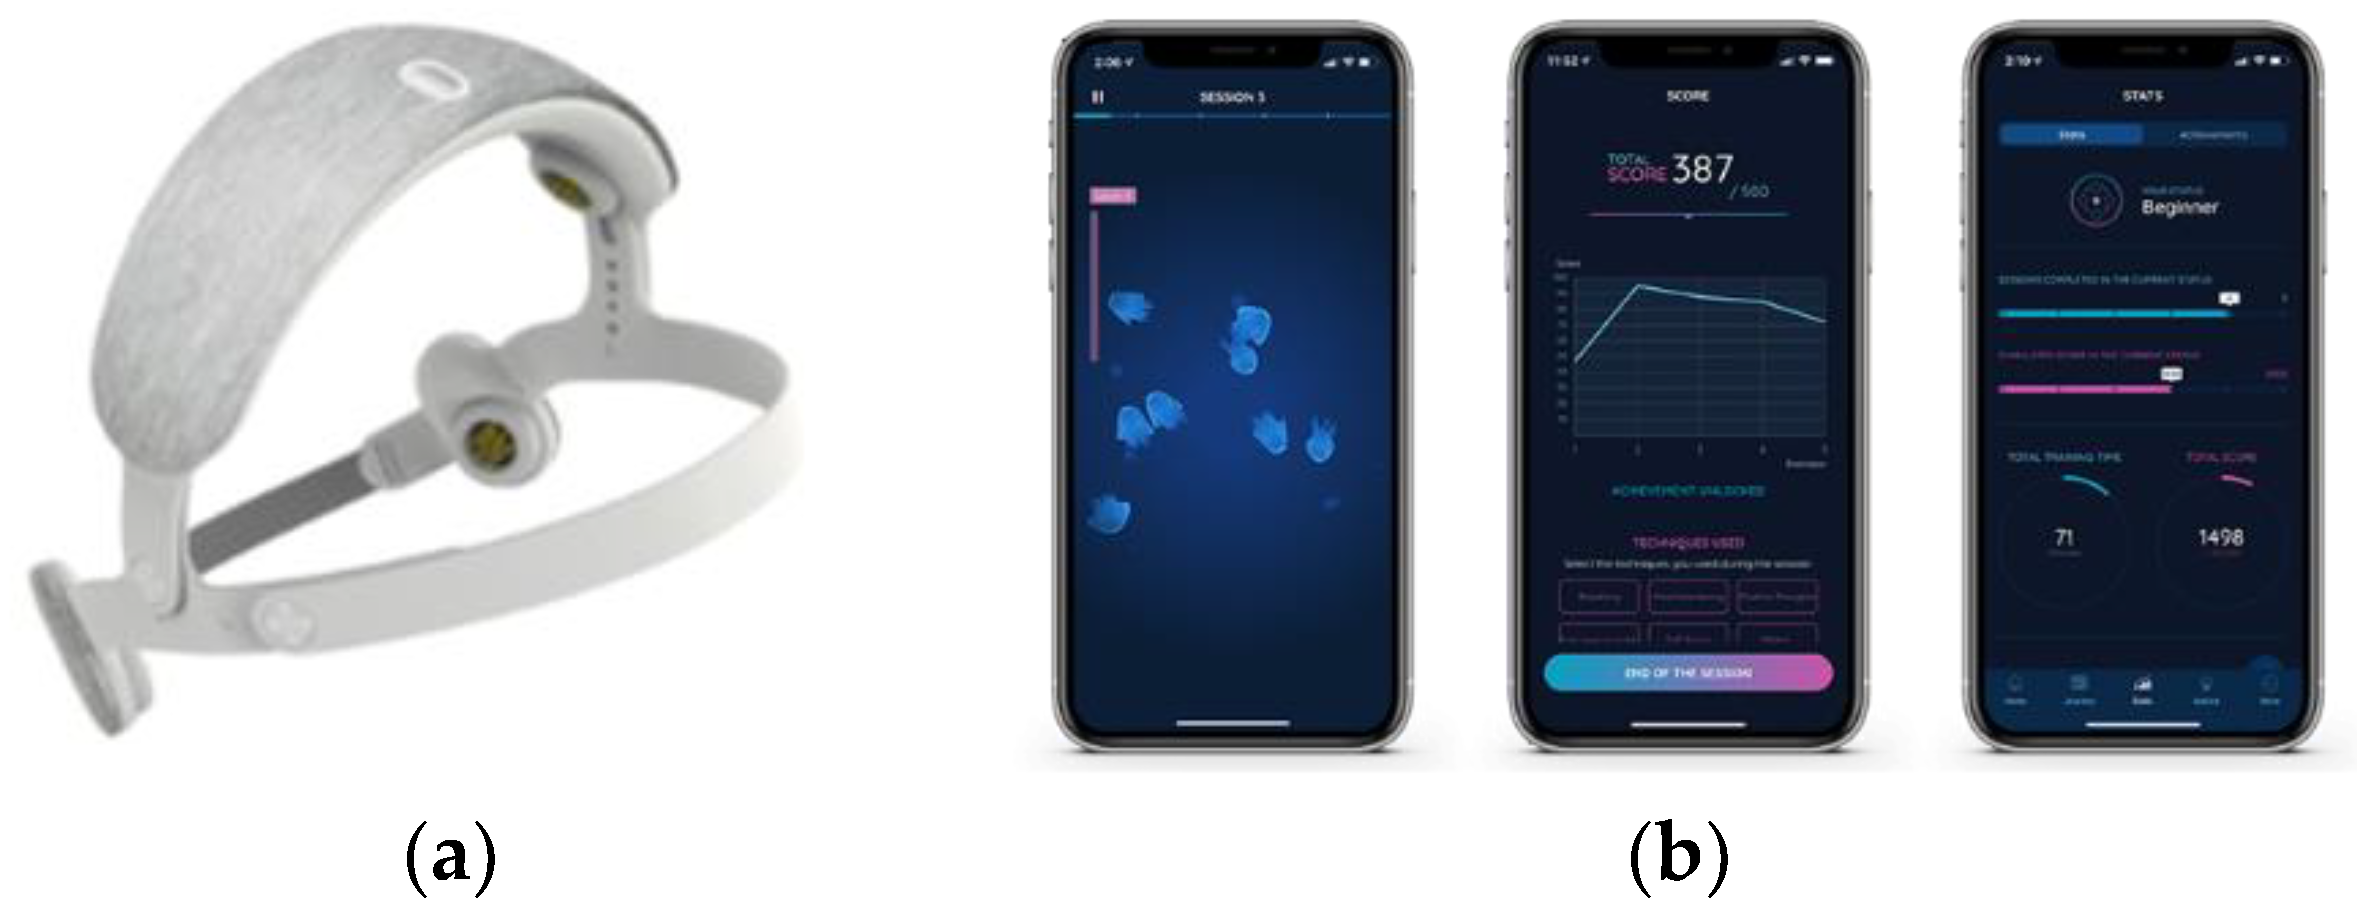
2.4. The Single Neurofeedback Session
2.4.1. Description of SMR Training
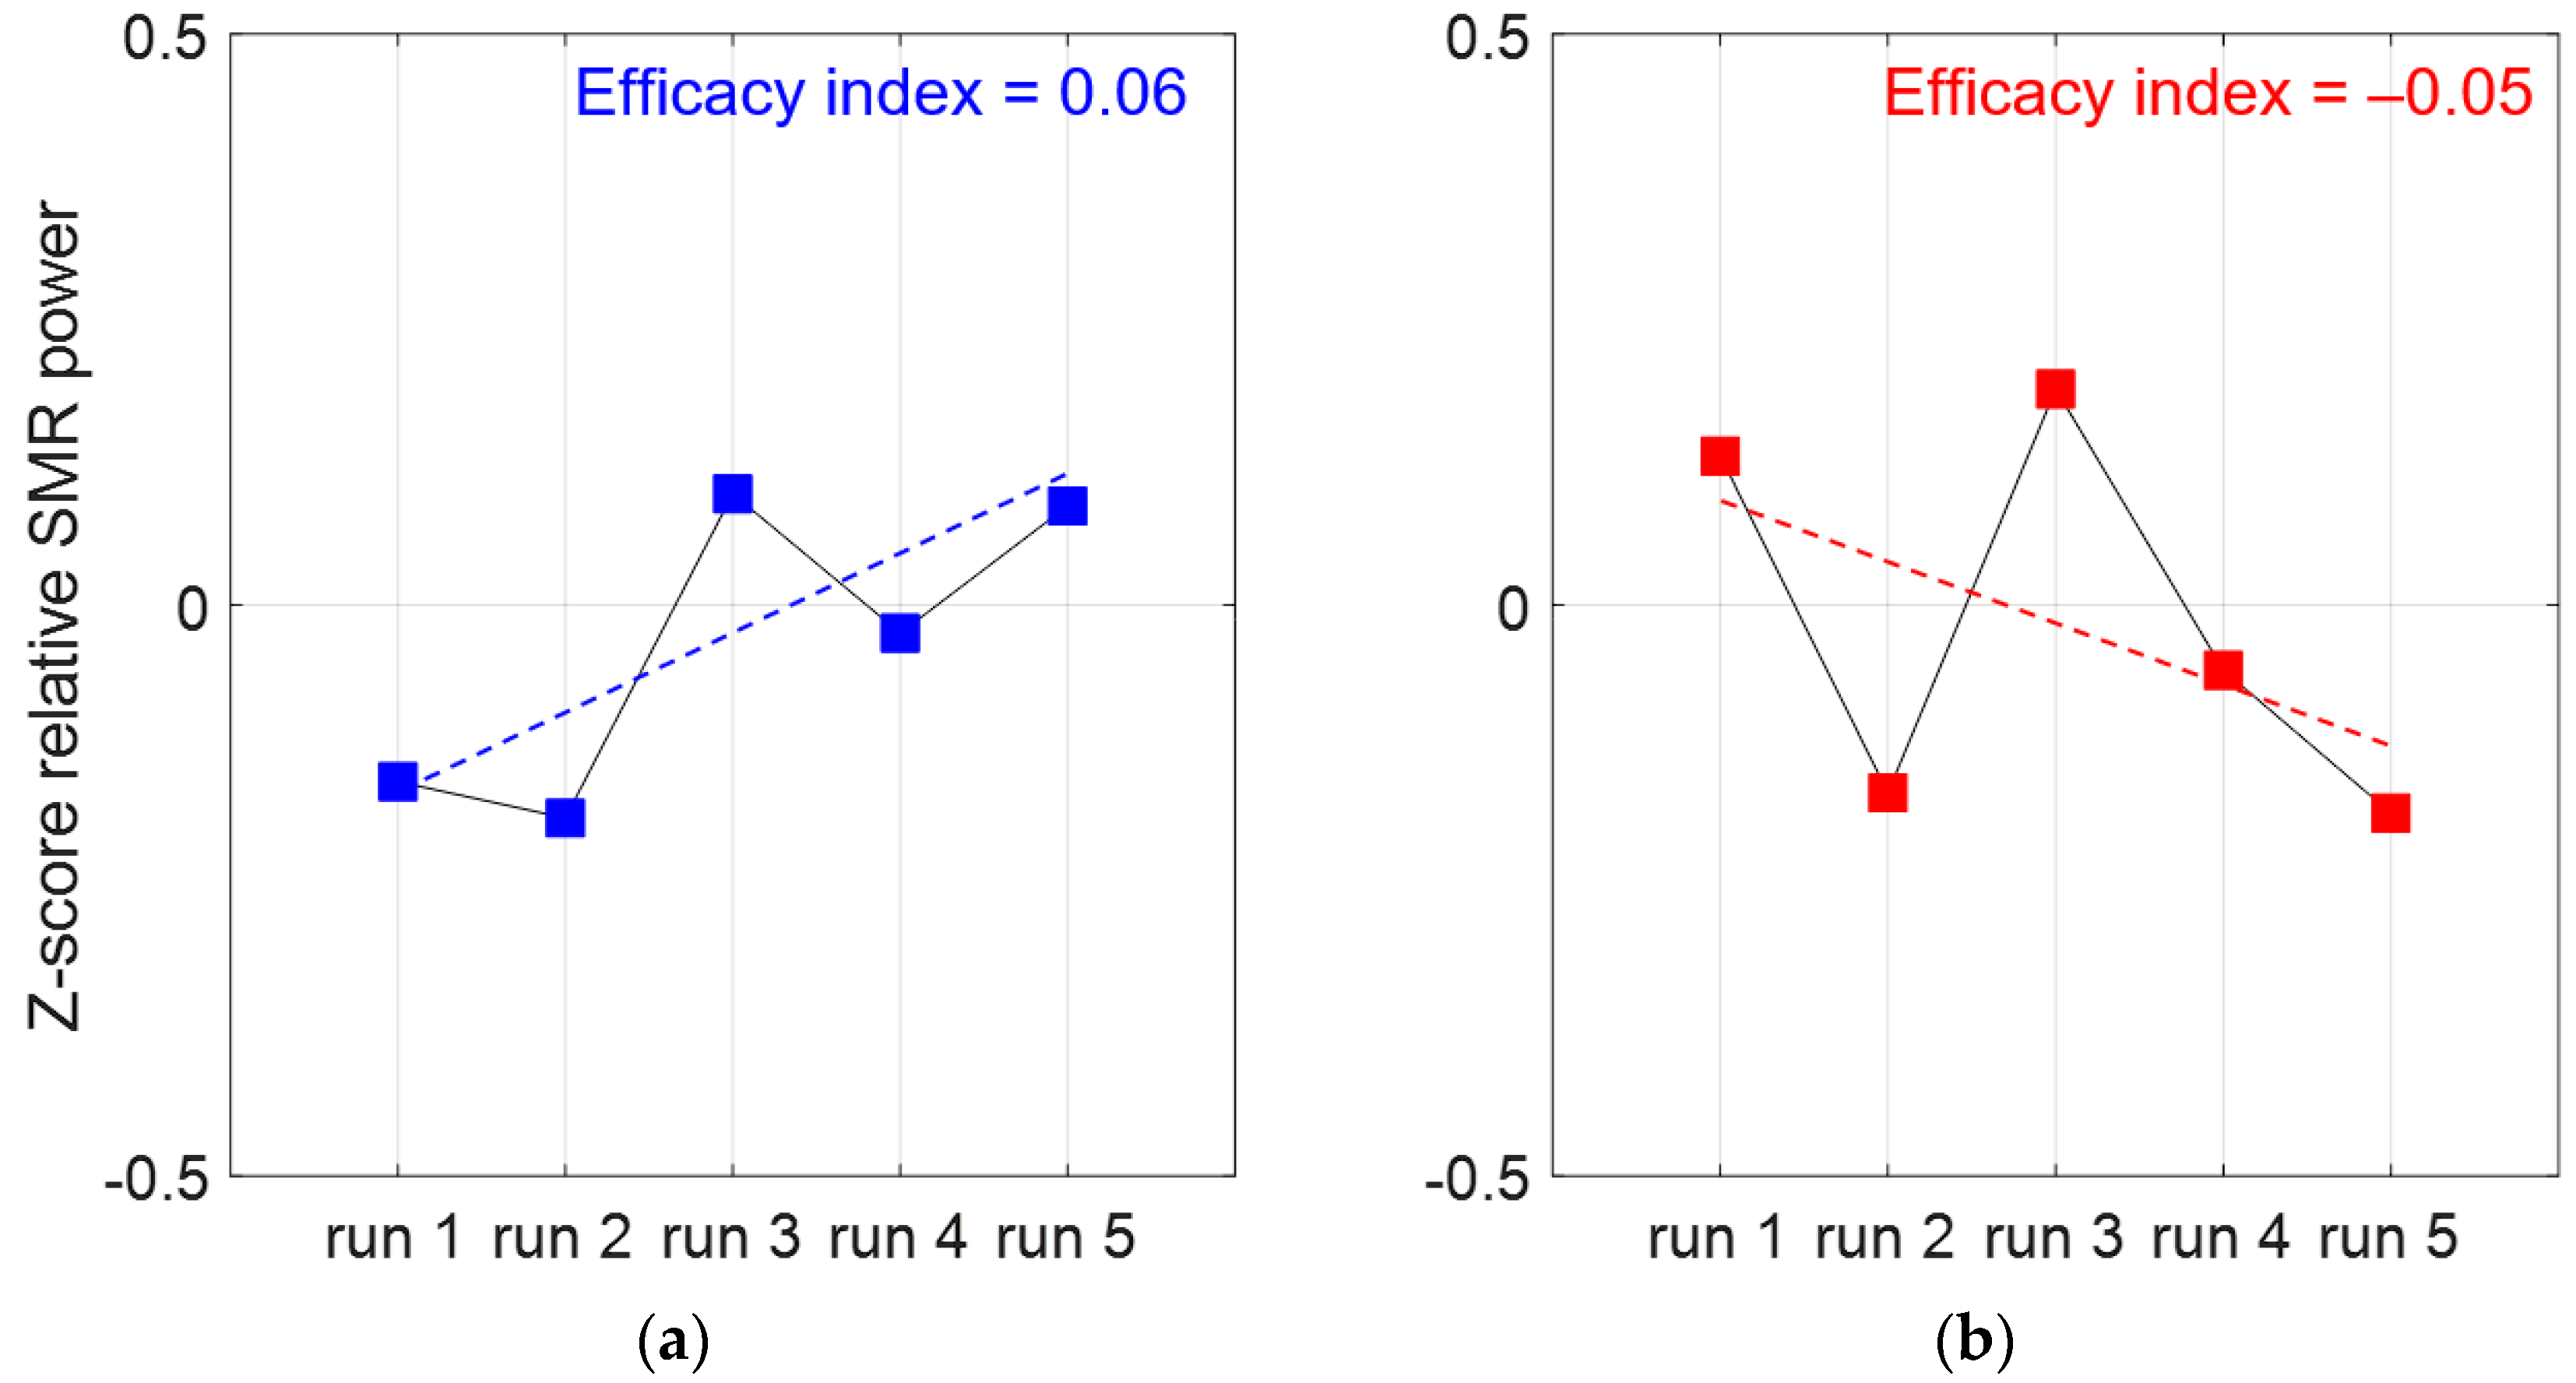
2.4.2. Index of NFb Training Efficacy
2.5. Frequency Domain Analysis of C4-EEG Time Series during SCWT
2.6. HRV: Analysis of RR Time Series
2.6.1. Time and Frequency Domain Analyses of RR Time Series
2.6.2. Entropy in RR Time Series and Their Shuffled Surrogates
2.6.3. Multiscale Multifractality in RR Time Series and Their Phase-Randomized Surrogates
2.7. Statistical Analyses
3. Results
3.1. Index of NFb Efficacy
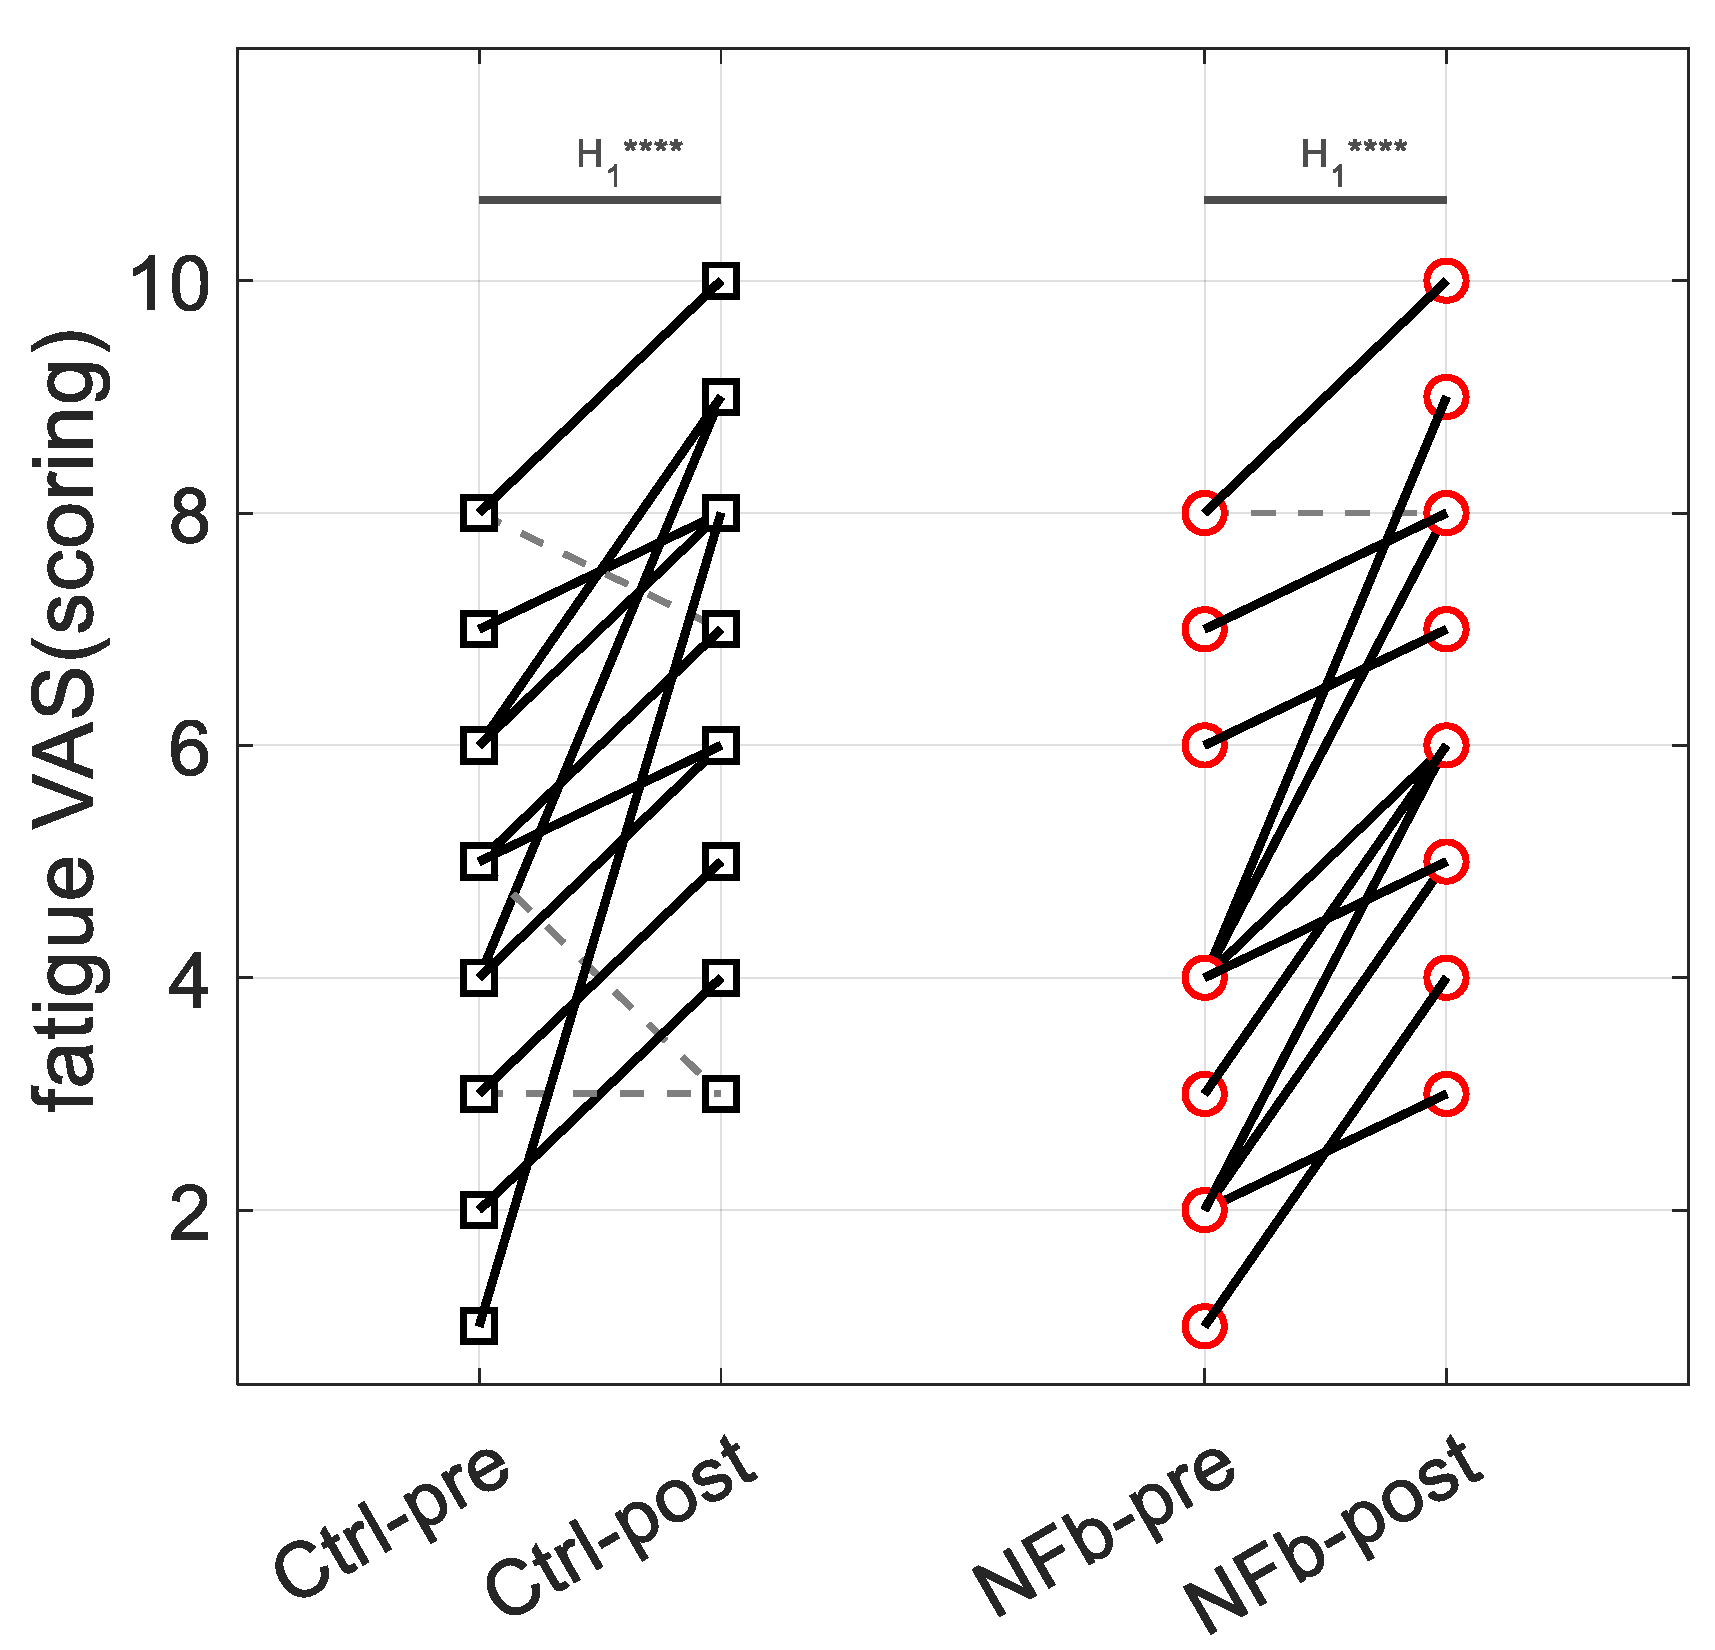
3.2. Self-Reported Feeling of Fatigue
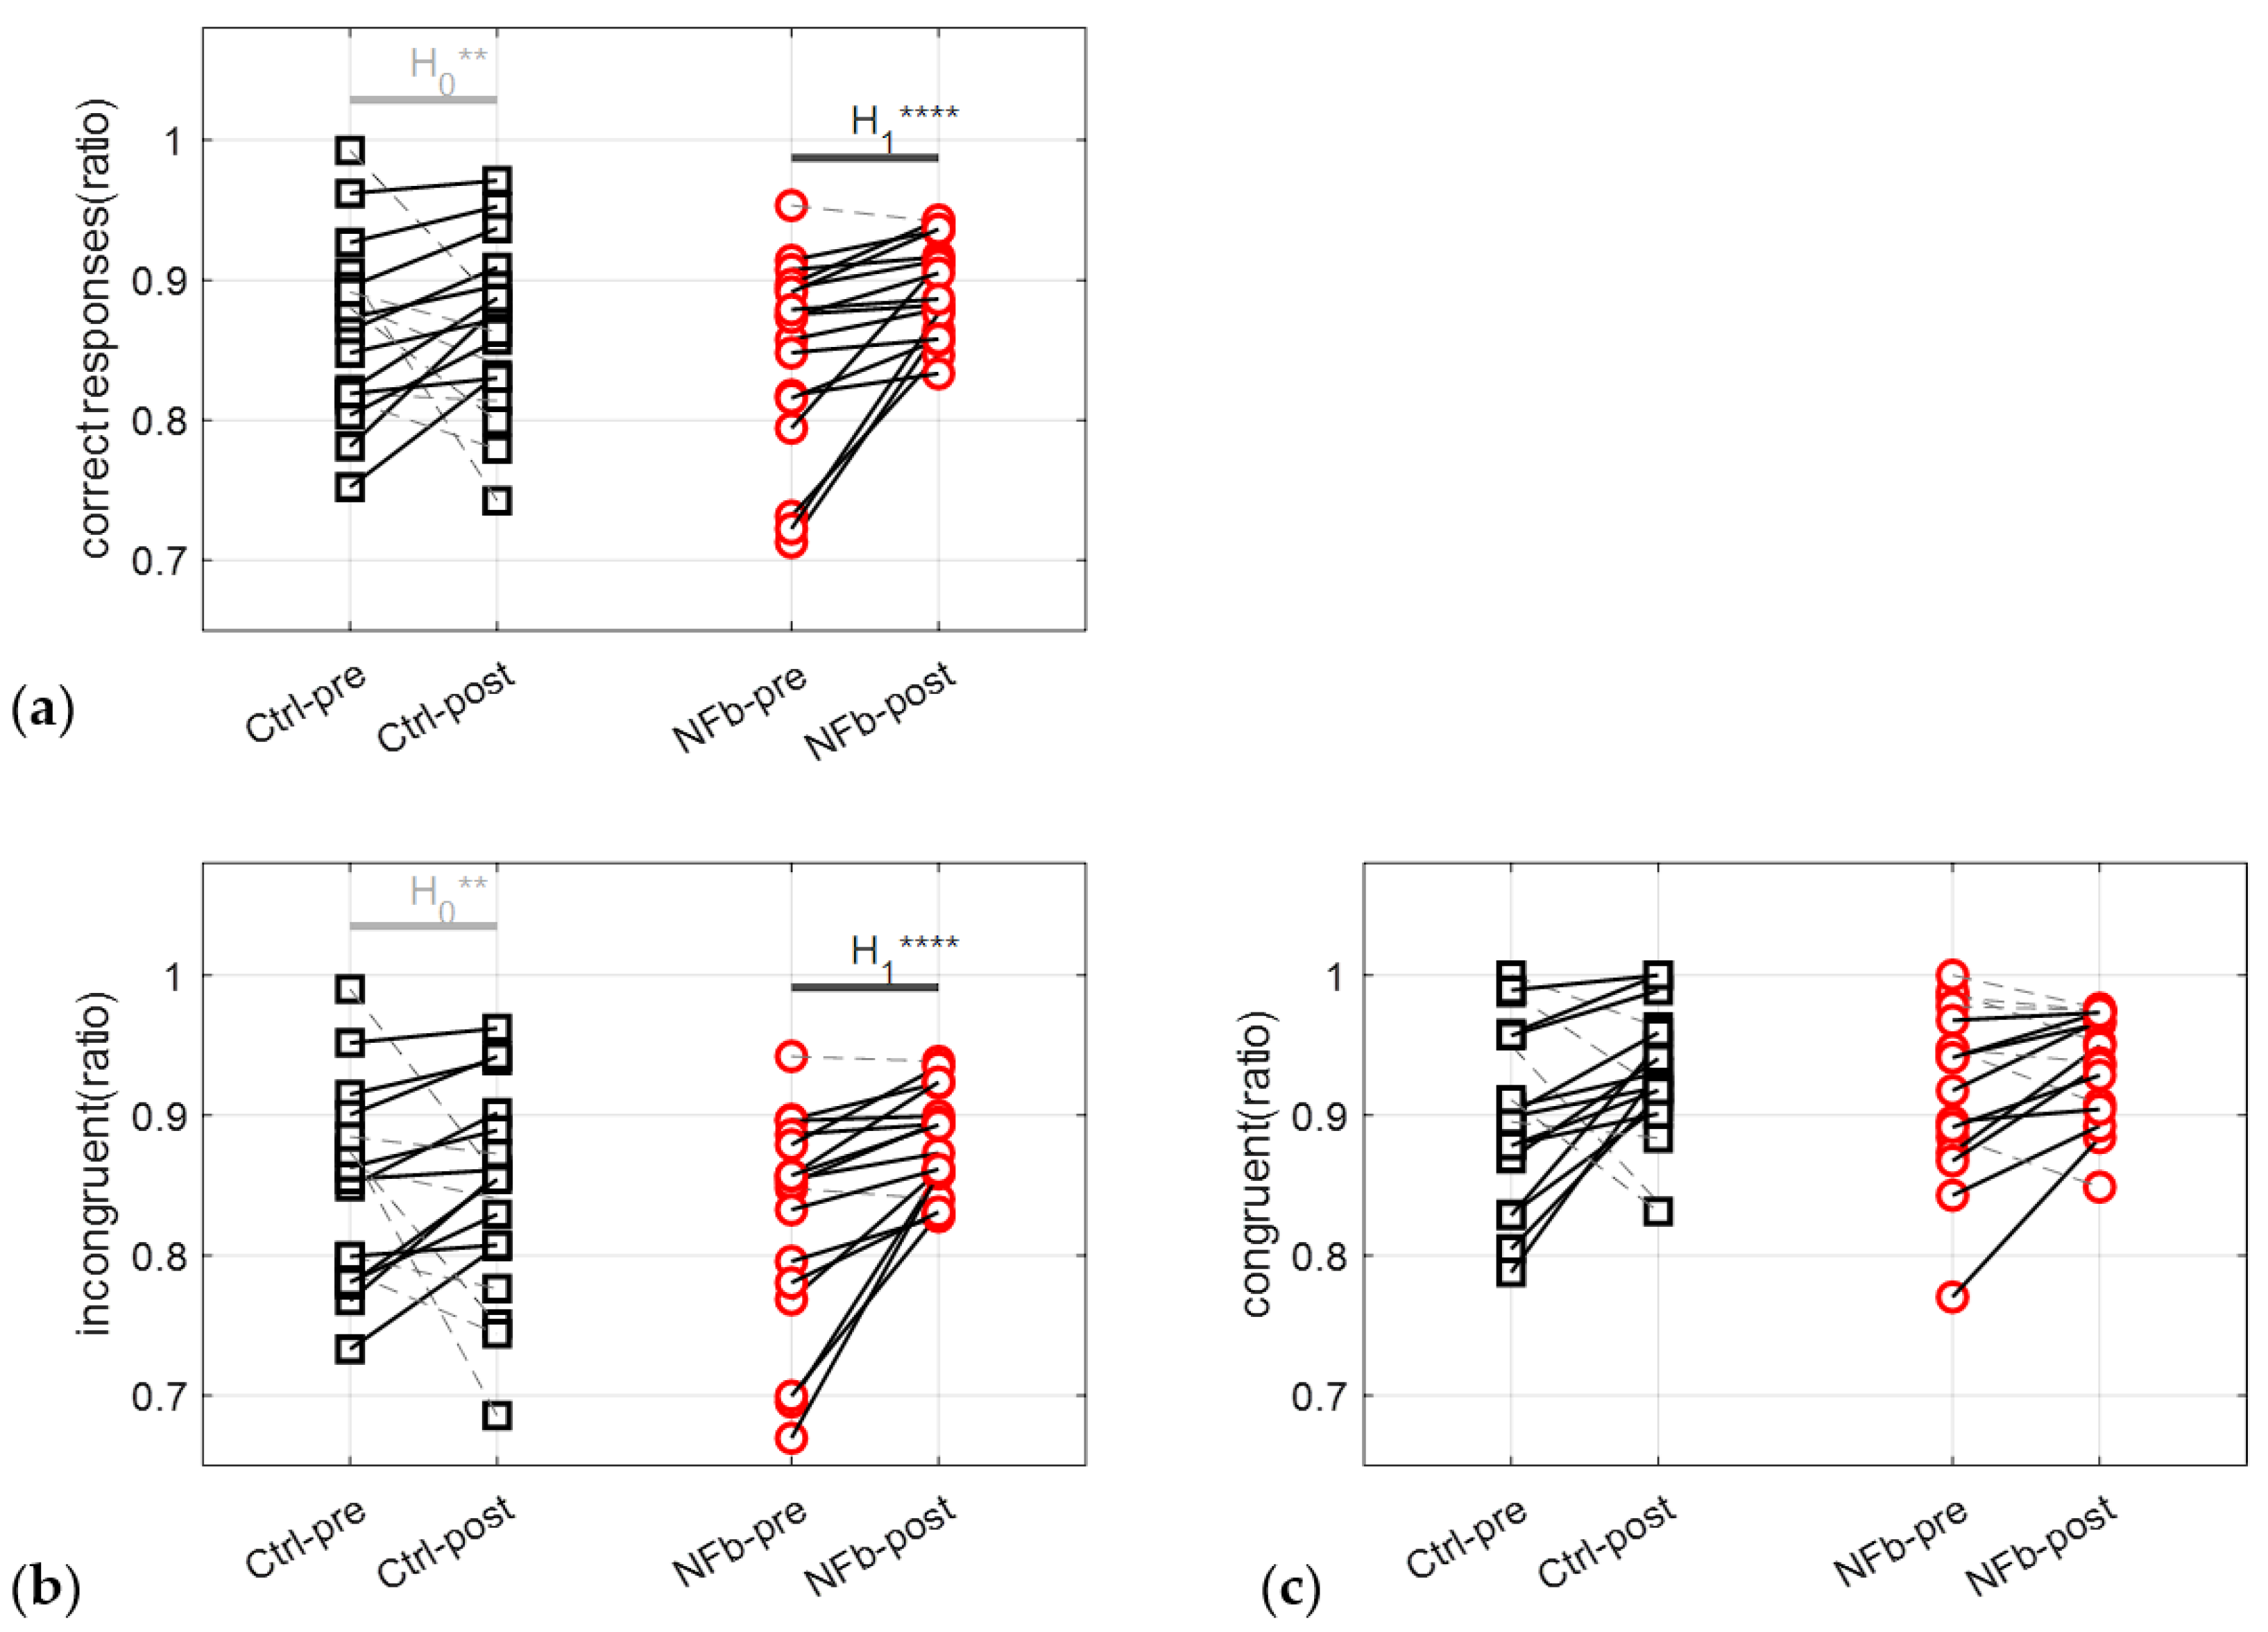
3.3. Performance in SCWT
3.3.1. Correct Responses
3.3.2. Response Times
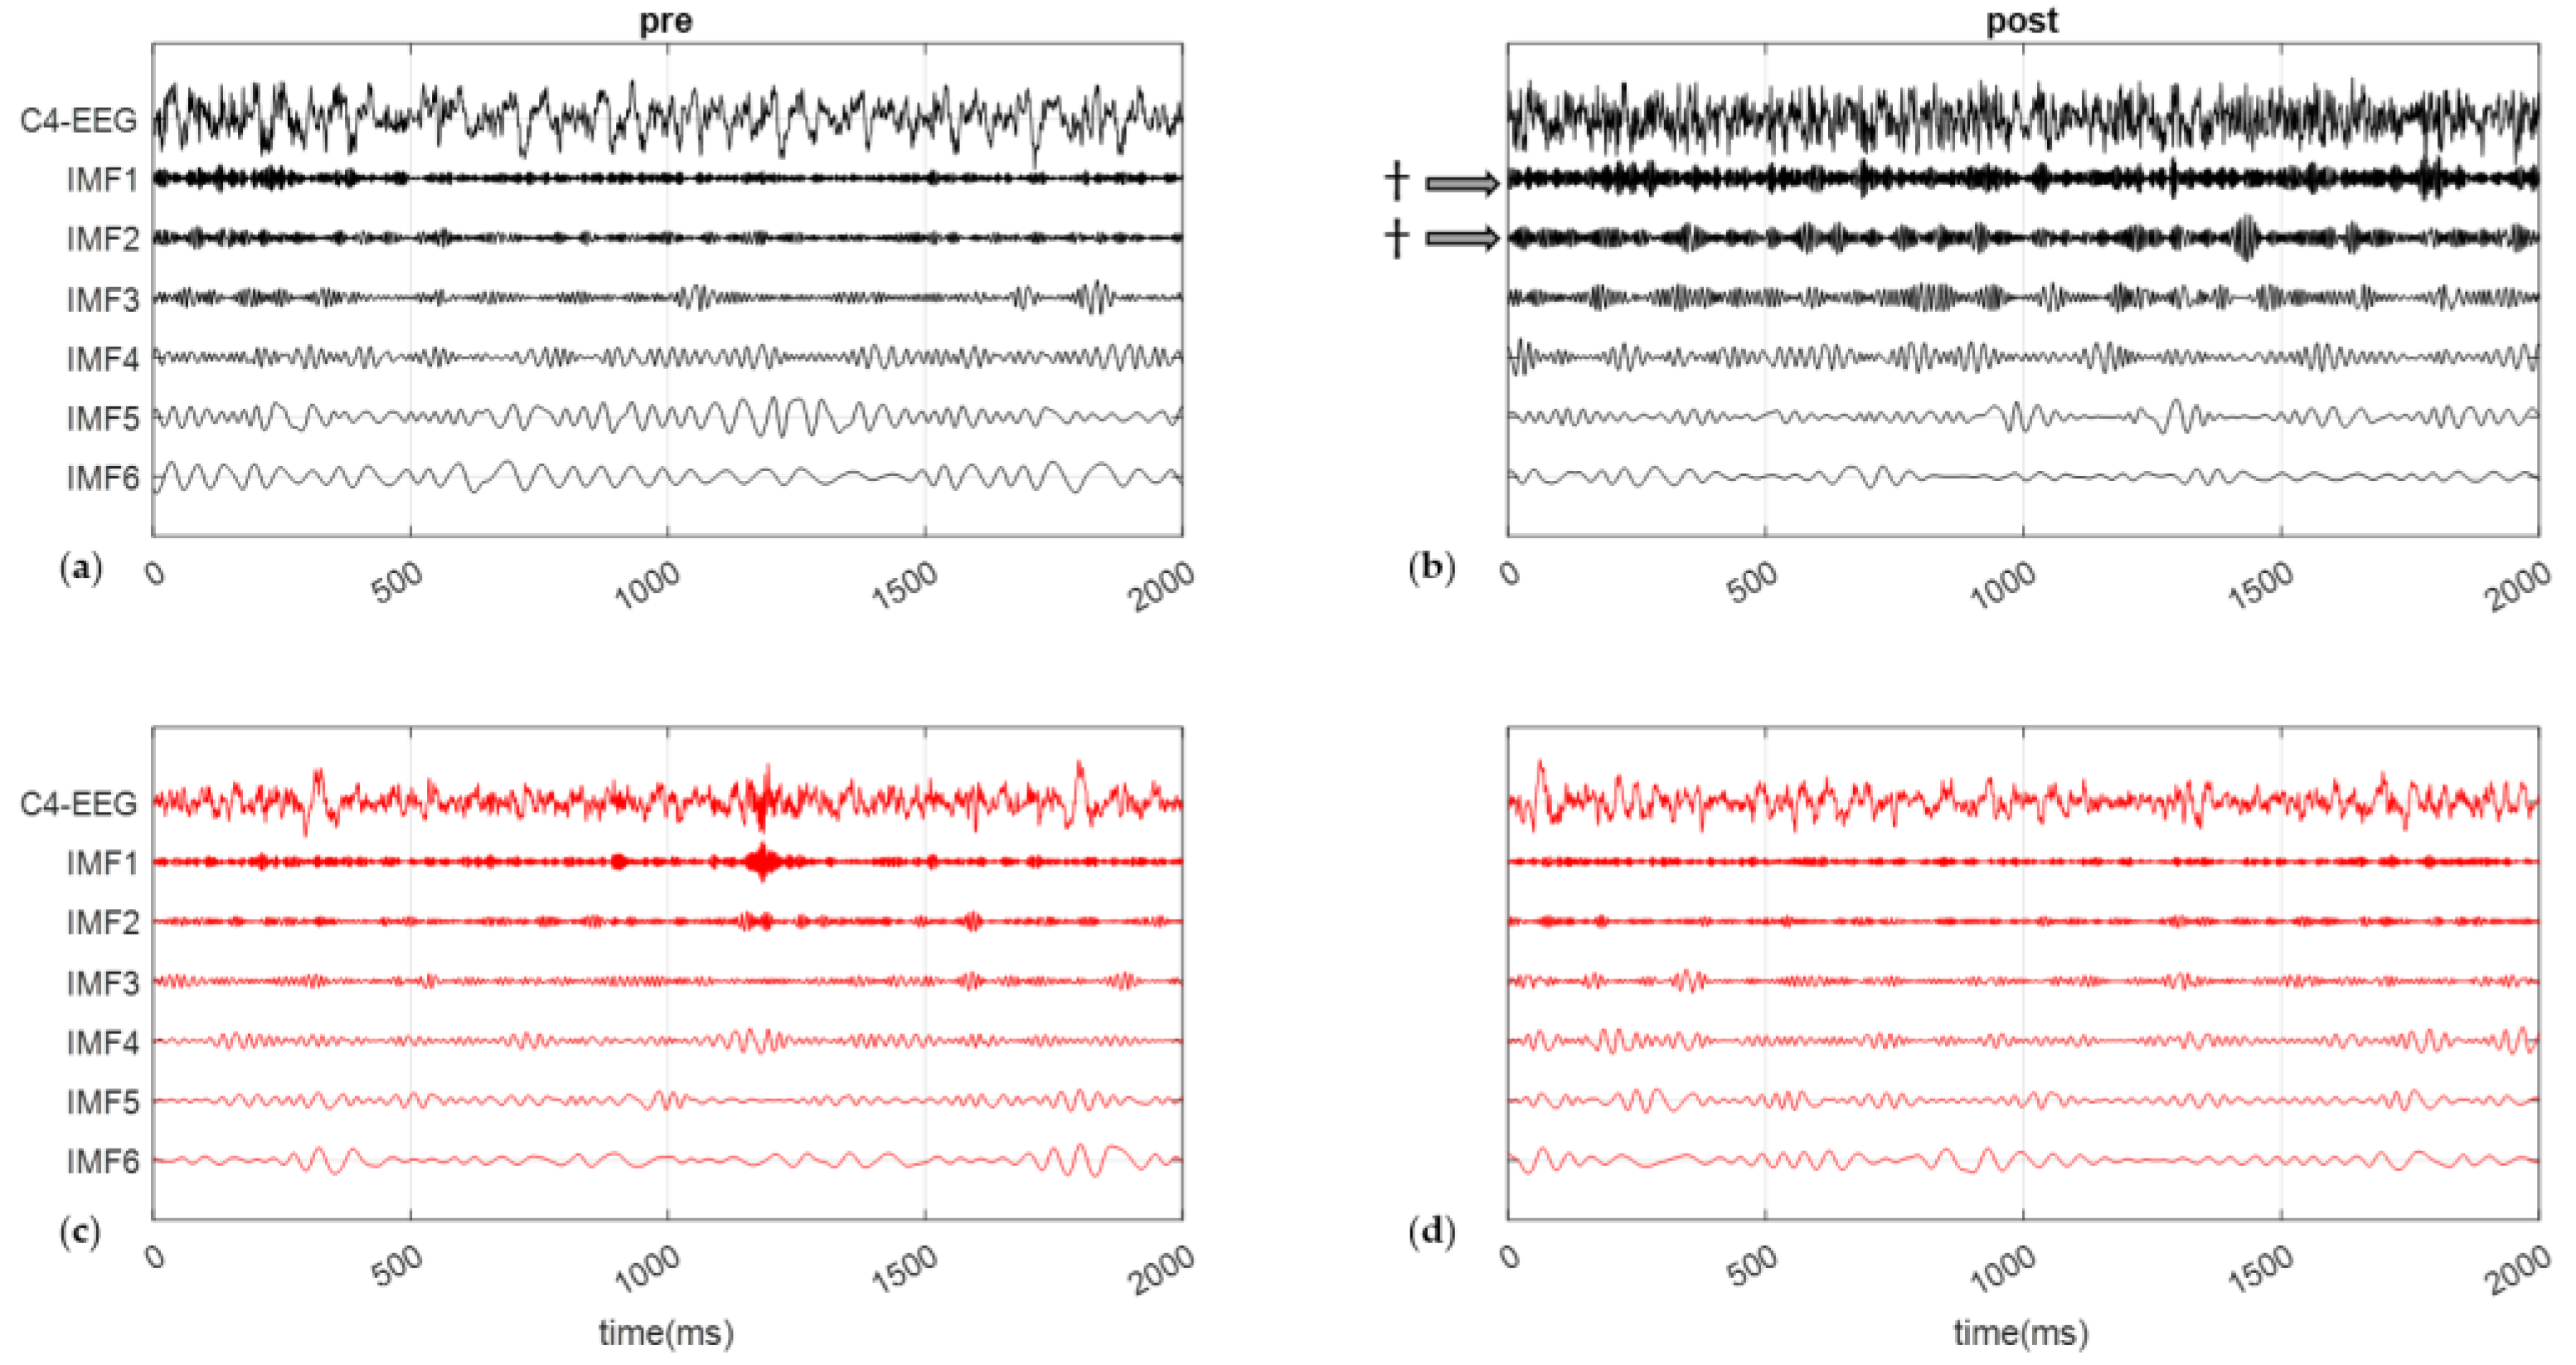
3.4. Frequencies and Energy on C4-EEG during SCWT
3.5. Heart Rate Dynamics during SCWT
3.5.1. HRV Analysis in Time-Domain and Frequency-Domain
3.5.2. Entropy in HRV
3.5.3. Scale-Specific Multifractality in HRV
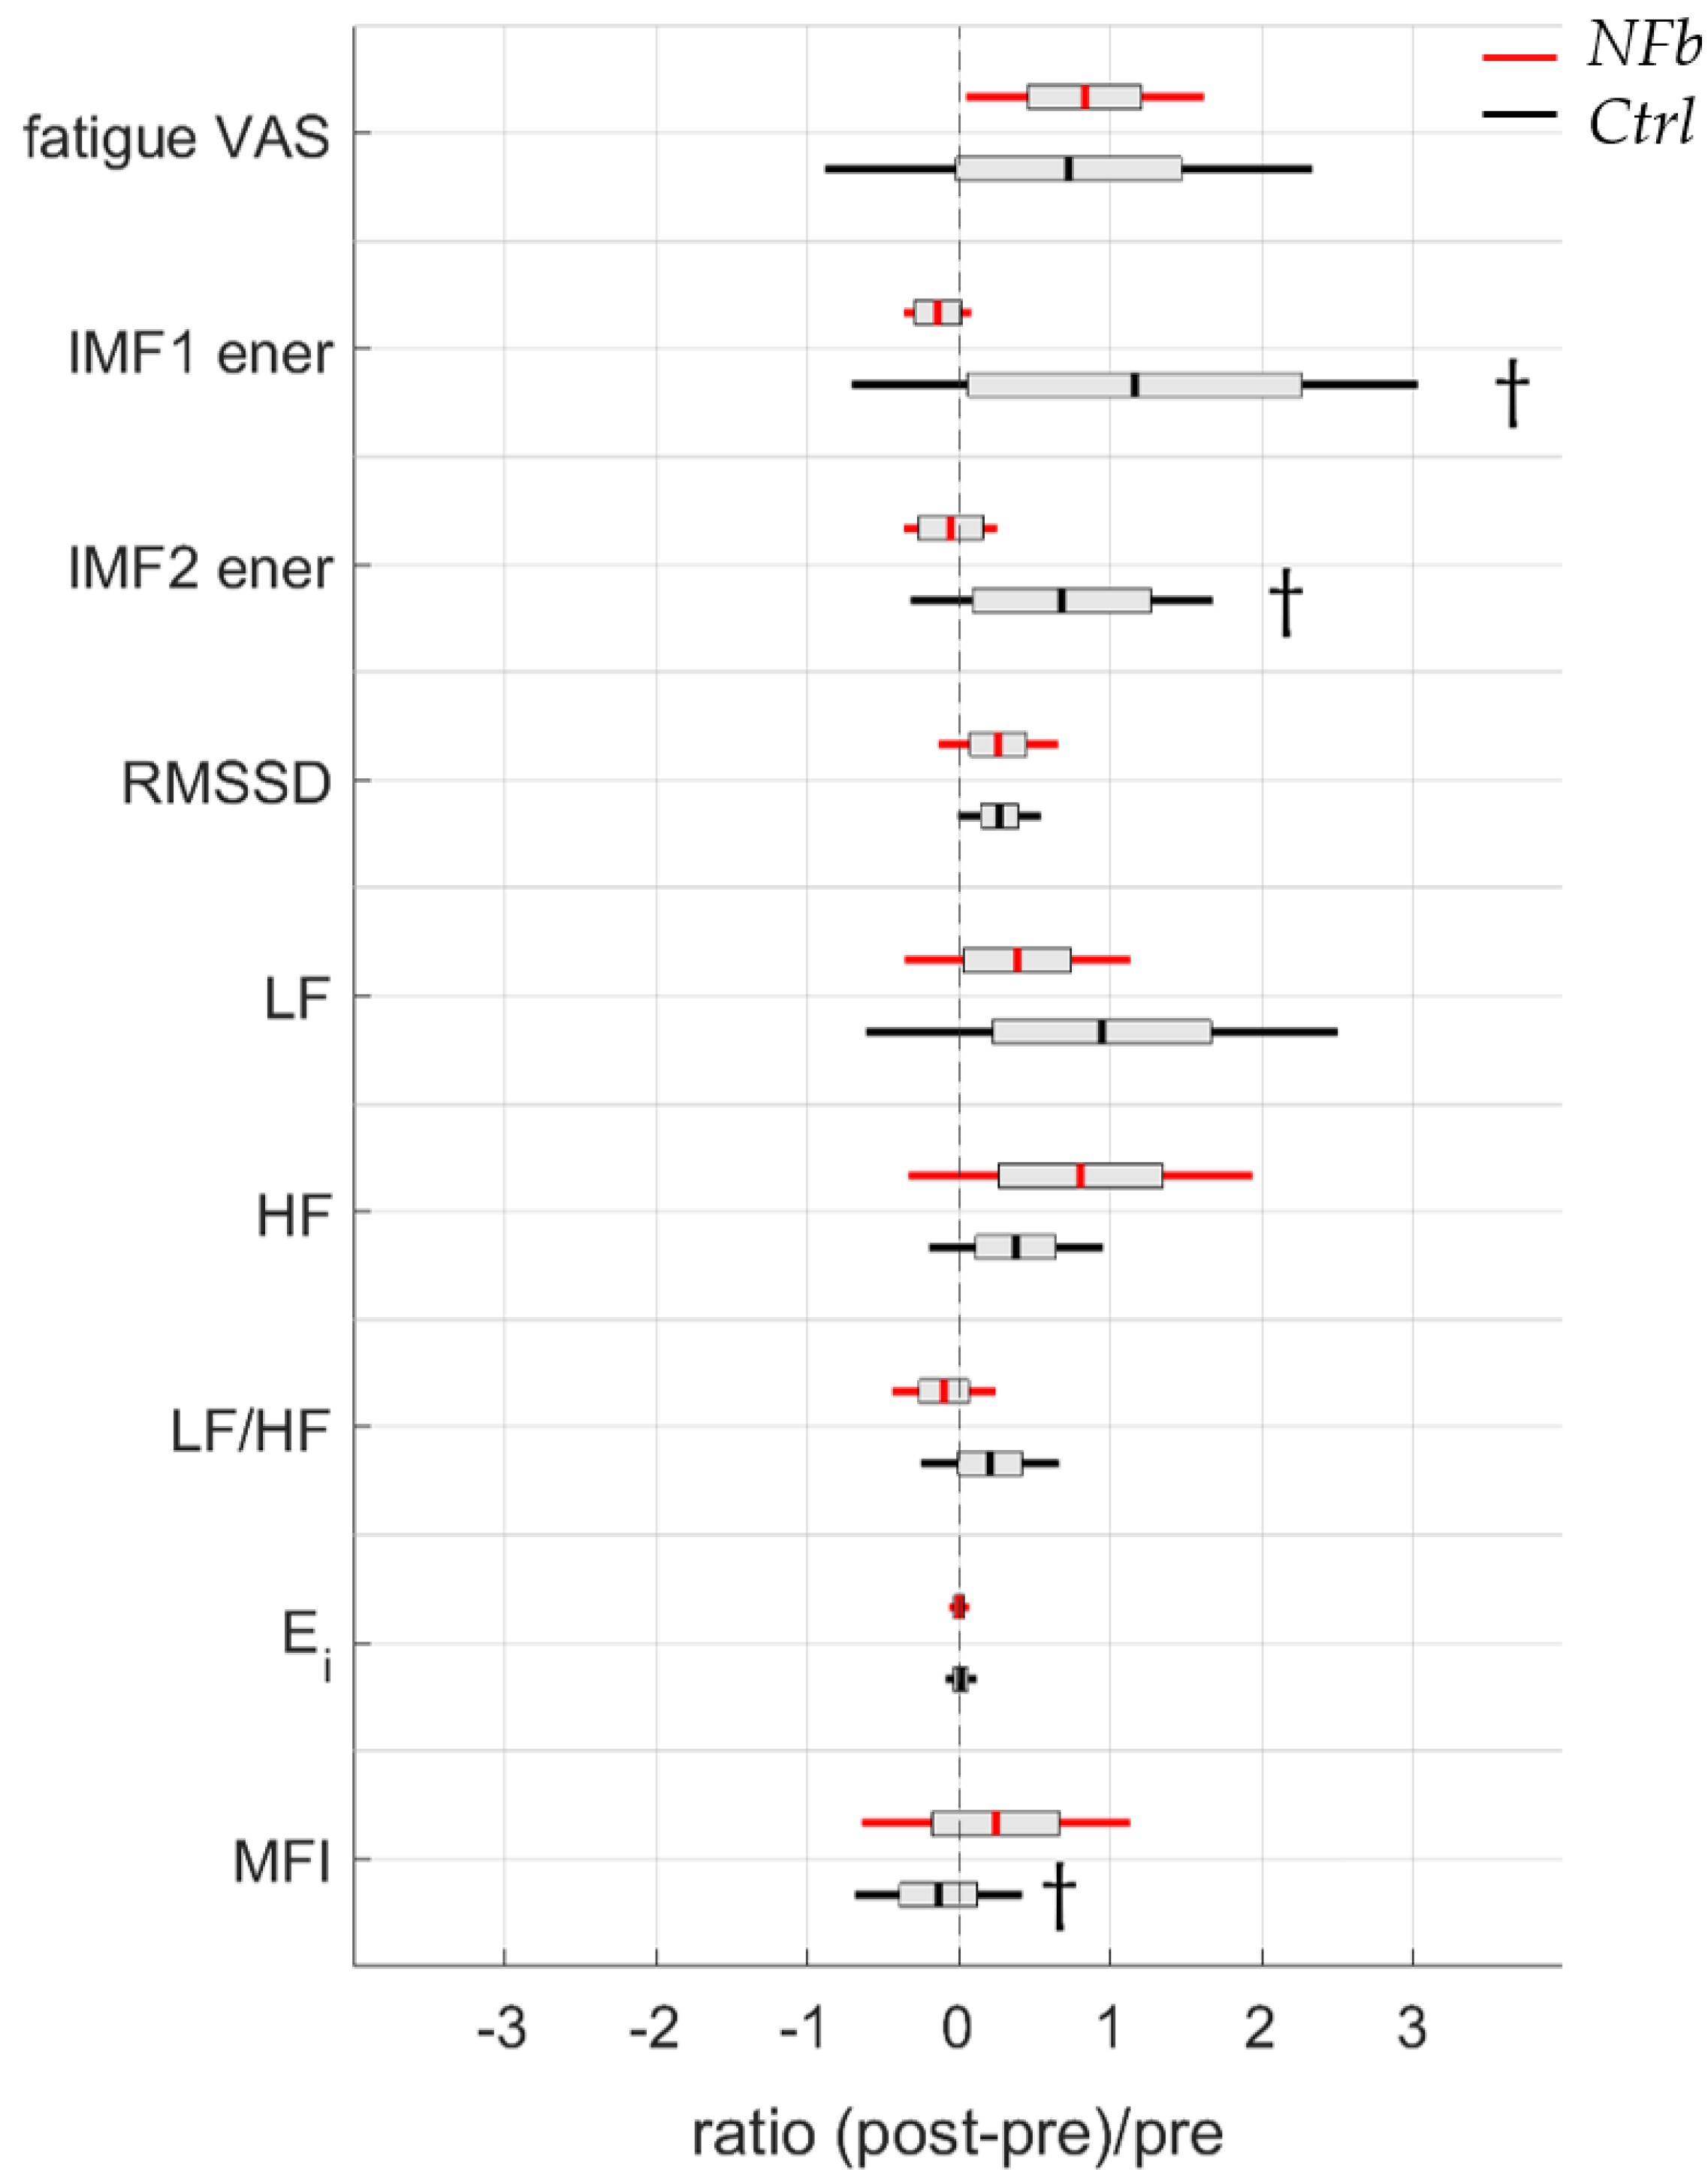
3.6. Multiple Linear Regression
4. Discussion
5. Conclusions
Author Contributions
Funding
Institutional Review Board Statement
Informed Consent Statement
Data Availability Statement
Conflicts of Interest
References
- Roth, S.R.; Sterman, M.B.; Clemente, C.D. Comparison of EEG Correlates of Reinforcement, Internal Inhibition and Sleep. Electroencephalogr. Clin. Neurophysiol. 1967, 23, 509–520. [Google Scholar] [CrossRef]
- Sterman, M.B.; Wyrwicka, W. EEG Correlates of Sleep: Evidence for Separate Forebrain Substrates. Brain Res. 1967, 6, 143–163. [Google Scholar] [CrossRef]
- Sterman, M.B. Physiological Origins and Functional Correlates of EEG Rhythmic Activities: Implications for Self-Regulation. Biofeedback Self-Regul. 1996, 21, 3–33. [Google Scholar] [CrossRef] [PubMed]
- Sterman, M.B.; Egner, T. Foundation and Practice of Neurofeedback for the Treatment of Epilepsy. Appl. Psychophysiol. Biofeedback 2006, 31, 21–35. [Google Scholar] [CrossRef]
- Lubar, J.F.; Shouse, M.N. EEG and Behavioral Changes in a Hyperkinetic Child Concurrent with Training of the Sensorimotor Rhythm (SMR): A Preliminary Report. Biofeedback Self-Regul. 1976, 1, 293–306. [Google Scholar] [CrossRef]
- Shouse, M.N.; Lubar, J.F. Operant Conditioning of EEG Rhythms and Ritalin in the Treatment of Hyperkinesis. Biofeedback Self-Regul. 1979, 4, 299–312. [Google Scholar] [CrossRef]
- Arns, M.; de Ridder, S.; Strehl, U.; Breteler, M.; Coenen, A. Efficacy of Neurofeedback Treatment in ADHD: The Effects on Inattention, Impulsivity and Hyperactivity: A Meta-Analysis. Clin. EEG Neurosci. 2009, 40, 180–189. [Google Scholar] [CrossRef]
- Egner, T.; Gruzelier, J.H. Learned Self-Regulation of EEG Frequency Components Affects Attention and Event-Related Brain Potentials in Humans. Neuroreport 2001, 12, 4155–4159. [Google Scholar] [CrossRef] [Green Version]
- Vernon, D.; Egner, T.; Cooper, N.; Compton, T.; Neilands, C.; Sheri, A.; Gruzelier, J. The Effect of Training Distinct Neurofeedback Protocols on Aspects of Cognitive Performance. Int. J. Psychophysiol. 2003, 47, 75–85. [Google Scholar] [CrossRef]
- Rueda, M.R.; Pozuelos, J.P.; Cómbita, L.M. Dept. of Experimental Psychology, Center for Research on Mind, Brain, and Behavior (CIMCYC), Universidad de Granada, Spain Cognitive Neuroscience of Attention From Brain Mechanisms to Individual Differences in Efficiency. AIMS Neurosci. 2015, 2, 183–202. [Google Scholar] [CrossRef]
- Gadea, M.; Aliño, M.; Hidalgo, V.; Espert, R.; Salvador, A. Effects of a Single Session of SMR Neurofeedback Training on Anxiety and Cortisol Levels. Neurophysiol. Clin. Clin. Neurophysiol. 2020, 50, 167–173. [Google Scholar] [CrossRef] [PubMed]
- Dayan, P.; Kakade, S.; Montague, P.R. Learning and Selective Attention. Nat. Neurosci. 2000, 3, 1218–1223. [Google Scholar] [CrossRef] [PubMed]
- Langner, R.; Eickhoff, S.B. Sustaining Attention to Simple Tasks: A Meta-Analytic Review of the Neural Mechanisms of Vigilant Attention. Psychol. Bull. 2013, 139, 870–900. [Google Scholar] [CrossRef] [PubMed] [Green Version]
- Rosenberg, M.D.; Finn, E.S.; Scheinost, D.; Papademetris, X.; Shen, X.; Constable, R.T.; Chun, M.M. A Neuromarker of Sustained Attention from Whole-Brain Functional Connectivity. Nat. Neurosci. 2016, 19, 165–171. [Google Scholar] [CrossRef] [Green Version]
- Benarroch, E.E. The Central Autonomic Network: Functional Organization, Dysfunction, and Perspective. Mayo Clin. Proc. 1993, 68, 988–1001. [Google Scholar] [CrossRef]
- Thayer, J.F.; Saus-Rose, E.; Johnsen, B.H. Heart Rate Variability, Prefrontal Neural Function, and Cognitive Performance: The Neurovisceral Integration Perspective on Self-Regulation, Adaptation, and Health. Ann. Behav. Med. 2009, 37, 141–153. [Google Scholar] [CrossRef]
- Valenza, G.; Sclocco, R.; Duggento, A.; Passamonti, L.; Napadow, V.; Barbieri, R.; Toschi, N. The Central Autonomic Network at Rest: Uncovering Functional MRI Correlates of Time-Varying Autonomic Outflow. NeuroImage 2019, 197, 383–390. [Google Scholar] [CrossRef]
- Mather, M.; Thayer, J. How Heart Rate Variability Affects Emotion Regulation Brain Networks. Curr. Opin. Behav. Sci. 2018, 19, 98–104. [Google Scholar] [CrossRef]
- Young, H.; Benton, D. We Should Be Using Nonlinear Indices When Relating Heart-Rate Dynamics to Cognition and Mood. Sci. Rep. 2015, 5, 16619. [Google Scholar] [CrossRef] [Green Version]
- Porta, A.; Bari, V.; Ranuzzi, G.; De Maria, B.; Baselli, G. Assessing Multiscale Complexity of Short Heart Rate Variability Series through a Model-Based Linear Approach. Chaos Interdiscip. J. Nonlinear Sci. 2017, 27, 093901. [Google Scholar] [CrossRef] [Green Version]
- Blons, E.; Arsac, L.M.; Gilfriche, P.; McLeod, H.; Lespinet-Najib, V.; Grivel, E.; Deschodt-Arsac, V. Alterations in Heart-Brain Interactions under Mild Stress during a Cognitive Task Are Reflected in Entropy of Heart Rate Dynamics. Sci. Rep. 2019, 9, 18190. [Google Scholar] [CrossRef] [PubMed]
- Blons, E.; Arsac, L.; Gilfriche, P.; Deschodt-Arsac, V. Multiscale Entropy of Cardiac and Postural Control Reflects a Flexible Adaptation to a Cognitive Task. Entropy 2019, 21, 1024. [Google Scholar] [CrossRef] [Green Version]
- Bouny, P.; Arsac, L.M.; Touré Cuq, E.; Deschodt-Arsac, V. Entropy and Multifractal-Multiscale Indices of Heart Rate Time Series to Evaluate Intricate Cognitive-Autonomic Interactions. Entropy 2021, 23, 663. [Google Scholar] [CrossRef] [PubMed]
- Costa, M.; Goldberger, A.L.; Peng, C.-K. Multiscale Entropy Analysis of Complex Physiologic Time Series. Phys. Rev. Lett. 2002, 89, 068102. [Google Scholar] [CrossRef] [PubMed] [Green Version]
- Faes, L.; Porta, A.; Javorka, M.; Nollo, G. Efficient Computation of Multiscale Entropy over Short Biomedical Time Series Based on Linear State-Space Models. Complexity 2017, 2017, e1768264. [Google Scholar] [CrossRef]
- Castiglioni, P. A Fast DFA Algorithm for Multifractal Multiscale Analysis of Physiological Time Series. Front. Physiol. 2019, 10, 18. [Google Scholar] [CrossRef] [Green Version]
- Peng, C.K.; Havlin, S.; Stanley, H.E.; Goldberger, A.L. Quantification of Scaling Exponents and Crossover Phenomena in Nonstationary Heartbeat Time Series. Chaos 1995, 5, 82–87. [Google Scholar] [CrossRef]
- Castiglioni, P.; Lazzeroni, D.; Coruzzi, P.; Faini, A. Multifractal-Multiscale Analysis of Cardiovascular Signals: A DFA-Based Characterization of Blood Pressure and Heart-Rate Complexity by Gender. Complexity 2018, 2018, 1–14. [Google Scholar] [CrossRef] [Green Version]
- Ivanov, P.C.; Amaral, L.A.N.; Goldberger, A.L.; Havlin, S.; Rosenblum, M.G.; Struzik, Z.R.; Stanley, H.E. Multifractality in Human Heartbeat Dynamics. Nature 1999, 399, 461–465. [Google Scholar] [CrossRef] [Green Version]
- Wu, S.-D.; Wu, C.-W.; Lin, S.-G.; Lee, K.-Y.; Peng, C.-K. Analysis of Complex Time Series Using Refined Composite Multiscale Entropy. Phys. Lett. A 2014, 378, 1369–1374. [Google Scholar] [CrossRef]
- Stoet, G. PsyToolkit: A Software Package for Programming Psychological Experiments Using Linux. Behav. Res. Methods 2010, 42, 1096–1104. [Google Scholar] [CrossRef] [PubMed]
- Stoet, G. PsyToolkit: A Novel Web-Based Method for Running Online Questionnaires and Reaction-Time Experiments. Teach. Psychol. 2017, 44, 24–31. [Google Scholar] [CrossRef]
- Krepel, N.; Egtberts, T.; Touré-Cuq, E.; Bouny, P.; Arns, M. Evaluation of the URGOnight Tele-Neurofeedback Device: An Open-Label Feasibility Study with Follow-Up. Appl. Psychophysiol. Biofeedback 2022, 47, 43–51. [Google Scholar] [CrossRef] [PubMed]
- Kober, S.E.; Schweiger, D.; Witte, M.; Reichert, J.L.; Grieshofer, P.; Neuper, C.; Wood, G. Specific Effects of EEG Based Neurofeedback Training on Memory Functions in Post-Stroke Victims. J. Neuroeng. Rehabil. 2015, 12, 107. [Google Scholar] [CrossRef] [Green Version]
- Reichert, J.L.; Kober, S.E.; Neuper, C.; Wood, G. Resting-State Sensorimotor Rhythm (SMR) Power Predicts the Ability to up-Regulate SMR in an EEG-Instrumental Conditioning Paradigm. Clin. Neurophysiol. Off. J. Int. Fed. Clin. Neurophysiol. 2015, 126, 2068–2077. [Google Scholar] [CrossRef]
- Ros, T.; Enriquez-Geppert, S.; Zotev, V.; Young, K.D.; Wood, G.; Whitfield-Gabrieli, S.; Wan, F.; Vuilleumier, P.; Vialatte, F.; Van De Ville, D.; et al. Consensus on the Reporting and Experimental Design of Clinical and Cognitive-Behavioural Neurofeedback Studies (CRED-Nf Checklist). Brain 2020, 143, 1674–1685. [Google Scholar] [CrossRef] [Green Version]
- Huang, N.; Shen, Z.; Long, S.; Wu, M.L.C.; Shih, H.; Zheng, Q.; Yen, N.-C.; Tung, C.-C.; Liu, H. The Empirical Mode Decomposition and the Hilbert Spectrum for Nonlinear and Non-Stationary Time Series Analysis. Proc. R. Soc. Lond. Ser. Math. Phys. Eng. Sci. 1998, 454, 903–995. [Google Scholar] [CrossRef]
- Xiao-Jun, Z.; Shi-Qin, L.; Fan, L.; Yu, X. The EEG Signal Process Based on EEMD. In Proceedings of the 2011 2nd International Symposium on Intelligence Information Processing and Trusted Computing, Wuhan, China, 22–23 October 2011; IEEE: Wuhan, China, 2011; pp. 222–225. [Google Scholar]
- Pasadyn, S.R.; Soudan, M.; Gillinov, M.; Houghtaling, P.; Phelan, D.; Gillinov, N.; Bittel, B.; Desai, M.Y. Accuracy of Commercially Available Heart Rate Monitors in Athletes: A Prospective Study. Cardiovasc. Diagn. Ther. 2019, 9, 379–385. [Google Scholar] [CrossRef]
- Malik, M. Task Force of The European Society of Cardiology and The North American. Society of Pacing and Electrophysiology Heart Rate Variability Standards of Measurement, Physiological Interpretation, and Clinical Use. Eur. Heart J. 1996, 93, 1043–1065. [Google Scholar]
- Costa, M.; Goldberger, A.L.; Peng, C.-K. Multiscale Entropy Analysis of Biological Signals. Phys. Rev. E 2005, 71, 021906. [Google Scholar] [CrossRef] [Green Version]
- Porta, A.; D’Addio, G.; Guzzetti, S.; Lucini, D.; Pagani, M. Testing the Presence of Non Stationarities in Short Heart Rate Variability Series. In Proceedings of the Computers in Cardiology, Chicago, IL, USA, 19–22 September 2004; IEEE: Chicago, IL, USA, 2004; pp. 645–648. [Google Scholar]
- Magagnin, V.; Bassani, T.; Bari, V.; Turiel, M.; Maestri, R.; Pinna, G.D.; Porta, A. Non-Stationarities Significantly Distort Short-Term Spectral, Symbolic and Entropy Heart Rate Variability Indices. Physiol. Meas. 2011, 32, 1775–1786. [Google Scholar] [CrossRef] [PubMed]
- Gow, B.; Peng, C.-K.; Wayne, P.; Ahn, A. Multiscale Entropy Analysis of Center-of-Pressure Dynamics in Human Postural Control: Methodological Considerations. Entropy 2015, 17, 7926–7947. [Google Scholar] [CrossRef]
- Silva, L.E.V.; Cabella, B.C.T.; Neves, U.P.d.C.; Murta Junior, L.O. Multiscale Entropy-Based Methods for Heart Rate Variability Complexity Analysis. Phys. Stat. Mech. Its Appl. 2015, 422, 143–152. [Google Scholar] [CrossRef]
- Kantelhardt, J.W.; Zschiegner, S.A.; Koscielny-Bunde, E.; Bunde, A.; Havlin, S.; Stanley, H.E. Multifractal Detrended Fluctuation Analysis of Nonstationary Time Series. Phys. Stat. Mech. Its Appl. 2002, 316, 87–114. [Google Scholar] [CrossRef] [Green Version]
- Castiglioni, P.; Omboni, S.; Parati, G.; Faini, A. Day and Night Changes of Cardiovascular Complexity: A Multi-Fractal Multi-Scale Analysis. Entropy 2020, 22, 462. [Google Scholar] [CrossRef] [Green Version]
- Schreiber, T.; Schmitz, A. Improved Surrogate Data for Nonlinearity Tests. Phys. Rev. Lett. 1996, 77, 635–638. [Google Scholar] [CrossRef] [Green Version]
- Tukey, J.W. Exploratory Data Analysis; Addison-Wesley Pub. Co.: Reading, MA, USA, 1977; ISBN 978-0-201-07616-5. [Google Scholar]
- Rouder, J.N.; Speckman, P.L.; Sun, D.; Morey, R.D.; Iverson, G. Bayesian t Tests for Accepting and Rejecting the Null Hypothesis. Psychon. Bull. Rev. 2009, 16, 225–237. [Google Scholar] [CrossRef]
- Keysers, C.; Gazzola, V.; Wagenmakers, E.-J. Using Bayes Factor Hypothesis Testing in Neuroscience to Establish Evidence of Absence. Nat. Neurosci. 2020, 23, 788–799. [Google Scholar] [CrossRef]
- Jeffreys, H. Theory of Probability, 3rd ed.; Oxford University Press: Oxford, UK, 1961. [Google Scholar]
- Wu, Z.; Huang, N.E. Ensemble Empirical Mode Decomposition: A Noise-Assisted Data Analysis Method. Adv. Adapt. Data Anal. 2009, 1, 1–41. [Google Scholar] [CrossRef]
- Viviani, G.; Vallesi, A. EEG-Neurofeedback and Executive Function Enhancement in Healthy Adults: A Systematic Review. Psychophysiology 2021, 58, e13874. [Google Scholar] [CrossRef]
- Gonçalves, Ó.F.; Carvalho, S.; Mendes, A.J.; Leite, J.; Boggio, P.S. Neuromodulating Attention and Mind-Wandering Processes with a Single Session Real Time EEG. Appl. Psychophysiol. Biofeedback 2018, 43, 143–151. [Google Scholar] [CrossRef] [PubMed]
- Torre, K.; Vergotte, G.; Viel, É.; Perrey, S.; Dupeyron, A. Fractal Properties in Sensorimotor Variability Unveil Internal Adaptations of the Organism before Symptomatic Functional Decline. Sci. Rep. 2019, 9, 15736. [Google Scholar] [CrossRef] [PubMed]
- Pamplona, G.S.P.; Heldner, J.; Langner, R.; Koush, Y.; Michels, L.; Ionta, S.; Scharnowski, F.; Salmon, C.E.G. Network-Based FMRI-Neurofeedback Training of Sustained Attention. NeuroImage 2020, 221, 117194. [Google Scholar] [CrossRef] [PubMed]
- Borghini, G.; Astolfi, L.; Vecchiato, G.; Mattia, D.; Babiloni, F. Measuring Neurophysiological Signals in Aircraft Pilots and Car Drivers for the Assessment of Mental Workload, Fatigue and Drowsiness. Neurosci. Biobehav. Rev. 2014, 44, 58–75. [Google Scholar] [CrossRef]


| SCWT Response Times (Unit) | ||||
|---|---|---|---|---|
| Pre | Post | Pre | Post | |
| RTtotal (ms) | 616 ± 55 | 606 ± 64 | 640 ± 34 | 611 ± 36 |
| RTcorrect (ms) | 614 ± 54 | 604 ± 63 | 633 ± 33 | 606 ± 35 |
| RTerror (ms) | 664 ± 139 | 656 ± 99 | 703 ± 40 | 669 ± 56 |
| RTcongruent (ms) | 584 ± 51 | 571 ± 53 | 597 ± 42 | 575 ± 38 |
| RTincongruent (ms) | 629 ± 60 | 621 ± 70 | 652 ± 65 | 623 ± 34 |
| IMFs | ||||||||
|---|---|---|---|---|---|---|---|---|
| Frequency (Hz) | Energy | Frequency (Hz) | Energy | |||||
| Pre | Post | Pre | Post | Pre | Post | Pre | Post | |
| IMF1 | 50.7 ± 1.6 | 51.3 ± 2.6 | 21.8 ± 17.2 | 42.5 ± 35.6 † | 51.0 ± 1.6 | 52.0 ± 1.2 | 44.5 ± 23.2 | 36.9 ± 18.8 |
| IMF2 | 30.0 ± 1.1 | 30.6 ± 1.8 | 18.3 ± 10.5 | 27.9 ± 16.2 † | 31.4 ± 1.5 | 31.6 ± 1.0 | 23.8 ± 13.8 | 20.0 ± 6.8 |
| IMF3 | 17.7 ± 0.4 | 18.2 ± 1.2 | 17.2 ± 6.7 | 21.7 ± 8.4 | 18.4 ± 0.9 | 18.8 ± 1.2 | 19.8 ± 7.0 | 17.7 ± 5.8 |
| IMF4 | 10.3 ± 0.6 | 10.6 ± 0.9 | 18.6 ± 5.0 | 20.0 ± 5.3 | 10.8 ± 0.6 | 10.8 ± 0.4 | 18.5 ± 3.1 | 18.1 ± 5.7 |
| IMF5 | 5.9 ± 0.4 | 6.2 ± 0.5 | 19.7 ± 5.5 | 18.5 ± 3.4 | 6.2 ± 0.5 | 6.3 ± 0.3 | 23.3 ± 9.3 | 18.7 ± 4.7 |
| IMF6 | 3.5 ± 0.2 | 3.6 ± 0.2 | 16.5 ± 4.6 | 14.8 ± 3.4 | 3.6 ± 0.2 | 3.8 ± 0.3 | 19.2 ± 3.5 | 19.5 ± 4.1 |
| HRV Variables (Unit) | ||||
|---|---|---|---|---|
| Pre | Post | Pre | Post | |
| RMSSD (ms) | 51.4 ± 24.0 | 62.8 ± 27.2 * | 47.2 ± 20.2 | 54.7 ± 17.0 * |
| LF (ms2Hz) | 1399 ± 764 | 2374 ± 1660 * | 1618 ± 1103 | 1943 ± 1351 |
| HF (ms2/Hz) | 1041 ± 795 | 1339 ± 947 * | 727 ± 486 | 1097 ± 711 * |
| LF/HF | 1.50 ± 0.62 | 1.68 ± 0.72 | 2.28 ± 0.85 | 1.97 ± 0.85 |
| Ei (u.a.) | 5.98 ± 0.62 | 6.02 ± 0.21 | 6.11 ± 0.31 | 6.13 ± 0.47 |
| MFI (u.a.) | 0.65 ± 0.40 | 0.42 ± 0.17 † | 0.48 ± 0.23 | 0.50 ± 0.19 |
Publisher’s Note: MDPI stays neutral with regard to jurisdictional claims in published maps and institutional affiliations. |
© 2022 by the authors. Licensee MDPI, Basel, Switzerland. This article is an open access article distributed under the terms and conditions of the Creative Commons Attribution (CC BY) license (https://creativecommons.org/licenses/by/4.0/).
Share and Cite
Bouny, P.; Arsac, L.M.; Pratviel, Y.; Boffet, A.; Touré Cuq, E.; Deschodt-Arsac, V. A Single Session of SMR-Neurofeedback Training Improves Selective Attention Emerging from a Dynamic Structuring of Brain–Heart Interplay. Brain Sci. 2022, 12, 794. https://doi.org/10.3390/brainsci12060794
Bouny P, Arsac LM, Pratviel Y, Boffet A, Touré Cuq E, Deschodt-Arsac V. A Single Session of SMR-Neurofeedback Training Improves Selective Attention Emerging from a Dynamic Structuring of Brain–Heart Interplay. Brain Sciences. 2022; 12(6):794. https://doi.org/10.3390/brainsci12060794
Chicago/Turabian StyleBouny, Pierre, Laurent M. Arsac, Yvan Pratviel, Alexis Boffet, Emma Touré Cuq, and Veronique Deschodt-Arsac. 2022. "A Single Session of SMR-Neurofeedback Training Improves Selective Attention Emerging from a Dynamic Structuring of Brain–Heart Interplay" Brain Sciences 12, no. 6: 794. https://doi.org/10.3390/brainsci12060794