
Backward Locomotor Treadmill Training Differentially Improves Walking Performance across Stroke Walking Impairment Levels

 ,
,
Abstract
:1. Introduction
2. Methods
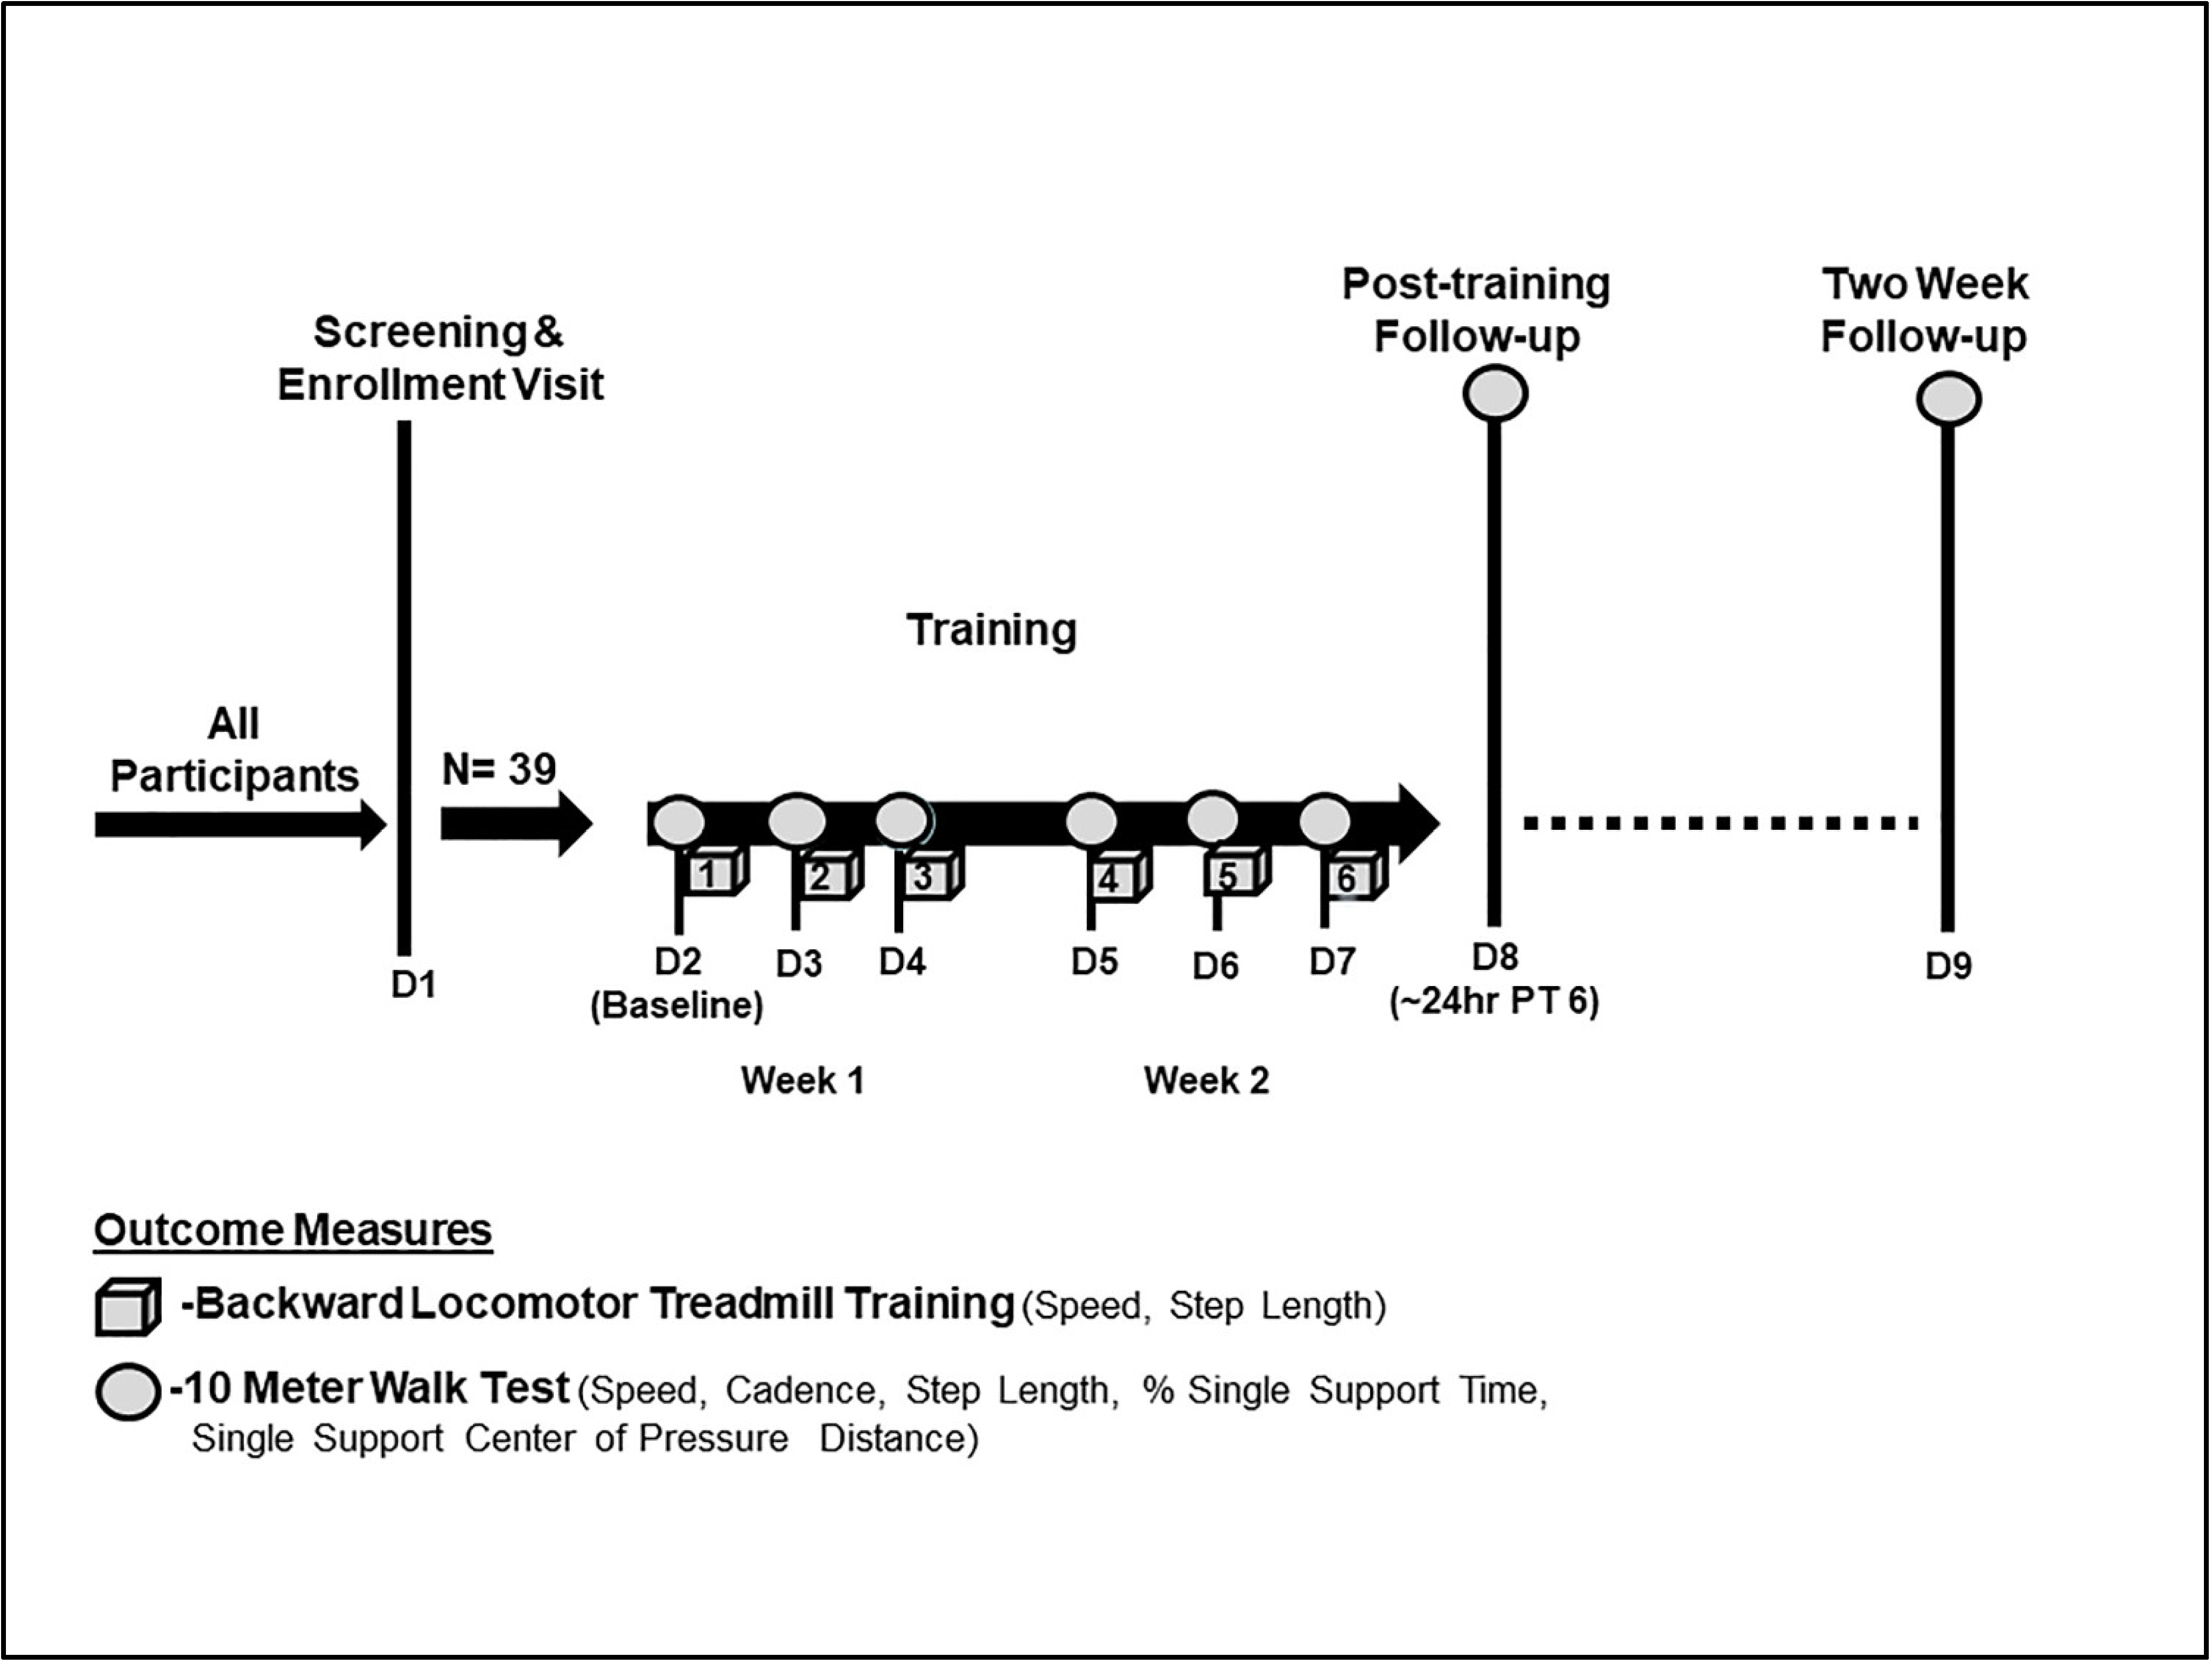
2.1. Design
2.2. Setting and Participants
2.3. Description of Training and Outcomes
Backward Locomotor Treadmill Training (BLTT)
2.4. Outcomes
2.4.1. BLTT
2.4.2. Overground Walking (10-m Walk Test—Fast)
2.5. Statistical Analysis
3. Results
3.1. Safety and Tolerability
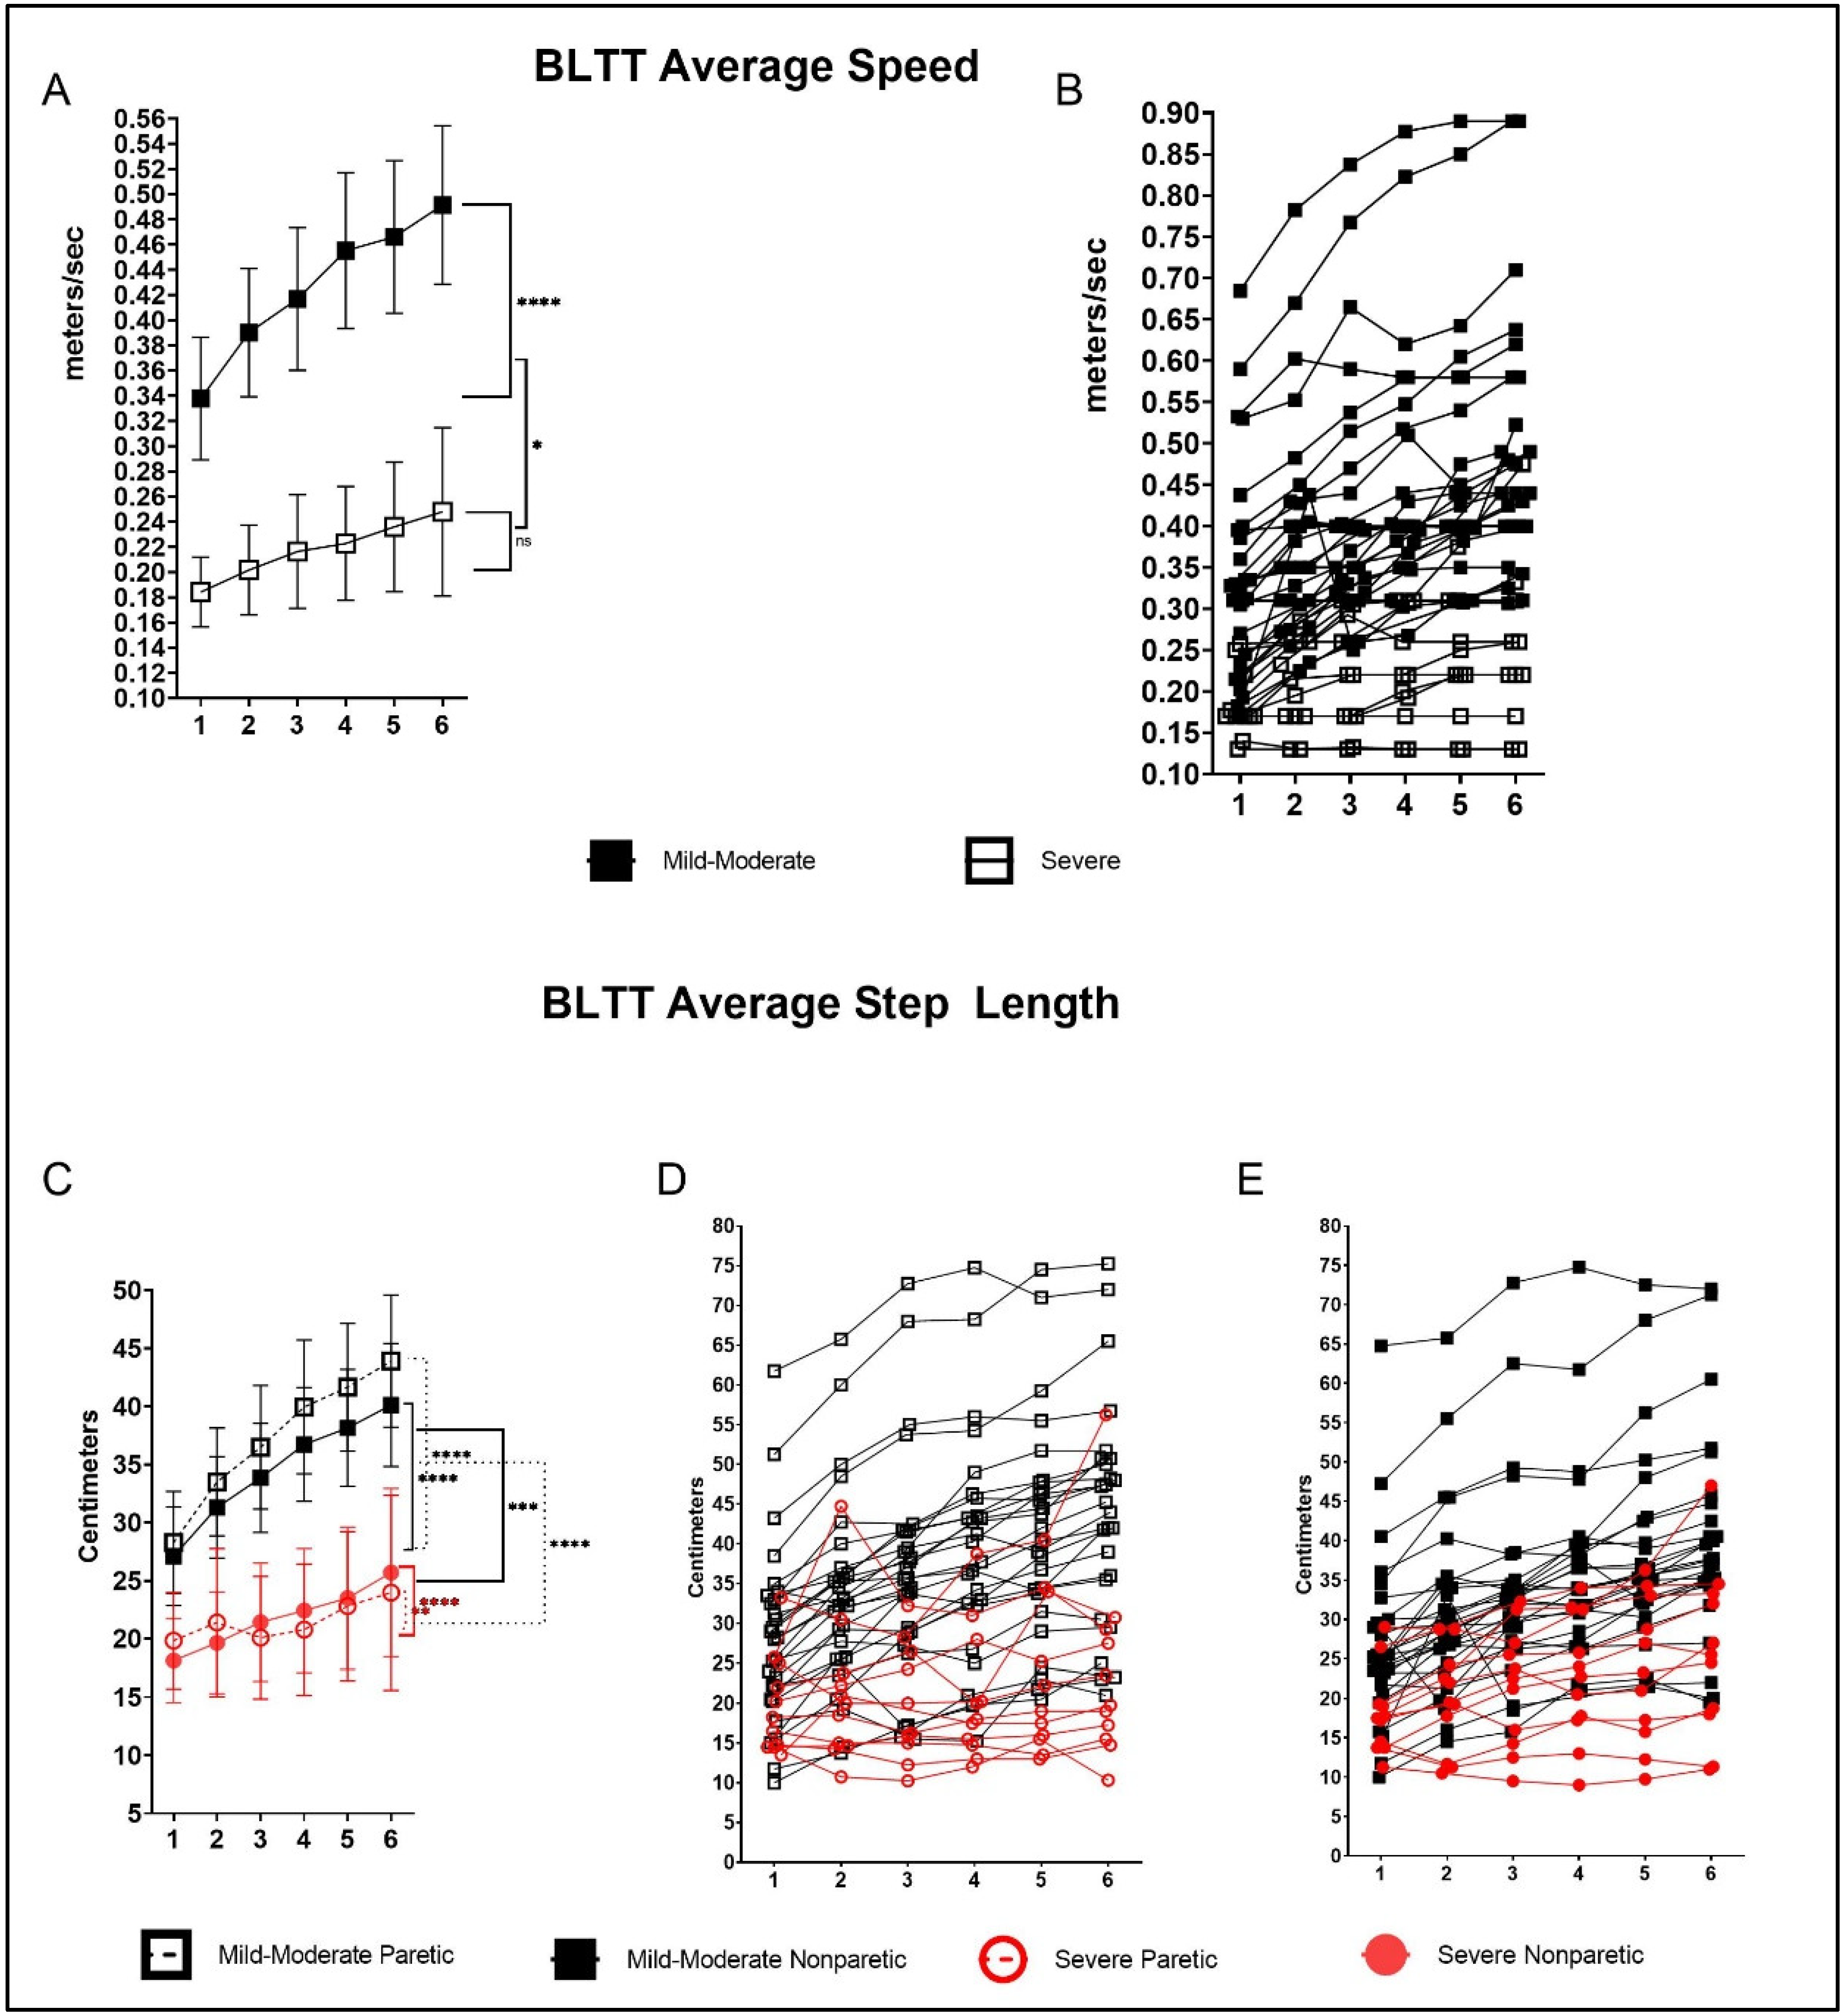
3.2. BLTT—Speed
3.3. BLTT—Paretic Step Length
3.4. BLTT—Nonparetic Step Length
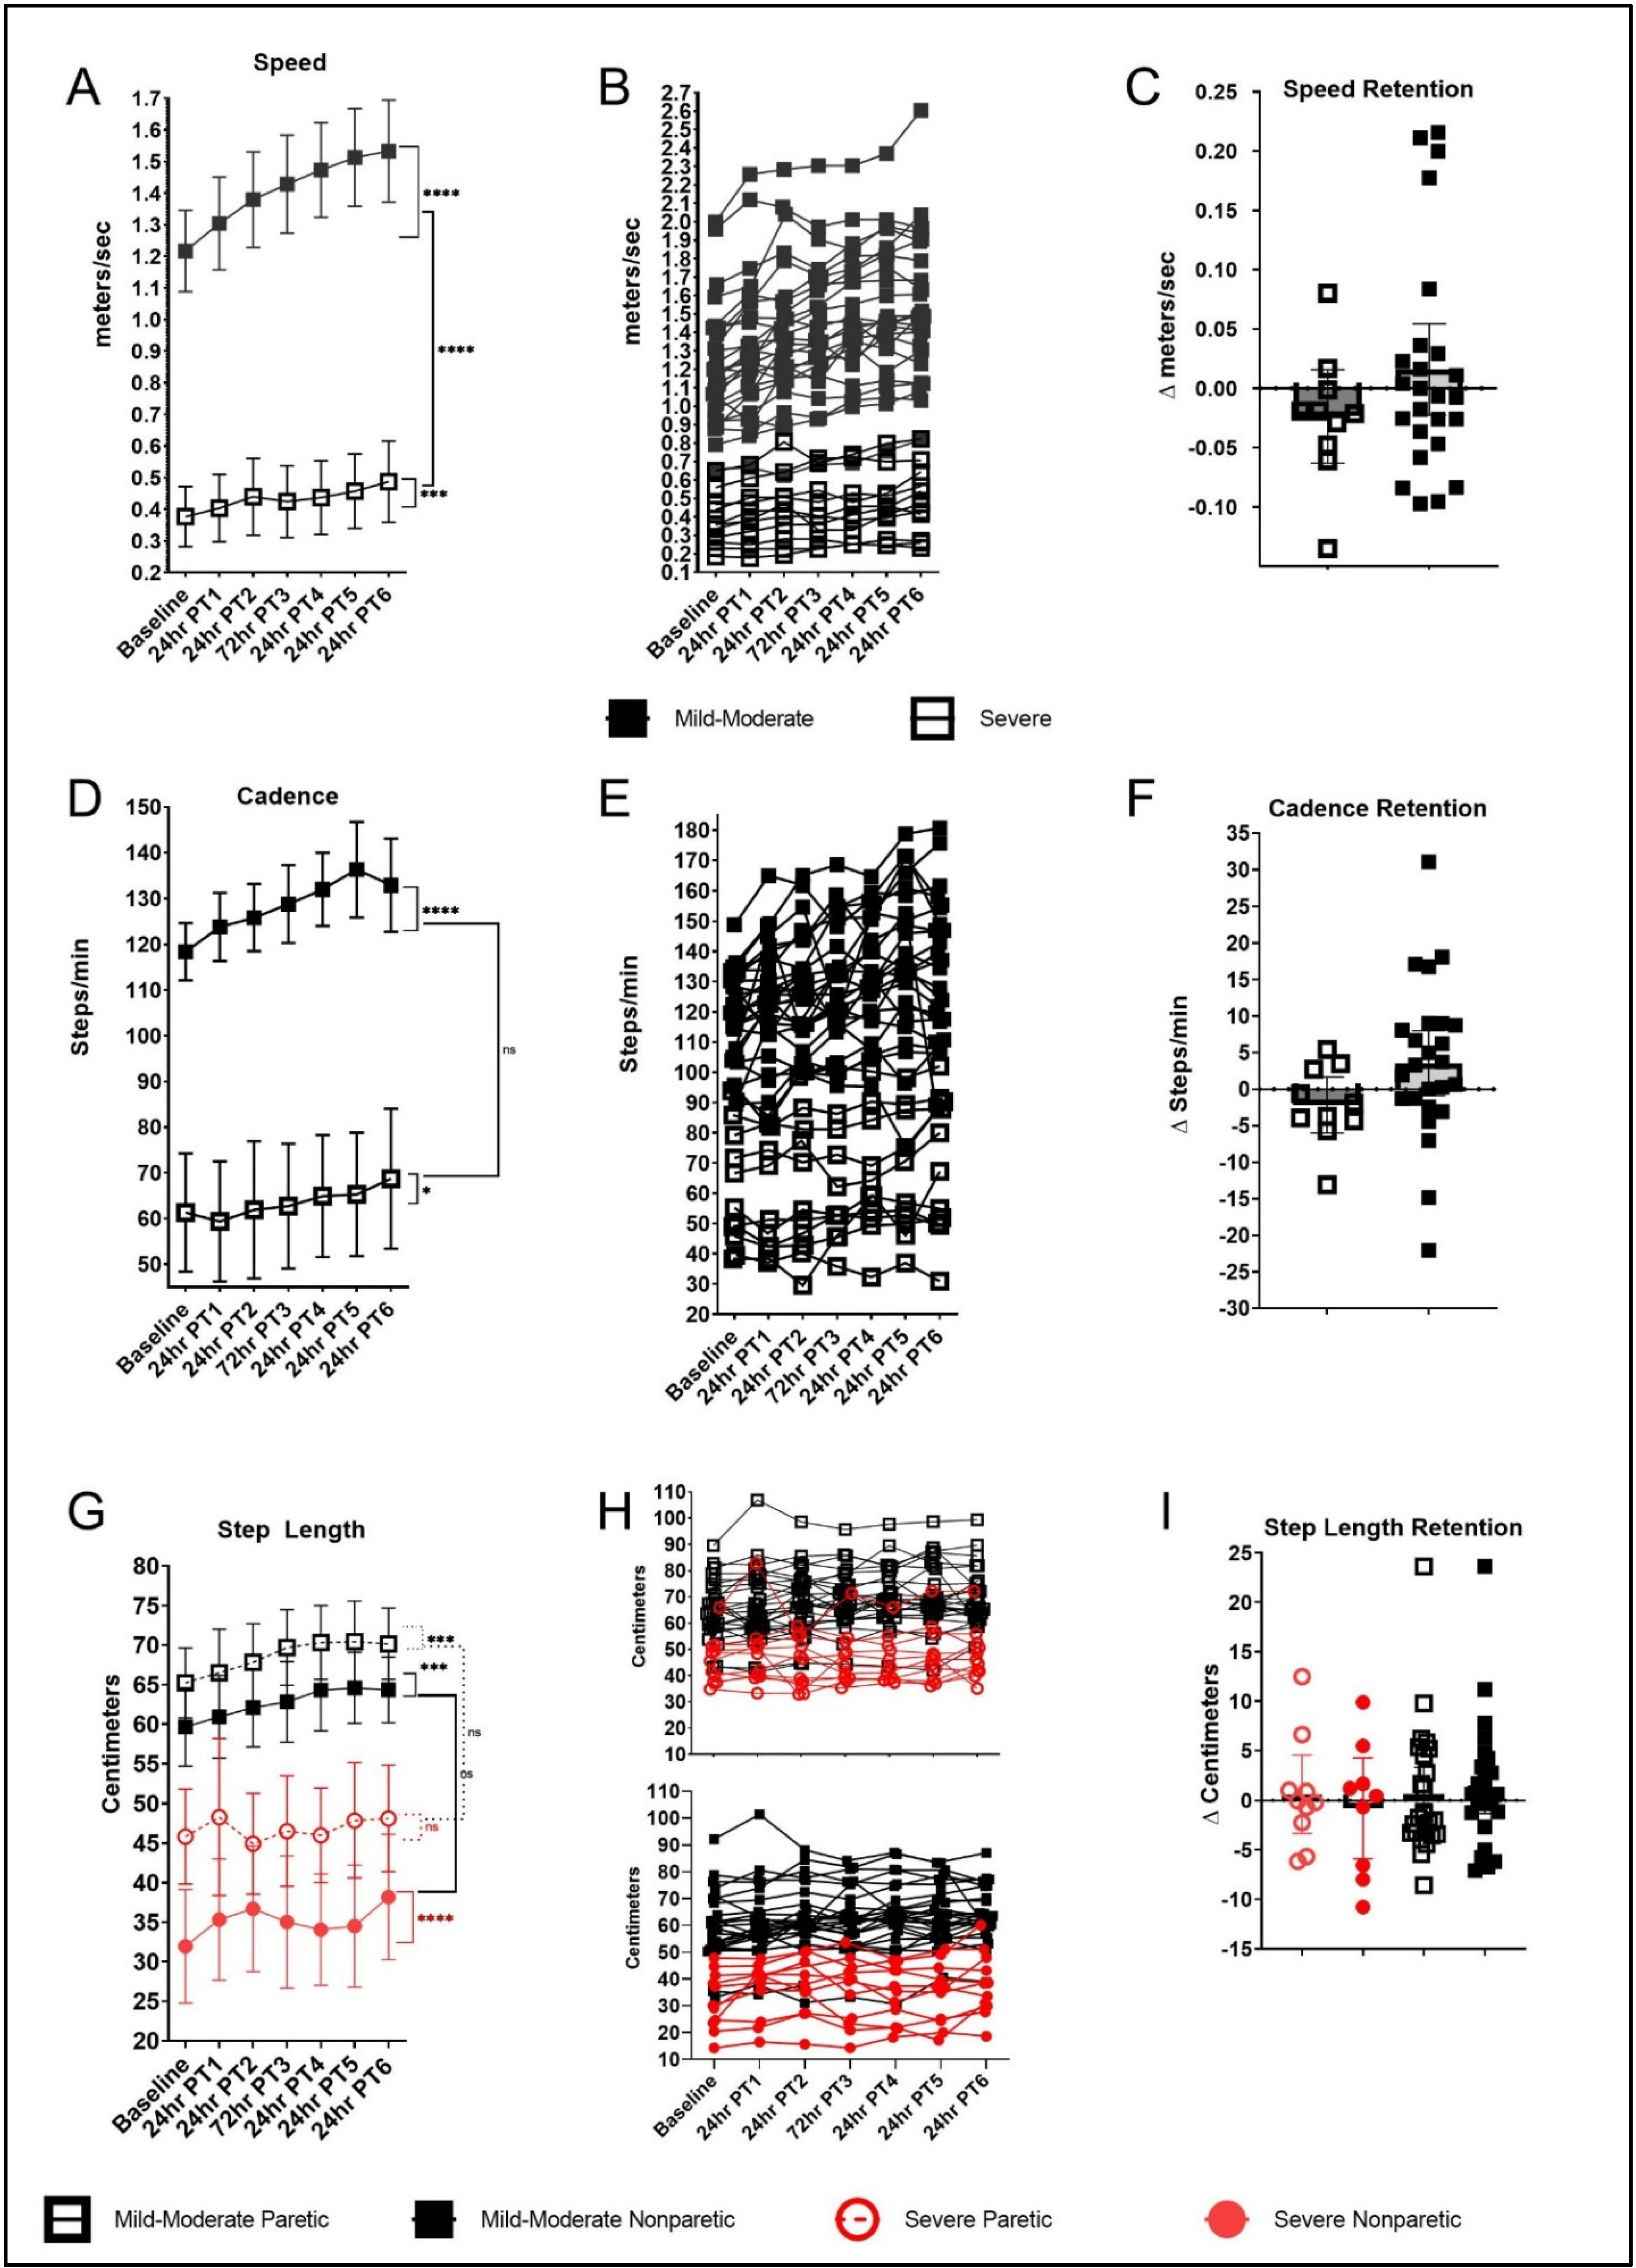
3.5. Overground Walking Performance
3.5.1. 10-mWT Speed (Fast)
3.5.2. 10-mWT—Cadence
3.5.3. 10-mWT—Paretic Step Length
3.5.4. 10-mWT—Nonparetic Step Length
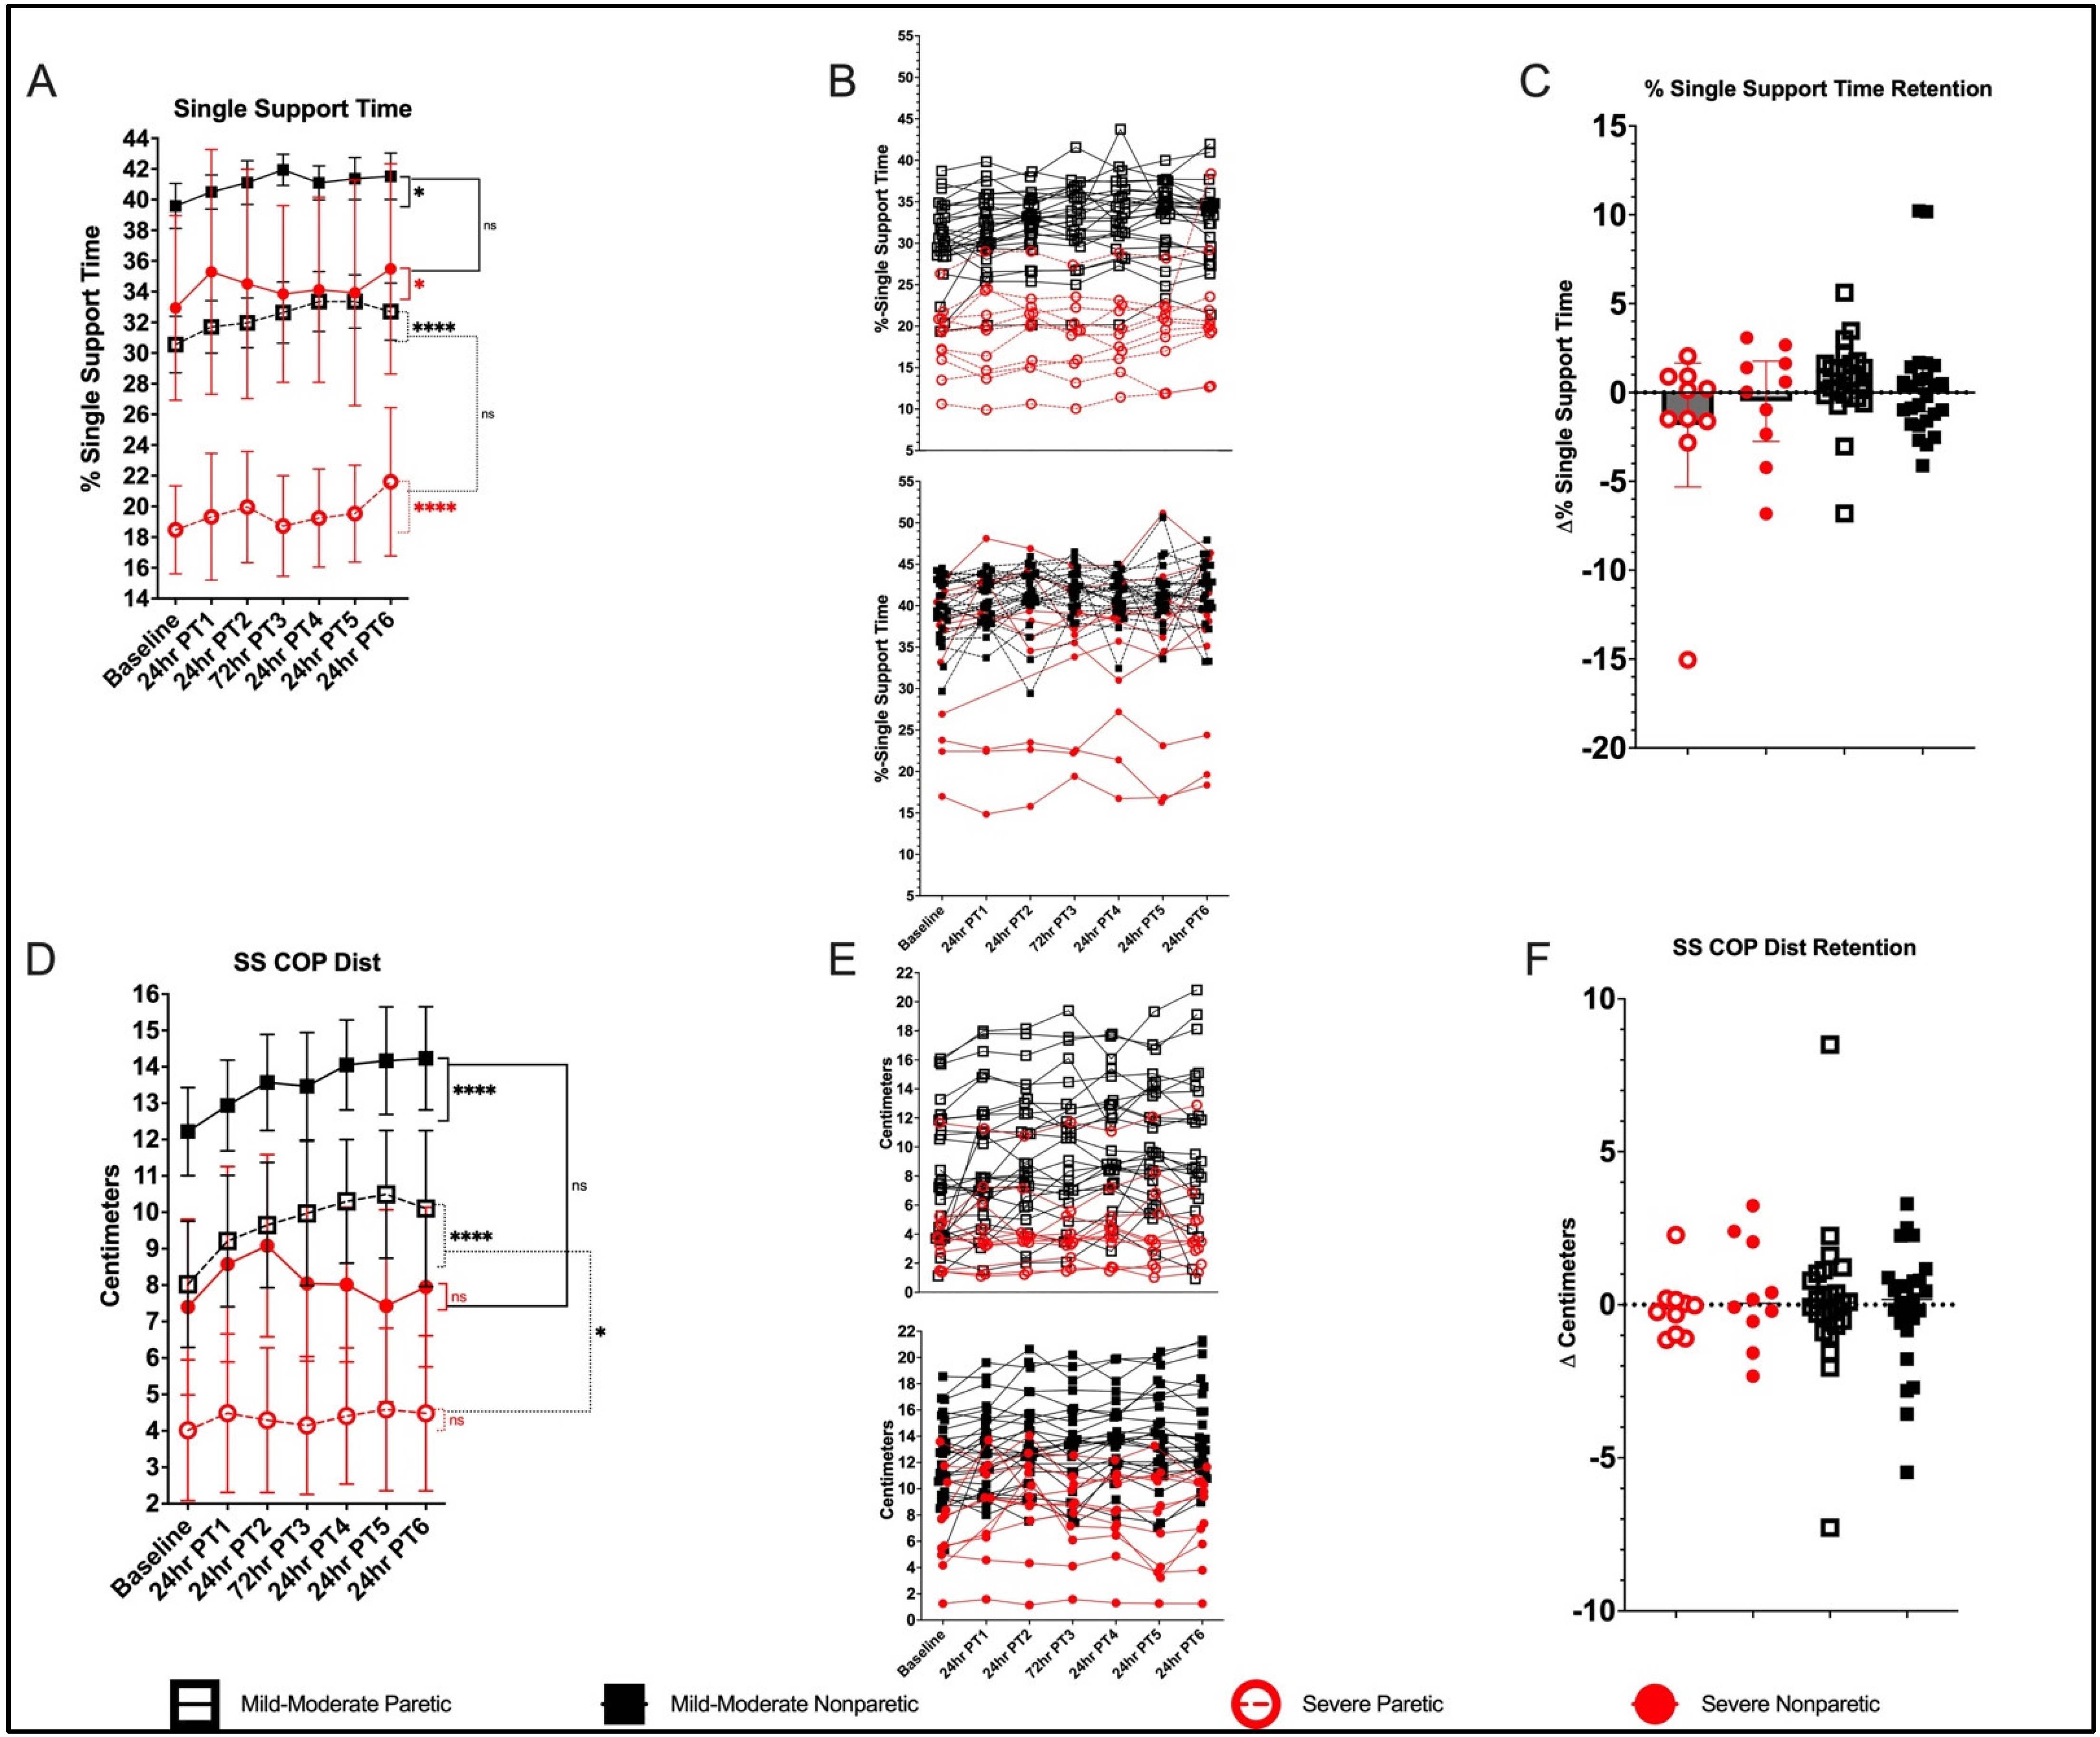
3.5.5. 10-mWT—% SST Paretic
3.5.6. 10-mWT—% SST Nonparetic
3.5.7. 10-mWT—SSCOP Dist. Paretic
3.5.8. 10-mWT—SSCOP Dist. Nonparetic
4. Discussion
Limitations
5. Conclusions
Supplementary Materials
Author Contributions
Funding
Institutional Review Board Statement
Informed Consent Statement
Data Availability Statement
Acknowledgments
Conflicts of Interest
References
- Mozaffarian, D.; Benjamin, E.J.; Go, A.S.; Arnett, D.K.; Blaha,, M.J.; Cushman, M.; Das, S.R.; De Ferranti, S.; Després, J.P.; Fullerton, H.J.; et al. Heart Disease and Stroke Statistics—2016 Update. Circulation 2016, 133, e38–e360. [Google Scholar] [CrossRef] [PubMed]
- Hendricks, H.T.; Limbeek, J.V.; Geurts, A.C.; Zwarts, M.J. Motor recovery after stroke: A systematic review of the literature. Arch. Phys. Med. Rehabil. 2002, 83, 1629–1637. [Google Scholar] [CrossRef] [PubMed]
- Perry, J.; Garrett, M.; Gronley, J.K.; Mulroy, S.J. Classification of walking handicap in the stroke population. Stroke 1995, 26, 982–989. [Google Scholar] [CrossRef] [PubMed]
- Mark, G.B.; Chitralakshmi, K.B.; Andrea, L.B.; Steven, A.K. Validation of a Speed-Based Classification System Using Quantitative Measures of Walking Performance Poststroke. Neurorehabil. Neural Repair 2008, 22, 672–675. [Google Scholar] [CrossRef] [PubMed] [Green Version]
- Duncan, P.W.; Sullivan, K.J.; Behrman, A.L.; Azen, S.P.; Wu, S.S.; Nadeau, S.E.; Dobkin, B.H.; Rose, D.K.; Tilson, J.K.; Cen, S.; et al. Body-weight-supported treadmill rehabilitation after stroke. N. Engl. J. Med. 2011, 364, 2026–2036. [Google Scholar] [CrossRef] [Green Version]
- Langhorne, P.; Stott, D.J.; Robertson, L.; MacDonald, J.; Jones, L.; McAlpine, C.; Dick, F.; Taylor, G.S.; Murray, G. Medical Complications after Stroke. Stroke 2000, 31, 1223–1229. [Google Scholar] [CrossRef] [PubMed]
- Dean, C.M.; Ada, L.; Lindley, R.I. Treadmill training provides greater benefit to the subgroup of community-dwelling people after stroke who walk faster than 0.4 m/s: A randomised trial. J. Physiother. 2014, 60, 97–101. [Google Scholar] [CrossRef] [PubMed] [Green Version]
- Kim, D.-K.; Oh, D.-W. Repeated Use of 6-min Walk Test with Immediate Knowledge of Results for Walking Capacity in Chronic Stroke: Clinical Trial of Fast versus Slow Walkers. J. Stroke Cerebrovasc. Dis. 2019, 28, 104337. [Google Scholar] [CrossRef] [PubMed]
- Hornby, T.G.; Henderson, C.E.; Holleran, C.L.; Lovell, L.; Roth, E.J.; Jang, J.H. Stepwise Regression and Latent Profile Analyses of Locomotor Outcomes Poststroke. Stroke 2020, 51, 3074–3082. [Google Scholar] [CrossRef] [PubMed]
- Veerbeek, J.; Wegen, E.V.; Peppen, R.V.; Wees, P.V.D.; Hendriks, E.; Rietberg, M.; Kwakkel, G. What Is the Evidence for Physical Therapy Poststroke? A Systematic Review and Meta-Analysis. PLoS ONE 2014, 9, e87987. [Google Scholar] [CrossRef] [PubMed] [Green Version]
- Saunders, D.H.; Greig, C.A.; Mead, G.E. Physical Activity and Exercise after Stroke. Stroke 2018, 45, 3742–3747. [Google Scholar] [CrossRef] [PubMed] [Green Version]
- Kovacevic, A.; Fenesi, B.; Paolucci, E.; Heisz, J.J. The effects of aerobic exercise intensity on memory in older adults. Appl. Physiol. Nutr. Metab. 2020, 45, 591–600. [Google Scholar] [CrossRef] [PubMed]
- Kleindorfer, D.O.; Towfighi, A.; Chaturvedi, S.; Cockroft, K.M.; Gutierrez, J.; Lombardi-Hill, D.; Kamel, H.; Kernan, W.N.; Kittner, S.J.; Leira, E.C.; et al. 2021 Guideline for the Prevention of Stroke in Patients With Stroke and Transient Ischemic Attack: A Guideline From the American Heart Association/American Stroke Association. Stroke 2021, 52, e364–e467. [Google Scholar] [CrossRef] [PubMed]
- Wouter, H.; Pieter, M.; Jacques, D. Steps Forward in Understanding Backward Gait: From Basic Circuits to Rehabilitation. Exerc. Sport Sci. Rev. 2014, 42, 23–29. [Google Scholar] [CrossRef]
- Wei-Ya, Y.H.; Yan, C. Backward walking training improves balance in school-aged boys. Sports Med. Arthrosc. Rehabil. Ther. Technol. 2011, 3, 24. [Google Scholar] [CrossRef] [Green Version]
- Awosika, O.O.; Sandrini, M.; Volochayev, R.; Thompson, R.M.; Fishman, N.; Wu, T.; Floeter, M.; Hallett, M.; Cohen, L.G. Transcutaneous Spinal Direct Current Stimulation Improves Locomotor Learning in Healthy Humans. Brain Stimul. 2019, 12, 628–634. [Google Scholar] [CrossRef] [Green Version]
- Wang, J.; Xu, J.; An, R. Effectiveness of Backward Walking Training on Balance Performance: A Systematic Review and Meta-analysis. Gait Posture 2019, 68, 466–475. [Google Scholar] [CrossRef] [PubMed]
- Dewolf, A.H.; Sylos-Labini, F.; Cappellini, G.; Ivanenko, Y.; Lacquaniti, F. Age-related changes in the neuromuscular control of forward and backward locomotion. PLoS ONE 2021, 16, e0246372. [Google Scholar] [CrossRef] [PubMed]
- Madeleine, E.H.; Gammon, M.E. Backward walking in Parkinson’s disease. Mov. Disord. 2009, 24, 218–223. [Google Scholar] [CrossRef] [PubMed]
- Madeleine, E.H.; Gammon, M.E. The effects of a secondary task on forward and backward walking in Parkinson’s disease. Neurorehabil. Neural Repair 2010, 24, 97–106. [Google Scholar] [CrossRef] [PubMed] [Green Version]
- Sung-Gyung, G.K.; Young, U.R.; Hyun, D.J.; Ji, H.J.; Hyeong-Dong, D.K. Backward walking treadmill therapy can improve walking ability in children with spastic cerebral palsy: A pilot study. Int. J. Rehabil. Res. 2013, 36, 246–252. [Google Scholar] [CrossRef] [PubMed]
- El-Basatiny, H.M.Y.; Abdel-Aziem, A.A. Effect of backward walking training on postural balance in children with hemiparetic cerebral palsy: A randomized controlled study. Clin. Rehabil. 2014, 29, 457–467. [Google Scholar] [CrossRef]
- Amr, A.A.-A.; Heba, M.E.-B. Effectiveness of backward walking training on walking ability in children with hemiparetic cerebral palsy: A randomized controlled trial. Clin. Rehabil. 2016, 31, 790–797. [Google Scholar] [CrossRef]
- Rashij, M.; Rai, H.R.; Sivapriya, R.; Rintu, N.; Linshina, T. Resisted Backward Walking to Improve Gait Synergism in Children with Hemiparetic Cerebral Palsy. Indian J. Physiother. Occup. Int. J. 2017, 11, 74–78. [Google Scholar] [CrossRef]
- Elnahhas, A.M.; Elshennawy, S.; Aly, M.G. Effects of backward gait training on balance, gross motor function, and gait in children with cerebral palsy: A systematic review. Clin. Rehabil. 2018, 33, 3–12. [Google Scholar] [CrossRef] [PubMed]
- Yea-Ru, Y.; Jyh-Geng, Y.; Ray-Yau, W.; Lu-Lu, Y.; Fu-Kong, L. Gait outcomes after additional backward walking training in patients with stroke: A randomized controlled trial. Clin. Rehabil. 2005, 19, 264–273. [Google Scholar] [CrossRef] [PubMed]
- Changshui, W.; Jun, W.; Xiaoyan, P.; Zengzhi, Y.; Gang, W.; Liping, G.; Chunnuan, H. Effectiveness of backward walking treadmill training in lower extremity function after stroke. Zhonghua Yi Xue Za Zhi 2006, 86, 2635–2638. [Google Scholar]
- Akiyoshi, T.; Saichi, W. Effects of Partial Body Weight Support while Training Acute Stroke Patients to Walk Backwards on a Treadmill—A Controlled Clinical Trial Using Randomized Allocation. J. Phys. Ther. Sci. 2010, 22, 177–187. [Google Scholar] [CrossRef] [Green Version]
- Kyunghoon, K.; Sukmin, L.; Kyoungbo, L. Effects of Progressive Body Weight Support Treadmill Forward and Backward Walking Training on Stroke Patients’ Affected Side Lower Extremity’s Walking Ability. J. Phys. Ther. Sci. 2014, 26, 1923–1927. [Google Scholar] [CrossRef] [PubMed] [Green Version]
- Byung-Hoon, L.; Jin-Gyu, J.; Chan-Kyu, K. Effects of Backward Walking Training in the Gait ability and Foot Pressure of Hemiplegia Patients. J. Korea Acad. Ind. Coop. Soc. 2014, 15, 7259–7265. [Google Scholar] [CrossRef] [Green Version]
- Rose, D.K.; DeMark, L.; Fox, E.J.; Clark, D.J.; Wludyka, P. A Backward Walking Training Program to Improve Balance and Mobility in Acute Stroke. J. Neurol. Phys. Ther. 2018, 42, 12–21. [Google Scholar] [CrossRef] [PubMed]
- Chang, K.-W.; Lin, C.-M.; Yen, C.-W.; Yang, C.-C.; Tanaka, T.; Guo, L.-Y. The Effect of Walking Backward on a Treadmill on Balance, Speed of Walking and Cardiopulmonary Fitness for Patients with Chronic Stroke: A Pilot Study. Int. J. Environ. Res. Public 2021, 18, 2376. [Google Scholar] [CrossRef] [PubMed]
- Grasso, R.; Bianchi, L.; Lacquaniti, F. Motor patterns for human gait: Backward versus forward locomotion. J. Neurophysiol. 1998, 80, 1868–1885. [Google Scholar] [CrossRef] [Green Version]
- Winter, D.A. Biomechanics of normal and pathological gait: Implications for understanding human locomotor control. J. Mot. Behav. 1989, 21, 337–355. [Google Scholar] [CrossRef]
- Thorstensson, A. How is the normal locomotor program modified to produce backward walking? Exp. Brain Res. 1986, 61, 664–668. [Google Scholar] [CrossRef] [PubMed]
- Winter, D.A.; Pluck, N.; Yang, J.F. Backward walking: A simple reversal of forward walking? J. Mot. Behav. 1989, 21, 291–305. [Google Scholar] [CrossRef]
- Schneider, C.; Capaday, C. Progressive Adaptation of the Soleus H-Reflex With Daily Training at Walking Backward. J. Neurophysiol. 2003, 89, 648–656. [Google Scholar] [CrossRef] [PubMed]
- Kurz, M.J.; Wilson, T.W.; Arpin, D.J. Stride-time variability and sensorimotor cortical activation during walking. NeuroImage 2012, 59, 1602–1607. [Google Scholar] [CrossRef] [PubMed]
- Lin, N.-H.; Liu, C.-H.; Lee, P.; Guo, L.-Y.; Sung, J.-L.; Yen, C.-W.; Liaw, L.-J. Backward Walking Induces Significantly Larger Upper-Mu-Rhythm Suppression Effects than Forward Walking Does. Sensors 2020, 20, 7250. [Google Scholar] [CrossRef] [PubMed]
- Wernig, A.; Wernig, S. The Trouble with “Body Weight Support” in Treadmill Training. Arch. Phys. Med. Rehabil. 2010, 91, 1478. [Google Scholar] [CrossRef] [PubMed]
- Awosika, O.O.; Matthews, S.; Staggs, E.J.; Boyne, P.; Song, X.; Rizik, B.A.; Sucharew, H.J.; Zhang, C.; Mungcal, G.; Moudgal, R.; et al. Backward locomotor treadmill training combined with transcutaneous spinal direct current stimulation in stroke: A randomized pilot feasibility and safety study. Brain Commun. 2020, 2, fcaa045. [Google Scholar] [CrossRef] [Green Version]
- Bocci, T.; Marceglia, S.; Vergari, M.; Cognetto, V.; Cogiamanian, F.; Sartucci, F.; Priori, A. Transcutaneous spinal direct current stimulation modulates human corticospinal system excitability. J. Neurophysiol. 2015, 114, 440–446. [Google Scholar] [CrossRef] [PubMed] [Green Version]
- Kroenke, K.; Spitzer, R.L.; Williams, J.B.W. The PHQ-9. J. Gen. Intern. Med. 2001, 16, 606–613. [Google Scholar] [CrossRef] [PubMed]
- Chen, Z.-H.; Ye, X.-L.; Chen, W.-J.; Chen, G.-Q.; Wu, J.-T.; Wu, H.; Xu, X.-M. Effectiveness of backward walking for people affected by stroke: A systematic review and meta-analysis of randomized controlled trials. Medicine 2020, 99, e20731. [Google Scholar] [CrossRef] [PubMed]
- Laufer, Y. Effect of age on characteristics of forward and backward gait at preferred and accelerated walking speed. J. Gerontol. A Biol. Sci. Med. Sci. 2005, 60, 627–632. [Google Scholar] [CrossRef]
- Ayoub, H.E.S.A.A. Impact of Body Weight Supported Backward Treadmilltraining on Walking Speed in Children with Spastic Diplegia. Int. J. Physiother. 2016, 3, 485–489. [Google Scholar] [CrossRef]
- Schroeder, H.P.V.; Coutts, R.D.; Lyden, P.D.; Billings, E.; Nickel, V.L. Gait parameters following stroke: A practical assessment. J. Rehabil. Res. Dev. 1995, 32, 25–31. [Google Scholar]
- Fettrow, T.; Reimann, H.; Grenet, D.; Crenshaw, J.; Higginson, J.; Jeka, J. Walking Cadence Affects the Recruitment of the Medial-Lateral Balance Mechanisms. Front. Sports Act. Living 2019, 1, 40. [Google Scholar] [CrossRef] [PubMed] [Green Version]
- Schmid, A.A.; Rittman, M. Consequences of Poststroke Falls: Activity Limitation, Increased Dependence, and the Development of Fear of Falling. Am. J. Occup. Ther. 2009, 63, 310–316. [Google Scholar] [CrossRef] [PubMed] [Green Version]
- Guimaraes, R.M.; Isaacs, B. Characteristics of the gait in old people who fall. Int. Rehabil. Med. 2009, 2, 177–180. [Google Scholar] [CrossRef] [PubMed]
- Roth, E.J.; Merbitz, C.; Mroczek, K.; Dugan, S.A.; Suh, W.W. Hemiplegic gait. Relationships between walking speed and other temporal parameters. Am. J. Phys. Med. Rehabil. Assoc. Acad. Physiatr. 1997, 76, 128–133. [Google Scholar] [CrossRef] [PubMed]
- Li, S.; Francisco, G.E.; Zhou, P. Post-stroke Hemiplegic Gait: New Perspective and Insights. Front. Physiol. 2018, 9, 1021. [Google Scholar] [CrossRef] [PubMed] [Green Version]
- Mizelle, C.; Rodgers, M.; Forrester, L. Bilateral foot center of pressure measures predict hemiparetic gait velocity. Gait Posture 2006, 24, 356–363. [Google Scholar] [CrossRef] [PubMed]
- Chisholm, A.E.; Perry, S.D.; McIlroy, W.E. Inter-limb centre of pressure symmetry during gait among stroke survivors. Gait Posture 2011, 33, 238–243. [Google Scholar] [CrossRef] [PubMed] [Green Version]
- Alghadir, A.H.; Anwer, S.; Sarkar, B.; Paul, A.K.; Anwar, D. Effect of 6-week retro or forward walking program on pain, functional disability, quadriceps muscle strength, and performance in individuals with knee osteoarthritis: A randomized controlled trial (retro-walking trial). BMC Musculoskelet. Disord. 2019, 20, 159. [Google Scholar] [CrossRef] [PubMed]
- Sedhom, M.G. Backward Walking Training Improves Knee Proprioception in Non Athletic Males. Int. J. Physiother. 2017, 4, 33–37. [Google Scholar] [CrossRef]
- Shen, M.; Che, S.; Ye, D.; Li, Y.; Lin, F.; Zhang, Y. Effects of backward walking on knee proprioception after ACL reconstruction. Physiother. Theory Pract. 2019, 37, 1109–1116. [Google Scholar] [CrossRef] [PubMed]
- Macko, R.F.; Ivey, F.M.; Forrester, L.W. Task-oriented aerobic exercise in chronic hemiparetic stroke: Training protocols and treatment effects. Top. Stroke Rehabil. 2005, 12, 45–57. [Google Scholar] [CrossRef]
- Collett, J.; Fleming, M.K.; Meester, D.; Al-Yahya, E.; Wade, D.T.; Dennis, A.; Salvan, P.; Meaney, A.; Cockburn, J.; Dawes, J.; et al. Dual-task walking and automaticity after Stroke: Insights from a secondary analysis and imaging sub-study of a randomised controlled trial. Clin. Rehabil. 2021, 35. [Google Scholar] [CrossRef] [PubMed]
- Mehrholz, J.; Thomas, S.; Elsner, B. Treadmill training and body weight support for walking after stroke. Cochrane Database Syst. Rev. 2017. [Google Scholar] [CrossRef] [PubMed]
- Schmid, A.; Duncan, P.W.; Studenski, S.; Lai, S.; Richards, L.; Perera, S.; Wu, S.S. Improvements in Speed-Based Gait Classifications Are Meaningful. Stroke 2007, 38, 2096–2100. [Google Scholar] [CrossRef] [PubMed] [Green Version]
- Plummer, P.; Behrman, A.L.; Duncan, P.W.; Spigel, P.; Saracino, D.; Martin, J.; Fox, E.; Thigpen, M.; Kautz, S.A. Effects of stroke severity and training duration on locomotor recovery after stroke: A pilot study. Neurorehabil. Neural Repair 2007, 21, 137–151. [Google Scholar] [CrossRef]
- Wonsetler, E.C.; Bowden, M.G. A systematic review of mechanisms of gait speed change post-stroke. Part 1: Spatiotemporal parameters and asymmetry ratios. Top. Stroke Rehabil. 2017, 24, 435–446. [Google Scholar] [CrossRef]


| Groups (Severity) | Demographics | ||||||||
|---|---|---|---|---|---|---|---|---|---|
| Gender | Height(cm) | Age (Yr) | MMSE | Stroke Location | Type (I vs. H) | Stroke Age (Mo) | Assistive Device | ||
| Mild–Moderate (>0.4 m/s) | BLTT-3 | F | 162 | 47.43 | 29 | L MCA | I | 37.80 | AB |
| BLTT-7 | F | 170 | 51.12 | 27 | R MCA | I | 76.71 | AFO | |
| BLTT-9 | M | 182 | 56.04 | 29 | L Basal Ganglia | I | 172.5 * | ||
| BLTT-11 | M | 172 | 69.81 | 28 | L PCA | I | 36.53 | - | |
| BLTT-14 | M | 182 | 65.11 | 28 | R Basal Ganglia | I | 33.18 | - | |
| BLTT-19 | M | 177 | 64.51 | 25 | L ACA/MCA | I | 140.3 * | - | |
| BLTT-21 | F | 172 | 54.79 | 30 | L MCA | I | 12.42 | AFO | |
| BLTT-48 | M | 182 | 57.85 | 27 | LMCA | I | 11.31 | - | |
| BLTT-2 | F | 167 | 38.01 | 28 | L MCA/PCA | H | 68.13 | AFO | |
| BLTT-4 | M | 182 | 62.32 | 29 | R ACA | I | 147.6 * | - | |
| BLTT-5 | M | 180 | 33.68 | 30 | L > R Midbrain | H | 11.71 | KFO, KB | |
| BLTT-8 | M | 180 | 63.34 | 26 | R MCA | I | 100.0 * | AFO | |
| BLTT-12 | F | 157 | 63.46 | 26 | L MCA | I | 222.6 * | - | |
| BLTT-13 | M | 175 | 56.93 | 29 | R MCA | I | 18.42 | - | |
| BLTT-17 | F | 172 | 44.07 | 28 | R MCA | I | 8.433 | - | |
| BLTT-20 | F | 170 | 49.69 | 30 | R MCA | H | 41.45 | SKC, AFO | |
| BLTT-23 | M | 167 | 66.78 | 30 | L Cerebellar | I | 9.806 | - | |
| BLTT-24 | F | 162 | 51.52 | 29 | L MCA | I | 9.258 | AFO | |
| BLTT-26 | M | 193 | 57.27 | 28 | L Basal Ganglia | I | 18.23 | - | |
| BLTT-29 | M | 195 | 72.92 | 28 | R > L Cerebellar | I | 18.94 | - | |
| BLTT-30 | M | 177 | 54.73 | 29 | L MCA | H | 48.10 | - | |
| BLTT-32 | F | 160 | 63.02 | 27 | L MCA | I | 166.1 * | - | |
| BLTT-34 | F | 175 | 64.93 | 30 | R Pontine | I | 29.23 | - | |
| BLTT-36 | F | 160 | 69.35 | 28 | L Pontine | I | 10.13 | - | |
| BLTT-39 | F | 162 | 62.16 | 29 | R MCA | I | 82.23 | - | |
| BLTT-40 | F | 170 | 34.73 | 29 | R MCA | I | 28.61 | - | |
| BLTT-44 | F | 162 | 61.33 | 30 | R MCA | I | 74.24 | C | |
| BLTT-46 | M | 170 | 69.60 | 29 | R Basal Ganglia | I | 26.01 | - | |
| Mean ± SD | 172.7 ± 9.684 | 57.38 ± 10.52 | 28.39 ± 1.343 | 59.28 ± 59.25 | |||||
| Severe (≤0.4 m/s) | BLTT-1 | F | 167 | 58.11 | 25 | L MCA | I | 49.40 | WBQC |
| BLTT-16 | M | 172 | 56.74 | 30 | L Basal Ganglia | I | 12.39 | AFO | |
| BLTT-25 | M | 180 | 58.07 | 28 | L MCA | I | 9.226 | C, AFO | |
| BLTT-28 | M | 193 | 53.31 | 30 | R MCA | H | 25.94 | C, AFO | |
| BLTT-33 | F | 165 | 55.93 | 30 | R MCA | I | 20.90 | NBQC | |
| BLTT-37 | F | 167 | 52.98 | 29 | R ACA/Pontine | H | 11.03 | HC, AFO | |
| BLTT-38 | M | 177 | 47.70 | 21 | L MCA | H | 8.548 | HW, AFO | |
| BLTT-41 | M | 177 | 55.51 | 28 | R MCA | I | 34.13 | NBQC, AFO | |
| BLTT-42 | M | 175 | 64.47 | 30 | R MCA | H | 83.31 | WBQC | |
| BLTT-47 | M | 187 | 38.69 | 29 | R MCA | I | 11.28 | NBQC, KFO | |
| BLTT-49 | M | 180 | 69.73 | 29 | R MCA | I | 28.83 | WBQC, AFO | |
| Mean ± SD | 176.4 ± 8.617 | 55.57 ± 8.078 | 28.09 ± 2.773 | 26.82 ± 22.66 | |||||
| p-value | 0.132 | 0.475 | 0.737 | 0.009 | |||||
Publisher’s Note: MDPI stays neutral with regard to jurisdictional claims in published maps and institutional affiliations. |
© 2022 by the authors. Licensee MDPI, Basel, Switzerland. This article is an open access article distributed under the terms and conditions of the Creative Commons Attribution (CC BY) license (https://creativecommons.org/licenses/by/4.0/).
Share and Cite
Awosika, O.O.; Chan, D.; Sucharew, H.J.; Boyne, P.; Bhattacharya, A.; Dunning, K.; Kissela, B.M. Backward Locomotor Treadmill Training Differentially Improves Walking Performance across Stroke Walking Impairment Levels. Brain Sci. 2022, 12, 133. https://doi.org/10.3390/brainsci12020133
Awosika OO, Chan D, Sucharew HJ, Boyne P, Bhattacharya A, Dunning K, Kissela BM. Backward Locomotor Treadmill Training Differentially Improves Walking Performance across Stroke Walking Impairment Levels. Brain Sciences. 2022; 12(2):133. https://doi.org/10.3390/brainsci12020133
Chicago/Turabian StyleAwosika, Oluwole O., Dorothy Chan, Heidi J. Sucharew, Pierce Boyne, Amit Bhattacharya, Kari Dunning, and Brett M. Kissela. 2022. "Backward Locomotor Treadmill Training Differentially Improves Walking Performance across Stroke Walking Impairment Levels" Brain Sciences 12, no. 2: 133. https://doi.org/10.3390/brainsci12020133