Article

Application of Near-Infrared Spectroscopy and Aquaphotomics in Understanding the Water Behavior during Cold Atmospheric Plasma Processing

1
NMPA Key Laboratory for Technology Research and Evaluation of Drug Products, School of Pharmaceutical Sciences, Cheeloo College of Medicine, Shandong University, Jinan 250012, China
2
School of Electrical Engineering, Shandong University, Jinan 250061, China
*
Author to whom correspondence should be addressed.
Appl. Sci. 2024, 14(1), 1; https://doi.org/10.3390/app14010001
Submission received: 12 October 2023 / Revised: 7 December 2023 / Accepted: 13 December 2023 / Published: 19 December 2023
(This article belongs to the Special Issue Spectral Detection: Technologies and Applications)

Abstract

:
Plasma-activated water (PAW), obtained by exposing liquid to cold atmospheric plasma (CAP) for a period, has gained widespread attention for its potential as anti-bacterial, anti-infective, anti-cancer and other biological agents. It is important to understand the PAW behavior and express it in a ‘visualization’ form. Near-infrared spectroscopy (NIR) and aquaphotomics were introduced in this study to investigate the PAW spectra to visualize the water molecular species and try to analyze the production and changes of the active substances in PAW. Second-order derivative, PCA and PLS were applied to identify specific peaks to construct the aquagram and reference method for the ROS assay used to prove the spectral results. The results showed that a longer treatment time resulted in greater spectral changes which could be visualized with 12 water matrix coordinates (WAMACS) and the change trends were in accordance with the ROS concentration variations. Furthermore, during PAW sample storage, there were fluctuations in spectral changes, with a general trend of increase, and a gradual decrease in ROS concentration due to active substance reactions in PAW. In conclusion, this study presents a new perspective on examining the water behavior of PAW and offers a new method to explore cold plasma biomedical materials.

1. Introduction

Plasma is the fourth state of matter besides solid, liquid, and gas. An ionized gaseous substance includes reactive substances, free radicals, and photons. It is worth noting that 99% of visible matter in the universe exists in plasma form [1]. One particular type of plasma, known as cold atmospheric plasma (CAP), has garnered attention in the biomedical field due to its energetic property and low gas temperature. CAP contains reactive oxygen and nitrogen species (RONS), including reactive oxygen species (ROS) and reactive nitrogen species (RNS). These species have shown promising potential in producing a range of biological effects such as antimicrobial, anti-infective, and anticancer effects [2,3,4,5,6]. When plasma is used to treat a liquid, it produces a solution called plasma-activated water (PAW), a new type of electrochemical biocide [7]. PAW has also demonstrated anticancer properties, which makes it a valuable area for further research [8]. The biomedical applications of PAW depend mainly on the RONS generated therein [9], which are the result of reactions in plasma chemistry [10,11]. The two most used plasmas in biomedical applications are dielectric barrier discharge (DBD) plasma and atmospheric pressure jet plasma, which are generated by their corresponding generator devices [12]. Dielectric barrier discharge (DBD) devices consist of two parallel electrode plates, where one electrode is connected to a high-voltage source and the other is grounded [13]. For some specific clinical treatments, such as wound treatment and tumor treatment, the target to be treated cannot be placed between the two electrode plates, making the application of DBD devices limited. Plasma jet devices deliver the working gas from one end of the jet tube, ionize the gas inside the jet tube by designing a suitable electrode structure, and then spray the resulting discharge plasma into the air from the other end of the jet tube [14]. This design is more advantageous than the DBD device. Moreover, when treating the sample, the energetic particles generated by the jet plasma will have a direct chemical reaction with the active molecules in the air, generating a large amount of RONS and transporting them to the sample. Therefore, this study chose the plasma jet device as the CAP generation device.
Following CAP treatment, the PAW contains ROS and RNS [15], which are general terms for a group of substances that are not a single species. ROS includes several species such as singlet oxygen O 2 1 , superoxide anion radical O 2 , hydroxyl radical HO , superoxide radical HOO , ozone O 3 , hydrogen peroxide H 2 O 2 , etc. [7,10,16,17]. However, singlet oxygen O 2 1 and hydroxyl radical HO have a short lifespan in water. Ozone O 3 reacts quickly with nitrite NO 2 due to its high oxidation. Superoxide anion radical O 2 and superoxide radical HOO undergo disproportionation reactions at a fast rate in PAW, and superoxide anion radical O 2 can also undergo bimolecular self-reactions. Although hydrogen peroxide H 2 O 2 reacts with other reactive substances, it has a long lifespan and can be detected. On the other hand, RNS comprises nitrite NO 2 , nitrate NO 3 , nitric oxide NO, nitrogen dioxide NO 2 , peroxynitrite ONOOH and OONOOH, and so on [7,16,18]. Nitric oxide NO and nitrogen dioxide NO 2 have a short lifespan in water and undergo a series of reactions to produce the more stable nitrite NO 2 and nitrate NO 3 . Peroxynitrite ONOOH and OONOOH are unstable in water and decompose rapidly. Nitrite NO 2 reacts with oxidizing species in the PAW but has a longer lifespan, whereas nitrate NO 3 is highly stable in water. The various species have different half-lives and react with each other in PAWs, making it challenging and time-consuming to detect them all. Therefore, this study only analyzed long-lived species in PAWs [12,17,18].
Various techniques have been utilized by researchers to identify the concentration of RONS in PAW. For example, Bhagirath Ghimire et al. measured the concentration of H 2 O 2 by assessing the absorbance value at 450 nm of the reaction product of H 2 O 2 -induced oxidation of o-phenylenediamine, 2-3-diaminophenylazine. Additionally, they employed the Griess reagent kit to measure the concentration of NO 2 [19]. Meanwhile, Vikas Rathore and Sudhir Kumar Nema employed multiple methods, such as the NO 3 ion UV shielding method, NO 2 ion Griess reagent method, H 2 O 2 titanium oxide sulfate method, and dissolved O 3 indigo colorimetric method, to evaluate RONS in PAW while investigating its properties [12]. Despite the accuracy of these methods in detecting specific RONS species in PAW, they do not provide a comprehensive view of PAW as a whole. Jun-Seok Oh et al. used a UV-visible spectroscopic method and a curve-fitting procedure to well describe the chemical properties of long-lived RONS and O 2 in PAWs, and investigated the effects of two parameters, the exposure time of the plasma jet and the treatment distance, on the concentration of RONS [15]. This is a method that can comprehensively reflect the chemical properties of active substances in PAW. Similarly, the combination of near-infrared (NIR) spectroscopy and aquaphotomics used in this study reflected the corresponding chemical properties of PAW.
NIR spectroscopy serves as a vital analytical tool in aquaphotomics. The NIR region 680–2500 nm proves to be an excellent tool for water observation [20] and offers abundant information about water molecule structure in this range. This information facilitates the deconstruction of the physicochemical properties of water systems. Aquaphotomics is an emerging scientific discipline for the study of water and aqueous systems, founded in 2005 by Professor Roumiana Tsenkova of Kobe University, Japan [21,22,23]. Work in aquaphotomics is mainly performed using NIR spectroscopy.
In aquaphotomics, water structural information is related to the water system under study, and using light-water interactions, many different absorption bands reflecting the structural information of water can be obtained [24,25,26,27]. By collecting a large amount of spectral data and combining chemometric methods to analyze the spectral data, removing non-essential effects, and identifying highly reproducible and characteristic wavelengths, the water matrix coordinates (WAMACS) containing the characteristic absorption bands with high contribution in all spectral models were established [20,27]. Using WAMACS as a reference, it is possible to determine the production and changes of RONS in the PAW.
Chemiluminescence (CL) is one of the most common means of detecting ROS. The basic principle is to use the energy released by the chemical reaction between ROS and the detection agent to excite the product molecules, causing the electrons to undergo a non-radiative jump, and the energy is released in the form of photons when they return to the ground state. The concentration of ROS can be measured by using an instrument to detect the light intensity [17]. Based on chemiluminescence, the fluorescent probe method has been gradually derived. The fluorescent probe method uses a fluorescent probe with reducing properties to react with ROS and indirectly detects the presence and content of ROS by measuring the fluorescence intensity. This method has the advantages of high sensitivity and precision, easy operation, and good reproducibility, and is widely used in the biological field [17]. The working solution of the ROS kit comprises fluorescent probes possessing reducing properties, which follows the fluorescent probe method’s principles. This kit has a great advantage in that it can detect all ROS species in the sample, which greatly simplifies the experimental operation and reduces the experimental cost.
In this study, we used a plasma jet device to treat double-distilled water to obtain different PAW samples. The aqueous behavior of PAW was explored using aquaphotomics and near-infrared spectroscopy, as well as the detection of ROS in PAW using a humoral active oxygen kit. The aim was to investigate the generation and change pattern of active substances in PAW by detecting the perturbation of the aqueous system caused by the active substances in PAW. The results showed that the active substances in PAW increased with the treatment time, and the active substances were changing in PAW with some regularity. With this analytical tool, we hope to gain insights into the changes in the structure of water in PAW and apply it to the study of the physicochemical properties of other CAP products.

2. Materials and Methods

2.1. Materials and Reagents

Deionized water (18.2 MΩ·cm, Millipore, Academic, Burlington, MA, USA) was obtained in our lab, and a body-fluid reactive oxygen species (ROS) detection kit was purchased from BestBio, Shanghai, China (BB-460517).

2.2. Preparation of PAW

The PAW samples were obtained by placing 5 mL of double-distilled water in a 4 cm bottom diameter Petri dish and treating it with a CAP jet device for 5, 10, and 15 min. The specific parameters of the plasma jet are as follows: The working gas is argon only and the flow rate is 1000 mL/min. The power supply waveform is pulsed, with a 400 ns pulse width. The discharge frequency is 5 kHz and the discharge voltage is sinusoidal with a voltage amplitude of 16 kV. The discharge image of the plasma jet device is shown in Figure 1.

2.3. Acquisition of NIR Spectra

The PAW NIR spectra were obtained using a spectrometer (Matrix-F, Bruker, Billerica, MA, USA) in transmission mode with a temperature controller (qpod/MPKIT, Quantum Northwest) at 25 °C. The spectra were obtained in the range of 12,000 to 4000 cm−1 (wavelength range: 833–2500 nm). The cuvette optical path was 1 mm and the spectra were also referenced to air with a resolution of 4 cm−1 and 32 scans. Three consecutive spectra were acquired for each sample, and all background spectra were subtracted to obtain the spectrum of the original sample to be processed. Before each measurement, the samples were left in a light-proof environment for 2 h.
Likewise, measurements were conducted on PAW samples exposed to 0.5 h intervals every 8 h for 15 min. The measurements were taken directly from the instrument without any removal of the samples, and this experiment was repeated thrice for accuracy.

2.4. Spectra Processing and Analysis

Raw NIR spectra of water systems are often difficult to directly extract useful information about the samples, so three different data-processing methods were used to extract information about the water during plasma treatment. Prior to data processing, the x-axis of all NIR spectra in this study was converted from wavenumber to wavelength by dividing 1 by the wavenumber since it is suitable for aquaphotomics analysis. Three consecutive spectra were averaged and the range from 1300 to 1860 nm (data points: 1202), which contains most water information, was selected for further analysis. The Unscrambler X 10.4 (64-bit) software and MATLAB R2022a software (MathWorks Inc., Natick, MA, USA) were introduced for data analysis.

2.4.1. Second-Order-Derivative Method

We used the standard normal variational transform (SNV) for baseline correction to ensure accuracy and consistency between samples. The Savitzky–Golay second-order-derivative (filter width 13, polynomial order 2, derivative order, 2) approach was applied to improve the resolution and allow us to uncover water-related information that leads to an understanding of the production and change in active substances in the PAW.

2.4.2. Principal Component Analysis (PCA)

Principal Component Analysis (PCA) was also used to identify WAMACS. The spectra were analyzed using SNV and the Savitzky–Golay second-order-derivative method before PCA analysis. PCA was performed and the loadings were calculated and used for WAMACS identification.

2.4.3. Partial Least Squares (PLS)

We used partial least squares (PLS) to identify 12 specific wavelengths, which are characteristic wavelengths with high reproducibility and significant variations over the measured spectral range. For the PLS procedure, the storage time was used as reference data, and the principal components were chosen using the 5-fold cross-validation method. The resulting regression coefficient curves were then used for WAMACS identification. Finally, wavelengths were selected to represent the spectral variations which could be used to construct the aquagram mirror.

2.4.4. Aquagram Calculation

The absorbance values at specific WAMACS define the water spectral pattern (WASP) [27], which can be visualized by a chart called the aquagram [28]. The 12 most influential wavelengths selected using the Savitzky–Golay second-order-derivative, PCA and PLS methods are used to display the absorption spectral pattern of each water on the aquagram. The aquagram displays the normalized and averaged absorbance values of the sample spectra on a radial axis. The radial axis is defined by the 12 selected wavelengths. The normalized absorbance was calculated using Equation (1).
A λ = A λ μ λ σ λ
where A λ is the normalized absorbance shown on the aqueous spectrum, A λ is the absorbance after the second-order-derivative treatment, μ λ is the mean of all spectra of the treated sample, σ λ is the standard deviation of all spectra of the treated sample, and λ is the selected wavelength.

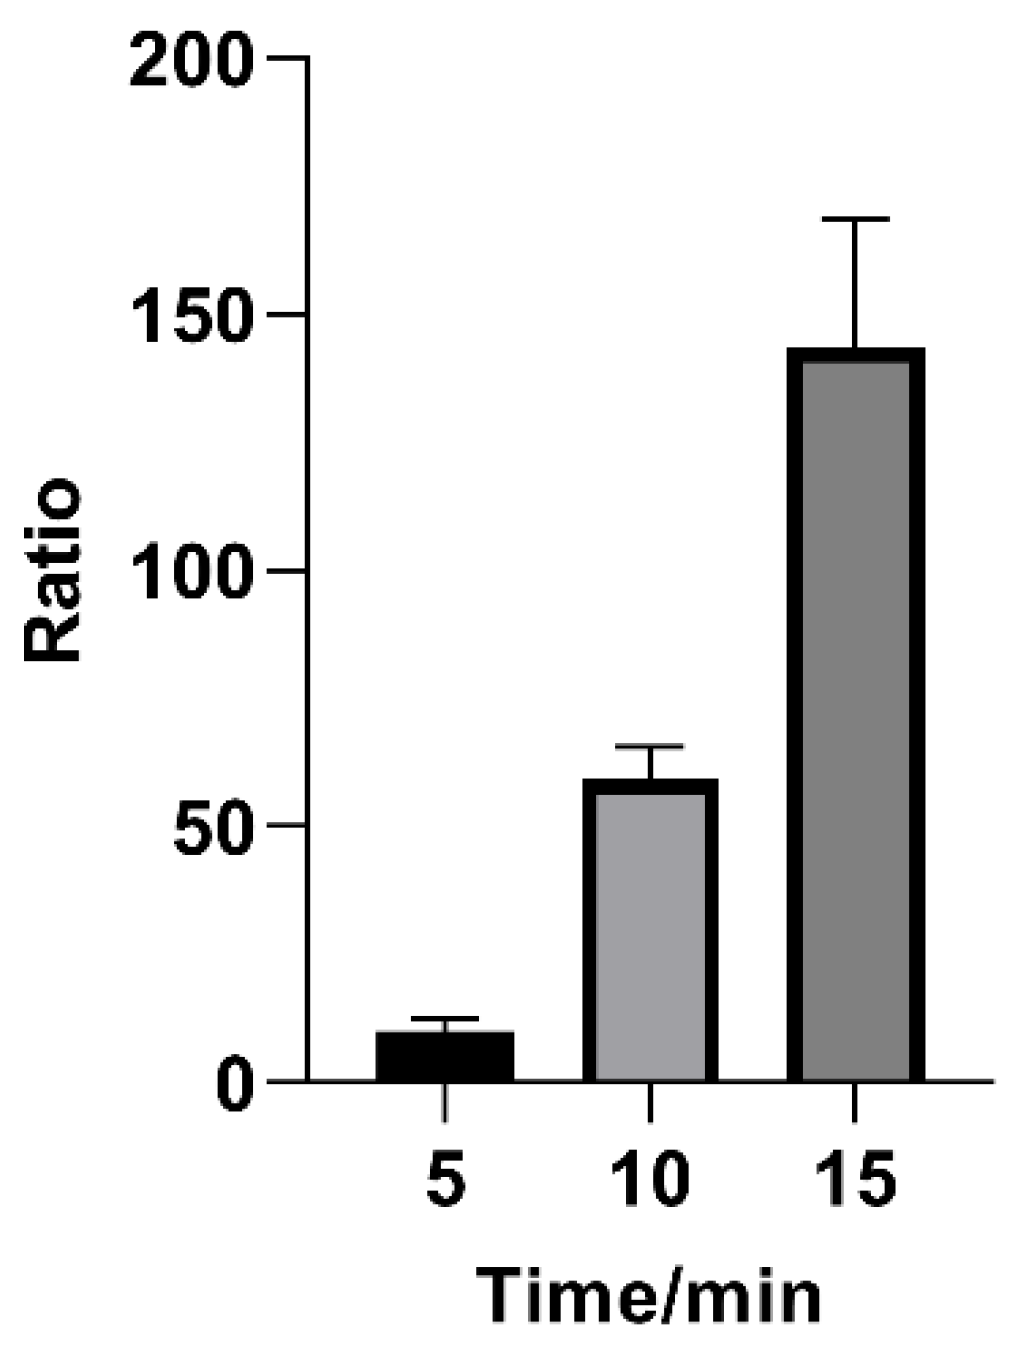
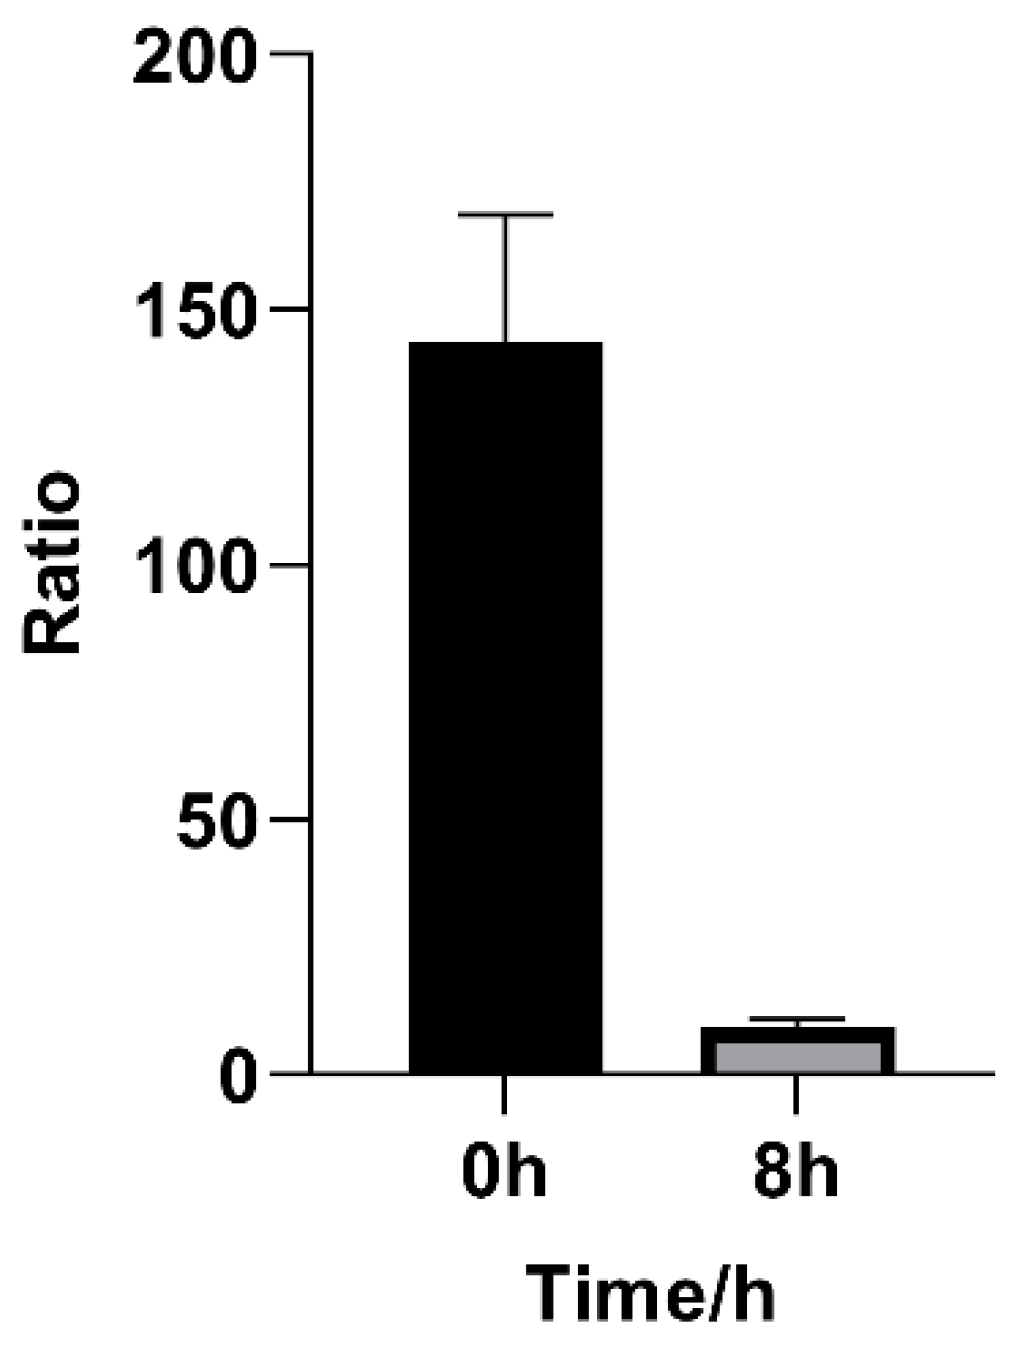
2.5. Kit Assay for ROS

We used a reactive oxygen species kit assay to determine the concentration of ROS in PAW. To prepare for the experiment, the active oxygen O06 probe in the kit is dispensed into several sets of 3 µL test tubes and stored according to the kit’s specific requirements. Before each use, the storage solution is diluted by a factor of 10 to obtain the working solution required for the experiment. To conduct the experiment, 10 µL working solution and 100 µL sample are thoroughly mixed in a black 96-well plate using a pipette. The mixture is then incubated for 20 min at 37 °C, protected from light, and placed in a microplate reader (Synergy H1, BioTek Instruments, Inc., Winooski, VT, USA) to detect fluorescence intensity at an excitation wavelength of 488 nm and an emission wavelength of 520 nm. By comparing the fluorescence intensity of the sample to that of the blank control, the ROS concentration in different samples can be determined. The fluorescence intensity data are then analyzed using GraphPad Prism 8.4.2 software (Graphpad Software Inc., San Diego, CA, USA) to obtain a final graph of the experimental comparison results.

3. Results and Discussion

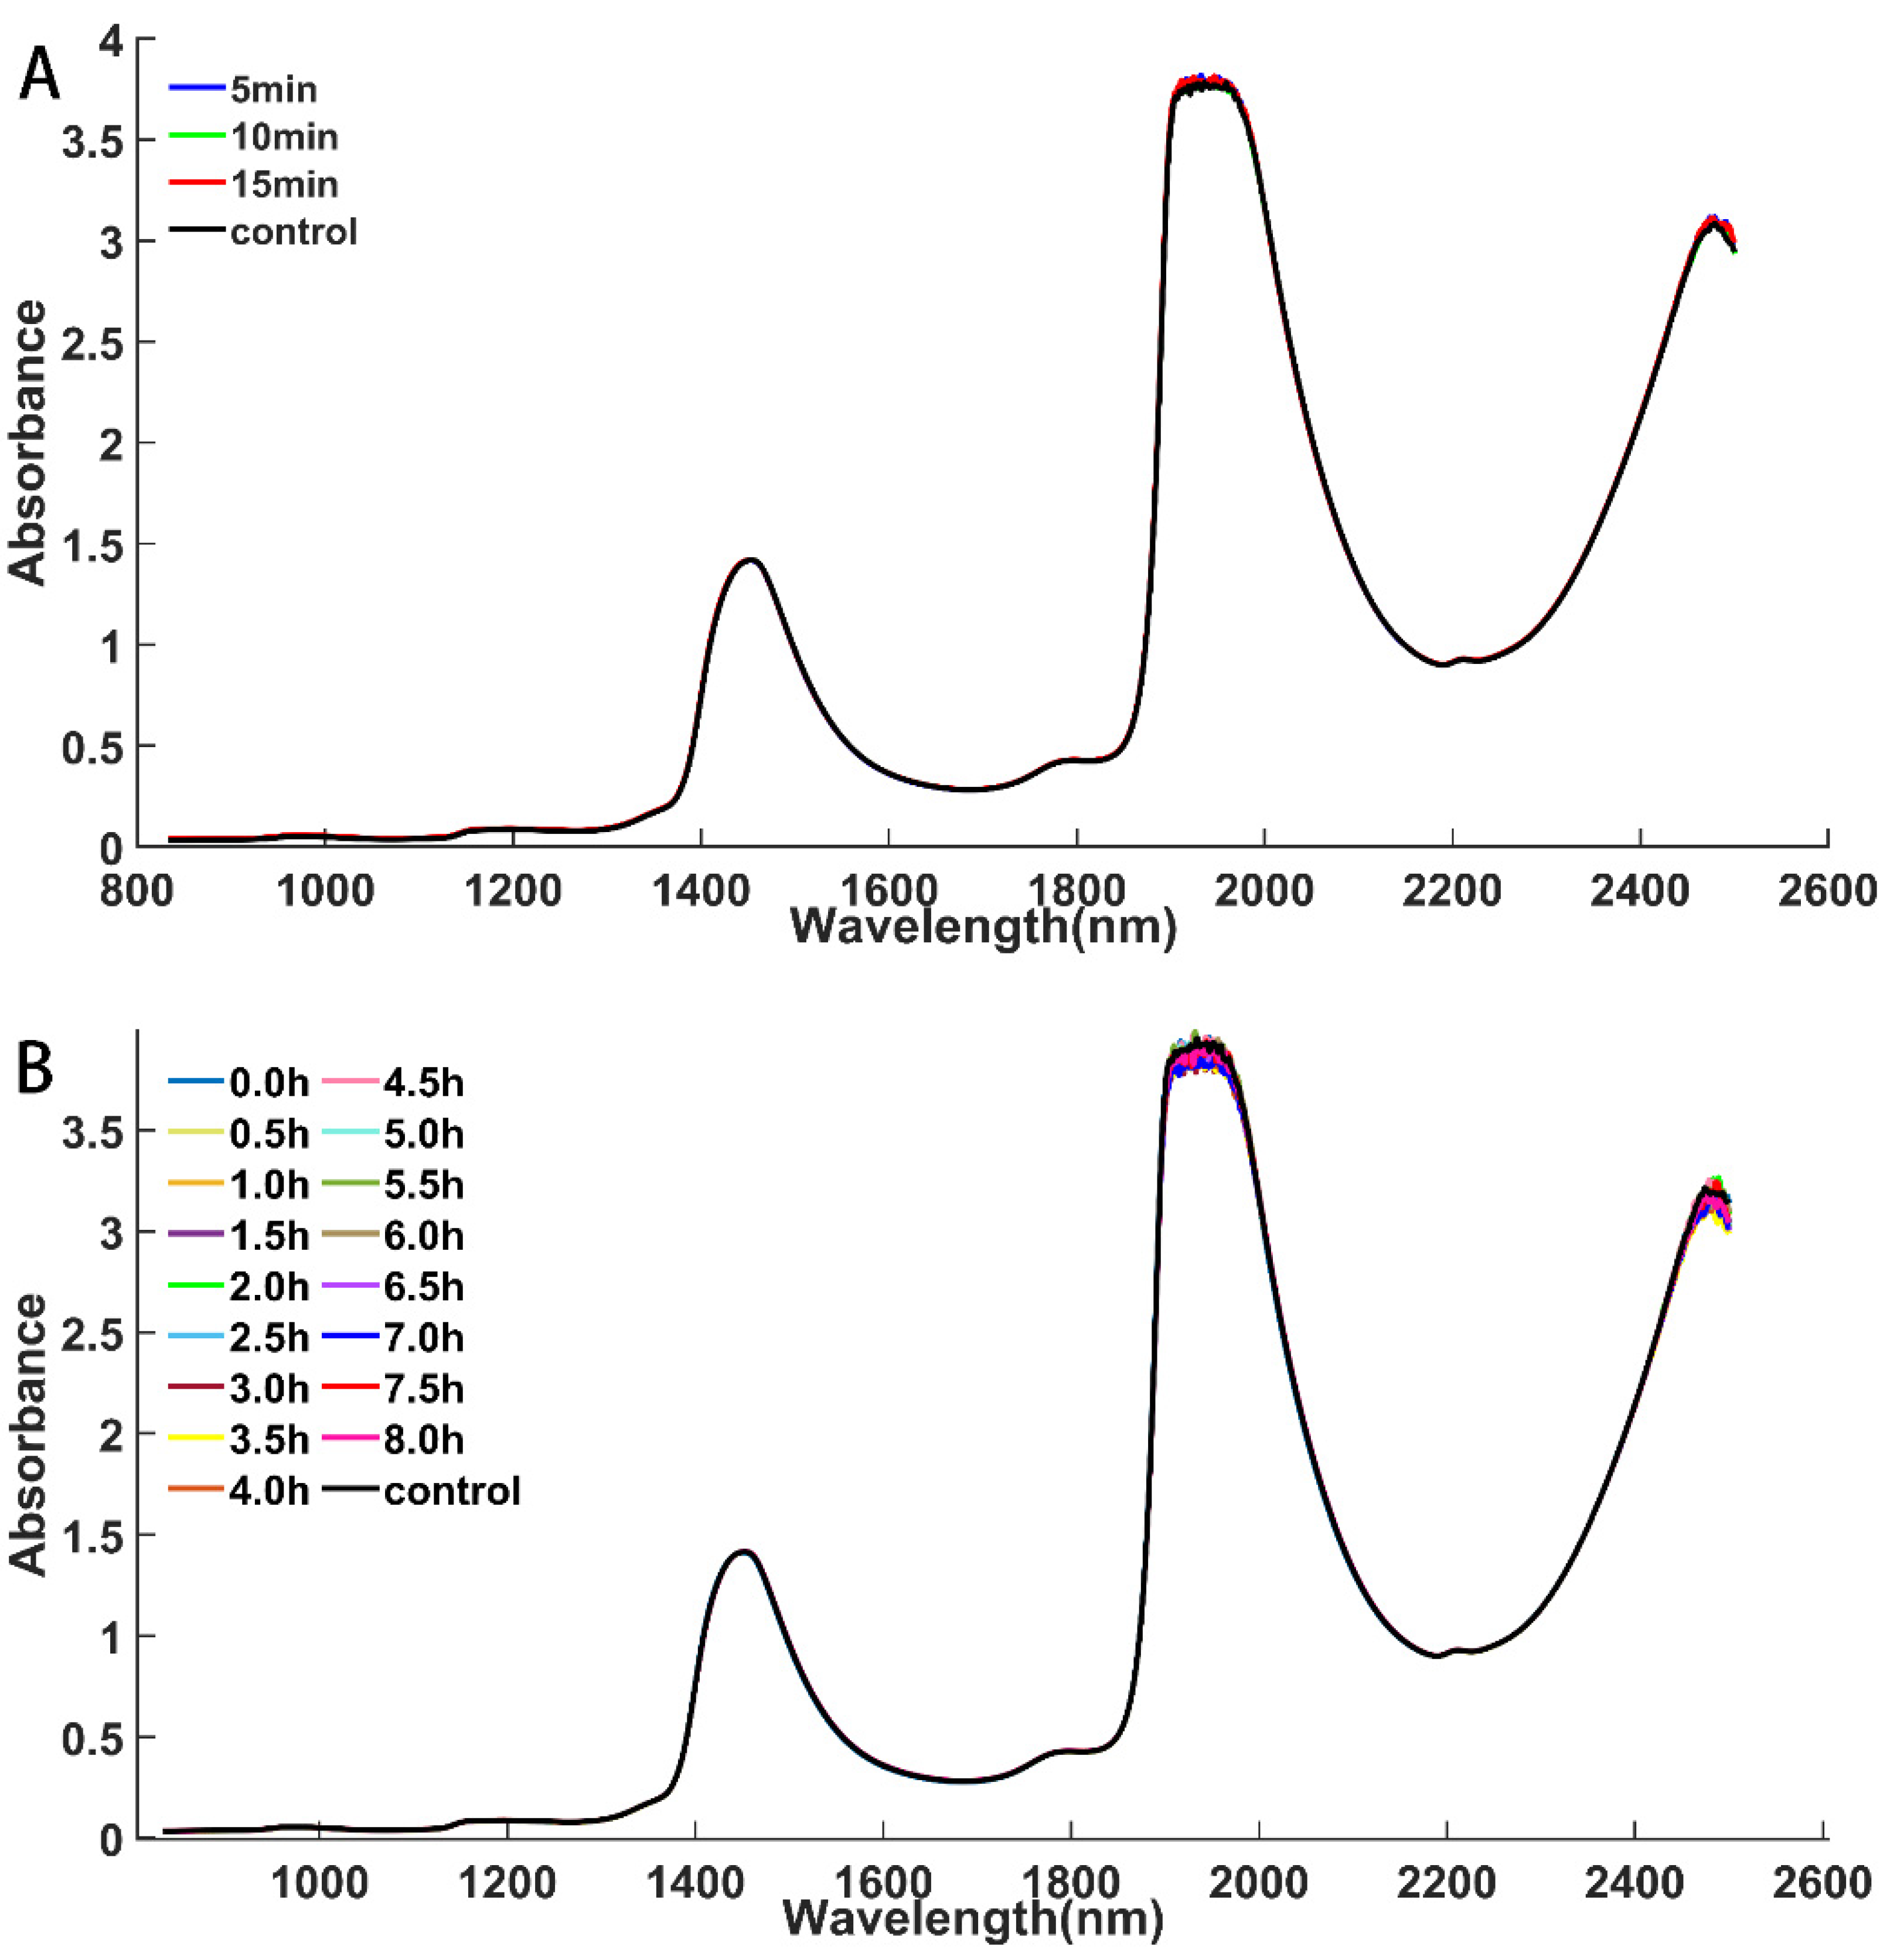
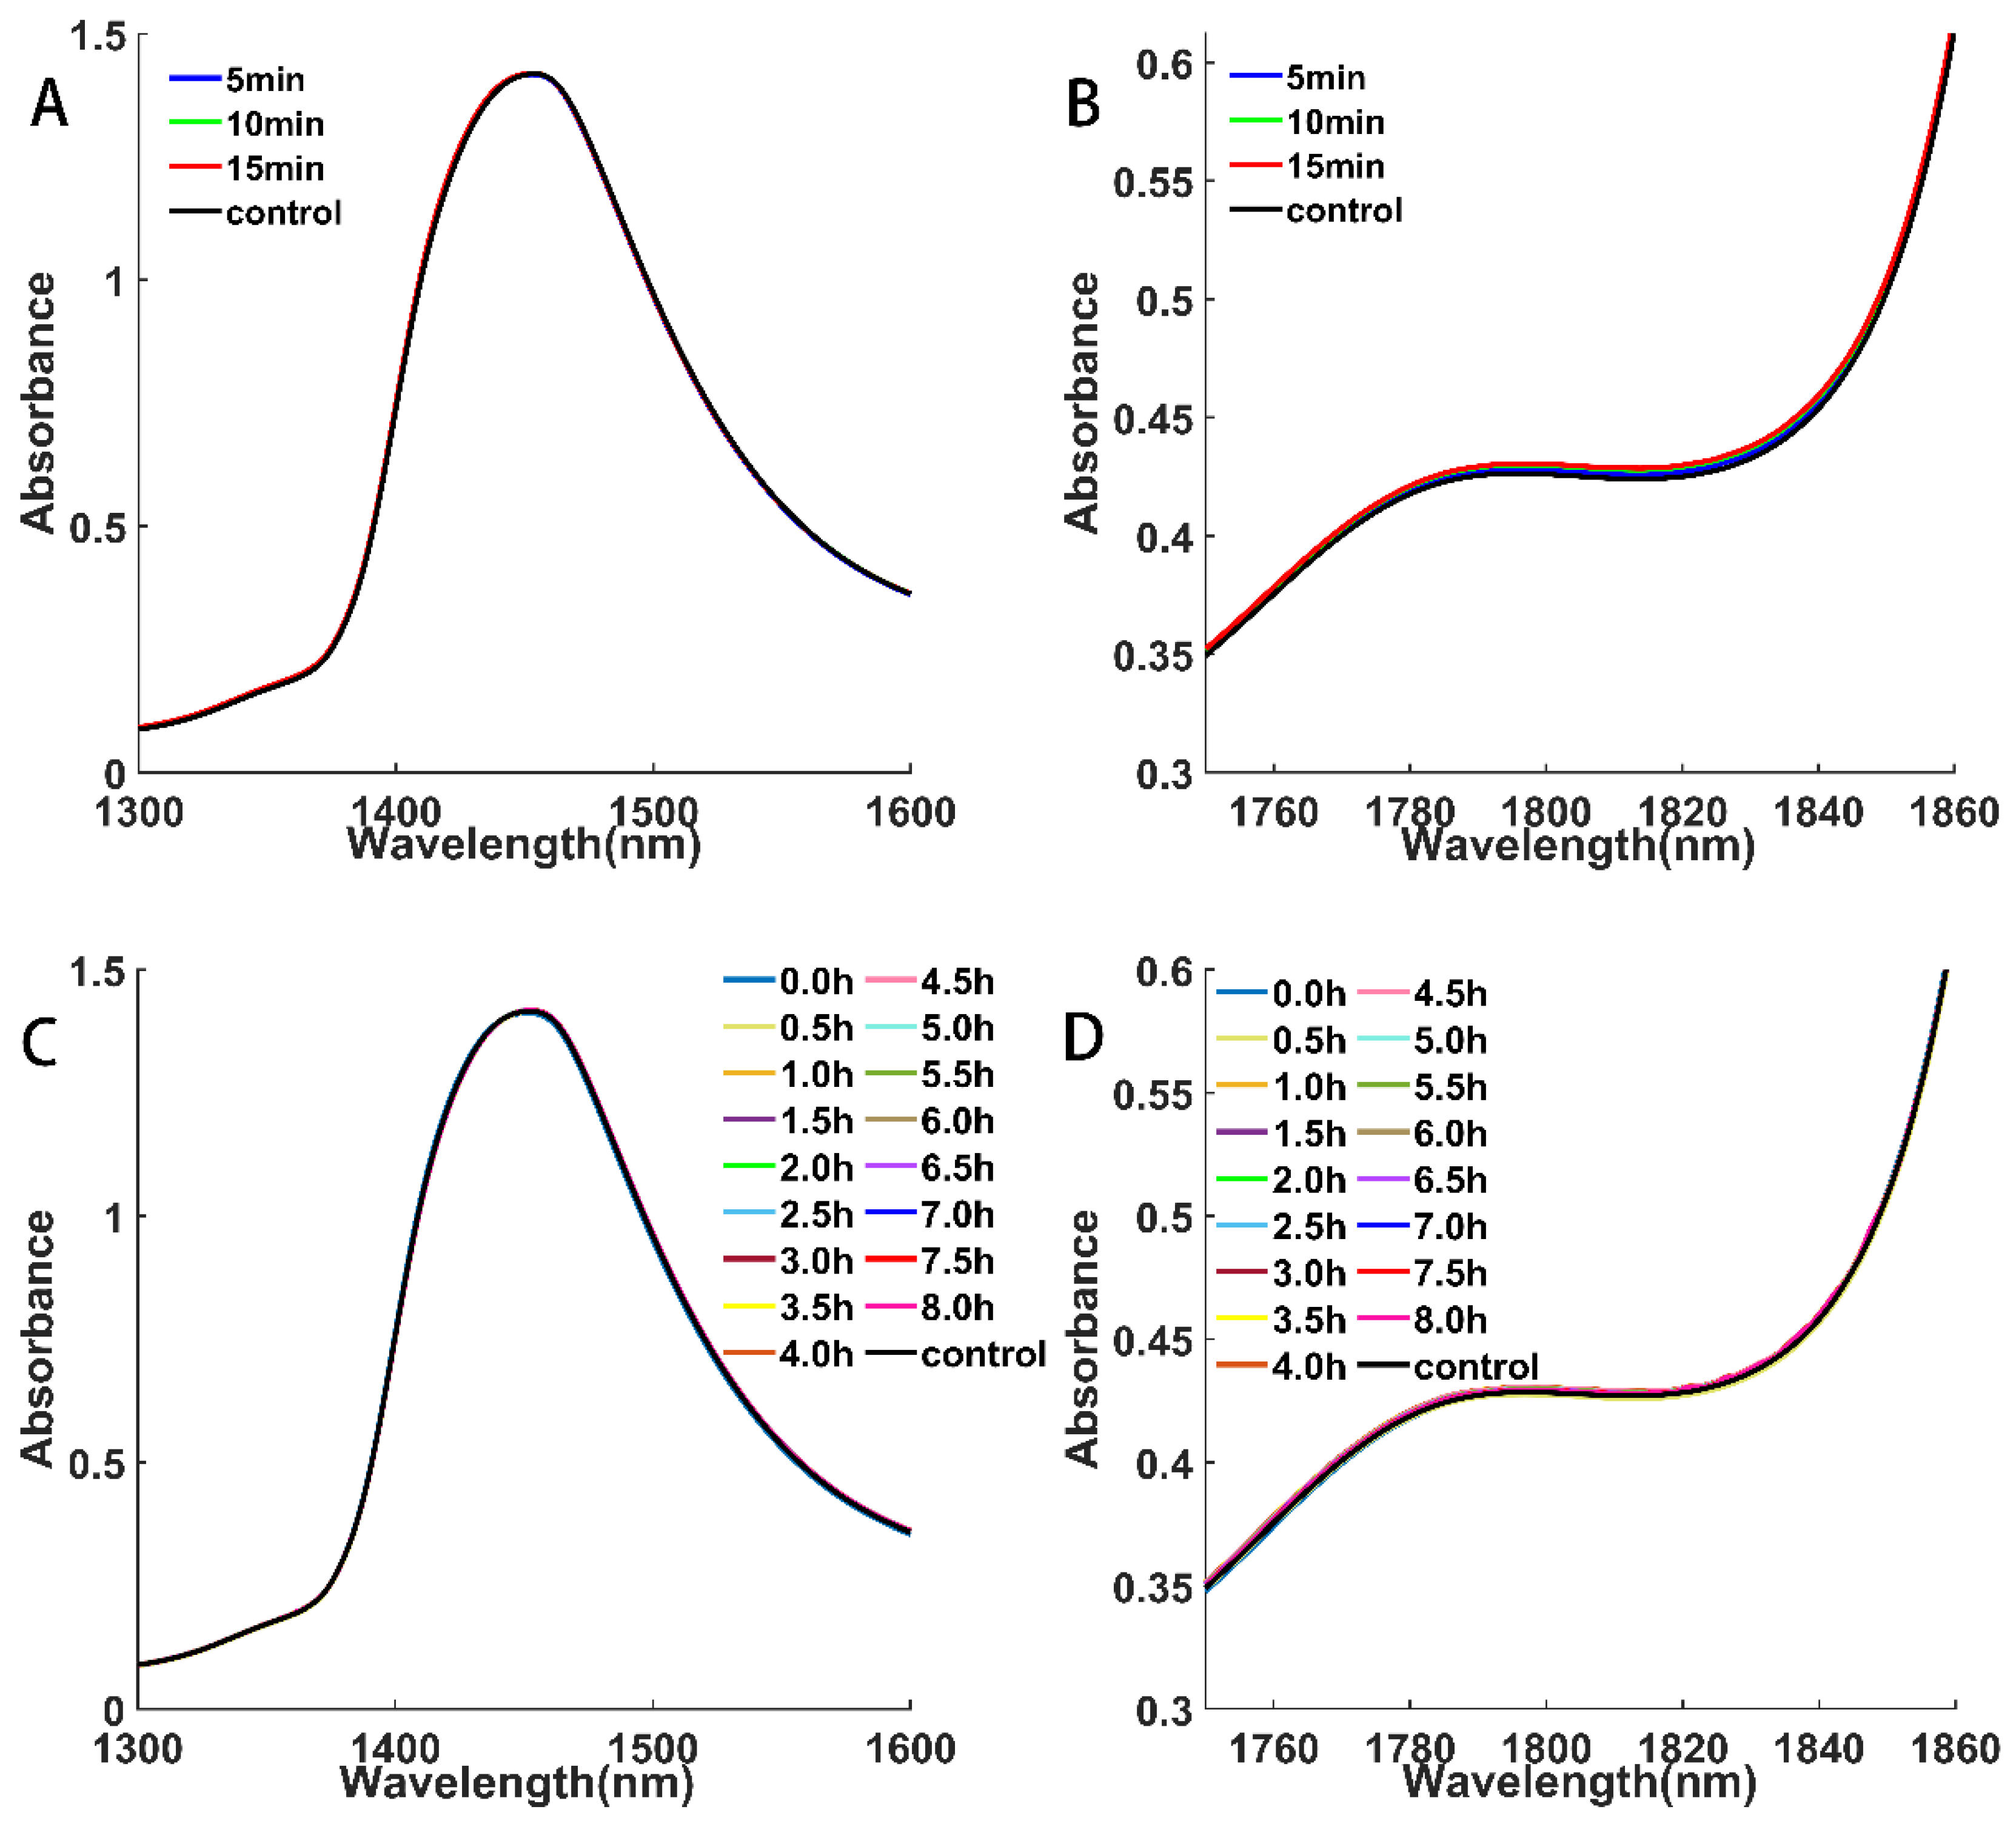
3.1. Analysis of Raw Spectra

Figure 2 shows the raw spectra obtained with different pretreatment time. It can be seen that the whole spectra show two broad absorption peaks located at 1300–1600 nm and 1860–2200 nm, which are the octave and combined frequency peaks of water absorption, respectively. In the region of the combined frequency peaks, saturation of water absorption can be seen. This is due to the fact that the absorption in these regions is beyond the detection range of the NIR spectrometer [29] and therefore does not need to be investigated further. Therefore, we mainly analyzed the water absorption from 1300 to 1860 nm. The raw spectra from 1300 to 1600 nm belong to the first overtone region of the OH stretching band. This peak identifies many absorption bands containing important structural information. In addition, a small peak is observed at 1750–1860 nm, which indicates the OH stretching and bending vibrational absorption bands and deserves further investigation. These two absorption bands will be the focus of further analysis in this study. As can be seen from the partial enlargement of Figure 3, neither the processing time nor the storage time had an obvious effect on the raw spectra, so further aqueous spectral processing is required. This is the case for the bands between 1300 and 1600 nm, and 1750 and 1860 nm, which will be an important area of future research to compare spectral differences.

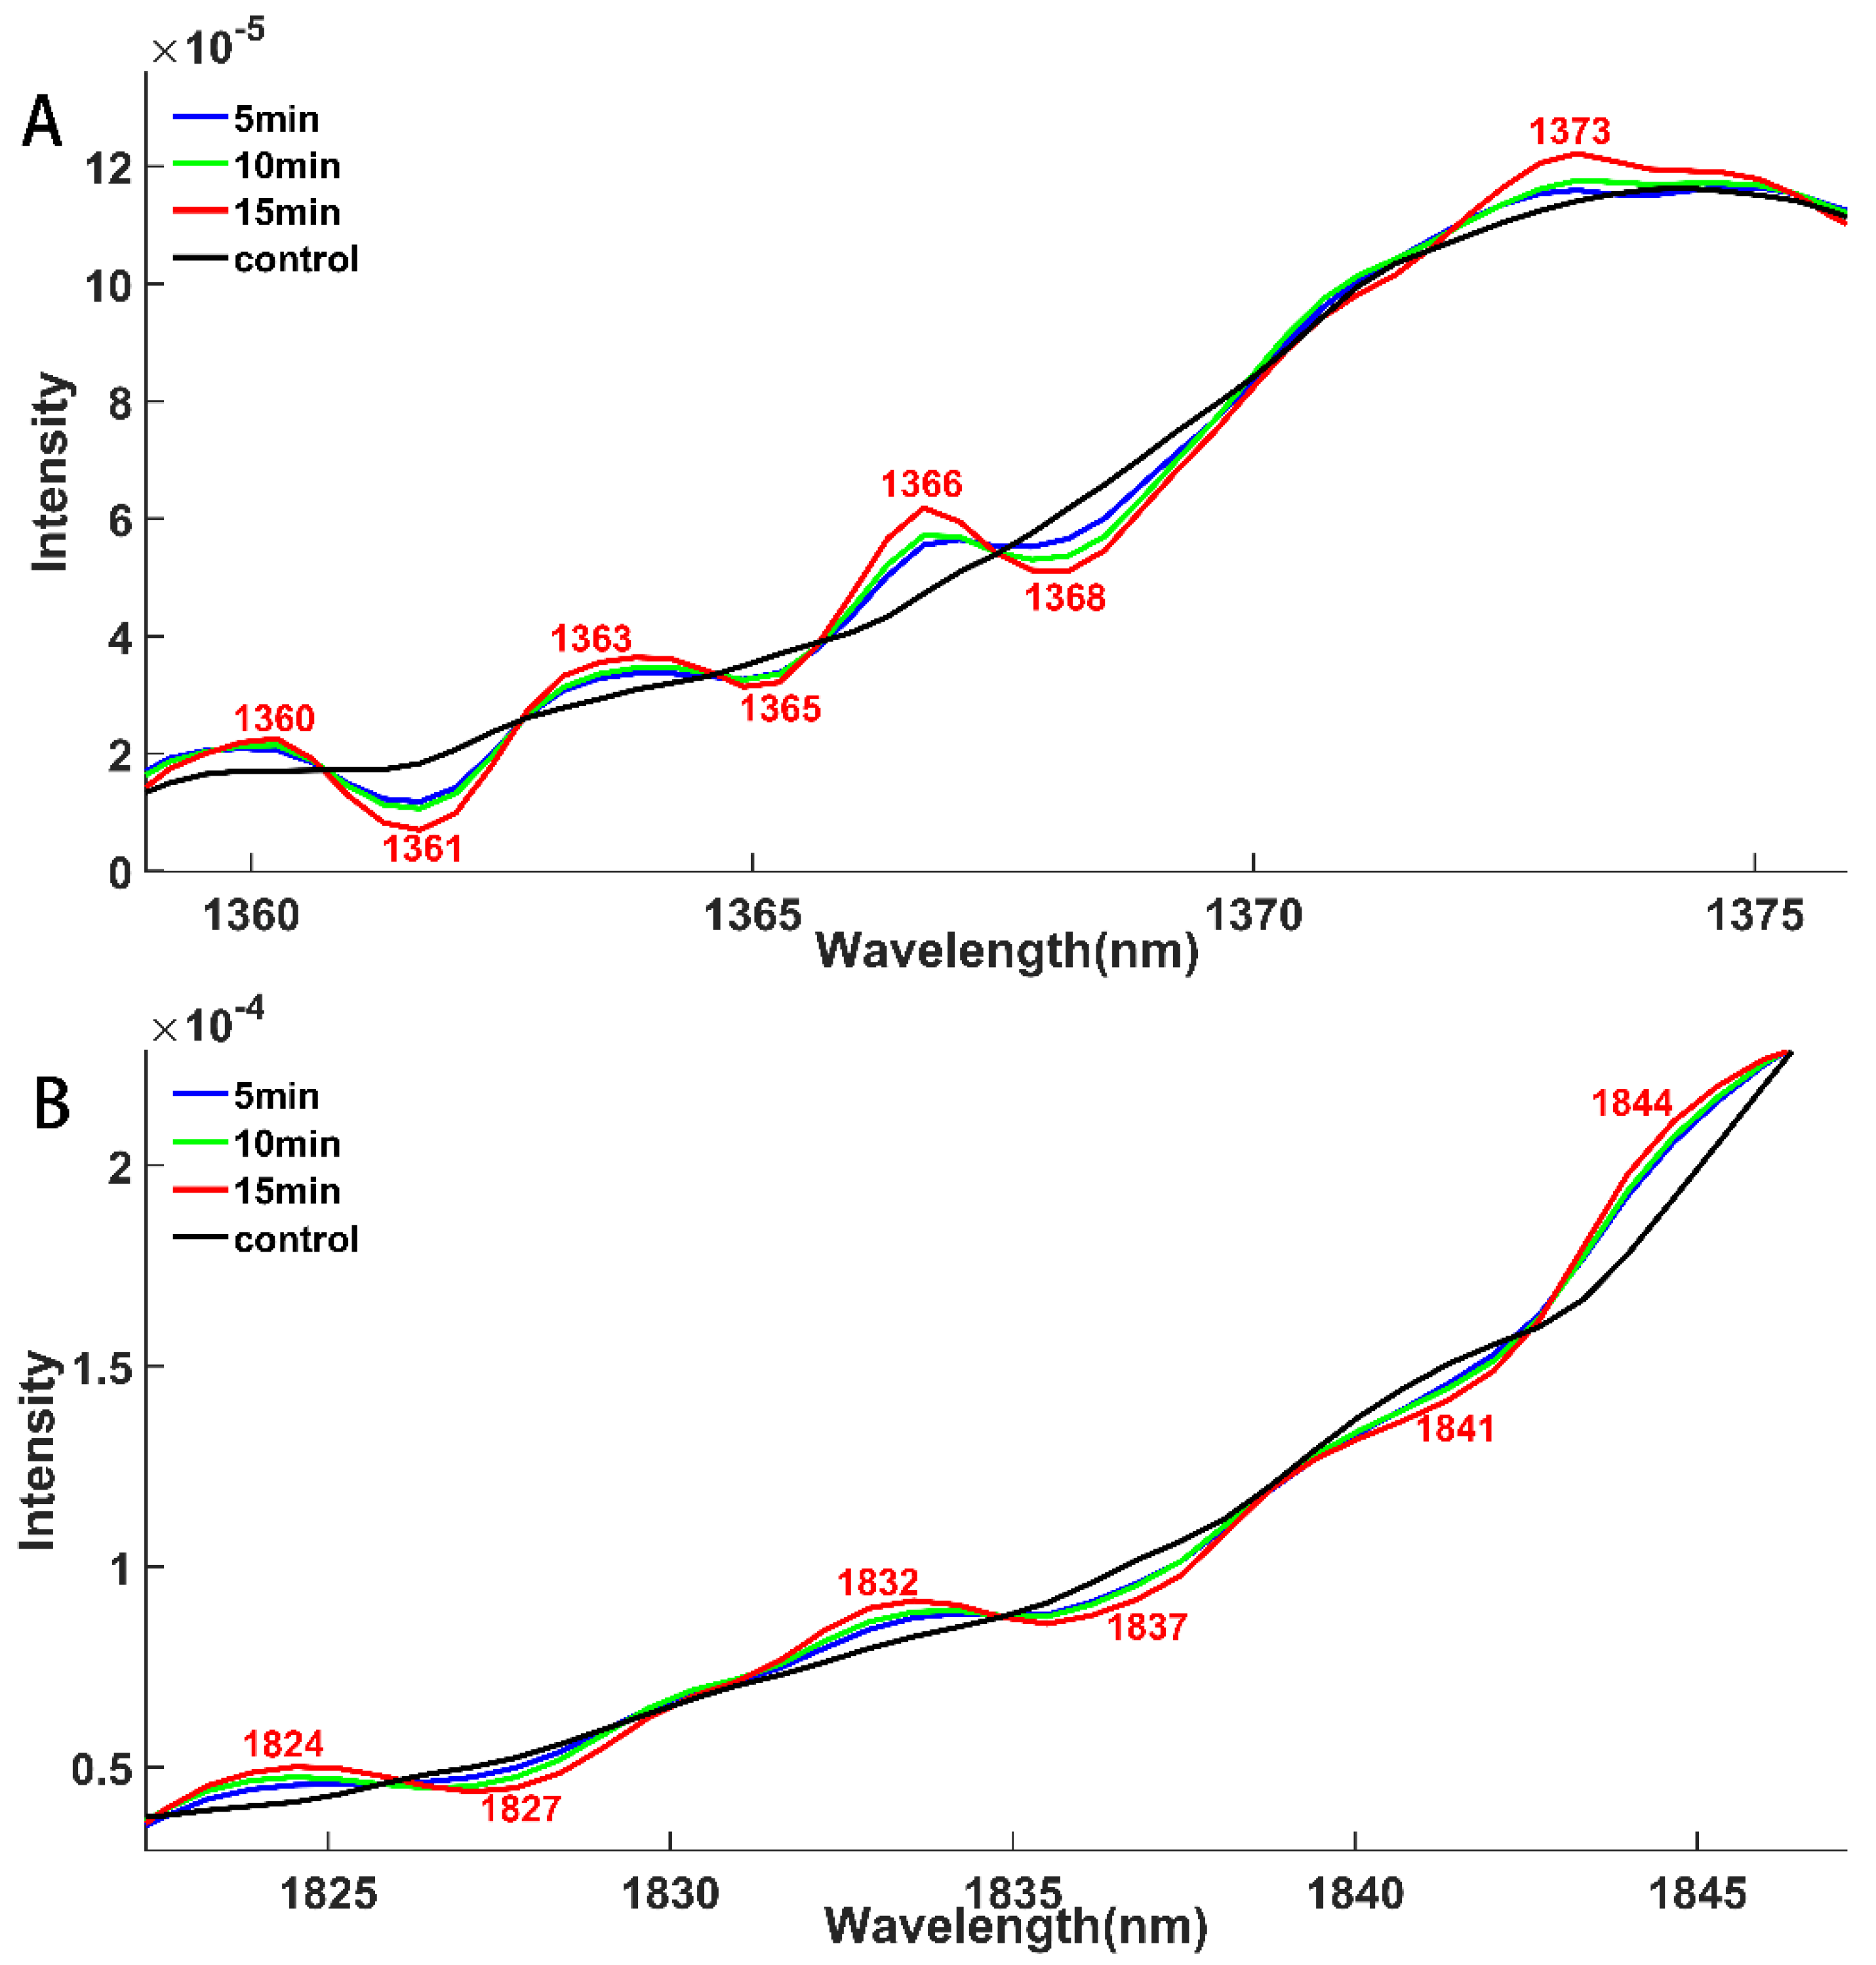
3.2. Analysis of Savitzky–Golay Second-Order-Derivative Spectra

Second-order-derivative treatment of spectra was performed on PAW samples treated with CAP for 5, 10 and 15 min, respectively. Subsequently, the spectra were compared with those of the blank control, revealing a clear and regular change in the spectra. Studies in aquaphotomics have shown that specific absorption bands can be identified in the first overtone region of the OH stretching band [20]. In addition, significant spectral variations in the OH bending and stretching band region (1800–1860 nm) of the NIR spectra were also identified [29], as depicted in Figure 4. Figure 4 shows a partial enlargement of the second-order-derivative spectrum ranging from 1300 to 1380 nm and 1800 to 1850 nm, respectively. The two regions could be assigned to different aspects of the structure of water molecules. In Figure 4A, the wavelengths 1360 nm, 1361 nm, 1363 nm, 1365 nm, 1366 nm and 1368 nm could be assigned to the solvation shell absorption of water, i.e., OH-(H2O)1,2,4 [27], and 1373 nm could be identified as the symmetric and asymmetric telescoping vibrations of the water molecular structure, i.e., υ1 + υ3 [27]. In Figure 4B, all six wavelengths correspond to the stretching and bending vibrations of the OH bond [29]. By making full use of the potential information contained in these wavelengths, we could use water information as a mirror to reflect the active ingredients in PAW. The variation in the spectra demonstrates an increase with longer treatment time, owing to the impact of reactive substances on the water molecules’ structure. This increase in reactive substances is a result of the production of high-energy electrons by the CAP emitter during the discharge process. These electrons bombard the feed gas argon, Ar, producing argon plasma, which then reacts with O2, N2, and water vapor in the air, creating active substances. Alternatively, energetic electrons may come into direct contact with air, producing active substances that eventually enter the water. As the treatment time increases, the number of energetic electrons produced rises, leading to an increase in the amount of active substances in the water [19,30]. The ratio of fluorescence intensities shown in Figure 5 indicates a rise in ROS concentration with treatment time, consistent with the change in the spectra.
As mentioned above, the results obtained using the chemical and NIR spectroscopy methods are the same. This suggests that the state of water as a whole system changes under the influence of active substances and that the spectral pattern reflects this change.

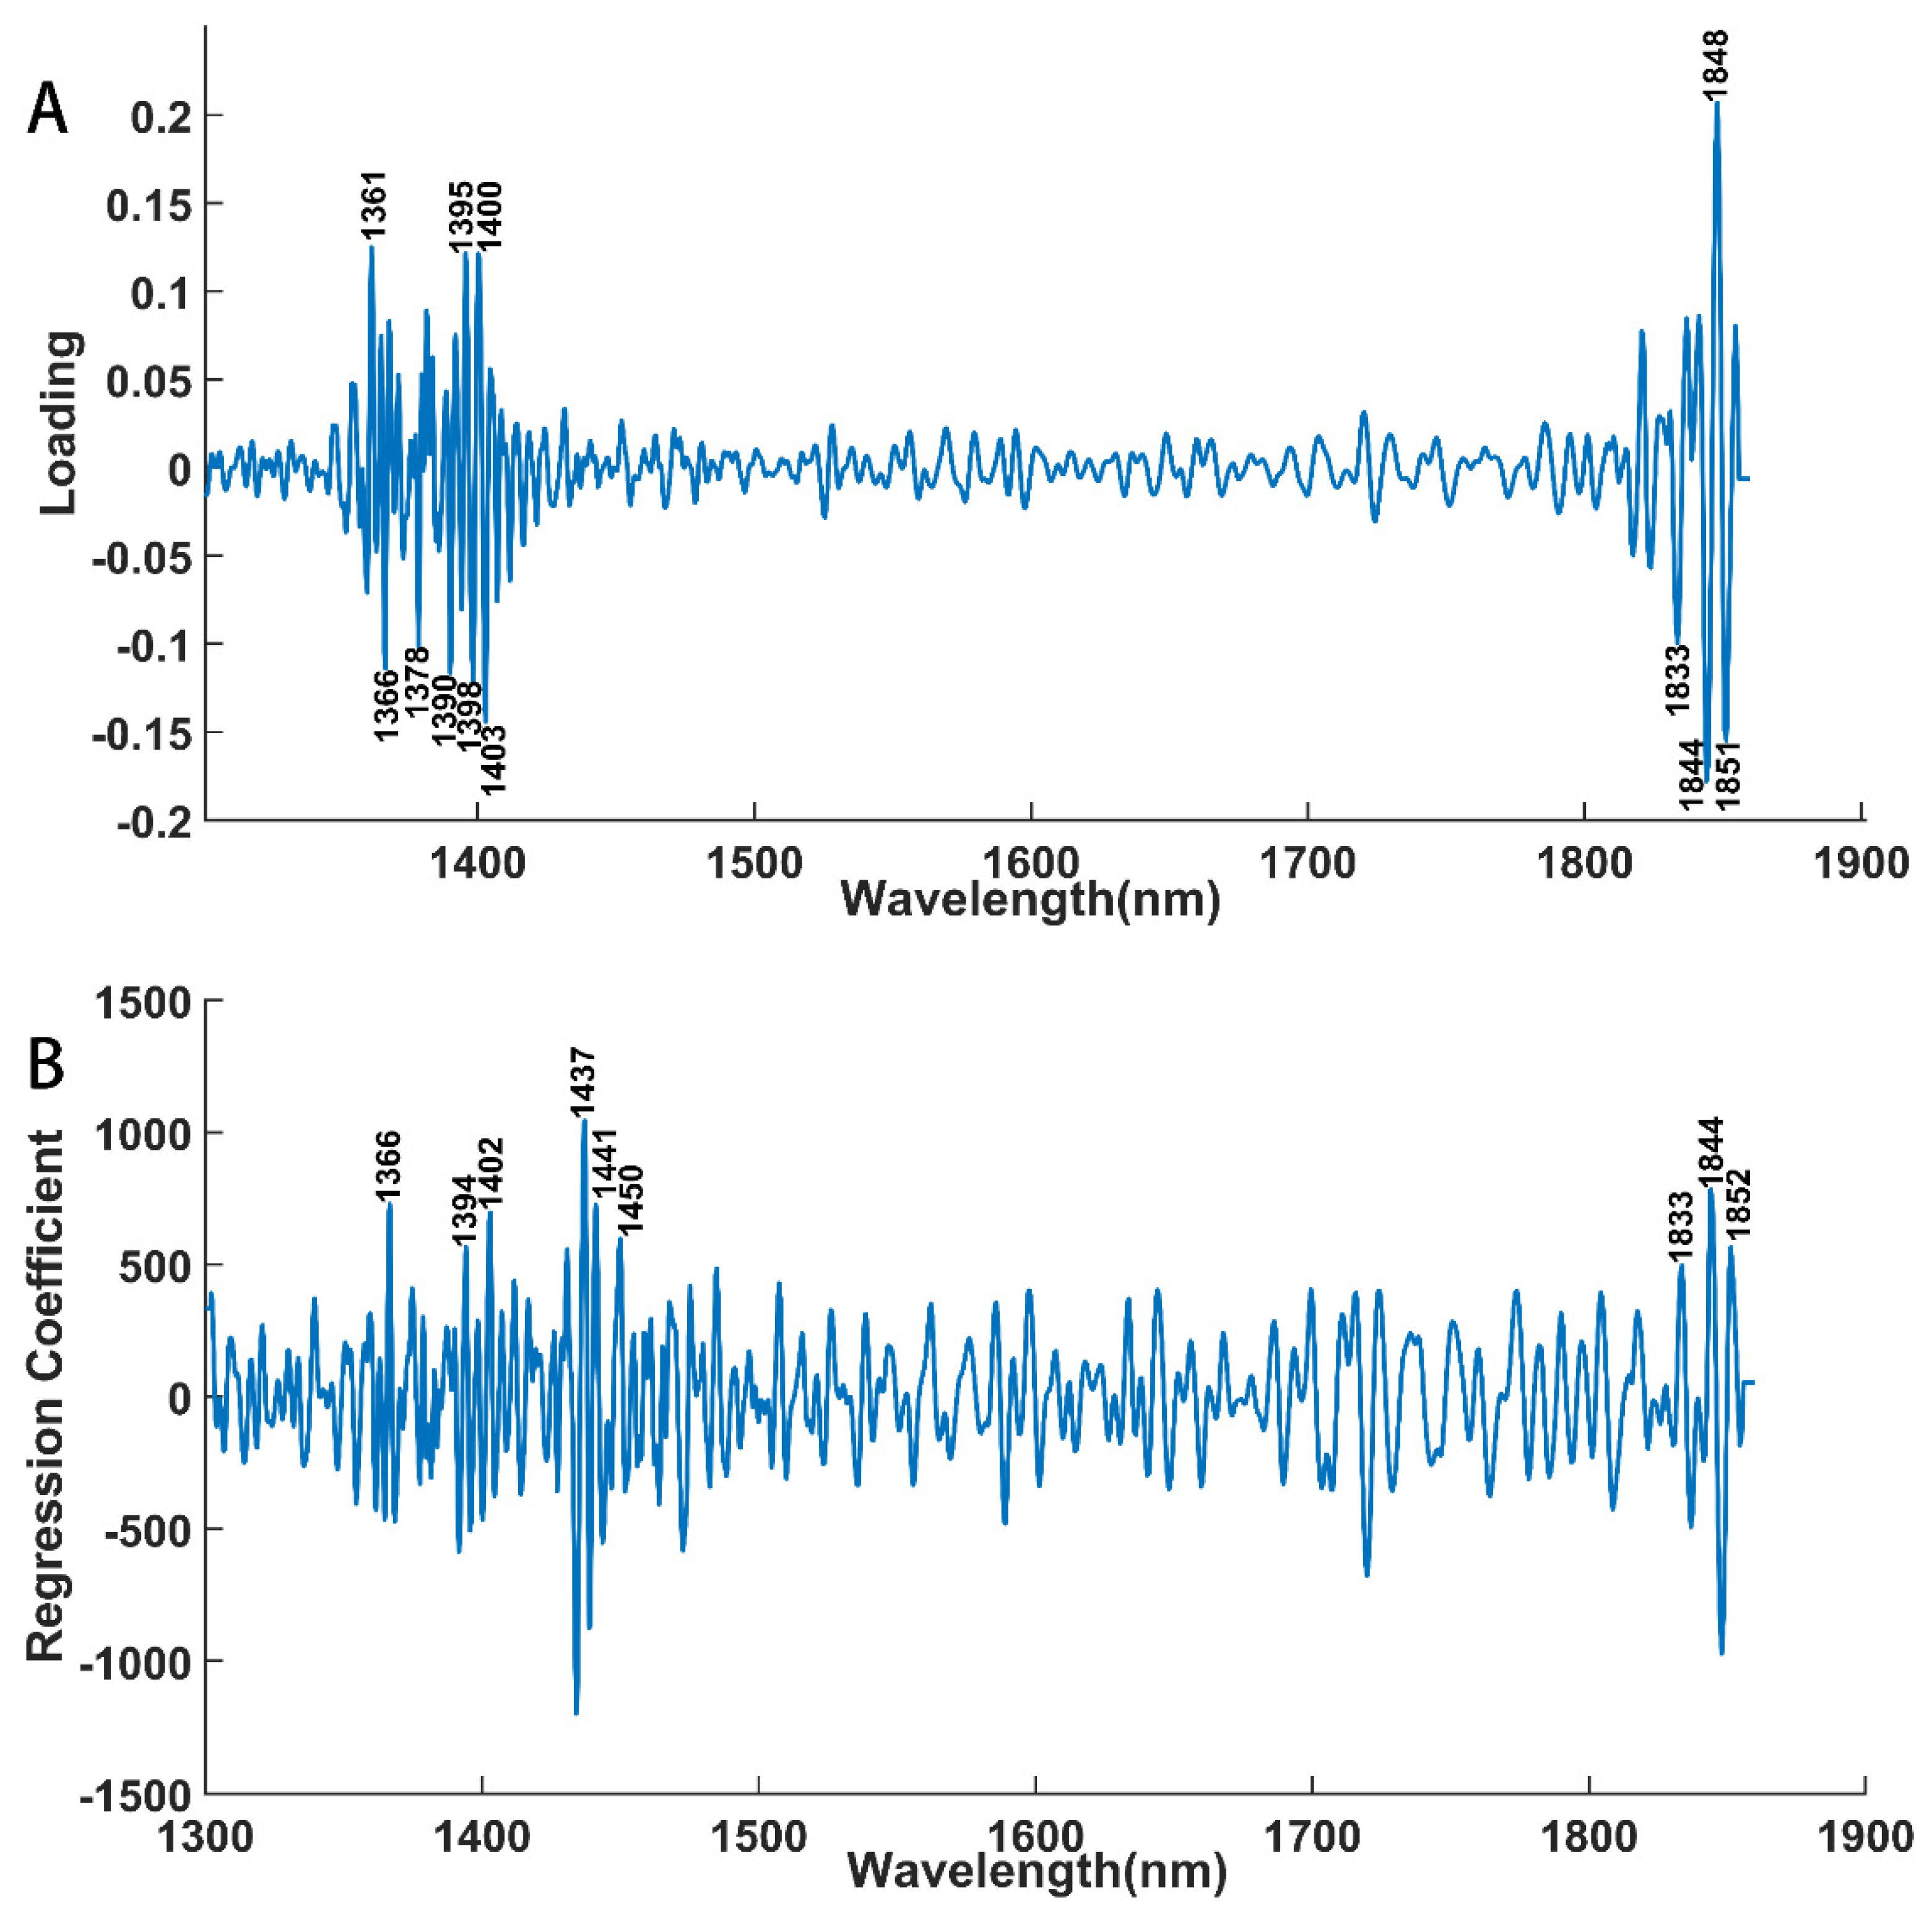
3.3. Acquisition of 12 Characteristic Wavelengths

PCA was first used to find useful information about the WAMACS. The first principal component contributes about 63.24% of the total variance. PC1 shows that as the time goes by, the score decreases which shows no difference with the ROS concentration changes. And then loading for PC1 was introduced for WAMACS identification. Figure 6A shows the wavelengths selected by the PCA method. Each wavelength corresponds to the absorption of a specific water molecular species: 1361 nm and 1366 nm—OH-(H2O)1,2,4; 1378 nm—υ1 + υ3, 1390 nm—2υ1, OH-(H2O)1,4 and O2-(H2O)4; 1395 nm and 1398 nm—water trapped in the local field of ions; 1400 nm and 1403 nm—free water molecules (S0) [27]; 1833 nm, 1844 nm, 1848 nm and 1851 nm—OH bond stretching and bending vibrations [29].
The PLS technique was further introduced for WAMACS analysis. The spectral data obtained from the 8 h measurements were analyzed using the PLS method with storage time as the y-variable. Principal components were determined using the cross-validation method and four components were used in this study as the RMSECV is low. Then, regression coefficient curves of the spectral were calculated and the greater the value of the regression coefficient, the more robust the correlation between the absorption generated at that wavelength. A set of characteristic wavelengths was selected based on the values of the regression coefficients, as shown in Figure 6B, where each wavelength corresponds to the absorption of a specific water molecular species: 1366 nm—OH-(H2O)1,2,4; 1394 nm—water trapped in the local field of ions; 1402 nm—free water molecules (S0) [27]; 1437 nm and 1441 nm—water molecules with 1 hydrogen bond(S0); 1450 nm—OH-(H2O)4,5; 1833 nm, 1844 nm and 1852 nm—OH bond stretching and bending vibrations [29]. Of these wavelengths selected by PCA and PLS, most occur in the broad absorption peak at 1300–1600 nm, which contains valuable insights into the structure of water and provides useful information. The remaining few wavelengths are in the 1800–1860 nm range and correspond to the stretching and bending vibrations of the OH bond, providing less information but are necessary to account for.
Finally, compared with the WAMACS discovered using different methods, the WAMACS were constructed using 12 wavelengths. As described in the following section, the absorption of these wavelengths in the NIR band corresponds to the structural changes of water molecules. It is important to note that only wavelengths with positive regression coefficients were selected to guarantee the clarity and simplicity of the aquagram.

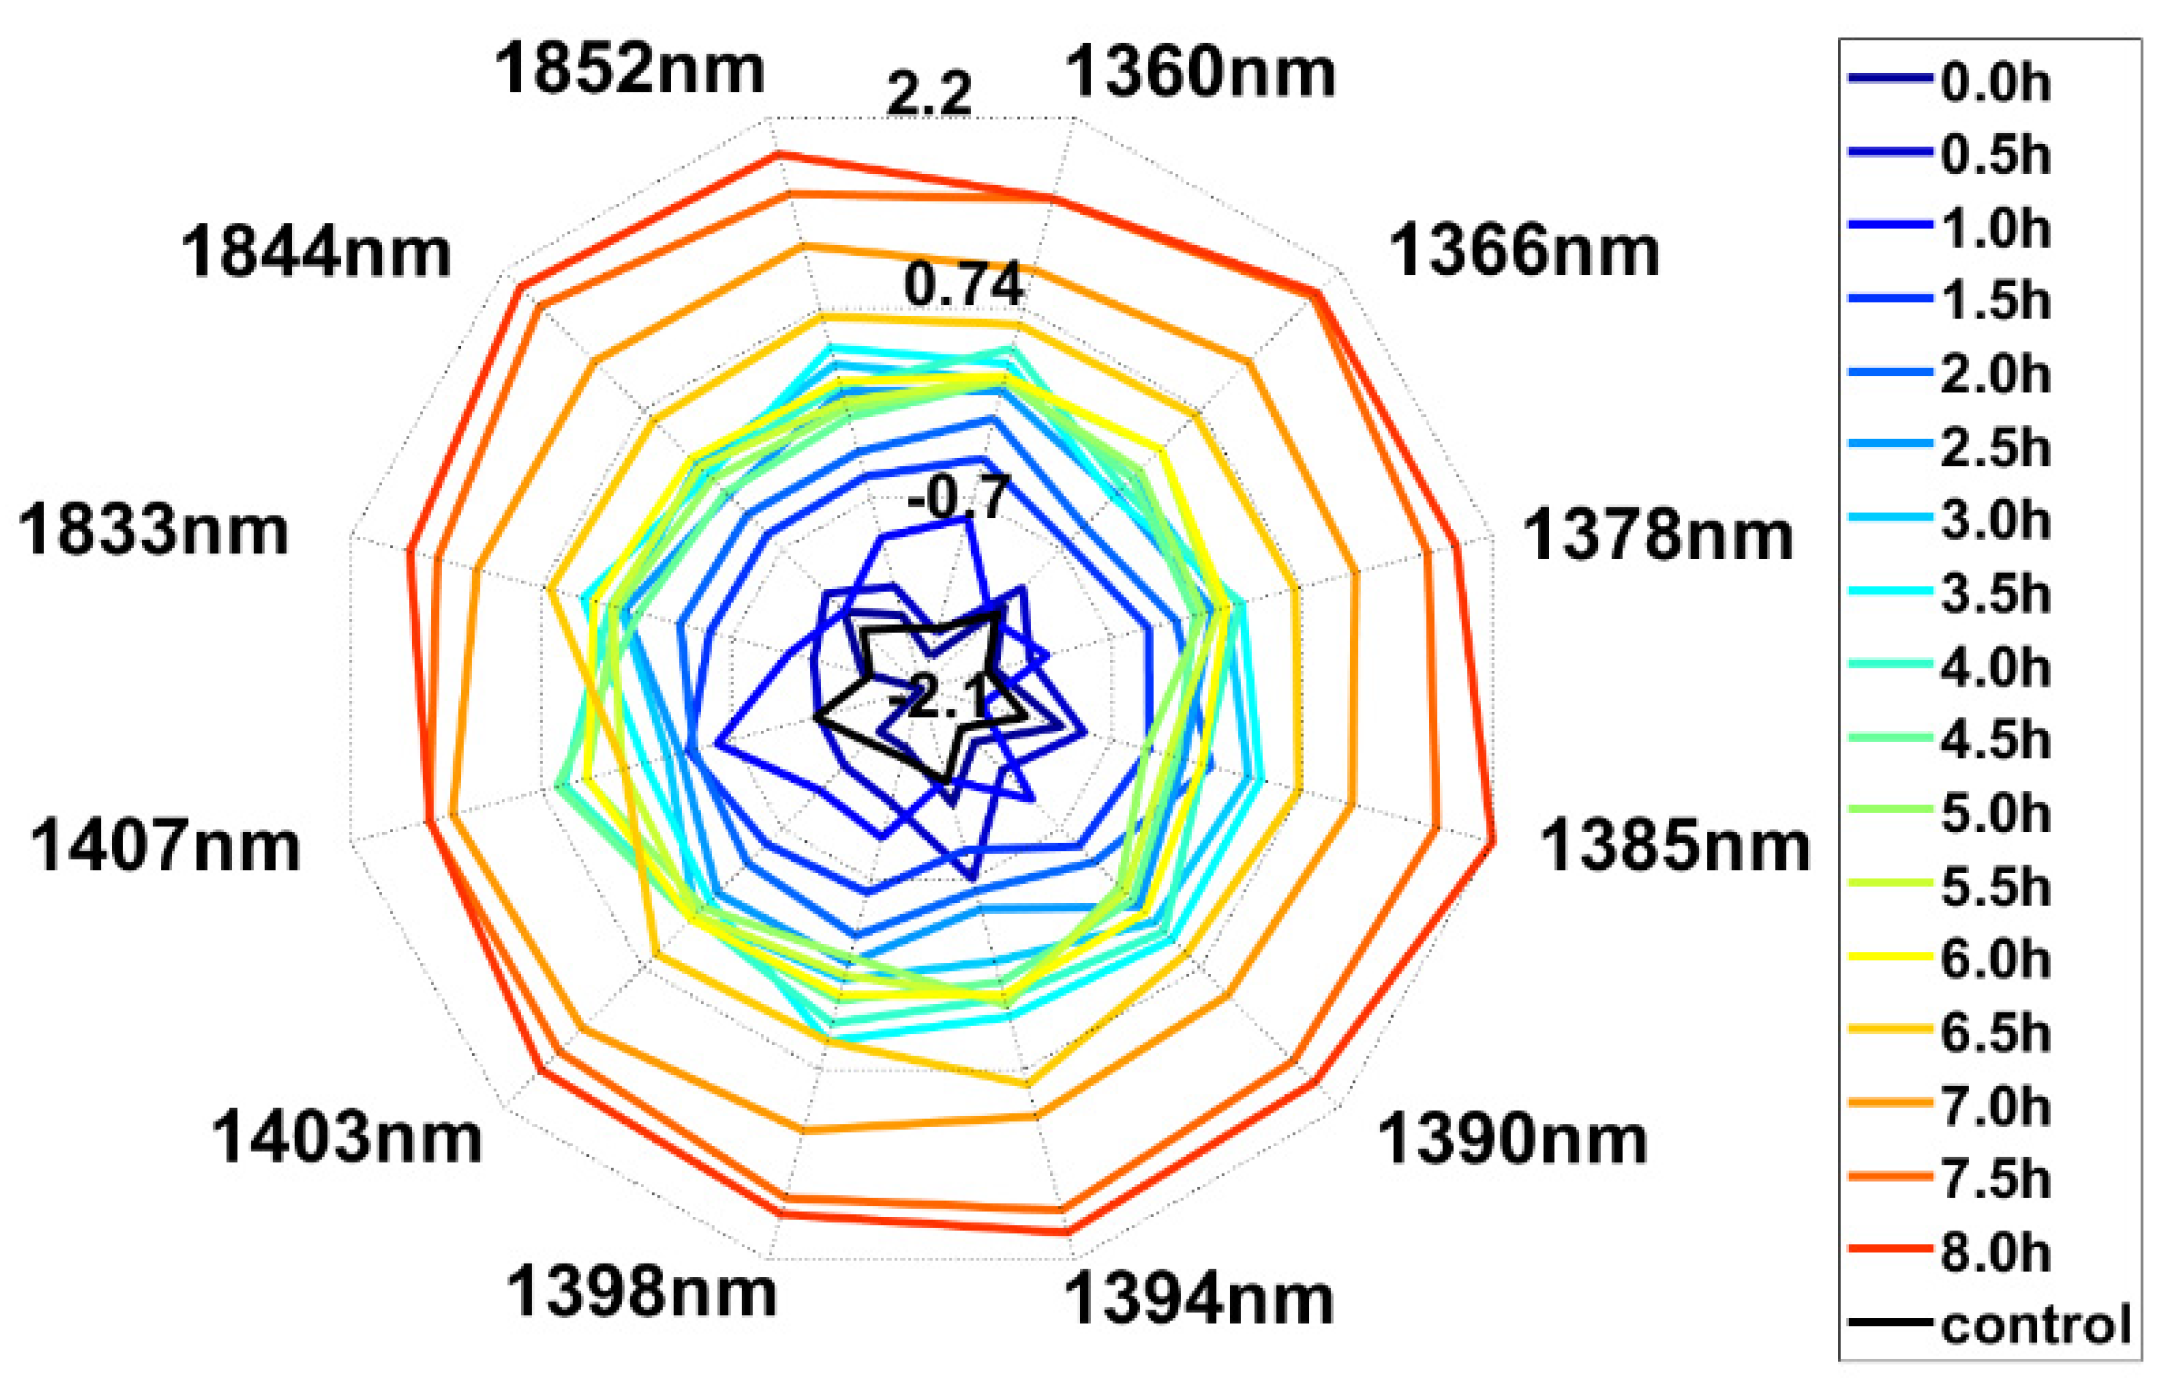
3.4. Analysis of Aquagram

The analysis was based on raw spectra taken at a fixed time of 8 h. The spectra were preprocessed and underwent Savitzky–Golay second-order-derivative processing, and an aquagram of 12 selected wavelengths was calculated and plotted using the processed spectral data. The results are presented in Figure 7. It indicates an overall increase in spectral variation across 12 wavelengths, with some fluctuations observed at intermediate time (2.5–6 h). This is due to the presence of only a few highly reactive short-lived species during spectroscopic detection. Long-lived species such as H 2 O 2 , NO 2 , and NO 3 fluctuate in concentration within the water. In particular, H 2 O 2 reacts with NO 2 to form peroxynitrite, which is unstable in the PAW of acidic pH and decomposes into the end product NO 3 , and NO 2 also disproportionates under acidic conditions to form NO 3 [17,18]. The concentrations of H 2 O 2 and NO 2 in the PAW are gradually decreasing, while the concentration of NO 3 constantly increases [16,31]. There is an increasing/decreasing balance in the PAW and the general tendency increases with time when the equilibrium is broken.
Studies have revealed that H 2 O 2 , NO 2 , and NO 3 have an impact on water molecule structure through mechanisms like solvation and hydrogen bonding [32,33,34,35]. This can lead to hydrogen bonding between water molecules, between water and solute, and the stretching or bending vibration of the OH bonds of water [36]. Figure 7 presents an aquagram that demonstrates 12 wavelengths with a high level of regularity and repeatability in their spectral variation. The 1360–1410 nm and 1800–1860 nm wavelengths are of special interest. The former corresponds to the range of weakly hydrogen-bonded water, free water, and solvent shell absorption of water [27], while the latter corresponds to the range for OH-bond stretching and bending vibration absorption of water [29]. Each wavelength corresponds to the absorption of a specific water molecular species: 1360 nm and 1366 nm—OH-(H2O)1,2,4; 1378 nm—υ1 + υ3’; 1385 nm and 1390 nm—2υ1, OH-(H2O)1,4 and O2-(H2O)4; 1394 nm and 1398 nm—water trapped in the local field of ions; 1403 nm and 1407 nm—free water molecules (S0) [27]; 1833 nm, 1844 nm and 1852 nm—OH bond stretching and bending vibrations [29].
To measure the ROS concentration in PAW samples treated for 15 min, we employed a reactive oxygen kit and conducted the assay both before and after 8 h. The final experimental results were expressed as the ratio of the fluorescence intensity of the sample to that of the blank control, as shown in Figure 8. It confirms that the ratio of fluorescence intensity decreases with the increase in time, implying a decrease in ROS concentration in the PAW over time.
Aquaphotomics has some advancements to indirectly study the changes of other molecules in the water system by using water as the mirror. The concentration of active substances in PAW is a millimolar gradient [16], and it needs specific analytical tools and complicated procedures for active-substance determination. And, in this study, the small changes in the active substance in PAW can be measured through the significant changes in the aquagram. Therefore, the aquagram could be used as a tool to visualize the PAW in the future.

4. Conclusions

In this study, NIR and aquaphotomics were introduced to realize the characterization of the CAP process to water. Savitzky–Golay second-order derivative, PCA and PLS were useful tools in helping us identify WAMACS. And a total of 12 specific WAMACS were found in this research which could be used as a mirror to make the active substances visible. Also, in the future, this method could be used as an in-line method to realize the qualitative and quantitative analysis of the active substances during the CAP process.

Author Contributions

Conceptualization, J.L., X.W. (Xiaolong Wang) and L.L.; methodology, J.L. and L.L.; software, J.L., X.W. (Xiaoying Wei), W.D. and L.L.; validation, J.L.; formal analysis, J.L. and L.L.; investigation, J.L.; resources, T.X., L.L. and H.Z.; data curation, W.D.; writing—original draft preparation, J.L.; writing—review and editing, L.L.; visualization, J.L.; supervision, L.L.; project administration, X.W. (Xiaolong Wang) and L.L.; funding acquisition, X.W. (Xiaolong Wang) and L.L. All authors have read and agreed to the published version of the manuscript.

Funding

This work was supported by the Fundamental Research Funds for the Central Universities [2022JC027], Future Scholar Program of Shandong University and Fundamental Research Funds of Shandong University [2019GN092].

Institutional Review Board Statement

Not applicable.

Informed Consent Statement

Not applicable.

Data Availability Statement

Data underlying the results presented in this paper are not publicly available at this time but may be obtained from the authors upon reasonable request. The data are not publicly available due to privacy.

Acknowledgments

We want to thank all participants for their support.

Conflicts of Interest

The authors declare that they have no known competing financial interests or personal relationships that could have appeared to influence the work reported in this paper.

References

  1. Chen, G.; Chen, Z.; Wang, Z.; Obenchain, R.; Wen, D.; Li, H.; Wirz, R.E.; Gu, Z. Portable air-fed cold atmospheric plasma device for postsurgical cancer treatment. Sci. Adv. 2021, 7, eabg5686. [Google Scholar] [CrossRef] [PubMed]
  2. Jung, J.M.; Yoon, H.K.; Kim, S.Y.; Yun, M.R.; Kim, G.H.; Lee, W.J.; Lee, M.W.; Chang, S.E.; Won, C.H. Anticancer Effect of Cold Atmospheric Plasma in Syngeneic Mouse Models of Melanoma and Colon Cancer. Molecules 2023, 28, 4171. [Google Scholar] [CrossRef] [PubMed]
  3. Chen, G.; Chen, Z.; Wen, D.; Wang, Z.; Li, H.; Zeng, Y.; Dotti, G.; Wirz, R.E.; Gu, Z. Transdermal cold atmospheric plasma-mediated immune checkpoint blockade therapy. Proc. Natl. Acad. Sci. USA 2020, 117, 3687–3692. [Google Scholar] [CrossRef] [PubMed]
  4. Chen, Z.; Garcia, G., Jr.; Arumugaswami, V.; Wirz, R.E. Cold atmospheric plasma for SARS-CoV-2 inactivation. Phys. Fluids 2020, 32, 111702. [Google Scholar] [CrossRef]
  5. Isbary, G.; Stolz, W.; Shimizu, T.; Monetti, R.; Bunk, W.; Schmidt, H.U.; Morfill, G.E.; Klämpfl, T.G.; Steffes, B.; Thomas, H.M.; et al. Cold atmospheric argon plasma treatment may accelerate wound healing in chronic wounds: Results of an open retrospective randomized controlled study in vivo. Clin. Plasma Med. 2013, 1, 25–30. [Google Scholar] [CrossRef]
  6. Li, Y.F.; Shimizu, T.; Zimmermann, J.L.; Morfill, G.E. Cold Atmospheric Plasma for Surface Disinfection. Plasma Process. Polym. 2011, 9, 585–589. [Google Scholar] [CrossRef]
  7. Hu, X.; Zhang, Y.; Wu, R.A.; Liao, X.; Liu, D.; Cullen, P.J.; Zhou, R.-W.; Ding, T. Diagnostic analysis of reactive species in plasma-activated water (PAW): Current advances and outlooks. J. Phys. D Appl. Phys. 2021, 55, 023002. [Google Scholar] [CrossRef]
  8. Subramanian, P.S.G.; Jain, A.; Shivapuji, A.M.; Sundaresan, N.R.; Dasappa, S.; Rao, L. Plasma-activated water from a dielectric barrier discharge plasma source for the selective treatment of cancer cells. Plasma Process. Polym. 2020, 17, 1900260. [Google Scholar] [CrossRef]
  9. Rathore, V.; Nema, S.K. The role of different plasma forming gases on chemical species formed in plasma activated water (PAW) and their effect on its properties. Phys. Scr. 2022, 97, 065003. [Google Scholar] [CrossRef]
  10. Rathore, V.; Nema, S.K. Optimization of process parameters to generate plasma activated water and study of physicochemical properties of plasma activated solutions at optimum condition. J. Appl. Phys. 2021, 129, 084901. [Google Scholar] [CrossRef]
  11. Rathore, V.; Patel, D.; Butani, S.; Nema, S.K. Investigation of Physicochemical Properties of Plasma Activated Water and its Bactericidal Efficacy. Plasma Chem. Plasma Process. 2021, 41, 871–902. [Google Scholar] [CrossRef]
  12. Rathore, V.; Nema, S.K. A comparative study of dielectric barrier discharge plasma device and plasma jet to generate plasma activated water and post-discharge trapping of reactive species. Phys. Plasmas 2022, 29, 033510. [Google Scholar] [CrossRef]
  13. Li, Z.; Jin, S.; Xian, Y.; Nie, L.; Liu, D.; Lu, X. A non-equal gap distance dielectric barrier discharge: Between a wedge-shaped and a plane-shaped electrode. Plasma Sources Sci. Technol. 2021, 30, 065026. [Google Scholar] [CrossRef]
  14. Acsente, T.; Ionita, M.D.; Teodorescu, M.; Marascu, V.; Dinescu, G. Surface modification of polymethylmethacrylate foils using an atmospheric pressure plasma jet in presence of water vapors. Thin Solid Film. 2016, 614, 25–30. [Google Scholar] [CrossRef]
  15. Oh, J.-S.; Szili, E.J.; Ogawa, K.; Short, R.D.; Ito, M.; Furuta, H.; Hatta, A. UV-vis spectroscopy study of plasma-activated water: Dependence of the chemical composition on plasma exposure time and treatment distance. Jpn. J. Appl. Phys. 2018, 57, 0102B9. [Google Scholar] [CrossRef]
  16. Machala, Z.; Tarabova, B.; Hensel, K.; Spetlikova, E.; Sikurova, L.; Lukes, P. Formation of ROS and RNS in Water Electro-Sprayed through Transient Spark Discharge in Air and their Bactericidal Effects. Plasma Process. Polym. 2013, 10, 649–659. [Google Scholar] [CrossRef]
  17. Burns, J.M.; Cooper, W.J.; Ferry, J.L.; King, D.W.; DiMento, B.P.; McNeill, K.; Miller, C.J.; Miller, W.L.; Peake, B.M.; Rusak, S.A.; et al. Methods for reactive oxygen species (ROS) detection in aqueous environments. Aquat. Sci. 2012, 74, 683–734. [Google Scholar] [CrossRef]
  18. Takahashi, K.; Satoh, K.; Itoh, H.; Kawaguchi, H.; Timoshkin, I.; Given, M.; MacGregor, S. Production characteristics of reactive oxygen/nitrogen species in water using atmospheric pressure discharge plasmas. Jpn. J. Appl. Phys. 2016, 55, 07LF01. [Google Scholar] [CrossRef]
  19. Ghimire, B.; Szili, E.J.; Patenall, B.L.; Lamichhane, P.; Gaur, N.; Robson, A.J.; Trivedi, D.; Thet, N.T.; Jenkins, A.T.A.; Choi, E.H.; et al. Enhancement of hydrogen peroxide production from an atmospheric pressure argon plasma jet and implications to the antibacterial activity of plasma activated water. Plasma Sources Sci. Technol. 2021, 30, 035009. [Google Scholar] [CrossRef]
  20. Tsenkova, R.; Muncan, J.; Pollner, B.; Kovacs, Z. Essentials of Aquaphotomics and Its Chemometrics Approaches. Front. Chem. 2018, 6, 363. [Google Scholar] [CrossRef]
  21. Tsenkova, R. Aquaphotomics: Exploring Water—Light Interactions for a Better Understanding of the Biological World. NIR News 2006, 17, 8–14. [Google Scholar] [CrossRef]
  22. Tsenkova, R. Aquaphotomics and Chambersburg. NIR News 2006, 17, 12–14. [Google Scholar] [CrossRef]
  23. Tsenkova, R. AquaPhotomics: Water Absorbance Pattern as a Biological Marker for Disease Diagnosis and Disease Understanding. NIR News 2017, 18, 14–16. [Google Scholar] [CrossRef]
  24. Weber, J.M.; Kelley, J.A.; Nielsen, S.B.; Ayotte, P.; Johnson, M.A. Isolating the Spectroscopic Signature of a Hydration Shell with the Use of Clusters: Superoxide Tetrahydrate. Science 2000, 287, 2461–2463. [Google Scholar] [CrossRef]
  25. Weber, J.M.; Kelley, J.A.; Robertson, W.H.; Johnson, M.A. Hydration of a structured excess charge distribution: Infrared spectroscopy of the O2⋅(H2O)n, (1 ≤ n ≤ 5) clusters. J. Chem. Phys. 2001, 114, 2698–2706. [Google Scholar] [CrossRef]
  26. Smith, J.D.; Cappa, C.D.; Wilson, K.R.; Cohen, R.C.; Geissler, P.L.; Saykally, R.J. Unified description of temperature-dependent hydrogen-bond rearrangements in liquid water. Proc. Natl. Acad. Sci. USA 2005, 102, 14171–14174. [Google Scholar] [CrossRef]
  27. Tsenkova, R. Aquaphotomics: Dynamic Spectroscopy of Aqueous and Biological Systems Describes Peculiarities of Water. J. Near Infrared Spectrosc. 2009, 17, 303–313. [Google Scholar] [CrossRef]
  28. Kinoshita, K.; Miyazaki, M.; Morita, H.; Vassileva, M.; Tang, C.; Li, D.; Ishikawa, O.; Kusunoki, H.; Tsenkova, R. Spectral pattern of urinary water as a biomarker of estrus in the giant panda. Sci. Rep. 2012, 2, 856. [Google Scholar] [CrossRef]
  29. Baishya, N.; Momouei, M.; Budidha, K.; Qassem, M.; Vadgama, P.; Kyriacou, P.A. Near infrared spectrometric investigation of lactate in a varying pH buffer. J. Near Infrared Spectrosc. 2020, 28, 328–333. [Google Scholar] [CrossRef]
  30. Gumbel, D.; Bekeschus, S.; Gelbrich, N.; Napp, M.; Ekkernkamp, A.; Kramer, A.; Stope, M.B. Cold Atmospheric Plasma in the Treatment of Osteosarcoma. Int. J. Mol. Sci. 2017, 18, 2004. [Google Scholar] [CrossRef]
  31. Traylor, M.J.; Pavlovich, M.J.; Karim, S.; Hait, P.; Sakiyama, Y.; Clark, D.S.; Graves, D.B. Long-term antibacterial efficacy of air plasma-activated water. J. Phys. D Appl. Phys. 2011, 44, 472001. [Google Scholar] [CrossRef]
  32. Priyadarsini, A.; Mallik, B.S. Structure and rotational dynamics of water around hydrogen peroxide. J. Mol. Liq. 2022, 348, 118054. [Google Scholar] [CrossRef]
  33. Biswas, A.; Mallik, B.S. Conformation-induced vibrational spectral dynamics of hydrogen peroxide and vicinal water molecules. Phys. Chem. Chem. Phys. 2021, 23, 6665–6676. [Google Scholar] [CrossRef]
  34. Yadav, S.; Chandra, A. Solvation Shell of the Nitrite Ion in Water: An Ab Initio Molecular Dynamics Study. J. Phys. Chem. B 2020, 124, 7194–7204. [Google Scholar] [CrossRef]
  35. Banerjee, P.; Yashonath, S.; Bagchi, B. Coupled jump rotational dynamics in aqueous nitrate solutions. J. Chem. Phys. 2016, 145, 234502. [Google Scholar] [CrossRef]
  36. Tsenkova, R.; Kovacs, Z.; Kubota, Y. Aquaphotomics: Near Infrared Spectroscopy and Water States in Biological Systems. Subcell Biochem. 2015, 71, 189–211. [Google Scholar]
Figure 1. Discharge image of the plasma jet device used in this study.
Applsci 14 00001 g001
Figure 2. Raw NIR spectra of PAW samples: (A). Raw NIR spectra of PAW samples obtained by treating with CAP for 5 min, 10 min, and 15 min, respectively. (B). Raw NIR spectra were acquired by continuous measurement of a 15 min PAW sample for 8 h.
Applsci 14 00001 g002
Figure 3. Local magnification of the original spectra at 1300–1600 nm and 1750–1860 nm: (A). Magnified view of the spectra of the samples treated for 5, 10 and 15 min at 1300–1600 nm. (B). Magnified view of the spectra of the samples treated for 5, 10 and 15 min at 1750–1860 nm. (C). Magnified view of the spectra obtained from the samples treated for 15 min with continuous collection for 8 h at 1300–1600 nm. (D). Magnified view of the spectra at 1750–1860 nm obtained from the samples treated for 15 min with 8 h of continuous collection.
Applsci 14 00001 g003
Figure 4. Local magnification of the second-order-derivative spectral changes after processing the 5, 10, and 15 min PAW samples demonstrates a trend of increasing spectral changes with longer processing times from 5 to 15 min: (A). Local magnification of the spectrum in the range 1359–1375 nm. (B). Local magnification of the spectrum in the range 1821–1847 nm.
Applsci 14 00001 g004
Figure 5. The ratio of fluorescence intensity of PAW samples with different treatment times to the blank control. Black, light grey and grey in the graphs indicate the ratio of the fluorescence intensity measured by the 5, 10 and 15 min samples to that measured by the blank control, respectively.
Applsci 14 00001 g005
Figure 6. Load plots corresponding to PC1 in PCA analysis and regression coefficient curves in PLS analysis. (A). Load plots obtained by plotting the loads derived from PC1 against wavelengths and labelled with characteristic wavelengths selected in the range 1300–1860 nm. (B). Regression coefficient curves obtained by plotting the values of the regression coefficients against wavelengths and labelled with characteristic wavelengths selected in the range 1300–1860 nm.
Applsci 14 00001 g006
Figure 7. Aquagram of NIR spectral data containing 12 water matrix coordinates.
Applsci 14 00001 g007
Figure 8. Comparison of the fluorescence intensity ratio of the PAW samples to the blank control before and after 8 h. Black and light grey in the graph represent the ratio of fluorescence intensity measured without storage and after 8h storage of the samples to the fluorescence intensity measured by the blank control, respectively.
Applsci 14 00001 g008
Disclaimer/Publisher’s Note: The statements, opinions and data contained in all publications are solely those of the individual author(s) and contributor(s) and not of MDPI and/or the editor(s). MDPI and/or the editor(s) disclaim responsibility for any injury to people or property resulting from any ideas, methods, instructions or products referred to in the content.

