Article

Unmanned Helicopter Airborne Fourier Transform Infrared Spectrometer Remote Sensing System for Hazardous Vapors Detection

1
Key Laboratory of Computational Optical Imaging Technology, Aerospace Information Research Institute, Chinese Academy of Sciences, Beijing 100094, China
2
University of Chinese Academy of Sciences, Beijing 100049, China
*
Authors to whom correspondence should be addressed.
Appl. Sci. 2024, 14(4), 1367; https://doi.org/10.3390/app14041367
Submission received: 8 January 2024 / Revised: 30 January 2024 / Accepted: 6 February 2024 / Published: 7 February 2024
(This article belongs to the Special Issue Spectral Detection: Technologies and Applications)

Abstract

:
The rapid development of unmanned aerial vehicles (UAVs) provides a new application mode for gas remote sensing. Compared with fixed observation and vehicle-mounted platforms, a Fourier transform infrared spectrometer (FTIR) integrated in the UAV can monitor chemical gases across a large area, can collect data from multiple angles in three-dimensional space, and can operate in contaminated or hazardous environments. The unmanned helicopter has a larger payload and longer endurance than the rotary-wing drone, which relaxes the weight, size and power consumption limitations of the spectrometer. A FTIR remote sensing system integrated in an unmanned helicopter was developed. In order to solve the data acquisition and analysis problem caused by vibration and attitude instability of the unmanned helicopter, a dual-channel parallel oscillating mirror was designed to improve the stability of the interferometer module, and a robust principal component analysis algorithm based on kernel function was used to separate background spectrum and gas features. The flight experiment of sulfur hexafluoride gas detection was carried out. The results show that the system operates stably and can collect and identify the target spectrum in real time under the motion and hovering modes of an unmanned helicopter, which has broad application prospects.

1. Introduction

Passive Fourier transform remote sensing technology enables the detection and identification of chemical pollutants in the air [1], and has been widely studied and applied in many fields such as the detection of hazardous clouds [2,3,4,5,6,7], the analysis of aircraft exhaust plume [8,9,10], pollution gas emissions over distance monitoring [11,12,13,14,15] and taking measurements of greenhouse gases [16,17,18]. The Fourier transform infrared spectrometer is mainly carried by a vehicle or fixed on a tripod which is slow to deploy or requires dedicated runways [19]. The unmanned aerial vehicle is an aerial vehicle that is guided automatically with a remote controller and is implemented in the agriculture, oil & gas industries, and seaports for inspection, security, and surveillance [20]. UAVs have become attractive experimental platforms for air quality research in recent years. They have the advantages of being low cost, having wide coverage and multiple observation angles, as well as the capability to perform remote sensing and close-in detection which do not require equipment operators to get close to toxic gases and are very safe. UAVs have demonstrated their applications in multiple studies, such as integrating a tunable diode laser absorption spectroscopy (TDLAS) system to detect natural gas fugitive leaks [21] and using particulate matter and nitrogen dioxide sensors to monitor atmospheric pollutants [22].
Despite the potential of UAV remote sensing gas detection, the Fourier transform infrared spectrometer generally contains a motor-driven interferometer module, a cooled infrared detector, a data acquisition board and a processing computer. The weight and power constraints limit the gas detection capabilities of autonomous UAVs. Rutkauskas et al. suspended the Fourier transform spectrometer under the DJI M600 drone (DJI, Shenzhen, China) to obtain GPS-referenced concentration data for carbon dioxide, propane and water (humidity) [19]. Limited by the maximum lifting weight of the rotary-wing UAV, the endurance of the drone was short.
Aside from lift weight and power constraints, vibration resistance and high stability are also required by FTIR systems. The interference fringes of the spectrometer should be kept constant before and after takeoff to ensure that high-quality spectra are recovered during flight. In addition, the pure background spectrum is difficult to measure because of the vibration and attitude of the UAV platform. The method of directly subtracting the background spectrum from the target spectrum may increase the false alarm rate and reduce the detection probability of gases with weak spectral characteristics. Beil et al. proposed a brightness temperature method based on Planck’s radiation law [1]. In the brightness temperature spectrum regime, the temperature spectrum has a constant baseline for many natural materials that serve as the background in field measurements (concrete, forest, etc.). The brightness temperature method measures blackbody spectra at different temperatures to calibrate the spectrometer before each measurement. If the blackbody is designed inside the spectrometer, the increased weight makes it difficult to integrate with drones. The external calibration requires strict environmental conditions for the UAV-integrated system applied in the field. Li et al. used the least absolute shrinkage and selection operator (LASSO) method to select the most appropriate reference for spectral fitting [7]. The accuracy of fitting decreases when the atmospheric state changes due to poor meteorological conditions or the turbulence effects associated with the complex air flow around a UAV.
In order to make the Fourier transform infrared spectrometer used in more scenarios and make full use of the advantages of UAV platforms, we proposed an unmanned helicopter airborne dual-channel parallel oscillating mirror FTIR passive remote sensing system, different from the rotary-wing UAV used in previous studies. The chemical gas detection experiments of the integrated system were carried out in the hovering and moving modes of the unmanned helicopter, respectively. The results show that the system can monitor, identify and warn of chemical gas in real time. The main contributions in this study are as follows:
  • We proposed to use an unmanned helicopter as the FTIR carrying platform. The payload and endurance advantages of unmanned helicopters reduce the weight and power consumption requirements of the spectrometer. To the best of our knowledge, this is the first attempt to integrate the FTIR with unmanned helicopters.
  • Aiming at the problem of removing the background and extracting the spectral characteristics of the gas of the spectrometer mounted on the unmanned helicopter, we proposed to collect multiple background spectra near the detection area to form a background spectral database, and use the algorithm based on robust principal component analysis to separate the low-rank background.
The paper is organized as follows: Section 2 is divided into four parts: the theoretical model used in passive gas remote sensing; the gas detection algorithm based on RPCA; the interference module design; and the integration method of the FTIR system. Section 3 shows the details and results of the ground and flight gas detection experiments of the unmanned helicopter FTIR system. Section 4 and Section 5 compare and analyze the experimental results and propose the improvement methods for future research.

2. Materials and Methods

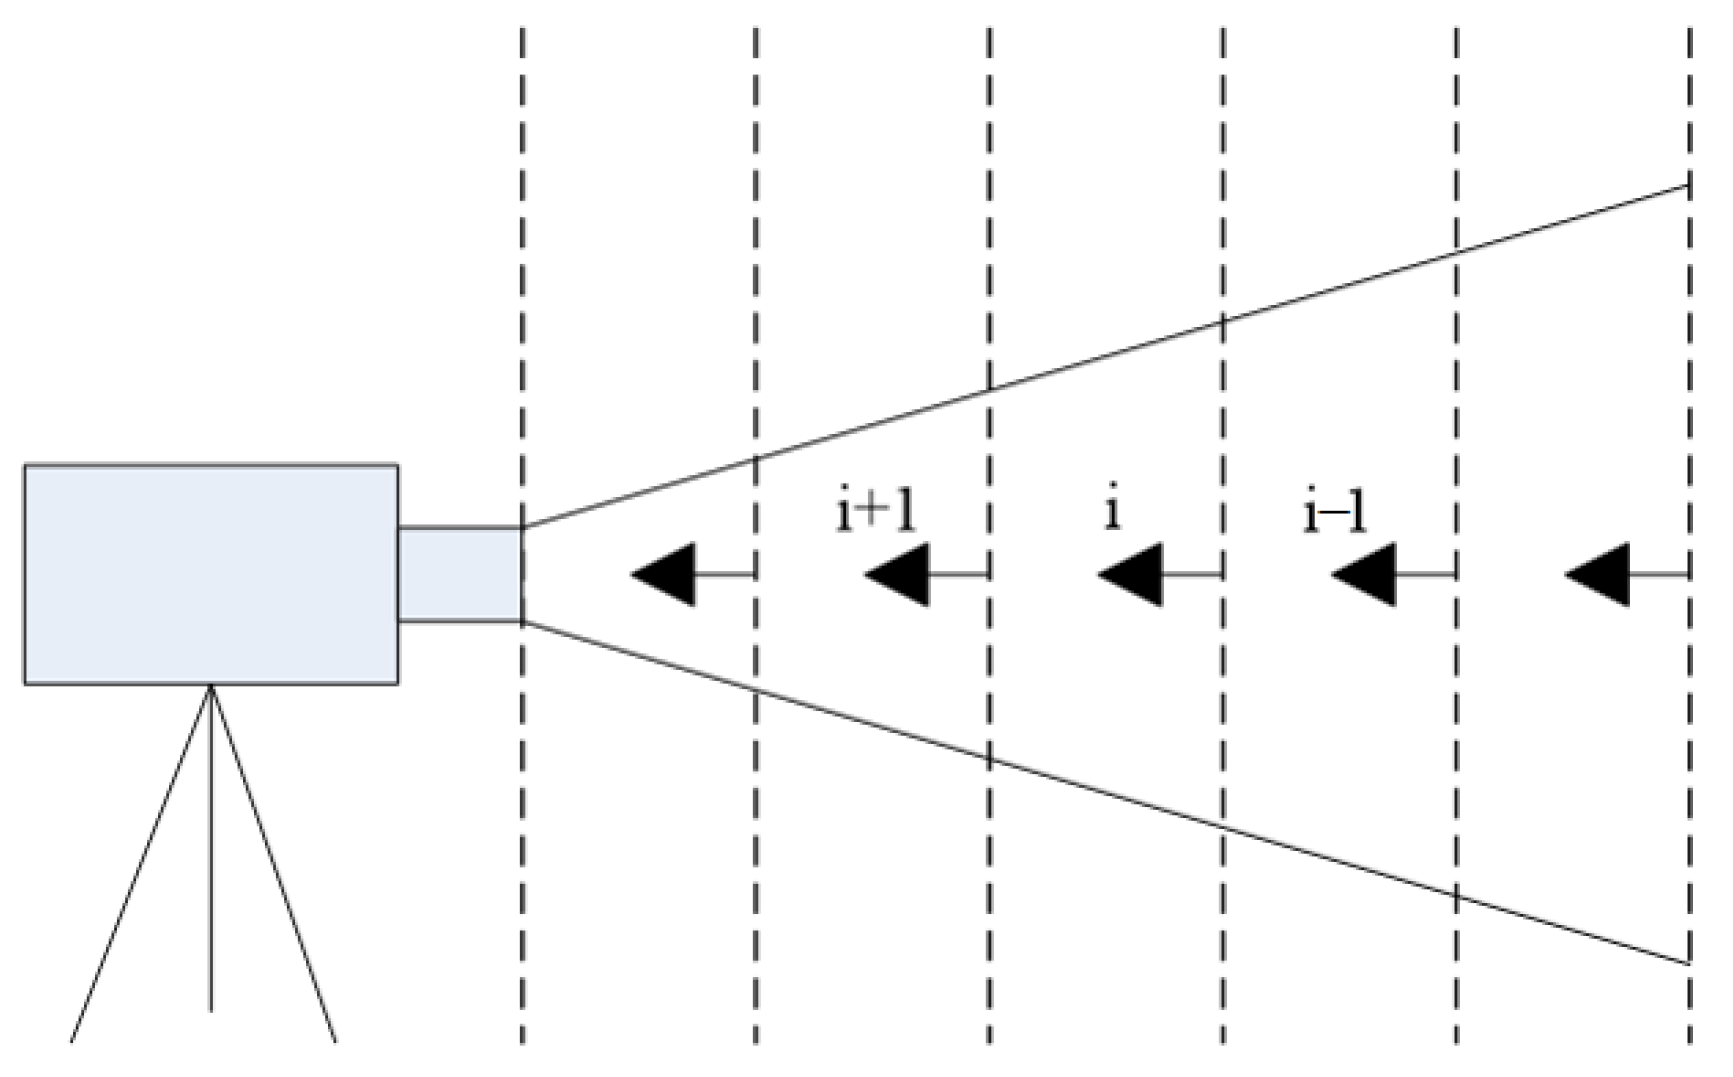
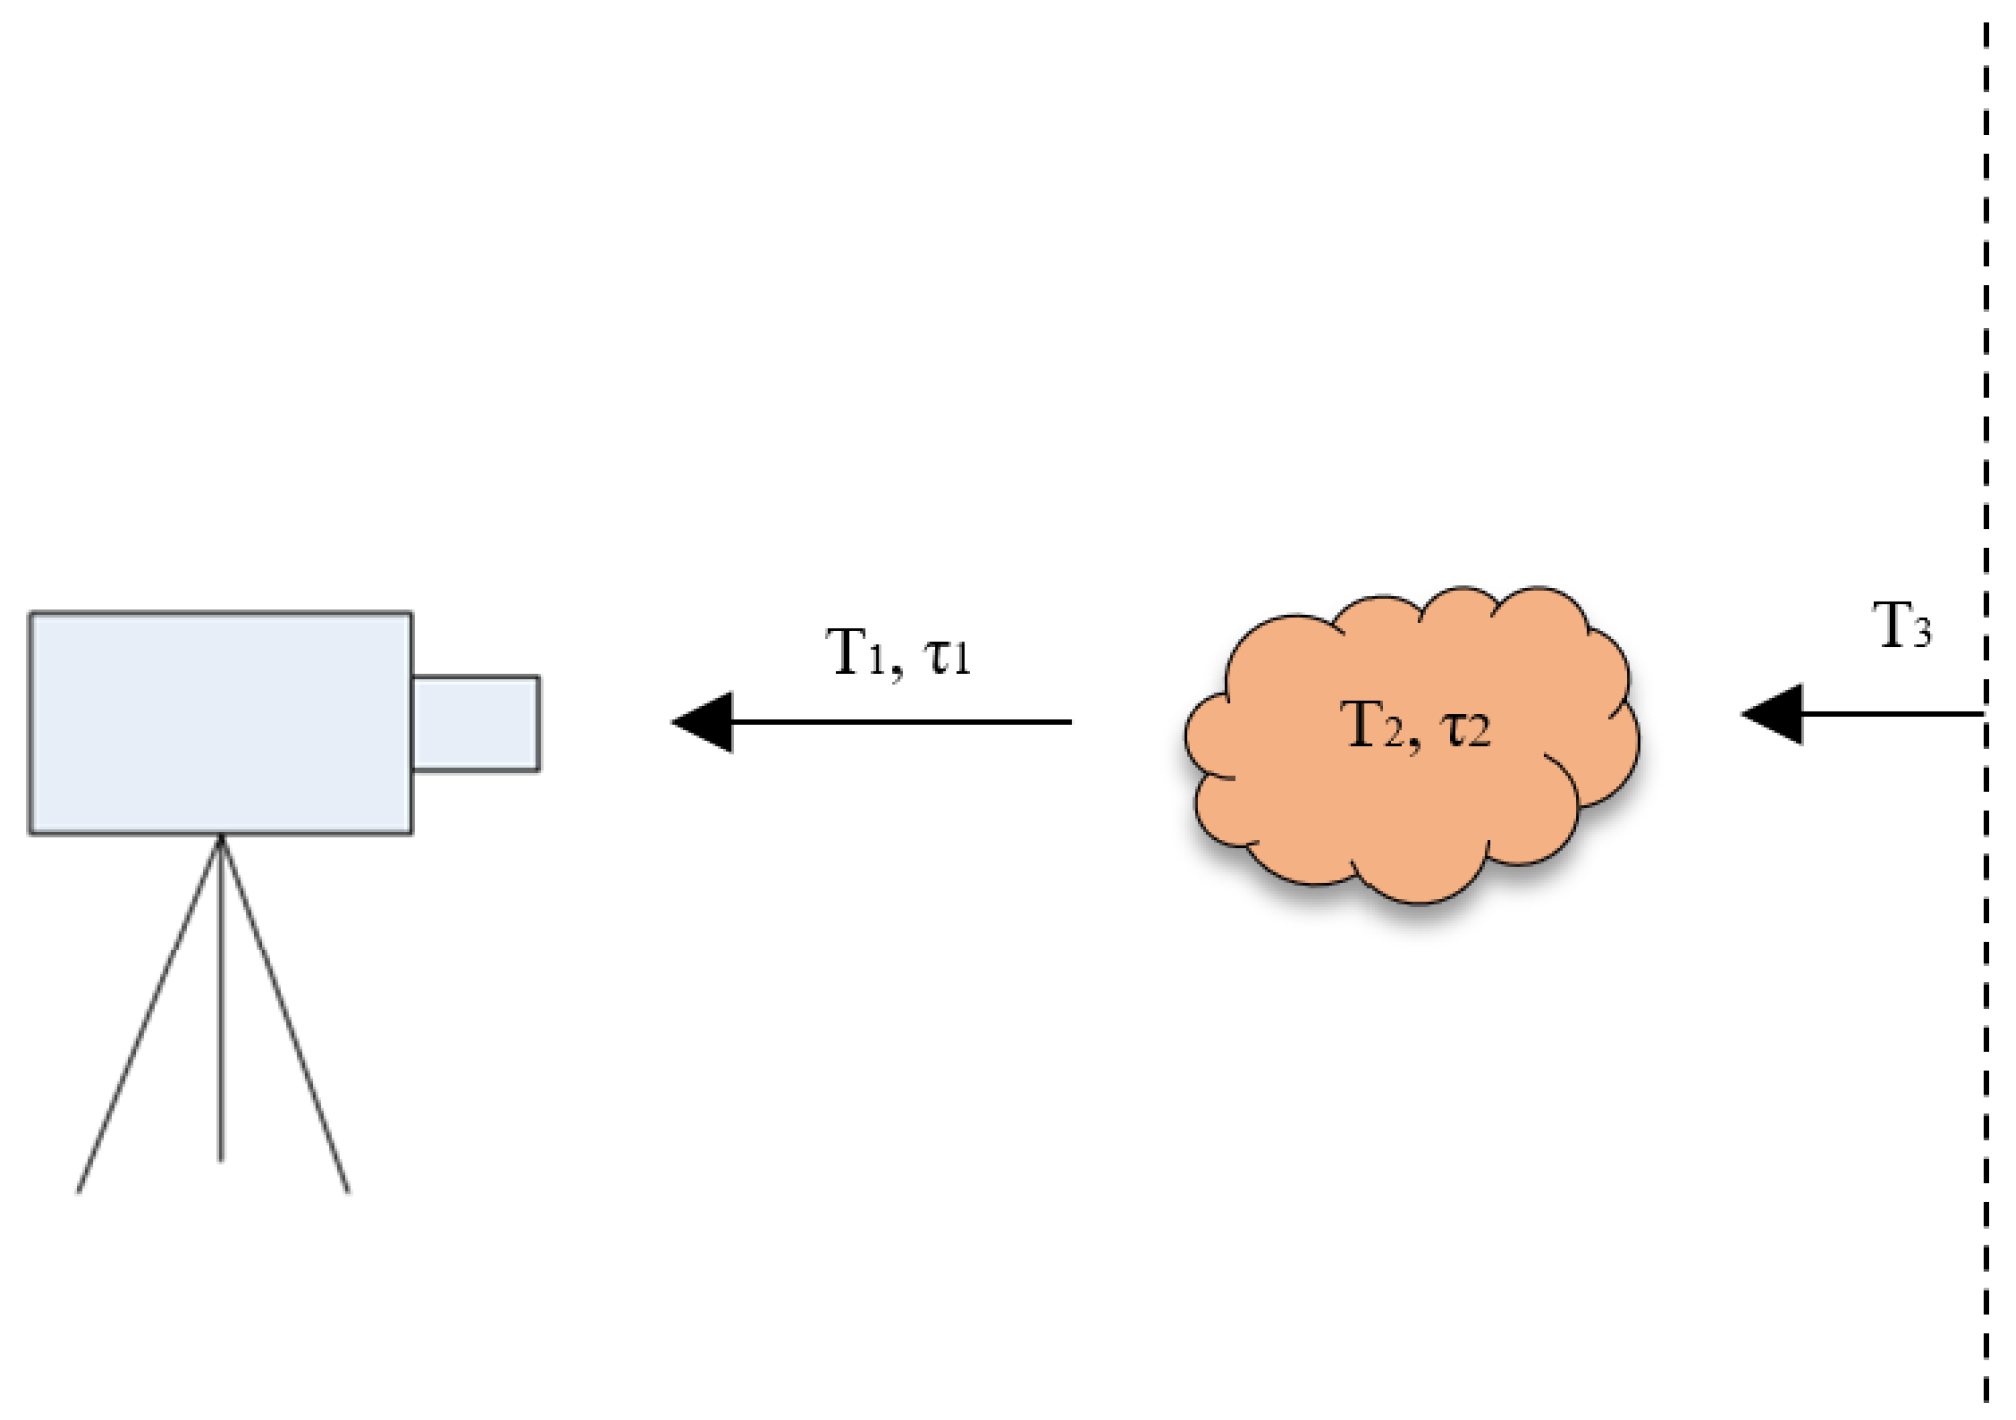
2.1. FTIR Passive Remote Sensing Model

Passive remote sensing of gas clouds is based on the analysis of the infrared absorption and radiation by molecules in the atmosphere. The propagation of radiation through the atmosphere is described by the theory of radiative transfer [23]. The atmosphere in front of the FTIR is divided into multiple homogeneous layers, as shown in Figure 1. For each homogeneous layer, it receives radiation from the previous layer and transfer radiation to the next layer. Taking into account the transmittance and scattering of the target material, interferers and atmosphere in the homogeneous layer, the output spectral radiometry can be expressed as:
L i = 1 τ a τ b τ c B i + τ a τ b τ c L i 1 + ρ i
where B i is the radiance of blackbody at temperature of layer i, L i 1 is the radiance of layer i − 1, τ a , τ b , τ c are the transmittance of the gas, the interference and the atmosphere, respectively, and ρ i is the scattering contribution.
For horizontal, low elevation, or ground to ground measurements, a simplified model with three layers can be used, as shown in Figure 2. Radiation from the background, for example, the building, the sky or the ground (Layer 3) propagates through the gas cloud (Layer 2) and the atmosphere between the cloud and the Fourier transform infrared spectrometer (Layer 1) [1].
In this three-layers model, Layer 1 and Layer 2 are considered homogenous. The radiation measured from all layers by the spectrometer is:
L 1 = 1 τ 1 B 1 + τ 1 1 τ 2 B 2 + τ 2 L 3
where τ i is the transmittance of layer i (i = 1, 2, 3), B i is the radiance of blackbody at temperature T i , L 3 is the radiance transmitted by the background layer to gas cloud layer. The scattering contribution is negligible [1]. When the second layer is in thermal balance with the surrounding environment, that is, B = B 1 = B 2 , Equation (2) can be simplified as:
L 1 = 1 τ 1 τ 2 B + τ 1 τ 2 L 3
It is generally assumed that the transmittance of Layer 1 τ 1 1 , then Equation (3) can be simplified with a two-layers model:
L 1 = 1 τ 2 B + τ 2 L 3

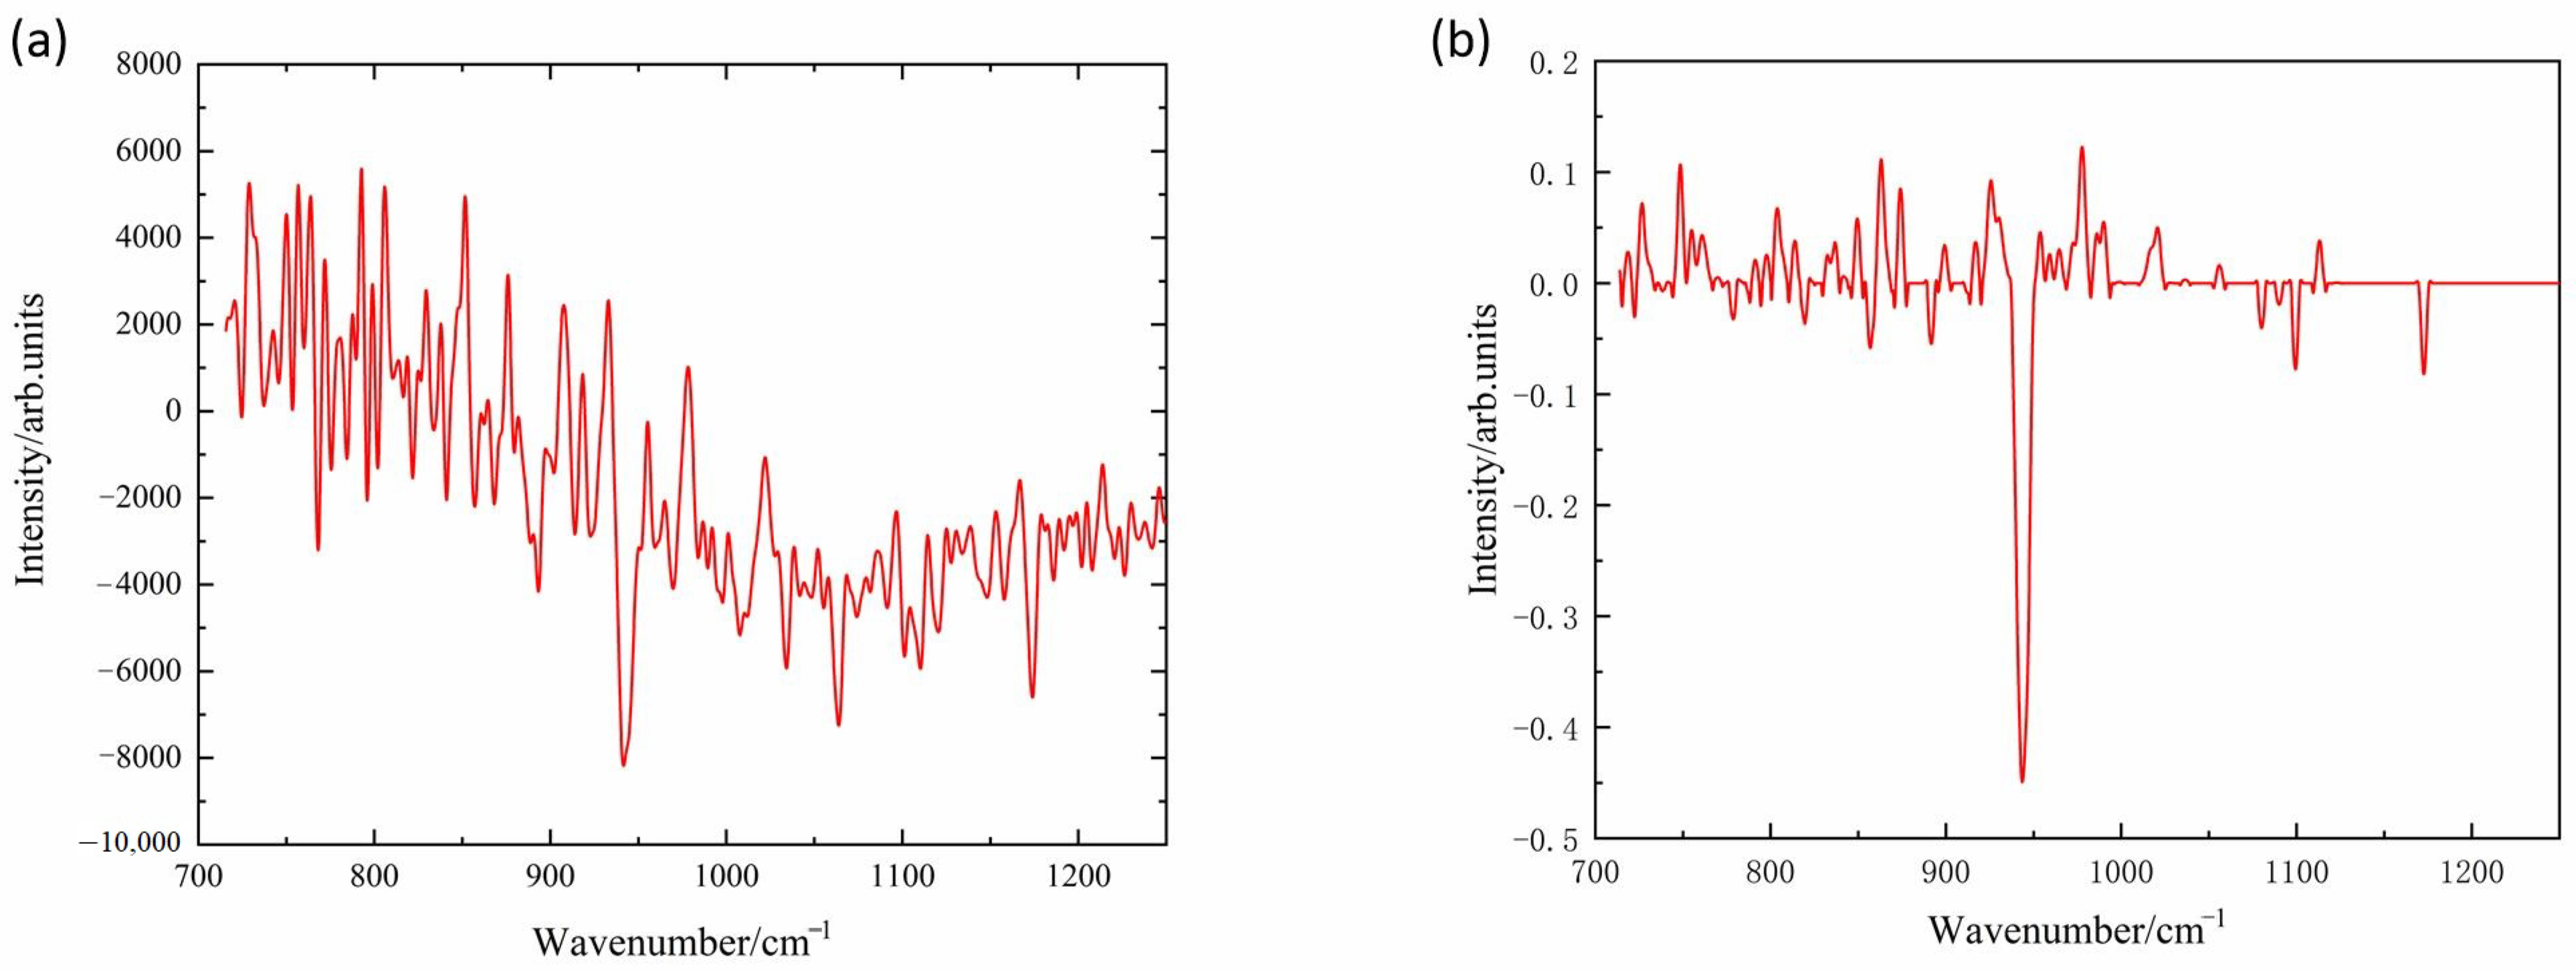
2.2. Gas Absorption Feature Extraction Based on RPCA

The classical principal component analysis (PCA) algorithm is widely used in data analysis, dimensionality reduction and denoising today. It assumes a Gaussian independent and identical distribution of small noise data, but its robustness is poor for non-Gaussian noise or noise with serious outliers. Robust PCA aims to separate a low-rank matrix L and a sparse noise matrix S from observations M. Unlike the small noise required in classical PCA, RPCA is able to recover the low-rank data from arbitrarily large magnitude and sparsely noisy observations. The separation problem is solved by tractable convex optimization [24]:
minimize   L * + λ S 1 subject   to   L + S = M
where L * = i σ i L denotes the nuclear norm of the matrix of L, σ i L is the singular value of matrix L, S 1 denotes the l 1 norm of S , λ is the sparsity constraint parameter of the matrix S, and M R n 1 × n 2 is the observation matrix. The choice of λ is always λ = max n 1 , n 2 . For practical problems, it is possible to improve performance by choosing λ in accordance with prior knowledge. If S is very sparse, increasing λ will recover L of larger rank. Equation (5) can be solved using alternating direction method of multipliers (ADMM).
Due to the vibration and unstable attitude of the unmanned helicopter, we cannot measure the accurate background spectrum. RPCA is able to recover the low-rank data, so we can use the RPCA algorithm to solve the background spectrum and gas absorption feature separation problem. Consider the background spectrum as a low-rank matrix and the gas absorption feature as a sparse matrix in the observed data. Specifically, before measuring the spectrum where the target gas exists, we first measure a series of background spectra b i i = 1,2 , , N near the measurement site, and then the gas spectrum x and the background spectrum are arranged to form the original observation data matrix M:
M = b 1 , b 2 , , b N , x
The background estimation spectrum L and sparse gas absorption feature spectrum S are separated by the RPCA method.

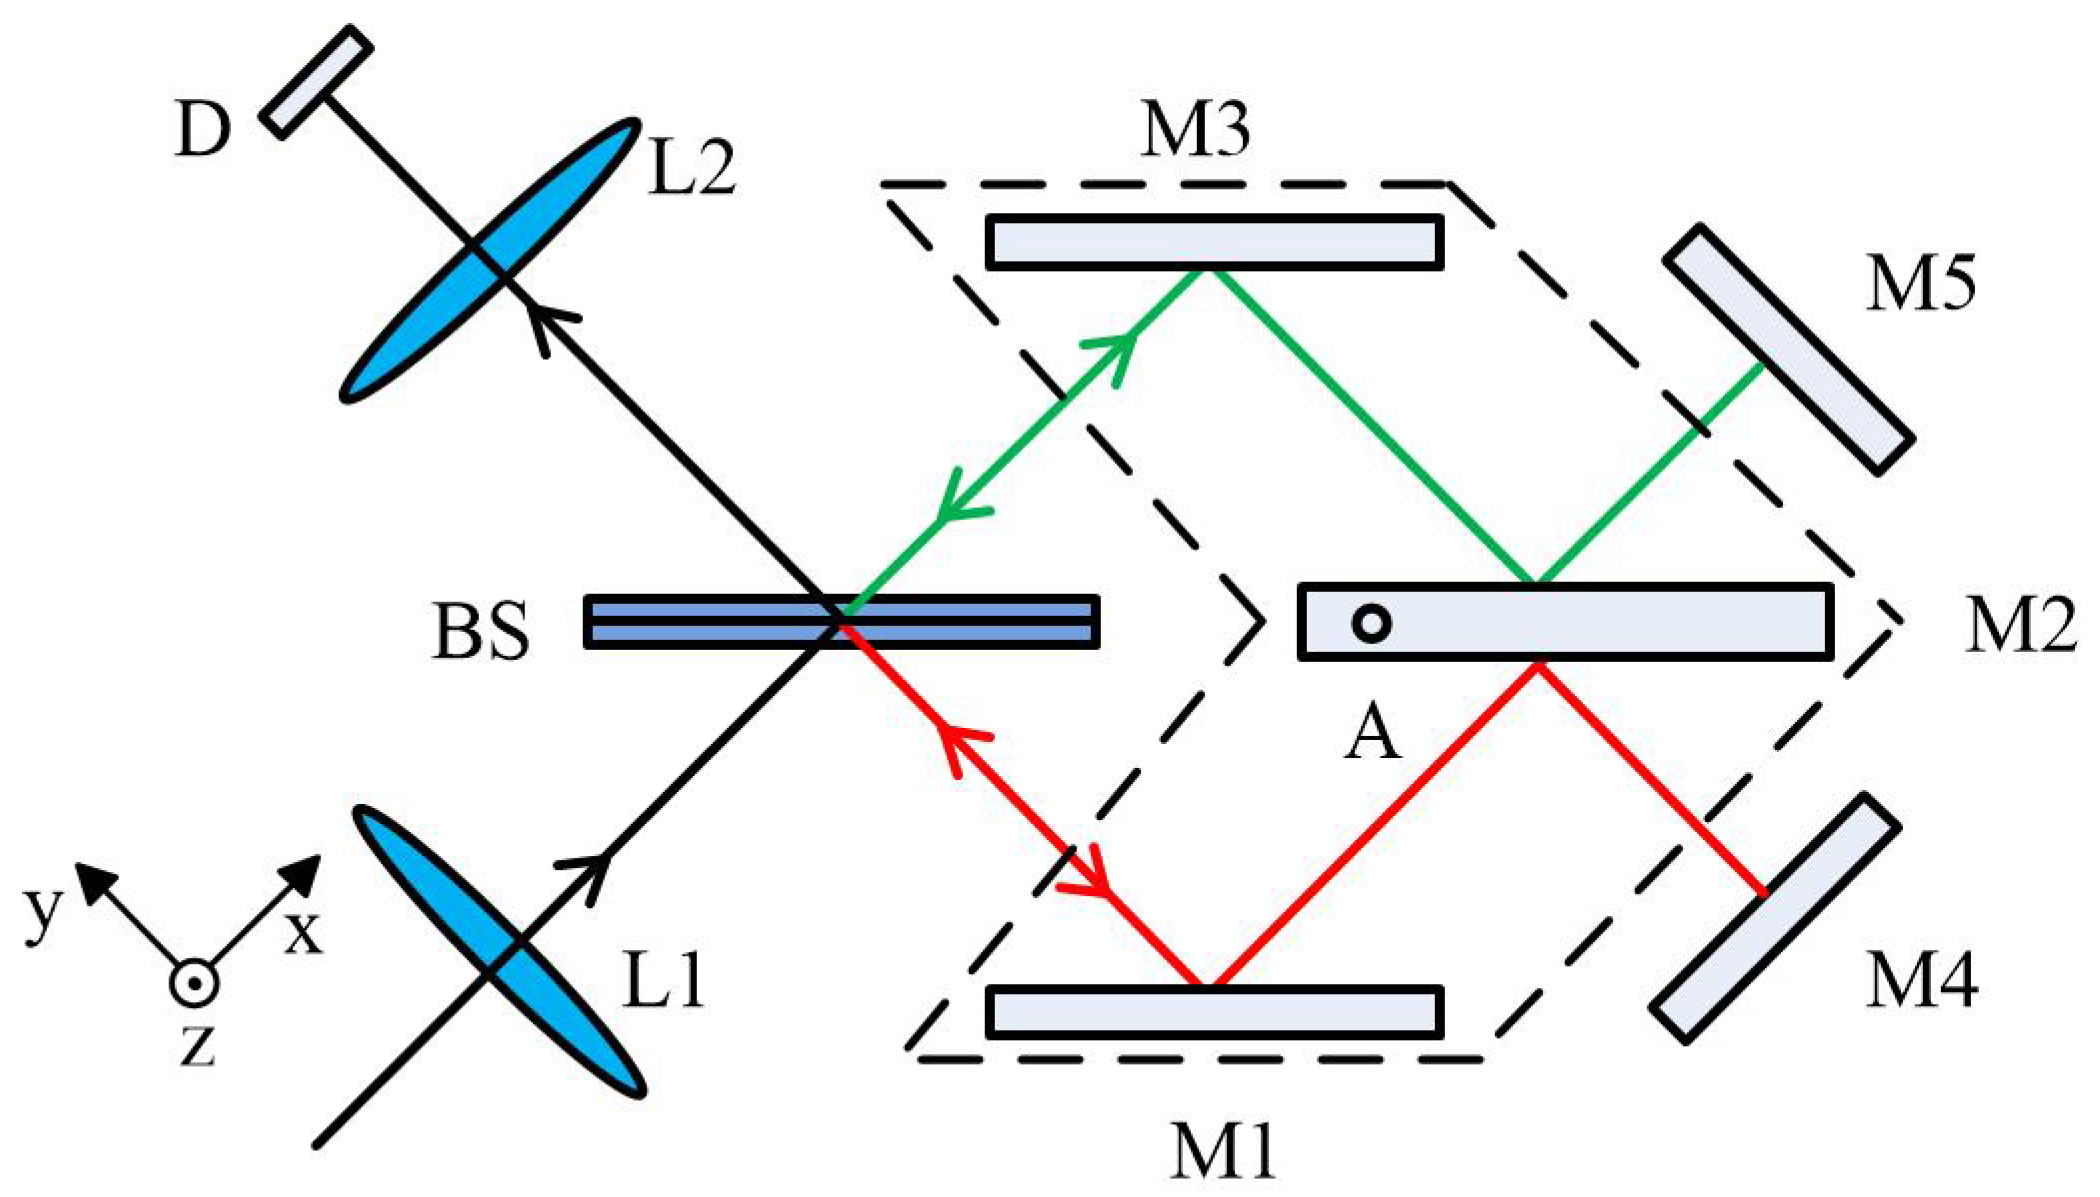
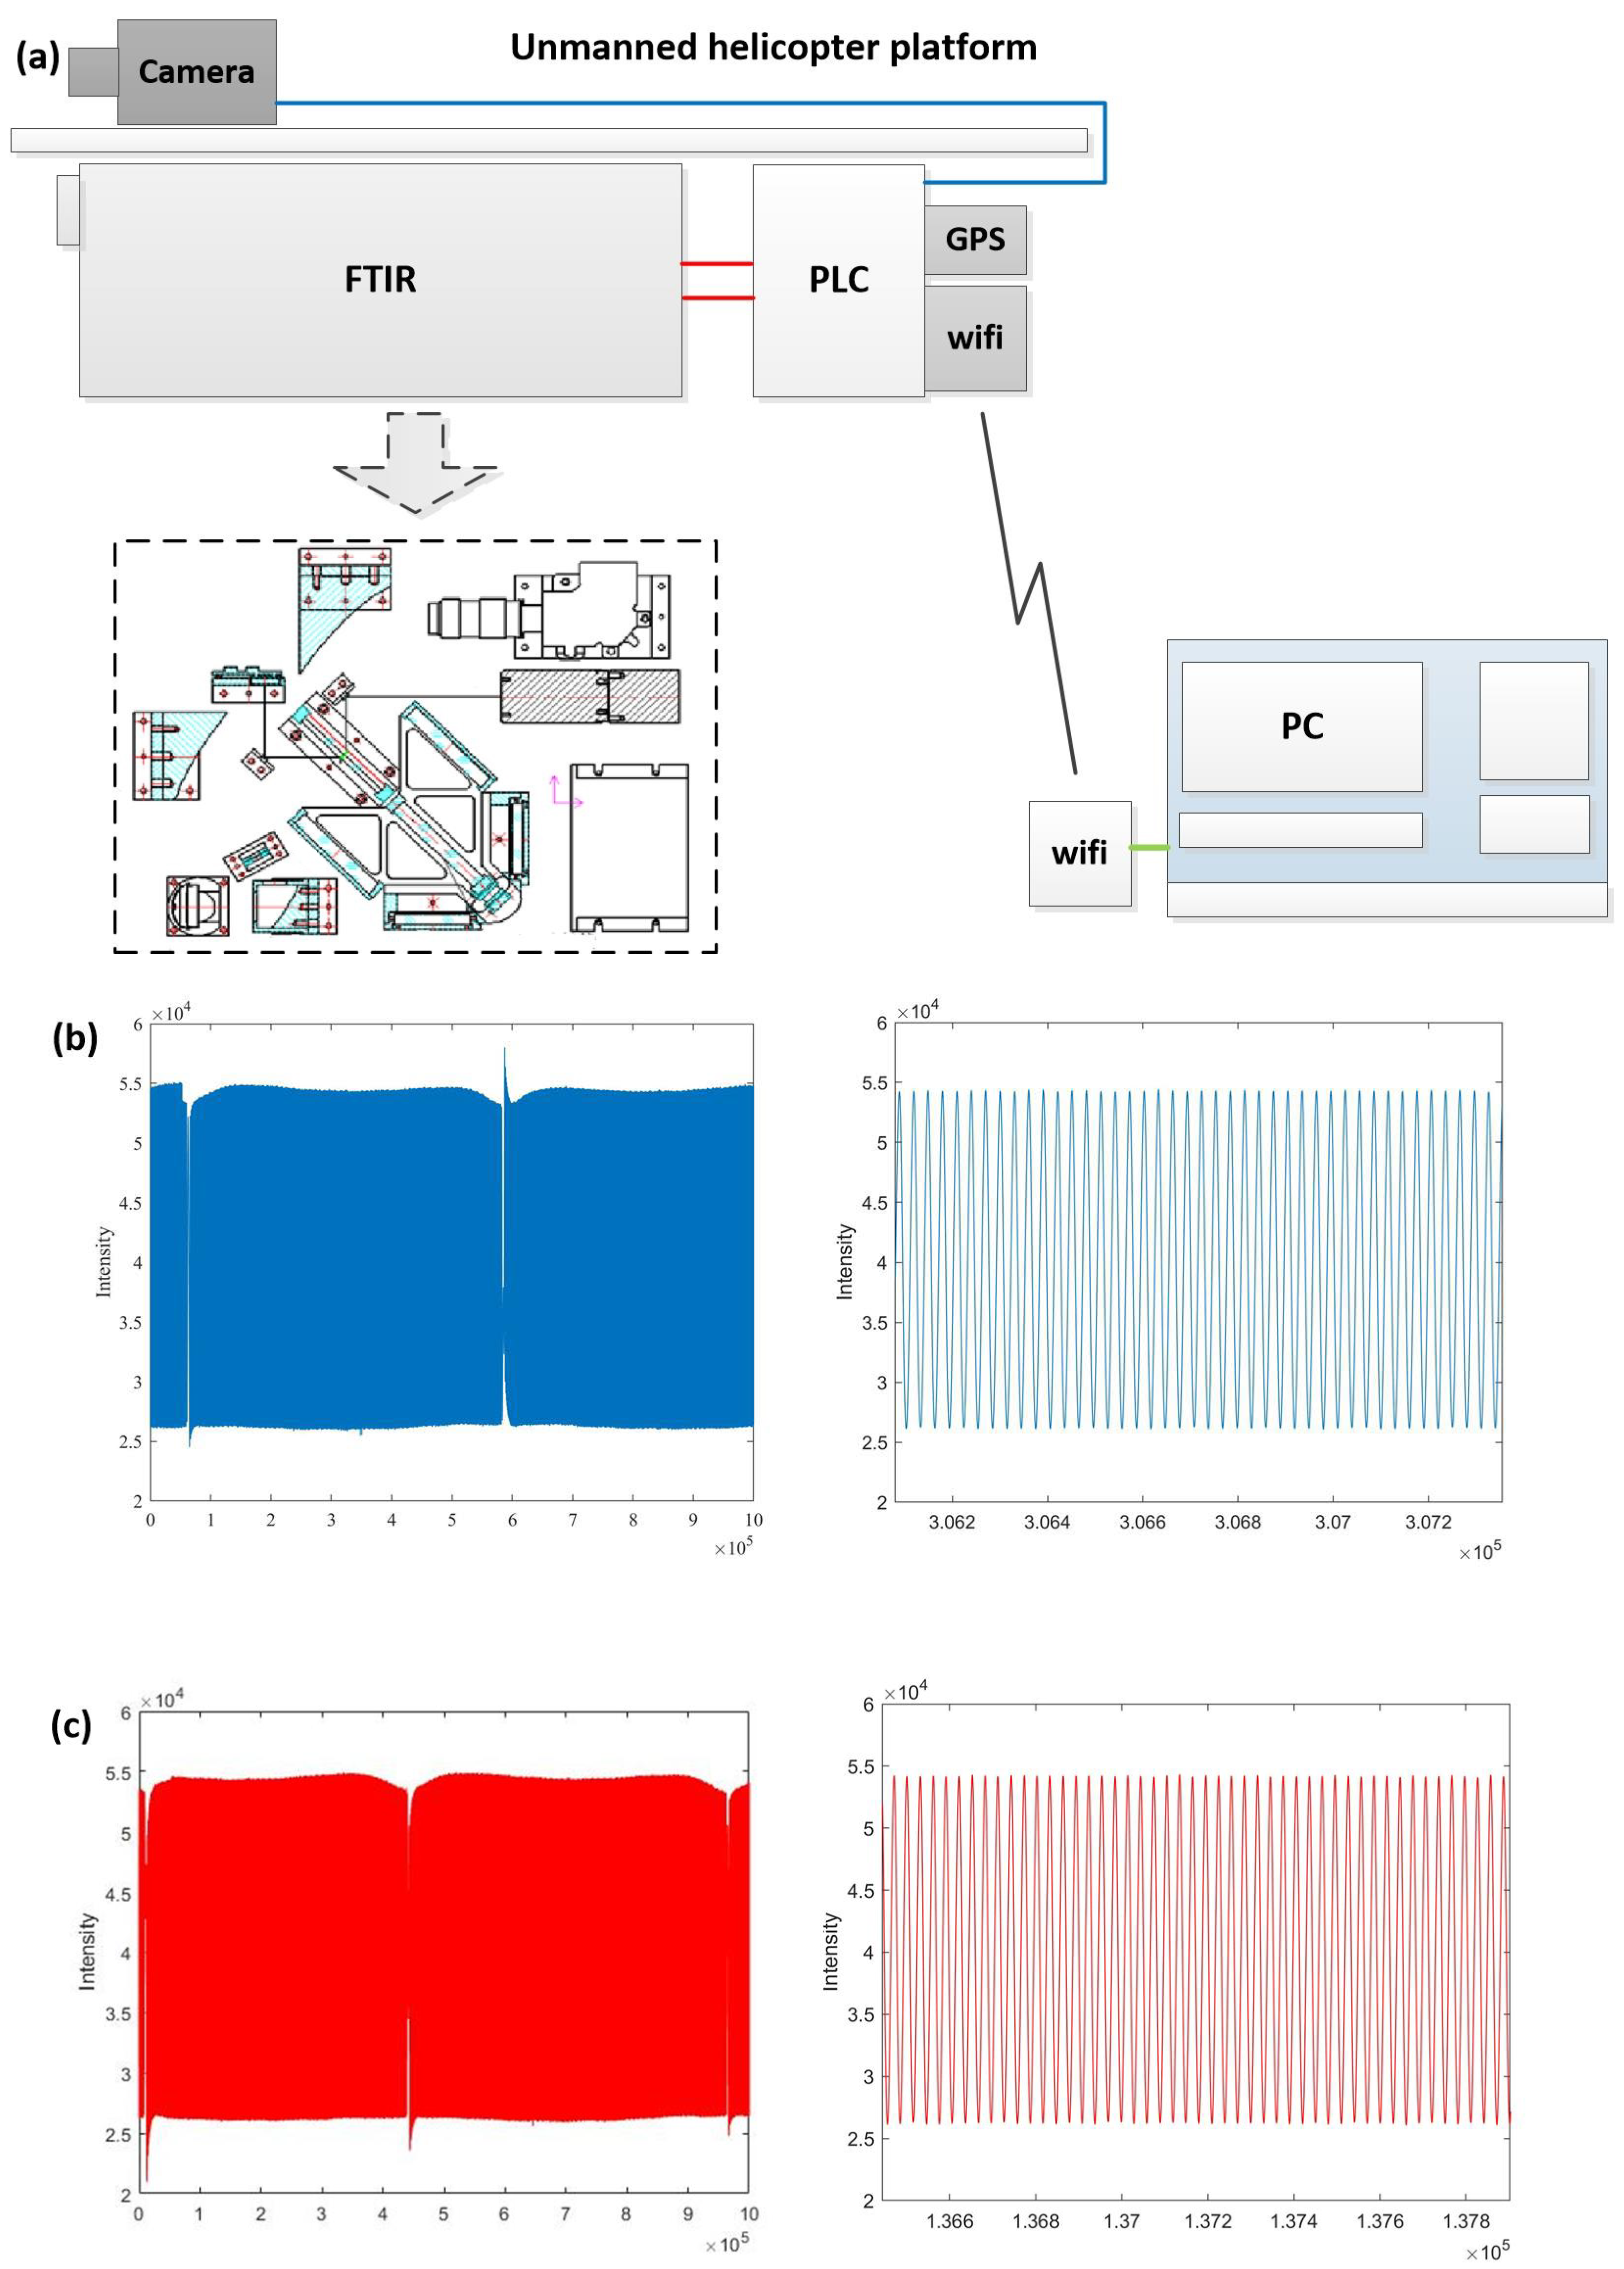
2.3. Dual-Channel Parallel Oscillating Mirror Interferometer

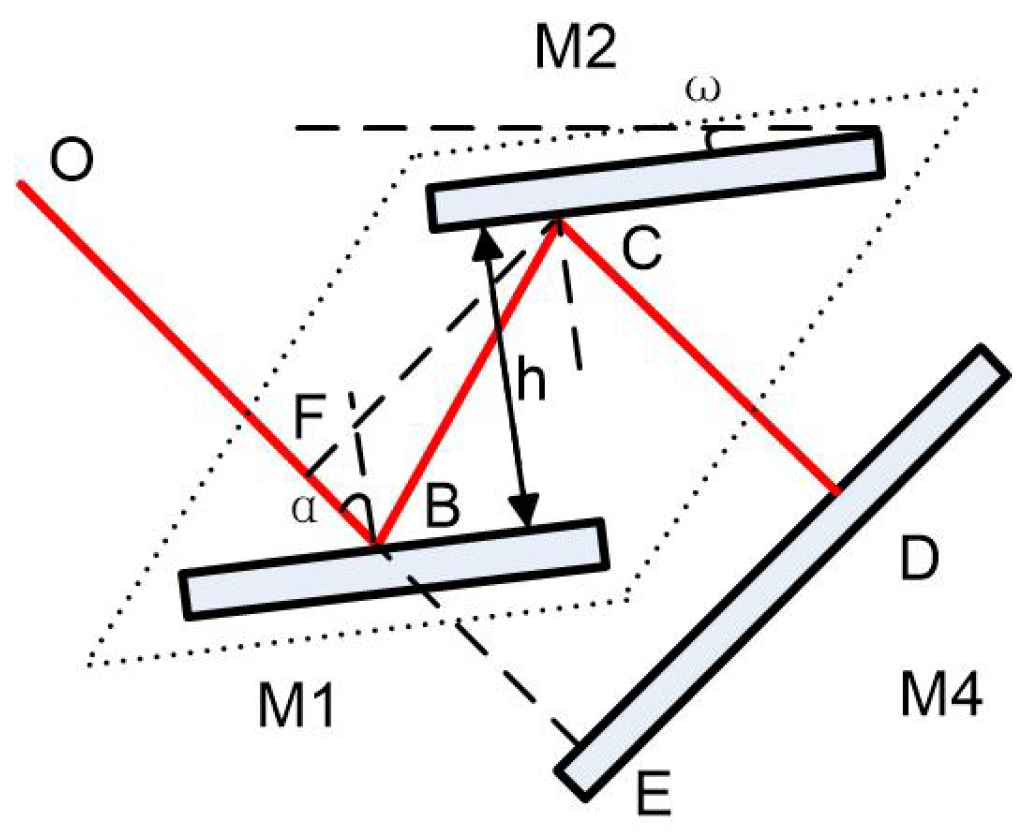
2.3.1. Basic Principle and Components

The principle of the parallel oscillating mirror interferometer module is shown in Figure 3, including a collimator L1, a beam splitter BS, three plane reflecting mirrors M1, M2 and M3, two end mirrors M4 and M5, an imaging mirror L2 and a detector D. The upper and lower faces of mirror M2 are reflective and parallel to each other. Mirror M1 and mirror M3 are parallel to mirror M2, and M1 and M3 are symmetric about mirror M2. The part in the dotted line in Figure 3 is the only moving part in the interferometer, which can swing around the rotation axis perpendicular to the paper (z direction). The two end mirrors M4 and M5 are perpendicular to the direction of the incident light.
The propagation path of light in the interferometer is as follows: the light carrying the measured information is collimated using the collimator L1 and then enters the interferometer as parallel light. The beam splitter BS divides it into transmitted light and reflected light. The reflected light, after being reflected by mirrors M1 and M2, is incident on the end mirror M4, and after being reflected by M4, it returns to the beam splitter BS again. Similarly, the transmitted light is incident on the end mirror M5 after being reflected by the mirrors M3 and M2 and returns to the beam splitter BS after being reflected by M5. The two beams of light merge at the beam splitter and form a beam of coherent light, which converges on the detector D through the imaging mirror L2.
The optical path difference (OPD) of the reflected and transmitted light varies with time as the mirror swings. The relationship between the OPD and the distance h between parallel mirrors and the incident angle α is shown in Figure 4. The light path distance l is equal to 2(OB + BC + CD). The vertical line of ray OB crossing point C intersects ray OB at point F, and the extension line of ray OB intersects mirror M4 at point E. Since the incident ray OB is perpendicular to the reflector M4, CD = FE, and the optical path of the system can be written as 2(OE + FB + BC), that is:
l = 2 h cos α 1 + cos 2 α + 2 O E = 4 h cos   α + 2 O E
If M4 and M5 are symmetric with respect to BS, then the OPD is:
O P D = 4 h ( cos α 1 cos α 2 )
where α 1 and α 2 are the incidence angles of the ray incident on M1 and M3, respectively, and vary with the swing angle ω . The interference intensity that changes with OPD is collected on the detector. After recording the complete interference data, the spectral data can be restored through Fourier transform.

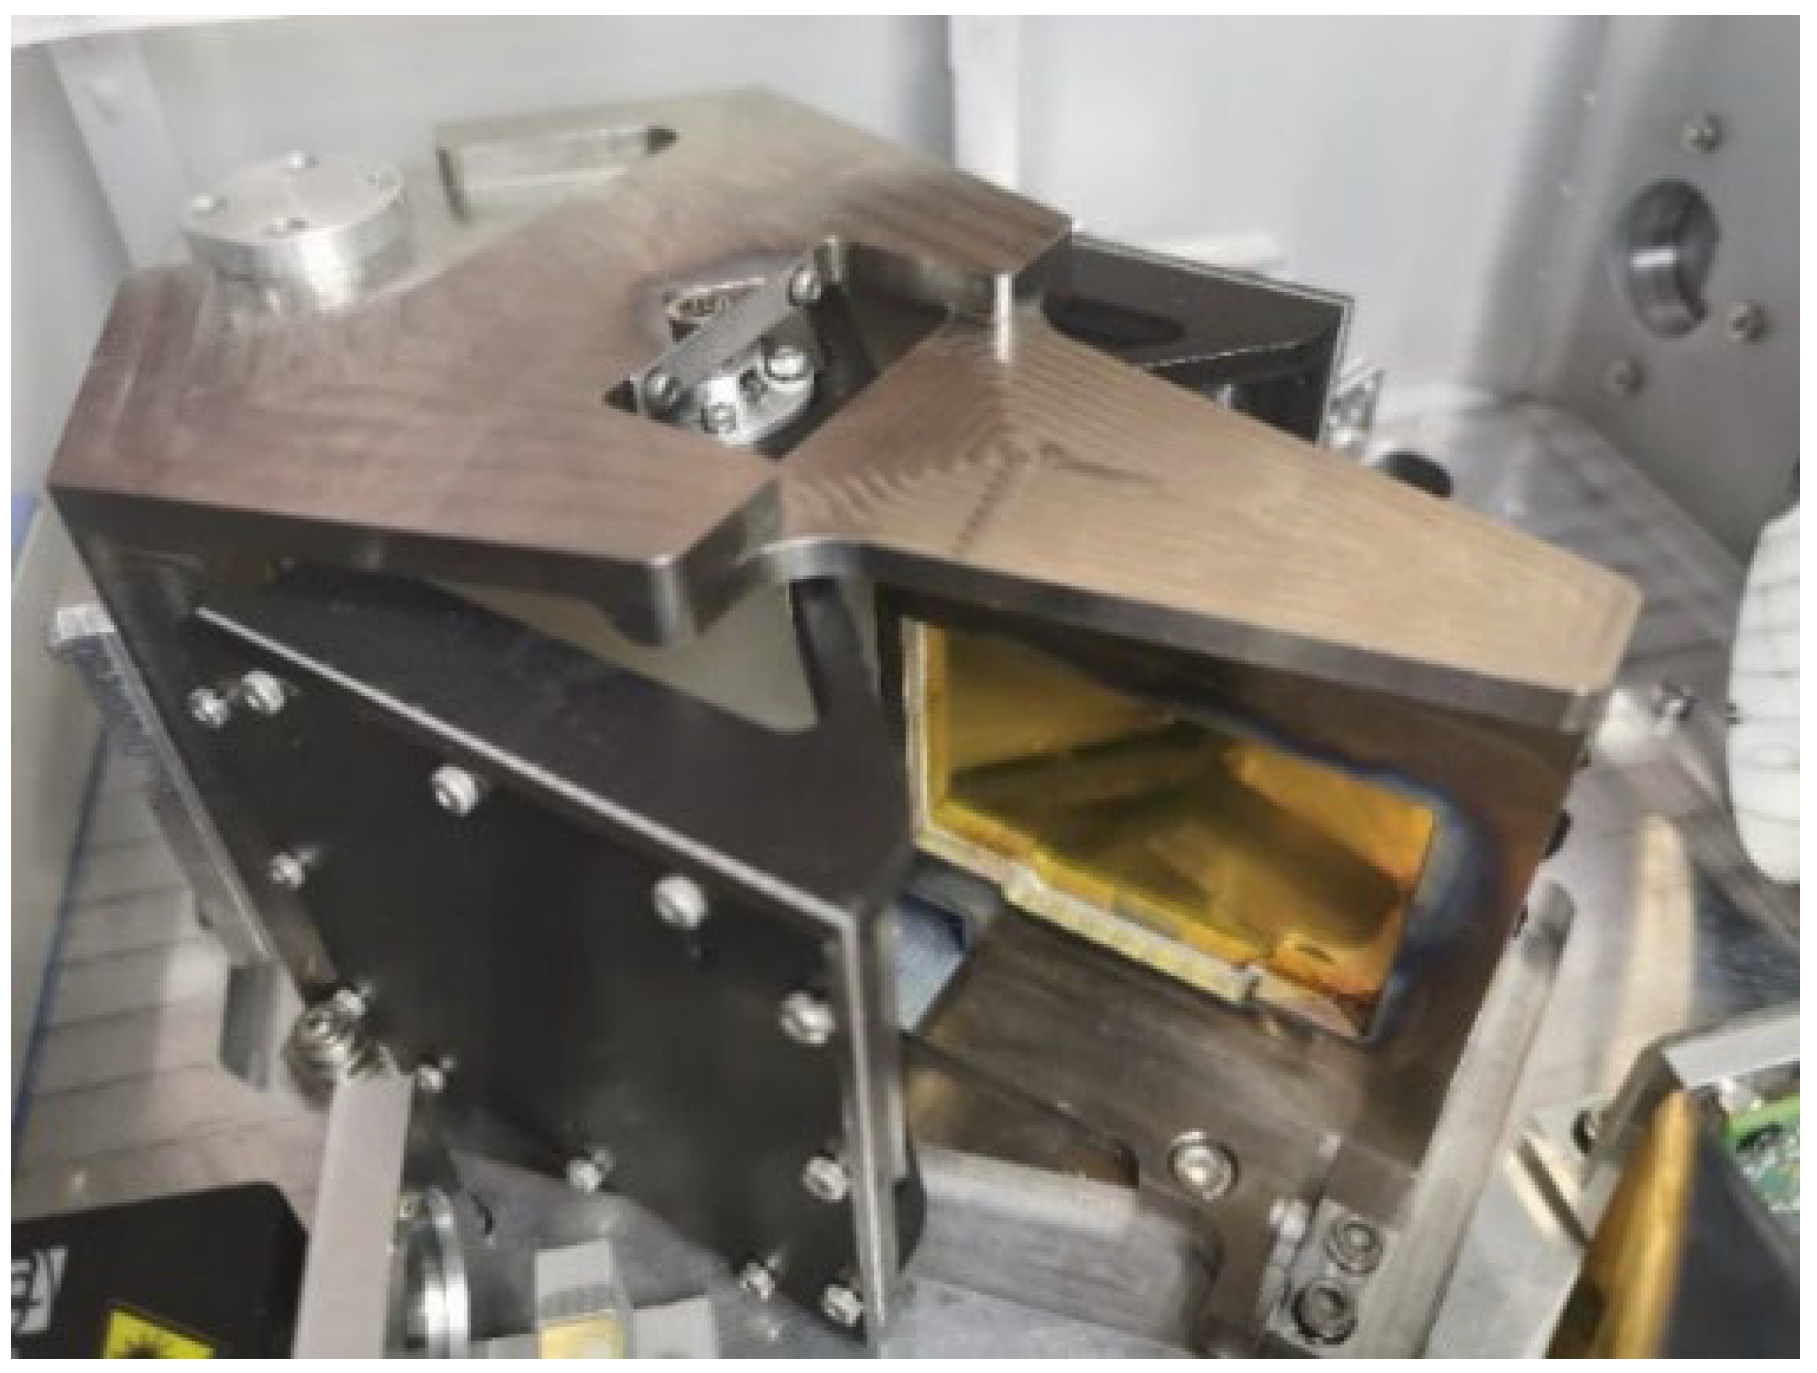
2.3.2. Physical Design

The interferometer is the core module of the FTIR spectrometer. The parallel oscillating mirror interferometer has high stability and strong environmental anti-interference ability, which can meet the requirements of remote sensing detection of chemical gases. The interferometer module is fixed with a separate titanium alloy material base to improve structural stability, and its thermal stability is better. At the same time, the design adopts a symmetrical structure to ensure the consistency of the system deformation when the ambient temperature changes and reduces the impact on the interference modulation degree. The interferometer mainly includes beam splitter components, parallel oscillating mirrors, end mirrors and voice coil motors. The beam splitter consists of a half mirror and a compensating mirror. A laser transmission window is reserved at the edge of the beam splitter. The movement of the mirror is controlled by the voice coil motor. The physical interferometer module is shown in Figure 5.

2.4. Unmanned Helicopter Airborne FTIR Remote Sensing System

The unmanned helicopter airborne FTIR remote sensing system comprises a Fourier transform infrared spectrometer, an electric control box, a data processing system with a lower computer, a GPS module, a Wi-Fi module, a visible light camera and a ground personal computer (Figure 6). The FTIR consists of a parallel oscillating mirror interferometer, a cooled infrared MCT detector and a helium-neon laser at 640 nm. Figure 6 shows the internal structure and optical path design. The housing material of the spectrometer is aluminum alloy and the bottom optical platform is designed in a cellular style to reduce the weight. The spectrometer is suspended from the internal beam of the unmanned helicopter using shock absorbers. Figure 6b,c show the effectiveness of the system vibration isolation, and it can be seen that the quality of the interference fringes collected in the unmanned helicopter after takeoff is as high as before takeoff.
The optical axes of the camera and the spectrometer are parallel to each other, which is used to observe the area pointed at by the spectrometer. The GPS measures the position of the system. The data processing system converts the interference data into spectral data and identifies the gas components. The visible light images, GPS information, restored spectrum and gas identification results are transmitted to the computer on the ground through the Wi-Fi module. Images, spectra data and identification results can be displayed on the ground computer in real time.
Table 1 shows the FTIR parameters and Table 2 shows the unmanned helicopter parameters. The total weight of the spectrometer and electric control box is 12.5 kg, and the maximum power consumption is 50 W. The detection system is powered by a 28-volt 2500 mAh lithium battery pack, enabling continuous detection for 1 h. The maximum load of the unmanned helicopter is 40 kg and the endurance time is 1.5 h when the load is 30 kg.

3. Results

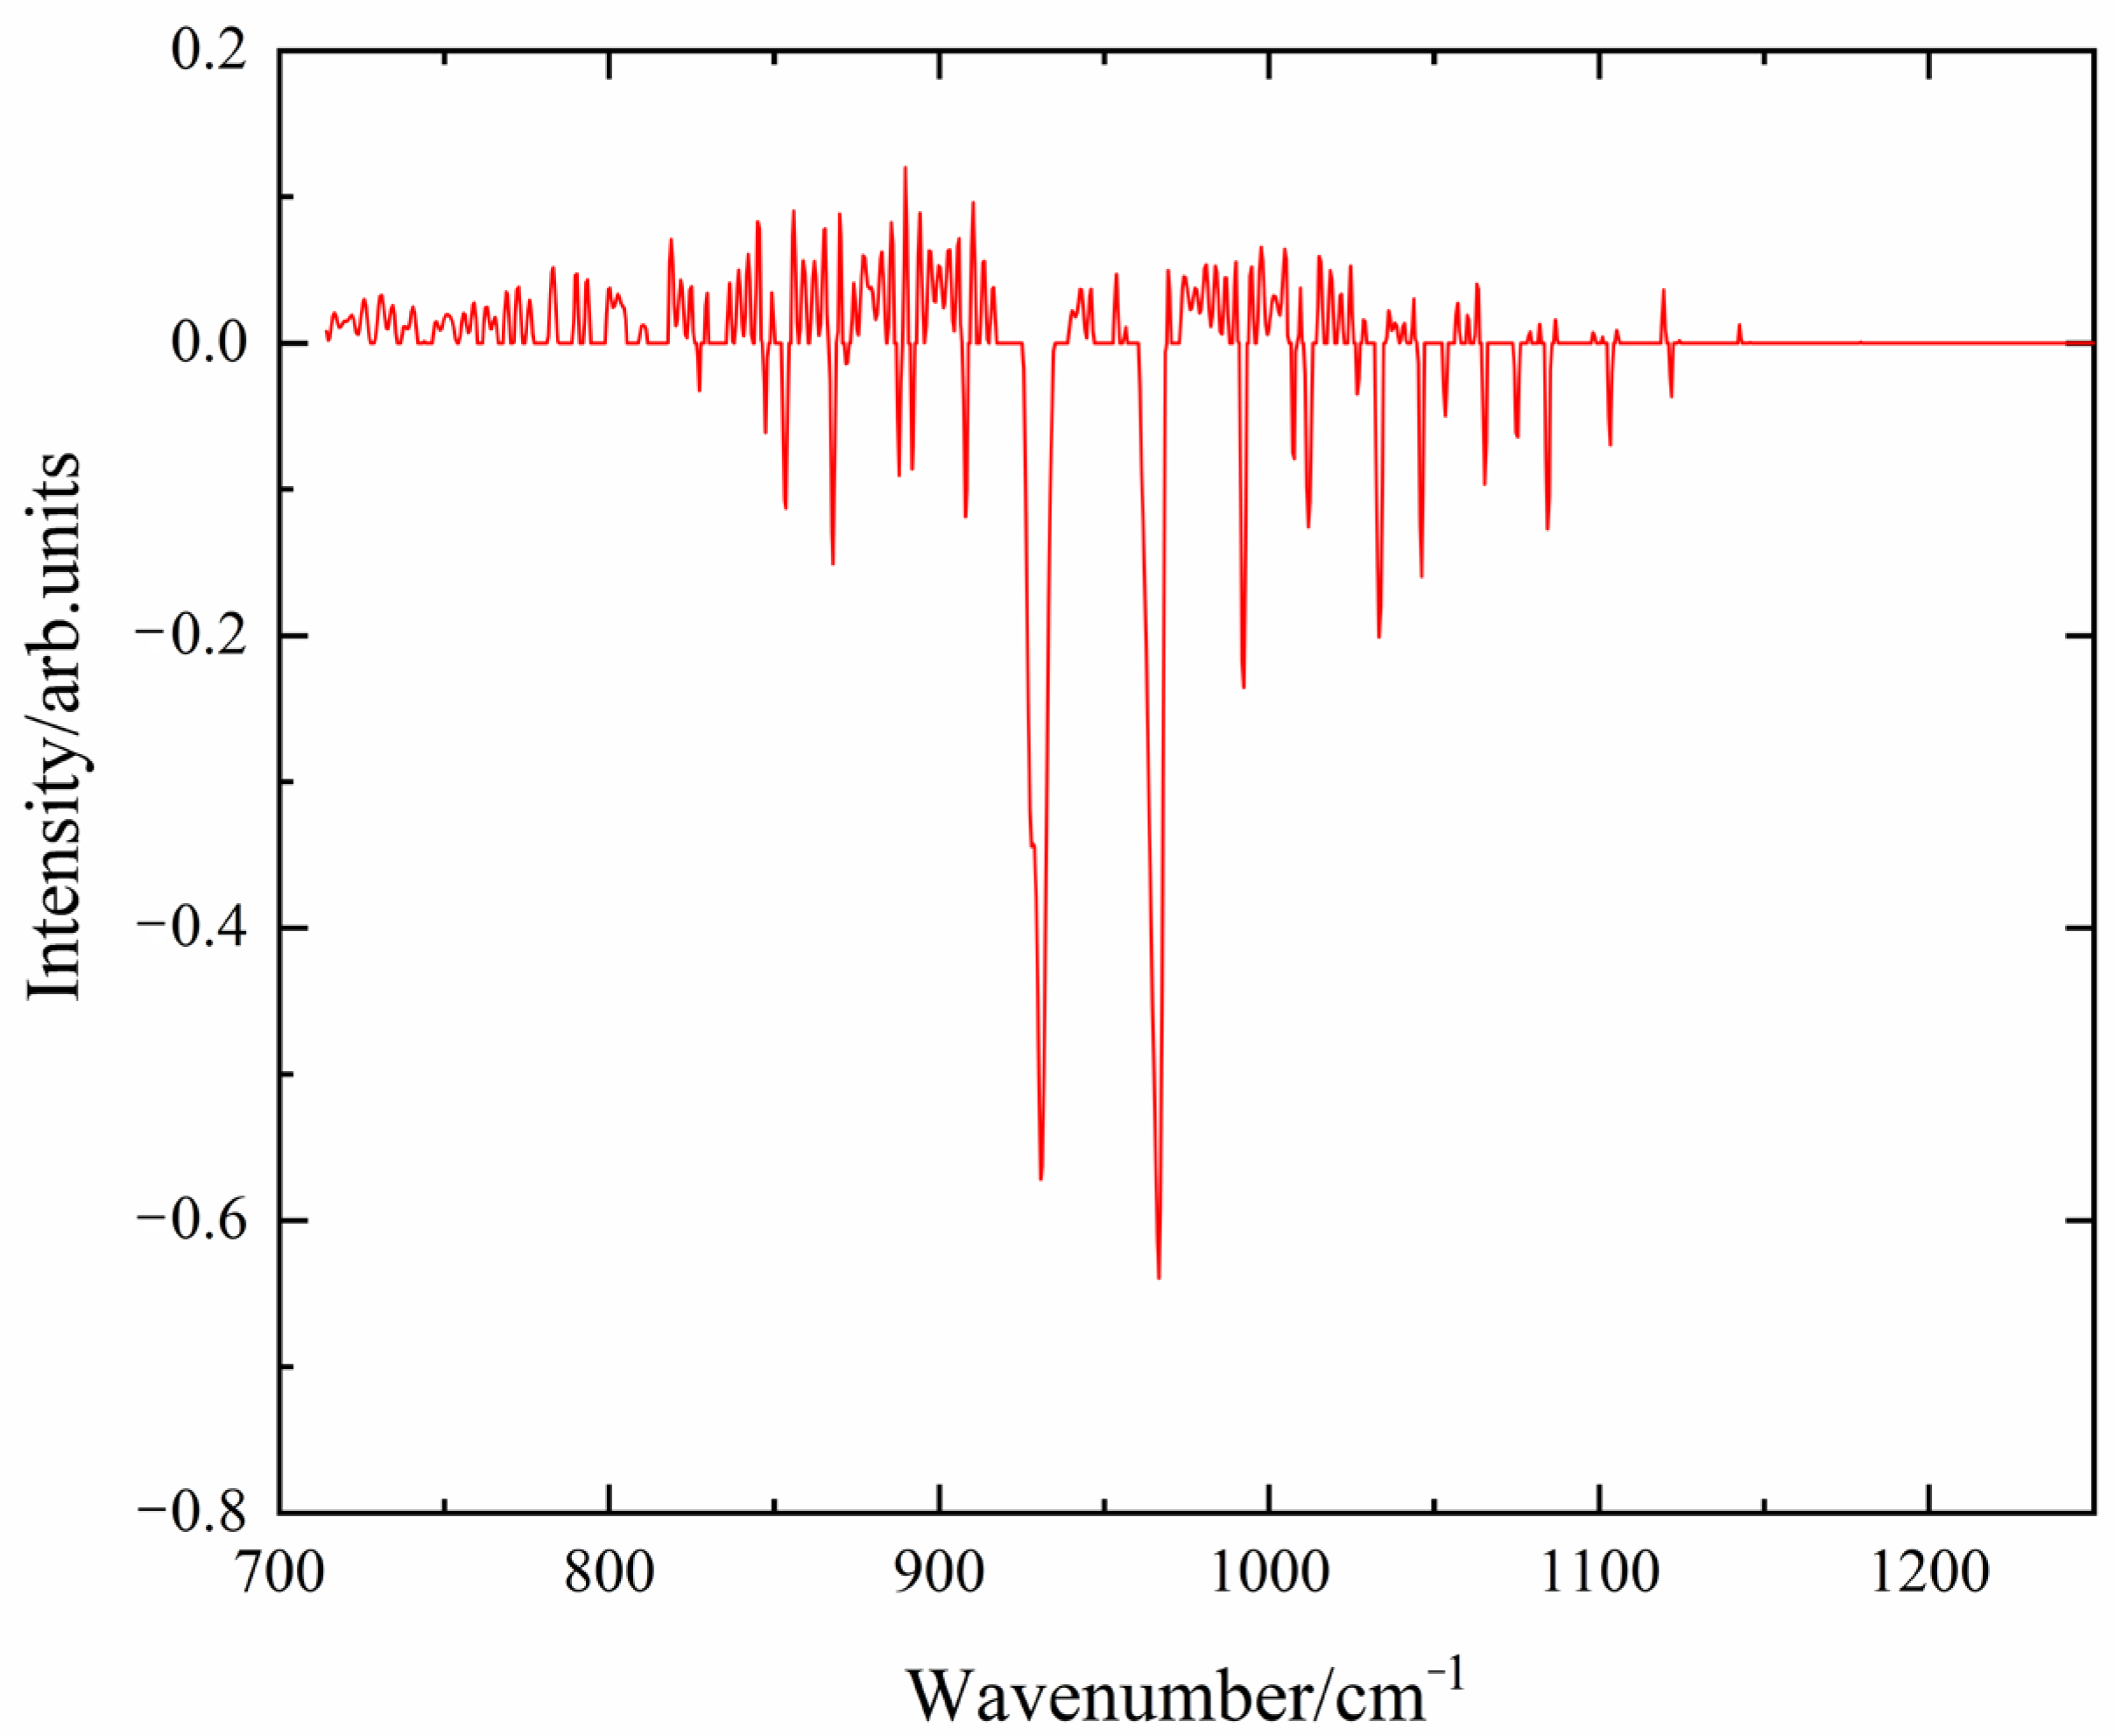
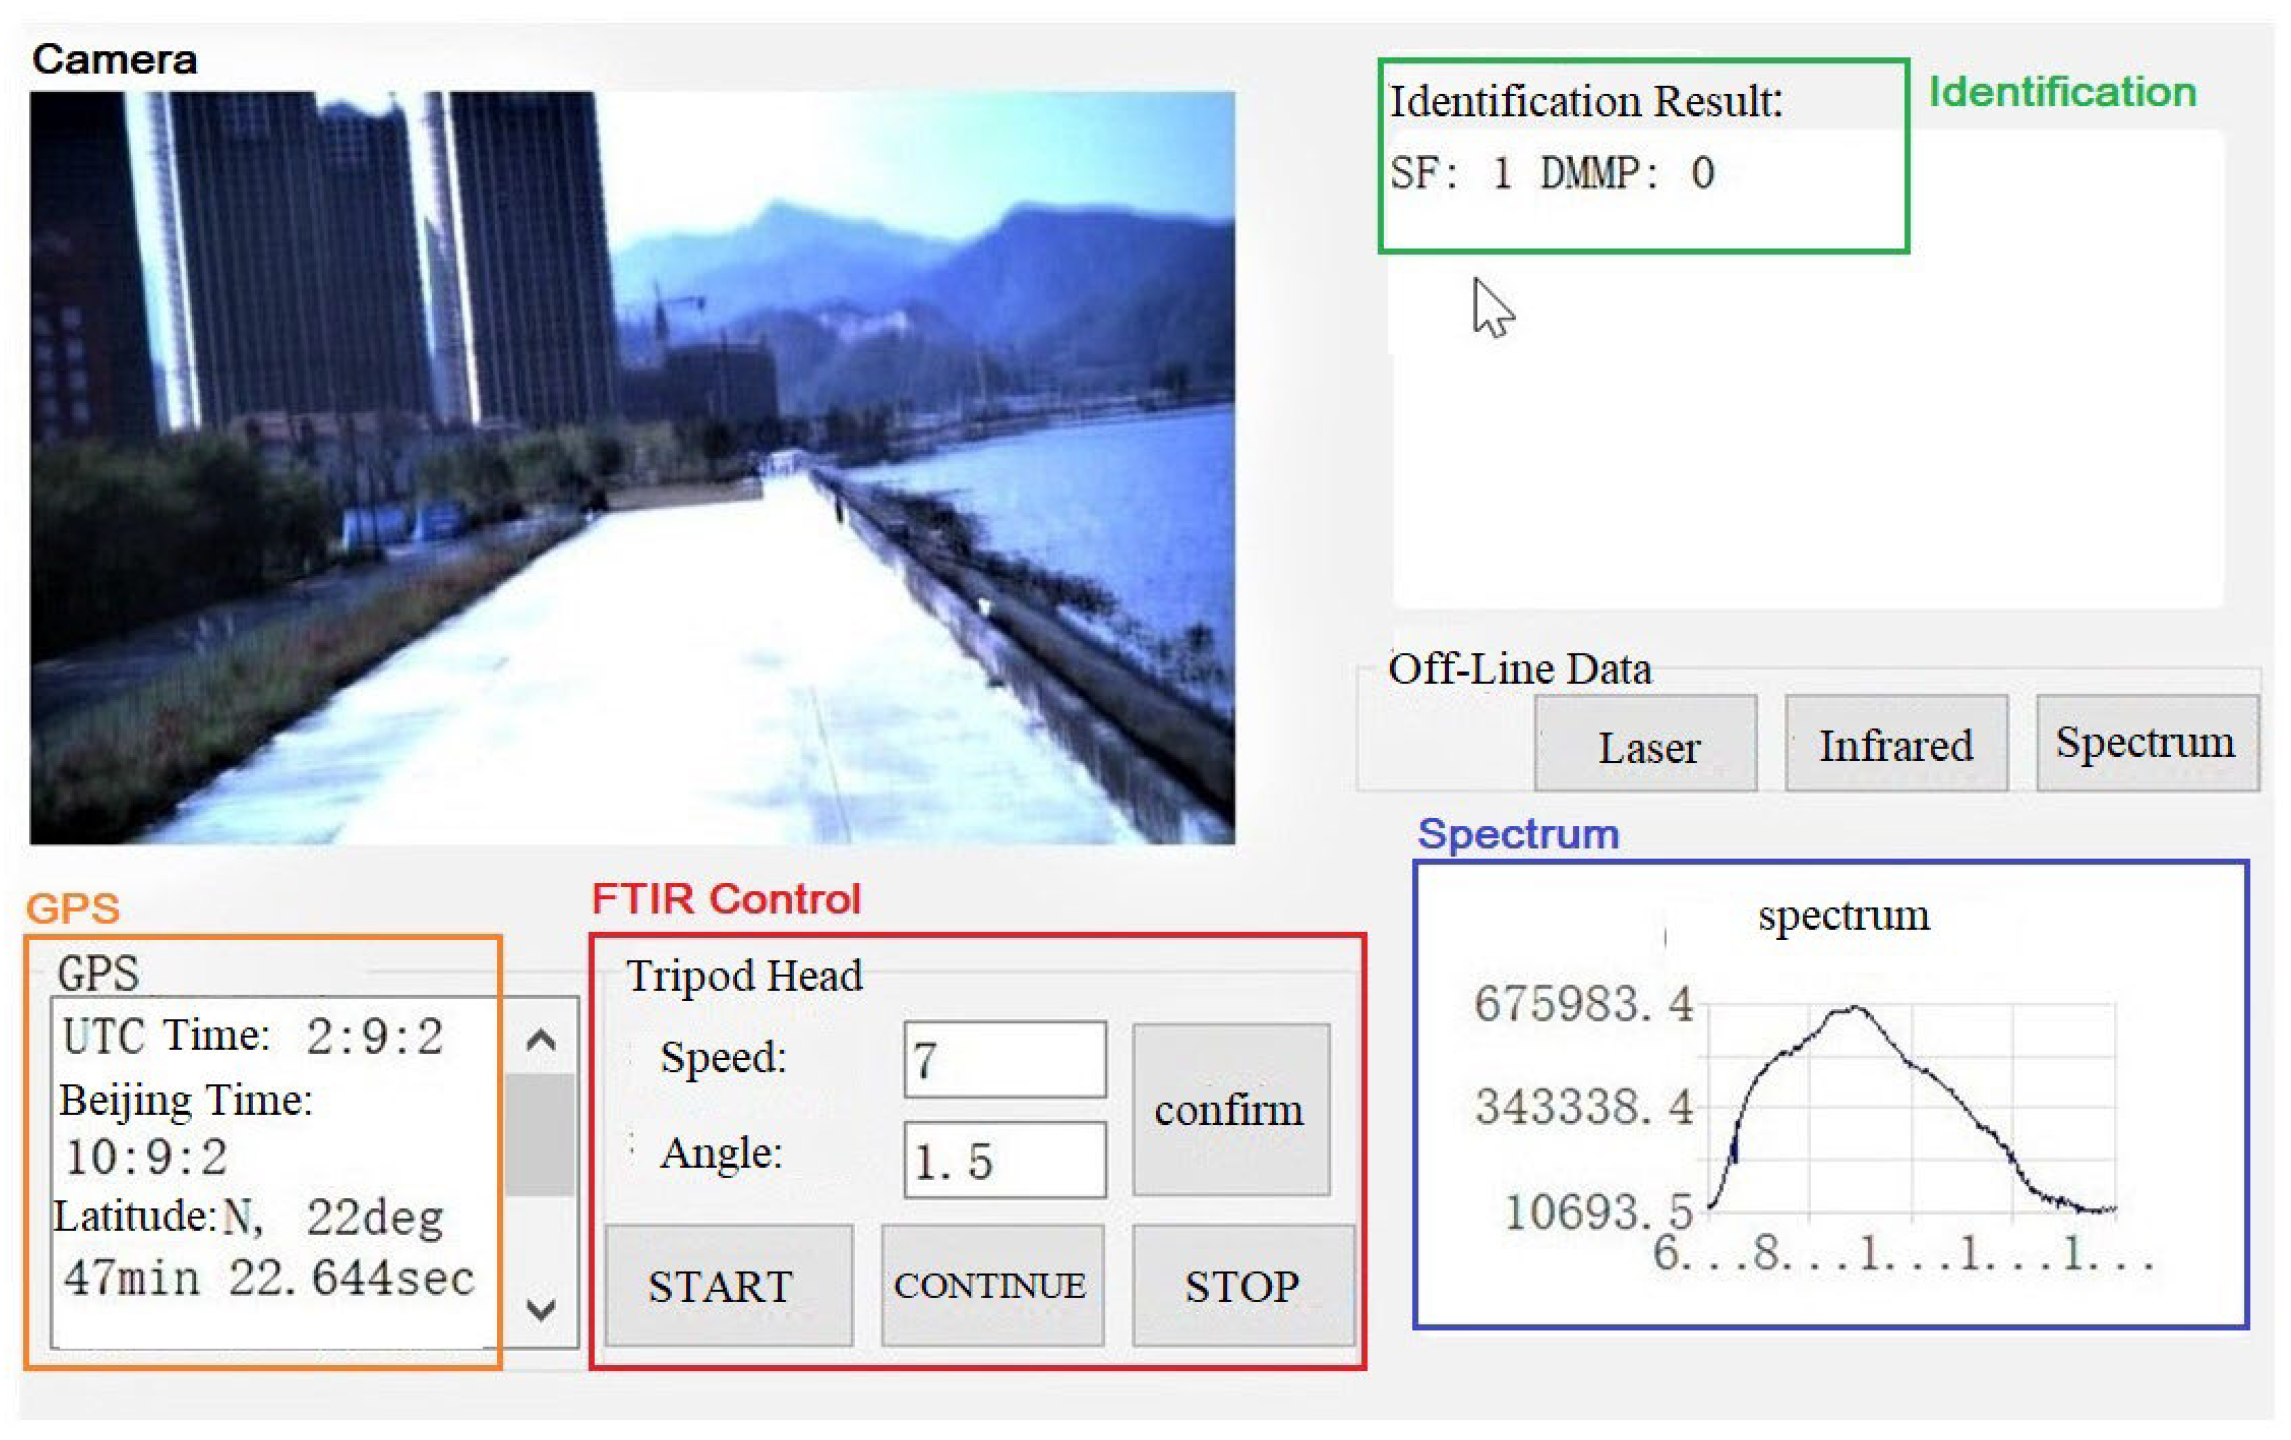
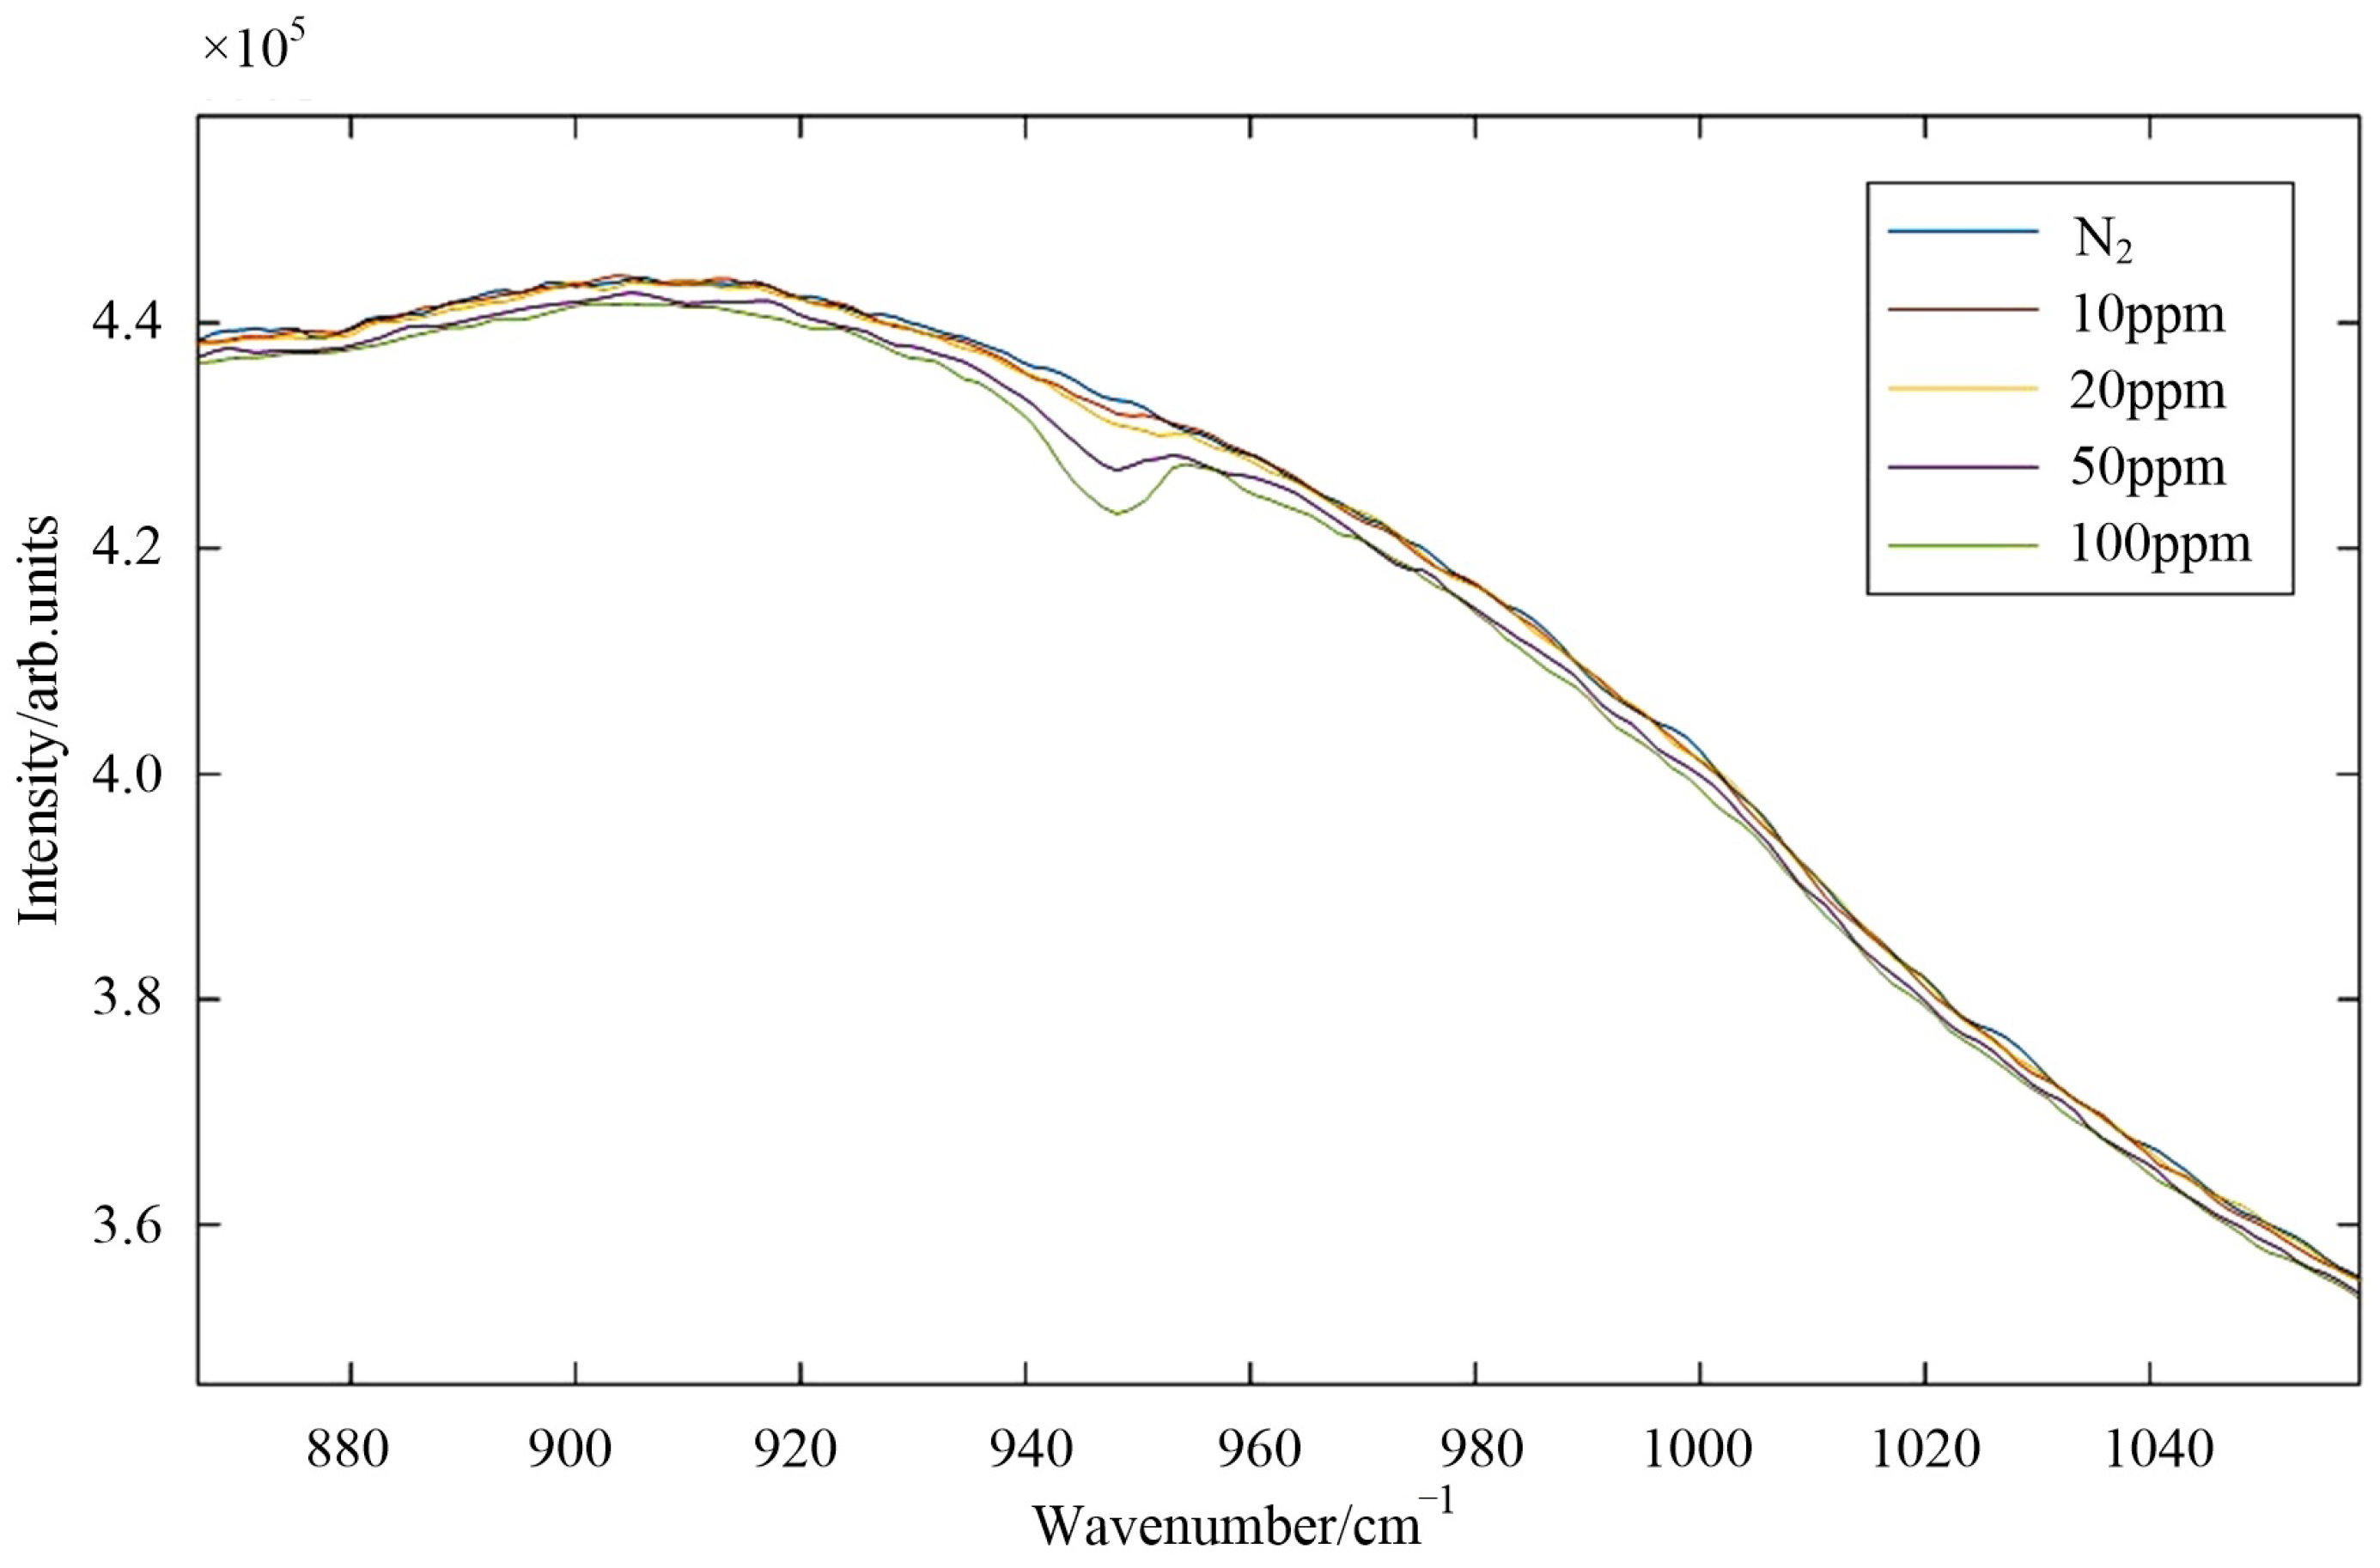
3.1. Ground Detection Experiment

In the ground detection experiment, the spectrometer was mounted on the pod of the unmanned helicopter, which was parked on the ground with only the engine turned on without turning the propeller. A container of ammonia water was placed 0.5 m away from the spectrometer, and the ammonia gas volatilized in the air was detected using the spectrometer. We used the RPCA method to extract the absorption features of the measured spectra, and the result is shown in Figure 7. The result shows that the system can detect the chemical gas and correctly extract the characteristic peak at 963 cm−1 and 930 cm−1 when the UAV engine is started.

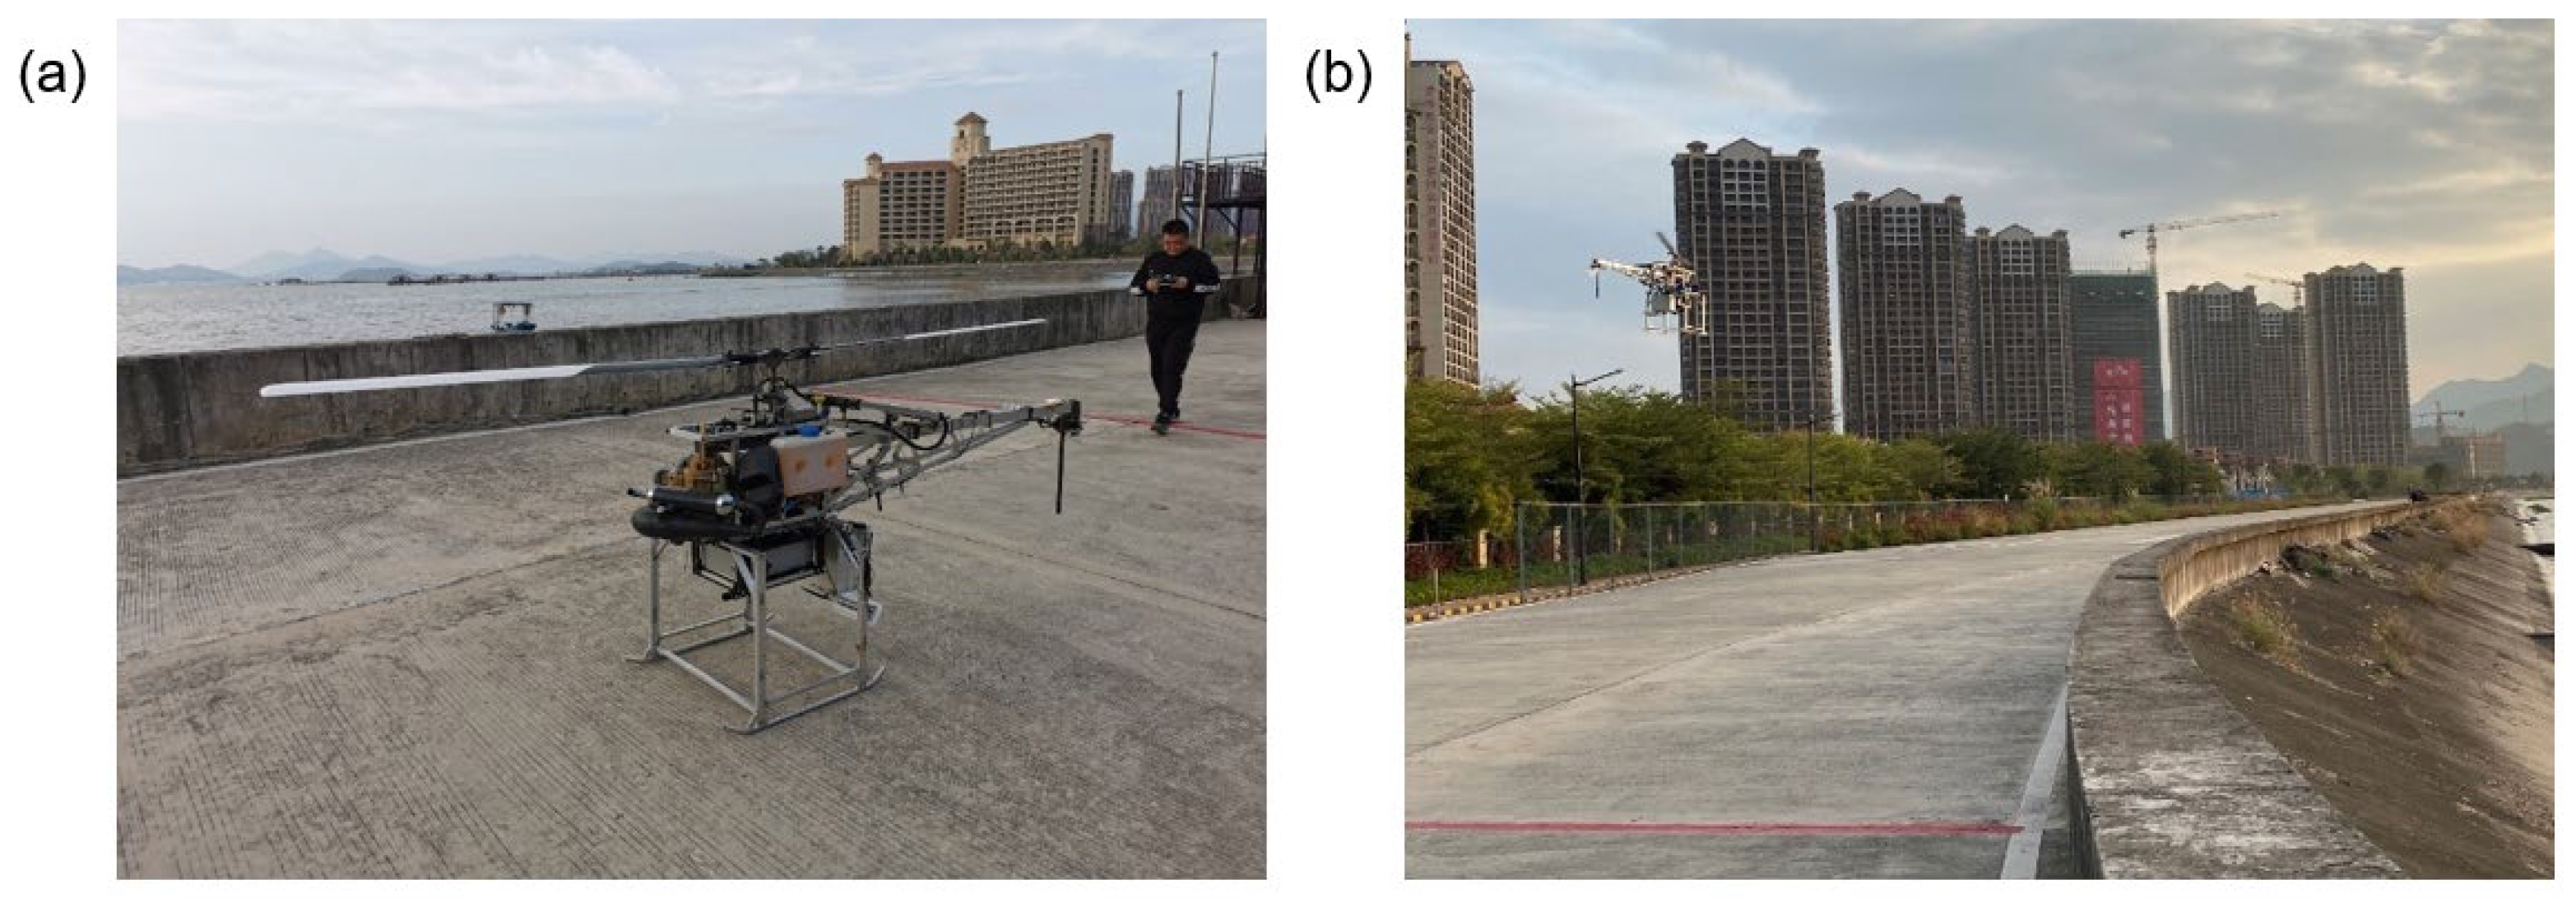
3.2. Flight Detection Experiment

The field experiment was carried out in two modes: when the unmanned helicopter was in motion and when it was hovering. In the motion mode, we controlled the unmanned helicopter to launch into the air, move back and forth within a range of 200 m at a certain speed. During the flight, we observed whether the spectrometer could work normally and checked the image and spectral data received by the ground computer. In the hover mode, the FTIR system detected and identified SF6 gas at a distance of 200 m. First, the unmanned helicopter was controlled to collect multiple background spectra around the SF6 gas release location and store them, and then the SF6 gas was released from the pressure vessel. According to the visible light camera image, the unmanned helicopter was controlled to aim at the gas release area, collect spectral data and identify the target gas composition. Figure 8a shows the picture of the system ready to fly after the ground installation of the test site and Figure 8b shows the picture of the system in the air.
In the first mode, we powered on the system, opened the instrument control software, and connected the lower computer to communicate with the ground system. We controlled the unmanned helicopter to launch into the air, and increased its speed gradually to 30 km/h. The results of the ground display system show that the unmanned helicopter airborne FTIR remote sensing system can withstand the vibration and other effects of the helicopter during flight and accurately restore the spectrum. When the flight speed reached 30 km/h, the remote data transmission module and the whole system could work normally.
In the second mode, the temperature of the experimental flight site was 22.6 °C, the crosswind speed was 5.6 m/s, and the unmanned helicopter hovered at a height of 20 m above the ground. SF6 gas was released at a distance of 200 m from the hovering point of the drone. The system continuously collected spectral data and identified gas components. The original interferogram data were stored in the memory of the lower computer, and the spectra and identification results were transmitted to the ground control terminal for real-time display. The interface of the host computer for real-time identification of SF6 gas using the FTIR system is shown in Figure 9.
The FTIR system continuously collected data, and the recovered spectral data are shown in Figure 10. The bold red line is the target spectrum of SF6 gas absorption characteristics, and the rest are multiple background spectra collected near the detection area. As can be seen in Figure 10, noise is introduced into the background spectrum because the unmanned helicopter cannot maintain an absolutely immobile state when hovering in the air. In addition, the fast wind speed in the experimental environment and the rapid change of atmospheric turbulence also made the single background spectrum difficult to be well estimated using prior knowledge.
The gas feature extraction results are shown in Figure 11, in which Figure 11a shows the differential spectrum of directly subtracting the background spectrum from the target spectrum and Figure 11b shows the RPCA method result. It can be seen that the RPCA algorithm can accurately extract the absorption characteristic peak of SF6 gas at 947 cm−1; the intensity of the absorption peak is about four times that of the noise, indicating that the signal can be distinguished from the noise. In the actual system, the SF6 gas can be identified and alarmed by setting the detection threshold.

4. Discussion

Different from the rotary-wing UAV used in previous studies, we use an unmanned helicopter as the flight platform to carry the FTIR system. The large payload capacity and long endurance of the unmanned helicopter lowers the weight and power consumption requirements of the spectrometer. The physical design of the interference module enhances its stability to adapt it to the vibration environment of the unmanned helicopter.
The field SF6 detection experiment results show that the interference fringes collected in the unmanned helicopter before and after takeoff are of the same quality, and spectra are accurately measured during the flight. Comparing the gas feature extraction results using the two methods, it can be seen that it is difficult to obtain ideal results by directly subtracting the background spectrum of the surrounding environment from the target spectrum because the pure background spectrum is difficult to measure. The difference between the pure background spectrum and the surrounding environment spectrum causes the results to be disturbed by noise. The RPCA algorithm is able to recover the low-rank background data from arbitrarily large magnitude and sparsely noisy observations and is robust despite noise. The gas feature extraction algorithm based on RPCA shows better results, in which the absorption characteristics are more obvious and there is less noise interference. However, the RPCA method requires the measurement of multiple background spectra, which is difficult for some burst leakage gas measurements. In practical gas leak monitoring applications, we consider establishing a background spectrum library for multiple time periods or collecting multiple spectra around the detection area to solve this problem. If the unmanned helicopter payload is large enough, designing a blackbody calibration light path inside the spectrometer can provide a richer selection of gas absorption feature extraction algorithms.
The sensitivity of the system is limited by the atmospheric changes in the sensing path and the noise introduced by the system itself. Due to the high wind speed in the experimental environment, the concentration of SF6 gas cannot be accurately measured. With our current equipment, it is difficult to quantify the interference of atmospheric changes on the detection sensitivity of the system. To measure the detection sensitivity limit of the system itself, spectra of SF6 and nitrogen gas mixtures with different standard concentrations in the gas pool were collected in the laboratory. A standard blackbody with a difference of 5 K from the environment temperature was used as the background. The measured spectra of pure nitrogen and 10 ppm, 20 ppm, 50 ppm and 100 ppm concentration SF6 gas are shown in Figure 12.
The spectra in Figure 12 show a relatively good response of the FTIR system to SF6 gas at concentrations above 50 ppm in the laboratory environment. The results can be used as a reference for the detection performance of the system in the field environment. We plan to carry out more experiments to further study the detection ability of the FTIR system under different atmospheric environment conditions in the future.

5. Conclusions

In order to explore the possibility of UAV platform applied to gas remote sensing, we proposed an FTIR remote sensing system integrated with an unmanned helicopter which uses a dual-channel parallel oscillating mirror interferometer as the core module. The RPCA method is proposed to separate the background spectrum and gas absorption features to improve the robustness of detection under noise interference. The research and experiment of the FTIR chemical gas remote sensing system carried by an unmanned helicopter is of great significance for the application of FTIRs in the fields of toxic and harmful gas early warning and environmental monitoring. Due to the limitations of the maximum load weight of the selected unmanned helicopter, the system composition does not include the tripod head and the blackbody. In future research, we will consider using a UAV with a larger load to achieve multi-angle accurate detection.

Author Contributions

Conceptualization, Z.S. and M.H.; methodology, Z.S. and M.H.; software, Z.S.; validation, Z.S., W.H. and X.L.; formal analysis, G.Z.; investigation, W.H.; resources, L.Q.; data curation, W.H.; writing—original draft preparation, Z.S.; writing—review and editing, Z.S. and G.Z.; visualization, Z.S.; supervision, M.H. and L.Q.; project administration, M.H.; funding acquisition, L.Q. All authors have read and agreed to the published version of the manuscript.

Funding

This research was supported by the Youth Innovation Promotion Association CAS.

Institutional Review Board Statement

Not applicable.

Informed Consent Statement

Not applicable.

Data Availability Statement

The data presented in this study are available on request from the corresponding author. The data are not publicly available due to privacy restrictions.

Acknowledgments

The authors acknowledge Qisheng Cai and Jingsen Hu for cooperation in this research. The authors would like to thank anonymous reviewers for their insightful comments and constructive suggestions.

Conflicts of Interest

The authors declare no conflicts of interest.

References

  1. Beil, A.; Daum, R.; Harig, R.; Matz, G. Remote sensing of atmospheric pollution by passive FTIR spectrometry. In Proceedings of the Spectroscopic Atmospheric Environmental Monitoring Techniques, Barcelona, Spain, 15 December 1998; SPIE: Bellingham, WA, USA, 1998; pp. 32–43. [Google Scholar]
  2. Flanigan, D.F. Prediction of the limits of detection of hazardous vapors by passive infrared with the use of MODTRAN. Appl. Opt. 1996, 35, 6090–6098. [Google Scholar] [CrossRef] [PubMed]
  3. Harig, R.; Matz, G. Toxic cloud imaging by infrared spectrometry: A scanning FTIR system for identification and visualization. Field Anal. Chem. Technol. 2001, 5, 75–90. [Google Scholar] [CrossRef]
  4. Lee, J.H.; Yu, H.G.; Park, D.J.; Park, B.H.; Kim, J.H. Characterization of hazardous gases using an infrared hyperspectral imaging system. Instrum. Sci. Technol. 2015, 43, 469–484. [Google Scholar] [CrossRef]
  5. Kim, Y.C.; Yu, H.G.; Lee, J.H.; Park, D.J.; Nam, H.W. Hazardous gas detection for FTIR-based hyperspectral imaging system using DNN and CNN. In Proceedings of the Electro-Optical and Infrared Systems: Technology and Applications XIV, Warsaw, Poland, 13–14 September 2017; SPIE: Bellingham, WA, USA; pp. 341–349. [Google Scholar]
  6. Yu, H.G.; Lee, J.H.; Kim, Y.C.; Park, D.J. Intelligent detection algorithm of hazardous gases for FTIR-based hyperspectral imaging system using SVM classifier. In Proceedings of the Algorithms and Technologies for Multispectral, Hyperspectral, and Ultraspectral Imagery XXIII, Anaheim, CA, USA, 11–13 April 2017; SPIE: Bellingham, WA, USA; pp. 75–83. [Google Scholar]
  7. Li, D.; Cui, F.; Wang, A.; Li, Y.; Wu, J.; Qiao, Y. Adaptive Detection Algorithm for Hazardous Clouds Based on Infrared Remote Sensing Spectroscopy and the LASSO Method. IEEE Trans. Geosci. Remote Sens. 2020, 58, 8649–8664. [Google Scholar] [CrossRef]
  8. Schafer, K.; Jahn, C.; Utzig, S.; Flores-Jardines, E.; Harig, R.; Rusch, P. Remote measurement of the plume shape of aircraft exhausts at airports by passive FTIR spectrometry. In Proceedings of the Remote Sensing of Clouds and the Atmosphere IX, Maspalomas, Spain, 13–15 September 2004; SPIE: Bellingham, WA, USA, 2004; pp. 334–344. [Google Scholar]
  9. Flores-Jardines, E.; Schäfer, K.; Harig, R.; Rusch, P.; Grutter, M. Investigation of temperature and gas concentration distributions in hot exhausts (airplanes and burners) by scanning imaging FTIR spectrometry. In Proceedings of the Remote Sensing of Clouds and the Atmosphere, X, Bruges, Belgium, 29 October 2005; SPIE: Bellingham, WA, USA; pp. 365–376. [Google Scholar]
  10. Paulec, M.; Marciniak, M.; Gross, K.; Akers, B.; Azevedo, D. Tomographic reconstruction of a jet engine exhaust plume using an infrared hyperspectral imager. Opt. Eng. 2018, 57, 103103. [Google Scholar] [CrossRef]
  11. Harig, R. Passive remote sensing of pollutant clouds by Fourier-transform infrared spectrometry: Signal-to-noise ratio as a function of spectral resolution. Appl. Opt. 2004, 43, 4603–4610. [Google Scholar] [CrossRef] [PubMed]
  12. Harig, R.; Matz, G.; Rusch, P. Scanning infrared remote sensing system for identification, visualization, and quantification of airborne pollutants. In Proceedings of the Instrumentation for Air Pollution and Global Atmospheric Monitoring, Boston, MA, USA, 7 February 2001; SPIE: Bellingham, WA, USA, 2001; pp. 83–94. [Google Scholar]
  13. Thériault, J.M.; Puckrin, E.; Bouffard, F.; Déry, B. Passive remote monitoring of chemical vapors by differential Fourier-transform infrared radiometry: Results at a range of 1.5 km. Appl. Opt. 2004, 43, 1425–1434. [Google Scholar] [CrossRef] [PubMed]
  14. Hu, Y.; Xu, L.; Shen, X.; Jin, L.; Xu, H.; Deng, Y.; Liu, J.; Liu, W. Reconstruction of a leaking gas cloud from a passive FTIR scanning remote-sensing imaging system. Appl. Opt. 2021, 60, 9396–9403. [Google Scholar] [CrossRef] [PubMed]
  15. Hu, Y.; Xu, L.; Shen, X.; Jin, L.; Xu, H.; Deng, Y.; Liu, J.; Liu, W. Three-dimensional reconstruction of a leaking gas cloud based on two scanning FTIR remote-sensing imaging systems. Opt. Express 2022, 30, 25581–25596. [Google Scholar] [CrossRef] [PubMed]
  16. Hammer, S.; Griffith DW, T.; Konrad, G.; Vardag, S.; Caldow, C.; Levin, I. Assessment of a multi-species in situ FTIR for precise atmospheric greenhouse gas observations. Atmos. Meas. Tech. 2013, 6, 1153–1170. [Google Scholar] [CrossRef]
  17. Griffith, D.W.; Pöhler, D.; Schmitt, S.; Hammer, S.; Vardag, S.N.; Platt, U. Long open-path measurements of greenhouse gases in air using near-infrared Fourier transform spectroscopy. Atmos. Meas. Tech. 2018, 11, 1549–1563. [Google Scholar] [CrossRef]
  18. Byrne, B.; Strong, K.; Colebatch, O.; You, Y.; Wunch, D.; Ars, S.; Jones, D.B.A.; Fogal, P.; Mittermeier, R.L.; Worthy, D.; et al. Monitoring urban greenhouse gases using open-path Fourier transform spectroscopy. Atmos.-Ocean 2020, 58, 25–45. [Google Scholar] [CrossRef]
  19. Rutkauskas, M.; Asenov, M.; Ramamoorthy, S.; Reid, D.T. Autonomous multi-species environmental gas sensing using drone-based Fourier-transform infrared spectroscopy. Opt. Express 2019, 27, 9578–9587. [Google Scholar] [CrossRef] [PubMed]
  20. Sharma, R.; Arya, R. UAV based long range environment monitoring system with Industry 5.0 perspectives for smart city infrastructure. Comput. Ind. Eng. 2022, 168, 108066. [Google Scholar] [CrossRef]
  21. Golston, L.M.; Aubut, N.F.; Frish, M.B.; Yang, S.; Talbot, R.W.; Gretencord, C.; Spiritt, M.J.; Zondlo, M.A. Natural gas fugitive leak detection using an unmanned aerial vehicle: Measurement system description and mass balance approach. Atmosphere 2018, 9, 383. [Google Scholar] [CrossRef]
  22. Gu, Q.R.; Michanowicz, D.; Jia, C. Developing a modular unmanned aerial vehicle (UAV) platform for air pollution profiling. Sensors 2018, 18, 4363. [Google Scholar] [CrossRef] [PubMed]
  23. Goody, R.M.; Yung, Y.L. Atmospheric Radiation: Theoretical Basis; Oxford University Press: Oxford, UK, 1995. [Google Scholar]
  24. Candès, E.J.; Li, X.; Ma, Y.; Wright, J. Robust principal component analysis? J. ACM 2011, 58, 1–37. [Google Scholar] [CrossRef]
Figure 1. Multilayer atmosphere radiative transfer model.
Applsci 14 01367 g001
Figure 2. Three-layer simplified atmosphere radiative transfer model.
Applsci 14 01367 g002
Figure 3. Schematic of structure and optical path of parallel oscillating mirror interferometer module. The green line indicates the transmitted light and the red line indicates the reflected light.
Applsci 14 01367 g003
Figure 4. Schematic of the optical path difference.
Applsci 14 01367 g004
Figure 5. Image of parallel oscillating mirror interferometer module.
Applsci 14 01367 g005
Figure 6. Schematic of unmanned helicopter airborne FTIR system and laser interference fringes. (a) The unmanned helicopter airborne FTIR remote sensing system composition: Fourier transform infrared spectrometer, an electric control box, a data processing system with a lower computer, a GPS module, a Wi-Fi module, a visible light camera and a ground personal computer. (b) laser interference fringes before takeoff (blue). (c) laser interference fringes in flight (red).
Applsci 14 01367 g006
Figure 7. Ammonia gas feature extraction result based on RPCA (red).
Applsci 14 01367 g007
Figure 8. SF6 remote detection experiment carried out by unmanned helicopter airborne FTIR system. (a) Unmanned helicopter airborne FTIR system in standby mode on the ground; (b) unmanned helicopter airborne FTIR system in the air.
Applsci 14 01367 g008
Figure 9. SF6 gas identification host computer software interface.
Applsci 14 01367 g009
Figure 10. Background spectrum and characteristic spectrum of SF6 gas. The bold red line is the spectrum of SF6 gas and the rest are multiple background spectra.
Applsci 14 01367 g010
Figure 11. SF6 gas feature extraction results. (a) The background spectrum is directly subtracted from the target spectrum. (b) The low-rank background is estimated and separated based on RPCA algorithm.
Applsci 14 01367 g011
Figure 12. Spectra of pure nitrogen and SF6 gas with 10 ppm, 20 ppm, 50 ppm and 100 ppm standard concentrations using a blackbody with a difference of 5 K from the environment temperature as the background.
Applsci 14 01367 g012
Table 1. Parameters of FTIR.
ParameterSpecification
Spectral resolution/cm−14
Spectral range/μm8–14
Field of view/mrad30
Scan rate/(scan/s)8
DetectorStirling MCT
Table 2. Parameters of unmanned helicopter.
ParameterSpecification
Product modelHuaYi UH1C100B, (HuaYi Shenzhen, China)
Max speed/(km/h)800
Payload/kg40
Duration of Flight/h1.5@30 kg
Disclaimer/Publisher’s Note: The statements, opinions and data contained in all publications are solely those of the individual author(s) and contributor(s) and not of MDPI and/or the editor(s). MDPI and/or the editor(s) disclaim responsibility for any injury to people or property resulting from any ideas, methods, instructions or products referred to in the content.

