Article

Physical Modeling and Intelligent Prediction for Instability of High Backfill Slope Moisturized under the Influence of Rainfall Disasters

1
Department of Geotechnical Engineering, College of Civil Engineering, Tongji University, Shanghai 200092, China
2
Key Laboratory of Geotechnical and Underground Engineering, Ministry of Education, Tongji University, Shanghai 200092, China
3
Shanghai CAAC New Era Airport Design & Research Institute Co., Ltd., Shanghai 200335, China
*
Author to whom correspondence should be addressed.
Appl. Sci. 2023, 13(7), 4218; https://doi.org/10.3390/app13074218
Submission received: 2 March 2023 / Revised: 21 March 2023 / Accepted: 24 March 2023 / Published: 27 March 2023
(This article belongs to the Special Issue Advanced Research on Tunnel Slope Stability and Land Subsidence)

Abstract

:
The stability of high backfill slopes emerges in practice due to the expansion of transportation infrastructures. The seepage and infiltration of rainfall into the backfills brings challenges to engineers in predicting the stability of the slope, weakening the shear strength and modulus of the soil. This study carried out a series of model tests under a plane strain condition to investigate the stability of a high backfill slope moisturized by rainfalls, considering the influences of rainfall duration and intensity. The slope displacements were monitored by a laser displacement sensor and the moisture content in the backfill mass were obtained by a soil moisture sensor. The test results show that increasing the rainfall intensity and duration caused the slope near the surface to be saturated, resulting in significant influences on the lateral displacement of the slope and the reduction of stability as well as the sizes of the sliding mass. Based on the model tests, the numerical analysis was adopted to extend the analysis cases, and the backpropagation (BP) neural network model was further adopted to build a model for predicting the stability of a high backfill slope under rainfall. The trained BP model shows the average relative error of 1.02% and the goodness of fitness of 0.999, indicating a good prediction effect.

1. Introduction

It is widely reported that high backfill slopes are damaged by rainfall and they significantly endanger people’s lives and property [1,2,3,4]. With the rapid growth of the economy and fast urbanization process of China in the past decades, the demand for the expansion and/or renewal of transportation infrastructures (e.g., highways, railways, and airports) has increasingly grown. To shorten the commuting distance, some transportation infrastructures have to be constructed in mountainous areas; as a result, a large number of high slopes due to excavation and backfill construction emerge. This gives rise to some critical geotechnical problems, e.g., excessive total and differential settlement, and slope failure. Meanwhile, rainfall is abundant in some regions; for example, it is commonly over 1500 mm a year in the east coast area of China. The seepage and infiltration of rainfall into the soil make the performance of high backfill slopes more complex. Under the influence of rainfall, the mechanical properties of the slope mass tend to be weak, such as the shear strength, matric suction, and modulus, which brings further challenges to engineers in predicting the stability of the slope [5,6,7,8,9,10].
Previous studies found that rainfall significantly affects the performance of the slope [11,12,13,14]. Wu et al. [15] conducted model tests to quantify the loess soil slopes undergoing failure due to rainfall, which may cause multi-sliding retrogressive landslides. Li et al. [16] carried out a hazard assessment of rainfall-induced debris landslides, and pointed out that the rainfall duration corresponding to the initiation of the debris landslide was exponentially related to the rainfall intensity. Meanwhile, some theoretical analyses, such as the limit equilibrium analysis and numerical simulation, were conducted to investigate the fracture evolution characteristics and failure mode of the slope [17,18,19,20]. Liu et al. [21] investigated the progressive development of rainfall-induced landslides using the random finite element and material point methods with hydro-mechanical coupling.
In addition, machine learning techniques, such as neural networks, data mining techniques, BP algorithms, etc., have been increasingly adopted to assess the stability of slopes [22,23,24,25,26,27]. Based on neural networks, Du et al. [28], Liu et al. [29], and Cao et al. [30] proposed a displacement prediction and early warning system for landslides. Chen et al. [31] and Leonarduzzi et al. [32] applied data mining techniques to plot landslide susceptibility mapping so that more landslide-related parameters were considered, including the slope angle, slope aspect, plan curvature, rainfall threshold, etc. Panda et al. [33] proposed a new BP algorithm for achieving a better prediction of the slope. However, machine learning has seldom been adopted for assessing high backfill slopes in practice.
This study is aimed at investigating the stability of high backfill slopes moisturized by rainfall. A series of model tests were carried out under a plane strain condition considering the influences of rainfall duration and intensity. The slope displacements and moisture content in the backfill mass were monitored during the test. Based on the model tests, a numerical analysis was adopted to extend the analysis cases, and a machine learning method was used to develop a prediction method for the stability of high backfill slopes considering the effects of rainfall duration and intensity.

2. Model Test Preparation and Program

2.1. Test Setup

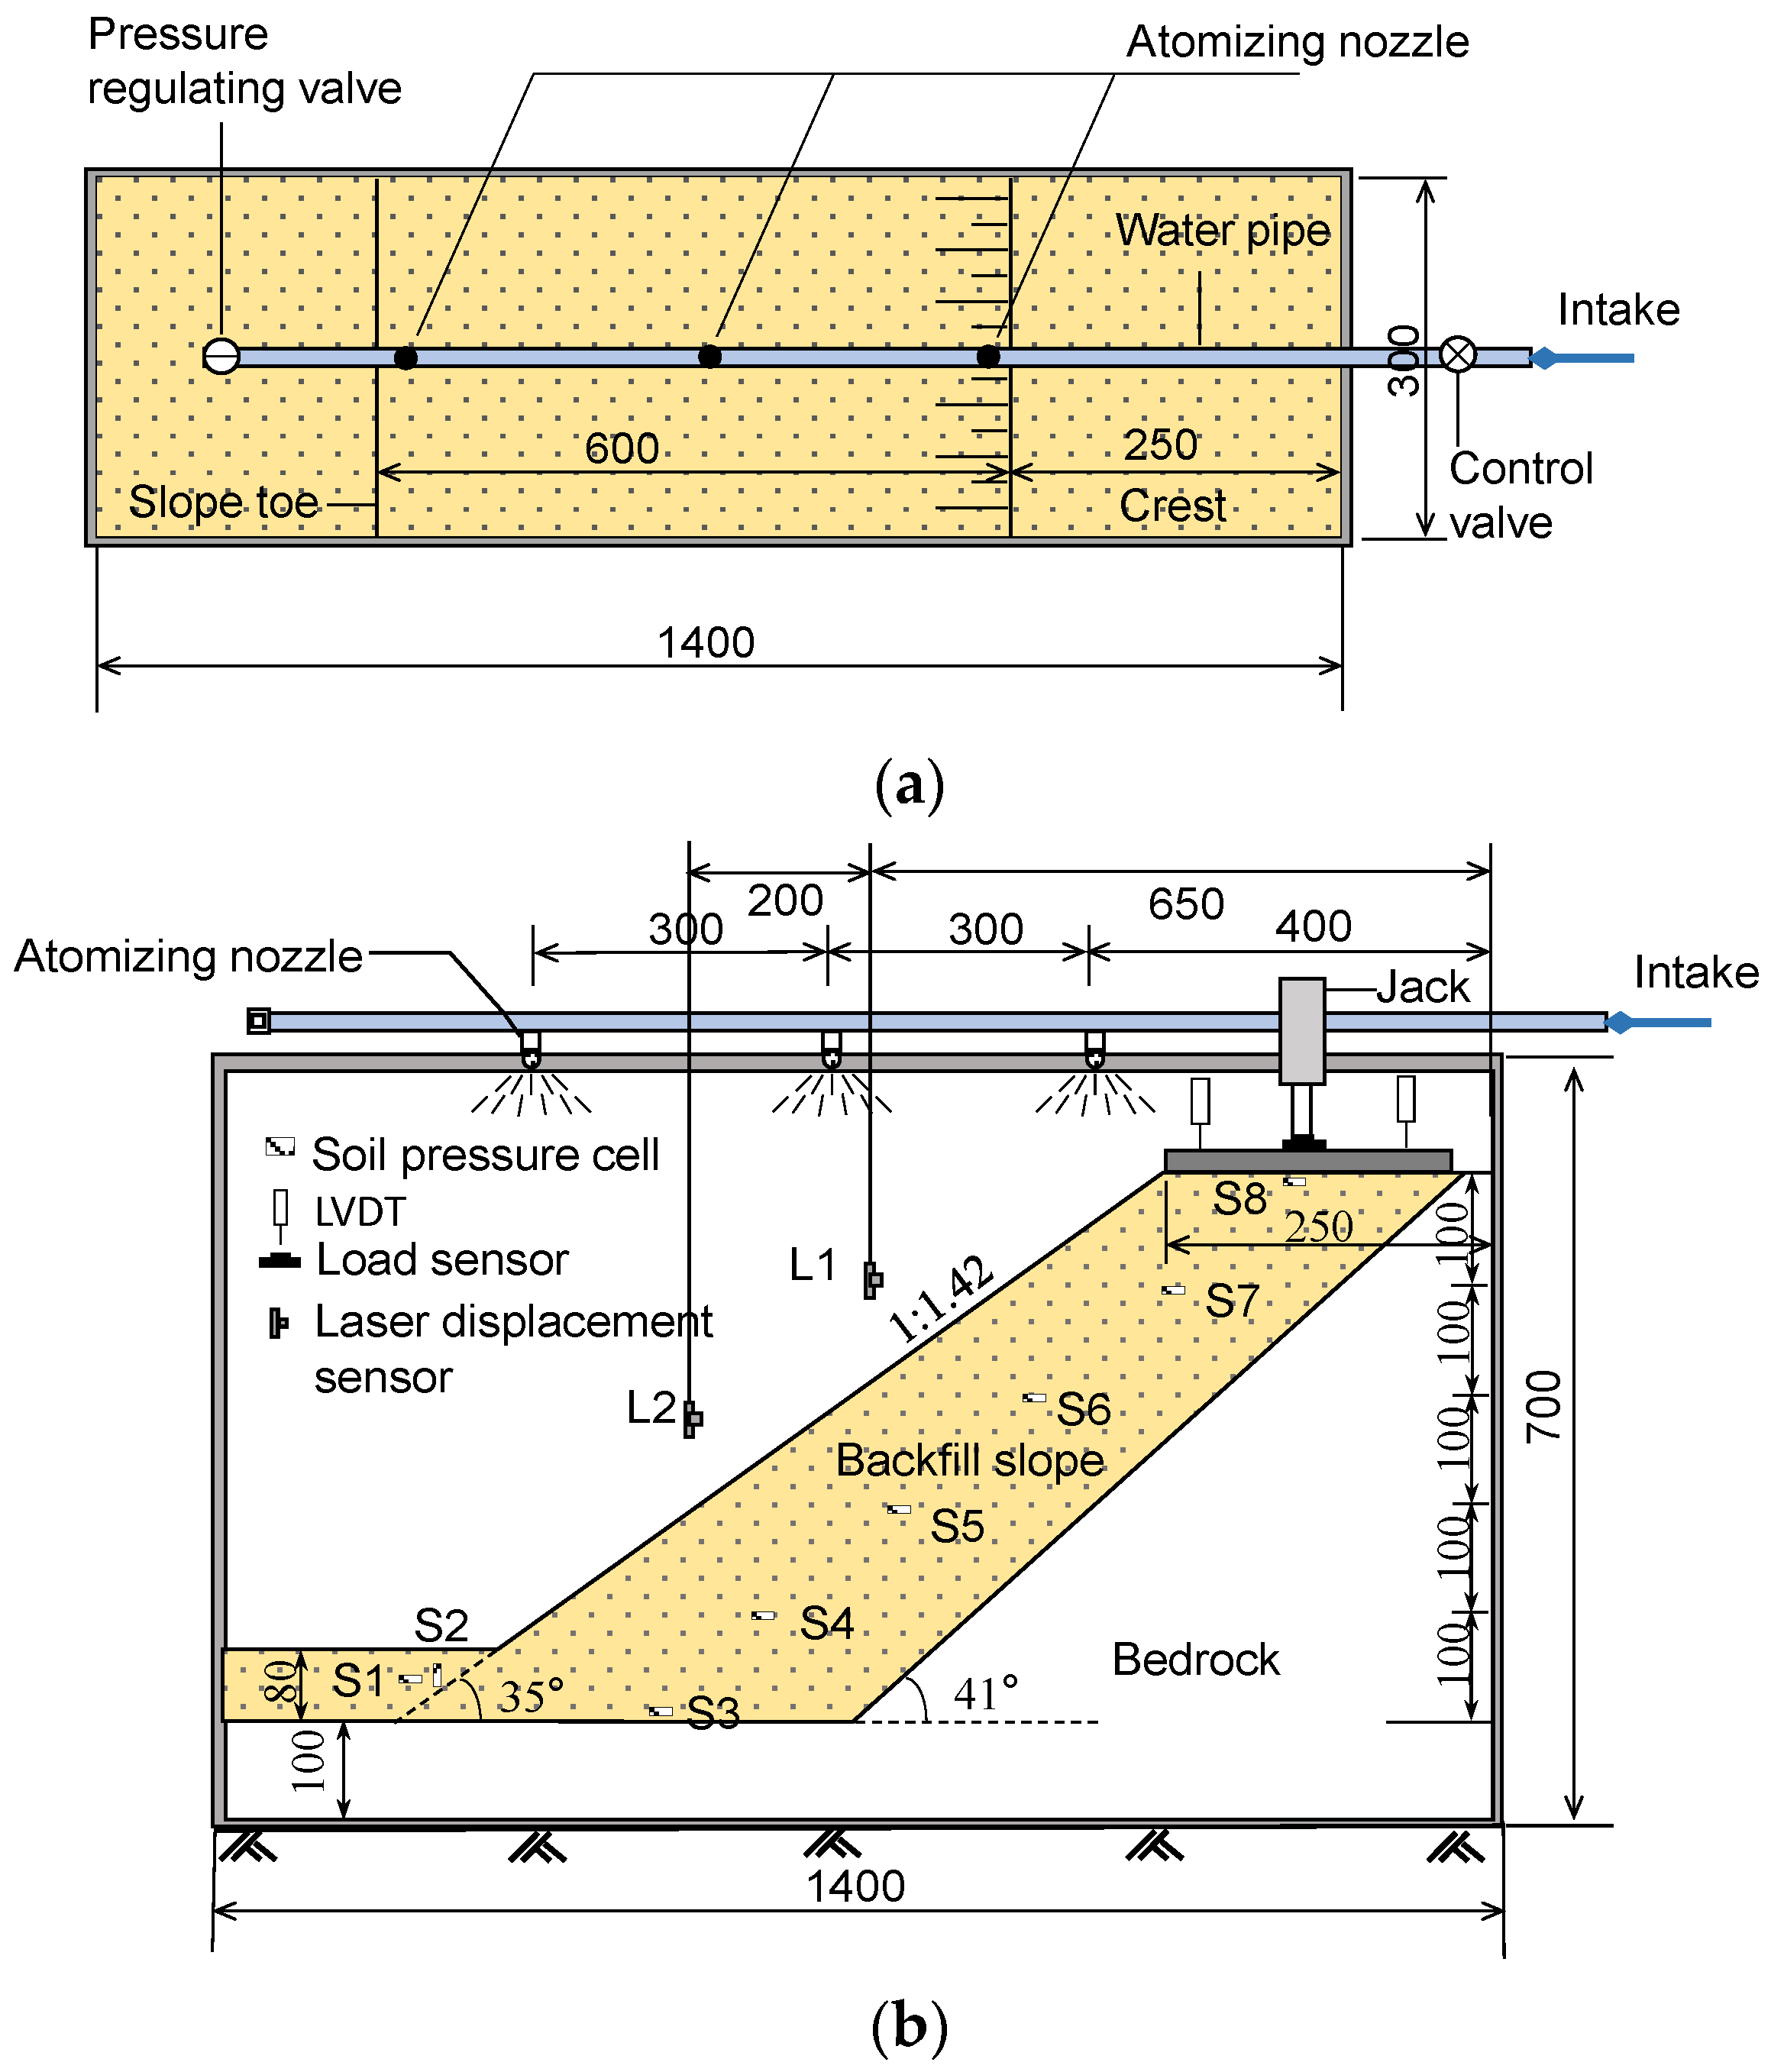
Figure 1 presents the schematic of the model test. The model box had inside dimensions of 1400 mm long, 700 mm high, and 300 mm wide, and was made of double-layer toughened glass plates to allow the visual observation and photogrammetry of the model slope during the test. The model box was fixed by steel frames to minimize its lateral deformations. To minimize the side effect due to the friction of the side walls of the box, a thin layer of Vaseline was smeared on the inside of the side walls.
The model bedrock slope with a slope angle of 41° was made of wood. Waterproof glue was spread on the boundary of the model bedrock contacting with the side walls of the model box to prevent water leakage. A backfill slope with a slope angle of 35° and a crest of 350 mm was constructed adjacent to the bedrock slope. A loading plate with dimensions of 290 mm long, 200 mm wide, and 15 mm thick was placed on the top of the backfill slope. A hydraulic jack was connected to the loading plate, which was used to apply an external load on the top surface of the backfill slope. An artificial rainfall device containing three atomizing nozzles was installed directly over the model box to achieve modeling of rainfall in this study. The rainfall intensity can be simply controlled by manually adjusting the valve.

2.2. Materials and Preparation

Considering the sizes of the model test, this study selected a scale ratio of 1/40 to a typical prototype size. This study mainly paid close attention to the similarities of the backfill properties, including the strength and permeability. The model backfill soil was made of a mixture of quartz sand, nano-bentonite, and expanded polystyrene (EPS) particles. The quartz sand had a particle size range of 0.5 mm to 4 mm, and the non-uniformity coefficient Cu and the curvature coefficient Cu were 3.64 and 0.98, respectively. The EPS particles had a particle size range of 1 mm to 2 mm. The quartz sands were mixed with nano-bentonite according to a mass ratio of 7:3, and the mixture was then mixed with the EPS particles according to the volume ratio of 10:1. The inclusion of EPS particles can adjust the compressibility of soil. As the water content of the backfill changes due to rainfall, a series of laboratory tests were conducted to obtain the physical–mechanical properties of the artificial soils with different water contents. Table 1 summarizes the main properties of the soils. Clearly, the shear strength properties and modulus decreased with the increase of the water content. The prepared backfill can reflect the material properties weakened by the seepage and infiltration of rainfall. The permeability of the soil under the saturated condition was 1.3 × 10⁻⁷ m/s, obtained from a falling-head permeability test, which is in the same order of magnitude as the protype.
In the model tests, the soils with a water content of 5% were prepared. Semi-resin alumina sandpaper was pasted on the slope side of the mode bedrock to increase the roughness of the bedrock surface. The interface shear test showed the interfacial frictional angle of 32.3° and cohesion of 9.1 kPa for the interface between the bedrock and the backfill. A 50 mm-thick soil layer was compacted on the base of bedrock. To better control the manufacture of backfill slope, a wooden facing plate with an inclination angle of 60° was installed in front of the backfill slope, and then the weighted backfill soils were gently placed into the channel between the bedrock and the facing plate. The soils were compacted manually by a steel hammer to a relative density of 80% with a lift thickness of 50 mm up to the desired slope height. The compaction was controlled by the mass and volume in each lift. After the backfills in the channel were complete, the facing plate was removed, and the desired slope shape with a slope angle of 35° and a crest of 350 mm wide were carefully trimmed.

2.3. Testing Program and Monitoring Plan

This study mainly considered the influence of rain on the stability of high backfill slopes. Rainfall intensities of 0.2 mm/h and 4 mm/h were considered, which correspond to light rain and heavy rain in the prototype [31]. Rainfall durations of 0.5 h and 1 h were considered. Table 2 shows the model test program.
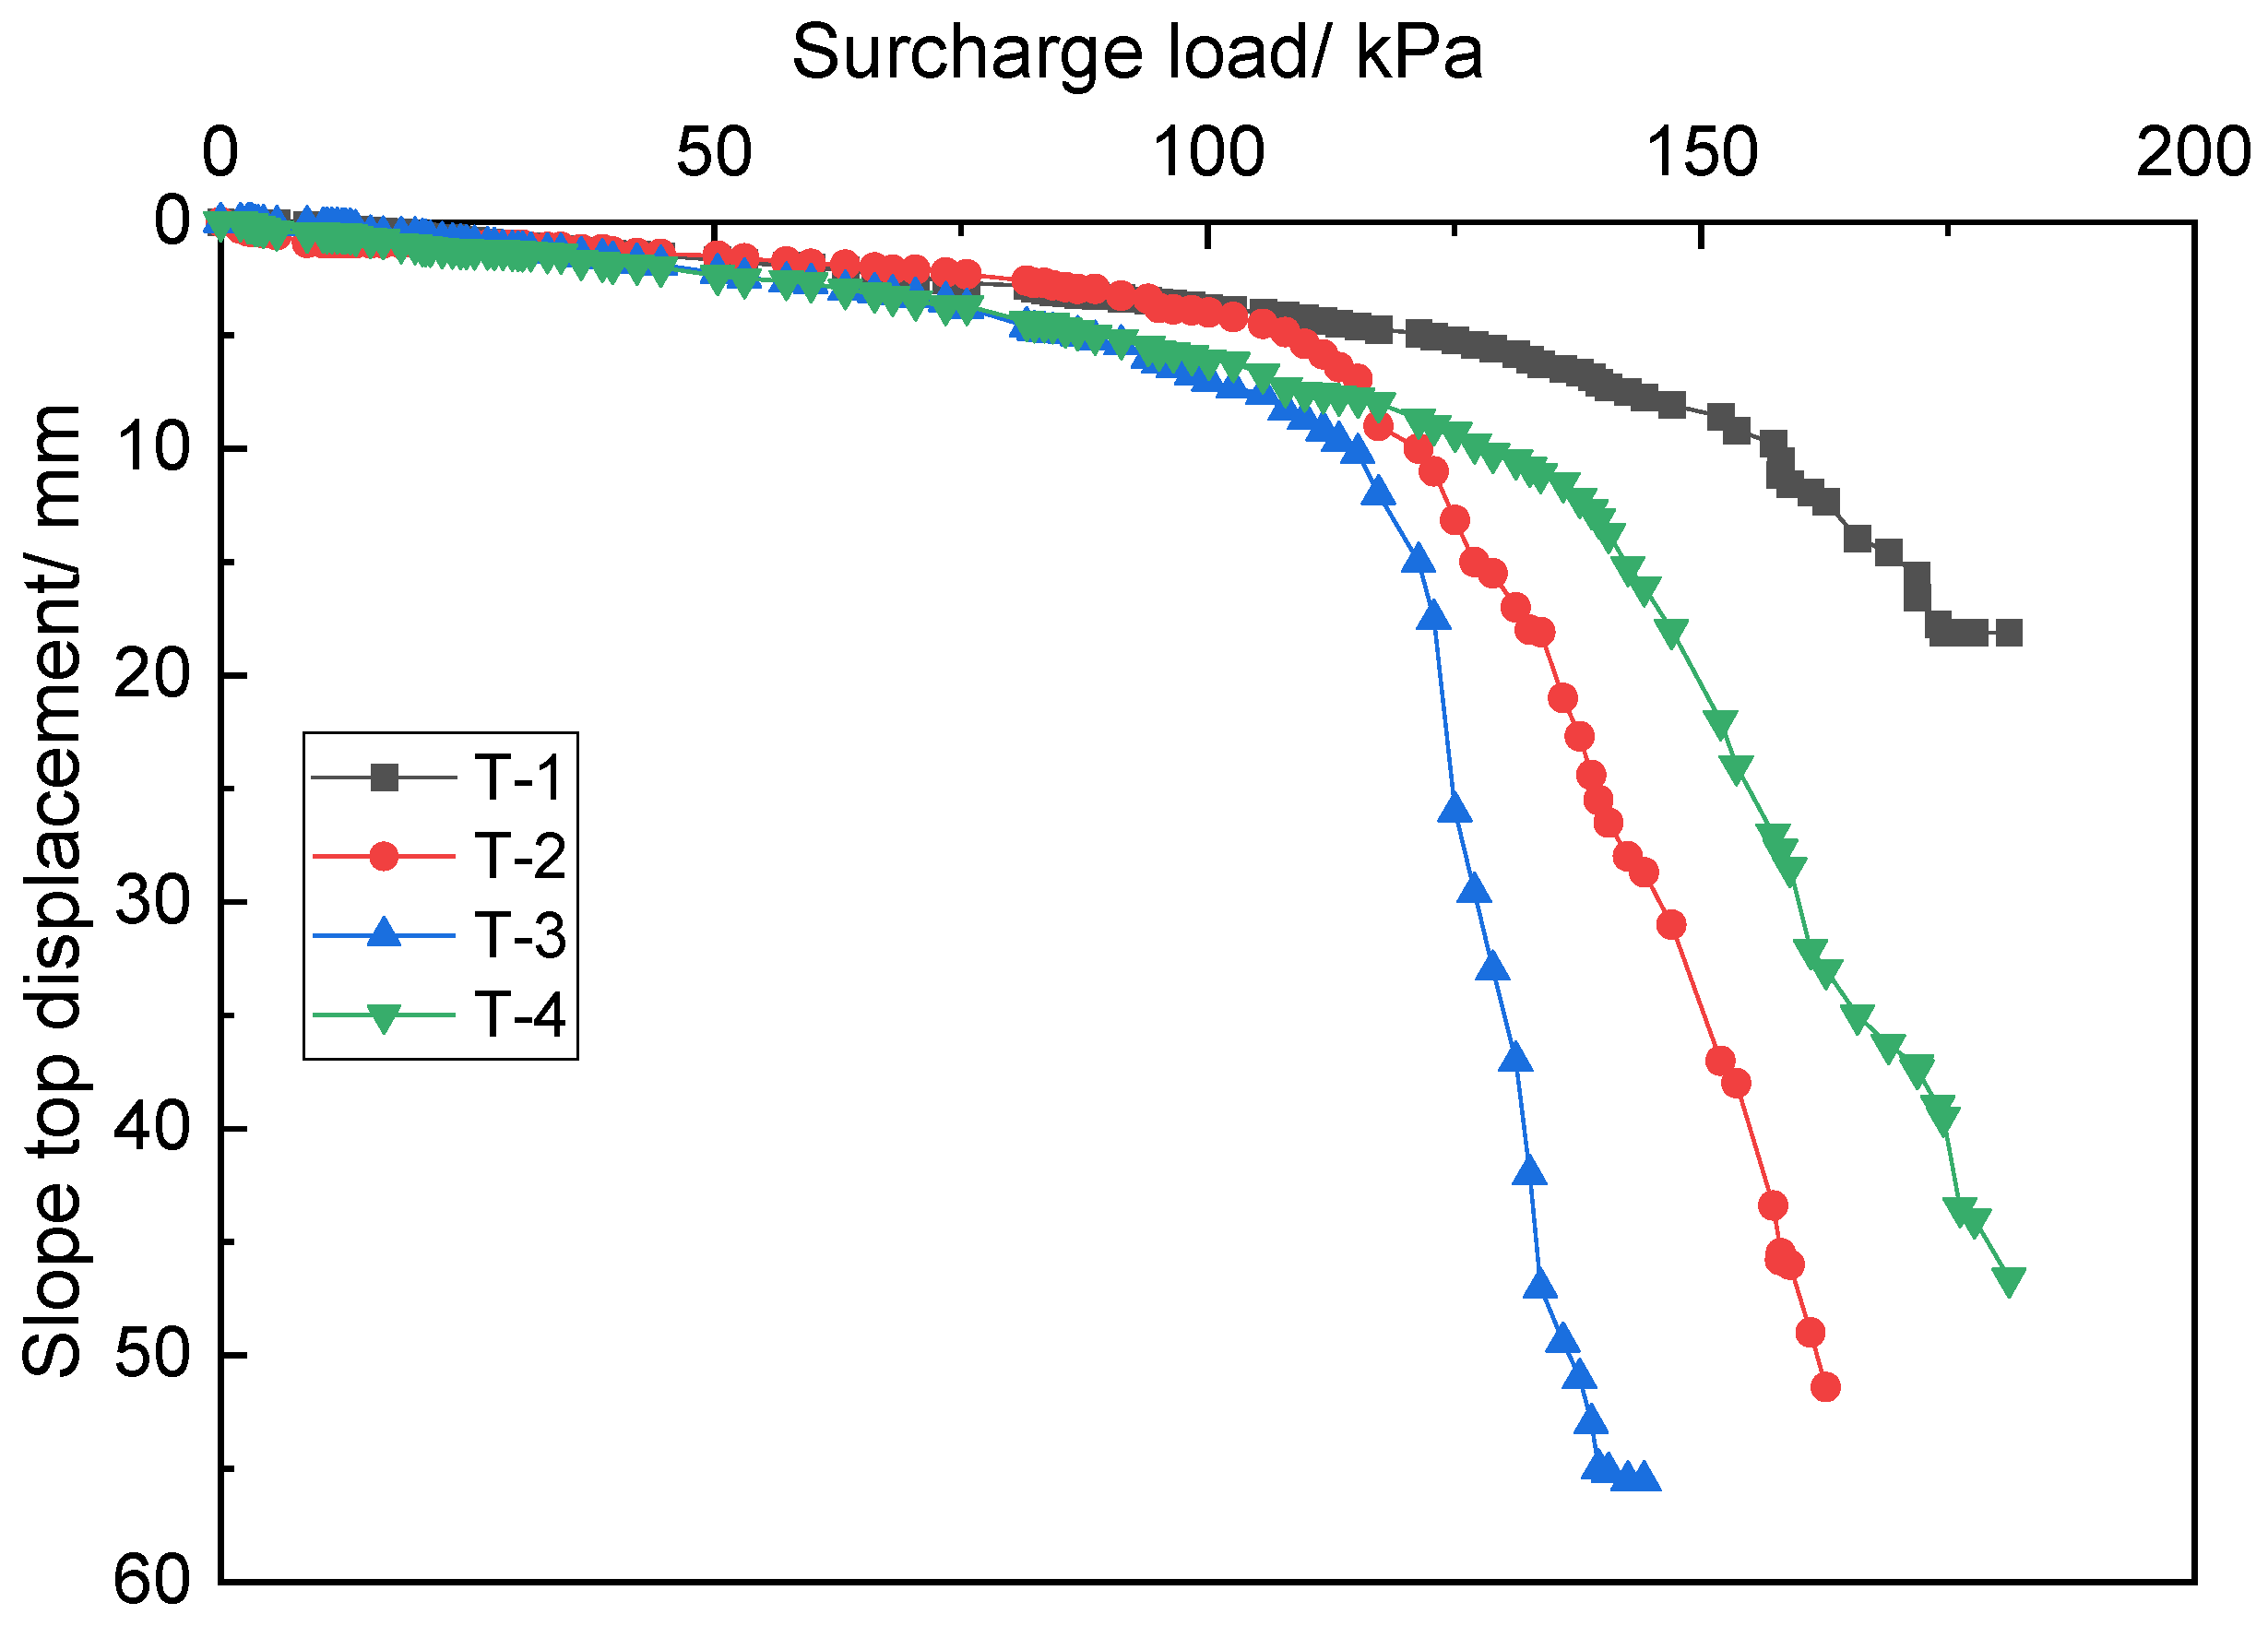
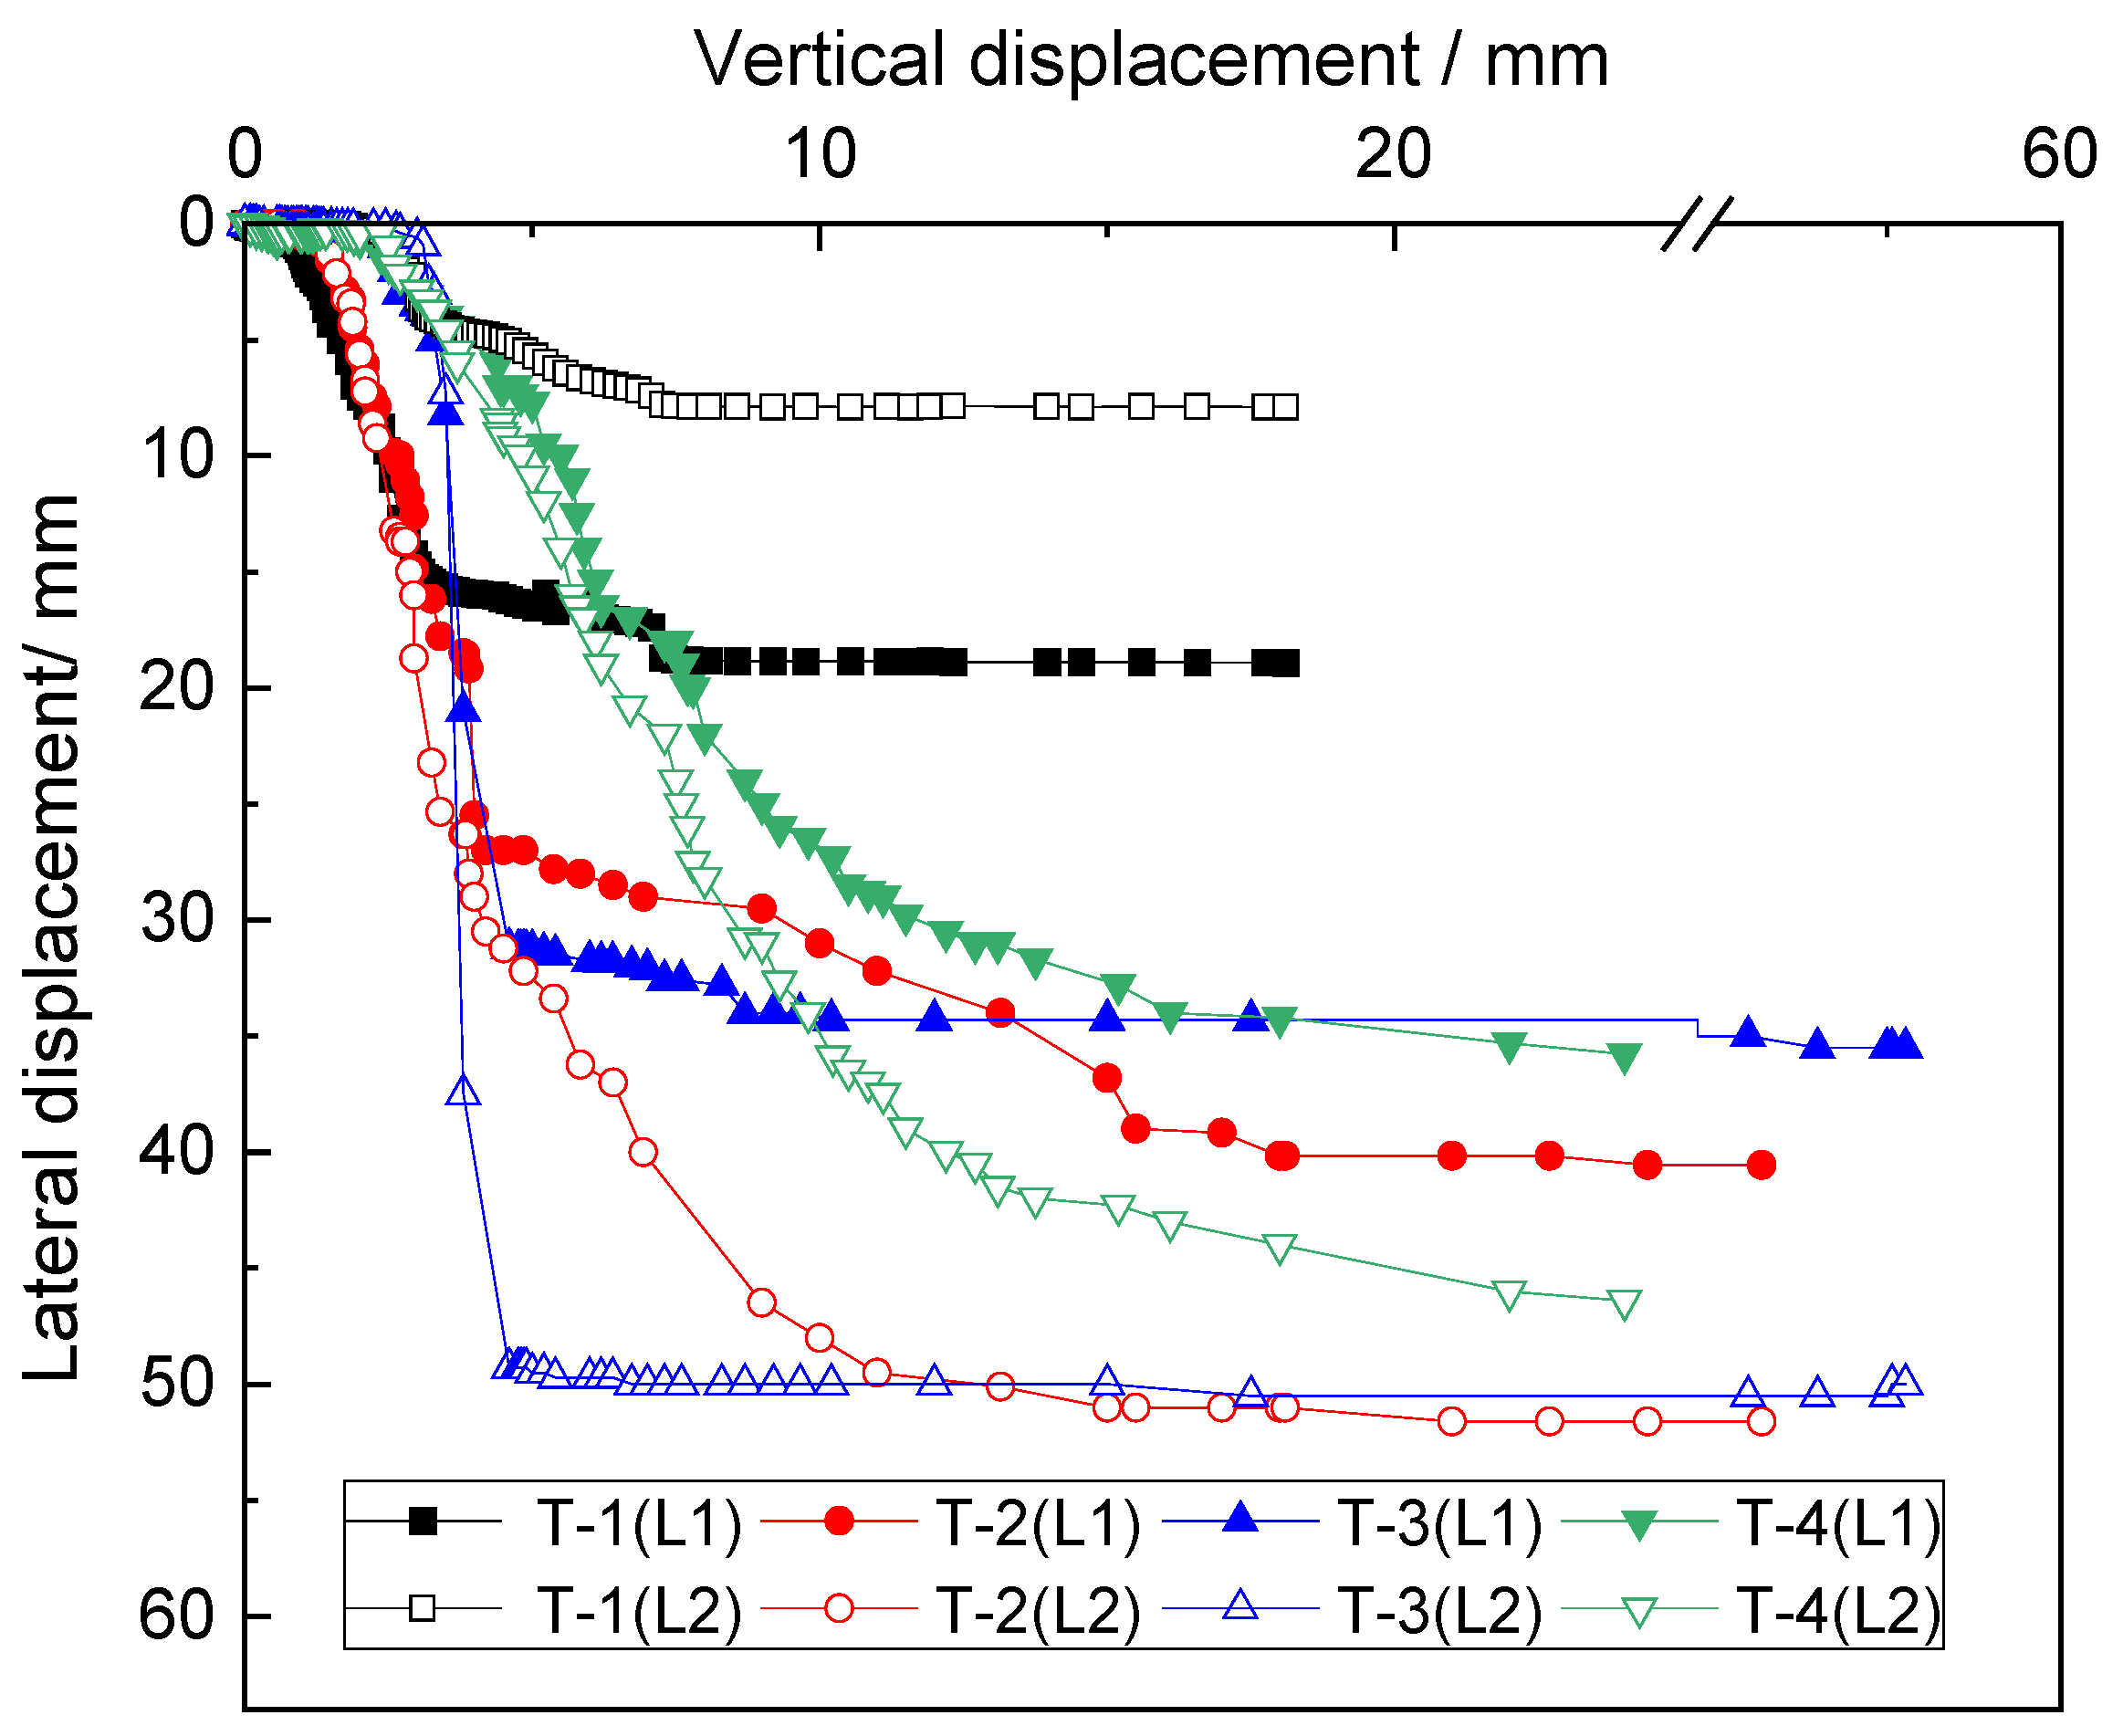
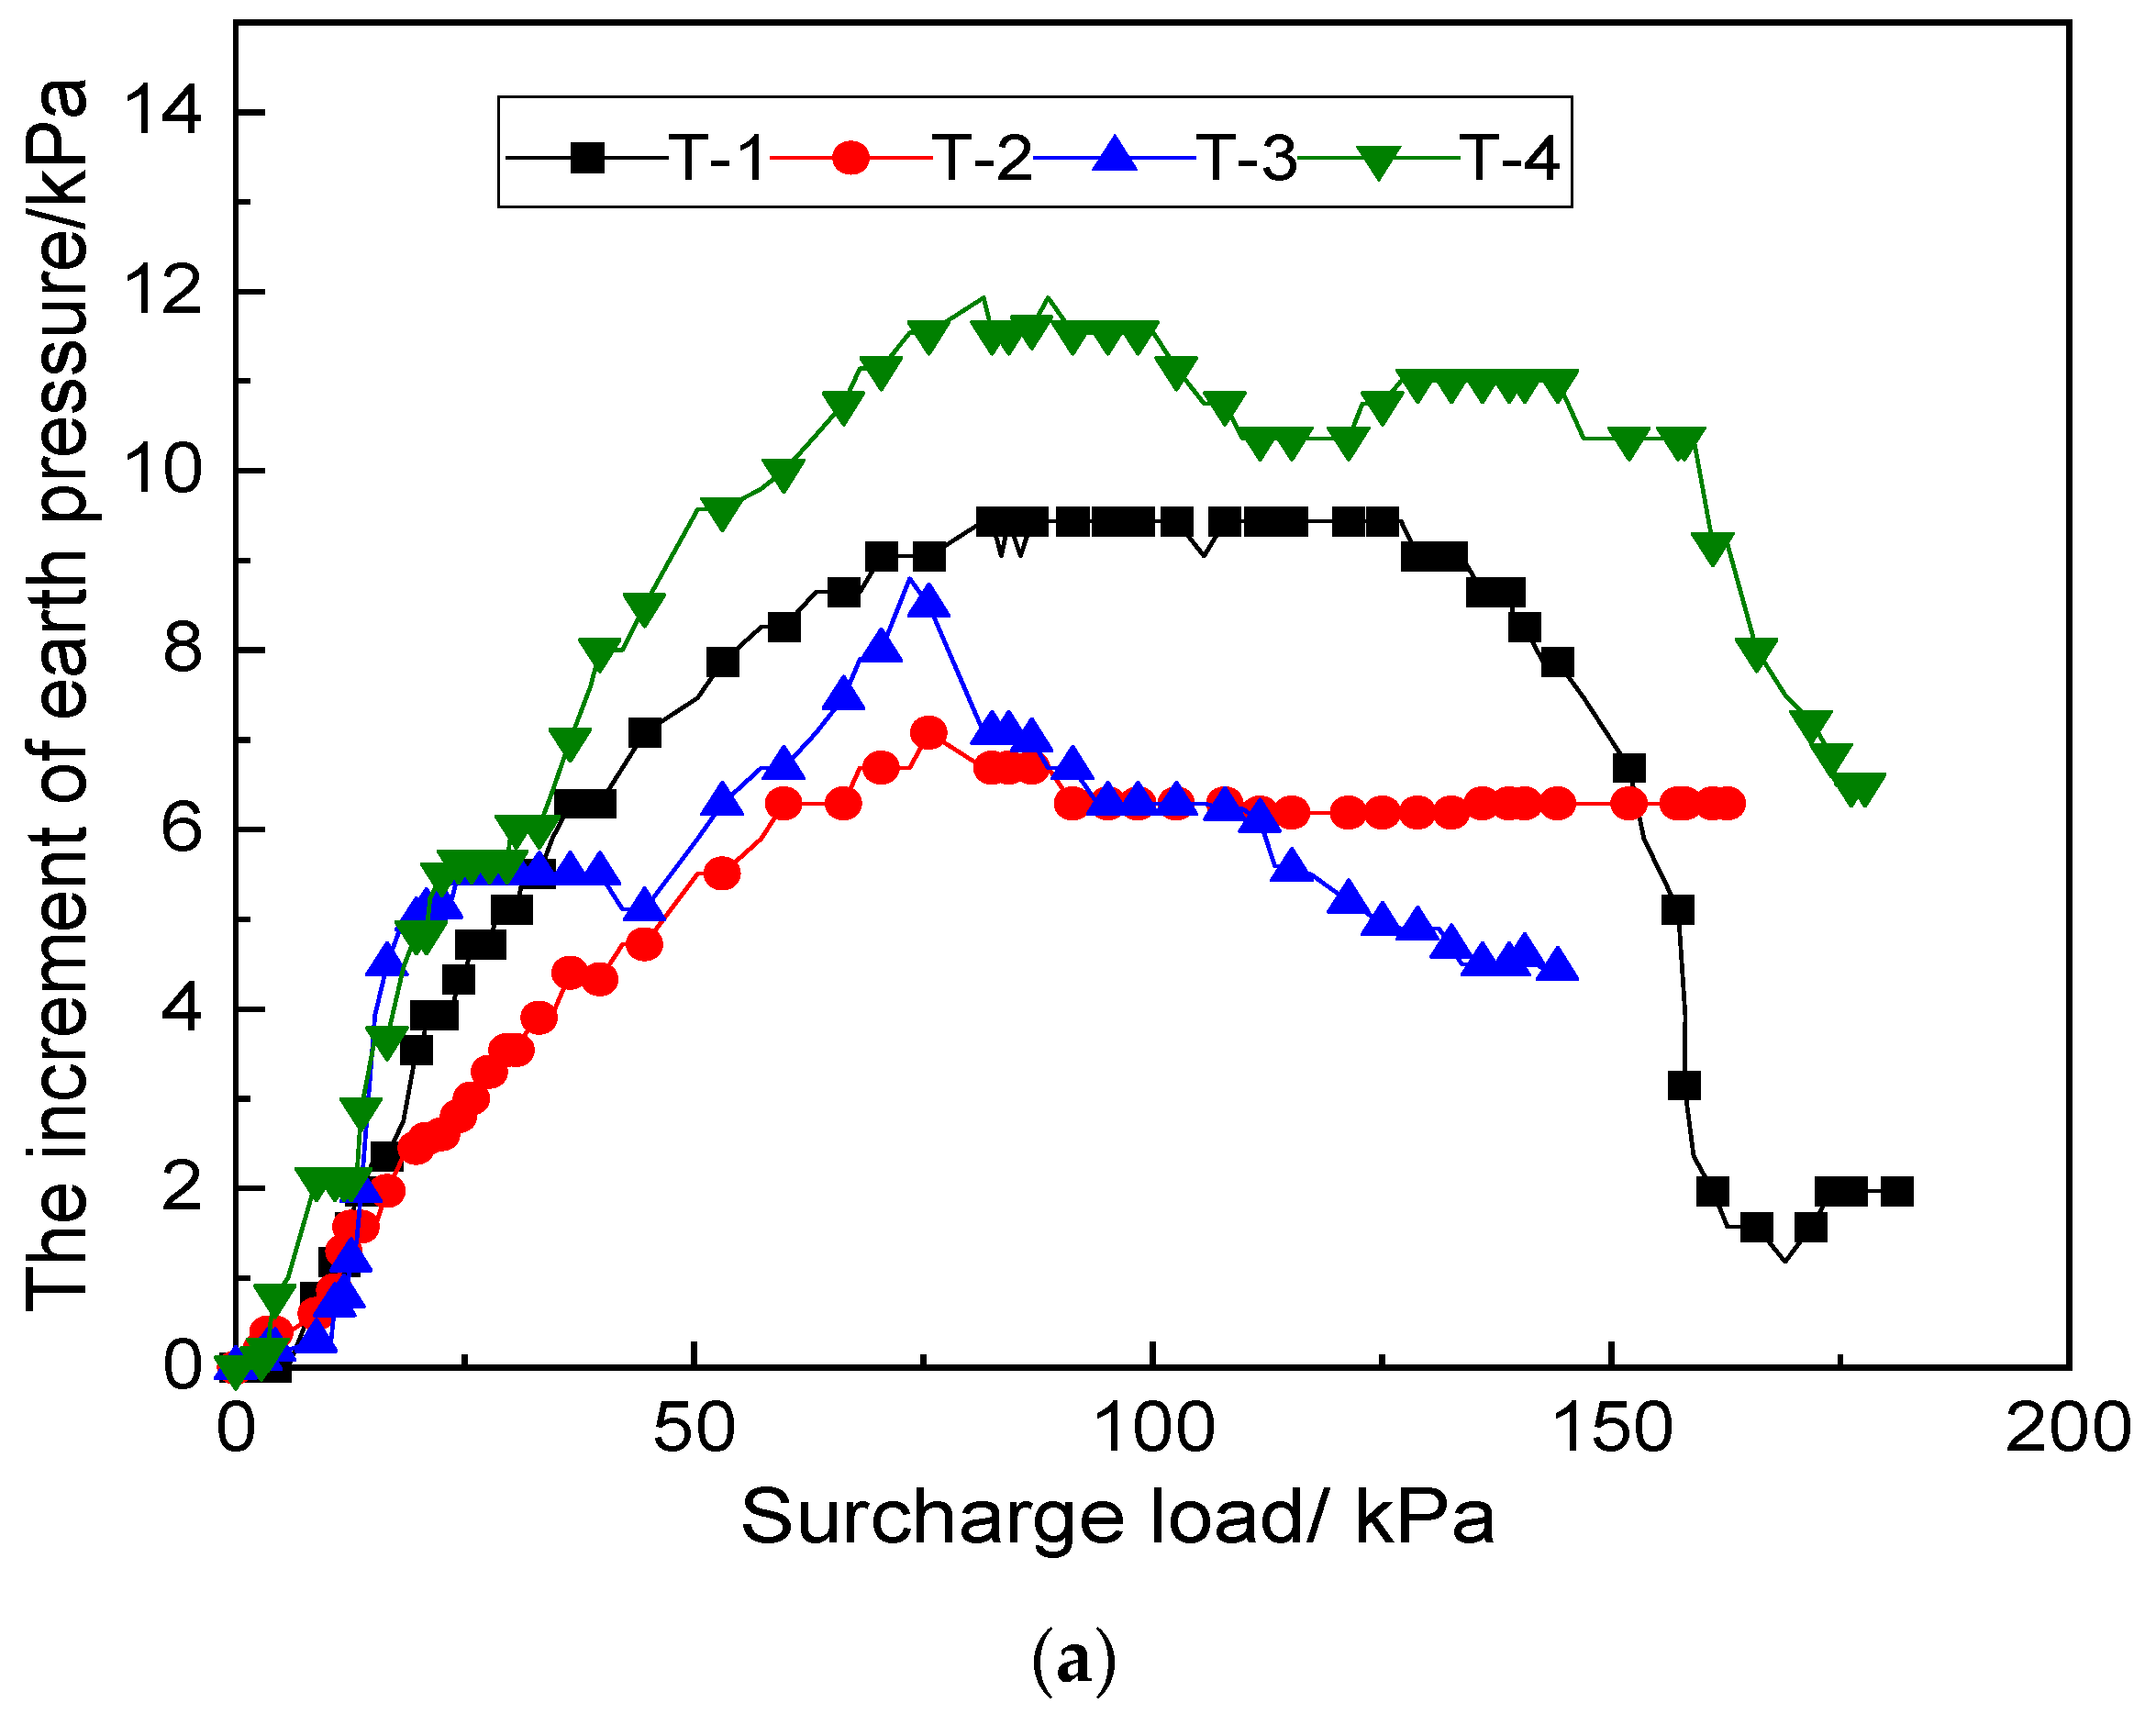
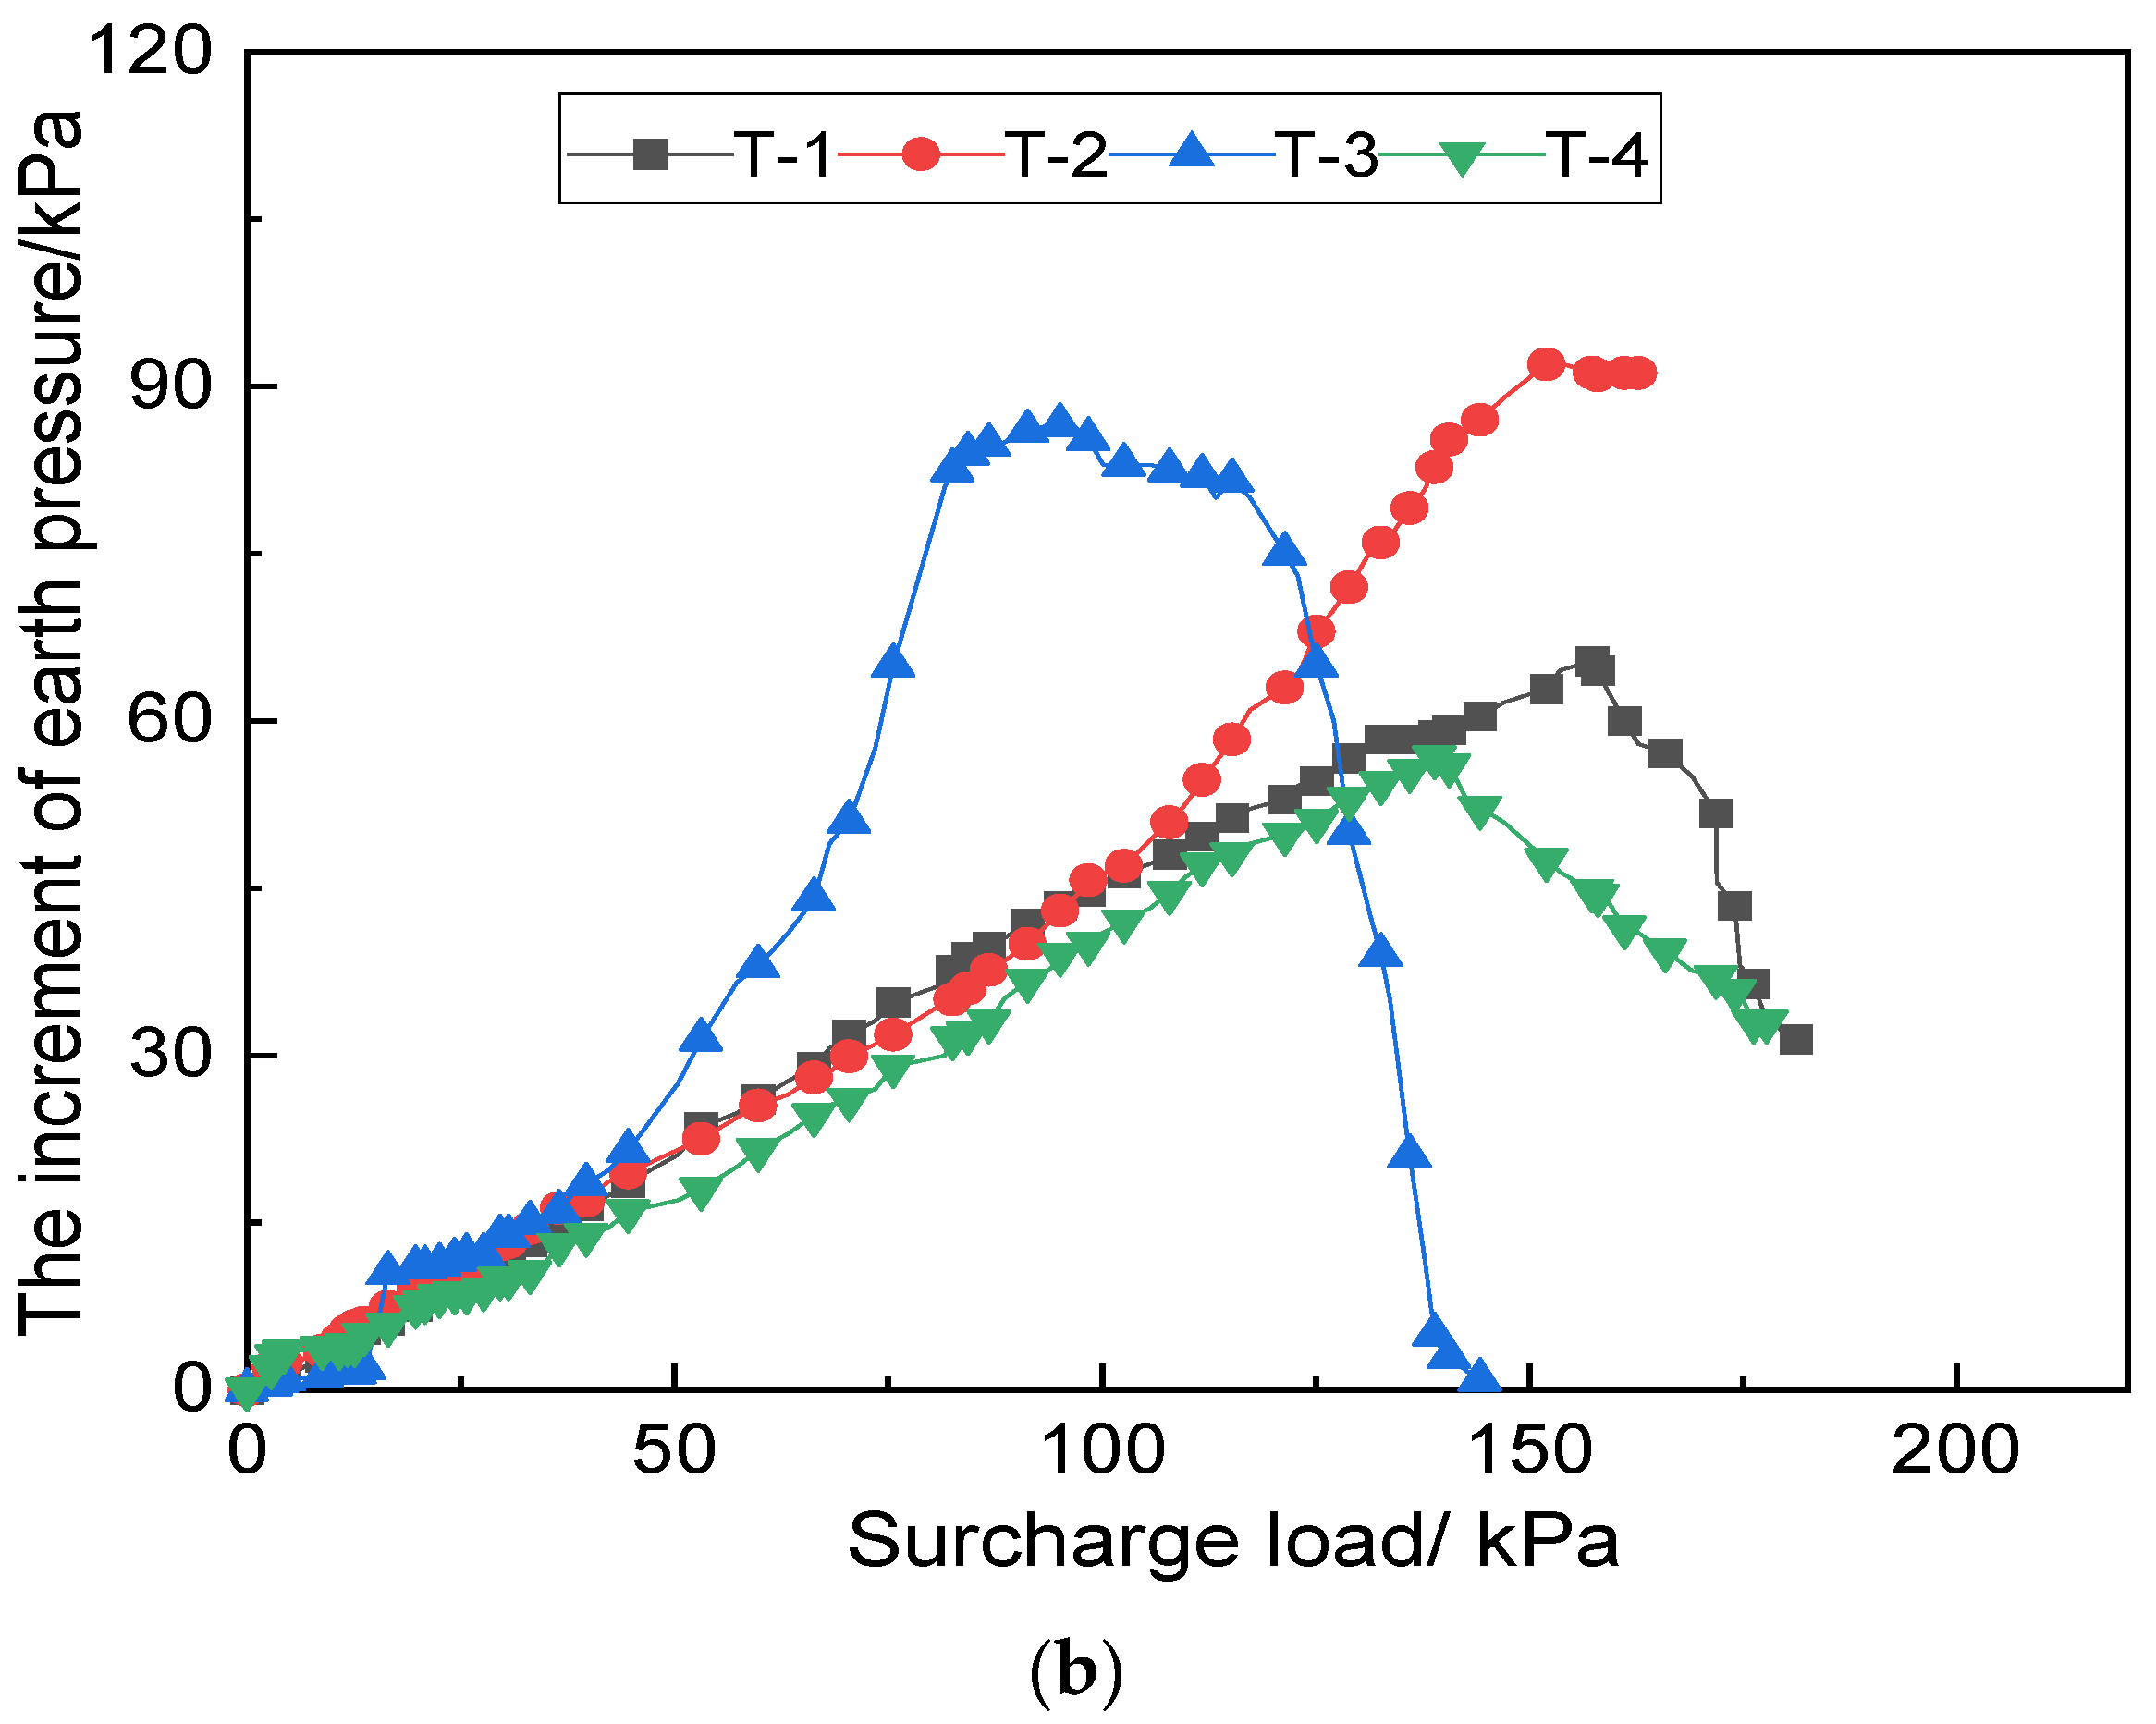
Figure 1 also includes the layout of the monitoring instruments in the model test. In this study, the displacements, earth pressures, and water contents of the backfill were measured. The load sensors were placed right below the jack to measure the applied load. Six earth pressure cells were installed along the centerline of the backfill slope to measure the vertical soil stress, and two were installed at the toe of the slope to measure the horizontal and vertical soil stresses, respectively. Two linear variable displacement transducers (LVDT) were installed at the slope shoulder to measure the vertical displacements, and two laser displacement censers were installed above the slope surface to measure the lateral displacements. A soil moisture sensor was used to measure the soil moisture content in the backfill slope after the rain. A data logger device was used to record the test data in real time. A Canon 6D digital camera was fixed on the cross section to take high-definition photos during the test, so, as with the displacement field, the cross section of the backfill slope can be obtained with the particle image velocimetry (PIV) technique.
In each model test, after manufacturing the model test and leaving to rest for 24 h, the artificial rainfall device was started up according to the planned rain intensity and duration. A soil moisture sensor was used to record the soil moisture content near the slope surface. A loading device applied a load on the top of the slope crest with a gradual increase of 1.7 kPa (kiloPascals) per second until the slope eventually failed. The displacements and earth pressures were monitored, and the pictures were taken four times a second in the loading process. After the test, the backfills were carefully excavated with a layer of 50 mm, and the soil moisture content in the internal zone of the backfill slope were recorded.

3. Test Results and Analyses

3.1. Slope Deformation

Figure 2 shows the variation of the vertical displacement on the top surface of the slope with the increase of the surcharge load. It can be seen that, with the increase of the surcharge, the vertical displacement of the slope increased almost linearly and gradually accelerated with a fast rate irrespective of the rainfall. However, the rainfall had a significant impact on the slope stability. The instability critical surcharge was determined by referring to the graphing method proposed by Casagrande [34]. The backfill slopes had instability critical surcharges of 149 kPa, 125 kPa, 117 kPa, and 136 kPa in the tests T-1 to T-4, respectively. It can be found that the stability of the backfill slope decreases with the increase of the rainfall intensity and duration as other factors are consistent.
Figure 3 displays the variations of the lateral displacement of the backfill slope at the monitoring points L1 and L2 with the vertical displacement on the top surface of the slope. The lateral displacement of the backfill slope increased rapidly with the increase of the vertical displacement. After reaching a certain value, it remained stable with the increase of the vertical displacement. With the increase of the rainfall intensity and duration, the increase of the lateral displacement became more significant. In the model test T-1, the lateral displacement near the slope shoulder (i.e., L1) was more significant than that in the middle part of the slope (i.e., L2), while, after the rainfall, we see the opposite result. Comparing T-2 and T-3, the lateral displacement near the slope shoulder (i.e., L1) in the model test T-2 is 5.0 mm larger than in the model test T-3. In the middle part of the slope (i.e., L2), the lateral displacement of T-2 and T-3 are basically identical. This showed that a different rainfall duration can increase the slide of the slope. Comparing T-2 and T-4, the lateral displacement near the slope shoulder (i.e., L1) in the model test T-2 is 3.1 mm larger than in the model test T-4. In the middle part of the slope (i.e., L2), the lateral displacement of T-2 is 3.1 mm larger than T-4. This showed that rainfall intensity can increase the sliding area of the slope. This indicated that the rainfall changed the slope failure from the part near the shoulder to the middle part.

3.2. Stress Development

The earth pressure cells S1 to S5 were kept almost constant during the loading test, indicating that they were not influenced by the surcharge. The earth pressure cell S8 varied consistently with the applied surcharge. Thus, they were excluded from the analysis. Figure 4 shows the variation of the earth pressure cells S6 and S7. The earth pressures of S6 and S7 increased fast with the increase of the surcharge, and reduced sharply or became stable after reaching a peak value. As the slip plane passed through the zones near S6 and S7, the backfills experienced plastic shear displacement with the surcharge load, resulting in a reduction in earth pressure. Thus, the decline in earth pressure can also be used as an indication of the slope failure.
Figure 5 shows the surcharge load at the peak earth pressure. The surcharge load corresponding to the peak earth pressures at S6 were generally smaller than those at S7. In addition, increasing the rainfall intensity and duration decreased the surcharge load corresponding to the peak earth pressure. It is indicated that the rainfall caused a decline of the shear strength of the backfill.

3.3. Slope Humidification Range

Figure 6 shows the contours of the mass moisture contents in the backfill slope determined by the soil moisture sensor. The moisture contents near the slope surface were 28.76% and 28.20% in the tests T-2 and T-3, while it was 20.63% in the test T-4. The heavy rain causes the slope surface to be saturated faster than the light rain. In the internal zone of the backfill slope, the moisture content was distributed almost parallel to the slope surface. With the movement of the wetting front into the slope, the water content gradually decreased to the initial water content of 5%. Figure 7 illustrates the moisture contents distributed along the backfill slope at the middle height, as shown in Figure 6a. The moisture content gradually decreases and eventually tends to a certain value. The trend of the change in tests T2 and T3 is basically the same. It can be observed that, in test T-4, the expansion rate of the wetting front was relatively slow, resulting in a narrowly distributed moisturized zone. Therefore, rainfall intensity significantly impacts the internal distribution of the moisture contents in the backfill slope.

3.4. Failure Modes

Figure 8 illustrates the shear strain contours of the backfill slope determined by PIV in each test. The slip plane can be determined as the zone with the relatively larger shear strains. Test T-1 had a primary slip plane near the slope shoulder. Test T-2 and T-4 had a similar slip plane, which passed from the rear of the top surface to the middle of the side slope. The slip plane of test T-3 was further contacted with the bedrock interface. All the slip planes were close to an arc-like sliding, but the rainfall influenced the sizes of the sliding mass.
Table 3 shows the maximum displacements and shear strains of the slope at failure. The maximum vertical and horizontal displacements of the backfill slope after rainfall were nearly two to three times as large as the test without rainfall, and they increased with the rain intensity and duration. The rainfall caused the backfill to be softened; as a result, relatively large displacements occurred after rainfall.

4. Model Base Establishment

To further investigate the influence of rainfall on the stability of the backfill slope, a numerical analysis incorporated in the software Geostudio was adopted in this study. The numerical simulation has the advantages of high efficiency, safety, and good repeatability. It can freely consider different conditions as compared with the physical model test. Test T-2 was used to calibrate the numerical model, including the relationship of the mass moisture content with the matric suction and permeability of the backfill soil [33]. Adopting the rest model tests T-1, T-3, and T-4 to validate a numerical model is a great step towards ensuring the accuracy and reliability of the simulation results. Accordingly, a large number of model bases were established considering the different surcharges, and the rainfall intensity and duration were established.
A two-dimensional numerical model with the same geometry as test T-2 was created. The backfill slope was modeled as Mohr–Coulomb failure criteria, and the material properties are as shown in Table 1. The bottom boundary was fixed in both the horizontal and vertical directions. The lateral displacements on the side boundaries were set to zero but the vertical movement was free. A rainfall boundary condition was set along the slope surface with a rainfall intensity of 4 mm/h. The Fredlund–Xing method was adopted to estimate the functions of the mass moisture content with the matric suction and permeability. After the simulation of rainfall, the Morgenstern–Price method was adopted to calculate the stability of the slope under the determined instability critical surcharge from the model test.
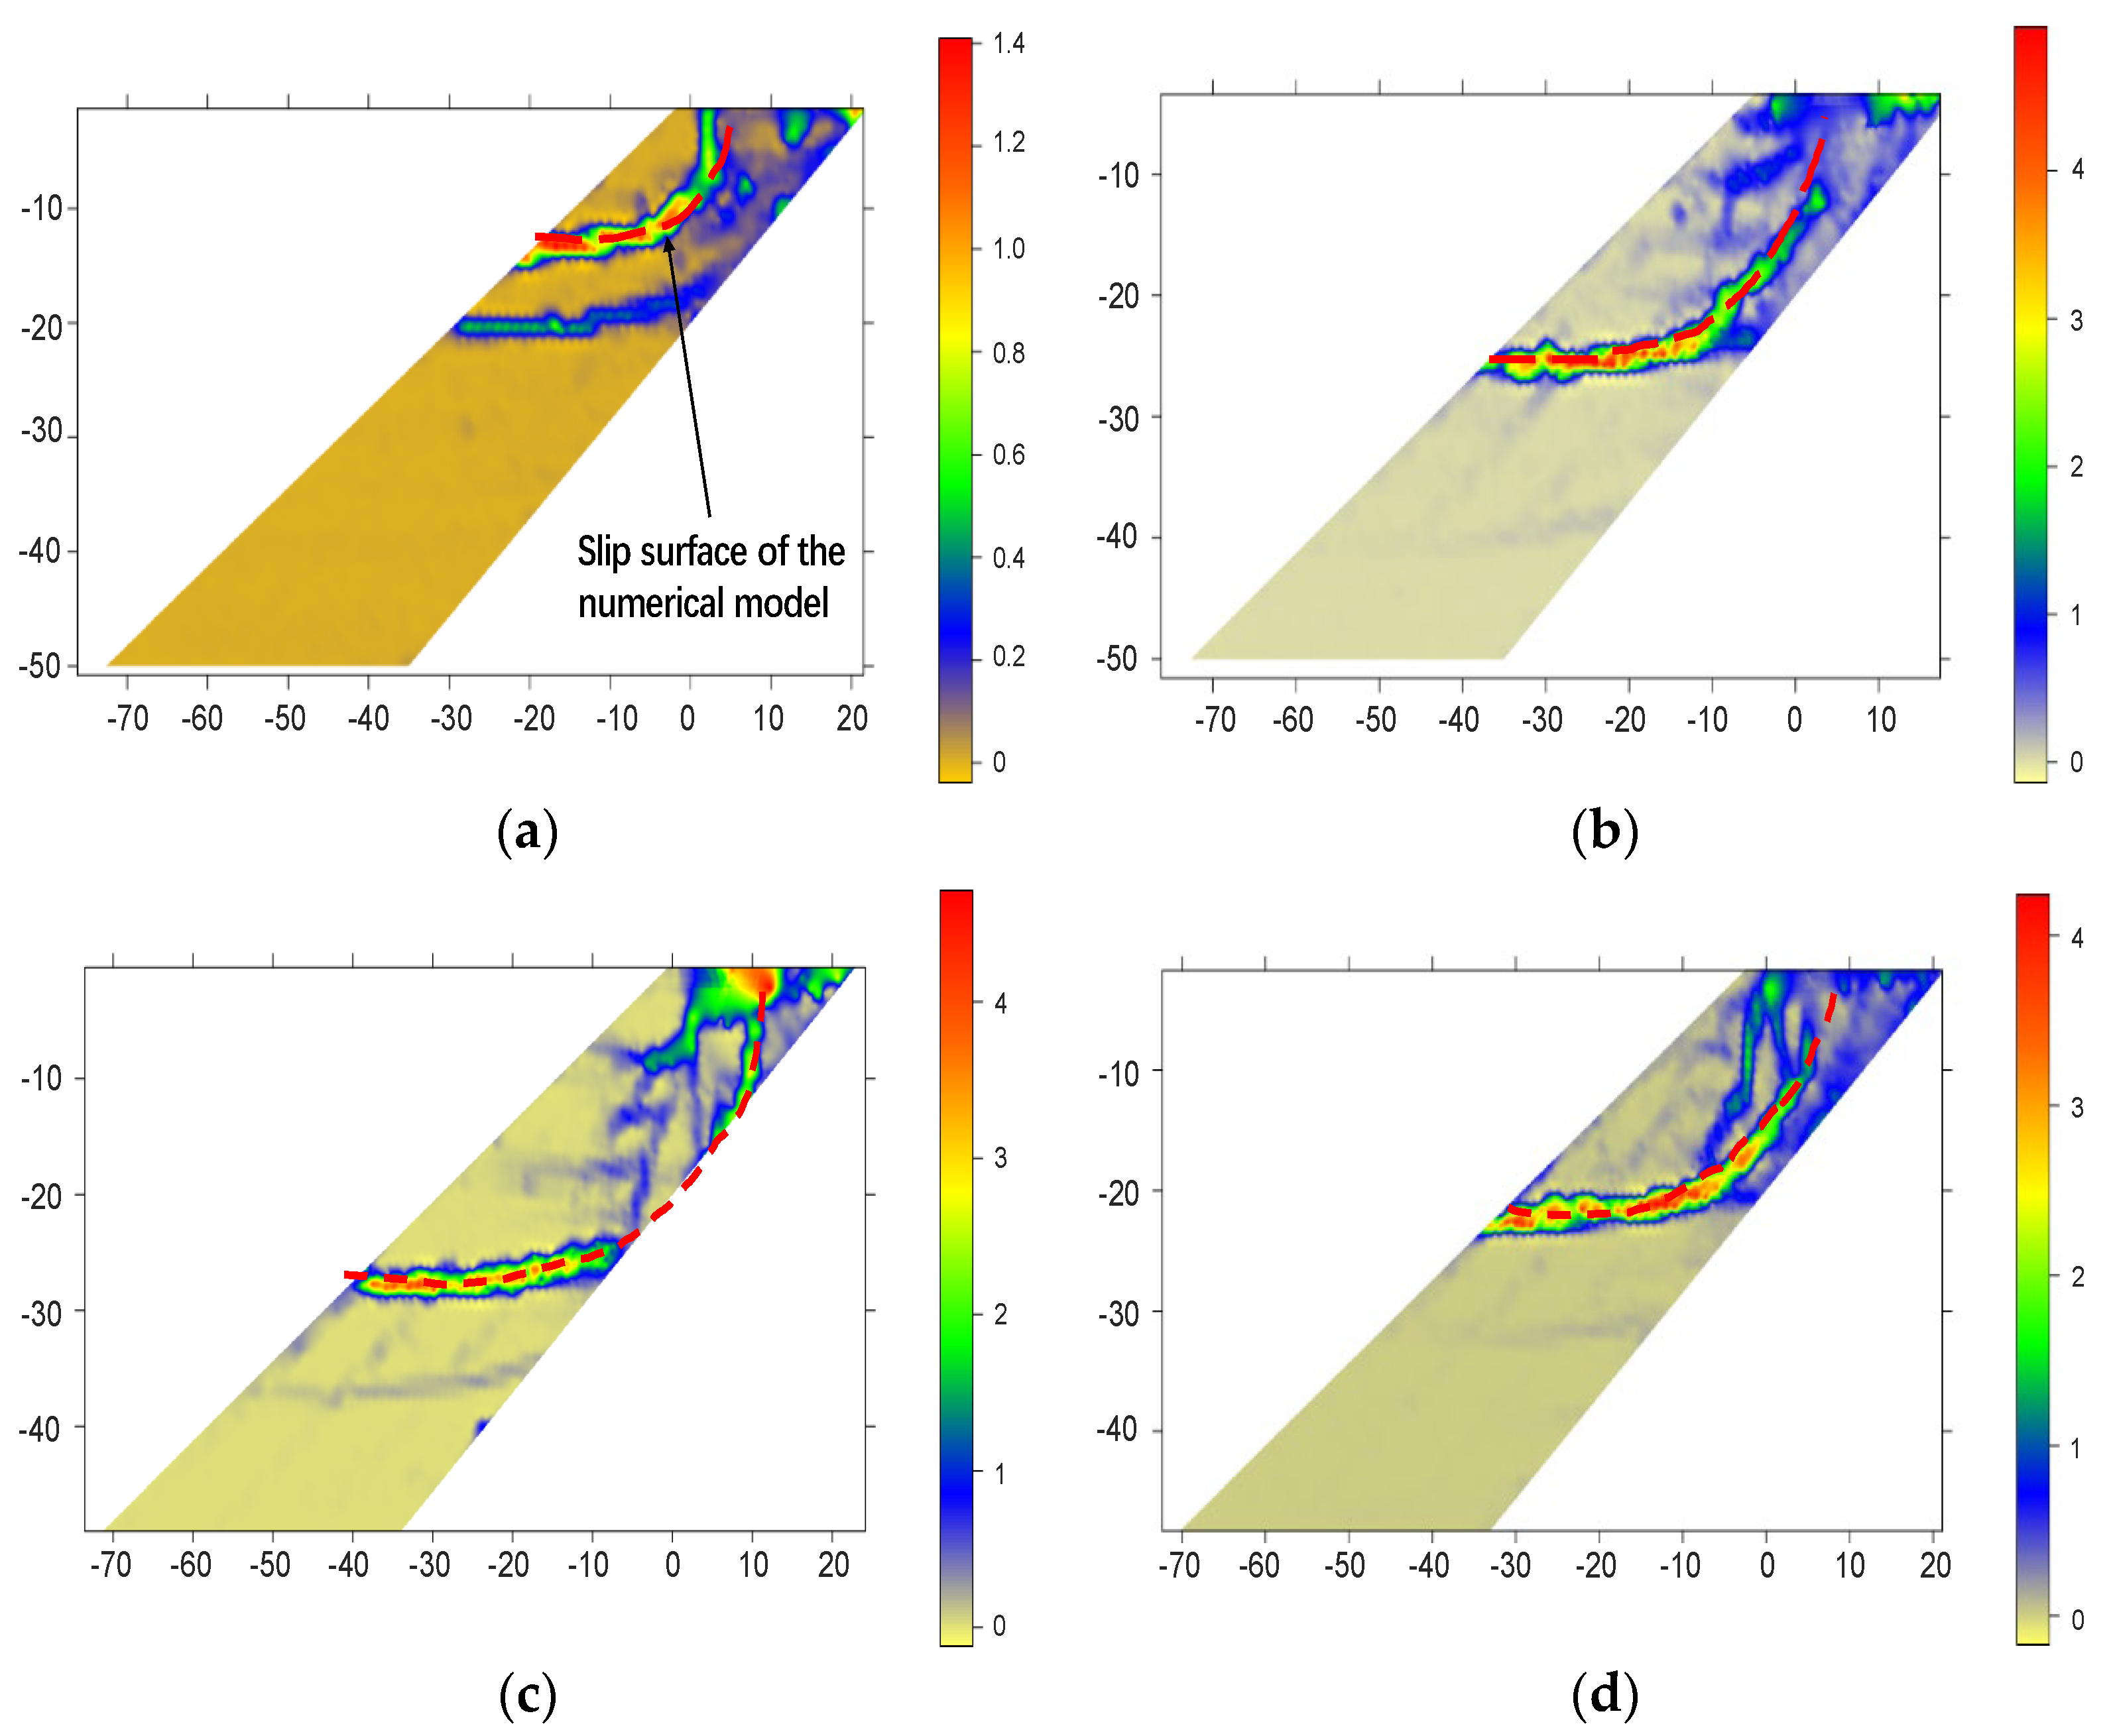
Figure 8b includes the calculated slip plane by the numerical analysis. Table 4 summarizes the calculated displacements of the backfill slope and factor of safety. It is indicated that the results by the calibrated numerical model T-2 agreed well with the model test. The calibrated model was used to further predict the stability of the tests T-1, T-3, and T-4. The numerical model had the same geometry, displacement boundary condition, and material properties instead of the rainfall boundary. As seen from Figure 8 and Table 4, the results of the numerical analysis were in good agreement with the model tests.
Based on the calibrated model, a model base including 112 cases was established, considering the factors of surcharge load and rainfall intensity and duration, as listed in Table 5. The rain duration changes from 0 to 9 h. The rain intensity varies from 0.65 to 4.0 mm/h, which refers to the rain intensity changing from light rain to heavy rain in the prototype.

4.1. Model Establishment and Training

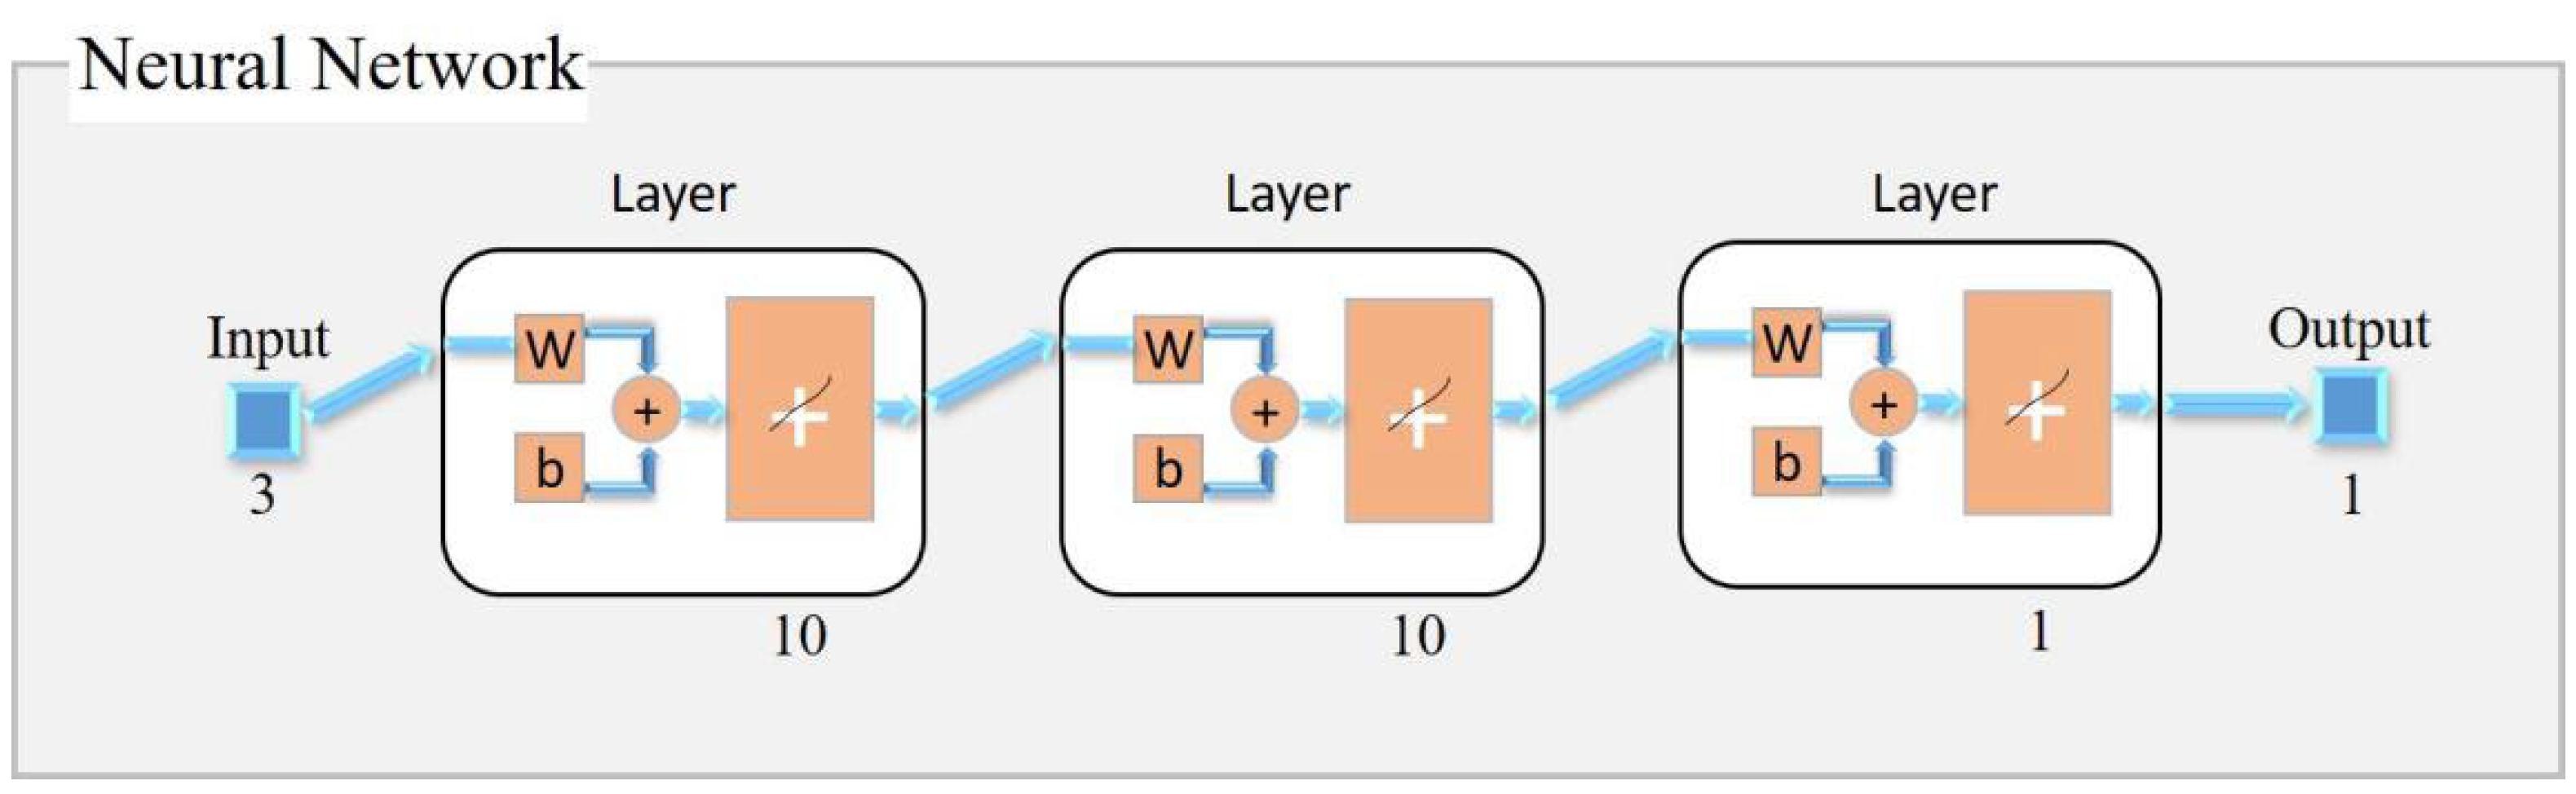
This study adopted the BP neural network to evaluate the stability of the backfill slope. The BP neural network adopts error backpropagation and signal forward propagation and continuously adjusts the threshold and weight of the network to minimize the error [35,36]. The BP neural network structure contains the input layer, hidden layer, and output layer. In this study, the surcharge load, and rainfall intensity and duration were the input layer, and the factor of safety was the output layer. The values of the 116 cases were normalized to values between [−1, 1] using the mapminmax function to make the network converge quickly. Normalization can prevent the phenomenon of neuron output saturation due to the tremendous absolute value of the input.
Among the cases, 102 cases were randomly selected as the training set, and the remaining 10 cases were the testing set. The newff function was adopted to create a BP neural network for the backpropagation algorithm:
net = n e w f f P ,   T ,   S
in which P is the input vector, T is the target vector, and S is the number of neurons in the hidden layer. P is a matrix of R × Q1. In the created neural network, there are R neurons in the input layer, and each row corresponds to the typical value of the input data of a neuron. T is a matrix of SN × Q2. The network has SN output layer nodes, and each row is a typical value of the output value. In this study, the training was set to have two hidden layers, and the number of neurons in the output layer was 10. The sigmoid function was selected as the transmission function of the neurons in both the hidden layer and the output layer, and the sigmoid function can prevent the phenomenon of neuron output saturation caused by the excessive net input absolute value. The traingdx function was selected as the training function of the backpropagation algorithm because that updates the weight and bias values according to the gradient descent momentum and an adaptive learning rate. It will return a trained net and the training record, and the learngdm function is adopted as the gradient descent learning function with an additional momentum factor. Figure 9 shows the final radial basis network structure.
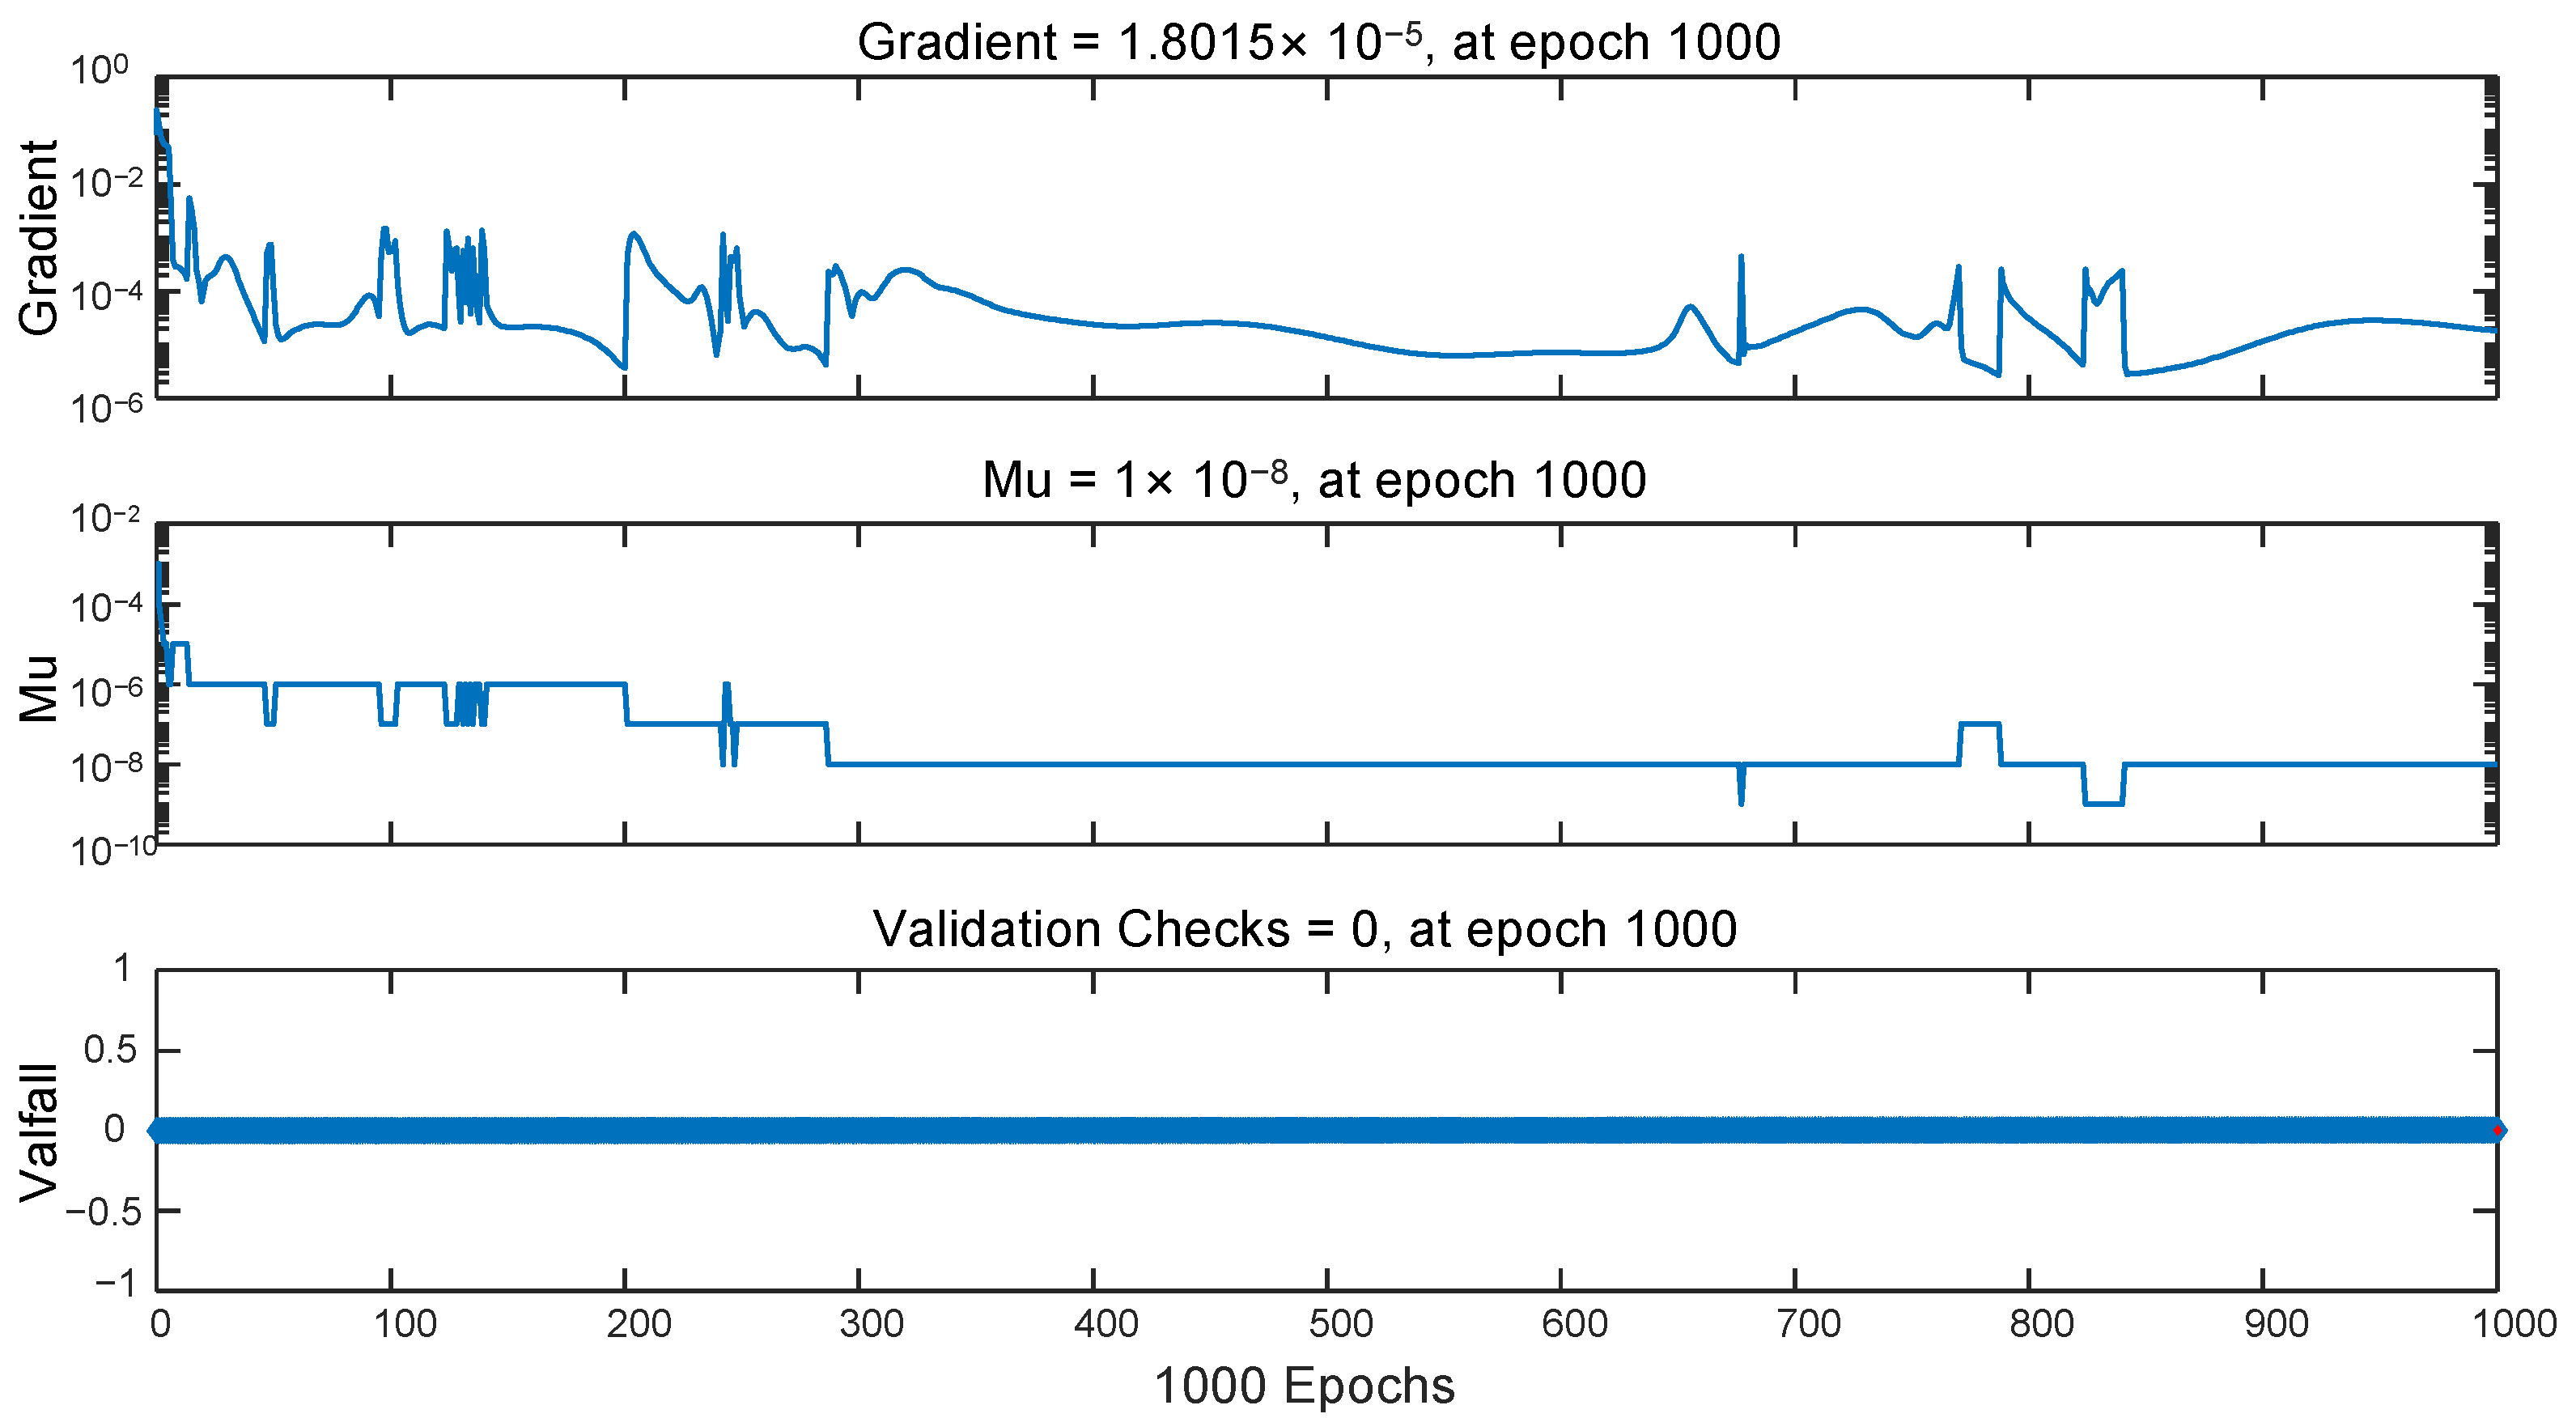
The maximum training times of the network were set to 1000 times with the target error tolerance of 0.01, the learning rate of 0.001, and the displayed interval times of 10. Figure 10 shows the training state based on the BP neural network.

4.2. Model Testing

Table 6 shows the testing results of the 10 cases by the trained model. The factors of safety predicted by the trained BP neural network were close to the ideal output values. The average relative error of 1.02% and the goodness of fitness of 0.999 for the BP model indicate a good prediction effect.
The trained BP neural network model was further used to predict the stability of the four physical model tests. Table 7 shows the predicted factors of safety for the model tests. It can be seen that the predicted safety factors of the four tests are all less than 1.1, indicating that the slope was under a critical state, which was consistent with the test.

5. Conclusions

This paper carried out a series of model tests under a plane strain condition to investigate the stability of high backfill slopes moisturized by rainfalls, considering the influences of rainfall duration and intensity. Based on the extended model cases, a BP neural network model was used to develop a prediction model considering the rainfall duration and intensity. Based on the test result and analyses, the following conclusions can be drawn:
  • The deformation of the slope increased sharply after reaching a certain surcharge. Increasing the rainfall intensity and duration made the lateral displacement of the slope become more significant, and reduced the stability of the backfill slope.
  • The moisture content was distributed almost parallel to the slope surface after rainfall. Increasing the rainfall intensity caused the soil near the slope surface to be saturated faster. All the slip planes were close to an arc-like sliding, but the rainfall influenced the sizes of the sliding mass.
  • Based on the calibrated model, a model base including 112 cases was established considering the factors of surcharge load, and rainfall intensity and duration. The BP neural network was adopted to build a model for predicting the stability of high backfill slopes under rainfall. The trained BP model shows the average relative error of 1.02% and the goodness of fitness of 0.999, indicating a good prediction effect.

Author Contributions

Conceptualization, Z.Z. and L.Q.; methodology, W.W.; formal analysis, W.W.; investigation, W.W.; resources, J.Z.; data curation, W.W.; writing—original draft preparation, L.Q.; writing—review and editing, Z.Z. and L.Q.; visualization, L.Q.; supervision, G.Y.; project administration, G.Y.; funding acquisition, G.Y. and Z.Z. All authors have read and agreed to the published version of the manuscript.

Funding

This research was funded by Shanghai Science and Technology Development Funds, Grant, No. 22ZR1466600, and the National Natural Science Foundation of China (NSFC), Grant Nos. 41972272 & 41772281.

Institutional Review Board Statement

Not applicable.

Informed Consent Statement

Not applicable.

Data Availability Statement

The data that support the findings of this study are available from the corresponding author, Liangkai Qin, upon reasonable request.

Acknowledgments

The authors appreciate the financial support provided by the Shanghai Science and Technology Development Funds (Grant Nos. 22ZR1466600) and the National Natural Science Foundation of China (NSFC) (Grant Nos. 41972272 & 41772281).

Conflicts of Interest

The authors declare no conflict of interest. The funder had no role in the design of the study; in the collection, analyses, or interpretation of data; in the writing of the manuscript; or in the decision to publish the results.

References

  1. Luo, L.; Guo, W.Z.; Tian, P.; Liu, Y.L.; Wang, S.K.; Luo, J.W. Unique landslides (loess slide-flows) induced by an extreme rainstorm in 2018 on the Loess Plateau: A new geological hazard and erosion process. Int. J. Sediment Res. 2023, 38, 228–239. [Google Scholar] [CrossRef]
  2. Wu, X.Z.; Ma, C.Z.; Wang, R.K.; Li, W.C. Development of environmental contours from rainfall intensity and duration data for slopes. Nat. Hazards 2022, 116, 1001–1027. [Google Scholar] [CrossRef]
  3. Kaihara, S.; Tadakuma, N.; Saito, H.; Nakaya, H. Influence of below-threshold rainfall on landslide occurrence based on Japanese cases. Nat. Hazards 2022, 115, 2307–2332. [Google Scholar] [CrossRef]
  4. Huang, L.; Liu, J.; Zhang, F.; Dontsov, E.; Damjanac, B. Exploring the influence of rock inherent heterogeneity and grain size on hydraulic fracturing using discrete element modeling. Int. J. Solids Struct. 2019, 176–177, 207–220. [Google Scholar] [CrossRef]
  5. Vanapalli, S.K.; Fredlund, D.G.; Pufahl, D.E.; Clifton, A.W. Model for the prediction of shear strength with respect to soil suction. Can. Geotech. J. 1996, 33, 379–392. [Google Scholar] [CrossRef]
  6. Liu, X.X.; Xia, Y.Y.; Cai, J.J.; Ning, Q.Y.; Chen, X.Y. Study on stability of high-filled embankment slope of highly weathered soft rock under rainfall infiltration. Rock Soil Mech. 2007, 28, 1705–1709. [Google Scholar] [CrossRef]
  7. Kim, J.; Kim, Y.; Jeong, S.; Hong, M. Rainfall-induced landslides by deficit field matric suction in unsaturated soil slopes. Environ. Earth Sci. 2017, 76, 808. [Google Scholar] [CrossRef]
  8. Huang, L.; He, R.; Yang, Z.; Tan, P.; Chen, W.; Li, X.; Cao, A. Exploring hydraulic fracture behavior in glutenite formation with strong heterogeneity and variable lithology based on DEM simulation. Eng. Fract. Mech. 2023, 278, 109020. [Google Scholar] [CrossRef]
  9. Qin, P.P.; Huang, B.L.; Li, B.; Chen, X.T.; Jiang, X.N. Hazard analysis of landslide blocking a river in Guang’an Village, Wuxi County, Chongqing, China. Landslides 2022, 19, 2775–2790. [Google Scholar] [CrossRef]
  10. Zhang, S.; Zhang, X.C.; Pei, X.J.; Wang, S.Y.; Huang, R.Q.; Xu, Q.; Wang, Z.L. Model test study on the hydrological mechanisms and early warning thresholds for loess fill slope failure induced by rainfall. Eng. Geol. 2019, 258, 105135. [Google Scholar] [CrossRef]
  11. Crosta, G.B.; Frattini, P. Distributed modelling of shallow landslides triggered by intense rainfall. Nat. Hazards Earth Syst. Sci. 2003, 3, 81–93. [Google Scholar] [CrossRef] [Green Version]
  12. Jiang, Q.Q.; Jiao, Y.Y.; Song, L.; Wang, H.; Xie, B.T. Experimental study on reservoir landslide under rainfall and water-level fluctuation. Rock Soil Mech. 2019, 40, 104630. [Google Scholar] [CrossRef]
  13. Chueasamat, A.; Hori, T.; Saito, H.; Sato, T.; Kohgo, Y. Experimental tests of slope failure due to rainfalls using 1g physical slope models. Soils Found. 2018, 58, 290–305. [Google Scholar] [CrossRef]
  14. Sun, S.W.; Liu, L.; Hu, J.B.; Ding, H. Failure characteristics and mechanism of a rain-triggered landslide in the northern longwall of Fushun west open pit, China. Landslides 2022, 19, 2439–2458. [Google Scholar] [CrossRef]
  15. Wu, L.Z.; Zhou, Y.; Sun, P.; Shi, J.S.; Liu, G.G.; Bai, L.Y. Laboratory characterization of rainfall-induced loess slope failure. Catena 2016, 150, 1–8. [Google Scholar] [CrossRef]
  16. Li, Q.Q.; Huang, D.; Pei, S.F.; Qiao, J.P.; Wang, M. Using Physical Model Experiments for Hazards Assessment of Rainfall-Induced Debris Landslides. J. Earth Sci. 2021, 32, 1113–1128. [Google Scholar] [CrossRef]
  17. Rahimi, A.; Rahardjo, H.; Leong, E.C. Effect of Antecedent Rainfall Patterns on Rainfall-Induced Slope Failure. J. Geotech. Geoenvironmental Eng. 2011, 137, 483–491. [Google Scholar] [CrossRef]
  18. Tang, D.; Li, D.Q.; Zhou, C.B.; Phoon, K.K. Slope stability analysis considering antecedent rainfall process. Rock Soil Mech. 2013, 34, 3239–3248. [Google Scholar] [CrossRef]
  19. Leshchinsky, B.; Vahedifard, F.; Koo, H.B.; Kim, S.H. Yumokjeong Landslide: An investigation of progressive failure of a hillslope using the finite element method. Landslides 2015, 12, 997–1005. [Google Scholar] [CrossRef]
  20. Vickneswaran, T.; Ravichandran, N. Stability and deformation responses of earth slopes subjected to multiple natural and manmade hazards. Int. J. Geomech. 2022, 22, 04021304. [Google Scholar] [CrossRef]
  21. Liu, X.; Wang, Y. Probabilistic simulation of entire process of rainfall-induced landslides using random finite element and material point methods with hydro-mechanical coupling. Comput. Geotech. 2021, 132, 103989. [Google Scholar] [CrossRef]
  22. Tozato, K.; Dolojan, N.; Touge, Y.; Kure, S.; Moriguchi, S.; Kawagoe, S.; Kazama, S.; Terada, K. Limit equilibrium method-based 3D slope stability analysis for wide area considering influence of rainfall. Eng. Geol. 2022, 308, 106808. [Google Scholar] [CrossRef]
  23. Yan, Y.J.; Cheng, A.P.; Li, J.; Dong, F.S.; Dai, S.Y. Mechanical parameter inversion and long-term stability prediction of railway high slope based on monitoring data. J. Railw. Sci. Eng. 2020, 17, 2516–2528. [Google Scholar] [CrossRef]
  24. Zhou, J.F.; Qin, C.B. Stability analysis of unsaturated soil slopes under reservoir drawdown and rainfall conditions: Steady and transient state analysis. Comput. Geotech. 2022, 142, 104541. [Google Scholar] [CrossRef]
  25. Bordoni, M.; Galanti, Y.; Bartelletti, C.; Persichillo, M.G.; Barsanti, M.; Giannecchini, R.; Avanzi, G.D.A.; Cevasco, A.; Brandolini, P.; Galve, J.P.; et al. The influence of the inventory on the determination of the rainfall-induced shallow landslides susceptibility using generalized additive models. Catena 2020, 193, 104630. [Google Scholar] [CrossRef]
  26. Zhou, J.W.; Cui, P.; Hao, M.H. Comprehensive analyses of the initiation and entrainment processes of the 2000 Yigong catastrophic landslide in Tibet, China. Landslides 2016, 13, 39–54. [Google Scholar] [CrossRef]
  27. Mayoraz, F.; Vulliet, L. Neural networks for slope movement prediction. Int. J. Geomech. 2002, 2, 153–173. [Google Scholar] [CrossRef]
  28. Du, J.; Yin, K.L.; Lacasse, S. Displacement prediction in colluvial landslides, Three Gorges Reservoir, China. Landslides 2013, 10, 203–218. [Google Scholar] [CrossRef]
  29. Liu, Z.B.; Shao, J.F.; Xu, W.Y.; Chen, H.J.; Shi, C. Comparison on landslide nonlinear displacement analysis and prediction with computational intelligence approaches. Landslides 2014, 11, 889–896. [Google Scholar] [CrossRef]
  30. Cao, Y.; Yin, K.L.; Alexander, D.E.; Zhou, C. Using an extreme learning machine to predict the displacement of step-like landslides in relation to controlling factors. Landslides 2016, 13, 725–736. [Google Scholar] [CrossRef]
  31. Chen, W.; Xie, X.S.; Wang, J.L.; Pradhan, B.; Hong, H.Y.; Bui, D.T.; Duan, Z.; Ma, J.Q. A comparative study of logistic model tree, random forest, and classification and regression tree models for spatial prediction of landslide susceptibility. Catena 2017, 151, 147–160. [Google Scholar] [CrossRef] [Green Version]
  32. Leonarduzzi, E.; Molnar, P.; Mcardell, B.W. Predictive performance of rainfall thresholds for shallow landslides in Switzerland from gridded daily data. Water Resour. Res. 2017, 53, 6612–6625. [Google Scholar] [CrossRef] [Green Version]
  33. Matias, A.; Coelho, R.; Andrade, J.S., Jr.; Araujo, N. Flow through time-evolving porous media: Swelling and erosion. J. Comput. Sci. 2021, 53, 101360. [Google Scholar] [CrossRef]
  34. Casagrande, A. The determination of the preconsolidation load and its practical significance. In Proceedings of the 1st International Conference on Soil Mechanics and Foundation Engineering, Cambridge, MA, USA, 22–26 June 1936; Volume 3, pp. 60–64. [Google Scholar]
  35. Panda, S.; Panda, G. Performance evaluation of a new bp algorithm for a modified artificial neural network. Neural Process. Lett. 2020, 51, 1869–1889. [Google Scholar] [CrossRef]
  36. Monjo, R. Measure of rainfall time structure using the dimensionless n-index. Clim. Res. 2016, 67, 71–86. [Google Scholar] [CrossRef] [Green Version]
Figure 1. Setup of the model test: (a) plane view; and (b) cross section (unit: mm).
Applsci 13 04218 g001
Figure 2. Variation of vertical displacement on the top of slope with the applied load.
Applsci 13 04218 g002
Figure 3. Variation of lateral displacement of the slope with its vertical displacement.
Applsci 13 04218 g003
Figure 4. Relationship between the increment of earth pressure and the surcharge load: (a) S6; and (b) S7.
Applsci 13 04218 g004aApplsci 13 04218 g004b
Figure 5. The surcharge load corresponds to the peak earth pressure.
Applsci 13 04218 g005
Figure 6. Contour of mass moisture content in the backfill slope: (a) T-2; (b) T-3; and (c) T-4.
Applsci 13 04218 g006
Figure 7. The moisture content of profile at the height of 25.0.
Applsci 13 04218 g007
Figure 8. Contour of shear strain in the backfill slope: (a) T-1; (b) T-2; (c) T-3; and (d) T-4 (unit: %).
Applsci 13 04218 g008
Figure 9. BP neural network structure.
Applsci 13 04218 g009
Figure 10. Training state.
Applsci 13 04218 g010
Table 1. Physical–mechanical properties of the artificial soil.
w, %γ, kN/m3c, kPaϕ, °E, MPa
5%15.4422.331.15.6
15%16.9124.023.13.8
30%19.1114.77.02.9
Note: w is the water content, γ is the unit weight, c is the cohesion, ϕ is the friction angle, and E is the compressibility modulus.
Table 2. Test program.
NumberRainfall Intensity/mm/hRain Duration/h
T-1//
T-240.5
T-341
T-40.20.5
Table 3. The maximum displacement and shear strain at failure.
Test No.Horizontal Displacement/mmVertical Displacement/mmShear Strain/%
T-119181.4
T-250544.6
T-353574.8
T-446474.2
Table 4. Test results of numerical analysis.
Test No.Horizontal Displacement/mmVertical Displacement/mmFactor of Safety
T-118.0/19.0 *22.2/18.0 *1.117
T-256.6/50.0 *58.4/54.0 *1.080
T-361.8/53.0 *59.4/57.0 *1.044
T-449.6/46.0 *50.9/47.0 *1.053
Note: * denotes the data of the model test.
Table 5. Numerical model base.
Case No.Rain Duration/hRainfall Intensity/mm/hSurcharge/kPa
1–160/0.5/1/1.5/2/2.5/3/3.5/4/4.5/5/5.5/6/6.5/7/7.5/80.65100
17–280/0.5/1/1.5/2/2.5/3/3.5/6/7.5/8/8.5/90.65300
29–370/1/1.5/2/2.5/3/3.5/4/4.52.0300
38–420/0.5/1/1.5/2/2.54.0300
43–480/0.5/1/1.5/2/2.5/36.550
49–540/0.5/1/1.5/2/2.5/36.5100
55–570/0.5/16.5200
58–680/0.5/1/1.5/2/2.5/3/3.5/4/4.5/5.52.0200
69–770/0.5/1/1.5/2/2.5/3/3.5/42.0100
78–860/0.5/1/2/2.5/3/3.5/4/4.52.050
87–1020/0.5/1/1.5/2/3/3.5/4/4.5/5/5.5/6/6.5/7/7.5/80.6550
10320.65100
10470.65300
105–1060.52.0/4.0300
10704.050
108–1091.54.050/100
11052.0200
1111.52.050
1122.50.6550
Table 6. Prediction results of BP neural network model.
NumberPredictive ValueOutput ValueRelative Errors/%
11.51471.54982.26
20.90190.90130.07
30.92520.92730.23
40.92520.92130.42
52.42102.42480.16
61.52831.49812.02
71.05761.04211.49
81.04241.04280.04
92.34012.35280.54
102.30492.37643.01
Table 7. Safety factor prediction results of the model tests.
TestT-1T-2T-3T-4
Prediction result1.1081.0901.0601.045
Disclaimer/Publisher’s Note: The statements, opinions and data contained in all publications are solely those of the individual author(s) and contributor(s) and not of MDPI and/or the editor(s). MDPI and/or the editor(s) disclaim responsibility for any injury to people or property resulting from any ideas, methods, instructions or products referred to in the content.

