Article

Research on Truck Lane Management Strategies for Platooning Speed Optimization and Control on Multi-Lane Highways

1
School of Transportation, Southeast University, Nanjing 211189, China
2
Planning Research Center, Jiangsu Provincial Department of Transportation, Nanjing 210000, China
*
Author to whom correspondence should be addressed.
Appl. Sci. 2023, 13(6), 4072; https://doi.org/10.3390/app13064072
Submission received: 5 November 2022 / Revised: 22 January 2023 / Accepted: 28 January 2023 / Published: 22 March 2023
(This article belongs to the Special Issue Novel Methods and Technologies for Intelligent Vehicles)

Abstract

:
Automated truck platooning has become an increasingly popular research subject, and its applicability to highways is considered one of the earliest possible landing scenarios for automated driving. However, there is a lack of research regarding the combination of truck platooning technology and truck lane management strategy on multilane highways in the environment of a cooperative vehicle–infrastructure system (CVIS). For highway weaving sections under the CVIS environment, this paper proposes a truck platooning optimal speed control model based on multi-objective optimization. Through a combination of model predictive control and the cell transmission model, this approach considers the bottleneck cell traffic flow, overall vehicle travel time, and truck platooning fuel consumption as objectives. By conducting experiments on a mixed traffic flow simulation platform, the multi-lane management strategies and optimal speed control effect were evaluated through different scenarios. This study also determined the appropriate proportion of truck platooning for an exclusive lane and to increase truck lanes, thus providing effective lane management decision support for highway managers.

1. Introduction

Platoon refers to autonomous vehicles that travel compactly and steadily with a short inter-vehicle distance. Because platooning technology enables the vehicles to maintain high speeds with less aerodynamic drag, the improvement is noticeable, especially for heavy-duty trucks [1,2]. Truck platooning, which is mostly employed for long-distance transportation on highways, is considered one of the most promising scenarios for the early commercial application of vehicle automation on open roads. Therefore, research on truck platooning technology has recently become a central focus of scholars in the field of automated driving. Truck platooning can avoid the slow response times and operational errors associated with human drivers, thus improving the safety of highway traffic. Because trucks in platooning systems can be driven with minimal vehicle spacing, the approach may help improve highway capacity, reduce fuel consumption and the operation costs of trucks, and improve the road environment and air quality [3,4,5,6].
With the aid of Vehicle-to-Vehicle communication [7] and Cooperative Adaptive Cruise Control [8], truck platooning systems and pioneering projects such as SARTRE [9], GCDC [10], Energy ITS [11] and ENSEMBLE [12] have shown pronounced benefits, including higher safety, better energy consumption, and greater comfort. Truck platooning studies generally establish a hierarchical control method with two levels of platooning: platooning control and platooning coordination [13]. The optimal objectives are the combination of vehicle speed, fuel economy, and instantaneous stability [14,15,16,17]. The management of truck platoons can not be isolated from the actual environment and traffic dynamics [18]; thus, vehicle–infrastructure cooperation or global traffic optimization must necessarily be involved. Previous studies have combined truck platooning with road traffic flow states, analyzed the optimal control of truck platooning, improved bottleneck congestion as the optimization goal [19,20,21], and studied the formation, maintenance or separation strategy of truck platooning in special conditions of mixed traffic flow [22,23].
From the perspective of the traffic authority, platooning systems shall ensure efficient traffic operations at the macro level. However, there has been an insufficient amount of research conducted on the combination of truck platooning and truck lane management strategies for multilane highways. Existing truck lane management studies on highways largely examined how to set up lanes for autonomously driven trucks through a simulation platform to ensure traffic safety and improve traffic efficiency [24,25,26]. In general, research pertaining to truck platooning oriented toward vehicle–infrastructure cooperation and traffic flow optimization, as well as truck-lane management strategies on multilane highways, needs to be further strengthened.
This study established a multi-objective optimization truck platooning method for optimal speed control that considers global transportation optimization at the bottleneck, as well as individual energy consumption, for connected automated vehicle highways. In the process of this study, several truck lane management strategies were examined. Accordingly, this paper analyzes their influence on highway traffic and suggests additional approaches for highway management. The contributions of this study include: (1) A speed control model for truck platooning based on a multi-objective optimization, with the combination of macro-traffic flow optimization and energy consumption of automated trucks under the vehicle–infrastructure collaborative environment; (2) Targeting the management requirements of truck platooning technology in multilane highways under the CVIS environment, a set of truck lane management strategies for traffic efficiency and safety in the weaving section was proposed, thus providing decision-making support for highway lane management and traffic operations.

2. Truck Platooning Speed Control Based on Multi-Objective Optimization

In a CVIS environment, an intelligent roadside system can access real-time traffic states using roadside sensors and detectors. Accordingly, traffic flow models have been adopted to predict future traffic states. Through the collaborative planning of truck platooning speeds by means of an exchange of information between intelligent roadside systems and truck platooning, traffic efficiency can be improved. This study focuses on the on- and off-ramp weaving sections of highways. The vehicle speed of the truck platooning upstream at the highway mainline is adjusted in advance to relieve or dissipate traffic congestion. In this study, model predictive control (MPC) and a cell transmission model (CTM) were used to predict the traffic flow states of highways, and truck platooning speed was optimized using a non-dominated sorting genetic algorithm. The algorithm’s underlying elite strategy considers the maximum bottleneck cell traffic flow, minimum traffic time of all vehicles on the road, and minimum fuel consumption of truck platooning as optimization objectives.

2.1. Model Construction Based on Model Predictive Control

MPC is a control algorithm based on a predictive model, wherein the current state and future control quantity of the system are taken as inputs to obtain the system’s future output, and the optimal control quantity in the predictive time domain is calculated by combining the control objectives. The algorithm comprises four stages: model prediction, effect evaluation, rolling optimization, and feedback correction. In model prediction, CTMs are employed to calculate the boundary traffic of each section.

2.1.1. Improved Cell Transmission Model

The CTM is a type of macroscopic traffic flow model that is used to describe changes in road traffic conditions. The model divides the road into several cells and predicts their densities to calculate the current input and output flow between cells, detect the flow of input, and update the subsequent state values, such as speed and density.
A variable speed limit is typically used to optimize speed in the on- and off-ramp weaving sections of highways. Combined with the CTM, a variable speed limit was used to control the upstream bottleneck cell speed to relieve congestion. However, due to the general nature of variable speed limit control, it cannot be ensured that human drivers who enter its range will comply with speed limit requirements.
Based on this idea, the speed control of truck platooning in the weaving section can affect the downstream traffic flow state where the traffic capacity decreases. In contrast to the variable speed limit strategy, truck platooning speed control yields a higher compliance rate. In addition, the control range of truck platooning varies depending on location.
In this study, when the downstream cell density was predicted to exceed the critical density, truck platooning speed control was performed. Based on prior research [10], this study comprehensively considers the speed of lanes in the presence and absence of truck platooning.
Assume that in the t-th time interval, the speed of truck platooning is controlled according to v p t , the speed of the corresponding cell is v p t , the corresponding density is ρ p t , and the critical density is ρ c p . ω indicates the propagation speed of congestion wave. As shown in the basic diagram, the critical density is calculated as follows:
ρ c p = ω ρ j a m ω + v p t
The maximum capacity of a single lane is obtained by the following formula:
Q m p = v p t ρ c p
The calculation formulas for demand flow D i t and supply flow S i t of the cell corresponding to truck platooning control are:
D i t = m i n v i t ρ i t n i Δ t , Q m p n i Δ t
S i + 1 t = m i n ρ j a m ρ i t ω n i Δ t , Q m p n i Δ t
where, v i t is the density of cell i in the t-th interval. The respective adjusted formula for speed within the cell is, then:
v i t = m i n v f , v p t ρ i t ρ c p ρ j a m ρ i t ω ρ i t ρ i t > ρ c p
where, v f represents free-flow velocity. This study predicts the control module, CTM state quantity (that is, whether the input quantity is the current cell density), ρ i t , cell speed v i t , inter-cell transmission flow q i t , input flow of the main lane and on-ramp, location of truck platooning, and truck platooning speed v p t . The predictive quantity—that is, the output quantity—comprises the density, speed of each cell, inter-cell flow, and location of truck platooning in the forecast period.

2.1.2. Control Cell Analysis

(1)
Calculation of platooning position
Within the proposed method, downstream traffic congestion is relieved by controlling the speed of truck platooning, represented by the speed of the cell where the truck platooning is located. Because the truck platooning process is dynamic, its location also changes continuously. Therefore, when carrying out MPC, it is necessary to predict the location at each successive moment. The following formula is used to achieve this:
x p t + 1 = x p t + v p t + 1 t
where, x p t is the current position of truck platooning in the road network, x p t + 1 represents the position of truck platooning in the subsequent moment, v p t + 1 denotes the truck platooning speed during the predicted time interval, and the speed of the truck remains constant.
x c e l l p t + 1 = x p t + 1 L
Here, x c e l l p t + 1 represents the predicted location (that is, the cell where truck platooning is located at the next moment) and L represents the cell’s length.
(2)
Single-bottleneck control cell analysis
Specifically, x p t represents the instantaneous position of truck platooning in the road network at the end of the t-th time interval. The cells that were controlled in this study include all cells within the interval x c e l l p t , x c e l l p t + 1 . Within this interval, it is also necessary to consider the relationship between the locations of truck platooning and congestion (assuming m) to determine the cell that requires control.
1)
x c e l l p t m
When the above formula is satisfied, there is no need to control or predict the subsequent location of truck platooning.
2)
x c e l l p t < m
When the above formula is satisfied, only the cells in x c e l l p t , x c e l l p t + 1 < m are controlled.
(3)
Multi-bottleneck control cell analysis
Assume that there are two bottleneck cells m and n at the t-th time interval in the road network, and m < n.
1)
x c e l l p t n
When the above formula is satisfied, there is no need to control or predict the subsequent location of truck platooning.
2)
m xcell p t < n
When the above formula is satisfied, only the cells in m x c e l l p t , x c e l l p t + 1 < n are controlled, and the optimization objective is calculated with the object of n.
3)
x c e l l p t < m
When the above formula is satisfied, the cells in x c e l l p t , x c e l l p t + 1 < m are controlled, and the optimization objective is calculated with the object of m. The process then repeats for the interval m x c e l l p t , x c e l l p t + 1 < n and object of n.

2.2. Optimal Speed Computation Based on Multi-Objective Optimization

2.2.1. Objective Function

To optimize control speed, it is necessary to set the evaluation as an objective function. In the present study, truck platooning speed is considered the control object, aiming to relieve traffic congestion at the bottleneck from the perspective of road managers who seek to improve traffic efficiency and capacity. From the perspective of truck platooning vehicles, fuel consumption must be reduced. In this study, bottleneck cell traffic flow, overall vehicle travel time, truck platooning fuel consumption, and other factors were selected as functional objectives.
(1)
Bottleneck metacell traffic flow.
To alleviate congestion within the bottleneck cell, the objective is to maximize the cell’s traffic flow in the predicted time domain. The calculation formula is as follows:
k = t + 1 k = t + 4 v i k ρ i k n L t
(2)
Overall vehicle travel time.
To reduce vehicle travel time with the objective of minimizing total travel time in a predicted time domain, the calculation formula is as follows:
k = t + 1 k = t + 4 i = 1 i = N ρ i k n L t
where, N denotes the number of cells.
(3)
Truck platooning fuel consumption.
The objective is to minimize the fuel consumption of truck platooning in the predicted time domain from a fuel consumption and cost perspective. Prior studies analyzed the fuel calculation and calibrated the relationship between VSP distribution and vehicle fuel consumption by combining the former with real vehicle operation data [27,28]. The fuel consumption rates of specific truck models under the complete VSP interval were obtained via software analysis.
VSP refers to the instantaneous power of a motor vehicle per unit mass in kw / t . This value—which relates to vehicle speed, acceleration, road gradient, and other factors—can be used to calculate the fuel consumption. The formula for calculating VSP is
V S P = v a + g g r a d e + g C R + 1 2 ρ a C D A m v 3
where, v is the instantaneous vehicle speed in m / s ; a is the instantaneous acceleration in m / s 2 ; g is the acceleration of gravity in m / s 2 , equivalent to approximately 9.81; grade is the slope of the road in %; C R denotes the rolling resistance coefficient; ρ a denotes ambient air density; C D represents the air resistance coefficient; A denotes the transverse sectional area in m 2 ; and m represents the total mass of the vehicle in kg .
Different vehicle types have different calculated VSP parameters. The present study considered the test truck models used in a prior study [19,20], which are associated with the following VSP formula:
V S P = v a + 9.81 g r a d e + 0.09199 + 0.000169 v 3
The fuel consumption was obtained by introducing the calculated VSP value into the corresponding interval range in the table.
k = t + 1 k = t + 4 p = 1 p = m V S P v p m k t
where, m is the number of truck platoons. The cell where the truck platooning position x p k 1 is located at the end moment of the—(k − 1)th time interval is less than m.

2.2.2. Multi-Objective Speed Optimization

This paper proposes objective functions for bottleneck cell traffic flow, overall vehicle travel time, and truck platooning fuel consumption, where the former must be maximized, whereas the latter two must be minimized. To optimize the truck platooning control speed, each objective function can be weighted to convert the multi-objective optimization problem into a single-objective optimization problem. However, it is unclear how to reasonably determine the weights of specific objectives, or approach the magnitude between each objective. Instead, the non-dominated ranking genetic algorithm with elite strategy (NSGA-II) was employed to solve multi-objective optimization in this study.
Genetic algorithms, also known as simple genetic algorithms (SGAs), are on the basis of Darwinian evolutionary theory. An SGA is a type of stochastic global search optimization algorithm that takes all individuals in a population as the object, and starts from any initial population. Through random selection, crossover, and mutation operations, the algorithm generates a population group more adapted to the environment, and gradually evolves the population to a better region in the search space. Finally, it converges to a group of individuals that are most adapted to the environment through continuous reproduction and evolution, thus obtaining an optimal solution. The basic processes of genetic algorithms include chromosome encoding, generation of the initial population, calculation of the fitness value, genetic operator operation, and genetic termination.
An SGA can be represented as:
S G A = ( C ,   E ,   P 0 ,   M ,   ϕ ,   Γ ,   ψ ,   T )
where, C denotes the coding method for individuals, E denotes the individual fitness evaluation function, P 0 denotes the initial population, M denotes the population size, ϕ denotes the selection operator, Γ denotes the crossover operator, ψ denotes the variation operator, and T denotes the genetic termination condition.
Non-dominated sorting genetic algorithms (NSGAs) are an extension of SGAs using the concept of Pareto optimality. Typically, these algorithms yield an optimal solution set that is impossible to optimize further. Such a solution set is called a non-dominated or Pareto optimal solution set.
Unlike SGAs, NSGAs first compute and rank the dominant and non-dominant relationships among all individuals in a population, and then perform the genetic operation. The Pareto optimal solution set provides a non-inferior solution to the multi-objective optimization problem, and the decision maker must select a value from the set as the optimal solution through a method known as problem-specific analysis. In this study, the speed corresponding to the lowest overall vehicle travel time was selected as the optimal solution from the perspective of traffic efficiency.
Because NSGA algorithms typically entail high computational complexity and the loss of the best individual, this study adopted the non-dominated sorting genetic algorithm with elite strategy (NSGA-II). NSGA-II presents the following advantages: (1) a fast non-dominated sorting method, which reduces computational complexity; (2) a crowding degree and crowding degree comparison operator, which maintains population diversity; and (3) an elite strategy to expand the sampling space. In this study, key parameters of the NSGA-II are a population size of 100, and 200 termination iterations.

3. Analysis of the Lane Control Strategy Based on Truck Platooning Simulation

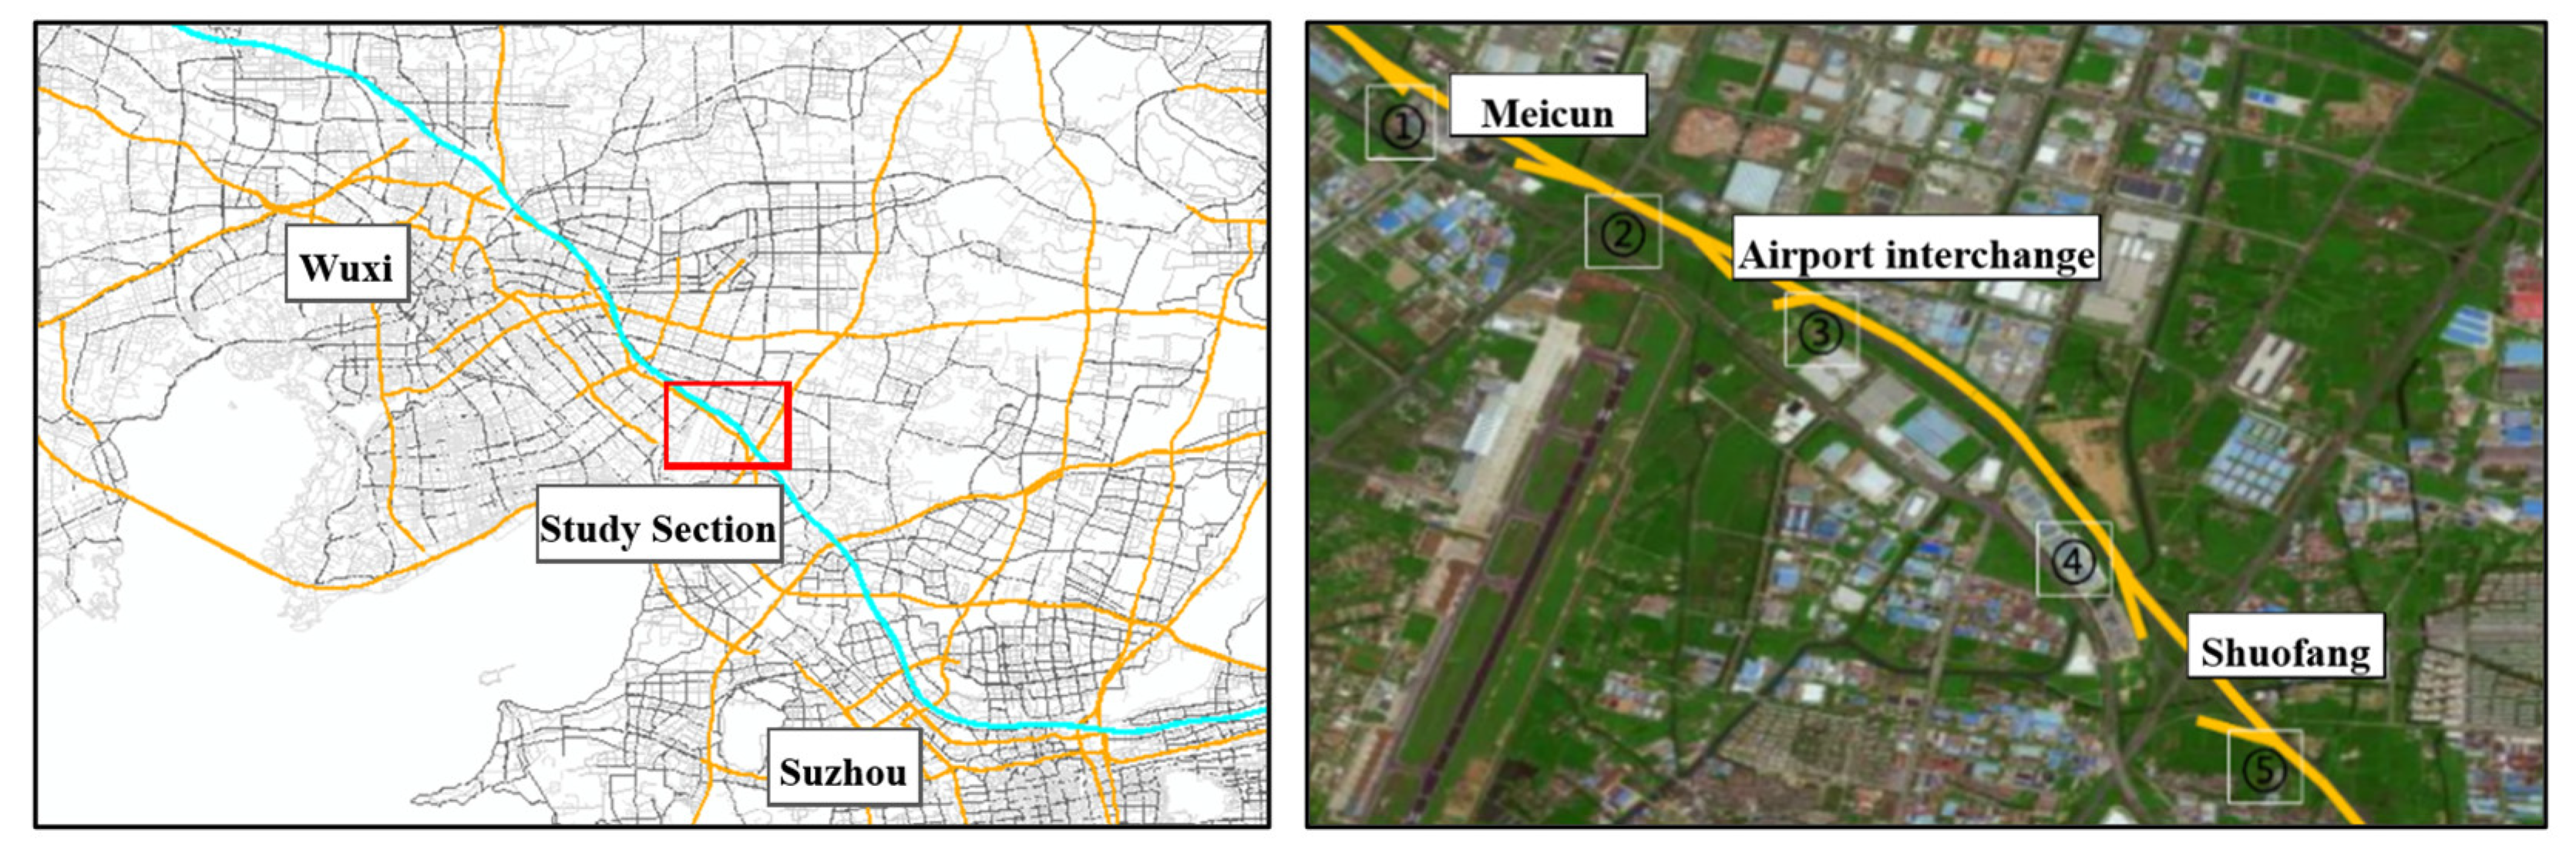
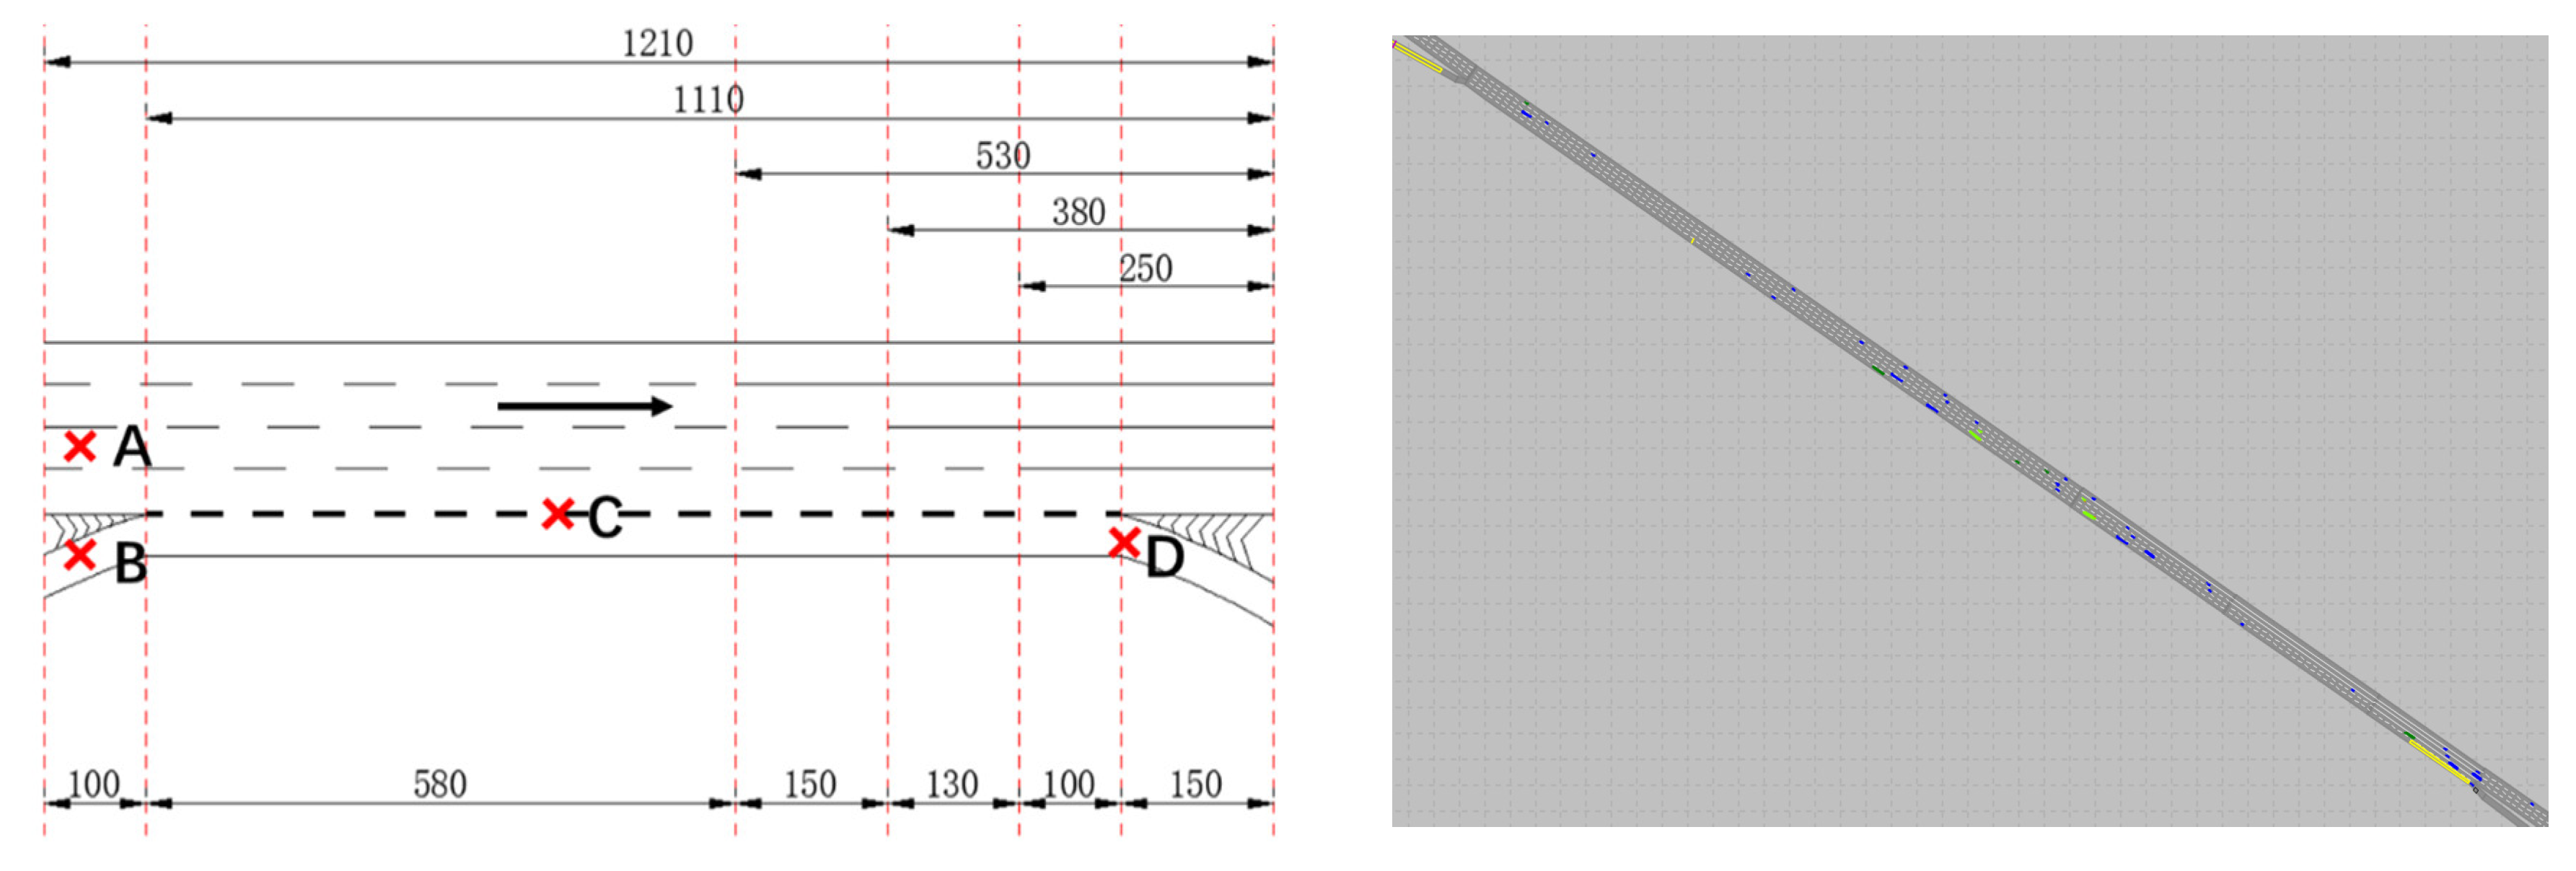
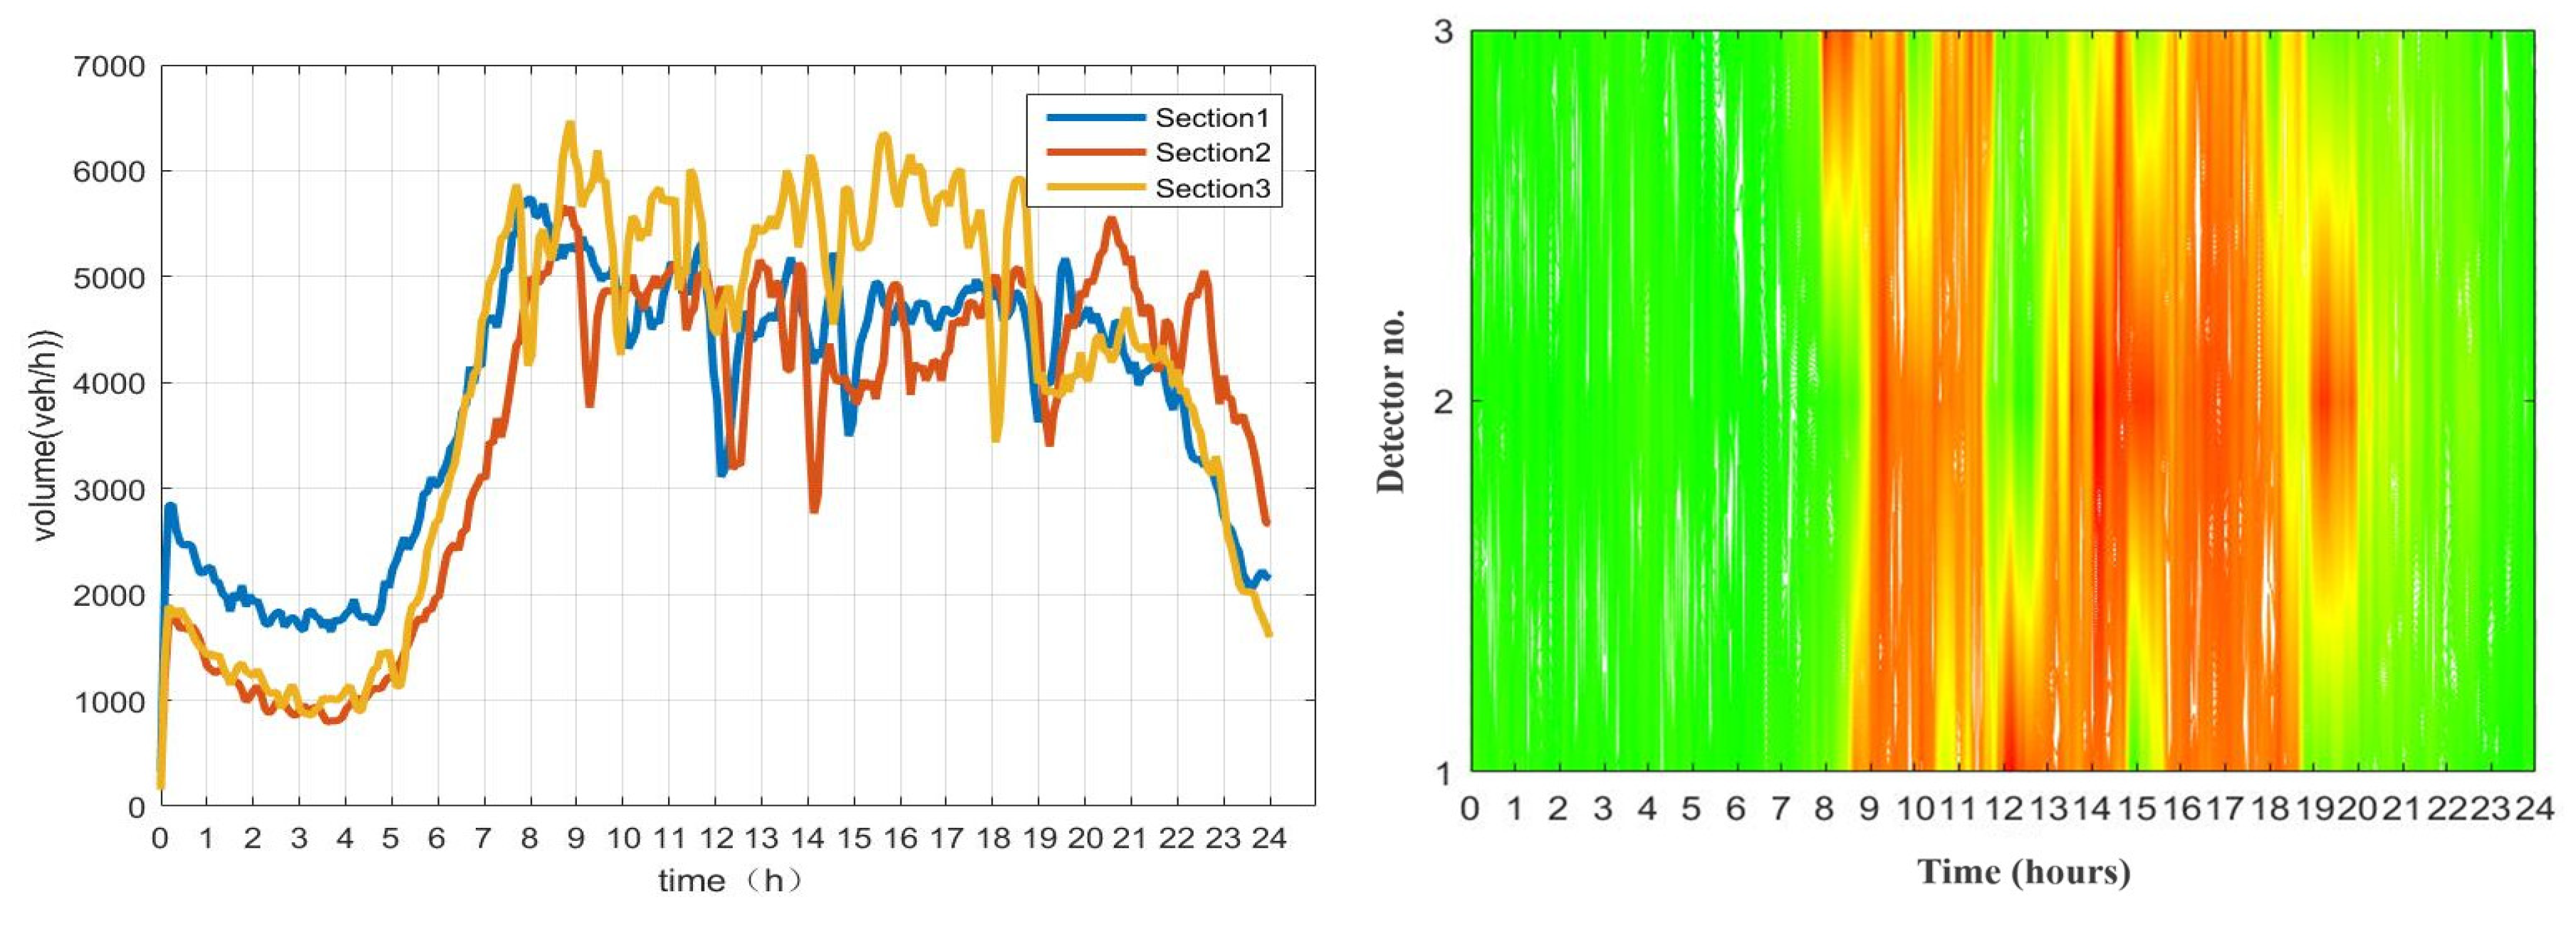
3.1. Simulation Platform Construction

The experiment conducted in this study encompassed approximately 8 km the Nanjing–Shanghai direction of the Wuxi section of the Nanjing–Shanghai Highway, which contains the Meicun service area, airport interchange, and Shuofang junction. The section includes two merging sections (③ and ⑤), two diverging sections (① and ④), and one weaving section (②), as shown in Figure 1.
The marking method between the lanes of the Nanjing-Shanghai Highway in the basic section is represented by a dotted line. The marking methods for the lanes in the weaving, merging, and diverging sections are different, with the former shown in Figure 2. The vehicles entering the left ramp of the weaving section are the off-ramp vehicles of the Meicun service area, whereas those entering the right ramp are the on-ramp vehicles of the airport interchange. Mainline and ramp traffic frequently intermingle in the weaving zone, which may lead to congestion and accidents. Traffic conflicts in the weaving zone include: (1) mainline vehicles slowing down before entering the weaving zone, and rear-end collisions with the vehicles behind them; (2) off-ramp vehicles slowing down before entering the weaving zone, and rear-end collisions with the vehicles behind them; (3) mainline vehicles weaving with off-ramp vehicles in the weaving zone, resulting in side impact collisions; and (4) on-ramp vehicles slowing down before entering the ramp, resulting in rear-end collisions with the vehicles behind them.
Traffic detectors are set on the main line in Meicun service area, airport interchange, and Shuofang junction as Section 1, Section 2 and Section 3. The cross-sectional flow and average speed of the road sections in the study area are illustrated in Figure 3. In general, the maximum hourly traffic volume did not exceed 7000 veh/n on the weekdays surveyed. Between 0:00 and 6:00, the hourly traffic volumes did not exceed 3000 veh/n. These values increased between 6:00 and 9:00, gradually approaching 6000 veh/n. Between 9:00 and 20:00, traffic volumes fluctuated between 4000 and 6000 veh/n. The section speed distribution is similar, with smooth traffic and high speeds between 0:00 and 6:00; a gradual decrease in speed between 6:00 and 9:00; and low speeds, high volumes, and relatively congested roads between 9:00 and 20:00.

3.1.1. Simulation Platform Construction

In this study, the driving behavior parameters of small cars and manually operated trucks were adjusted in the VISSIM simulation platform. A comprehensive evaluation function of model parameters related to traffic flow and speed was established to minimize the error between simulation outputs and actual surveyed figures. The corresponding values were also taken as driving behavior correction data. Subsequently, time-varying diagrams of traffic flow and speed distribution of the cross section obtained from the simulation were drawn. Corresponding parameters, such as flow rate and speed, were also set appropriately.
Traffic flow in VISSIM is measured in units of veh/h. The following seven traffic flows were employed: 1000, 2000, 3000, 4000, 5000, 6000, and 7000. CAR denotes ordinary cars, HDT represents manually operated trucks, and ATP (automated truck platform) refers to platooning trucks.
Based on actual road traffic and truck platooning information obtained in prior studies, the speed distributions of the three aforementioned vehicle types are listed in Table 1.

3.1.2. Simulation Evaluation Indicators

This study analyzed the traffic states of a road network under various simulation scenarios from the perspective of both traffic efficiency and safety, thus determining the parameters of each simulation scenario, as well as lane management methods, to provide road managers with decision-making information and alleviate traffic issues.
In general, truck-to-queue driving in the outside lane can easily produce a truck barrier phenomenon, especially in the weaving section. This phenomenon affects other vehicles, thus efficiently completing the weaving process. Therefore, delay was selected as the evaluation index of passage efficiency. Delay represents the difference between the actual travel time through the road section, and the corresponding ideal travel time.
This study also analyzed traffic safety from the perspective of conflicts. A non-accident indirect method of evaluating traffic safety was employed to analyze the spatial and temporal proximity between traffic entities. If a vehicle does not take appropriate actions, such as changing direction, changing speed, or stopping, a collision may occur. In this study, emergency braking in simulation (BREMSAX) was employed to analyze traffic conflicts. BREMSAX indicates emergency braking of a vehicle when the distance between it and the vehicle in front is less than the safe distance in VISSIM.

3.2. Analysis of the Lane Control Strategy

Based on the highway truck lane restriction management strategy, this study investigated the conditions of truck platooning on exclusive lanes, and the effect of optimal speed control in the weaving section. Two representative scenarios were accordingly analyzed.
Scenario I: The existing lane management method of the Nanjing–Shanghai highway is employed for the two outer lanes, i.e., the third and the fourth lanes. Thus the outermost fourth lane was selected as the exclusive lane for truck platooning, and the number of lanes designated for manual vehicle operation is reduced from four to three. Scenario I analyzes the impact of self-driving truck platooning in the weaving zone. Two comparative analyses were conducted: ① comparison between opening and not opening the second lane for HDT driving under the lane dedicated to truck platooning; ② comparison between truck platooning in the form of a queue, and that in the form of separation (a separated distance between each two trucks), when passing through the weaving zone of ramps under the lane dedicated to truck platooning. Both analyses examined overall traffic efficiency and safety.
Scenario II: This scenario aims improve traffic conditions of the highway bottleneck area, combined with the prior analysis of optimal speed control for truck platooning. Based on CVIS technology and the real-time acquisition of road traffic flow information, the optimal speed of truck platooning was obtained through the CTM, MPC, and multi-objective solution. Scenario II was subsequently set up to analyze the impact of optimal speed control with and without truck platooning under the dedicated lane strategy.
For Scenarios I and II, the lanes that can be operated by different vehicle types are listed in Table 2.
When the truck platooning lane is set up, the outermost exclusive lane on the basic section is reserved for truck platooning. However, this lane is shared with other vehicles in all other road sections. The flow rate input in the simulation was 1000 veh/h, with a minimum of 1000 veh/h and maximum of 7000 veh/h. The proportions of trucks to total traffic were set to 5%, 10%, 15%, and 20%, and the proportions of truck platooning to overall truck traffic were 10%, 30%, and 50%.

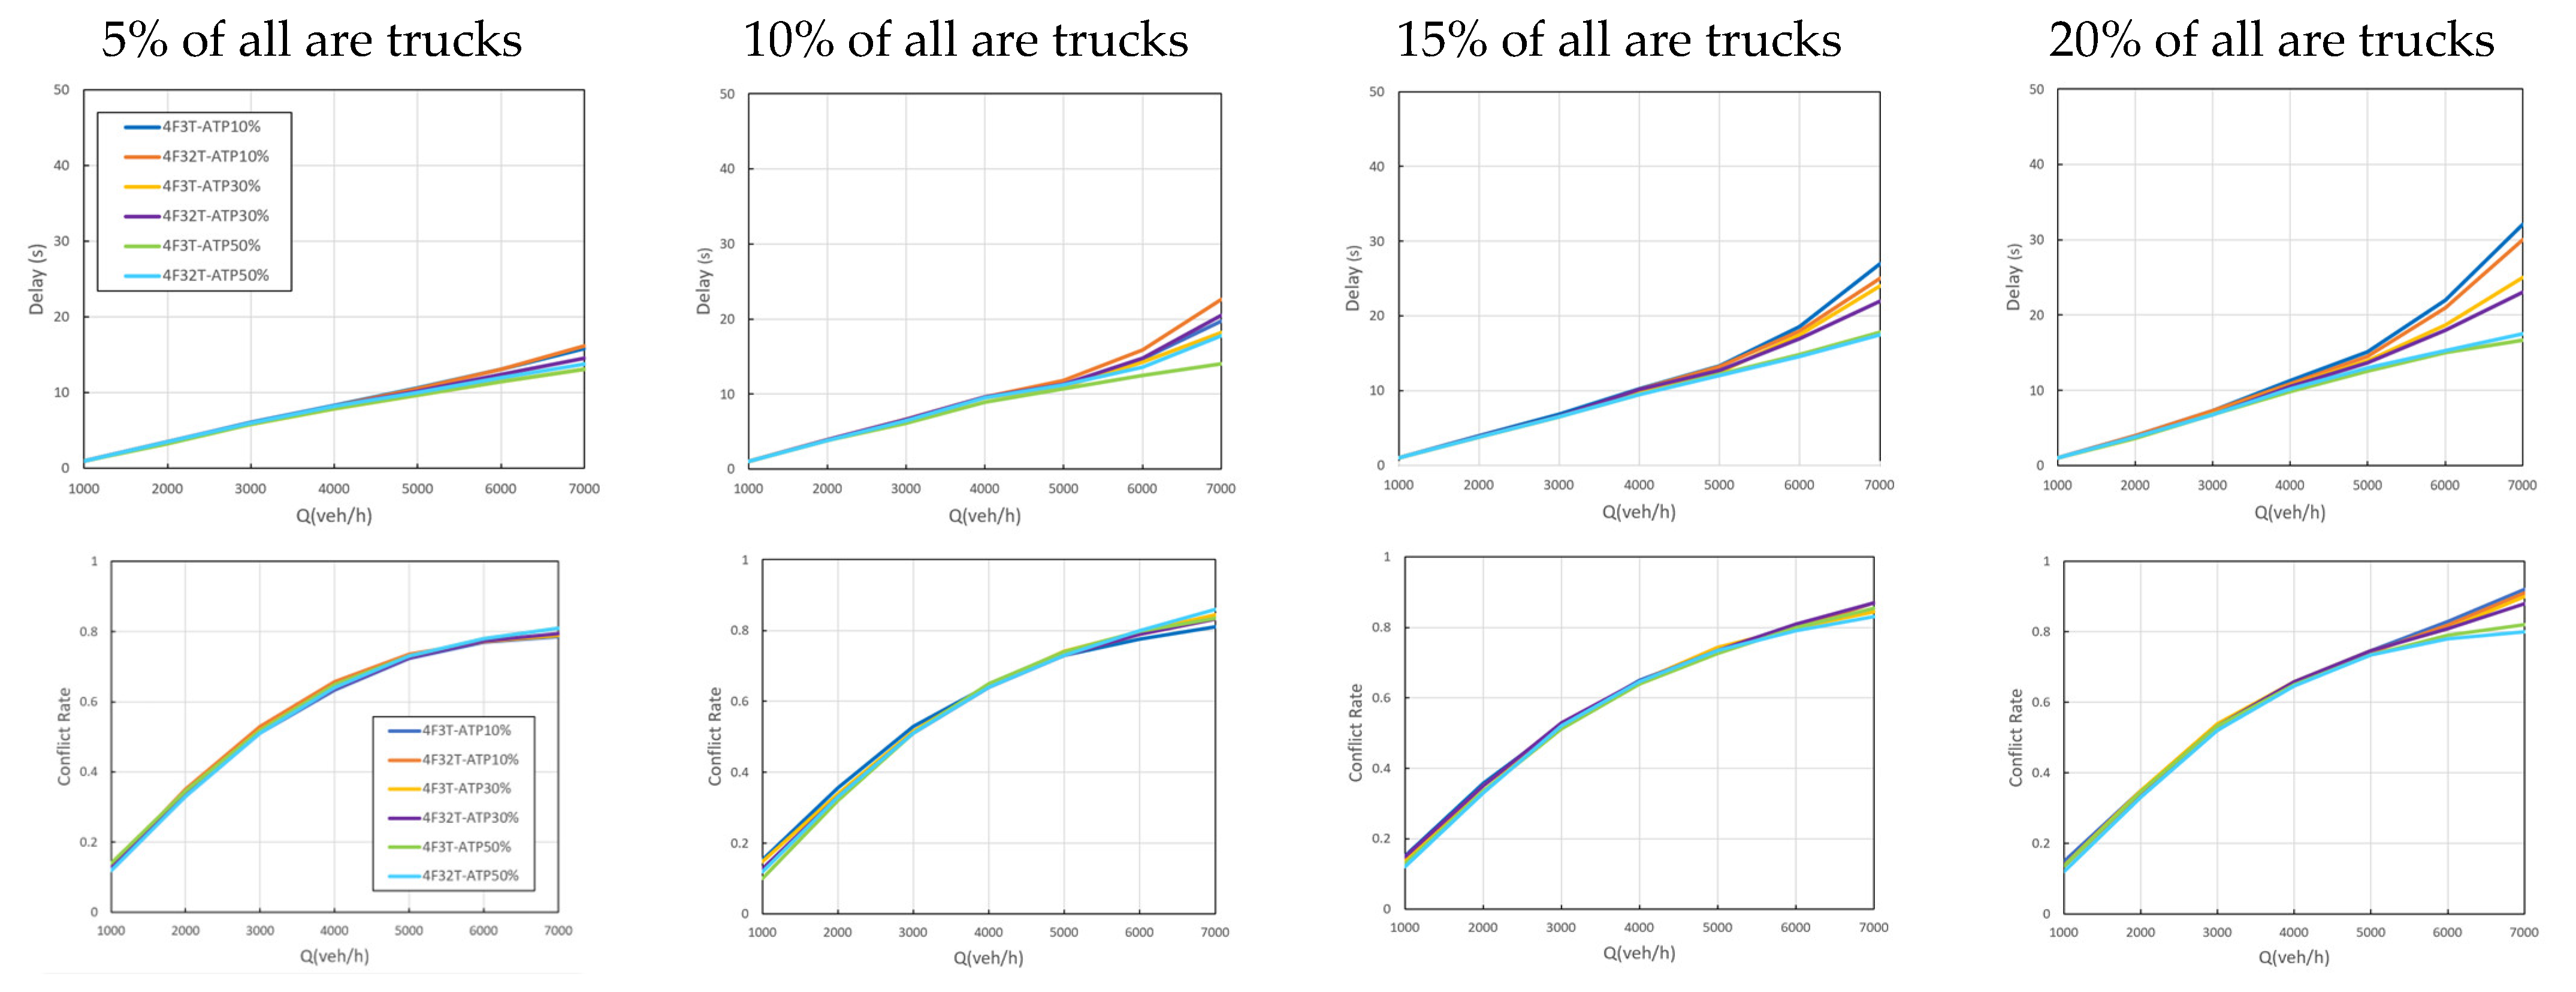
3.2.1. Analysis of Exclusive Lanes for Truck Platooning

Scenario Ⅰ investigates whether truck platooning passes through the weaving section, and whether the second lane is open for HDT in the presence of an exclusive lane for truck platooning. Figure 4 and Figure 5 show the corresponding simulation results. 4F3T indicates that the fourth lane is exclusive for truck platooning, and the third lane is open for HDT driving; 4F32T indicates that the fourth lane is exclusive for truck platooning, and the second and third lanes are open for HDT driving.
(1)
Truck platooning in the queue phase through the weaving section
Figure 4 illustrates a comparison of the delay and conflict rates with respect to HDT on the second lane when truck platooning in the queue phase passes through the weaving section on an exclusive lane. Each column in Figure 4 represents the proportion of trucks in the total traffic flow. Here, ATP indicates automated truck platooning, with the corresponding percentage denoting the amount of automated trucks compared to the overall truck traffic.
It is apparent that the 4F3T strategy incurs smaller delays than the 4F32T strategy under the same conditions, with truck traffic volumes of 5%, 10%, and 15%. Conversely, the 4F32T strategy exhibits a lower delay for a truck traffic volume of 20%. The conflict rate difference between the two strategies is consistent with the conclusion of the delay difference. This indicates that for a truck traffic volume of ≤15%, the interference between trucks and passenger cars must be reduced, and HDT should be restricted to the third lane. Conversely, when the proportion of trucks reaches 20%, the second lane needs to be opened to HDT to improve overall traffic capacity.
(2)
Truck platooning in the separation phase through the weaving section
Truck platooning in the separation phase means automated trucks passing through the weaving section are in the form of single trucks with a separated distance between each two trucks. Each column in Figure 5 represents the proportion of trucks in the total traffic flow. ATP with the corresponding percentage denotes the amount of automated trucks compared to the overall truck traffic.
Figure 5 shows that the delays incurred by the 4F3T strategy are slightly smaller than those incurred by the 4F32T strategy under equivalent conditions, when the percentage of truck traffic is 5% and 10%. For percentages of 15% and 20%, the reverse can be observed. The conclusions of the conflict rate and delay differences between the two strategies are roughly equivalent. This indicates that when truck platooning in the separation phase is set and the proportion of trucks is ≤10%, the interference between trucks and passenger cars should be reduced, and HDT should be restricted to the third lane.
Comparing the delay data between Figure 4 and Figure 5, when truck platooning passes through the weaving section, a higher platooning percentage increases delay, whereas the converse is true when truck platooning in the separation phase passes through the weaving section. For a flow rate of 7000 veh/h and proportion of automated trucks exceeding 10%, the delay value of truck platooning in queue phase increases compared to the counterpart in the separation phase, which indicates that when truck platooning is relegated to the outermost lane, the efficiency of passage and vehicle access to the ramp are reduced. Conversely, when automated trucks in the separation phase pass through the weaving section, traffic efficiency increases with the increase in the proportion of automated trucks, which indicates that designating the outermost lane as an exclusive lane for truck platooning helps improve traffic efficiency.
Comparing the conflict rate data in Figure 4 and Figure 5, similar trends are seen in the presence and absence of truck platooning, and similar conflict rate values are found when the traffic rate is ≤6000 veh/h. When the traffic rate reaches 7000 veh/h, truck platooning accounts for a smaller proportion of the conflict rate.

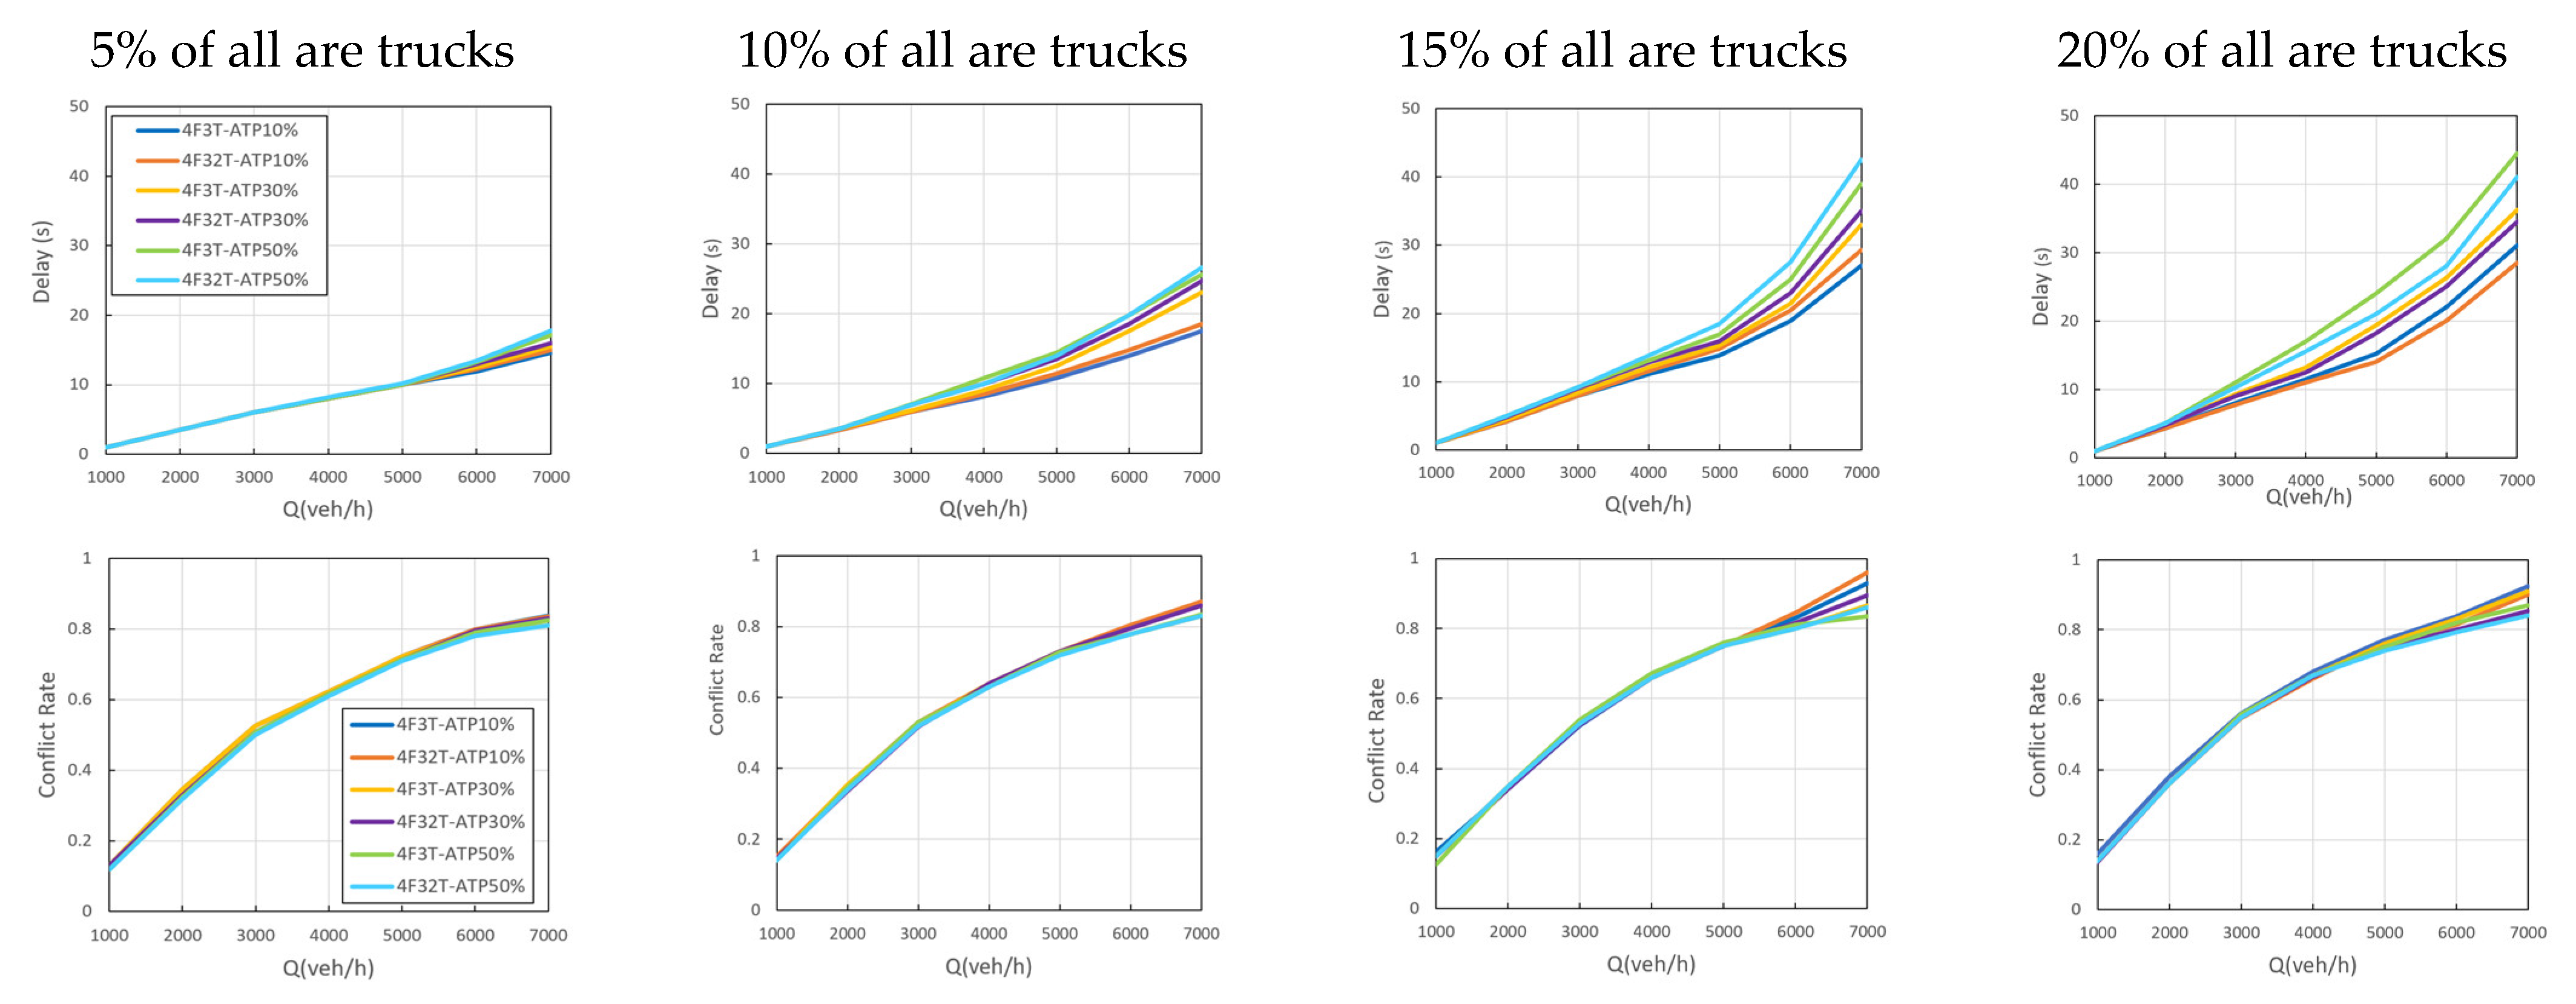
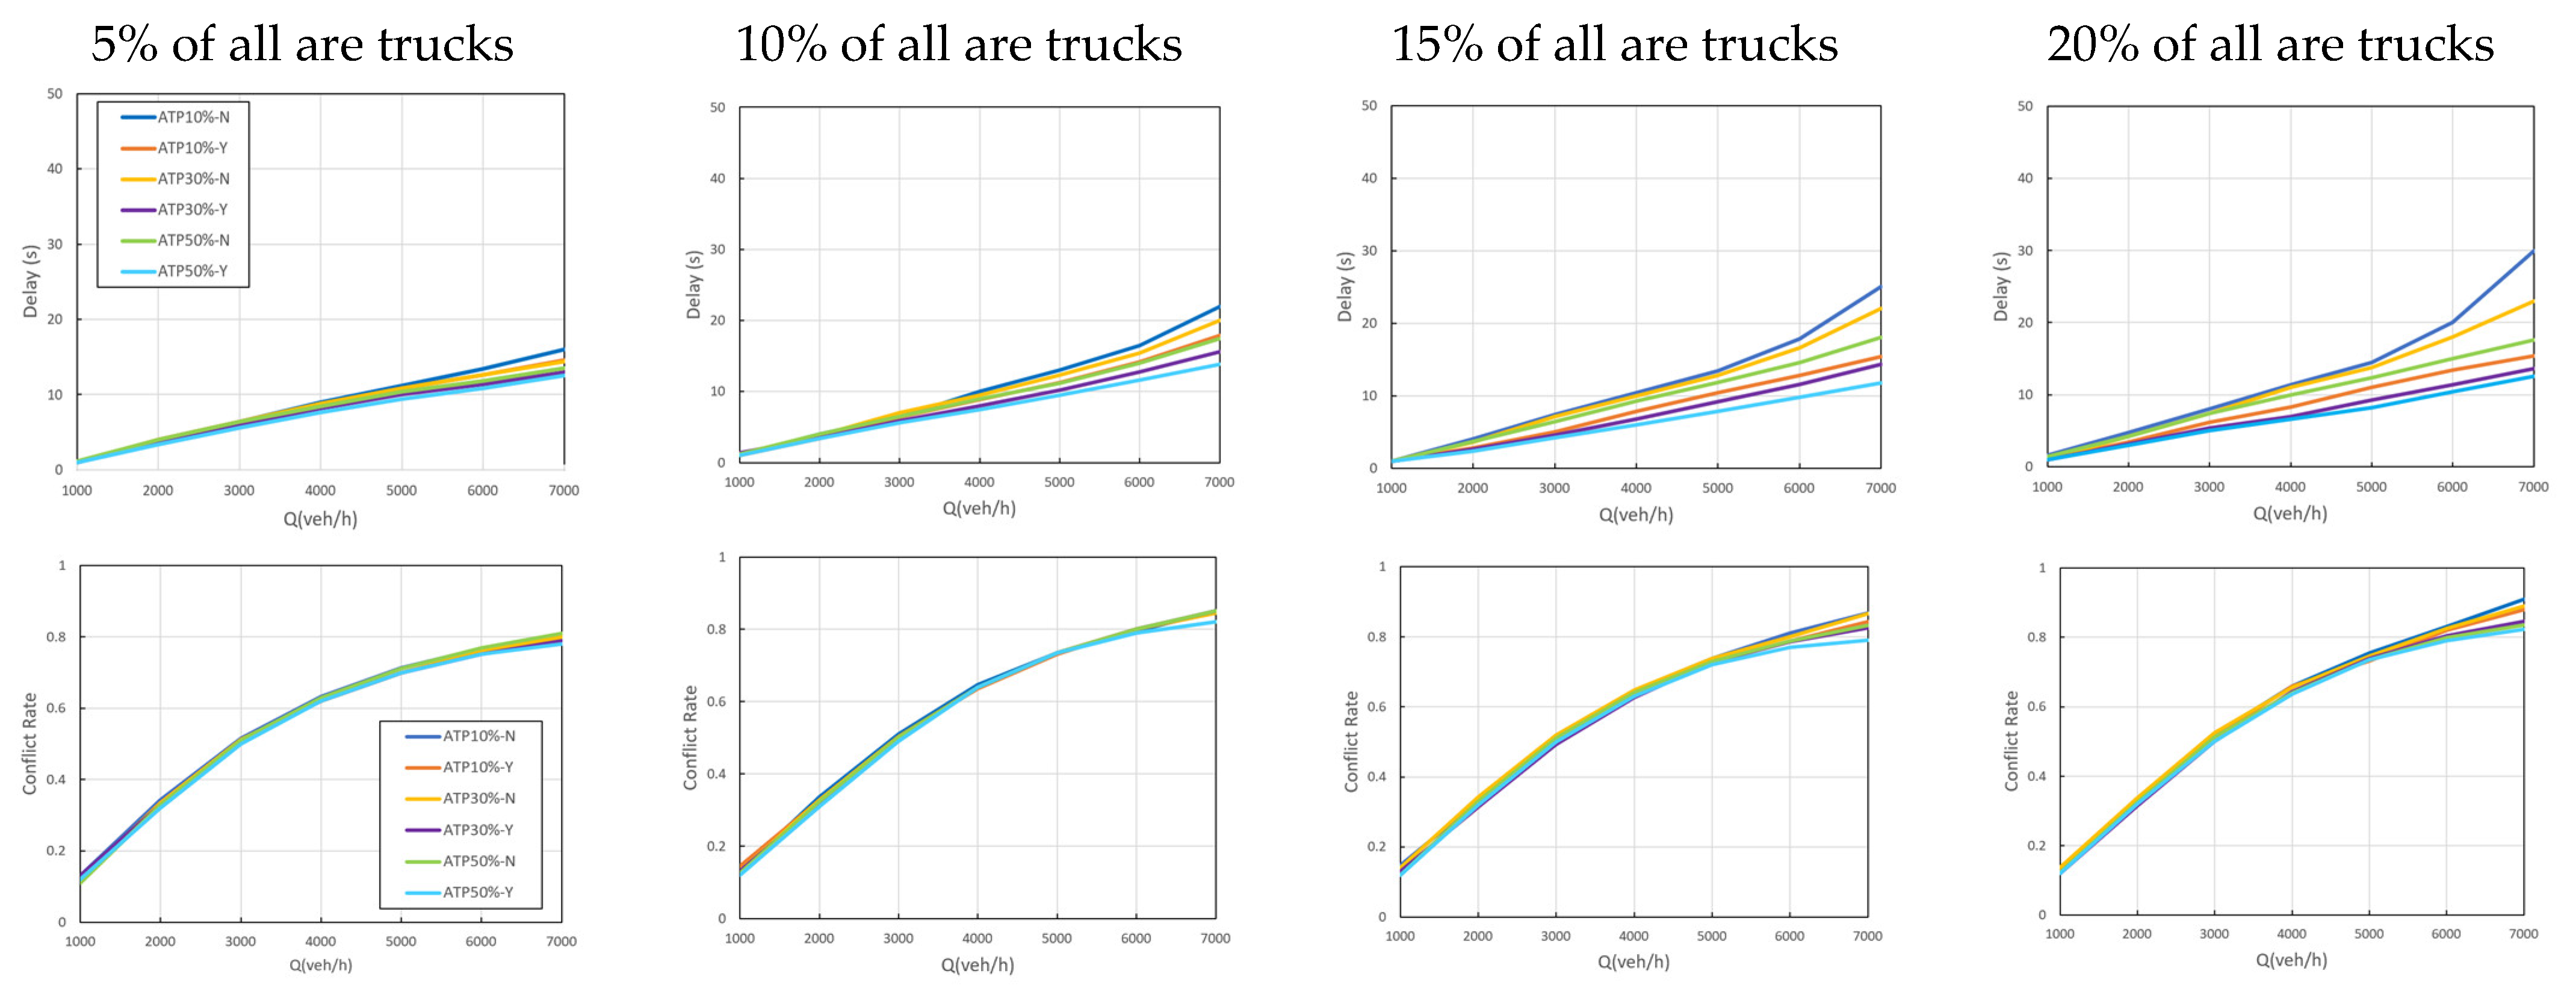
3.2.2. Analysis of the Optimal Speed Control Strategy

Based on the conclusion of Scenario I, real-time road traffic information was employed in the CVIS environment to optimize the speed control of truck platooning using a genetic algorithm. The algorithm’s objectives encompass maximizing traffic flow in a predicted time domain for the bottleneck cell, minimizing travel time for all vehicles on the road, and minimizing fuel consumption from the perspective of truck platooning vehicles. The optimal speed control strategy first analyzes the difference between optimal speed control with and without truck platooning when setting up dedicated lanes, and further examines the difference between optimal speed control with truck platooning in the queue and separation phases under a 4F32T strategy by vehicle type and different lanes.
Figure 6 presents a comparison of the delay and conflict rates with and without optimal speed control of truck platooning when the second lane is opened for HDT and truck platooning in the separation phase are set to pass the weaving section under the exclusive lane policy. “-N” and “-Y” mean simulations without and with optimal speed control strategy respectively. Each column in Figure 6 represents the proportion of trucks in the total traffic flow. ATP indicates automated truck platooning, and the corresponding percentage represents the proportion of platooning trucks among overall truck traffic. Furthermore, the labels -N and -Y denote the absence and presence of optimal speed control, respectively.
Overall, there is a decrease in delay when there is optimal control of truck platooning under the same conditions. With an increase in truck percentage and traffic, the delay and conflict rate are significantly decreased when there is optimal truck platooning control. In terms of delay, when the volume of traffic is 7000 veh/h, when the proportion of trucks is 5%, 10%, 15%, 20%, and truck platooning separation form, the delay decreases by approximately 1–2, 2–5, 5–10, and 3–16 s. With an increase in the proportion of truck platooning, there is an increase in the value of truck platooning optimal control on delay. In terms of conflict, the same conditions have truck platooning optimal control of conflict rate in each truck proportion and truck platooning proportion; in the flow ≤6000 veh/h, there is no significant difference between the conflict rate discount; in the volume 7000 veh/h, the conflict rate is about 0.8, with truck platooning optimal control being better than no truck platooning optimal control.

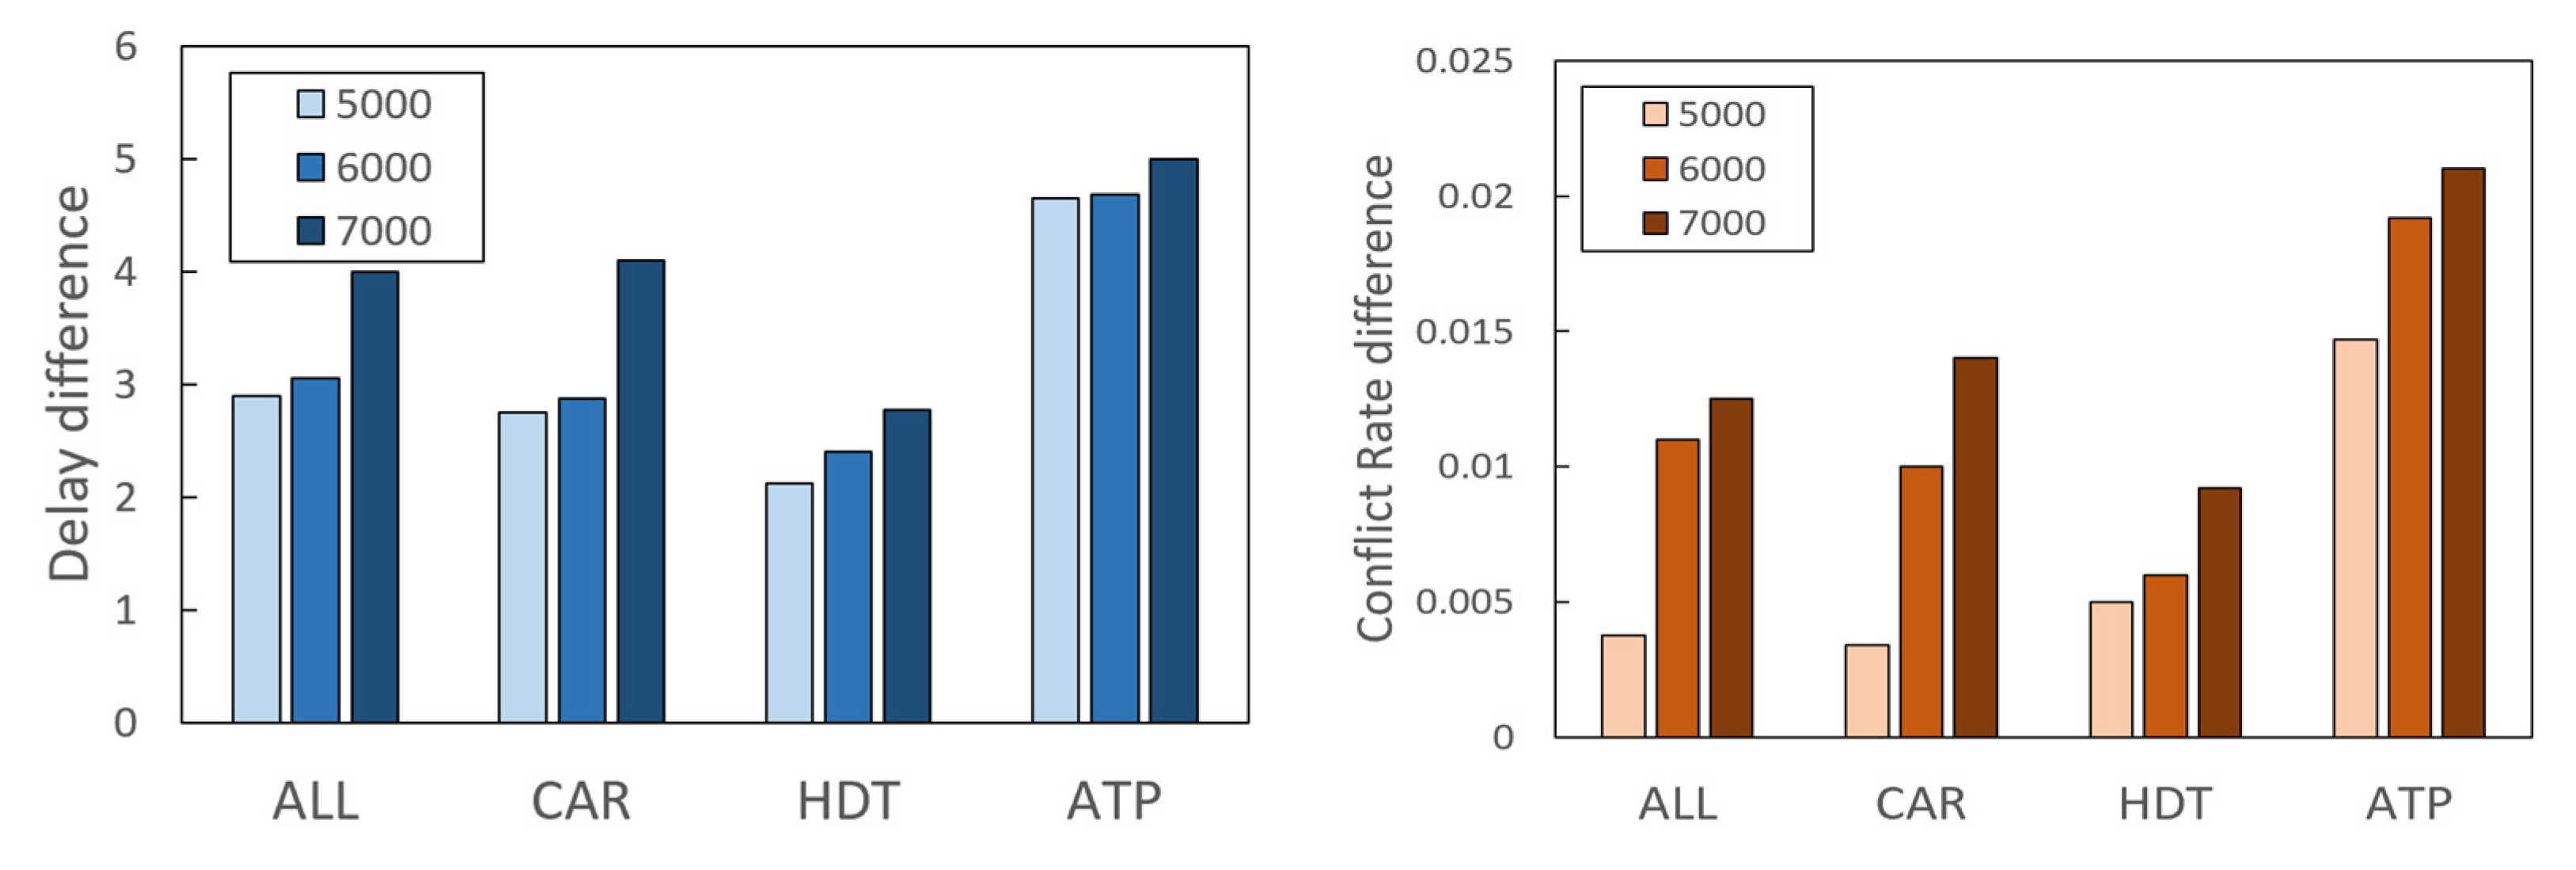
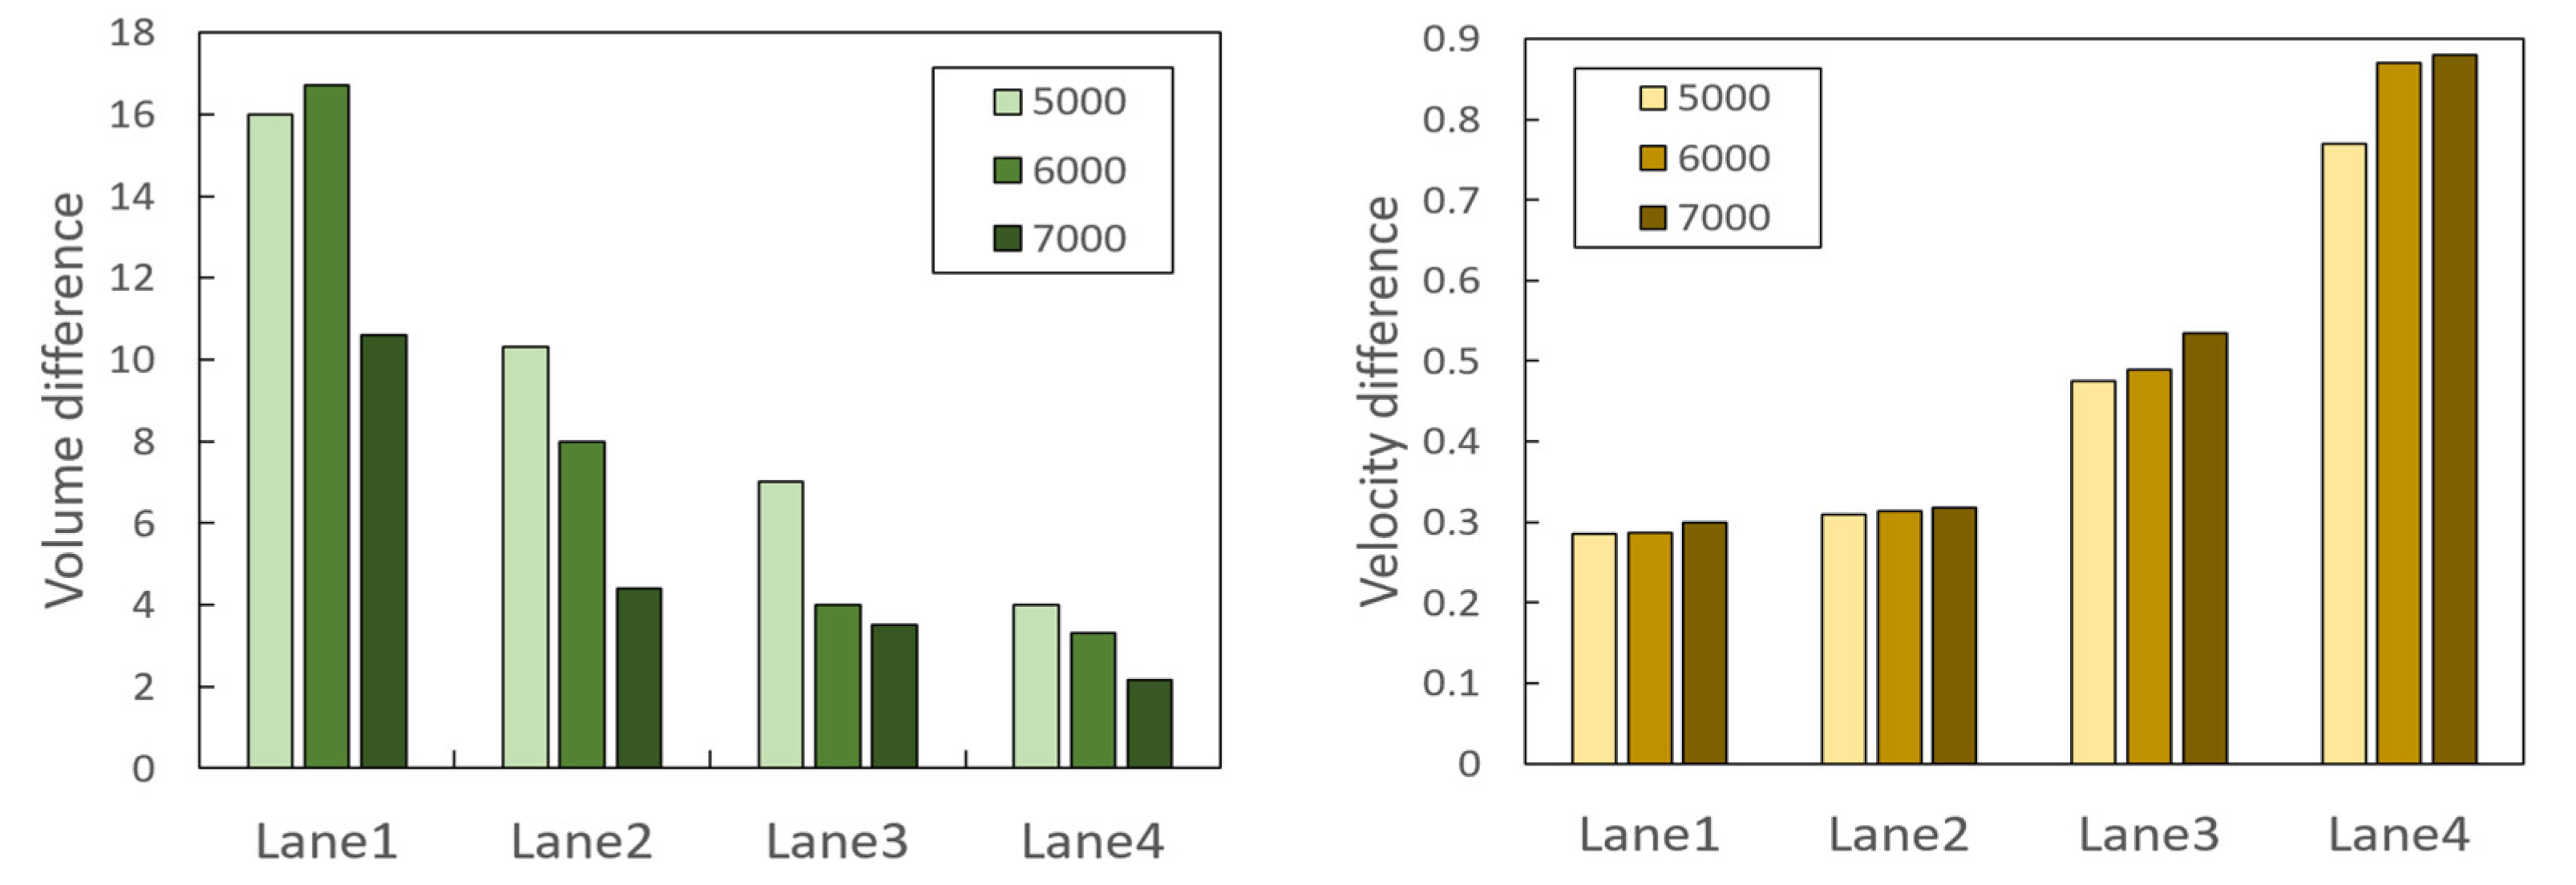
3.2.3. Comparative Analysis by Vehicle and Lane

To further analyze the impact of optimal speed control on different vehicle types and lanes, the 4F32T strategy with truck platooning in separation phase in the weaving section was selected with traffic volumes of 5000, 6000, and 7000 veh/h. In the context of this experiment, ATP and HDT were both set to for 10%. Figure 7 presents a comparison in terms of delay difference and conflict rate difference among different vehicle types with and without optimal speed control. ALL, CAR, HDT, and ATP denote all vehicle models, human-driven cars, human-driven trucks, and self-driving truck platoons, respectively, and 5000, 6000, and 7000 veh/h denote the simulation input traffic, respectively. The blue column on the left shows the delay difference for each model when the simulated input traffic is 5000 veh/h, the purple column shows the delay difference for each model when the simulated input traffic volume is 6000 veh/h, and the red column shows the delay difference for each model when the simulated input traffic volume is 7000 veh/h. Further, the dark green column on the right shows the conflict rate difference for each model when the simulated input traffic volume is 5000 veh/h, the green column shows the conflict rate difference for each model when the simulated input traffic volume is 6000 veh/h, and the yellow column shows the conflict rate difference for each model when the simulated input traffic volume is 7000 veh/h.
The delay and conflict rate data in the weaving section can be obtained for different vehicle types by setting a travel time detector. Overall, truck platooning control exhibits improved delay and conflict rates for all vehicle models. Furthermore, these rates are proportional to traffic volume. Because travel time minimization is one of the objectives of this study, the optimal speed control strategy for truck platoons optimizes traffic through the interleaving zone for each vehicle model. The greatest extent of improvement was seen in van platooning, followed by minibus platooning.
Figure 8 shows a comparison, in terms of volume difference and velocity difference, of different lanes with and without optimal speed control under the same strategy as in Figure 7. In the context of this figure, the lanes are sequentially labeled from the inside to the outside.
Overall, there is an improvement in the number and speed of vehicles passing through the cross-section in the presence of truck platooning control, as the control method maximizes traffic volume through the bottleneck area while minimizing total vehicle travel time. In the same lane under the section, traffic volume decreases, whereas speed remains approximately the same. In the same flow, subsequent lanes exhibit a decrease in traffic and increase in speed.

4. Conclusions

This study was conducted to enable smooth, safe, and energy-efficient truck platooning under the CVIS environment in the weaving section of a highway by optimizing the speed of truck platooning and setting an appropriate lane management strategy. By combining the MPC and CTM methods, an optimal speed control model for truck platooning was constructed based on multi-objective optimization in the CVIS environment. The model considers factors such as the maximum flow of bottleneck cells, shortest overall vehicle travel time, and minimum fuel consumption and employs NSGA-II to solve multi-objective optimization. The Wuxi section of a two-way eight-lane Nanjing–Shanghai highway was selected as the experimental setting. Accordingly, a mixed traffic flow simulation platform was built, and two scenarios were set to evaluate truck lane management strategies and the speed of truck platooning. The results indicate improved performance when truck platooning in separation phase passing through the weaving section is set. When the proportion of all trucks exceeds 15%, it is recommended to open the second lane for HDT driving. When the proportion of truck platooning exceeds 20% of the total traffic volume, it is recommended to set up an exclusive lane for truck platooning. Indicators such as delay and conflict rate show that the passing effect of truck platooning under optimal speed control is better than that in the absence of control.
The key parameters in the car-following and lane-changing model for truck platooning and ordinary vehicles in this study were obtained from references and calibrated in accordance with real data. However, parameters require further calibration in more prominent highway scenarios. Since interaction between truck platooning and ordinary vehicles in the weaving section is complex, the means by which a better balance between the efficiency of macro-level traffic operations and the efficiency of the truck platooning system itself can be accomplished will be the subject of subsequent research.

Author Contributions

Conceptualization, Y.R.; methodology, Y.R. and S.W.; validation, S.W. and R.W.; formal analysis, S.W. and R.W.; investigation, Z.S.; resources, Y.R.; writing—original draft preparation, S.W.; writing—review and editing, Y.R.; visualization, S.W. and Z.S.; supervision, Y.R.; project administration, Y.R.; funding acquisition, Y.R. All authors have read and agreed to the published version of the manuscript.

Funding

This research was supported by the Key R&D Program of Shandong Province, China (grant no. 2020CXGC010118).

Institutional Review Board Statement

Not applicable.

Informed Consent Statement

Not applicable.

Data Availability Statement

Restrictions apply to the availability of these data. Data was obtained from Jiangsu Expressway Company Limited and are partly available from the corresponding author with the permission of Jiangsu Expressway Company Limited.

Conflicts of Interest

The authors declare no conflict of interest.

References

  1. Bhoopalam, A.K.; Agatz, N.; Zuidwijk, R. Planning of truck platoons: A literature review and directions for future research. Transp. Res. Part B Methodol. 2018, 107, 212–228. [Google Scholar] [CrossRef] [Green Version]
  2. Zhao, C.; Li, L.; Li, J.; Li, K.; Li, Z. The Impact of Truck Platoons on the Traffic Dynamics Around Off-Ramp Regions. IEEE Access 2021, 9, 57010–57019. [Google Scholar] [CrossRef]
  3. Rahman, M.S.; Mohamed, A. Longitudinal safety evaluation of connected vehicles’ platooning on expressways. Accid. Anal. Prev. 2018, 117, 381–391. [Google Scholar] [CrossRef] [PubMed]
  4. Yang, D.; Kuijpers, A.; Dane, G.; van der Sande, T. Impacts of large-scale truck platooning on Dutch highways. Transp. Res. Procedia 2019, 37, 425–432. [Google Scholar] [CrossRef]
  5. Chen, Z.; Xiong, S.; Chen, Q.; Zhang, Y.; Yu, J.; Jiang, J.; Wu, C. Eco-Driving: A Scientometric and Bibliometric Analysis. IEEE Trans. Intell. Transp. Syst. 2022, 23, 22716–22736. [Google Scholar] [CrossRef]
  6. Balador, A.; Bazzi, A.; Hernandez-Jayo, U.; de la Iglesia, I.; Ahmadvand, H. A survey on vehicular communication for cooperative truck platooning application. Veh. Commun. 2022, 35, 100460. [Google Scholar] [CrossRef]
  7. Qu, F.; Wang, F.-Y.; Yang, L. Intelligent transportation spaces: Vehicles, traffic, communications, and beyond. IEEE Commun. Mag. 2010, 48, 136–142. [Google Scholar] [CrossRef]
  8. Nowakowski, C.; Thompson, D.D.; Shladover, S.E.; Kailas, A.; Lu, X.-Y. Operational Concepts for Truck Maneuvers with Cooperative Adaptive Cruise Control. Transp. Res. Rec. J. Transp. Res. Board 2016, 2559, 57–64. [Google Scholar] [CrossRef]
  9. Chan, E.; Gilhead, P.; Jelínek, P.; Krej£i, P.; Robinson, T. Cooperative control of SARTRE automated platoon vehicles. In 19th ITS World Congressertico—ITS Europeeuropean Commissionits Americaits Asia-Pacific; ITS Asia Pacific: Vienna, Austria, 2012. [Google Scholar]
  10. Van Nunen, E.; Kwakkernaat, M.R.J.A.E.; Ploeg, J.; Netten, B.D. Cooperative competition for future mobility. IEEE Trans. Intell. Transp. Syst. 2012, 13, 1018–1025. [Google Scholar] [CrossRef]
  11. Tsugawa, S. An Overview on an Automated Truck Platoon within the Energy ITS Project. IFAC Proc. Vol. 2013, 46, 41–46. [Google Scholar] [CrossRef]
  12. ENSEMBLE. ENSEMBLE—The Project. 2020. Available online: https://platooningensemble.eu/project (accessed on 11 February 2021).
  13. Lesch, V.; Breitbach, M.; Segata, M.; Becker, C.; Kounev, S.; Krupitzer, C. An Overview on Approaches for Coordination of Platoons. IEEE Trans. Intell. Transp. Syst. 2021, 23, 10049–10065. [Google Scholar] [CrossRef]
  14. Gong, S.; Shen, J.; Du, L. Constrained optimization and distributed computation based car following control of a connected and autonomous vehicle platoon. Transp. Res. Part B Methodol. 2016, 94, 314–334. [Google Scholar] [CrossRef]
  15. McAuliffe, B.; Lu, X.-Y.; Shladover, S. Influences on Energy Savings of Heavy Trucks Using Cooperative Adaptive Cruise Control. SAE Tech. Pap. 2018, 1, 1181. [Google Scholar] [CrossRef] [Green Version]
  16. Bouchery, Y.; Hezarkhani, B.; Stauffer, G. Coalition formation and cost sharing for truck platooning. Transp. Res. Part B Methodol. 2022, 165, 15–34. [Google Scholar] [CrossRef]
  17. Xu, M.; Yan, X.; Yin, Y. Truck routing and platooning optimization considering drivers’ mandatory breaks. Transp. Res. Part C Emerg. Technol. 2022, 143, 103809. [Google Scholar] [CrossRef]
  18. Duret, A.; Wang, M.; Ladino, A. A hierarchical approach for splitting truck platoons near network discontinuities. Transp. Res. Part B Methodol. 2019, 132, 285–302. [Google Scholar] [CrossRef] [Green Version]
  19. Piacentini, G.; Pasquale, C.; Sacone, S.; Siri, S.; Ferrara, A. Multiple Moving Bottlenecks for Traffic Control in Freeway Systems; Institute of Electrical and Electronics Engineers Inc.: Naples, Italy, 2019. [Google Scholar]
  20. Čičić, M.; Pasquale, C.; Siri, S.; Sacone, S.; Johansson, K.H. Platoon-actuated variable area mainstream traffic control for bot-tleneck decongestion. Eur. J. Control 2022, 68, 100687. [Google Scholar] [CrossRef]
  21. Calvert, S.; Schakel, W.; van Arem, B. Evaluation and modelling of the traffic flow effects of truck platooning. Transp. Res. Part C Emerg. Technol. 2019, 105, 1–22. [Google Scholar] [CrossRef]
  22. Mahnam, S.; Menendez, M. Analysis of strategies for truck platooning: Hybrid strategy. Transp. Res. Rec. 2016, 254, 41–48. [Google Scholar]
  23. Törnell, J.; Sebben, S.; Elofsson, P. Experimental investigation of a two-truck platoon considering inter-vehicle distance, lateral offset and yaw. J. Wind. Eng. Ind. Aerodyn. 2021, 213, 104596. [Google Scholar] [CrossRef]
  24. Siuhi, S.; Mussa, R. Simulation Analysis of Truck-Restricted and High-Occupancy Vehicle Lanes. Transp. Res. Rec. J. Transp. Res. Board 2007, 2012, 127–133. [Google Scholar] [CrossRef]
  25. Winkler, M.; Fan, W.D. Evaluating impacts on freeway capacity using VISSIM: Accounting for truck lane restrictions, driver behavior, and interchange density. Adv. Transp. Stud. 2011, 25, 15–28. [Google Scholar]
  26. Al Eisaeia, M.; Moridpourb, S.; Tay, R. Heavy Vehicle Management: Restriction Strategies. Transp. Res. Procedia 2017, 21, 18–28. [Google Scholar] [CrossRef]
  27. Mahesh, S.; Ramadurai, G.; Nagendra, S.S. On-board measurement of emissions from freight trucks in urban arterials: Effect of operating conditions, emission standards, and truck size. Atmos. Environ. 2019, 212, 75–82. [Google Scholar] [CrossRef]
  28. Wu, B.; Xuan, K.; Zhang, X.; Wu, Z.; Wang, W.; Shen, X.; Li, X.; Zhang, H.; Cao, X.; Hao, X.; et al. Quantitative of instantaneous BC emissions based on vehicle specific power from real-world driving diesel trucks in China. Sci. Total. Environ. 2022, 819, 153230. [Google Scholar] [CrossRef] [PubMed]
Figure 1. Nanjing–Shanghai highway in bright cyan (left) and marked section map (right).
Applsci 13 04072 g001
Figure 2. Schematic diagram of lane marking mode in weaving section (left) and simulation diagram of weaving section (right).
Applsci 13 04072 g002
Figure 3. Cross-section traffic volume time varying diagram and section speed distribution diagram.
Applsci 13 04072 g003
Figure 4. Delay and conflict rate of truck platooning in the queue phase in Scenario I.
Applsci 13 04072 g004
Figure 5. Delay and conflict rate of truck platooning in the separation phase in Scenario I.
Applsci 13 04072 g005
Figure 6. Separation phase with 4F32T strategy through the weaving section in Scenario II.
Applsci 13 04072 g006
Figure 7. Comparison of different vehicle types under the 4F32T strategy.
Applsci 13 04072 g007
Figure 8. Comparison of different lanes with the 4F32T strategy.
Applsci 13 04072 g008
Table 1. Vehicle speed distribution.
Vehicle TypeMinimum SpeedMaximum SpeedAverage Speed85% Vehicle Speed
CAR46.612084.296.4
HDT34.291.560.172
ATP36.594.6665.377.2
Table 2. Vehicle travel lanes in the weaving section.
Lane Management MethodVehicle TypeLane 1Lane 2Lane 3Lane 4
Truck platooning exclusive lane and second lane close to HDTCAR×
HDT×××
ATP×××
Truck platooning exclusive lane under optimal speed controlCAR×
HDT××
ATP×××
Disclaimer/Publisher’s Note: The statements, opinions and data contained in all publications are solely those of the individual author(s) and contributor(s) and not of MDPI and/or the editor(s). MDPI and/or the editor(s) disclaim responsibility for any injury to people or property resulting from any ideas, methods, instructions or products referred to in the content.

