Article

Finite Element Analysis of the Influence of Chamfer Hub Geometry on the Stress Concentrations of Shrink Fits

by
Eulalia Izard
1,
Roberto García-Martín
2,
Manuel Rodríguez-Martín
2 and
Miguel Lorenzo
2,*
1
Department of Mechanical Engineering, University of Salamanca, ETSII, Avda. Fernando Ballesteros, 2, 37700 Bejar, Salamanca, Spain
2
Department of Mechanical Engineering, University of Salamanca, EPS de Zamora, Avda. Cardenal Cisneros, 34, 49029 Zamora, Spain
*
Author to whom correspondence should be addressed.
Appl. Sci. 2023, 13(6), 3606; https://doi.org/10.3390/app13063606
Submission received: 7 February 2023 / Revised: 3 March 2023 / Accepted: 7 March 2023 / Published: 11 March 2023
(This article belongs to the Special Issue Focus on Fatigue and Fracture of Engineering Materials)

Abstract

:
The theoretical expressions commonly used in the design of interference fits do not take into account the huge stress concentrations located at the edges of the hub. This underestimation of the real stress state can induce the incorrect performance of the shaft–hub assembly. Among the different methods to address this problem is the use of chamfer hubs, which are used for reducing such stress concentrations. In this paper, an analysis, performed via finite element method, of the influence of the geometric parameters of a shrink fit with chamfer hubs was carried out with the aim of determining the optimal dimensions for the design of this type of mechanical assembly. To achieve this goal, different chamfer hub geometries were considered: (i) full–chamfer hubs defined by the chamfer angle and (ii) partial–chamfer hubs defined by the chamfer angle and the chamfer height. According to the obtained results, stress concentrations can be reduced by using a full–chamfer hub with chamfer angles within the range 13°–15° depending on the hub thickness. In addition, similar results can be obtained by using partial–chamfer hubs with a chamfer height of half of the hub thickness and chamfer angles within the range 13°–15°. By using these design recommendations, the theoretical equations can be used without underestimating the real stress state.

1. Introduction

The use of interference fits (press fits and shrink fits) constitutes a widely spread method for assembling mechanical components such as shafts and the components generally called hubs, including gears, bearings, pulleys, wheels, etc. [1,2,3]. Thus, both movement and torque can be transmitted between the assembled components: the shaft and the hub [1,2,3]. An interference fit is generated when the radial dimension of one component of the interference fit (shaft and hub) is lower than the other. As result, pressure occurs at the contact between the shaft and hub due to the so–called radial interference. Interference fits can be manufactured by two techniques: (i) axial insertion of the shaft into the hub, resulting in the so–called press fit [1,4,5], and (ii) by increasing the size of the hub by raising the temperature through dilatation and then placing the shaft inside the hub [1,3,6,7,8]. Later, the hub is cooled down to room temperature, recovering the initial dimensions and pressuring the shaft. Obviously, the contact pressure is dependent on the magnitude of the radial interference [9,10,11]. The ISO standard for fits and tolerances [12] recommends certain interference fits for a given application.
The theoretical expressions used for designing interference fits are derived from the theory of elasticity; more concretely, this is the theory of thick–walled pressure cylinders [10,11]. According to these equations, a uniform distribution of stress at the shaft–hub interface is predicted. However, it is well known that a high stress concentration is located at the edges of the hub [11,13,14] and, hence, the design equations lead to an underestimation of the real stress state. As result, the mechanical performance of the assembled components can be reduced under in–service conditions [15,16,17,18]. Thus, taking into account the in–service conditions the high stress concentration at the shaft–hub interface can produce plastic strains that lead to undesirable effects such as vibrations or fretting fatigue failure [18,19,20].
Thus, a realistic estimation of such stress concentrations is a key issue in the design process of interference fits. Therefore, designs leading to relieve such stress concentrations and, therefore, obtain a uniformly distributed contact pressure similar to the one predicted by theory are welcomed. In this sense, many studies have focused on reducing stress concentrations by modifying hub geometry [21,22,23,24]. The most common modifications are the use of round grooves [22], contact rings [25], and chamfer hubs [26,27]. Thus, Lee et al. [21] proposed a method of reducing the maximum contact pressure at the press–fitted contact edge by optimizing the location and size of a stress relief groove in the hub face, reducing the stress by about 30%. In [22], numerical FEM simulations were carried out for obtaining design equations that provide the optimal dimensions (groove diameter and distance from interface) of the round groove. The influence of diverse geometric parameters, shaft/hub length ratio, shaft/hub diameter ratio, and the relative size of the notched hub were analyzed by FEM simulations in [23]. A general qualitative description of the diverse methods used for reducing stress concentrations was included in [24]. An analysis of the reductions of the stress concentrations at the hub edge by FEM simulations considering contact rings was carried out in [25], revealing the optimum contact ring thickness and the influence of the elastic material properties in such stress reductions. A preliminary analysis of the reductions of the stress concentrations by using chamfer hubs was developed in [26]. Pedersen discussed diverse optimized designs that improve the contact pressure distribution considering chamfer hubs and elliptical grooves and a combined chamfer and elliptical cut [27].
Other studies are focused on the analysis of complex hub geometries, for instance, a hub with an exponential variation of the thickness with the radial distance was proposed in [28]. Other design options, such as considering a variable radial interference [27,29] or using hubs of functionally graded materials [8,30], have been also studied. The estimation of the contact pressure at the interference is a difficult task since it cannot be measured directly at the hub–shaft interface. Therefore, the contact pressure can be quantitatively estimated by finite element method (FEM) numerical simulations [6,27,31,32,33,34].
Within this framework, a key issue in this field is to find the optimal values of modified hub geometry using chamfer hubs that allow reducing the stress concentration at the hub edge such that the stress distribution is uniform and, hence, design equations can be used for estimating the real stress state at the shaft–hub interface. To fill this gap, in this study, an analysis of the influence of the geometry of chamfer hubs on the stress concentrations was carried out in order to determine the optimal geometry to be considered in the design of interference fits. To achieve this goal, two different chamfer hub geometries were analyzed and compared with a conventional hub (Figure 1a): (i) partial–chamfer hubs with chamfer heights lower than the hub thickness, t (Figure 1b) and (ii) full–chamfer hubs with a chamfer height (lr) equal to the hub thickness (Figure 1c).
Thus, multiple simulations by means of FEM were carried out, varying the parameters that define the geometries (chamfer angle, α, hub thickness, t, and chamfer height, lr) to reveal the stress concentrations at the shaft–hub interface and quantitatively establish the reduction of stress concentrations for each geometry. From the analysis of the obtained results, a simple design recommendation of the optimal geometry of chamfer hubs can be derived that could be useful in the design of interference fits using chamfer hubs. By using these design recommendations in terms of chamfer hub geometric parameters, the stress concentrations can be reduced and an almost uniform distribution of contact pressure can be obtained, thereby making the values given by the theoretical expressions used in the design of interference fits realistic.

2. Materials and Methods

According to the design equations derived from the theory of thick–walled pressure cylinders [9,10], the contact pressure p in an interference fit considering a hub and shaft made of the same material can be obtained as follows:
p = E δ 2 R 1 R 2 r o 2
where E is the Young’s modulus, ro is the outer radius of the hub, δ is the radial interference, and R is the radius at the shaft–hub interface.
The contact pressure causes a stress distribution in both components. According to theory, the radial stress is equal to the contact pressure, the axial stress is null, and the tangential stress can be obtained from the following equation [9,10]:
σ r , o = p
σ t , o = p R 2 r o 2 R 2 1 + r o 2 R 2
These equations are obtained considering that (i) both the shaft and hub have the same length and (ii) the hypothesis of the plane strain case of the two–dimensional theory of elasticity is satisfied. From the contact pressure, p, the maximum transmitted torque, T, can be obtained as follows [9,10]:
T = 2 π R 2 μ l p
where µ is the friction coefficient and l is the hub contact length.
When the elements fitted by radial interference have different lengths, the discontinuity at the contact point generates a local stress concentration. Thus, the assumption of uniformly distributed contact pressure p and, consequently, of the stress tensor’s components, given by the theory of pressure cylinders (Equations (1)–(3)), becomes unrealistic. Indeed, the radial stress component, compressive for both parts, exhibit huge stress concentrations at the edges of the shaft–hub interface.

Finite Element Numerical Modeling

FEM simulations were carried out considering the interference fit of a hard press, type 50H7s6, according to the ISO standard for fits and tolerances [12]. This fit is recommended by such a standard for transmitting both movement and a given torque with a fixed placement of the shaft into the hub in a rotation movement. The dimensions of the interference fit were selected according to the following ratios obtained in previous studies [23]: length ratio L/l = 4 and the hub length must be l/d = 1, where d is the shaft diameter. Thus, the reference case has, on the one hand, a solid shaft of radius R = 25 mm and a length of L = 200 mm and, on the other hand, the hub is a hollow cylinder with a length of l = 50 mm and an outer radius of ro = 50 mm. Thus, taking into account the tolerances of the selected interference fit 50H7s6, the resulting maximum radial interference is δ = 29.5 μm.
Full–chamfer hubs constitute a simple modification of the conventional hub geometry. Thus, only one parameter is needed for defining the hub geometry, i.e., the chamfer angle, α, defined as shown in Figure 1c. However, for partial–chamfer hubs, an additional parameter is required, i.e., the chamfer height, lr, according to Figure 1b. In both cases, full and partial–chamfer hubs, the hub thickness, t, has an influence on stress concentrations, so in this study this parameter was also taken into account. The contact hub length, l, was fixed for all the cases of study. In this way, the maximum transmitted torque is only dependent on contact pressure according to Equation (4).
In order to include the influence of the hub thickness, t, in the study, a dimensionless parameter γ was defined as the ratio between the hub thickness and the shaft diameter as follows: γ = t/d. Thus, in this study, five different values of γ were considered: (i) an eighth of the shaft diameter, γ = 1/8, (ii) a quarter of d, γ = 1/4, (iii) a half, γ = 1/2 (iv), three quarters, γ = 3/4, and (v) a hub thickness equal to the shaft diameter, γ = 1. In addition, a dimensionless parameter β, defined as the ratio between the chamfer height and hub thickness, β = lr/t, is useful for the analysis of partial–chamfer hubs. Thus, when β = 0, a conventional hub without a chamfer hub is considered; 0 < β < 1 represents partial–chamfer hubs with diverse chamfer heights; and, finally, β = 1 represents full–chamfer hubs as shown in Figure 2. For each of the values of γ, six different values of β are considered as follows: (i) β = 0 is a conventional case without a chamfer hub; four partial–chamfer hubs progressively increasing the hub thickness are as follows: (ii) β = 1/8, (iii) β = 1/4, (iv) β = 1/2, (v) β = 3/4, and, finally, (vi) β = 1, where the geometry of the full–chamfer hubs is characterized by a chamfer height equal to the hub thickness.
Finally, for a given hub thickness γ and a chamfer height β, the chamfer geometry can be characterized by the chamfer angle α defined as shown in Figure 3. In this way, the chamfer angle can be obtained from the expression α = atan(lz/lr) for partial–chamfer hubs and the same expression can be applied to full–chamfer hubs considering the previous condition, β = 1, i.e., lr = t and then α = atan(lz/t). In this study, the chamfer angle was varied for each one of values of γ and β, from α = 0° (conventional hub) up to α = 30°, according to the following sequence: α = 0°, α = 5°, α = 10°, α = 12°, α = 13°, α = 14°, α = 15°, α = 18°, α = 20°, α = 25°, and α = 30°. Chamfer angles higher than 30° are considered inadequate from a technical point of view since the hub width at the upper surface becomes too small to be used. The maximum chamfer angle can be calculated as a function of the hub thickness as follows: αmax = atan(l/lr).
The revolute symmetry of the shaft–hub assembly (Figure 1) allows the reduction of the FE model to an axisymmetric case (Figure 3) with the corresponding saved time in terms of computing. In this way, the boundary conditions must be considered; null displacements in the radial direction were imposed in the nodes placed at the shaft axis. In addition, the geometry was also simplified taking into account the transversal plane’s symmetry. The boundary conditions were completed, imposing null displacements in the axial direction of the nodes of the shaft and hub placed at this plane, z = 0 (Figure 3). No external forces were applied. Considering the aim of the study, attention was primarily paid to the hub–shaft interface. Thus, the radial interference at the hub–shaft interface corresponding to the selected interference fit was included in the FEM simulations by means of a built–in function of the FEM software used in this study (MSC.MARC) available in the definition of the contact type (named “touching”) between the shaft and the hub. This option allows one to impose a given radial interference, causing contact pressure at the interface of the simulated interference fit. Contact is modeled as frictionless, taking into account the fact that friction has a negligible influence on stress distributions according to previous studies [27,35].
Conventional steel (AISI 1085) was chosen for both the shaft and the hub. The following material properties were considered in the simulations: Young’s modulus E = 210 GPa, Poisson coefficient ν = 0.3, and yield strength σY = 276 MPa. The FE modeling parameters are summarized in Table 1.
The geometry of both bodies (shaft and hub) was meshed using four–node quadrilateral elements. A non–uniform mesh was selected with an increasing meshing size out of the zones of interest, i.e., the shaft–hub interface and hub. In this way, a refined mesh was obtained at the interface without significantly increasing the computing time. Diverse meshes were considered up to reach the required convergence in the results. A mesh factor Km defined as the ratio of the number of mesh elements and the number of base mesh elements was considered in the mesh convergence analysis. Thus, different meshes were applied, decreasing the size of the elements in terms of the mesh factor (Km) following the sequence Km = 1, Km = 2, Km = 4, Km = 8, and Km = 16. In this way, each mesh has double the elements of the previous one. Then, the values of the contact pressure at the point of the shaft–hub interface placed in the symmetry plane of the hub z = 0 (point B in Figure 3) obtained from each one of the considered meshes were compared with the theoretical value given by Equation (1), as shown in Figure 4. Notice that point B was placed far away from the local stress concentration appearing at the hub edges, point A in Figure 3 and, consequently, the obtained value from numerical simulation should be similar to the one given by theoretical expressions and, hence, the precision of the numerical results can be estimated, and the numerical simulation results will be validated. As result, a mesh with 4736 elements and 4958 nodes is suitable for simulations (Figure 5) with an estimated error, ε, lower than 3%, as shown in Figure 4. For the selected mesh, the size of the elements at the contact zone was about 0.625 × 0.625 mm as shown in Figure 5. For the sake of clarity, the shaft–hub interface where contact was imposed was drawn and shown (black line) in the detailed view of Figure 5. In a similar way, the boundary conditions were drawn and are shown (red lines) in the mesh shown in Figure 5. Thus, on the one hand, nodes placed on the symmetry axis z = 0 were fixed in the radial direction (r–axis), and, on the other hand, nodes placed at the central symmetry axis r = 0 were fixed in the axial direction (z–axis).

3. Results

Numerical FEM simulations reveal the stress distributions on the interference fit as a result of the contact pressure at the shaft–hub interface (r = R) caused by the radial interference δ. From these stress fields, the axial distributions at the shaft–hub interface are revealed for the radial stress, tangential stress, and von Mises stress for both types of chamfer geometries analyzed in the present study: full–chamfer hubs and partial–chamfer hubs as will be discussed in the following sections.

3.1. Stress Concentrations in Full–Chamfer Hubs (β = 1)

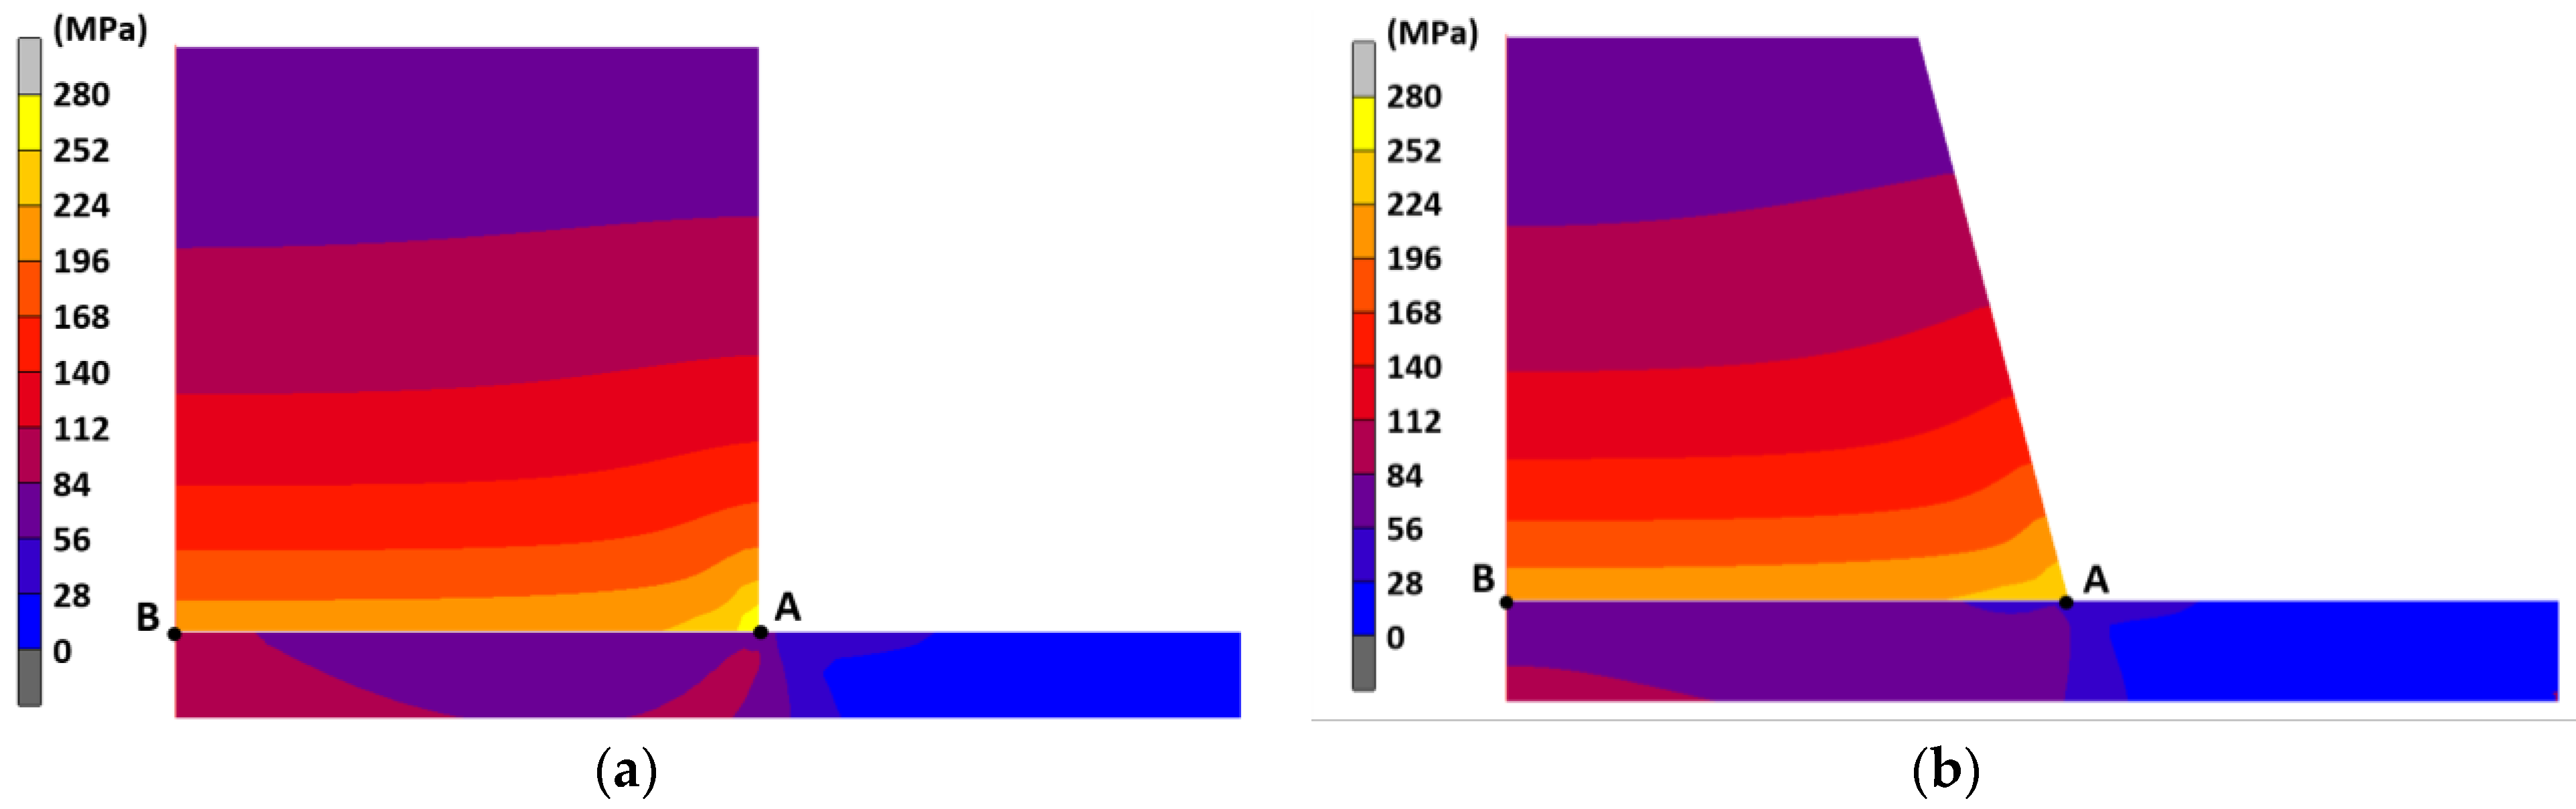
Numerical simulations reveal the stress fields at the hub and shaft in colored maps. From these plots, it is easy to visualize the stress distributions at the hub–shaft interface and the effect of a chamfer hub on the stress field from a qualitative point of view. Figure 6a,b show the von Mises stress fields of a conventional hub and a full–chamfer hub with a chamfer angle of α = 15°.
In these plots, a huge stress concentration was observed at the hub edge of the conventional hubs (right side of the hub, yellow zone, point A in Figure 6a). In addition, a highly localized effect of stress concentration was also revealed since the zone where the stress concentration appeared at the shaft–hub interface was only noticeable nearby the hub edge (point A), whereas the stress field was uniformly distributed far from the hub edge. However, for full–chamfer hubs, the high–stress zone (yellow zone) disappeared and, consequently, the stress concentration of the conventional hub significantly decreased. As result a more uniform distribution of stress in the axial direction at the interface was obtained.
To go deeper in the analysis, the axial distributions of the radial stress (σr), tangential stress (σt), and von Mises stress (σvM) at the shaft–hub interface are plotted in Figure 7, Figure 8 and 
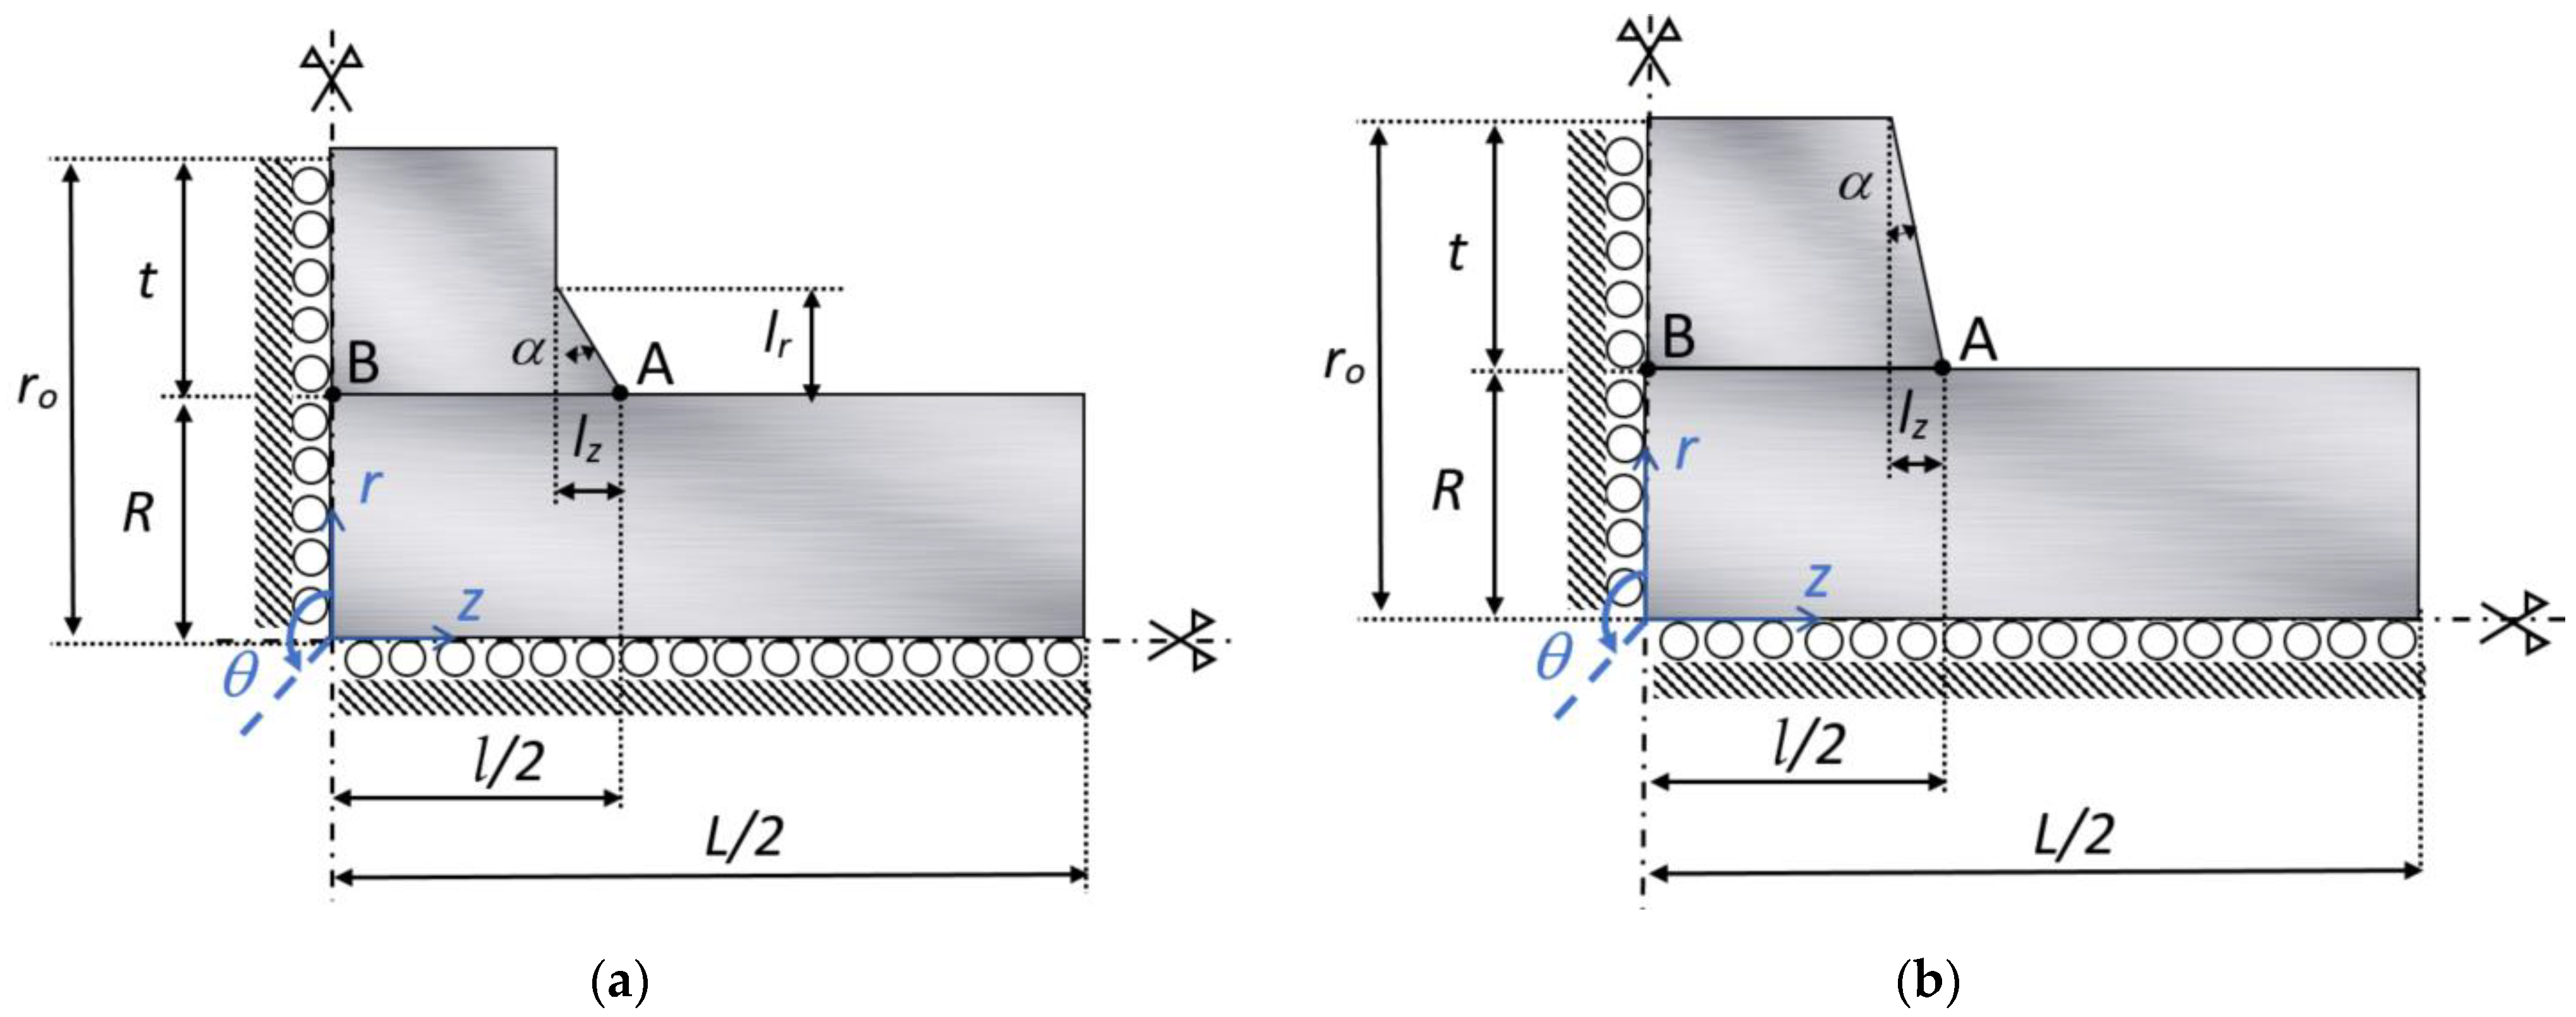
Figure 9, respectively, for full–chamfer hubs (β = 1), considering different values of the chamfer angle α within the range from α = 0° (conventional hub) to α = 30°. In these plots the distributions are represented in terms of the dimensionless distance ζ, defined as ζ = 2 z/l, where ζ = 0 represents the half cross–section of the hub (z = 0, point B in Figure 3) and ζ = 1 represents the hub edge (z = l/2, point A in Figure 3).
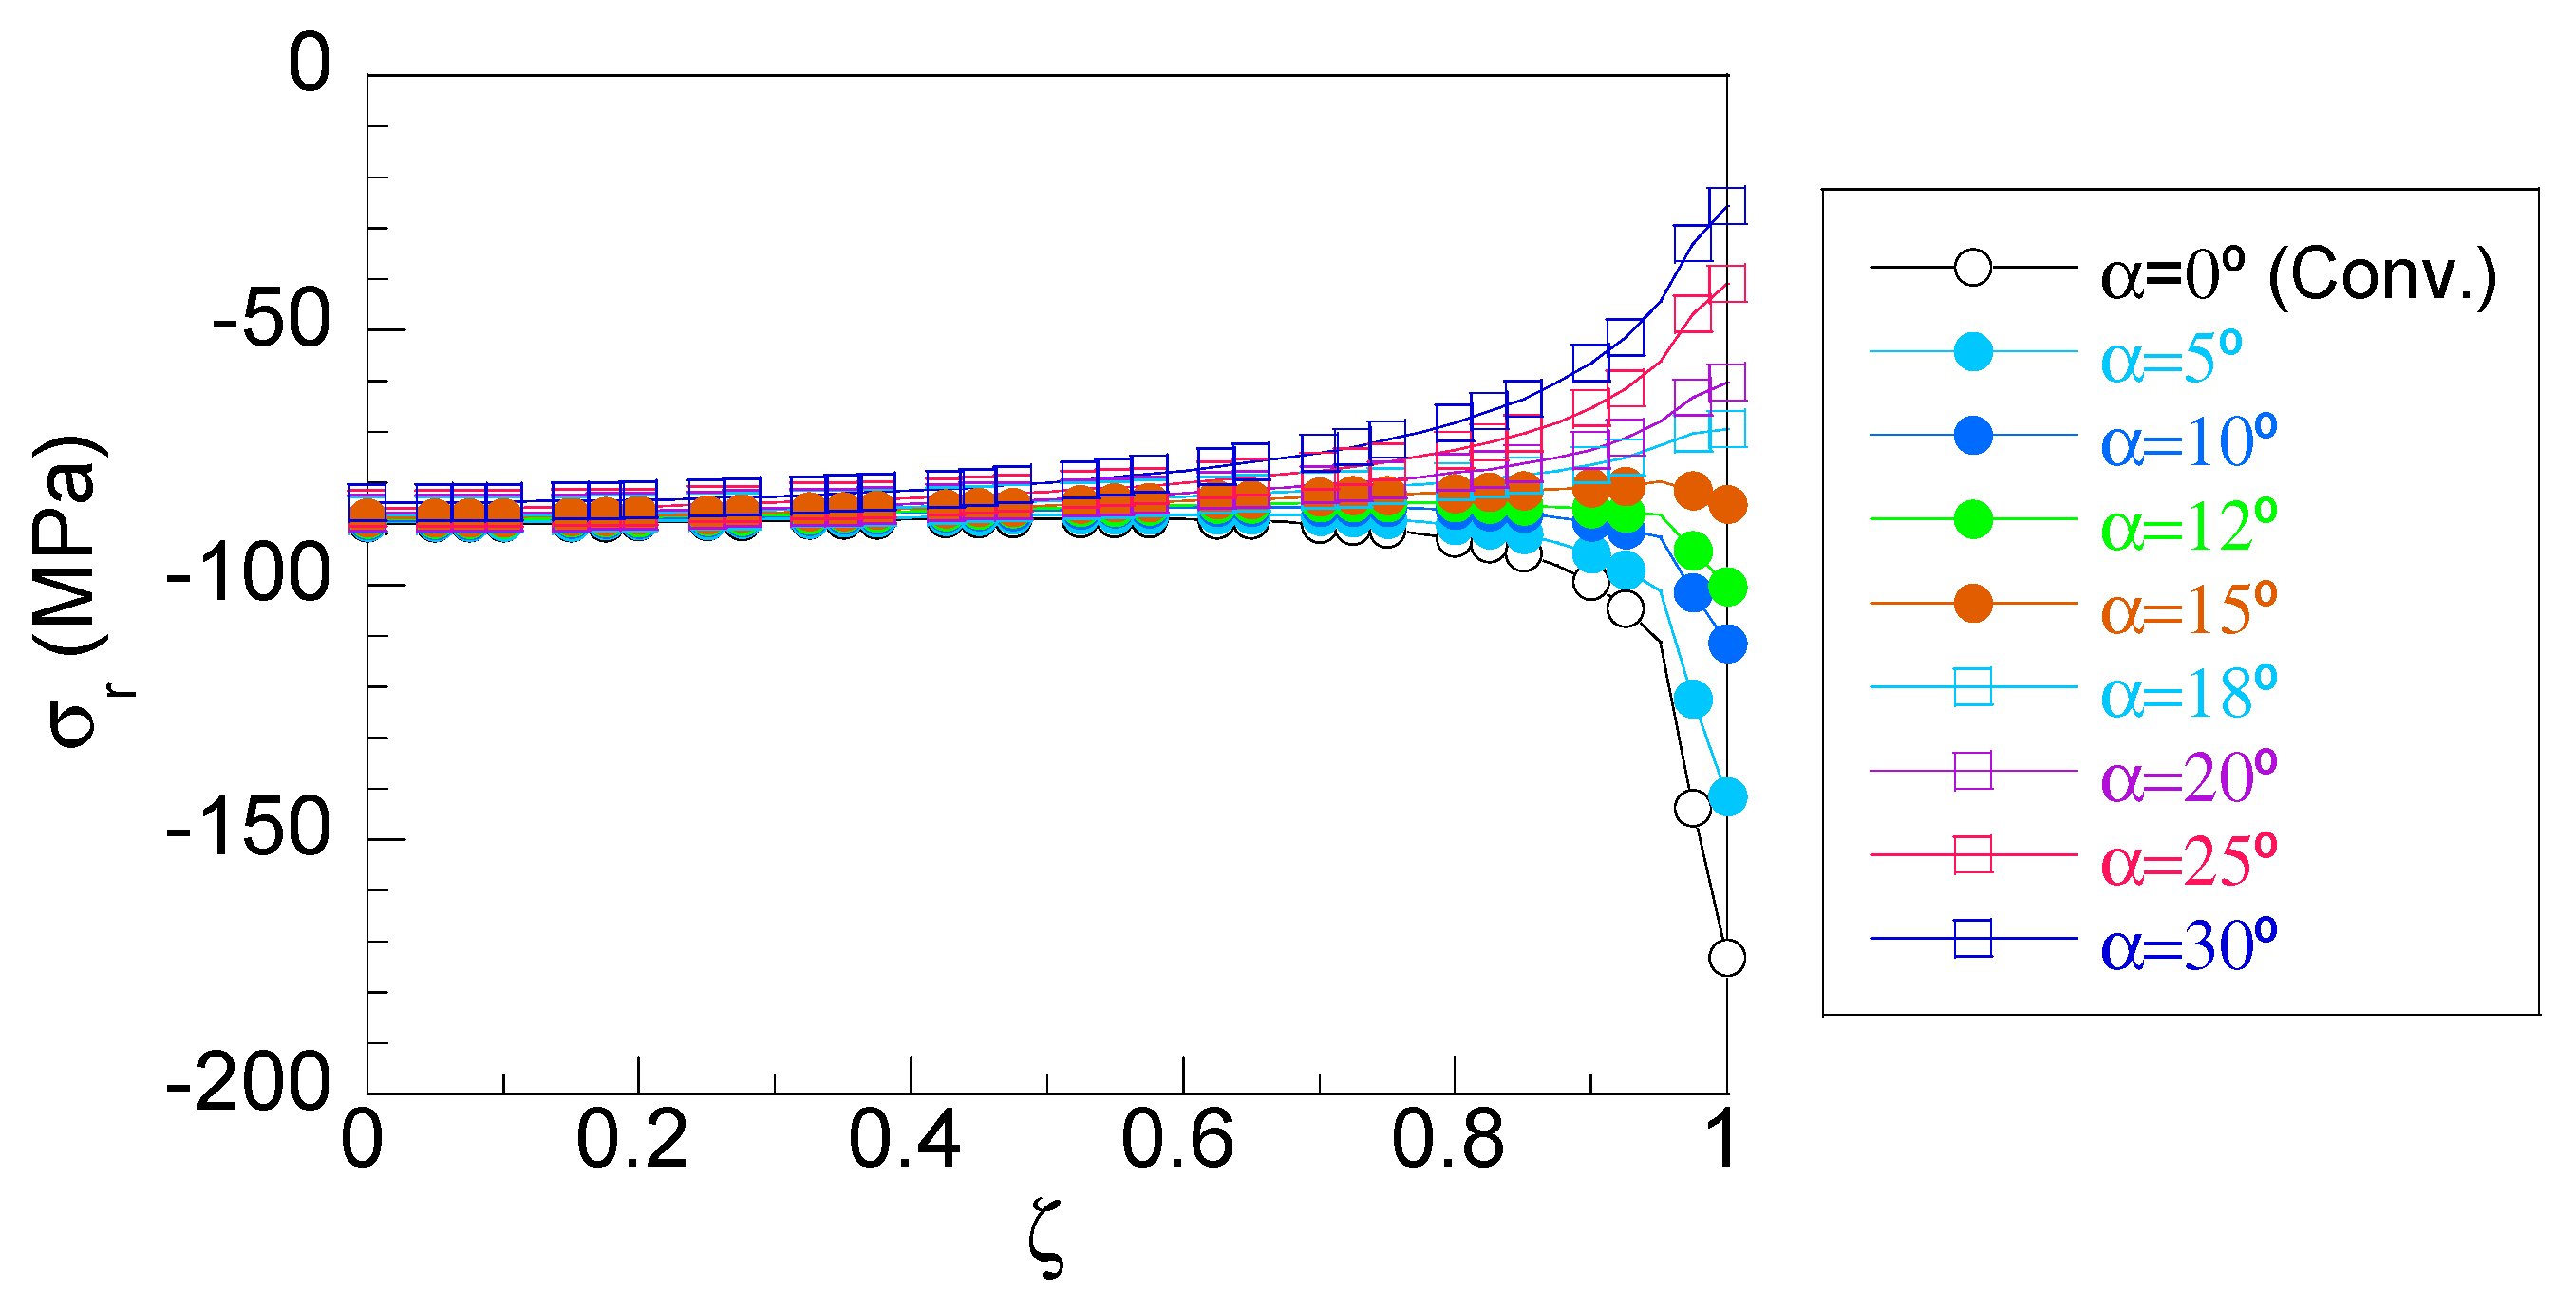
For the conventional hub (α = 0°, blank circles in Figure 7), the radial stress, σr, distributions exhibited two clearly defined zones. In the first one (out of the stress concentration), within the range 0 < ζ < 0.8, the stress was uniformly distributed, reaching a value similar to the one given by theory (Equation (2)). The second zone, placed nearby the hub edge (ζ > 0.8), showed a high increment of stress, reaching a maximum value at the hub edge (ζ = 1). Thus, on the one hand, the maximum value at this zone revealed the intensity of the stress concentration and, on the other hand, the local effect of the stress concentration was also estimated as just 20% of the half hub contact length l. For the first zone (0 < ζ < 0.8), the radial stress distributions were quite similar to the theoretically predicted ones for all the considered chamfer angles. However, at the vicinity of the hub edge (ζ > 0.8) where a high stress concentration appeared, the effect of the chamfer geometry on the stress distribution was highly significant.
According to the results, the stress concentration progressively decreased as the hub chamfer angle increased, even for low chamfer angles. Thus, the stress distribution became progressively more uniform, becoming almost plain (i.e., without stress concentrations) for medium of chamfer angle values, α = 15°. For higher chamfer angle values, α > 15°, the radial stress at the hub edge was lower than the values of such a stress at the inner points of the hub (where the uniform distribution appeared, ζ = 0) and, consequently, the maximum value of the radial stress distribution σr is similar to the one given by theoretical equations for these cases.
Figure 7. Hub axial distribution of radial stress at the shaft–hub interface.
Applsci 13 03606 g007
As the chamfer angle increased, a lower radial stress value appeared at the hub’s center plane. This can be attributed to a stress redistribution caused by the reduction at the hub surface. So, for high chamfer angles, a loss of the contact pressure was produced because of, on the one hand, the reduction of radial stress at the hub edge surroundings (the most significant one) and, on the other hand, the soft reduction of radial stress observed at the hub center (ζ = 0).
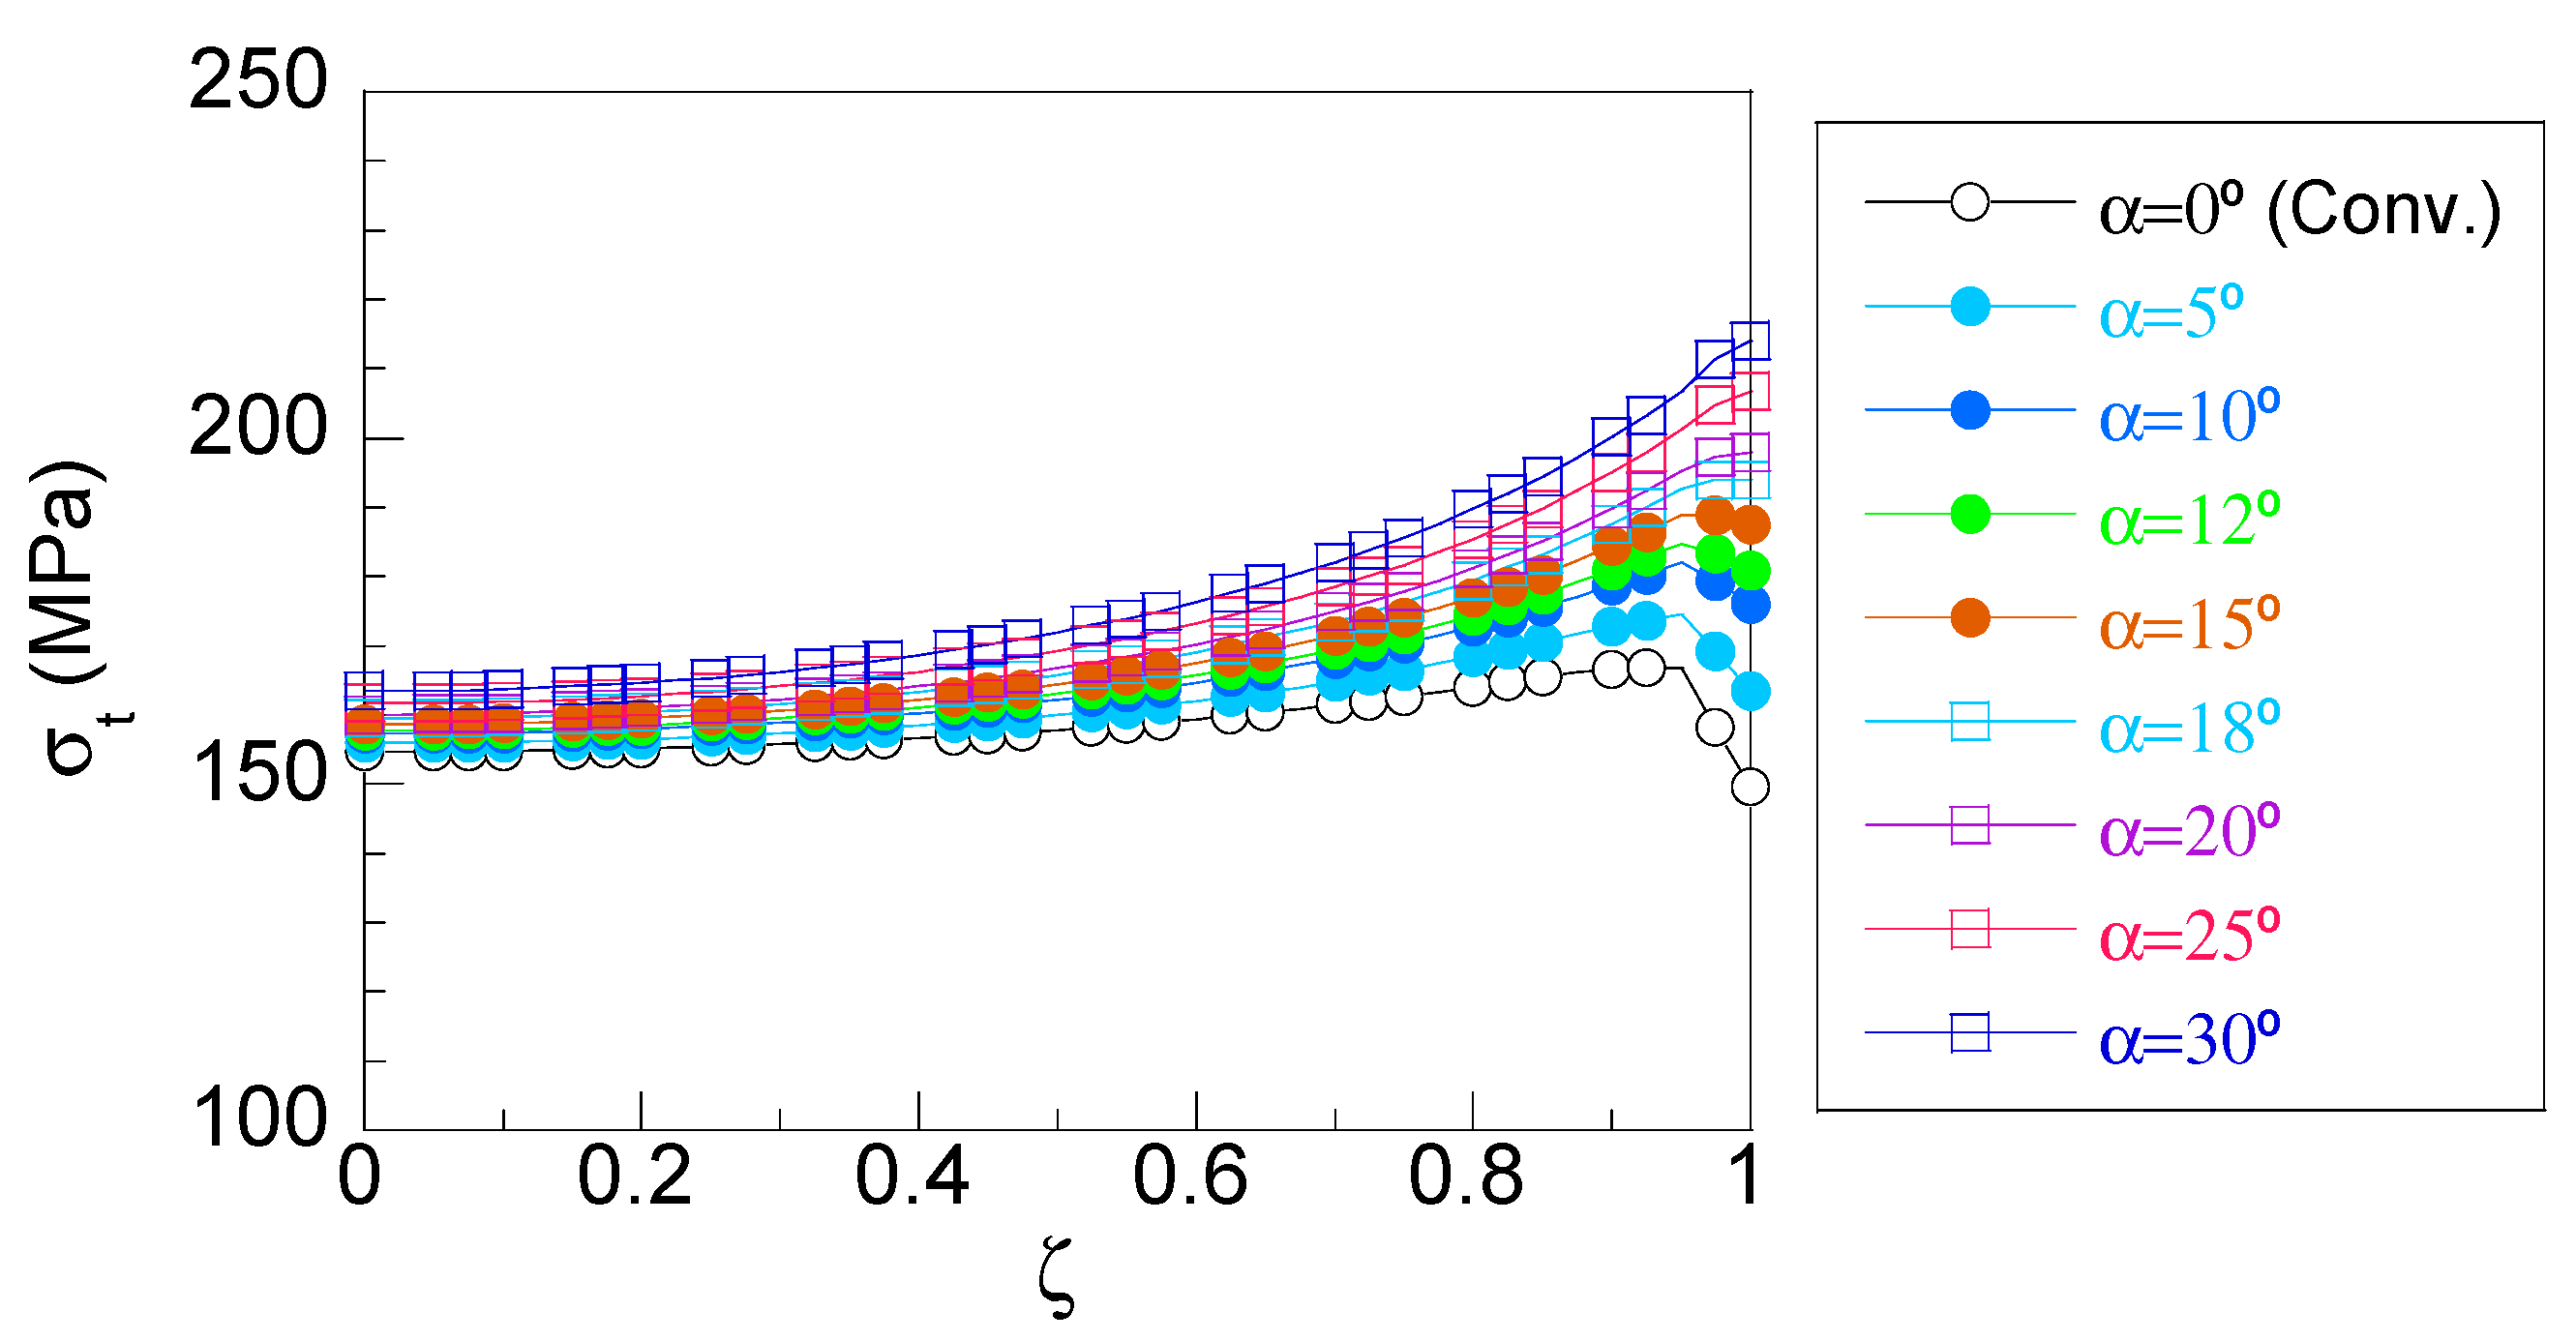
However, the axial distribution of tangential stress for a conventional hub (α = 0°), σt (blank circles in Figure 8), progressively increased from the hub’s central plane (ζ = 0) and reached a maximum value nearby the hub edge (ζ = 1). Later, it decreased until reaching the minimum value at the hub edge. As in the case of the radial stress, the tangential stress at the hub center (ζ = 0) is similar to the theoretical value given by Equation (3). The effect of the chamfer angle on the tangential stress was the opposite of the effect observed in the radial stress. Thus, the values of the tangential stress at the hub center softly increased as the chamfer angle increased. In addition, the values of the tangential stress at the hub edge (ζ = 1) progressively increased with the chamfer angle from a minimum value obtained for the conventional hub case, σt = 149.6 MPa (without chamfer, α = 0°), up to the highest value, σt,max = 206.6 MPa, obtained when the chamfer angle was the highest one considered (α = 30°). It should be highlighted that for low chamfer angles (α < 15°) the maximum stress appeared nearby the hub edge, whereas for high chamfer angles (α > 15°) the maximum tangential stress appeared at the hub edge.
Figure 8. Hub axial distribution of the tangential stress at the shaft–hub interface.
Applsci 13 03606 g008
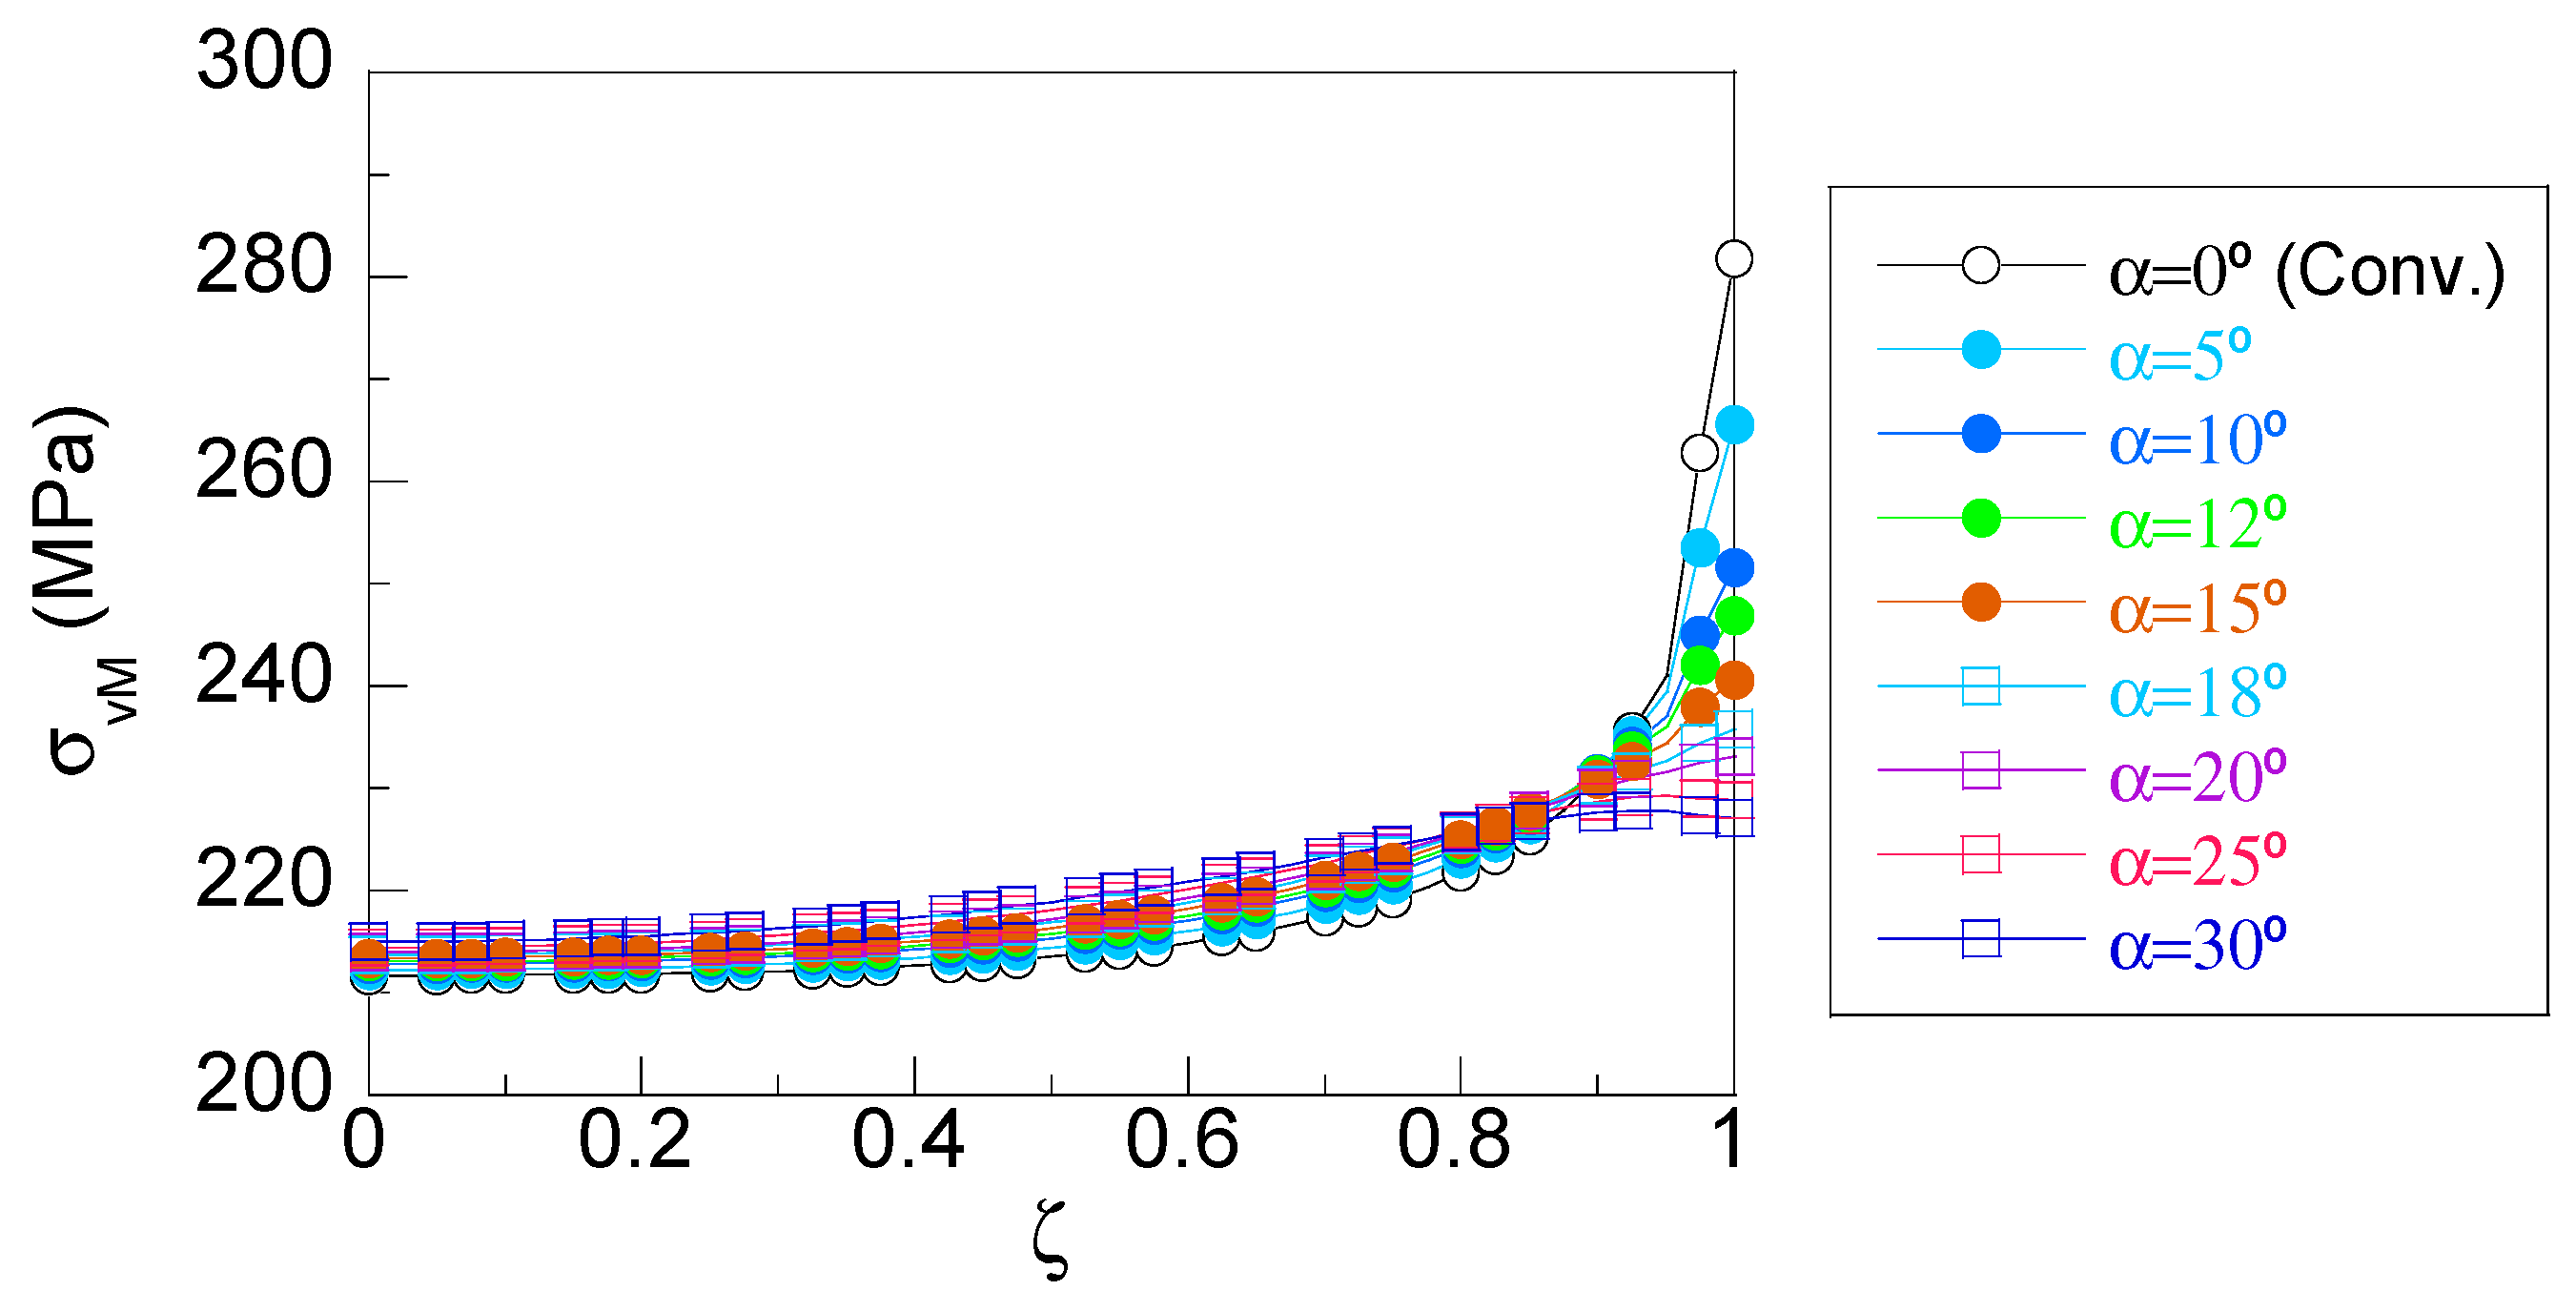
With regard to the distribution of the von Mises stress for a conventional hub (blank circles in Figure 9), the stress softly increased in the zone out of the stress concentration (0 < ζ < 0.8) and close to the hub edge, the von Mises stress heavily increased, reaching a maximum value at the hub edge.
Figure 9. Hub axial distribution of von Mises stress at the shaft–hub interface.
Applsci 13 03606 g009
As in the previous distributions, the effect of the chamfer vanished as the distance from the hub edge increased, reaching similar values to the ones predicted by theory for all chamfer angles considered, σvM = 215 MPa (Equation (4)). According to the results, as the chamfer angle α increased, a notable reduction on the stress concentration at the extremity of the hub was achieved (from a peak of 281.7 MPa corresponding to the conventional hub case up to 227.1 MPa for a chamfered hub with the highest chamfer angle α = 30°). As a consequence, the von Mises stress was more uniformly distributed throughout the hub–shaft interface.
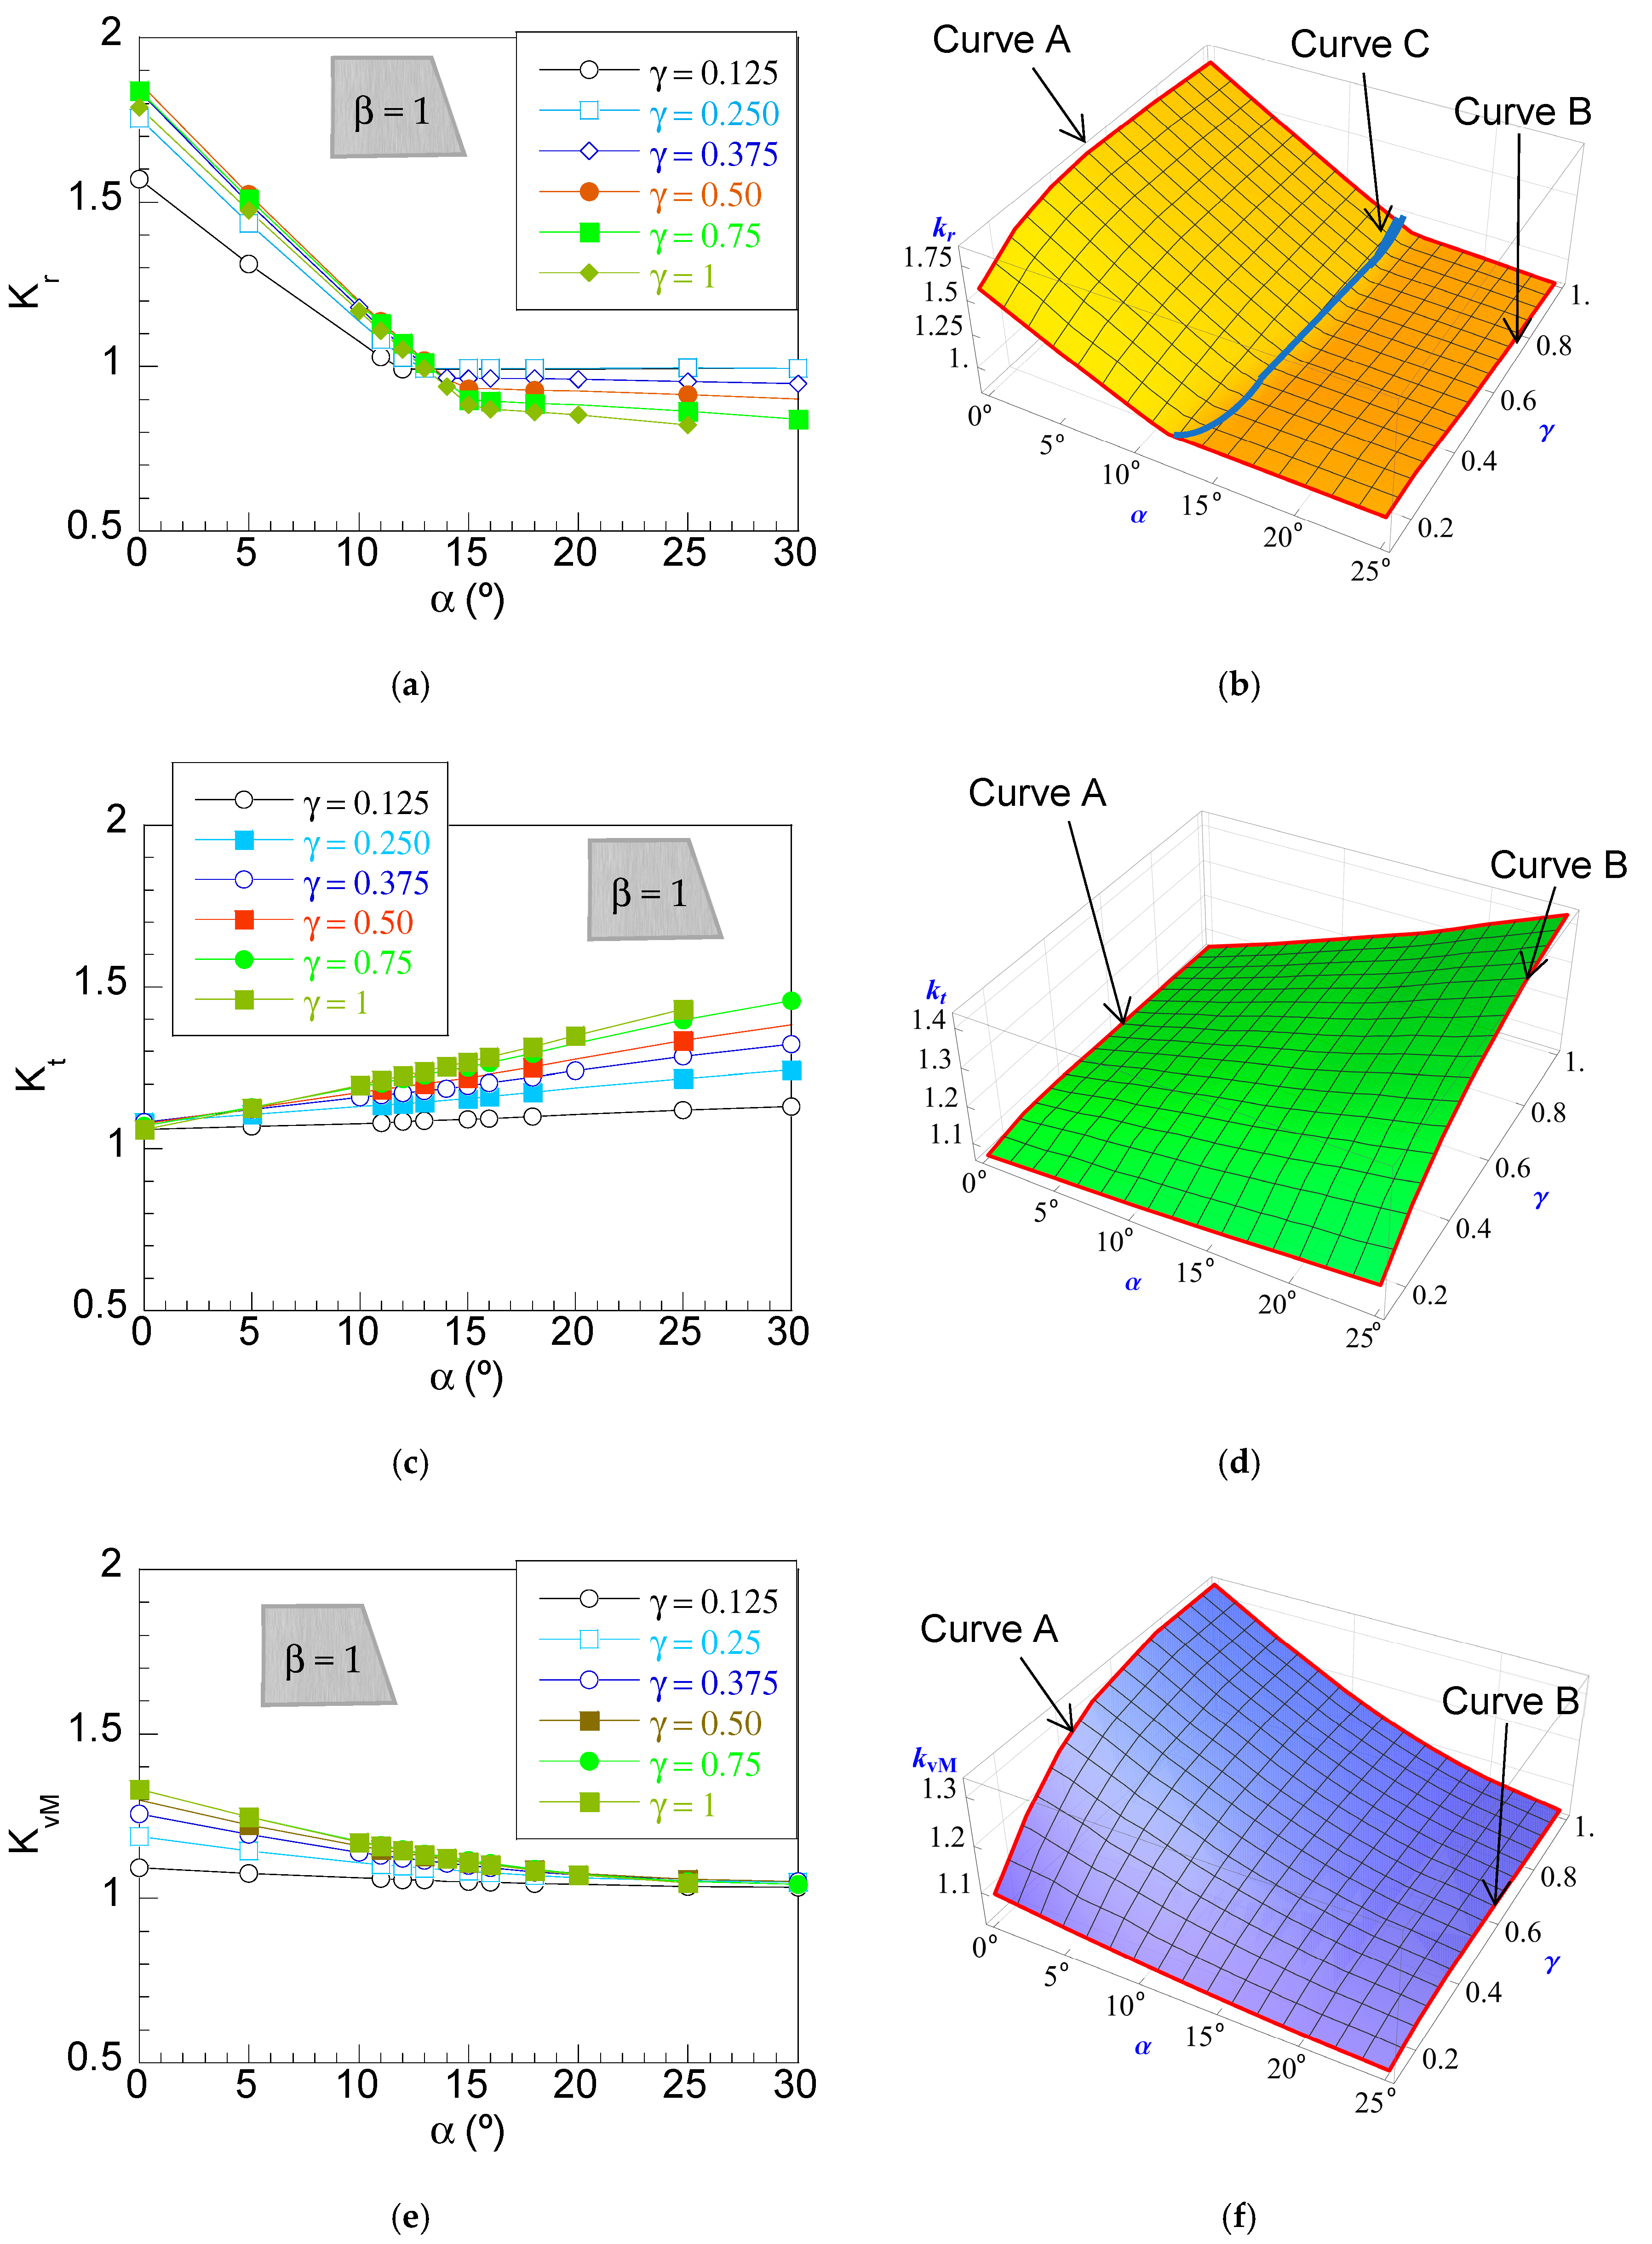
All the effects previously discussed can be better analyzed in terms of the variation of the stress concentration factors (SCFs, Kj) with the chamfer angle α for diverse chamfer heights γ (Figure 10). The SCF Kj is defined [23,27,34] as the ratio between the maximum stress obtained by means of FEM simulations, σj,FEM-max, and the corresponding theoretical value, σj,th (Equations (2) and (3)) as Equation (5) reflects, where subindexes jr, t, and vM refer to the radial, tangential, and von Mises stress, respectively:
K j = σ j , F E M max σ j , th
According to obtained results, a two–linear variation of the radial SCF, Kr, with the chamfer angle was obtained for all the dimensionless hub thicknesses, γ, considered. The first linear variation (zone A) was extended from α = 0° (conventional hub) to a certain angle (around 13°–15°) that is denoted as the transition chamfer angle, α*. The second one (zone B) was extended from the transition angle α* up to the maximum chamfer angle considered in this study, α = 30°. In this way, a high linear drop of Kr with α (high influence) was obtained for low chamfer angles within the interval 0° < α < α*, and soft variations of Kr (second–order influence) were observed for high chamfer angles, α > α*.
The influence of the hub thickness γ on the radial SCF was also revealed from the results plotted in Figure 10a. Regarding zone A (low chamfer angles), soft variations were observed for all the lines obtained for hub thickness γ > 0.375 and only the line corresponding to the lowest value of γ = 0.250 was clearly out of this band. However, at zone B (high chamfer angles), the slope of the lines progressively increased with γ. In any case, it should be highlighted that the slope of lines in zone B was notably lower than the slope of lines in zone A and, consequently, a soft influence on the radial SCF can be considered for high chamfer angles α > α*.
These results can be understood by taking into account the aforesaid effects of the hub chamfer angle on the stress distributions previously shown in Figure 7. Thus, the high variation of Kr for chamfer angles lower than α* is linked to the progressive reduction of the stress at the hub edge surroundings (ζ > 0.8 in Figure 7), reaching an almost plane distribution, i.e., without stress concentrations, for hub chamfer angles close to α*. Therefore, for such a case, the radial stress was similar to the theoretical value and, consequently, the value of the radial SCF was close to 1. For chamfer angles higher than α*, the radial stress at the hub edge (ζ = 1) was lower than the stress at the inner points (ζ = 0) and, consequently, the maximum value was placed at the hub center. In addition, a soft reduction of the radial stress at the inner points with regard to the theoretical value (given by Equation (2)) is observed in Figure 7 as the chamfer angle increased. Therefore, the radial SCF value given by Equation (5) is slightly lower than 1, as observed in Figure 10a, since the maximum radial stress at the hub center (ζ = 0) was lower than the value given by theory. This means that a loss of contact pressure (equal to radial stress) would appear if high chamfer angles were used. This is an undesirable scenario since a loss of contact pressure would lead to a loss of the maximum transmitted torque and the performance of the interference fits would be reduced.
In Figure 10b the variations of radial SCF, Kr (z–axis), with the chamfer angle, α (x–axis) and hub thickness, γ (y–axis) are represented in a 3D plot. In this plot, the sections of the surface for a given value of hub thickness γ (y–axis) are the curves shown in Figure 10a. In addition, the curves included in the sections of the surface for α = 0° reveal the influence of the hub thickness γ in conventional hubs (curve A) and, in a similar way, the section for the highest chamfer angle considered (α = 30°) reveals the variation of the previously discussed loss of Kr obtained for high chamfer angles (curve B).
Furthermore, the non–linear variation of the transition chamfer angle, α*, with the chamfer height γ was also observed (curve C). Regarding curve A, as the hub thickness γ increased, the radial SCF increased too, reaching a maximum value for γ = 0.5, and later Kr softly decreased up to γ = 1. On the other hand, curve B showed a progressive decrease of the radial SCF as γ increased from Kr =1 for the low chamfer thickness (γ < 0.375) up to Kr = 0.82 obtained for the high hub thickness (γ = 1). Finally, the transition chamfer angle (curve C) had a non–linear variation with γ.
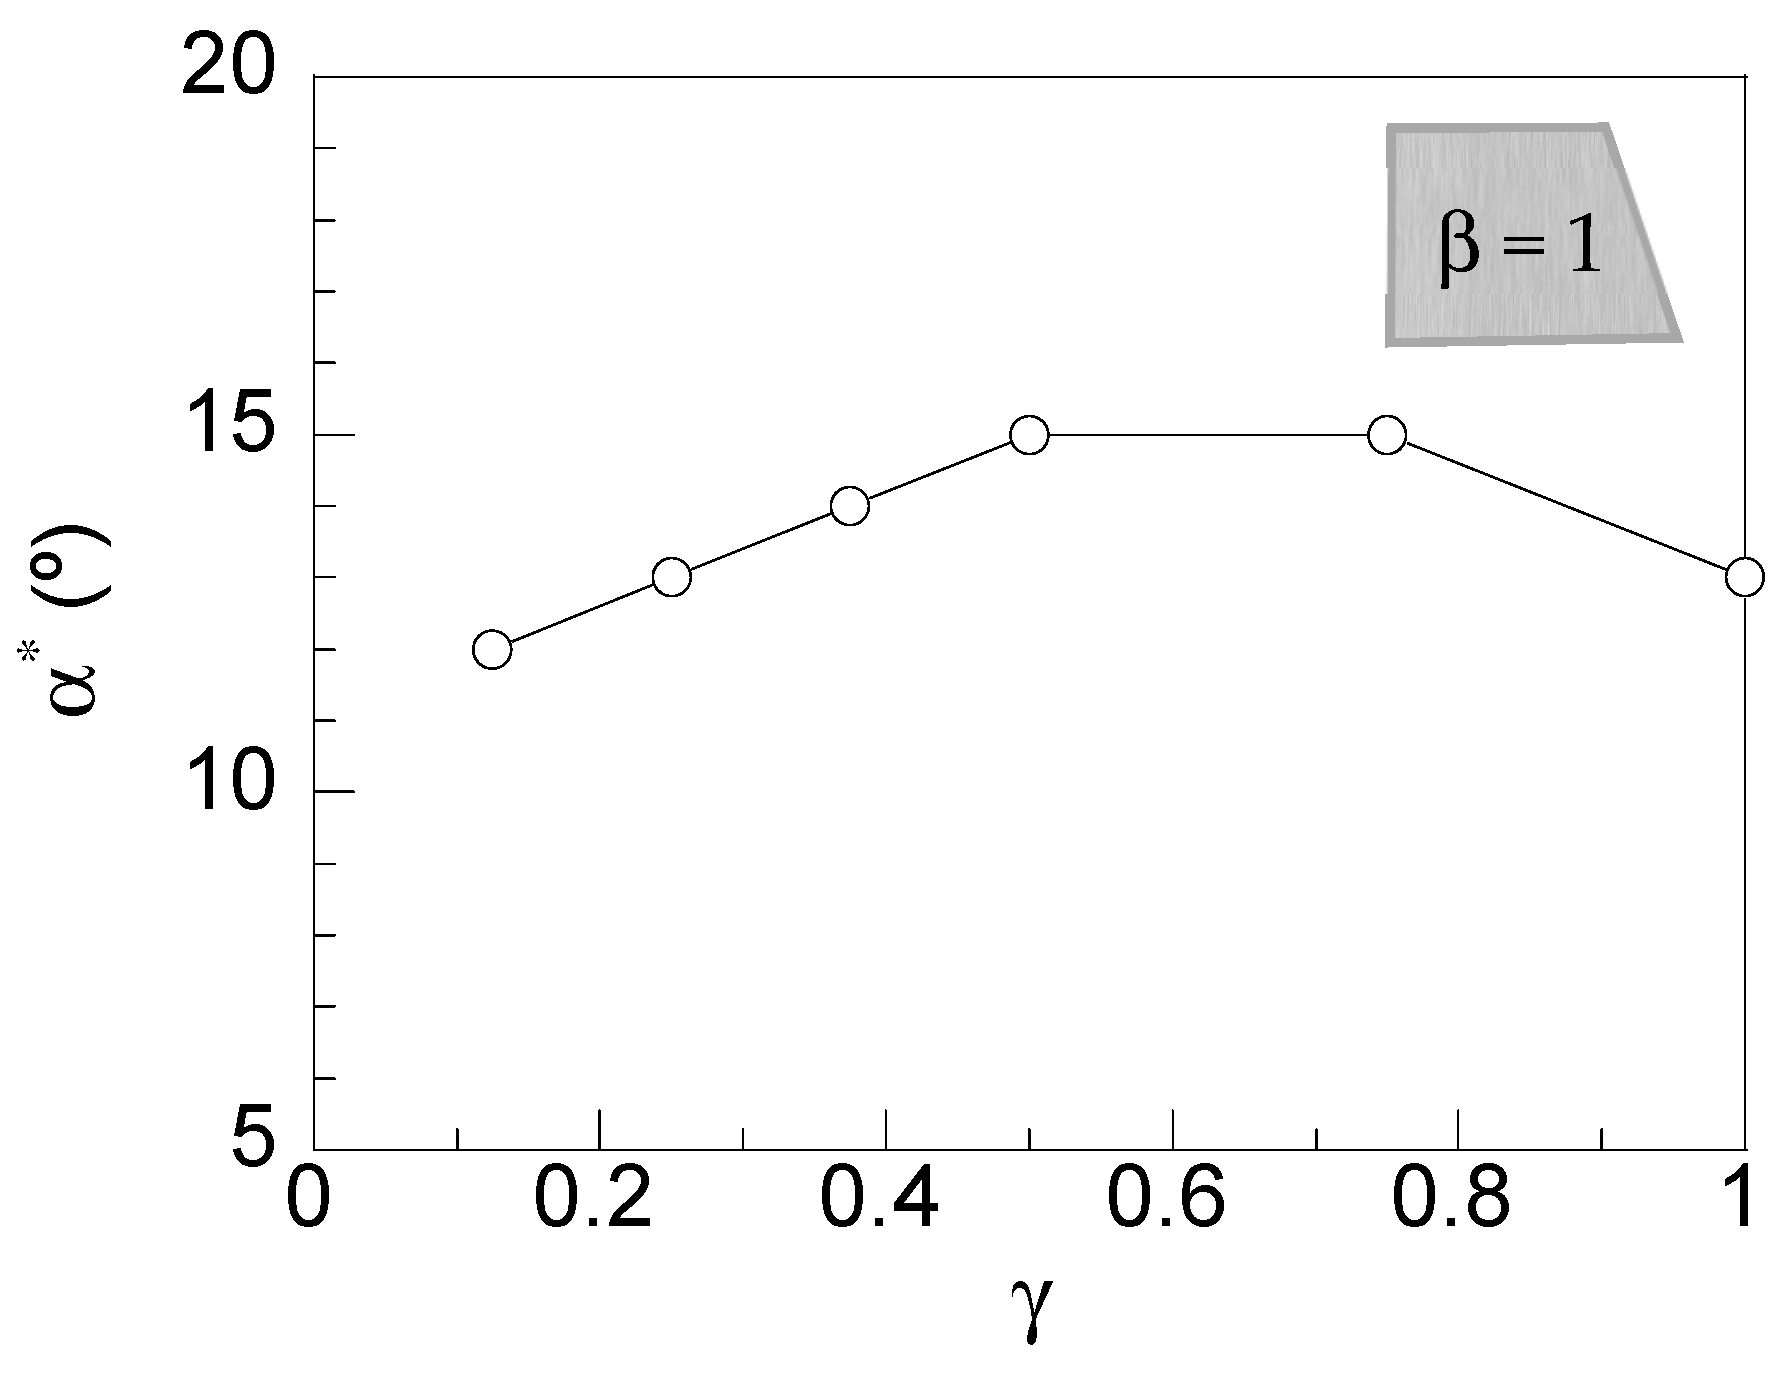
To go deeper in the analysis, taking into account the relevance of the variations of the transition chamfer angle for the design of chamfer hubs, the variation of such a parameter with the hub thickness is plotted in Figure 11. Thus, for the low hub thickness (γ < 0.5), the transition chamfer angle increased from 13° to 15°. For the medium hub thickness (0.5 < γ < 0.75), α* does not depend on γ and, finally, α* decreased for the high hub thickness (γ = 1). This result is quite interesting since, by using the curve shown in Figure 11, the optimal chamfer angle can be selected for a given hub thickness. In this way, the optimal chamfer angle is the same, α = 15°, for the most common values of the hub thickness, 0.5 < γ < 0.75, making the design of chamfer hubs much easier.
The value of tangential SCF for conventional hubs (α = 0°) was almost the same for all hub thicknesses considered and it was slightly higher than 1, (Kt = 1.07). The variation of the tangential SCF, Kt, linearly increased with the hub chamfer angle as shown in Figure 10c for all the hub thicknesses analyzed. However, the stress concentration level was lower than the one observed in the radial stress. In addition, the slopes of the linear variation of tangential SCF were dependent on hub thickness. Therefore, as the hub thickness increased, the slope of the linear variation also increased. Consequently, the highest values (Kt = 1.46) were reached for high hub thicknesses and high chamfer angles.
Figure 10d shows the 3D plot of variation of Kt (z–axis) with the chamfer angle, α (x–axis) and hub thickness, γ (y–axis). In this plot, the lines shown in Figure 10c are the cuts of the surface for a given hub thickness. The 3D plot (Figure 10d) reveals, on the one hand, the negligible variation of Kt with γ for conventional hubs (plane α = 0°) with an almost straight horizontal line (curve A) and, on the other hand, the non–linearly increasing trend of tangential SCF with the hub thickness for the highest chamfer angle considered (curve B). Therefore, according to these results, the use of high hub thicknesses and high chamfer angles is not recommended since the SCF increased up to 1.46 or, in other words, it increased by 36%.
Finally, regarding the von Mises SCF, a progressive reduction of such variable was observed as the chamfer angle increased up to a value close to 1 (KvM = 1.05) for high chamfer angles (α > 20°). This reduction is dependent on the hub thickness. Therefore, the von Mises SCF becomes progressively higher as the hub thickness increases for conventional hubs (α = 0°) and, consequently, a higher reduction is observed for high hub thickness cases. This variation can be explained by taking into account two competitive effects: the high decrease of the radial SCF, as shown in Figure 10a (zone A), and the soft increment of the tangential SCF, as shown in Figure 10c. Notice that the axial stress was considered null according to theory. Thus, for low chamfer angles (zone A) the decrease of the von Mises SCF is linked to the high decrease of the radial SCF since the increment of tangential SCF for low chamfer angles (α > α*) was soft and, on the other hand, for high chamfer angles (α > α*) the von Mises SCF was similar for all the cases since the decrease of the radial SCF (zone B) was compensated by the increase of the tangential SCF.
In a similar way, a 3D plot is included in Figure 10f to visualize the variations of the von Mises SCF (z–axis) with chamfer angle, α (x–axis) and hub thickness, γ (y–axis). The curves shown in Figure 10e are the cuts of the surface for a given hub thickness. In addition, the curve A shows the variation of the von Mises SCF for conventional hubs (plane, α = 0°). In this way, a nonlinear increment of KvM was observed as the hub thickness increased, similar to the variations observed in radial SCF, i.e., high variations for low hub thicknesses and soft variations for high hub thicknesses. However, for high chamfer angles (curve B) no variations with different hub thicknesses were observed.
Therefore, according to these results, chamfer angles close to the transition chamfer angle (13° < α < 15°) caused a huge decrease of the Kr (86%), reaching values close to 1 with a soft increment of the Kt (16%) with regard to the SCFs in a conventional hub. As a result, the von Mises SCF was also reduced to a value close to 1.1 with a reduction of about 16%. Therefore, using chamfer angles within the proposed range (13° < α < 15°), the values given by the theoretical equations can be used in the design of chamfer hubs for estimating the real stress state of the interference fit with low radial, tangential, and von Mises SCFs, or, in order words, with more uniformly distributed stresses at the shaft–hub interface than achieved when using conventional hubs.

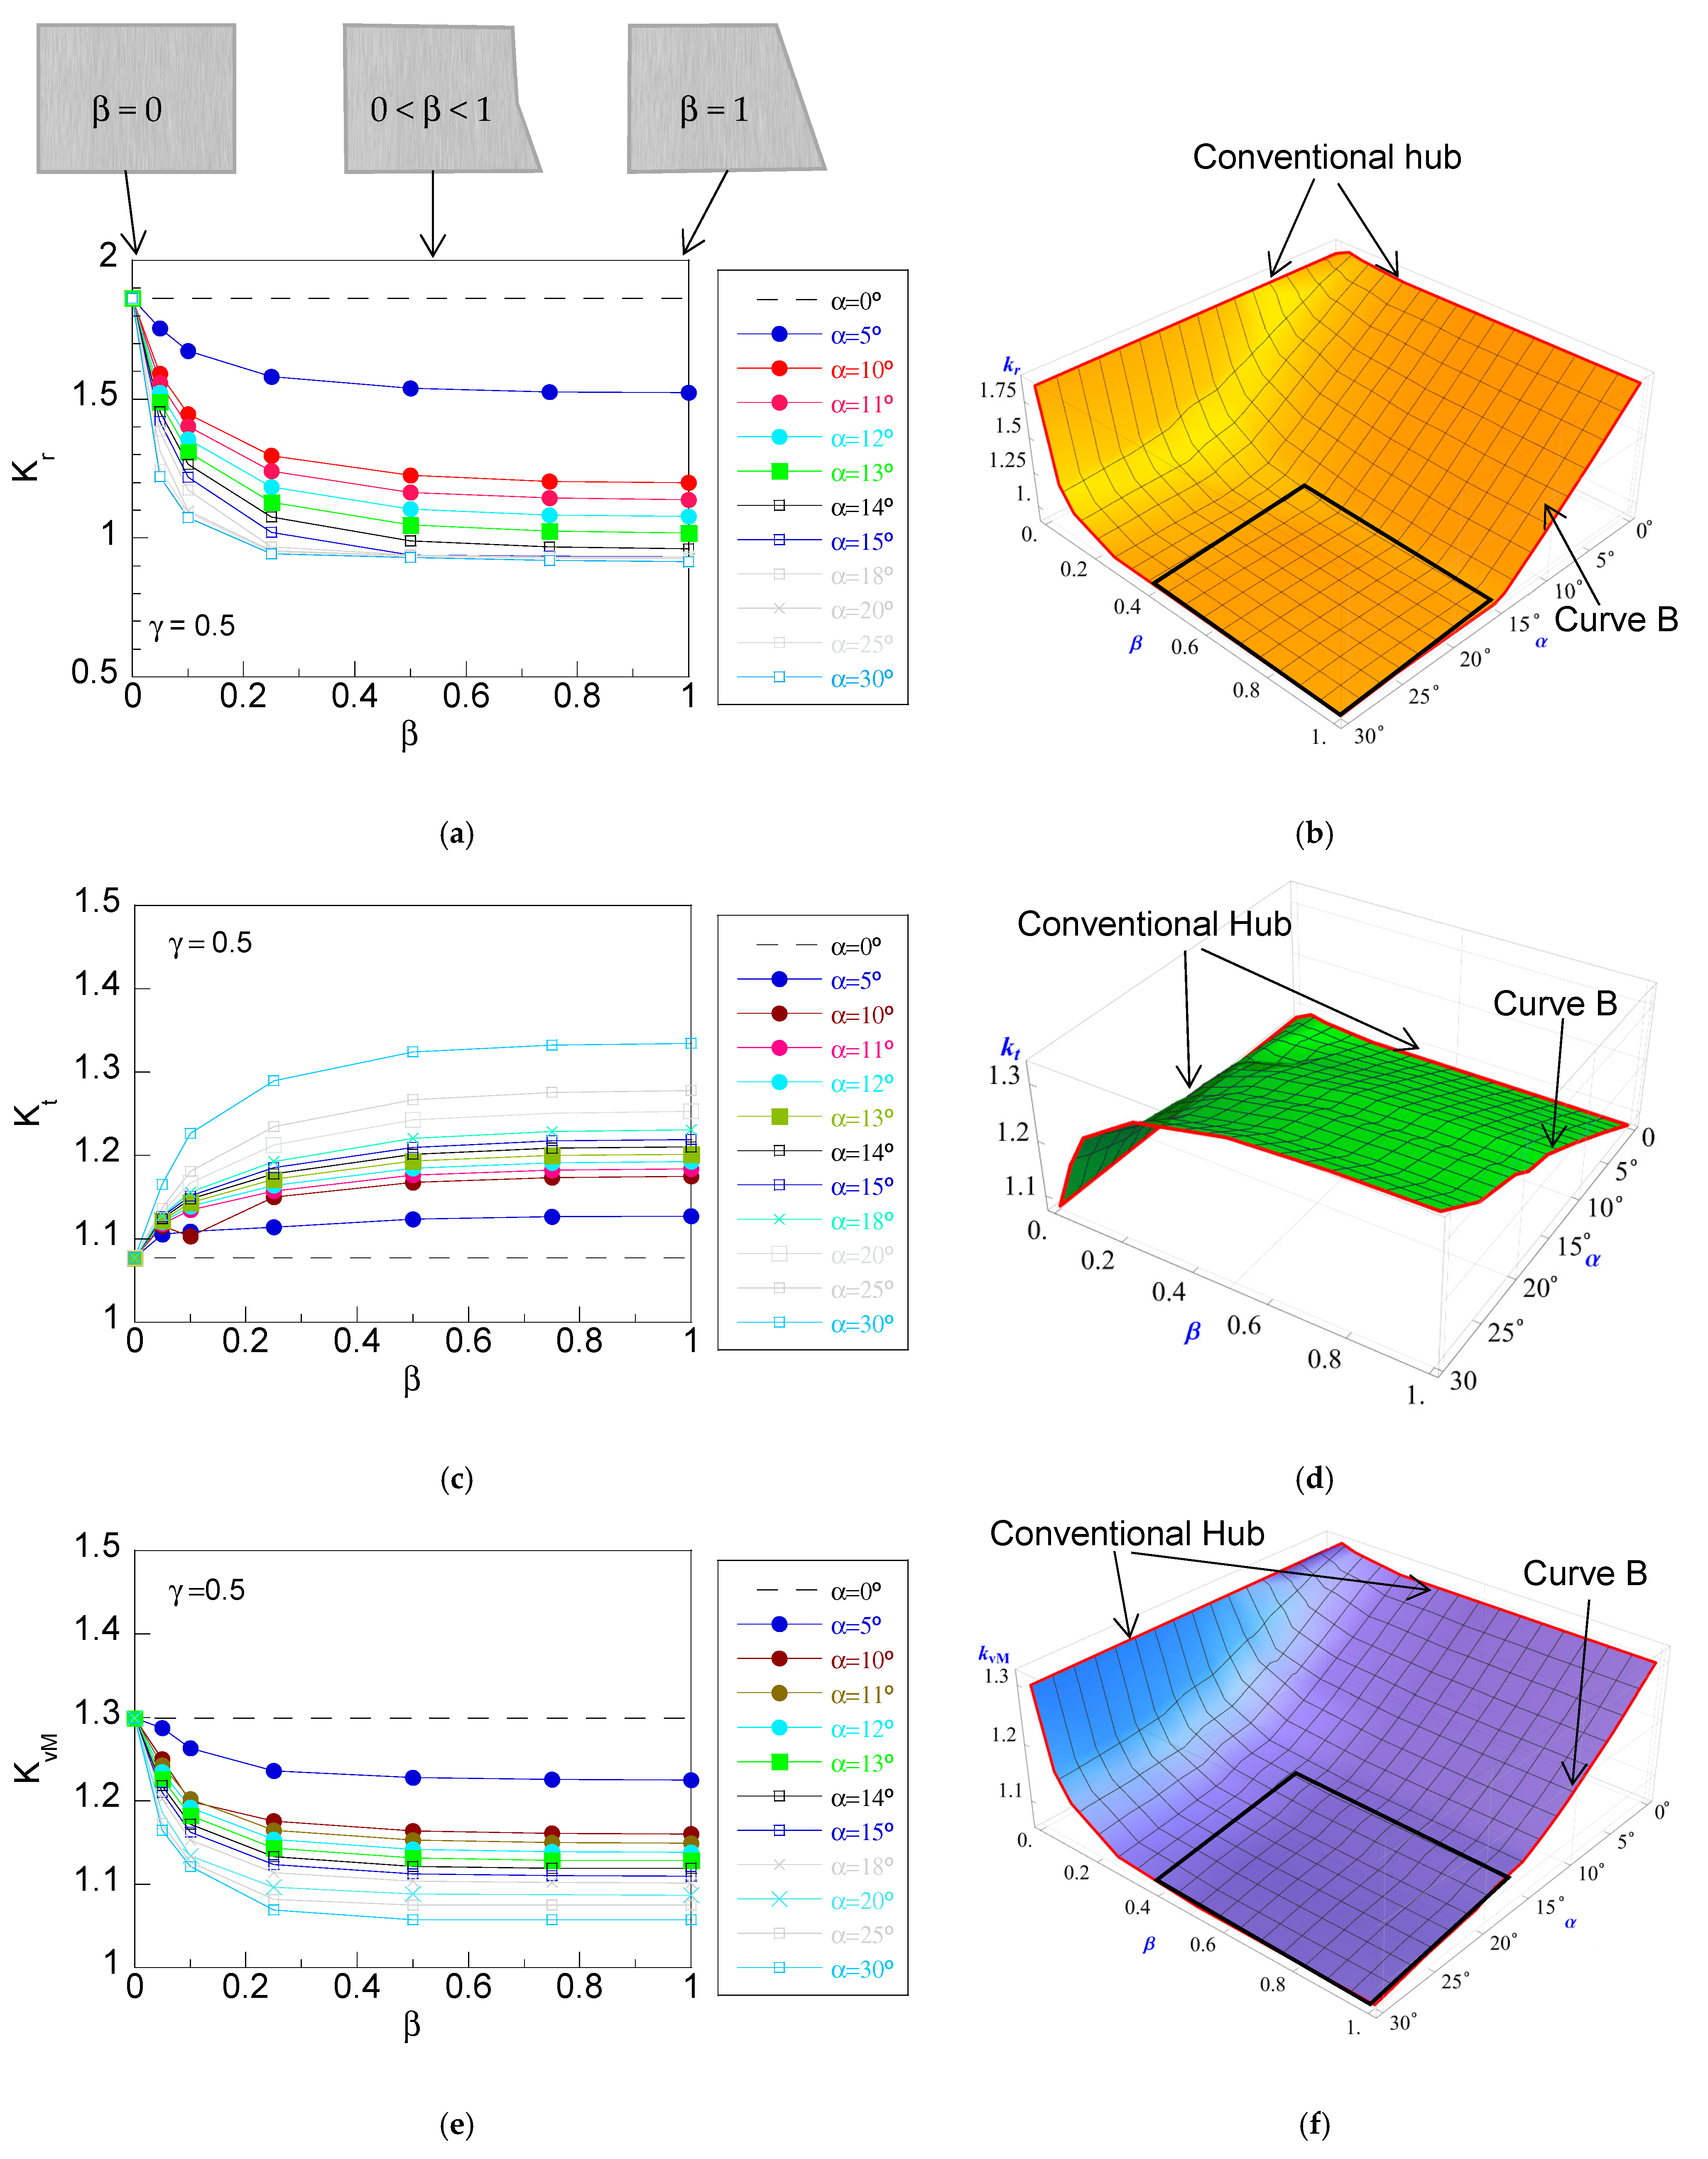
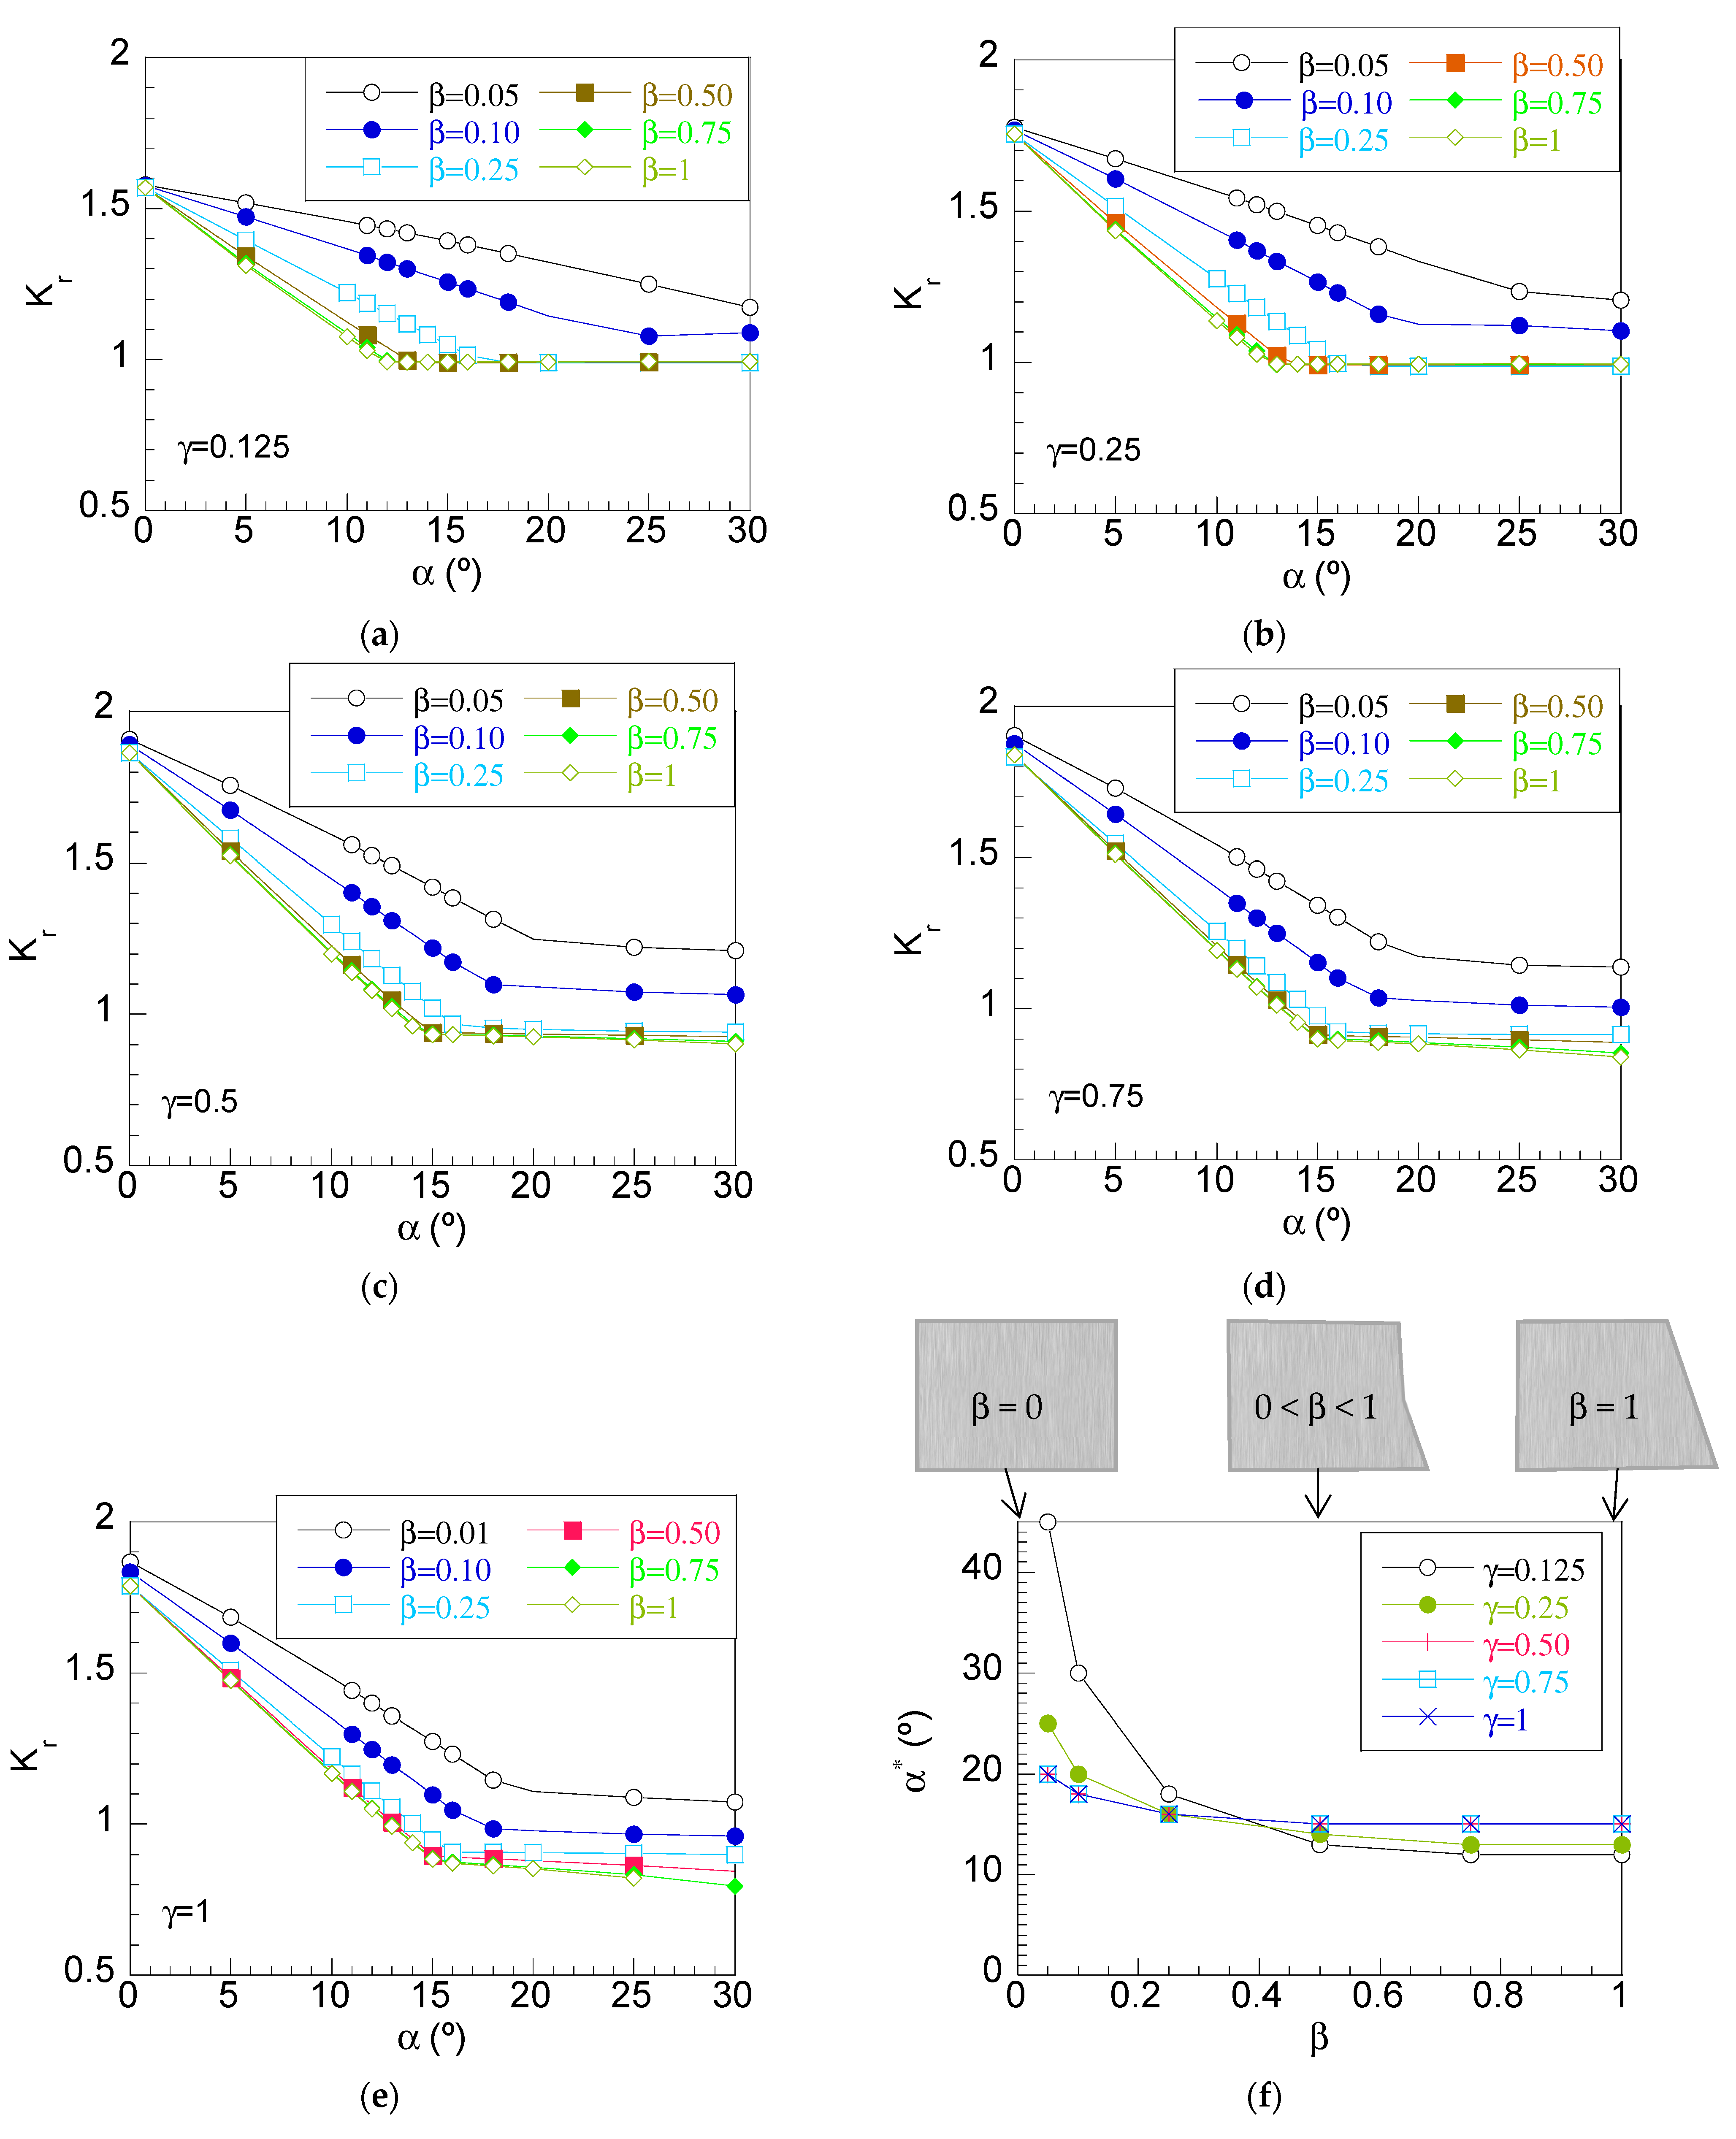
3.2. Stress Concentrations in Partial–Chamfer Hubs (0 < β < 1)

A partial–chamfer hub can be defined by three parameters: the chamfer height lr, the chamfer angle, α, and the hub thickness, t. In this study, the influence of each one of them on the stress concentrations at the shaft–hub interface was analyzed. The variations of the SCFs Kr, Kt, and KvM with the dimensionless chamfer height β are represented in Figure 12 for diverse values of the chamfer angle with a fixed value of the hub thickness, i.e., γ = 0.5.
Notice that the conventional hub was created either for a null chamfer angle, α = 0° (for any value of β) or for a null chamfer height, β = 0 (for any value of α). Taking this into account, the variation of the SCF Kr, Kt, and KvM with β clearly does not exist, it shown in the horizontal lines for the α = 0° case in Figure 12a,c,e. In addition, the values of Kr, Kt, and KvM for β = 0 (null chamfer height, i.e., conventional hub) were the same for all the curves plotted in Figure 12a,c,e, i.e., for any value of the considered chamfer angle. Thus, according to the results, a nonlinear variation of Kr with β was observed for different values of the hub chamfer angle. Thus, a high decrease of radial SCF was obtained for low values of the chamfer height, reaching a uniform horizontal distribution for intermediate and high values of β. Therefore, the minimum reduction of the SCF was reached for full–chamfer hubs (β = 1), but a similar reduction could be also obtained by using intermediate and high chamfer heights. For the sake of clarity, the transition chamfer height (β*) is defined as the value of β where the uniform distribution of SCF is reached. According to the results shown in Figure 12a, transition chamfer height was dependent on the chamfer angle. Thus, the value of β* progressively decreased as the chamfer angle increased. In this way, for high chamfer angles, the uniform distribution was reached for a chamfer height as low as 0.25, whereas for intermediate chamfer angles (10° < α < 15°) was β = 0.5.
Figure 12b shows a 3D plot where the variations of radial SCF, Kr (z–axis) with chamfer height, β (x–axis), and chamfer angle, α (y–axis) can be observed. Thus, the curves shown in Figure 12a are in fact sections of the surface shown in the 3D plot for different planes corresponding to a given chamfer angle.
The line in the plane β = 0 and the line in the plane α = 0° represent the conventional hub; hence, no variation appeared with the other variables. The curve shown in the plane β = 1 (full–chamfer hub) is the two–linear variation previously outlined in Figure 10a with a sudden decrease of radial SCF as α increased up to the transition chamfer angle and later followed by a soft decrease. From Figure 12b, the design zone is clearly visualized as the uniform plane zone within the range of the parameters α > 15° and β > 0.4 where the values of Kr were close to 1. Therefore, the stress concentration was reduced, and the design equations are valid for estimating the real stress state.
Regarding the tangential SCF, as was discussed above, for β = 0 (conventional hub) the tangential SCF was the same for all the values of the chamfer angle, α. The variation with the chamfer height, β, was nonlinear with a sharp increase for low chamfer heights until reaching a horizontal uniformity similar to that obtained for full–chamfer hubs (β = 1). The effect of the chamfer angle on tangential SCF was the opposite of the one observed in the radial SCF. Therefore, the value at which the stable value was reached (transition chamfer height, β*) increased as the hub chamfer angle increased. By using high chamfer angles, tangential SCFs as high as 1.3 were obtained; however, if intermediate chamfer angles (13° < α < 15°) were selected, the tangential SCF was slightly incremented.
Figure 12d shows the 3D plot of the variations of tangential SCF, Kt (z–axis) with chamfer height, β (x–axis) and chamfer angle, α (y–axis). Notice that the curves shown in Figure 12c are sections for different values of the hub chamfer angle. Thus, the lowest values of tangential SCF were obtained for the conventional case (either line at the plane β = 0 or line at the plane α = 0°). In addition, the curve included within the plane β = 1 (full–chamfer hub) showed a progressive increment of the Kt with the chamfer angle. In this way, the highest tangential SCF was reached for full–chamfer hubs (β = 1) and the highest chamfer angle (α = 30°). In fact, this is just the opposite trend of radial SCF. However, for values of α and β within the recommended range (13° < α < 15° and β > 0.5) previously established for the radial SCF, the increments of the tangential SCF were not so significant. In any case, the effect of the chamfer geometry is clear: a redistribution of stress that reduces radial stress and increases tangential stress. Therefore, cases causing a high reduction of radial stress will exhibit a high increment of tangential stress and vice versa.
Finally, regarding the von Mises SCF, the variation was quite similar to the one observed in the radial SCF. Thus, the highest SCF, as high as 1.3, was obtained for the conventional hub case (either β = 0 or α = 0°). As the chamfer height β increased, the von Mises SCF decreased until reaching a uniform value equivalent to the one obtained for full–chamfer hubs (β = 1). As the chamfer angle increased, the SCF decrease became sharper and the value of the transition chamfer height, β* (for which the stable value is reached) was obtained for lower values of the hub thickness in a similar way to that of the radial SCF trend shown in Figure 12a. This supposes that the lowest value of von Mises SCF corresponding to full–chamfer hubs (β = 1) is also obtained for partial–chamfer hubs with hub thickness higher than the transition chamfer height. This parameter is dependent on the chamfer angle α. Thus, for intermediate angles (α < 15°), β* was higher than 0.5, and for high chamfer angles β* was as low as 0.25. It should be highlighted that chamfer angles that significantly reduce the radial SCF also reduce the von Mises SCF. Therefore, the effect of the radial SCF and tangential SCF on the von Mises SCF is clear. The high reduction of the radial SCF compensates for the increment of the tangential SCF, obtaining a reduction of the von Mises SCF. Therefore, the use of the chamfer hubs with the proposed values allows the reduction of the maximum von Mises stress in the shaft–hub interface. In this way, plasticity is less likely to occur at the hub interface.
Figure 12f shows the 3D plot of the variations of von Mises SCF, KvM (z–axis) with chamfer height, β (x–axis), and chamfer angle, α (y–axis). A similar trend to the one previously discussed for the radial SCF was observed but with softer variations. In a similar way, the edges for planes β = 0 and α = 0° represent the conventional hub reaching the maximum KvM. In addition, the sections of the surface for different chamfer angles are the curves shown in Figure 12e. Moreover, the section of the 3D surface for β = 1 (full–chamfer hub case) revealed a two–linear variation with the chamfer angle but in this case with softer changes than in the variations observed in radial SCF. In a similar manner to the radial SCF 3D plot (Figure 12b), an almost flat surface of minimum von Mises SCF appeared for values of the chamfer height (0.4 < β < 1) and chamfer angles (α < 15°). Consequently, partial–chamfer hubs with a chamfer height higher than 0.5 and chamfer angles between 13° and 15° will exhibit the optimal behavior, a huge reduction of radial SCF, a reduction of von Mises SCF, and a soft increment of the tangential SCF.
To go deeper into the analysis, the variation of the radial SCF with the chamfer angle for a given hub thickness is represented in Figure 13 for different values of the chamfer height β. Notice that the curves included in this figure are sections of the 3D surface shown in Figure 12b discussed above. A two–linear variation of the radial SCF with the chamfer angle was obtained in partial–chamfer hubs similar to the one previously observed in full–chamfer hubs (Figure 10a). Thus, the maximum value of SCF was located at α = 0° (conventional hub) and it progressively decreased as the chamfer angle increased (zone A) until reaching a certain value where the SCF was uniform (zone B).
For low hub thicknesses (γ = 0.125) and low chamfer heights (β < 0.1), the transition chamfer angle appeared at high chamfer angles, α = 45°. However, as the chamfer height increased, the transition chamfer angle progressively reduced until reaching α* = 13° for a chamfer height β = 0.5. For higher chamfer heights β > 0.5, the curves were quite similar. In addition, for low hub heights (β < 0.1), the SCFs at zone B were higher than 1 and they progressively decreased until reaching a value close to 1 for chamfer heights β > 0.5.
A similar trend was observed for higher hub thicknesses γ (Figure 13b–e), but in these cases, the transition chamfer angle α* for the lowest chamfer height considered (β = 0.05) was progressively lower than the one observed in γ = 0.125 as the hub thickness increased. Differences were only noticeable for low chamfer heights since curves for γ > 0.50 only exhibited slight differences. In addition, the minimum radial SCF (zone B) was always 1 for hub thicknesses lower than 0.5. For γ > 0.5, the minimum Kr decreased as the chamfer height increased, always reaching the lowest value for the full–chamfer hub case (β = 1).
Furthermore, it is noticeable that from hub thickness γ > 0.5, zone B is not a horizontal line and a slight decrease of Kr with the chamfer angle was observed, reaching values below 1. The slope of zone B increased with the chamfer height and, hence, values of radial SCF as low as 0.82 were obtained for full–chamfer hubs (β = 1) with high chamfer angles. Note that the decrease of radial SCF below 1 is not adequate, since it means a loss of the contact pressure and consequently a loss of the maximum transmitted torque. Therefore, it can be concluded that high values of γ are not adequate. Therefore, the recommendation is clear: hub thicknesses, γ higher than 0.5 are not recommended due to the loss of contact pressure and hubs with chamfer heights β lower than 0.5 are also not recommended; the optimal chamfer angle, α, is within the range 13° < α < 15°.
Finally, the transition chamfer angle, α*, was obtained from curves plotted in Figure 13a–e and the variation of such a parameter with the chamfer height β for different values of the hub thickness γ is represented in Figure 13f. This plot is a useful tool for designing interference fits with partial–chamfer hubs since it allows obtaining the chamfer angle, α, and the chamfer height, β, that reduce the radial SCF for a given hub thickness γ. According to the results, a decrease of the transition chamfer angle with the chamfer height was observed up to β = 0.5 and, afterward, a uniform value was obtained up to the full–chamfer hub case (β = 1). The variations were sharper for low values of the hub thickness γ < 0.25 and for hub thicknesses higher than 0.5, the variation of the transition chamfer angle, α*, was the same for all the hub thicknesses considered. Low hub chamfer heights can be discarded since the radial SCFs at zone B (Figure 13a–e) were higher than 1. Taking these results into account, the use of partial–chamfer hubs with hub thicknesses γ = 0.5 and hub chamfer heights β = 0.5 would cause the same effects in terms of reducing the radial and von Mises SCF observed in full–chamfer hubs. Therefore, the design of partial–chamfer hubs is straightforward; the optimal chamfer angle is α = 15° considering chamfer heights β higher than 0.5 when using hub thickness γ = 0.5. In this way, the SCF would be as low as 1, which means that the SCF would be reduced at the interface and, consequently, the design equations could be used for predicting the real stress state of an interference fit.
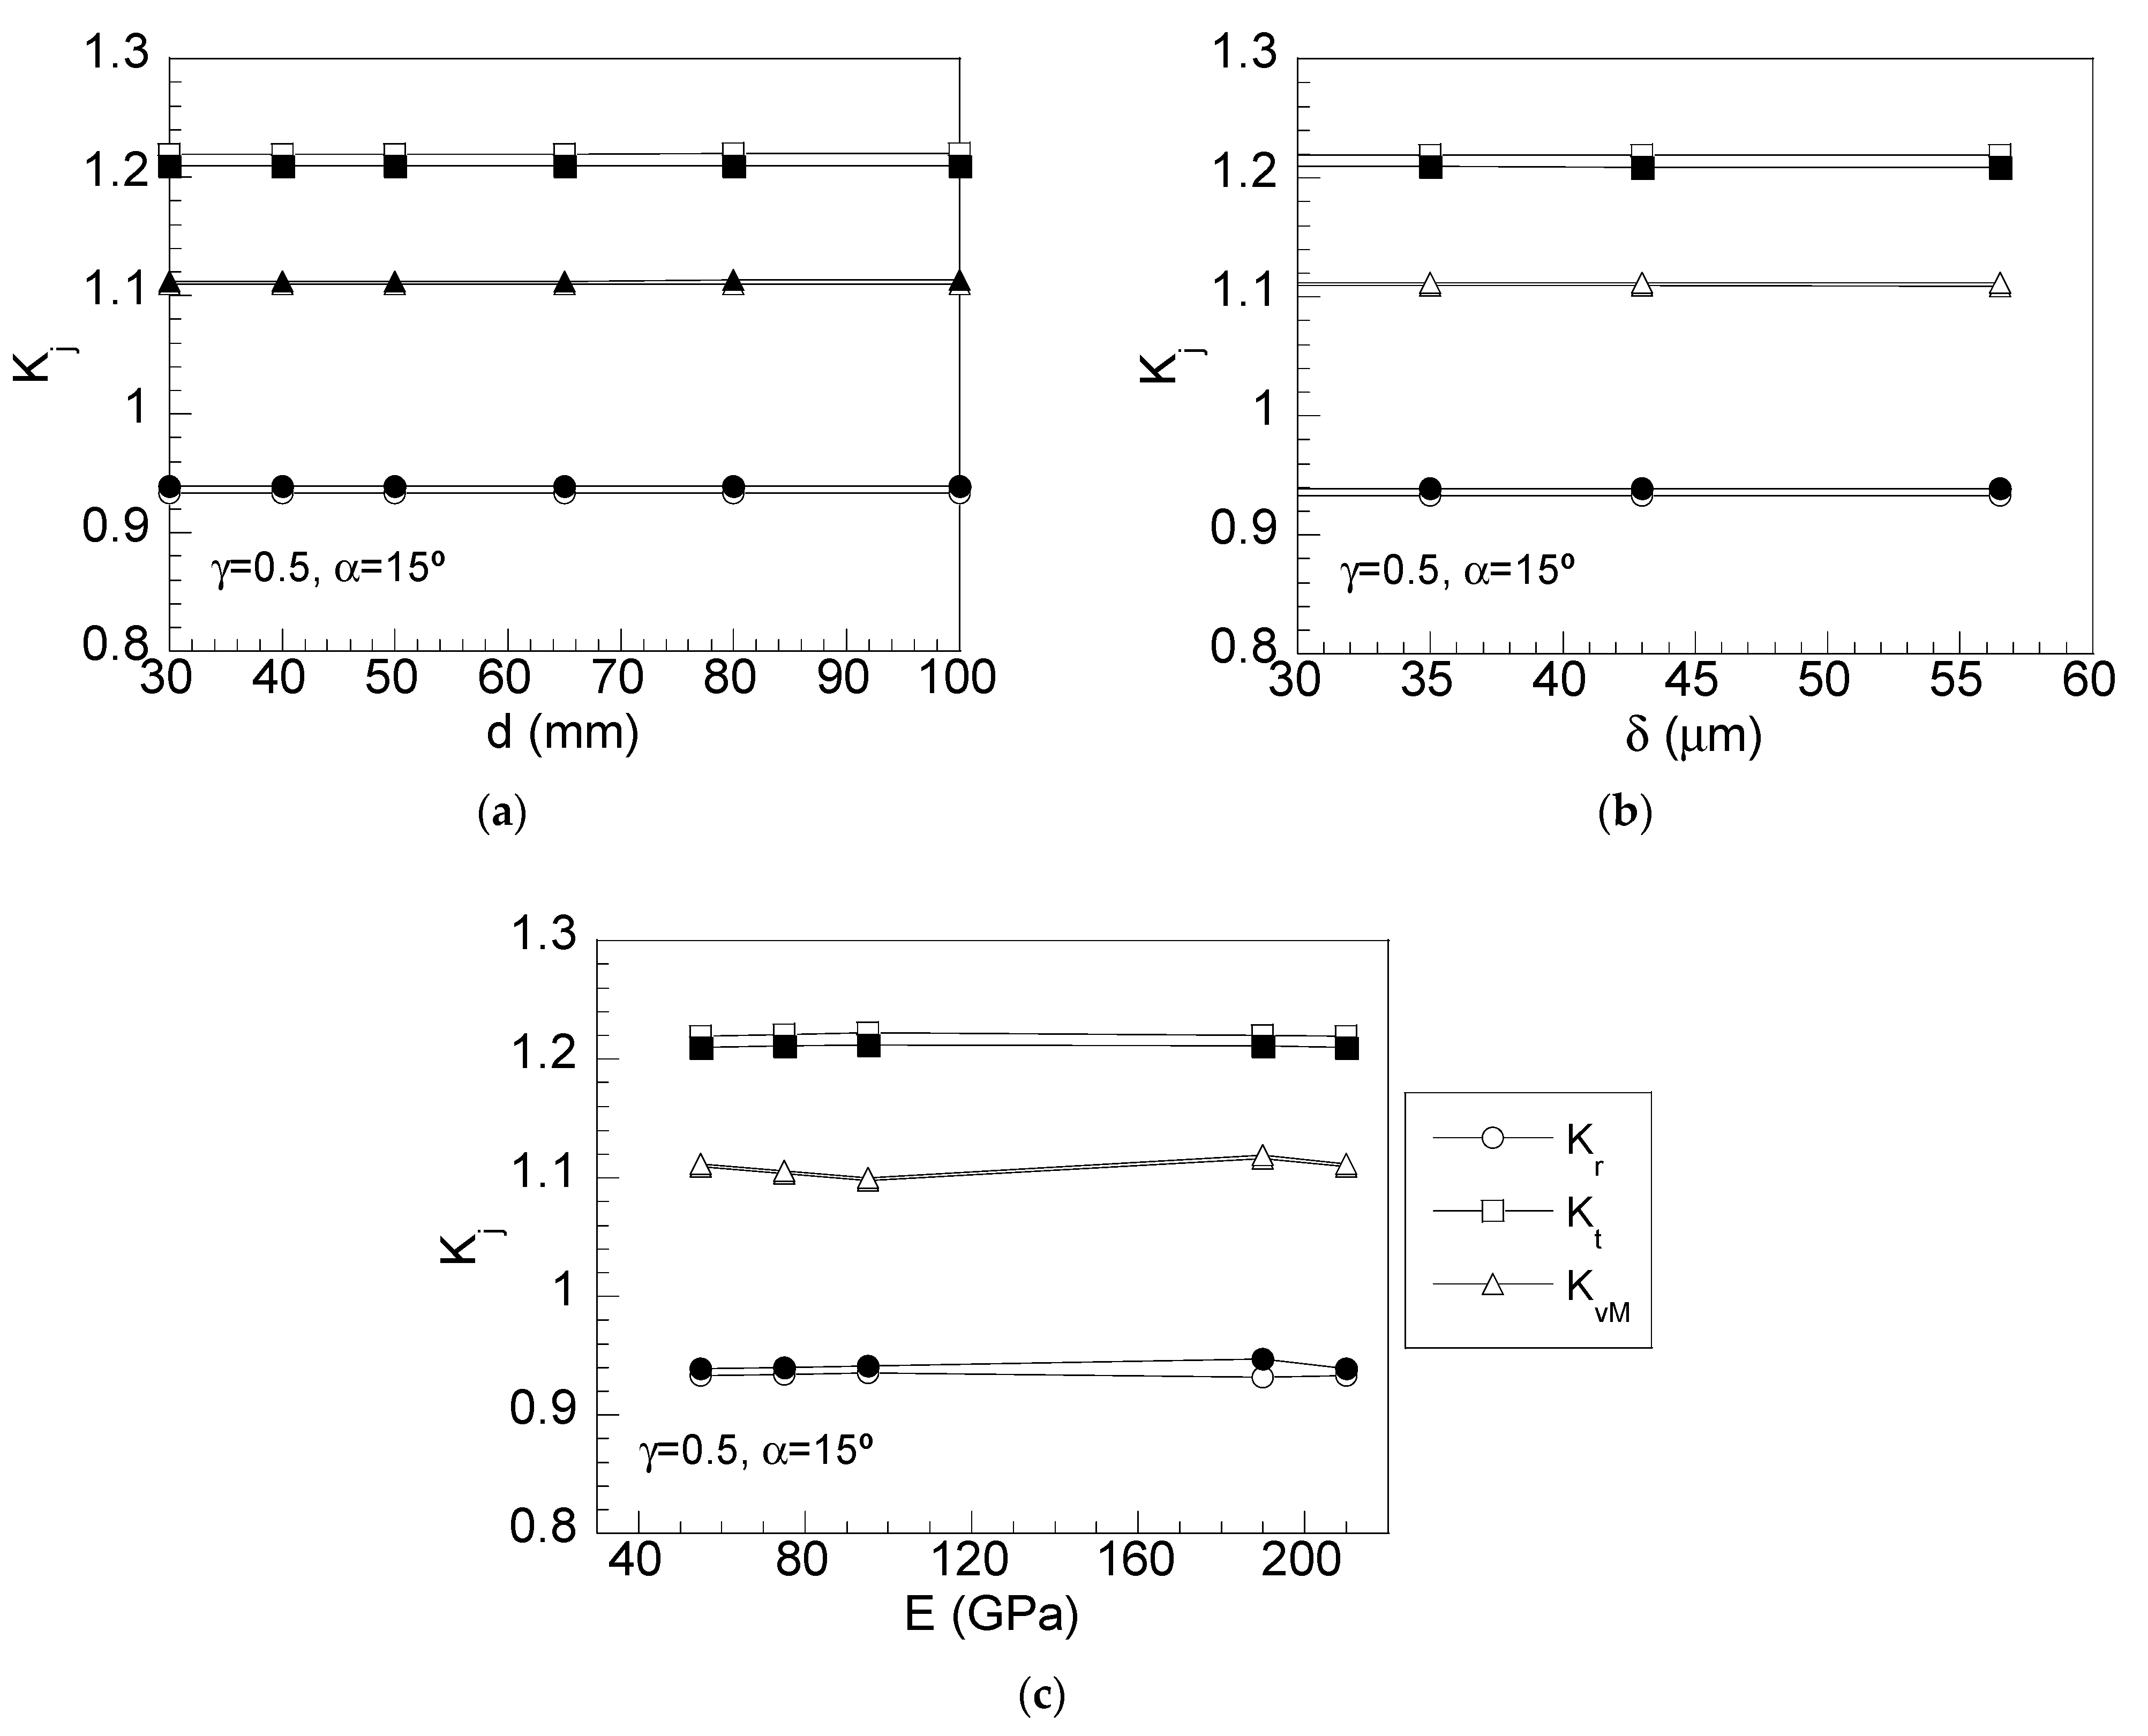
Additional simulations were considered to check the validity of the proposed design parameters for different shaft/hub dimensions, diverse interference fits, or different materials. Thus, six different shaft dimensions were considered (two lower and three higher than the reference case) with the same interference fit H7s6 and the same length ratio l/L = 4. For all shaft dimensions, the design conditions previously proposed for full chamfer (α = 15°, γ = 0.5) and partial–chamfer hubs (α = 15°, β = 0.5, γ = 0.5) were analyzed. Thus, the cases considered are the following: (i) 30H7s6; (ii) 40 H7s6; (iii) 50 H7s6 the reference case; (iv) 65 H7s6; (v) 80 H7s6, and, finally, (vi) 100H7s6. The results showed that the radial stress at the hub edge was lower than the radial stress at the hub center for all cases analyzed in a similar way as observed, in Figure 7, for the reference case. Consequently, the SCF reduction was the same for all the cases analyzed, and, hence, the proposed geometry led to the same reduction for any shaft diameter (Figure 14a).
Regarding the second analysis, five interference fits recommended by the ISO standard for fits and tolerances [12] were tested for a shaft diameter of 50 mm as follows: (i) 50H7x6 (δ = 56.5 μm); (ii) 50H7u6 (δ = 43 μm); (iii) 50H7t6 (δ = 35 μm); (iv) the reference case, 50H7s6 (δ = 29.5 μm); and (v) 50H7r6 (δ = 24 μm). In a similar way as previously discussed, the same SCF reduction was achieved for all the cases of study (Figure 14b) and, hence, the proposed geometry led to similar values for any interference fit selected from the ISO standard recommendation.
Finally, four different metallic materials were selected for the reference case 50H7s6 as follows: AISI 1080 steel (reference case); (ii) stainless steel 316L (E = 190 GPa, ν = 0.27); (ii) titanium (E = 95 GPa, ν = 0.36); (iii) aluminum (E = 75 GPa, ν = 0.33); and finally a (iv) a magnesium–aluminum alloy (E = 55 GPa, ν = 0.30). The results showed a slight variation of the SCF with the Young’s Modulus (Figure 14c) but, for any case, the SCF reductions were always similar for all the cases analyzed.

4. Conclusions

In this paper, the stress distributions and stress concentration factors at the shaft–hub interface in interference fits with a chamfer hub were analyzed. This modified hub only requires two parameters for defining the hub geometry for a given hub thickness: the chamfer angle, α, and the dimensionless chamfer height, β. According to the obtained results the following conclusions can be drawn:
  • Full–chamfer hubs caused a progressive reduction of the radial stress at the hub edge as the chamfer angle increased, reaching an almost uniform distribution of radial stress (or in other words, of contact pressure) for medium chamfer angles (α = 15°).
  • Although radial stress was reduced at the hub edge, the tangential stress was slightly increased. Nevertheless, the von Mises stress was also reduced at the hub edge, reaching a more uniform distribution at the shaft–hub interface than conventional hubs.
  • The use of chamfer hubs with high chamfer angles causes a loss of contact pressure because of a high reduction of the radial stress nearby the hub edge and a soft reduction of radial stress at the hub center. This loss produces a reduction of the maximum transmitted torque and, hence, high values of chamfer hubs are not suitable.
  • A curve of recommended chamfer angles to be selected in the design of full–chamfer hubs for different hub thicknesses γ is proposed. Taking this into account, the optimal chamfer angles are within the interval 13° < α < 15° for commonly used hub thicknesses 0.375 < γ < 0.5.
  • By using full–chamfer hubs with the proposed chamfer angles, a complete removal of radial stress concentration was achieved with a slight increment of tangential SCF and a reduction of the von Mises SCF. In this way, a more accurate estimation of the stress fields at the hub–shaft interface can be obtained by using the design equations given by theory.
  • Partial–chamfer hubs with a hub height higher than β > 0.4 and chamfer angles α > 15° exhibited a significant reduction of radial SCF with a slight increase of tangential SCF and a decrease of the von Mises SCF similar to the ones obtained by using full–chamfer hubs.
  • Curves of recommended chamfer angles to be selected in the design of partial–chamfer hubs for different chamfer heights β and hub thicknesses γ were proposed. According to the results, the optimal values to be used for designing partial–chamfer hubs are chamfer heights higher than β > 0.5, hub thicknesses γ = 0.5, and chamfer angles α = 15°.
  • By using the proposed optimal values, the same reductions on stress concentrations observed for full–chamfer hubs were obtained in partial–chamfer hubs and, consequently, the design equations can be used for estimating the real stress state at the shaft–hub interface.

Author Contributions

Conceptualization, M.L.; Data curation, M.L. and E.I.; Formal analysis, M.L., E.I. and R.G.-M.; Funding acquisition, M.L.; Investigation, M.L., E.I., M.R.-M. and R.G.-M.; Methodology, M.L.; Software, M.L., E.I. and R.G.-M.; Supervision, M.L., M.R.-M. and R.G.-M.; Validation, M.L.; Writing—original draft preparation, M.L. and E.I.; Writing—review and editing, M.L., E.I., M.R.-M. and R.G.-M. All authors have read and agreed to the published version of the manuscript.

Funding

This research was funded by the Fundación Memoria D. Samuel Solorzano Barruso, grant numbers FS/32-2017 and FS/12-2021 and MCIN/AEI/10.13039/501100011033, grant number PID2020-119003GB-I00.

Institutional Review Board Statement

Not applicable.

Informed Consent Statement

Not applicable.

Data Availability Statement

Not applicable.

Conflicts of Interest

The authors declare no conflict of interest. The funders had no role in the design of the study; in the collection, analyses, or interpretation of data; in the writing of the manuscript; or in the decision to publish the results.

Abbreviations

dShaft diameter
EYoung’s Modulus
KmMesh factor
Kjj–SCF
KrRadial SCF
KtTangential SCF
KvMvon Mises SCF
lShaft length
lrHub chamfer height
lzHub chamfer length
LHub length
pContact pressure
rRadial coordinate
r0Shaft radius
RHub radius
TMaximum transmitted torque
tHub thickness
zAxial coordinate
αHub chamfer angle
α*Transition hub chamfer angle
βDimensionless hub chamfer height
β*Dimensionless transition hub chamfer height
γDimensionless hub thickness
δRadial interference
εRelative error of FE
ζDimensionless axial coordinate
μFriction coefficient
νPoisson ratio
σrRadial stress
σtTangential stress
σvMvon Mises stress
σj,thj–stress given by theory
σj,FEM-maxMaximum j-stress obtained by FEM

References

  1. Chu, S.J.; Jeong, T.K.; Jung, E.H. Effect of radial interference on torque capacity of press-and shrink-fit gears. Inter. J. Automot. Technol. 2016, 17, 763–768. [Google Scholar] [CrossRef]
  2. Zhao, H. Numerical analysis of the interference fitting stresses between wheel and shaft. Inter. J. Mater. Prod. Technol. 1997, 12, 514–526. [Google Scholar] [CrossRef]
  3. Truman, C.E.; Booker, J.D. Analysis of a shrink-fit failure on a gear hub/shaft assembly. Eng. Fail. Anal. 2007, 14, 557–572. [Google Scholar] [CrossRef]
  4. Radi, E.; Lanzoni, L.; Strozzi, A.; Bertocchi, E. Shaft-hub press fit subjected to bending couples: Analytical evaluation of the shaft-hub detachment couple. Appl. Math. Model. 2017, 50, 135–160. [Google Scholar] [CrossRef]
  5. Zhang, Y.B.; Lu, L.T.; Zou, L.; Zeng, D.F.; Zhang, J.W. Finite element simulation of the influence of fretting wear on fretting crack nitiation in press-fitted shaft under rotating bending. Wear 2018, 400–401, 177–183. [Google Scholar] [CrossRef]
  6. Lorenzo, M.; Pérez-Cerdán, J.C.; Blanco, C. Influence of the thermal assembly process on the stress distributions in shrink fit joints. Key Eng. Mater. 2014, 572, 205–208. [Google Scholar] [CrossRef]
  7. Krol, R.; Siemiatkowski, Z. The analysis of shrink-fit connection the methods of heating and the factor influencing the distribution of residual stresses. Heliyon 2019, 5, e02839. [Google Scholar] [CrossRef]
  8. Apatay, T.; Arslan, E.; Mack, W. Effects of homogeneous and inhomogeneous heating on rotating shrink fits with annular inclusion and functionally graded hub. J. Therm. Stress. 2019, 42, 1458–1479. [Google Scholar] [CrossRef] [Green Version]
  9. Shigley, J.E.; Mischke, C.R. Standard Handbook of Machine Design, 11th ed.; McGraw Hill: New York, NY, USA, 1988. [Google Scholar]
  10. Norton, R.L. Machine Design, 5th ed.; Prentice Hall: New York, NY, USA, 2013. [Google Scholar]
  11. Parsons, B.; Wilson, E.A. A method for determining the surface contact stresses resulting from interference fits. J. Eng. Ind.-T. ASME 1970, 92, 208–218. [Google Scholar] [CrossRef]
  12. ISO 286-1:2010; Geometrical Product Specifications (GPS)—ISO Code System for Tolerances on Linear Sizes—Part 1: Basis of Tolerances, Deviations and Fits. International Organization for Standardization: Geneve, Switzerland, 2010; p. 38.
  13. Prasad, N.S.; Sashikanth, P.; Ramamurti, V. Stress distribution in interference joints. Comput. Struct. 1994, 51, 535–540. [Google Scholar] [CrossRef]
  14. Peterson, E.; Wahl, A.M. Fatigue of shafts at fitted members with related photoelastic analysis. J. Appl. Mech. 1935, 57, A1–A11. [Google Scholar] [CrossRef]
  15. Hao, D.; Wang, D. Finite-element modeling of the failure of interference-fit planet carrier and shaft assembly. Eng. Fail. Anal. 2013, 33, 184–196. [Google Scholar] [CrossRef]
  16. Li, R.; Zhang, C.; Zhan, L.; Cui, Y.; Shen, W. Expanding the applicable duration for shrink fitting of the ultrathin-walled reactor coolant pump rotor-can. Ann. Nucl. Energy 2017, 110, 1217–1223. [Google Scholar] [CrossRef]
  17. Mohan, A.; Julyes Jaisingh, S.; Babu Aurtherson, P. Fatigue analysis of thermal shrink-fit autofrettage in pressure cylinder using finite element analysis. J. Mater. Res. Technol. 2020, 9, 8606–8617. [Google Scholar] [CrossRef]
  18. Shu, Y.; Yang, G.; Liu, Z. Experimental study on fretting damage in the interference fit area of high-speed train wheels and axles based on specimen. Eng. Fail. Anal. 2022, 141, 106619. [Google Scholar] [CrossRef]
  19. Shu, Y.; Liu, Z.; Yang, G. Finite element simulation of fretting wear on railway axle press-fit specimens. Tribol. Int. 2023, 178, 108024. [Google Scholar] [CrossRef]
  20. Lanoue, F.; Vadean, A.; Sanschagrin, B. Finite element analysis and contact modelling considerations of interference fits for fretting fatigue strength calculations. Simul. Model. Pract. Th. 2009, 17, 1587–1602. [Google Scholar] [CrossRef]
  21. Lee, D.H.; Choi, H.Y.; Song, C.Y.; Lee, B.G. Design of stress relief groove on a press-fitted assembly. Adv. Mater. Res. 2013, 753–755, 1339–1342. [Google Scholar] [CrossRef]
  22. Pérez-Cerdán, J.C.; Lorenzo, M.; Blanco, C.; Moreno, P. Analysis of contact stresses in interference fit joints with circumferential round notch on the hub. In Proceedings of the 13th World Congress in Mechanism and Machine Science, Guanajuato, Mexico, 19–23 June 2011; pp. 19–25. [Google Scholar]
  23. Lorenzo, M.; Blanco, C.; Moreno, P.; Pérez-Cerdán, J.C. Influence of geometry on the stress peaks in interference fits with grooved hub. DYNA 2016, 91, 47–51. [Google Scholar] [CrossRef] [Green Version]
  24. Reshetov, D.N. Machine Design, 1st ed.; Mir: Moscow, Russia, 1978. [Google Scholar]
  25. Izard, E.; Garcia, R.; Rodriguez-Martín, M.; Lorenzo, M. Finite Element Analysis of the Reduction in Stress Concentration Factors in Shrink Fits by Using Contact Rings. Appl. Sci. 2022, 12, 10037. [Google Scholar] [CrossRef]
  26. Pérez-Cerdán, J.C.; Lorenzo, M.; Blanco, C. Stress concentrations in interference fit joints with chamfered hubs. Appl. Mech. Mater. 2012, 184, 489–492. [Google Scholar] [CrossRef]
  27. Pedersen, N.L. On optimization of interference fit assembly. Struct. Multidiscip. Optim. 2016, 54, 349–359. [Google Scholar] [CrossRef] [Green Version]
  28. Güven, U. Stress distribution in shrink fit with elastic-plastic hub exhibiting variable thickness. Int. J. Mech. Sci. 1993, 35, 39–46. [Google Scholar] [CrossRef]
  29. Oda, J.; Sakamoto, J.; San, K. A method for producing a uniform contact stress distribution in composite bodies with interference. Struct. Optim. 1991, 3, 23–28. [Google Scholar] [CrossRef]
  30. Arslan, E.; Mack, W. Shrink fit with solid inclusion and functionally graded hub. Compos. Struct. 2015, 121, 217–224. [Google Scholar] [CrossRef]
  31. Grimm, T.R.; Chiu, A.C. Design of hubs to minimize interface stresses—A finite element study. In Computers in Engineering: Proc. of the 1988 ASME International Computers in Engineering Conference and Exhibition; ASME: San Francisco, CA, USA, 1988; pp. 85–91. [Google Scholar]
  32. Zhang, Y.; McClain, B.; Fang, X.D. Design of interference fits via finite element method. Int. J. Mech. Sci. 2000, 42, 1835–1850. [Google Scholar] [CrossRef]
  33. Özel, A.; Temiz, Ş.; Aydin, M.D.; Şen, S. Stress analysis of shrink-fitted joints for various fit forms via finite element method. Mater. Des. 2005, 26, 281–289. [Google Scholar] [CrossRef]
  34. Croccolo, D.; Vincenzi, N. Stress concentration factors in compression-fit couplings. J. Mech. Eng. Sci. 2010, 224, 1143–1152. [Google Scholar] [CrossRef]
  35. Conway, H.D.; Farnham, K.A. Contact stresses between cylindrical shafts and sleeves. Inter. J. Eng. Sci. 1967, 5–7, 541–554. [Google Scholar] [CrossRef]
Figure 1. Scheme of a shrink fit with (a) a conventional hub; (b) a partial chamfered hub; and (c) a full–chamfer hub.
Applsci 13 03606 g001
Figure 2. Scheme of the geometric modifications of the hub in terms of the dimensionless parameters used in this study: the chamfer height β and the hub thickness γ.
Applsci 13 03606 g002
Figure 3. Scheme of two–dimensional finite element modeling of the interference fit with (a) a partial–chamfer hub and (b) a full–chamfer hub. Point A is located at the hub edge and point B is placed at the half cross section of the hub at the interface.
Applsci 13 03606 g003
Figure 4. Mesh convergence analysis results.
Applsci 13 03606 g004
Figure 5. Mesh used in FEM simulations: general view showing the applied boundary conditions and the detailed view at the hub edge where stress concentration appears at the contact of the hub–shaft interface.
Applsci 13 03606 g005
Figure 6. Hub von Mises stress fields obtained by FEM simulations for (a) a conventional hub; (b) a full–chamfer hub with a chamfer angle of α = 15°.
Applsci 13 03606 g006
Figure 10. Stress concentration factors as a function of the chamfer angle, α, for different values of the hub edge γ. (a) radial stress, (b) 3D view, (c) tangential stress, (d) 3D view, (e) von Mises stress, (f) 3D view.
Applsci 13 03606 g010
Figure 11. Variation of the transition chamfer angle as a function of the hub thickness, γ.
Applsci 13 03606 g011
Figure 12. Stress concentration factors as a function of chamfer height β for diverse values of chamfer angle α in partial–chamfer hubs with a hub thickness of γ = 0.5. (a) radial stress, (b) 3D view, (c) tangential stress, (d) 3D view, (e) von Mises stress, (f) 3D view.
Applsci 13 03606 g012
Figure 13. (ae): Radial stress concentration factors as a function of β for different hub thicknesses and (f): variation of the transition chamfer angle with the chamfer height for diverse hub thicknesses.
Applsci 13 03606 g013
Figure 14. Variation of the radial, tangential, and von Mises SCFs for full–chamfer (blank symbols) and partial–chamfer hubs (full symbols) with (a) diverse shaft dimensions, (b) different interference fits, and (c) diverse materials.
Applsci 13 03606 g014
Table 1. Parameters used in the finite element simulations.
ParameterValue
Young’s Modulus, E210 GPa
Poisson Ratio, ν0.3
Yield Strength, σY276 MPa
Hub radius, r050 mm
Hub length, l25 mm
Shaft radius, R25 mm
Shaft length, L200 mm
Hub chamfer angle, α[0°, 5°, 10°, 12°, 13°, 14°, 15°, 18°, 20°, 25°, 30°]
Hub chamfer height, β[0.125, 0.25, 0.5, 0.75, 1]
Hub dimensionless thickness, γ[0.125, 0.25, 0.5, 0.75, 1]
Radial interference, δ29.5 μm
Disclaimer/Publisher’s Note: The statements, opinions and data contained in all publications are solely those of the individual author(s) and contributor(s) and not of MDPI and/or the editor(s). MDPI and/or the editor(s) disclaim responsibility for any injury to people or property resulting from any ideas, methods, instructions or products referred to in the content.

