
A Comprehensive Survey of Machine Learning Methodologies with Emphasis in Water Resources Management

Abstract
:1. Introduction
2. ML Methodologies
2.1. Supervised Learning
2.1.1. Classification
- Classifiers: They are algorithms that assign input data to specific classes. They can be categorized into three main types: linear classifiers, nearest-neighbor classifiers, and classification trees [18].
- Linear classifiers: Through the linear combination of feature values can make classification decisions [19].
- Nearest-neighbor classifiers: Tag data objects that do not share the same label by using the nearest objects from the training set [20].
- “Brute-force” method classifier: While not an algorithm, this method exhaustively processes all data and all possible combinatorics to find the best possible classification solution [17]. This method does not involve the intelligent modeling of data mining; instead, it relies solely on computational combinatorics.
- Classification trees: A classification tree is a method that offers a descriptive graphical representation of its incremental improvement. To determine the tests, a combination table is utilized, in which class combinations are marked [21].
- Classification models: They attempt to make reasonable inferences from the input values provided by the trainer to predict the labels associated with the classes for new data [22].
- Binary classification: It is a classification that has two possible outcomes [23]. Basically, it is the process of classifying the data using predefined classes. It can be used in drought prediction [24], hydrological forecasting (predicting extreme weather events like heavy rainfall leading to flooding) [25], etc.
- Linear classification: Algorithms assume that the decision boundary separating the classes is a linear function of the input features. In other words, these algorithms try to find a linear equation (a straight line in two dimensions, a plane in three dimensions, or a hyperplane in higher dimensions) that best separates the data points of different classes. Linear classification algorithms include techniques like logistic regression and support vector machines (SVMs) with linear kernels. These algorithms work well when the relationship between the input features and the classes is approximately linear [13].
- Nonlinear classification: On the other hand, refers to the decision boundary that separates classes in a classification problem. In linear classification, it is assumed that the decision boundary is a linear function of the input features. This means that the boundary that separates classes is a straight line (in two dimensions), a plane (in three dimensions), or a hyperplane (in higher dimensions). Linear classifiers like logistic regression and linear support vector machines work well when the relationship between input features and classes are approximately linear. In nonlinear classification, the decision boundary is not a straight line, plane, or hyperplane. Instead, it can have curves, twists, or other complex shapes [13].
- Data collection and preprocessing: Collect the dataset and perform data preprocessing tasks, such as data cleaning, handling missing values, and transforming variables if necessary. This step ensures that the dataset is in a suitable format for the classification model and that the data are harmonized.
- Model initialization: Choose an appropriate classification algorithm or model for the task at hand. Select from options such as logistic regression, decision trees, random forests, or support vector machines based on the problem and data characteristics.
- Cross-validation and dataset separation: Split the dataset into training and testing subsets using cross-validation techniques. This helps evaluate the model’s performance by training on a portion of the data and testing on unseen data, allowing the detection of issues such as overfitting or underfitting.
- Training the model: Feed the training data into the classifier model. The model learns from the labeled training data and adjusts its internal parameters to discover the best decision boundaries or rules for classification. Iteratively update the model based on the training data until satisfactory performance is achieved.
- Evaluating the model performance: Once the model is trained, evaluate it as a newly created classifier on the evaluation dataset. Apply the learned decision boundaries or rules to classify attributes with unknown labels into predefined classes, providing insights and aiding decision making.
2.1.2. Regression
2.2. Unsupervised Learning
2.2.1. Clustering
2.2.2. Association Rules
2.3. Semisupervised Learning
2.3.1. Semisupervised Classification
2.3.2. Semisupervised Clustering
2.4. Reinforcement Learning
2.5. Evaluation Methods and Performance Metrics in ML
2.6. Bibliometric Analysis and Search Method for the ML Methodologies
3. Using ML for Water Activities
3.1. Water Resource Management and Quality Prediction
3.1.1. Water Resource Management Techniques
- –
- Irrigation optimization [242]: XGBoost is harnessed to optimize irrigation scheduling, particularly in regions like Morocco, aiding in efficient water usage for crop cultivation.
- –
- Urban groundwater quality [243]: Leveraging least squares support vector machines (LS-SVM), this study focused on enhancing the quality of urban groundwater. It effectively monitored and predicted groundwater quality, particularly in areas vulnerable to contamination due to urbanization.
- –
- Water level forecasting [244]: Multiple ML models, including multilayer perceptrons (MLP), long short-term memory (LSTM), and XGBoost, were employed for accurate water level forecasting. These models contributed significantly to flood warning systems and freshwater resource management.
- –
- Superiority of MLP [245]: Among the models used for water level prediction, MLP emerged as the standout performer. It exhibited a high degree of accuracy, especially in capturing short-term dependencies.
3.1.2. Flood Forecasting and Hydrological Models
- –
- Flood forecasting with TVF-EMD [246]: A hybrid approach combining time-varying filtering with empirical mode decomposition (TVF-EMD) and ML techniques was employed for flood forecasting. This approach excelled in handling nonstationary time series data.
- –
- Mekong River water levels [247]: Support vector regression (SVR) was applied to predict water levels in the Mekong River. SVR achieved a satisfactory mean absolute error, meeting stringent requirements for flood forecasting by the Mekong River Commission.
3.1.3. Water Demand Prediction and Climate Adaptation
- –
- Precise water demand predictions [248]: Advanced ML techniques were utilized for accurate predictions of water demand in urban areas. These models underscored the significance of temporal dynamics in water usage patterns.
- –
- Vapor pressure deficit in Egypt [249]: ML algorithms, including random forest (RF), were used to predict vapor pressure deficit (VPD) in different regions of Egypt. RF emerged as the top-performing model, supporting climate adaptation efforts.
3.2. Water Quality and Streamflow Management
3.2.1. ML Applications in Water Resource Management
- –
- Streamflow and water quality management [250]: A novel approach was introduced for water resource management, addressing the nonlinearity and uncertainty of streamflow. The proposed hybrid model effectively predicted water quality and quantity, offering improved accuracy in capturing nonlinear characteristics.
- –
- Enhanced streamflow forecasting [251]: With LSTM and metaheuristic optimization, we can improve streamflow forecasting. The results demonstrated significant enhancements in model performance, with the potential to support more effective flood management.
- –
- Smart farming in India [252]: India’s smart farming endeavors employed the Internet of Things (IoT) and ML classifiers, particularly the binary support vector machine (SVM). These technologies assisted farmers in optimizing crop irrigation, enhancing sustainability.
- –
- Urban water demand forecasting [253]: Adaptive urban water demand forecasting was proposed, utilizing ML models to cater to changing consumption patterns and improving water resource management.
- –
- Cybersecurity in water infrastructure [254]: Combining ML with operational metrics, this study enhanced cybersecurity measures in critical water infrastructure, addressing the increasing risk of cyberattacks in modernized water plants.
3.2.2. Water Management and Predictions
- –
- Water management simulations [255]: Rule-based reservoir management models (RMM) were augmented with ML, specifically long short-term memory (LSTM), for reservoir simulations. These hybrid models improved accuracy and forecasting in large-scale water management.
- –
- ML in inland water science [256]: This chapter explored the integration of ML with limnological knowledge, enhancing the accuracy and interpretability of models in inland water science, particularly in predicting water quality and quantity.
- –
- Waste separation for a circular economy [257]: To combat environmental pollution, this study proposed waste separation techniques involving sensor-equipped conveyor belts. This approach contributed to recycling and organic manure production, promoting a circular economy.
- –
- Water demand prediction in Brazil [258]: A novel hybrid model, combining support vector regression (SVR) and artificial neural networks (ANNs), excelled in predicting water demand for reservoirs supplying the Metropolitan Region of Salvador, Brazil. This advancement enhanced water resource management.
3.2.3. Advanced Predictive Models and Data Analysis
- –
- Water demand forecasting in urban areas [259]: Hybrid models (WBANN and WANN) were developed for weekly and monthly water demand forecasting in urban areas with limited data. These models were more accurate, with improved reliability through wavelet analysis and bootstrap techniques.
- –
- Surface water electrical conductivity prediction [260]: This study investigated surface water electrical conductivity (EC) prediction in the Upper Ganga basin. The random forest (RF) model outperformed others, showing improved accuracy and high correlation.
- –
- Data-centric water demand prediction [261]: This study analyzed the impact of training data length, temporal resolution, and data uncertainty on water demand prediction. It was found that random forest (RF) and neural network (NN) models outperformed others, offering accurate short-term water demand forecasts.
- –
- Daily reservoir inflow prediction [262]: This study explored daily reservoir inflow prediction using deep learning (LSTM) and ML (BRT) algorithms. LSTM demonstrated superior precision across various statistical measurements.
3.3. Advanced Techniques and Sustainability
3.3.1. Innovations in Water Resource Management and Forecasting
- –
- Optimizing agricultural irrigation [263]: This study discussed the use of innovative technologies like UAVs, ML, and IoT to optimize irrigation in agriculture, improving water status monitoring and prediction.
- –
- Deep learning for agricultural water management [264]: This study proposed a novel method using deep learning for feature extraction and classification in agricultural water management, achieving high accuracy and performance metrics.
- –
- Urban water demand forecasting with limited data [265]: This study evaluated the effectiveness of extreme learning machine (ELM) models for daily urban water demand forecasting. The ELMW model achieved high accuracy, particularly in predicting peak demand.
- –
- Water demand forecasting in Kuwait [266]: This study compared water demand forecasting methods in Kuwait, showing differences in accuracy between ARIMA and support vector linear regression models compared to actual consumption.
3.3.2. Advancements in Water Management and Quality Assessment
- –
- Intelligent water management system [267]: This study proposed an intelligent system for optimizing water collection and distribution, including water consumption prediction, without specific performance metrics.
- –
- Water quality index prediction [268]: This study developed water quality index (WQI) prediction models using water samples from North Pakistan. Hybrid algorithms showed superior performance with high accuracy and low error metrics.
- –
- Dynamic time scan forecasting (DTSF) [269]: This study introduced the DTSF method for water demand forecasting in urban supply systems, demonstrating comparable or better predictions with fewer computational resources.
3.3.3. Role of Artificial Intelligence and Deep Learning in Water Research
- –
- Deep learning in water sector research [270]: This study reviewed deep learning methods in the water sector for various tasks, serving as a roadmap for future challenges in water resources management.
- –
- Factors affecting nonrevenue water (NRW) [271]: This study classified factors affecting NRW in water distribution networks, offering a systematic approach for management.
- –
- AI in river water quality assessment [272]: This study reviewed the use of AI models in river water quality assessment, highlighting the need for handling missing data and implementing early warning systems.
3.4. Reservoir and River Quality Management
3.4.1. Innovations in Water Resource Management and Quality
- –
- Reservoir operation optimization [273]: This study presented a classification system for organizing literature on reservoir operation optimization, providing practical recommendations.
- –
- Soft computing for water quality index (WQI) [274]: This study developed a WQI using soft computing techniques, with ANFIS demonstrating reliability for WQI prediction.
- –
- Groundwater quality assessment in Sri Lanka [275]: This study assessed the quality of groundwater for irrigation in Sri Lanka’s tank cascade system, suggesting suitable areas.
- –
- Combatting reservoir sedimentation [276]: This study categorized strategies for combating reservoir sedimentation, offering a checklist for evaluating sediment management options.
- –
- Underground water level prediction [277]: This study utilized a hybrid model to predict underground water levels in Khuzestan province, achieving high accuracy in water resource modeling.
- –
- River water quality modeling [278]: This study utilized AI models to predict river water quality index (WQI) based on water quality variables. H2O deep learning and random forest models were effective, especially for small catchments.
- –
- Superabsorbent hydrogel (SH) [279]: This study explored the application of superabsorbent hydrogel (SH) in agriculture and slow-release fertilizers and discussed nutrient release mechanisms, highlighting the potential for sustainable agriculture.
- –
- Urbanization and groundwater quality [280]: This study examined the impact of urbanization and land use on groundwater quality in Xi’an City, China, supporting sustainable urban development and groundwater management in Xi’an City.
- –
- Leakage detection [281]: This study focused on efficient leakage detection in water distribution systems and emphasized the importance of enhancing operational efficiency and minimizing water losses.
- –
- ML in water systems [282]: This study explored the application of ML in natural and engineered water systems and discussed the advantages and disadvantages of various ML algorithms for water-related issues.
- –
- Groundwater nitrate contamination [283]: This study utilized ML techniques to predict nitrate concentrations in Mexico’s groundwater and identified pollution hotspots and health concerns, emphasizing the need for sustainable agricultural practices.
- –
- Smart water management [284]: This study discussed how smart water meters and data analytics improve urban water system design and highlighted enhanced efficiency throughout the water cycle.
- –
- River water quality prediction [285]: This study developed ML models to predict river water quality and classify index values and achieved efficient prediction and classification of water quality index values.
- –
- Flow-regime-dependent streamflow prediction [286]: This study proposed a flow-regime-dependent approach using various techniques to improve streamflow prediction, enhancing streamflow prediction for water resources management and planning.
- –
- Water use and management indicators [287]: This study evaluated water use and management indicators based on sustainability criteria and identified indicators meeting sustainability criteria for informed decision making.
3.4.2. Factors Influencing Water Consumption and Water Quality
- –
- Household water consumption [288]: This study proposed a framework for reviewing and analyzing the literature on determinants of household water consumption, aiding in prioritizing determinants for future research and practical recommendations.
- –
- Sürgü Stream water quality [289]: This study evaluated the water quality of the Sürgü Stream in Turkey, assessed its impact on soil and crop performance, and provided insights into water quality index and suitability classes for irrigation.
- –
- Groundwater monitoring with ML [290]: This study reviewed ML algorithms for groundwater monitoring and highlighted the effectiveness of ML in monitoring groundwater characteristics.
- –
- Water consumption in Qatar [291]: This study analyzed factors affecting water consumption in Qatar and identified temperature and population density as key influences on water consumption.
- –
- Environmentally friendly toilets [292]: This study developed a novel mechanism to reduce water consumption in toilets, aiming to make flushing more environmentally friendly, potentially conserving global water and energy.
- –
- Predicting water connection leaks [293]: This study used ML to predict water connection vulnerability to ruptures and leaks. Models showed potential for effective distribution network management.
- –
- Corporate water management practices [294]: This study examined the impact of macro factors on corporate water management practices, and identified factors driving water management practices for leading, average, and laggard companies.
- –
- Water quality parameter modeling [295]: This study modeled water quality parameters in a river basin using regression models and provided water quality distribution maps based on watershed features.
- –
- Factors influencing domestic water consumption [296]: This study analyzed factors influencing domestic water consumption in Joinville, Brazil. Socioeconomic and building characteristics play a significant role in water consumption.
- –
- Groundwater dynamics and prediction [297]: This study used ML recharge. Rainfall was identified as a key influencing factor for groundwater recharge.
- –
- Energy-efficient underwater sensor networks [298]: This study proposed an energy-efficient approach for underwater wireless sensor networks, utilizing clustering and routing techniques for efficient energy usage.
- –
- Groundwater management in arid regions [299]: This study assessed groundwater management in Kebili’s complex terminal aquifer and provided suitability classes for irrigation based on groundwater quality.
- –
- Model-independent leak detection [300]: This study introduced a model-independent approach for placing pressure sensors in water distribution networks. It utilized genetic algorithms for leak detection without a hydraulic model.
- –
- Variable-rate irrigation (VRI) [301]: This study explored the development of variable-rate irrigation (VRI) technologies for precision water management in agriculture. It highlighted the need for further research and practical support information.
- –
- Groundwater quality in Ojoto [302]: This study assessed the quality of drinking groundwater in Ojoto, Nigeria, using pollution and ecological risk indices. It identified areas with contaminated water and suitability for drinking.
3.5. Bibliometric Analysis and Search Method for Water Management
4. Conclusions
Author Contributions
Funding
Institutional Review Board Statement
Informed Consent Statement
Data Availability Statement
Conflicts of Interest
References
- Jha, K.; Doshi, A.; Patel, P.; Shah, M. A comprehensive review on automation in agriculture using artificial intelligence. Artif. Intell. Agric. 2019, 2, 1–12. [Google Scholar] [CrossRef]
- Sun, A.Y.; Scanlon, B.R. How can Big Data and machine learning benefit environment and water management: A survey of methods, applications, and future directions. Environ. Res. Lett. 2019, 14, 073001. [Google Scholar] [CrossRef]
- Shahin, M.A.; Symons, S.J. A machine vision system for grading lentils. Can. Biosyst. Eng. 2001, 43, 8. [Google Scholar]
- Sharma, T.; Singh, J.; Singh, A.; Chauhan, G. Artificial Intelligence in Water Management. RASSA J. Sci. Soc. 2021, 3, 186–189. [Google Scholar]
- Xu, W.; Zhaoyue, W.; Yirong, P.; Yuli, L.; Junxin, L.; Min, Y. Perspective and Prospects on Applying Artificial Intelligence to Address Water and Environmental Challenges of 21st Century. Bull. Chin. Acad. Sci. (Chin. Version) 2020, 35, 1163–1176. [Google Scholar]
- AlZu’Bi, S.; Alsmirat, M.; Al-Ayyoub, M.; Jararweh, Y. Artificial Intelligence Enabling Water Desalination Sustainability Optimization. In Proceedings of the 2019 7th International Renewable and Sustainable Energy Conference (IRSEC), Agadir, Morocco, 27–30 November 2019; pp. 1–4. [Google Scholar]
- Afzaal, H.; Farooque, A.A.; Abbas, F.; Acharya, B.; Esau, T. Computation of Evapotranspiration with Artificial Intelligence for Precision Water Resource Management. Appl. Sci. 2020, 10, 1621. [Google Scholar] [CrossRef]
- Mahesh, B. Machine Learning Algorithms—A Review. Int. J. Sci. Res. (IJSR) 2018, 9, 7. [Google Scholar]
- Ray, S. A Quick Review of Machine Learning Algorithms. In Proceedings of the 2019 International Conference on Machine Learning, Big Data, Cloud and Parallel Computing (COMITCon), Faridabad, India, 14–16 February 2019; pp. 35–39. [Google Scholar] [CrossRef]
- Fong, A. Welcome Message from the Editor-in-Chief. J. Adv. Inf. Technol. 2010, 1. [Google Scholar] [CrossRef]
- Dasgupta, A.; Nath, A. Classification of Machine Learning Algorithms. Int. J. Innov. Res. Adv. Eng. 2016, 3, 7. [Google Scholar]
- Cord, M.; Cunningham, P. (Eds.) Machine Learning Techniques for Multimedia: Case Studies on Organization and Retrieval; with 20 tables. In Cognitive Technologies; Springer: Berlin/Heidelberg, Germany, 2008. [Google Scholar]
- Saravanan, R.; Sujatha, P. A State of Art Techniques on Machine Learning Algorithms: A Perspective of Supervised Learning Approaches in Data Classification. In Proceedings of the 2018 Second International Conference on Intelligent Computing and Control Systems (ICICCS), Madurai, India, 14–15 June 2018; pp. 945–949. [Google Scholar]
- Jiang, T.; Gradus, J.L.; Rosellini, A.J. Supervised Machine Learning: A Brief Primer. Behav. Ther. 2020, 51, 675–687. [Google Scholar] [CrossRef]
- Nasteski, V. An overview of the supervised machine learning methods. Horizons 2017, 4, 51–62. [Google Scholar] [CrossRef]
- Hastie, T.; Tibshirani, R.; Friedman, J. Overview of Supervised Learning. In The Elements of Statistical Learning; Springer Series in Statistics; Springer: New York, NY, USA, 2009; pp. 9–41. [Google Scholar] [CrossRef]
- Sen, P.C.; Hajra, M.; Ghosh, M. Supervised Classification Algorithms in Machine Learning: A Survey and Review. In Emerging Technology in Modelling and Graphics. Advances in Intelligent Systems and Computing; Mandal, J.K., Bhattacharya, D., Eds.; Springer: Singapore, 2020; pp. 99–111. [Google Scholar] [CrossRef]
- Carrizosa, E.; Morales, D.R. Supervised classification and mathematical optimization. Comput. Oper. Res. 2013, 40, 150–165. [Google Scholar] [CrossRef]
- Göpfert, C.; Pfannschmidt, L.; Göpfert, J.P.; Hammer, B. Interpretation of linear classifiers by means of feature relevance bounds. Neurocomputing 2018, 298, 69–79. [Google Scholar] [CrossRef]
- Veenman, C.; Reinders, M. The nearest subclass classifier: A compromise between the nearest mean and nearest neighbor classifier. IEEE Trans. Pattern Anal. Mach. Intell. 2005, 27, 1417–1429. [Google Scholar] [CrossRef] [PubMed]
- Grochtmann, M.; Grimm, K. Classification trees for partition testing. Softw. Test. Verif. Reliab. 1993, 3, 63–82. [Google Scholar] [CrossRef]
- Freitas, A.A.; Freitas, A.A. Comprehensible Classification Models–a position paper. ACM SIGKDD Explor. Newsl. 2014, 15, 10. [Google Scholar] [CrossRef]
- Kumari, R.; Srivastava, K.S. Machine Learning: A Review on Binary Classification. Int. J. Comput. Appl. 2017, 160, 11–15. [Google Scholar] [CrossRef]
- Jiang, W.; Luo, J. An evaluation of machine learning and deep learning models for drought prediction using weather data. J. Intell. Fuzzy Syst. 2022, 43, 3611–3626. [Google Scholar] [CrossRef]
- Miao, Q.; Yang, D.; Yang, H.; Li, Z. Establishing a rainfall threshold for flash flood warnings in China’s mountainous areas based on a distributed hydrological model. J. Hydrol. 2016, 541, 371–386. [Google Scholar] [CrossRef]
- Grandini, M.; Bagli, E.; Visani, G. Metrics for Multi-Class Classification: An Overview. arXiv 2020. [Google Scholar] [CrossRef]
- Ladjal, M.; Bouamar, M.; Djerioui, M.; Brik, Y. Performance evaluation of ANN and SVM multiclass models for intelligent water quality classification using Dempster-Shafer Theory. In Proceedings of the 2016 International Conference on Electrical and Information Technologies (ICEIT), Tangiers, Morocco, 4–7 May 2016; pp. 191–196. [Google Scholar]
- Msiza, I.S.; Nelwamondo, F.V.; Marwala, T. Water demand prediction using artificial neural Networks and support vector regression. J. Comput. 2008, 3, 1–8. [Google Scholar] [CrossRef]
- Khan, T.A.; Shahid, Z.; Alam, M.; Su’ud, M.M.; Kadir, K. Early flood risk assessment using machine learning: A comparative study of svm, q-svm, k-nn and lda. In Proceedings of the 2019 13th International Conference on Mathematics, Actuarial Science, Computer Science and Statistics (MACS), Karachi, Pakistan, 14–15 December 2019; pp. 1–7. [Google Scholar]
- Tsoumakas, G.; Katakis, I. Multi-Label Classification: An Overview. Int. J. Data Warehous. Min. (IJDWM) 2007, 3, 1–13. [Google Scholar] [CrossRef]
- Yang, Q.; Shao, J.; Scholz, M.; Boehm, C.; Plant, C. Multi-label classification models for sustainable flood retention basins. Environ. Model. Softw. 2012, 32, 27–36. [Google Scholar] [CrossRef]
- Tsoumakas, G.; Spyromitros-Xioufis, E.; Vrekou, A.; Vlahavas, I. Multi-target regression via random linear target combinations. In Proceedings of the Machine Learning and Knowledge Discovery in Databases: European Conference, ECML PKDD 2014, Nancy, France, 15–19 September 2014; Proceedings, Part III 14. Springer: Berlin/Heidelberg, Germany, 2014; pp. 225–240. [Google Scholar]
- King, G.; Zeng, L. Logistic Regression in Rare Events Data. Political Anal. 2001, 9, 137–163. [Google Scholar] [CrossRef]
- Cortes, C.; Vapnik, V. Support-vector networks. Mach. Learn. 1995, 20, 273–297. [Google Scholar] [CrossRef]
- Freund, Y.; Schapire, R.E. Large margin classification using the perceptron algorithm. In Proceedings of the Eleventh Annual Conference on Computational Learning Theory, Madison, WI, USA, 24–26 July 1998; pp. 209–217. [Google Scholar] [CrossRef]
- Algamal, Z.Y.; Hammood, N. A new Jackknifing ridge estimator for logistic regression model. Pak. J. Stat. Oper. Res. 2022, 18, 955–961. [Google Scholar] [CrossRef]
- Meier, L.; Van De Geer, S.; Bühlmann, P. The group lasso for logistic regression. J. R. Stat. Soc. Ser. B (Stat. Methodol.) 2008, 70, 53–71. [Google Scholar] [CrossRef]
- Zou, H.; Hastie, T. Regularization and Variable Selection via the Elastic Net. J. R. Stat. Soc. Stat. Methodol. Ser. B 2005, 67, 301–320. [Google Scholar] [CrossRef]
- Zhang, S.; Xie, L. Penalized Least Squares Classifier: Classification by Regression Via Iterative Cost-Sensitive Learning. Neural Process. Lett. 2023, 1–20. [Google Scholar] [CrossRef]
- Wijnhoven, R.; de With, P. Fast Training of Object Detection Using Stochastic Gradient Descent. In Proceedings of the 2010 20th International Conference on Pattern Recognition (ICPR), Istanbul, Turkey, 23–26 August 2010; pp. 424–427. [Google Scholar]
- Domingos, P.; Pazzani, M. On the Optimality of the Simple Bayesian Classifier under Zero-One Loss. Mach. Learn. 1997, 29, 103–130. [Google Scholar] [CrossRef]
- Altay, O.; Ulas, M. Prediction of the autism spectrum disorder diagnosis with linear discriminant analysis classifier and K-nearest neighbor in children. In Proceedings of the 2018 6th International Symposium on Digital Forensic and Security (ISDFS), Antalya, Turkey, 22–25 March 2018; pp. 1–4. [Google Scholar]
- Crammer, K.; Dekel, O.; Keshet, J.; Shalev-Shwartz, S.; Singer, Y. Online Passive-Aggressive Algorithms. J. Mach. Learn. Res. 2006, 7, 551–585. Available online: http://jmlr.org/papers/v7/crammer06a.html (accessed on 4 July 2023).
- Hastie, T.; Tibshirani, R.; Friedman, J. The Elements of Statistical Learning: Data Mining, Inference, and Prediction; Springer Science & Business Media: New York, NY, USA, 2009. [Google Scholar]
- Jati, M.I.H.; Suroso; Santoso, P.B. Prediction of flood areas using the logistic regression method (case study of the provinces Banten, DKI Jakarta, and West Java). J. Phys. Conf. Ser. 2019, 1367, 012087. [Google Scholar] [CrossRef]
- Roodposhti, M.S.; Safarrad, T.; Shahabi, H. Drought sensitivity mapping using two one-class support vector machine algorithms. Atmos. Res. 2017, 193, 73–82. [Google Scholar] [CrossRef]
- Gollapalli, M. Ensemble machine learning model to predict the waterborne syndrome. Algorithms 2022, 15, 93. [Google Scholar] [CrossRef]
- Qun’Ou, J.; Lidan, X.; Siyang, S.; Meilin, W.; Huijie, X. Retrieval model for total nitrogen concentration based on UAV hyper spectral remote sensing data and machine learning algorithms—A case study in the Miyun Reservoir, China. Ecol. Indic. 2021, 124, 107356. [Google Scholar] [CrossRef]
- Ahmed, A.M.; Deo, R.C.; Feng, Q.; Ghahramani, A.; Raj, N.; Yin, Z.; Yang, L. Deep learning hybrid model with Boruta-Random Forest optimiser algorithm for streamflow forecasting with climate mode indices, rainfall, and periodicity. J. Hydrol. 2021, 599, 126350. [Google Scholar] [CrossRef]
- Su, H.; Yao, W.; Wu, Z.; Zheng, P.; Du, Q. Kernel low-rank representation with elastic net for China coastal wetland land cover classification using GF-5 hyperspectral imagery. ISPRS J. Photogramm. Remote Sens. 2020, 171, 238–252. [Google Scholar] [CrossRef]
- Ma, M.; Zhao, G.; He, B.; Li, Q.; Dong, H.; Wang, S.; Wang, Z. XGBoost-based method for flash flood risk assessment. J. Hydrol. 2021, 598, 126382. [Google Scholar] [CrossRef]
- Anh, D.T.; Thanh, D.V.; Le, H.M.; Sy, B.T.; Tanim, A.H.; Pham, Q.B.; Dang, T.D.; Mai, S.T.; Dang, N.M. Effect of Gradient De-scent Optimizers and Dropout Technique on Deep Learning LSTM Performance in Rainfall-runoff Modeling. Water Resour. Manag. 2023, 37, 639–657. [Google Scholar] [CrossRef]
- Dilmi, S.; Ladjal, M. A novel approach for water quality classification based on the integration of deep learning and feature extraction techniques. Chemom. Intell. Lab. Syst. 2021, 214, 104329. [Google Scholar] [CrossRef]
- Farda, N.M.; Farda, N.M. Multi-temporal land use mapping of coastal wetlands area using machine learning in Google earth engine. IOP Conf. Ser. Earth Environ. Sci. 2017, 98, 012042. [Google Scholar] [CrossRef]
- Wong, G.M.; Lewis, J.M.; Knudson, C.A.; Millan, M.; McAdam, A.C.; Eigenbrode, J.L.; Andrejkovičová, S.; Gómez, F.; Navarro-González, R.; House, C.H. Detection of reduced sulfur on Vera Rubin ridge by quadratic discriminant analysis of volatiles observed during evolved gas analysis. J. Geophys. Res. Planets 2020, 125, e2019JE006304. [Google Scholar] [CrossRef]
- Setshedi, K.J.; Mutingwende, N.; Ngqwala, N.P. The use of artificial neural networks to predict the physico-chemical characteristics of water quality in three district municipalities, eastern cape province, South Africa. Int. J. Environ. Res. Public Health 2021, 18, 5248. [Google Scholar] [CrossRef] [PubMed]
- Zhou, B.; Chen, B.; Hu, J. Quasi-Linear Support Vector Machine for Nonlinear Classification. IEICE Trans. Fundam. Electron. Commun. Comput. Sci. 2014, E97.A, 1587–1594. [Google Scholar] [CrossRef]
- Somvanshi, M.; Chavan, P.; Tambade, S.; Shinde, S.V. A review of machine learning techniques using decision tree and support vector machine. In Proceedings of the 2016 International Conference on Computing, Communication, Control and Automation (ICCUBEA), Pune, India, 12–13 August 2016; pp. 1–7. [Google Scholar]
- Speiser, J.L.; Miller, M.E.; Tooze, J.; Ip, E. A comparison of random forest variable selection methods for classification prediction modeling. Expert Syst. Appl. 2019, 134, 93–101. [Google Scholar] [CrossRef] [PubMed]
- Friedman, J.H. Greedy function approximation: A gradient boosting machine. Ann. Stat. 2001, 29, 1189–1232. [Google Scholar] [CrossRef]
- Zhang, M.-L.; Zhou, Z.-H. A k-nearest neighbor based algorithm for multi-label classification. In Proceedings of the 2005 IEEE International Conference on Granular Computing, Beijing, China, 25–27 July 2005; Volume 2, pp. 718–721. [Google Scholar] [CrossRef]
- Montavon, G.; Lapuschkin, S.; Binder, A.; Samek, W.; Müller, K.-R. Explaining nonlinear classification decisions with deep Taylor decomposition. Pattern Recognit. 2017, 65, 211–222. [Google Scholar] [CrossRef]
- Al Bataineh, A. A Comparative Analysis of Nonlinear Machine Learning Algorithms for Breast Cancer Detection. Int. J. Mach. Learn. Comput. 2019, 9, 248–254. [Google Scholar] [CrossRef]
- Cao, D.-S.; Liang, Y.-Z.; Xu, Q.-S.; Hu, Q.-N.; Zhang, L.-X.; Fu, G.-H. Exploring nonlinear relationships in chemical data using kernel-based methods. Chemom. Intell. Lab. Syst. 2011, 107, 106–115. [Google Scholar] [CrossRef]
- Lou, C.; Li, X.; Atoui, M.A. Bayesian Network Based on an Adaptive Threshold Scheme for Fault Detection and Classification. Ind. Eng. Chem. Res. 2020, 59, 15155–15164. [Google Scholar] [CrossRef]
- Ma, M.; Liu, C.; Zhao, G.; Xie, H.; Jia, P.; Wang, D.; Wang, H.; Hong, Y. Flash flood risk Analysis based on machine learning techniques in the Yunnan Province, China. Remote Sens. 2019, 11, 170. [Google Scholar] [CrossRef]
- Khosravi, K.; Pham, B.T.; Chapi, K.; Shirzadi, A.; Shahabi, H.; Revhaug, I.; Prakash, I.; Bui, D.T. A comparative as-sessment of decision trees algorithms for flash flood susceptibility modeling at Haraz watershed, northern Iran. Sci. Total Environ. 2018, 627, 744–755. [Google Scholar] [CrossRef]
- Ma, M.; Liu, J.; Liu, M.; Zeng, J.; Li, Y. Tree species classification based on sentinel-2 imagery and random forest classifier in the eastern regions of the Qilian mountains. Forests 2021, 12, 1736. [Google Scholar] [CrossRef]
- Pan, Z.; Lu, W.; Bai, Y. Groundwater contaminated source estimation based on adaptive correction iterative ensemble smoother with an auto lightgbm surrogate. J. Hydrol. 2023, 620, 129502. [Google Scholar] [CrossRef]
- Hadi, A.H.; Shareef, W.F. In-Situ Event Localization for Pipeline Monitoring System Based Wireless Sensor Network Using K-Nearest Neighbors and Support Vector Machine. J. Al-Qadisiyah Comput. Sci. Math. 2020, 12. [Google Scholar] [CrossRef]
- Hoang, T.D.; Pham, M.T.; Vu, T.T.; Nguyen, T.H.; Huynh, Q.-T.; Jo, J. Monitoring agriculture areas with satellite images and deep learning. Appl. Soft Comput. 2020, 95, 106565. [Google Scholar] [CrossRef]
- Jackson-Blake, L.A.; Clayer, F.; Haande, S.; Sample, J.E.; Moe, S.J. Seasonal forecasting of lake water quality and algal bloom risk using a continuous Gaussian Bayesian network. Hydrol. Earth Syst. Sci. 2022, 26, 3103–3124. [Google Scholar] [CrossRef]
- Zhu, Q.; Wang, Y.; Luo, Y. Improvement of multi-layer soil moisture prediction using support vector machines and ensemble Kalman filter coupled with remote sensing soil moisture datasets over an agriculture dominant basin in China. Hydrol. Process. 2021, 35, e14154. [Google Scholar] [CrossRef]
- Liu, J.; Liu, R.; Yang, Z.; Kuikka, S. Quantifying and predicting ecological and human health risks for binary heavy metal pollution accidents at the watershed scale using Bayesian Networks. Environ. Pollut. 2020, 269, 116125. [Google Scholar] [CrossRef]
- Quinto, B. Next-Generation Machine Learning with Spark: Covers XGBoost, LightGBM, Spark NLP, Distributed Deep Learning with Keras, and More; Apress: Berkeley, CA, USA, 2020. [Google Scholar] [CrossRef]
- Dridi, S. Supervised Learning-A Systematic Literature Review. OSF Prepr. 2022. [Google Scholar] [CrossRef]
- Motulsky, H.J.; Ransnas, L.A. Fitting curves to data using nonlinear regression: A practical and nonmathematical review. FASEB J. 1987, 1, 365–374. [Google Scholar] [CrossRef]
- Pohlman, J.T.; Leitner, D.W. A Comparison of Ordinary Least Squares and Logistic Regression. December 2003. Available online: https://kb.osu.edu/handle/1811/23983 (accessed on 7 July 2023).
- Dorugade, A.V. New ridge parameters for ridge regression. J. Assoc. Arab. Univ. Basic Appl. Sci. 2014, 15, 94–99. [Google Scholar] [CrossRef]
- Ranstam, J.; A Cook, J. LASSO regression. Br. J. Surg. 2018, 105, 1348. [Google Scholar] [CrossRef]
- Zhang, Z.; Lai, Z.; Xu, Y.; Shao, L.; Wu, J.; Xie, G.-S. Discriminative Elastic-Net Regularized Linear Regression. IEEE Trans. Image Process. 2017, 26, 1466–1481. [Google Scholar] [CrossRef] [PubMed]
- Castillo, I.; Schmidt-Hieber, J.; van der Vaart, A. Bayesian linear regression with sparse priors. Ann. Stat. 2015, 43, 1986–2018. [Google Scholar] [CrossRef]
- Billings, S.A.; Voon, W.S.F. A prediction-error and stepwise-regression estimation algorithm for non-linear systems. Int. J. Control 1986, 44, 803–822. [Google Scholar] [CrossRef]
- Yang, G.; Giuliani, M.; Galelli, S. Valuing the Codesign of Streamflow Forecast and Reservoir Operation Models. J. Water Resour. Plan. Manag. 2023, 149, 04023037. [Google Scholar] [CrossRef]
- Maltare, N.N.; Patel, D.S.S. An Exploration and Prediction of Rainfall and Groundwater Level for the District of Banaskantha, Gujrat, India. Int. J. Environ. Sci. 2023, 9. Available online: https://www.theaspd.com/resources/v9-1-1-Nilesh%20N.%20Maltare.pdf (accessed on 5 November 2023).
- Rolim, L.Z.R.; Filho, F.d.A.d.S.; Brown, C. A Multi-model Framework for Streamflow Forecasting Based on Stochastic Models: An Application to the State Of Ceará, Brazil. Water Conserv. Sci. Eng. 2023, 8, 7. [Google Scholar] [CrossRef]
- Kumar, V.; Kedam, N.; Sharma, K.V.; Mehta, D.J.; Caloiero, T. Advanced Machine Learning Techniques to Improve Hydrological Prediction: A Comparative Analysis of Streamflow Prediction Models. Water 2023, 15, 2572. [Google Scholar] [CrossRef]
- Janizadeh, S.; Vafakhah, M.; Kapelan, Z.; Dinan, N.M. Novel bayesian additive regression tree methodology for flood susceptibility modeling. Water Resour. Manag. 2021, 35, 4621–4646. [Google Scholar] [CrossRef]
- Shaikh, S.A.; Pattanayek, T. Implicit stochastic optimization for deriving operating rules for a multi-purpose multi-reservoir system. Sustain. Water Resour. Manag. 2022, 8, 141. [Google Scholar] [CrossRef]
- Ostertagová, E. Modelling using Polynomial Regression. Procedia Eng. 2012, 48, 500–506. [Google Scholar] [CrossRef]
- Drucker, H.; Burges, C.J.; Kaufman, L.; Smola, A.; Vapnik, V. Support Vector Regression Machines. In Advances in Neural Information Processing Systems, 9. 1996. Available online: https://proceedings.neurips.cc/paper_files/paper/1996/hash/d38901788c533e8286cb6400b40b386d-Abstract.html (accessed on 5 November 2023).
- Xu, M.; Watanachaturaporn, P.; Varshney, P.K.; Arora, M.K. Decision tree regression for soft classification of remote sensing data. Remote Sens. Environ. 2005, 97, 322–336. [Google Scholar] [CrossRef]
- Breiman, L. Random forests. Mach. Learn. 2001, 45, 5–32. [Google Scholar] [CrossRef]
- Cigizoglu, H.K.; Alp, M. Generalized regression neural network in modelling river sediment yield. Adv. Eng. Softw. 2006, 37, 63–68. [Google Scholar] [CrossRef]
- Kramer, O. K-Nearest Neighbors. In Dimensionality Reduction with Unsupervised Nearest Neighbors; Kramer, O., Ed.; In Intelligent Systems Reference Library; Springer: Berlin/Heidelberg, Germany, 2013; pp. 13–23. [Google Scholar] [CrossRef]
- Deringer, V.L.; Bartók, A.P.; Bernstein, N.; Wilkins, D.M.; Ceriotti, M.; Csányi, G. Gaussian Process Regression for Materials and Molecules. Chem. Rev. 2021, 121, 10073–10141. [Google Scholar] [CrossRef] [PubMed]
- Evgeniou, T.; Pontil, M. Support Vector Machines: Theory and Applications. In Machine Learning and Its Applications: Advanced Lectures; Paliouras, G., Karkaletsis, V., Spyropoulos, C.D., Eds.; Lecture Notes in Computer Science; Springer: Berlin/Heidelberg, Germany, 2001; pp. 249–257. [Google Scholar] [CrossRef]
- Sullivan, S.G.; Greenland, S. Bayesian regression in SAS software. Leuk. Res. 2012, 42, 308–317. [Google Scholar] [CrossRef]
- Rodriguez, M.; Fu, G.; Butler, D.; Yuan, Z.; Cook, L. Global resilience analysis of combined sewer systems under continuous hydrologic simulation. J. Environ. Manag. 2023, 344, 118607. [Google Scholar] [CrossRef]
- Mozaffari, S.; Javadi, S.; Moghaddam, H.K.; Randhir, T.O. Forecasting groundwater levels using a hybrid of support vector regression and particle swarm optimization. Water Resour. Manag. 2022, 36, 1955–1972. [Google Scholar] [CrossRef]
- He, X.; Luo, J.; Li, P.; Zuo, G.; Xie, J. A hybrid model based on variational mode decomposition and gradient boosting regression tree for monthly runoff forecasting. Water Resour. Manag. 2020, 34, 865–884. [Google Scholar] [CrossRef]
- Rafiei-Sardooi, E.; Azareh, A.; Choubin, B.; Mosavi, A.H.; Clague, J.J. Evaluating urban flood risk using hybrid method of TOPSIS and machine learning. Int. J. Disaster Risk Reduct. 2021, 66, 102614. [Google Scholar] [CrossRef]
- Hadi, S.J.; Abba, S.I.; Sammen, S.S.; Salih, S.Q.; Al-Ansari, N.; Yaseen, Z.M. Non-linear input variable selec-tion approach integrated with non-tuned data intelligence model for streamflow pattern simulation. IEEE Access 2019, 7, 141533–141548. [Google Scholar] [CrossRef]
- Molajou, A.; Nourani, V.; Afshar, A.; Khosravi, M.; Brysiewicz, A. Optimal design and feature selection by ge-netic algorithm for emotional artificial neural network (EANN) in rainfall-runoff modeling. Water Resour. Manag. 2021, 35, 2369–2384. [Google Scholar] [CrossRef]
- Tamilarasi, P.; Akila, D. Ground water data analysis using data mining: A literature review. Int. J. Recent Technol. Eng. 2019, 7, 2277–3878. [Google Scholar]
- Shabani, S.; Samadianfard, S.; Sattari, M.T.; Mosavi, A.; Shamshirband, S.; Kmet, T.; Várkonyi-Kóczy, A.R. Modeling pan evaporation using Gaussian process regression K-nearest neighbors random forest and support vector machines; comparative analysis. Atmosphere 2020, 11, 66. [Google Scholar] [CrossRef]
- Lee, S.H.; Kang, J.E.; Park, C.S. Urban flood risk assessment considering climate change using bayesian probability statistics and GIS: A case study from Seocho-Gu, Seoul. J. Korean Assoc. Geogr. Inf. Stud. 2016, 19, 36–51. [Google Scholar] [CrossRef]
- Hsu, K.; Levine, S.; Finn, C. Unsupervised Learning via Meta-Learning. arXiv 2019. [Google Scholar] [CrossRef]
- Li, N.; Shepperd, M.; Guo, Y. A systematic review of unsupervised learning techniques for software defect prediction. Inf. Softw. Technol. 2020, 122, 106287. [Google Scholar] [CrossRef]
- Li, M.; Zhu, X.; Gong, S. Unsupervised Person Re-identification by Deep Learning Tracklet Association. In Proceedings of the European Conference on Computer Vision (ECCV), Munich, Germany, 8–14 September 2018; pp. 737–753. Available online: https://openaccess.thecvf.com/content_ECCV_2018/html/Minxian_Li_Unsupervised_Person_Re-identification_ECCV_2018_paper.html (accessed on 25 October 2022).
- Serra, A.; Tagliaferri, R. Unsupervised Learning: Clustering. In Encyclopedia of Bioinformatics and Computational Biology; Elsevier: Amsterdam, The Netherlands, 2019; pp. 350–357. [Google Scholar] [CrossRef]
- Kriegel, H.-P.; Kröger, P.; Sander, J.; Zimek, A. Density-based clustering. WIREs Data Min. Knowl. Discov. 2011, 1, 231–240. [Google Scholar] [CrossRef]
- Madhulatha, T.S. An Overview on Clustering Methods. IOSR J. Eng. 2012, 2, 719–725. [Google Scholar] [CrossRef]
- Kodinariya, T.; Makwana, P. Review on Determining of Cluster in K-means Clustering. Int. J. Adv. Res. Comput. Sci. Manag. Stud. 2013, 1, 90–95. [Google Scholar]
- Kumar, K.M.; Reddy, A.R.M. A fast DBSCAN clustering algorithm by accelerating neighbor searching using Groups method. Pattern Recognit. 2016, 58, 39–48. [Google Scholar] [CrossRef]
- Zhao, Y.; Karypis, G. Evaluation of hierarchical clustering algorithms for document datasets. In Proceedings of the Eleventh International Conference on Information and Knowledge Management, in CIKM ’02, New York, NY, USA, 8–9 November 2002; pp. 515–524. [Google Scholar] [CrossRef]
- Liu, J.; Cai, D.; He, X. Gaussian Mixture Model with Local Consistency. Proc. AAAI Conf. Artif. Intell. 2010, 24, 512–517. [Google Scholar] [CrossRef]
- Carreira-Perpiñán, M.Á. A review of mean-shift algorithms for clustering. arXiv 2015. [Google Scholar] [CrossRef]
- von Luxburg, U. A tutorial on spectral clustering. Stat. Comput. 2007, 17, 395–416. [Google Scholar] [CrossRef]
- Deng, Z.; Hu, Y.; Zhu, M.; Huang, X.; Du, B. A scalable and fast OPTICS for clustering trajectory big data. Clust. Comput. 2014, 18, 549–562. [Google Scholar] [CrossRef]
- Müllner, D. Modern hierarchical, agglomerative clustering algorithms. arXiv 2011. [Google Scholar] [CrossRef]
- Bhattacharjee, P.; Mitra, P. A survey of density based clustering algorithms. Front. Comput. Sci. 2020, 15, 151308. [Google Scholar] [CrossRef]
- Calinski, T.; Harabasz, J. A dendrite method for cluster analysis. Commun. Stat. 1974, 3, 1–27. [Google Scholar] [CrossRef]
- Chou, C.-H.; Su, M.-C.; Lai, E. A new cluster validity measure and its application to image compression. Pattern Anal. Appl. 2004, 7, 205–220. [Google Scholar] [CrossRef]
- Ncir, C.E.B.; Hamza, A.; Bouaguel, W. Parallel and scalable Dunn Index for the validation of big data clusters. Parallel Comput. 2021, 102, 102751. [Google Scholar] [CrossRef]
- Wang, J.-S.; Chiang, J.-C. A cluster validity measure with outlier detection for support vector clustering. IEEE Trans. Syst. Man Cybern. Part B (Cybern.) 2008, 38, 78–89. [Google Scholar] [CrossRef]
- Kim, M.; Ramakrishna, R. New indices for cluster validity assessment. Pattern Recognit. Lett. 2005, 26, 2353–2363. [Google Scholar] [CrossRef]
- Rousseeuw, P.J. Silhouettes: A graphical aid to the interpretation and validation of cluster analysis. J. Comput. Appl. Math. 1987, 20, 53–65. [Google Scholar] [CrossRef]
- Sharghi, E.; Nourani, V.; Zhang, Y.; Ghaneei, P. Conjunction of cluster ensemble-model ensemble techniques for spatiotemporal assessment of groundwater depletion in semi-arid plains. J. Hydrol. 2022, 610, 127984. [Google Scholar] [CrossRef]
- Cao, X.; Liu, Y.; Wang, J.; Liu, C.; Duan, Q. Prediction of dissolved oxygen in pond culture water based on K-means clustering and gated recurrent unit neural network. Aquac. Eng. 2020, 91, 102122. [Google Scholar] [CrossRef]
- Fascista, A.; Coluccia, A.; Ravazzi, C. A Unified Bayesian Framework for Joint Estimation and Anomaly Detection in Environmental Sensor Networks. IEEE Access 2022, 11, 227–248. [Google Scholar] [CrossRef]
- Piemontese, L.; Kamugisha, R.; Tukahirwa, J.; Tengberg, A.; Pedde, S.; Jaramillo, F. Barriers to scaling sustainable land and water management in Uganda: A cross-scale archetype approach. Ecol. Soc. 2021, 26, 6. [Google Scholar] [CrossRef]
- Gournelos, T.; Kotinas, V.; Poulos, S. Fitting a Gaussian mixture model to bivariate distributions of monthly riv-er flows and suspended sediments. J. Hydrol. 2020, 590, 125166. [Google Scholar] [CrossRef]
- Sood, S.K.; Sandhu, R.; Singla, K.; Chang, V. IoT, big data and HPC based smart flood management frame-work. Sustain. Comput. Inform. Syst. 2018, 20, 102–117. [Google Scholar]
- Bijeesh, T.V.; Narasimhamurthy, K.N. Surface water detection and delineation using remote sensing images: A review of methods and algorithms. Sustain. Water Resour. Manag. 2020, 6, 68. [Google Scholar] [CrossRef]
- Arabi, B.; Salama, M.S.; Pitarch, J.; Verhoef, W. Integration of in-situ and multi-sensor satellite observations for long-term water quality monitoring in coastal areas. Remote Sens. Environ. 2020, 239, 111632. [Google Scholar] [CrossRef]
- Li, J.; Hassan, D.; Brewer, S.; Sitzenfrei, R. Is clustering time-series water depth useful? An exploratory study for flooding detection in urban drainage systems. Water 2020, 12, 2433. [Google Scholar] [CrossRef]
- Song, S.; Zhou, H.; Yang, Y.; Song, J. Hyperspectral anomaly detection via convolutional neural network and low rank with density-based clustering. IEEE J. Sel. Top. Appl. Earth Obs. Remote Sens. 2019, 12, 3637–3649. [Google Scholar] [CrossRef]
- Kotsiantis, S.; Kanellopoulos, D. Association Rules Mining: A Recent Overview. GESTS Int. Trans. Comput. Sci. Eng. 2006, 32, 71–82. [Google Scholar]
- Chen, X.; Petrounias, I. Mining Temporal Features in Association Rules. In Principles of Data Mining and Knowledge Discovery; Żytkow, J.M., Rauch, J., Eds.; Lecture Notes in Computer Science; Springer: Berlin/Heidelberg, Germany, 1999; pp. 295–300. [Google Scholar] [CrossRef]
- Al-Maolegi, M.; Arkok, B. An Improved Apriori Algorithm for Association Rules. Int. J. Nat. Lang. Comput. 2014, 3, 21–29. [Google Scholar] [CrossRef]
- Said, A.M. A Comparative Study of FP-growth Variations. Int. J. Comput. Sci. Netw. Secur. 2009, 9, 266–272. [Google Scholar]
- Girotra, M.; Nagpal, K.; Minocha, S.; Sharma, N. Comparative Survey on Association Rule Mining Algorithms. Int. J. Comput. Appl. 2013, 84, 18–22. [Google Scholar] [CrossRef]
- Mooney, C.H.; Roddick, J.F. Sequential pattern mining-approaches and algorithms. ACM Comput. Surv. 2013, 45, 1–39. [Google Scholar] [CrossRef]
- Miani, R.G.L.; Junior, E.R.H. Eliminating Redundant and Irrelevant Association Rules in Large Knowledge Bases. In Proceedings of the 20th International Conference on Enterprise Information Systems, Funchal, Madeira, Portugal, 21–24 March 2018; pp. 17–28. [Google Scholar] [CrossRef]
- Fournier-Viger, P.; Nkambou, R.; Tseng, V.S.-M. RuleGrowth: Mining sequential rules common to several sequences by pattern-growth. In Proceedings of the 2011 ACM Symposium on Applied Computing, Taichung, Taiwan, 21–24 March 2011; pp. 956–961. [Google Scholar] [CrossRef]
- Liu, B.; Hsu, W.; Ma, Y. Mining association rules with multiple minimum supports. In Proceedings of the Knowledge Discovery and Data Mining, San Diego, CA, USA, 15–18 August 1999; pp. 337–341. [Google Scholar] [CrossRef]
- Baher, S.; Lobo, L.M. A Comparative Study of Association Rule Algorithms for Course Recommender System in E-learning. Int. J. Comput. Appl. 2012, 39, 48–52. [Google Scholar] [CrossRef]
- Peterson, K.T.; Sagan, V.; Sloan, J.J. Deep learning-based water quality estimation and anomaly detection using Landsat-8/Sentinel-2 virtual constellation and cloud computing. GIScience Remote Sens. 2020, 57, 510–525. [Google Scholar] [CrossRef]
- Dhore, A.; Byakude, A.; Sonar, B.; Waste, M. Weather prediction using the data mining Techniques. Int. Res. J. Eng. Technol. (IRJET) 2017, 4, 2562–2565. [Google Scholar]
- Tian, K.; Yan, H.Q.; Mao, Y.M.; Wu, S.C. Data Mining of Hidden Danger in Enterprise Production Safety and Research of Hidden Danger’s Model Conversion. In Proceedings of the International Petroleum Technology Conference IPTC, Beijing, China, 26–28 March 2019; p. D012S071R002. [Google Scholar]
- Atluri, G.; Karpatne, A.; Kumar, V. Spatio-temporal data mining: A survey of problems and methods. ACM Comput. Surv. (CSUR) 2018, 51, 1–41. [Google Scholar] [CrossRef]
- Kravchik, M.; Shabtai, A. Efficient cyber attack detection in industrial control systems using lightweight neural networks and PCA. IEEE Trans. Dependable Secur. Comput. 2021, 19, 2179–2197. [Google Scholar] [CrossRef]
- Bayerlein, L.; Knill, C.; Limberg, J.; Steinebach, Y. The more the better? Rule growth and policy impact. In Proceedings of the International Conference on Public Policy (ICPP4), Montreal, QC, Canada, 26–28 June 2019. [Google Scholar]
- Wang, H. Retraction Note: Analysis of drought climate ecology and college students’ entrepreneurial ability based on an ant colony optimization model. Arab. J. Geosci. 2021, 14, 2665. [Google Scholar] [CrossRef]
- Isikli, E.; Ustundag, A.; Cevikcan, E. The effects of environmental risk factors on city life cycle: A link analysis. Hum. Ecol. Risk Assess. Int. J. 2015, 21, 1379–1394. [Google Scholar] [CrossRef]
- Reddy, Y.C.A.P.; Viswanath, P.; Reddy, B.E. Semi-supervised learning: A brief review. Int. J. Eng. Technol. 2018, 7, 81–85. [Google Scholar] [CrossRef]
- Tanha, J.; Van Someren, M.; Afsarmanesh, H. Semi-supervised self-training for decision tree classifiers. Int. J. Mach. Learn. Cybern. 2015, 8, 355–370. [Google Scholar] [CrossRef]
- Blum, A.; Mitchell, T. Combining labeled and unlabeled data with co-training. In Proceedings of the Eleventh Annual Conference on Computational Learning Theory-COLT’ 98, Madison, WI, USA, 24–26 July 1998. [Google Scholar] [CrossRef]
- Sun, S. A survey of multi-view machine learning. Neural Comput. Appl. 2013, 23, 2031–2038. [Google Scholar] [CrossRef]
- Li, D.; Yang, J.; Kreis, K.; Torralba, A.; Fidler, S. Semantic Segmentation with Generative Models: Semi-Supervised Learning and Strong Out-of-Domain Generalization. In Proceedings of the IEEE/CVF Conference on Computer Vision and Pattern Recognition, Nashville, TN, USA, 20–25 June 2021; pp. 8300–8311. Available online: https://openaccess.thecvf.com/content/CVPR2021/html/Li_Semantic_Segmentation_With_Generative_Models_Semi-Supervised_Learning_and_Strong_Out-of-Domain_CVPR_2021_paper.html (accessed on 17 July 2023).
- Sawant, S.S.; Prabukumar, M. A review on graph-based semi-supervised learning methods for hyperspectral image classification. Egypt. J. Remote Sens. Space Sci. 2018, 23, 243–248. [Google Scholar] [CrossRef]
- Kondratovich, E.; Baskin, I.I.; Varnek, A. Transductive Support Vector Machines: Promising Approach to Model Small and Unbalanced Datasets. Mol. Inform. 2013, 32, 261–266. [Google Scholar] [CrossRef] [PubMed]
- Saab, C.; Zéhil, G.P. About Machine Learning Techniques in Water Quality Monitoring. In Proceedings of the 2023 Fifth International Conference on Advances in Computational Tools for Engineering Applications (ACTEA), Zouk Mosbeh, Lebanon, 5–7 July 2023; pp. 115–121. [Google Scholar]
- Zhou, T. Ensemble Models for Forecasting Microbusiness Density: A Research Study (No. 10920); EasyChair: Baltimore, MD, USA, 2023. [Google Scholar]
- Huang, X.; Wen, D.; Li, J.; Qin, R. Multi-level monitoring of subtle urban changes for the megacities of China using high-resolution multi-view satellite imagery. Remote Sens. Environ. 2017, 196, 56–75. [Google Scholar] [CrossRef]
- Wang, S.; Du, L.; Ye, J.; Zhao, D. A deep generative model for non-intrusive identification of EV charging pro-files. IEEE Trans. Smart Grid 2020, 11, 4916–4927. [Google Scholar] [CrossRef]
- Xiaoyu, S.; Zijing, L.; Velazquez, C.; Haifeng, J. The role of graph-based methods in urban drainage networks (UDNs): Review and directions for future. Urban Water J. 2023, 20, 1095–1109. [Google Scholar] [CrossRef]
- Priyalakshmi, V.; Devi, R. Intrusion Detection Using Enhanced Transductive Support Vector Machine. In Proceedings of the 2022 11th International Conference on System Modeling & Advancement in Research Trends (SMART), Moradabad, India, 16–17 December 2022; pp. 1571–1579. [Google Scholar]
- Raskutti, B.; Ferrá, H.; Kowalczyk, A. Combining clustering and co-training to enhance text classification using unlabelled data. In Proceedings of the Eighth ACM SIGKDD International Conference on Knowledge Discovery and Data Mining, in KDD ’02, New York, NY, USA, 23–26 July 2002; pp. 620–625. [Google Scholar] [CrossRef]
- Hadifar, A.; Sterckx, L.; Demeester, T.; Develder, C. A Self-Training Approach for Short Text Clustering. In Proceedings of the 4th Workshop on Representation Learning for NLP (RepL4NLP-2019), Florence, Italy, 2 August 2019; Association for Computational Linguistics, 2019; pp. 194–199. [Google Scholar] [CrossRef]
- Vercruyssen, V.; Meert, W.; Verbruggen, G.; Maes, K.; Baumer, R.; Davis, J. Semi-Supervised Anomaly Detection with an Application to Water Analytics. ICDM 2018, 2018, 527–536. [Google Scholar] [CrossRef]
- Alzanin, S.M.; Azmi, A.M. Rumor detection in Arabic tweets using semi-supervised and unsupervised expectation–maximization. Knowl. Based Syst. 2019, 185, 104945. [Google Scholar] [CrossRef]
- Eaton, E.; Desjardins, M.; Jacob, S. Multi-view clustering with constraint propagation for learning with an incomplete mapping between views. In Proceedings of the 19th ACM International Conference on Information and Knowledge Management, Toronto, ON, Canada, 26–30 October 2010; pp. 389–398. [Google Scholar] [CrossRef]
- Liu, J.; Li, T.; Xie, P.; Du, S.; Teng, F.; Yang, X. Urban big data fusion based on deep learning: An overview. Inf. Fusion 2019, 53, 123–133. [Google Scholar] [CrossRef]
- Brentan, B.; Carpitella, S.; Barros, D.; Meirelles, G.; Certa, A.; Izquierdo, J. Water quality sensor placement: A multi-objective and multi-criteria approach. Water Resour. Manag. 2021, 35, 225–241. [Google Scholar] [CrossRef]
- Roy, B.; Stepišnik, T.; The Pooled Resource Open-Access ALS Clinical Trials Consortium; Vens, C.; Džeroski, S.; Clinical Trials Consortium. Survival analysis with semi-supervised predictive clustering trees. Comput. Biol. Med. 2022, 141, 105001. [Google Scholar] [CrossRef]
- Weigel, B.; Graco-Roza, C.; Hultman, J.; Pajunen, V.; Teittinen, A.; Kuzmina, M.; Zakharov, E.V.; Soininen, J.; Ovaskainen, O. Local eukaryotic and bacterial stream community assembly is shaped by regional land use effects. ISME Commun. 2023, 3, 65. [Google Scholar] [CrossRef]
- Chen, J.; Sun, B.; Wang, L.; Fang, B.; Chang, Y.; Li, Y.; Zhang, J.; Lyu, X.; Chen, G. Semi-supervised semantic segmentation framework with pseudo supervisions for land-use/land-cover mapping in coastal areas. Int. J. Appl. Earth Obs. Geoinf. 2022, 112, 102881. [Google Scholar] [CrossRef]
- Datta, A.; Dasgupta, M. Energy efficient topology control in Underwater Wireless Sensor Networks. Comput. Electr. Eng. 2023, 105, 108485. [Google Scholar] [CrossRef]
- Mafra, M.S.H.; Lunardi, W.G.; Siegloch, A.E.; Rech, Â.F.; Rech, T.D.; Campos, M.L.; Kempka, A.P.; Werner, S.S. Potentially toxic metals of vegetable gardens of urban schools in Lages, Santa Catarina, Brazil. Ciência Rural. 2020, 50. [Google Scholar] [CrossRef]
- Qiang, W.; Zhongli, Z. Reinforcement learning model, algorithms and its application. In Proceedings of the 2011 International Conference on Mechatronic Science, Electric Engineering and Computer (MEC 2011), Jilin, China, 19–22 August 2011; pp. 1143–1146. [Google Scholar]
- Nian, R.; Liu, J.; Huang, B. A review on reinforcement learning: Introduction and applications in industrial process control. Comput. Chem. Eng. 2020, 139, 106886. [Google Scholar] [CrossRef]
- Dayan, P.; Niv, Y. Reinforcement learning: The Good, The Bad and The Ugly. Curr. Opin. Neurobiol. 2008, 18, 185–196. [Google Scholar] [CrossRef] [PubMed]
- Van Hasselt, H.; Guez, A.; Silver, D. Deep Reinforcement Learning with Double Q-Learning. Proc. AAAI Conf. Artif. Intell. 2016, 30. [Google Scholar] [CrossRef]
- François-Lavet, V.; Fonteneau, R.; Ernst, D. How to Discount Deep Reinforcement Learning: Towards New Dynamic Strategies. arXiv 2016. [Google Scholar] [CrossRef]
- Sutton, R.S.; McAllester, D.; Singh, S.; Mansour, Y. Policy Gradient Methods for Reinforcement Learning with Function Approximation. In Advances in Neural Information Processing Systems; MIT Press: Cambridge, MA, USA, 1999; Available online: https://proceedings.neurips.cc/paper_files/paper/1999/hash/464d828b85b0bed98e80ade0a5c43b0f-Abstract.html (accessed on 18 July 2023).
- Kumar, H.; Koppel, A.; Ribeiro, A. On the sample complexity of actor-critic method for reinforcement learning with function approximation. Mach. Learn. 2023, 112, 2433–2467. [Google Scholar] [CrossRef]
- Schulman, J.; Wolski, F.; Dhariwal, P.; Radford, A.; Klimov, O. Proximal Policy Optimization Algorithms. arXiv 2017. [Google Scholar] [CrossRef]
- Yoo, H.; Kim, B.; Kim, J.W.; Lee, J.H. Reinforcement learning based optimal control of batch processes using Monte-Carlo deep deterministic policy gradient with phase segmentation. Comput. Chem. Eng. 2020, 144, 107133. [Google Scholar] [CrossRef]
- Lazaric, A.; Restelli, M.; Bonarini, A. Reinforcement Learning in Continuous Action Spaces through Sequential Monte Carlo Methods. In Advances in Neural Information Processing Systems; Curran Associates, Inc.: Red Hook, NY, USA, 2007; Available online: https://proceedings.neurips.cc/paper_files/paper/2007/hash/0f840be9b8db4d3fbd5ba2ce59211f55-Abstract.html (accessed on 18 July 2023).
- Taylor, M.E.; Whiteson, S.; Stone, P. Comparing evolutionary and temporal difference methods in a reinforcement learning domain. In Proceedings of the 8th Annual Conference on Genetic and Evolutionary Computation, in GECCO ’06, New York, NY, USA, 8–12 July 2006; pp. 1321–1328. [Google Scholar]
- Babaeizadeh, M.; Frosio, I.; Tyree, S.; Clemons, J.; Kautz, J. Reinforcement Learning through Asynchronous Advantage Actor-Critic on a GPU. arXiv 2017. [Google Scholar] [CrossRef]
- Tang, C.-Y.; Liu, C.-H.; Chen, W.-K.; You, S.D. Implementing action mask in proximal policy optimization (PPO) algorithm. ICT Express 2020, 6, 200–203. [Google Scholar] [CrossRef]
- Haarnoja, T.; Zhou, A.; Hartikainen, K.; Tucker, G.; Ha, S.; Tan, J.; Kumar, V.; Zhu, H.; Gupta, A.; Abbeel, P.; et al. Soft Actor-Critic Algorithms and Applications. arXiv 2019. [Google Scholar] [CrossRef]
- Kim, M.; Han, D.-K.; Park, J.-H.; Kim, J.-S. Motion Planning of Robot Manipulators for a Smoother Path Using a Twin Delayed Deep Deterministic Policy Gradient with Hindsight Experience Replay. Appl. Sci. 2020, 10, 575. [Google Scholar] [CrossRef]
- Hung, F.; Yang, Y.C.E. Assessing adaptive irrigation impacts on water scarcity in nonstationary environments—A multi-agent reinforcement learning approach. Water Resour. Res. 2021, 57, e2020wr029262. [Google Scholar] [CrossRef]
- Sadeghi Tabas, S. Reinforcement Learning Policy Gradient Methods for Reservoir Operation Management and Control. 2021. Available online: https://tigerprints.clemson.edu/all_theses/3670 (accessed on 5 November 2023).
- Qiu, C.; Hu, Y.; Chen, Y.; Zeng, B. Deep deterministic policy gradient (DDPG)-based energy harvesting wireless communications. IEEE Internet Things J. 2019, 6, 8577–8588. [Google Scholar] [CrossRef]
- Zheng, Y.; Tao, J.; Sun, Q.; Sun, H.; Chen, Z.; Sun, M.; Xie, G. Soft Actor–Critic based active disturbance rejec-tion path following control for unmanned surface vessel under wind and wave disturbances. Ocean Eng. 2022, 247, 110631. [Google Scholar] [CrossRef]
- Moreira, T.M.; de Faria, J.G., Jr.; Vaz-de-Melo, P.O.; Chaimowicz, L.; Medeiros-Ribeiro, G. Prediction-free, real-time flexible control of tidal lagoons through Proximal Policy Optimisation: A case study for the Swansea Lagoon. Ocean Eng. 2022, 247, 110657. [Google Scholar] [CrossRef]
- Safari Sokhtehkolaei, F.; Norooz Valashedi, R.; Khoshravesh, M. Evaluation of Conceptual Hydrological Model (HBV) Parameters for Predicting Shahid Rajaei Dam Basin Flow by Monte Carlo Method. Irrig. Water Eng. 2023, 14, 118–131. [Google Scholar]
- Bamurigire, P.; Vodacek, A.; Valko, A.; Rutabayiro Ngoga, S. Simulation of internet of things water management for efficient rice irrigation in Rwanda. Agriculture 2020, 10, 431. [Google Scholar] [CrossRef]
- Nasr-Azadani, M.; Abouei, J.; Plataniotis, K.N. Single-and multiagent actor–critic for initial UAV’s deployment and 3-D trajectory design. IEEE Internet Things J. 2022, 9, 15372–15389. [Google Scholar] [CrossRef]
- VanNijnatten, D.; Johns, C. Assessing the proximity to the desired End State in complex Water systems: Com-paring the Great Lakes and Rio Grande transboundary basins. Environ. Sci. Policy 2020, 114, 194–203. [Google Scholar] [CrossRef]
- Wu, X.; Jiang, W.; Yuan, S.; Kang, H.; Gao, Q.; Mi, J. Automatic Casting Control Method of Continuous Casting Based on Improved Soft Actor–Critic Algorithm. Metals 2023, 13, 820. [Google Scholar] [CrossRef]
- Oboreh-Snapps, O.; She, B.; Fahad, S.; Chen, H.; Kimball, J.; Li, F.; Cui, H.; Bo, R. Virtual Synchronous Generator Control Using Twin Delayed Deep Deterministic Policy Gradient Method. IEEE Trans. Energy Convers. 2023, 1–15. [Google Scholar] [CrossRef]
- Ghobadi, F.; Kang, D. Improving long-term streamflow prediction in a poorly gauged basin using geo-spatiotemporal mesoscale data and attention-based deep learning: A comparative study. J. Hydrol. 2022, 615. [Google Scholar] [CrossRef]
- Ghobadi, F.; Kang, D. Multi-Step Ahead Probabilistic Forecasting of Daily Streamflow Using Bayesian Deep Learning: A Multiple Case Study. Water 2022, 14, 3672. [Google Scholar] [CrossRef]
- Talukdar, S.; Singha, P.; Mahato, S.; Shahfahad; Pal, S.; Liou, Y.-A.; Rahman, A. Land-Use Land-Cover Classification by Machine Learning Classifiers for Satellite Observations—A Review. Remote Sens. 2020, 12, 1135. [Google Scholar] [CrossRef]
- Huang, R.; Ma, C.; Ma, J.; Huangfu, X.; He, Q. Machine learning in natural and engineered water systems. Water Res. 2021, 205, 117666. [Google Scholar] [CrossRef]
- Oğuz, A.; Ertuğrul, F. A survey on applications of machine learning algorithms in water quality assessment and water supply and management. Water Supply 2023, 23, 895–922. [Google Scholar] [CrossRef]
- Kisi, O. Machine Learning with Metaheuristic Algorithms for Sustainable Water Resources Management. Sustainability 2021, 13, 8596. [Google Scholar] [CrossRef]
- Estrada, P.A.L.; Jimenez, E.L.; Nuno, J.A.M.; Lomas, J.H.P. Water bodies detection using supervised learning algorithms. In Proceedings of the 2019 IEEE International Fall Meeting on Communications and Computing (ROC&C), Acapulco, Mexico, 6–8 March 2019; pp. 45–50. [Google Scholar]
- Nasir, N.; Kansal, A.; Alshaltone, O.; Barneih, F.; Sameer, M.; Shanableh, A.; Al-Shamma’a, A. Water quality classification using machine learning algorithms. J. Water Process Eng. 2022, 48, 102920. [Google Scholar] [CrossRef]
- Jie, R.C.W.; Tan, C.Y.; Teo, F.Y.; Goh, B.H.; Mah, Y.S. A Review of Managing Water Resources in Malaysia with Big Data Approaches. Water Manag. Sustain. Asia 2021, 23, 141–148. [Google Scholar]
- Govindan, R.; Al-Ansari, T. Computational decision framework for enhancing resilience of the energy, water and food nexus in risky environments. Renew. Sustain. Energy Rev. 2019, 112, 653–668. [Google Scholar] [CrossRef]
- Caiafa, C.F.; Solé-Casals, J.; Marti-Puig, P.; Zhe, S.; Tanaka, T. Decomposition methods for machine learning with small, incomplete or noisy datasets. Appl. Sci. 2020, 10, 8481. [Google Scholar] [CrossRef]
- Mabina, P.; Mukoma, P.; Booysen, M. Sustainability matchmaking: Linking renewable sources to electric water heating through machine learning. Energy Build. 2021, 246, 111085. [Google Scholar] [CrossRef]
- Heidari, A.; Olsen, N.; Mermod, P.; Alahi, A.; Khovalyg, D. Adaptive hot water production based on Supervised Learning. Sustain. Cities Soc. 2020, 66, 102625. [Google Scholar] [CrossRef]
- Mahmoud, H.; Wu, W.; Gaber, M.M. A Time-Series Self-Supervised Learning Approach to Detection of Cyber-physical Attacks in Water Distribution Systems. Energies 2022, 15, 914. [Google Scholar] [CrossRef]
- Ferrero, G.; Setty, K.; Rickert, B.; George, S.; Rinehold, A.; DeFrance, J.; Bartram, J. Capacity building and training approaches for water safety plans: A comprehensive literature review. Int. J. Hyg. Environ. Health 2019, 222, 615–627. [Google Scholar] [CrossRef]
- Häse, F.; Roch, L.M.; Friederich, P.; Aspuru-Guzik, A. Designing and understanding light-harvesting devices with machine learning. Nat. Commun. 2020, 11, 1–11. [Google Scholar] [CrossRef]
- Alimi, O.A.; Ouahada, K.; Abu-Mahfouz, A.M.; Rimer, S.; Alimi, K.O.A. A Review of Research Works on Supervised Learning Algorithms for SCADA Intrusion Detection and Classification. Sustainability 2021, 13, 9597. [Google Scholar] [CrossRef]
- Manoharan, S. Supervised Learning for Microclimatic parameter Estimation in a Greenhouse environment for productive Agronomics. J. Artif. Intell. Capsul. Netw. 2020, 2, 170–176. [Google Scholar] [CrossRef]
- Tyralis, H.; Papacharalampous, G.; Langousis, A. A Brief Review of Random Forests for Water Scientists and Practitioners and Their Recent History in Water Resources. Water 2019, 11, 910. [Google Scholar] [CrossRef]
- Elavarasan, D.; Vincent, D.R.; Sharma, V.; Zomaya, A.Y.; Srinivasan, K. Forecasting yield by integrating agrarian factors and machine learning models: A survey. Comput. Electron. Agric. 2018, 155, 257–282. [Google Scholar] [CrossRef]
- More, K.S.; Wolkersdorfer, C. Application of machine learning algorithms for nonlinear system forecasting through analytics—A case study with mining influenced water data. Water Resour. Ind. 2023, 29. [Google Scholar] [CrossRef]
- Taoufik, N.; Boumya, W.; Achak, M.; Chennouk, H.; Dewil, R.; Barka, N. The state of art on the prediction of efficiency and modeling of the processes of pollutants removal based on machine learning. Sci. Total Environ. 2022, 807, 150554. [Google Scholar] [CrossRef] [PubMed]
- Jiang, W.; Pokharel, B.; Lin, L.; Cao, H.; Carroll, K.C.; Zhang, Y.; Galdeano, C.; Musale, D.A.; Ghurye, G.L.; Xu, P. Analysis and prediction of produced water quantity and quality in the Permian Basin using machine learning techniques. Sci. Total. Environ. 2021, 801, 149693. [Google Scholar] [CrossRef] [PubMed]
- Tan, W.Y.; Lai, S.H.; Teo, F.Y.; El-Shafie, A. State-of-the-Art Development of Two-Waves Artificial Intelli-gence Modeling Techniques for River Streamflow Forecasting. Arch. Comput. Methods Eng. 2022, 29, 5185–5211. [Google Scholar] [CrossRef]
- Aquil, M.A.I.; Ishak, W.H.W. Comparison of Machine Learning Models in Forecasting Reservoir Water Level. J. Adv. Res. Appl. Sci. Eng. Technol. 2023, 31, 137–144. [Google Scholar] [CrossRef]
- Sapitang, M.; Ridwan, W.M.; Faizal Kushiar, K.; Najah Ahmed, A.; El-Shafie, A. Machine learning application in reservoir water level forecasting for sustainable hydropower generation strategy. Sustainability 2020, 12, 6121. [Google Scholar] [CrossRef]
- Wee, W.J.; Zaini, N.B.; Ahmed, A.N.; El-Shafie, A. A review of models for water level forecasting based on machine learning. Earth Sci. Inform. 2021, 14, 1707–1728. [Google Scholar] [CrossRef]
- Miro, M.E.; Groves, D.; Tincher, B.; Syme, J.; Tanverakul, S.; Catt, D. Adaptive water management in the face of uncertainty: Integrating machine learning, groundwater modeling and robust decision making. Clim. Risk Manag. 2021, 34, 100383. [Google Scholar] [CrossRef]
- Phan, T.-T.-H.; Nguyen, X.H. Combining statistical machine learning models with ARIMA for water level forecasting: The case of the Red river. Adv. Water Resour. 2020, 142, 103656. [Google Scholar] [CrossRef]
- Chakravarthy, S.R.S.; Bharanidharan, N.; Rajaguru, H. A systematic review on machine learning algorithms used for forecasting lake-water level fluctuations. Concurr. Comput. Pract. Exp. 2022, 34, e7231. [Google Scholar] [CrossRef]
- Boudhaouia, A.; Wira, P. A Real-Time Data Analysis Platform for Short-Term Water Consumption Forecasting with Machine Learning. Forecasting 2021, 3, 682–694. [Google Scholar] [CrossRef]
- Ghobadi, F.; Kang, D. Application of Machine Learning in Water Resources Management: A Systematic Literature Review. Water 2023, 15, 620. [Google Scholar] [CrossRef]
- Mounce, S.; Pedraza, C.; Jackson, T.; Linford, P.; Boxall, J. Cloud Based Machine Learning Approaches for Leakage Assessment and Management in Smart Water Networks. Procedia Eng. 2015, 119, 43–52. [Google Scholar] [CrossRef]
- Hao, W.; Cominola, A.; Castelletti, A. Comparing Predictive Machine Learning Models for Short- and Long-Term Urban Water Demand Forecasting in Milan, Italy. IFAC-PapersOnLine 2022, 55, 92–98. [Google Scholar] [CrossRef]
- Chouaib, E.H.; Salwa, B.; Saïd, K.; Abdelghani, C. Early Estimation of Daily Reference Evapotranspiration Using Machine Learning Techniques for Efficient Management of Irrigation Water. J. Phys. Conf. Ser. 2022, 2224, 012006. [Google Scholar] [CrossRef]
- Zhang, S.; Omar, A.H.; Hashim, A.S.; Alam, T.; Khalifa, H.A.E.-W.; Elkotb, M.A. Enhancing waste management and prediction of water quality in the sustainable urban environment using optimized algorithm of least square support vector machine and deep learning techniques. Urban Clim. 2023, 49, 101487. [Google Scholar] [CrossRef]
- Zakaria, M.N.A.; Ahmed, A.N.; Malek, M.A.; Birima, A.H.; Khan, M.H.; Sherif, M.; Elshafie, A. Exploring machine learning algorithms for accurate water level forecasting in Muda river, Malaysia. Heliyon 2023, 9, e17689. [Google Scholar] [CrossRef] [PubMed]
- Sattar, A.M.A.; Ertuğrul, F.; Gharabaghi, B.; McBean, E.A.; Cao, J. Extreme learning machine model for water network management. Neural Comput. Appl. 2017, 31, 157–169. [Google Scholar] [CrossRef]
- Jamei, M.; Ali, M.; Malik, A.; Prasad, R.; Abdulla, S.; Yaseen, Z.M. Forecasting Daily Flood Water Level Using Hybrid Advanced Machine Learning Based Time-Varying Filtered Empirical Mode Decomposition Approach. Water Resour. Manag. 2022, 36, 4637–4676. [Google Scholar] [CrossRef]
- Nguyen, T.-T.; Huu, Q.N.; Li, M.J. Forecasting Time Series Water Levels on Mekong River Using Machine Learning Models. In Proceedings of the 2015 Seventh International Conference on Knowledge and Systems Engineering (KSE), Ho Chi Minh City, Vietnam, 8–10 October 2015; pp. 292–297. [Google Scholar] [CrossRef]
- Duerr, I.; Merrill, H.R.; Wang, C.; Bai, R.; Boyer, M.; Dukes, M.D.; Bliznyuk, N. Forecasting urban household water demand with statistical and machine learning methods using large space-time data: A Comparative study. Environ. Model. Softw. 2018, 102, 29–38. [Google Scholar] [CrossRef]
- Elbeltagi, A.; Srivastava, A.; Deng, J.; Li, Z.; Raza, A.; Khadke, L.; Yu, Z.; El-Rawy, M. Forecasting vapor pressure deficit for agricultural water management using machine learning in semi-arid environments. Agric. Water Manag. 2023, 283, 108302. [Google Scholar] [CrossRef]
- Panahi, J.; Mastouri, R.; Shabanlou, S. Insights into enhanced machine learning techniques for surface water quantity and quality prediction based on data pre-processing algorithms. J. Hydroinform. 2022, 24, 875–897. [Google Scholar] [CrossRef]
- Tan, W.Y.; Lai, S.H.; Teo, F.Y.; Armaghani, D.J.; Pavitra, K.; El-Shafie, A. Three Steps towards Better Forecasting for Streamflow Deep Learning. Appl. Sci. 2022, 12, 12567. [Google Scholar] [CrossRef]
- Swetha, T.M.; Yogitha, T.; Hitha, M.K.S.; Syamanthika, P.; Poorna, S.S.; Anuraj, K. IOT Based Water Management System for Crops Using Conventional Machine Learning Techniques. In Proceedings of the 2021 12th International Conference on Computing Communication and Networking Technologies (ICCCNT), Kharagpur, India, 6–8 July 2021; pp. 1–4. [Google Scholar]
- Candelieri, A.; Soldi, D.; Archetti, F. Layered Machine Learning for Short-Term Water Demand Forecasting. Environ. Eng. Manag. J. 2015, 14, 2061–2072. [Google Scholar] [CrossRef]
- Neshenko, N.; Bou-Harb, E.; Furht, B.; Behara, R. Machine learning and user interface for cyber risk management of water infrastructure. Risk Anal. 2023. [Google Scholar] [CrossRef]
- Gangrade, S.; Lu, D.; Kao, S.; Painter, S.L. Machine Learning Assisted Reservoir Operation Model for Long-Term Water Management Simulation. JAWRA J. Am. Water Resour. Assoc. 2022, 58, 1592–1603. [Google Scholar] [CrossRef]
- Appling, A.P.; Oliver, S.K.; Read, J.S.; Sadler, J.M.; Zwart, J. Machine Learning for Understanding Inland Water Quantity, Quality, and Ecology. September 2022. Available online: https://eartharxiv.org/repository/view/3565/ (accessed on 2 October 2023).
- Vinothkumar, U.; Suresh, S.; Sasireka, S.; Hariprabhu, M.; Nagarathna, P. Machine learning integrated with an Internet of Things-based water management System. In Proceedings of the 2022 IEEE 2nd Mysore Sub Section International Conference (MysuruCon), Mysuru, India, 16–17 October 2022; pp. 1–7. [Google Scholar]
- Jesus, E.d.S.d.; Gomes, G.S.d.S. Machine learning models for forecasting water demand for the Metropolitan Region of Salvador, Bahia. Neural Comput. Appl. 2023, 35, 19669–19683. [Google Scholar] [CrossRef]
- Tiwari, M.K.; Adamowski, J.F. Medium-Term Urban Water Demand Forecasting with Limited Data Using an Ensemble Wavelet–Bootstrap Machine-Learning Approach. J. Water Resour. Plan. Manag. 2015, 141. [Google Scholar] [CrossRef]
- Kumar, D.; Singh, V.K.; Abed, S.A.; Tripathi, V.K.; Gupta, S.; Al-Ansari, N.; Vishwakarma, D.K.; Dewidar, A.Z.; Al Othman, A.A.; Mattar, M.A. Multi-ahead electrical conductivity forecasting of surface water based on machine learning algorithms. Appl. Water Sci. 2023, 13, 13. [Google Scholar] [CrossRef]
- Liu, G.; Savic, D.; Fu, G. Short-term water demand forecasting using data-centric machine learning approaches. J. Hydroinform. 2023, 25, 895–911. [Google Scholar] [CrossRef]
- Latif, S.D.; Ahmed, A.N. Streamflow Prediction Utilizing Deep Learning and Machine Learning Algorithms for Sustainable Water Supply Management. Water Resour. Manag. 2023, 37, 3227–3241. [Google Scholar] [CrossRef]
- Ahansal, Y.; Bouziani, M.; Yaagoubi, R.; Sebari, I.; Sebari, K.; Kenny, L. Towards Smart Irrigation: A Literature Review on the Use of Geospatial Technologies and Machine Learning in the Management of Water Resources in Arboriculture. Agronomy 2022, 12, 297. [Google Scholar] [CrossRef]
- Lin, Y.-C.; Alorfi, A.S.; Hasanin, T.; Arumugam, M.; Alroobaea, R.; Alsafyani, M.; Alghamdi, W.Y. Water agricultural management based on hydrology using machine learning techniques for feature extraction and classification. Acta Geophys. 2023, 1–11. [Google Scholar] [CrossRef]
- Tiwari, M.; Adamowski, J.; Adamowski, K. Water demand forecasting using extreme learning machines. J. Water Land Dev. 2016, 28, 37–52. [Google Scholar] [CrossRef]
- Ibrahim, T.; Omar, Y.; Maghraby, F.A. Water Demand Forecasting Using Machine Learning and Time Series Algorithms. In Proceedings of the 2020 International Conference on Emerging Smart Computing and Informatics (ESCI), Pune, India, 12–14 March 2020; pp. 325–329. [Google Scholar]
- Sophia, S.G.G.; Sharmila, V.C.; Suchitra, S.; Muthu, T.S.; Pavithra, B. Water management using genetic algorithm-based machine learning. Soft Comput. 2020, 24, 17153–17165. [Google Scholar] [CrossRef]
- Aslam, B.; Maqsoom, A.; Cheema, A.H.; Ullah, F.; Alharbi, A.; Imran, M. Water Quality Management Using Hybrid Machine Learning and Data Mining Algorithms: An Indexing Approach. IEEE Access 2022, 10, 119692–119705. [Google Scholar] [CrossRef]
- Groppo, G.d.d.S.; Costa, M.A.; Libânio, M. Predicting time-series for water demand in the big data environment using statistical methods, machine learning and the novel analog methodology dynamic time scan forecasting. Water Supply 2023, 23, 624–644. [Google Scholar] [CrossRef]
- Sit, M.; Demiray, B.Z.; Xiang, Z.; Ewing, G.J.; Sermet, Y.; Demir, I. A comprehensive review of deep learning applications in hydrology and water resources. Water Sci. Technol. 2020, 82, 2635–2670. [Google Scholar] [CrossRef] [PubMed]
- Jang, D. A Parameter Classification System for Nonrevenue Water Management in Water Distribution Networks. Adv. Civ. Eng. 2018, 2018, 3841979. [Google Scholar] [CrossRef]
- Tiyasha; Tung, T.M.; Yaseen, Z.M. A survey on river water quality modelling using artificial intelligence models: 2000–2020. J. Hydrol. 2020, 585, 124670. [Google Scholar] [CrossRef]
- Dobson, B.; Wagener, T.; Pianosi, F. An argument-driven classification and comparison of reservoir operation optimization methods. Adv. Water Resour. 2019, 128, 74–86. [Google Scholar] [CrossRef]
- Patil, D.; Kar, S.; Gupta, R. Classification and Prediction of Developed Water Quality Indexes Using Soft Computing Tools. Water Conserv. Sci. Eng. 2023, 8, 16. [Google Scholar] [CrossRef]
- Kumari, M.K.N.; Sakai, K.; Kimura, S.; Yuge, K.; Gunarathna, M.H.J.P. Classification of Groundwater Suitability for Irrigation in the Ulagalla Tank Cascade Landscape by GIS and the Analytic Hierarchy Process. Agronomy 2019, 9, 351. [Google Scholar] [CrossRef]
- Morris, G.L. Classification of Management Alternatives to Combat Reservoir Sedimentation. Water 2020, 12, 861. [Google Scholar] [CrossRef]
- Rahimi, M.; Ebrahimi, H. Data driven of underground water level using artificial intelligence hybrid algorithms. Sci. Rep. 2023, 13, 10359. [Google Scholar] [CrossRef]
- Tiyasha; Tung, T.M.; Yaseen, Z.M. Deep Learning for Prediction of Water Quality Index Classification: Tropical Catchment Environmental Assessment. Nat. Resour. Res. 2021, 30, 4235–4254. [Google Scholar] [CrossRef]
- Liu, Y.; Wang, J.; Chen, H.; Cheng, D. Environmentally friendly hydrogel: A review of classification, preparation and application in agriculture. Sci. Total. Environ. 2022, 846, 157303. [Google Scholar] [CrossRef] [PubMed]
- He, S.; Li, P.; Wu, J.; Elumalai, V.; Adimalla, N. Groundwater quality under land use/land cover changes: A temporal study from 2005 to 2015 in Xi’an, Northwest China. Hum. Ecol. Risk Assess. Int. J. 2019, 26, 2771–2797. [Google Scholar] [CrossRef]
- Wan, X.; Kuhanestani, P.K.; Farmani, R.; Keedwell, E. Literature Review of Data Analytics for Leak Detection in Water Distribution Networks: A Focus on Pressure and Flow Smart Sensors. J. Water Resour. Plan. Manag. 2022, 148, 03122002. [Google Scholar] [CrossRef]
- Aivazidou, E.; Banias, G.; Lampridi, M.; Vasileiadis, G.; Anagnostis, A.; Papageorgiou, E.; Bochtis, D. Smart technologies for sustainable water management: An urban analysis. Sustainability 2021, 13, 13940. [Google Scholar] [CrossRef]
- Mahlknecht, J.; Torres-Martínez, J.A.; Kumar, M.; Mora, A.; Kaown, D.; Loge, F.J. Nitrate prediction in groundwater of data scarce regions: The futuristic fresh-water management outlook. Sci. Total. Environ. 2023, 905, 166863. [Google Scholar] [CrossRef] [PubMed]
- Nguyen, K.A.; Stewart, R.A.; Zhang, H.; Sahin, O.; Siriwardene, N. Re-engineering traditional urban water management practices with smart metering and informatics. Environ. Model. Softw. 2018, 101, 256–267. [Google Scholar] [CrossRef]
- Nair, J.P.; Vijaya, M.S. River Water Quality Prediction and index classification using Machine Learning. J. Phys. Conf. Ser. 2022, 2325, 012011. [Google Scholar] [CrossRef]
- Chu, H.; Wei, J.; Wu, W. Streamflow prediction using LASSO-FCM-DBN approach based on hydro-meteorological condition classification. J. Hydrol. 2019, 580, 124253. [Google Scholar] [CrossRef]
- Pires, A.; Morato, J.; Peixoto, H.; Botero, V.; Zuluaga, L.; Figueroa, A. Sustainability Assessment of indicators for integrated water resources management. Sci. Total Environ. 2017, 578, 139–147. [Google Scholar] [CrossRef]
- Cominola, A.; Preiss, L.; Thyer, M.; Maier, H.R.; Prevos, P.; Stewart, R.A.; Castelletti, A. The determinants of household water consumption: A review and assessment framework for research and practice. NPJ Clean Water 2023, 6, 11. [Google Scholar] [CrossRef]
- Varol, M. Use of water quality index and multivariate statistical methods for the evaluation of water quality of a stream affected by multiple stressors: A case study. Environ. Pollut. 2020, 266, 115417. [Google Scholar] [CrossRef] [PubMed]
- Ahmadi, A.; Olyaei, M.; Heydari, Z.; Emami, M.; Zeynolabedin, A.; Ghomlaghi, A.; Daccache, A.; Fogg, G.E.; Sadegh, M. Groundwater Level Modeling with Machine Learning: A Systematic Review and Meta-Analysis. Water 2022, 14, 949. [Google Scholar] [CrossRef]
- Alshaikhli, M.; Aqeel, S.; Valdeolmillos, N.; Fathima, F.; Choe, P. A Multi-Linear Regression Model to Predict the Factors Affecting Water Consumption in Qatar. IOP Conf. Ser. Earth Environ. Sci. 2021, 691, 012004. [Google Scholar] [CrossRef]
- Girish, A.; Selladurai, S.; Lolla, A.D.; Prasanth, A.S. A Novel Mechanism to Decrease Water Consumption in Commodes. In Proceedings of the 2022 International Conference and Utility Exhibition on Energy, Environment and Climate Change (ICUE), Pattaya City, Thailand, 26–28 October 2022; pp. 1–6. [Google Scholar]
- Gouveia, C.G.N.; Soares, A.K. Water Connection Bursting and Leaks Prediction Using Machine Learning. In World Environmental and Water Resources Congress 2021; ASCE: Reston, VI, USA, 2021; pp. 1000–1013. [Google Scholar]
- Ortas, E.; Burritt, R.L.; Christ, K.L. The influence of macro factors on corporate water management: A multi-country quantile regression approach. J. Clean. Prod. 2019, 226, 1013–1021. [Google Scholar] [CrossRef]
- Wang, F.; Wang, Y.; Zhang, K.; Hu, M.; Weng, Q.; Zhang, H. Spatial heterogeneity modeling of water quality based on random forest regression and model interpretation. Environ. Res. 2021, 202, 111660. [Google Scholar] [CrossRef] [PubMed]
- Grespan, A.; Garcia, J.; Brikalski, M.P.; Henning, E.; Kalbusch, A. Assessment of water consumption in households using statistical analysis and regression trees. Sustain. Cities Soc. 2022, 87, 104186. [Google Scholar] [CrossRef]
- Huang, X.; Gao, L.; Crosbie, R.S.; Zhang, N.; Fu, G.; Doble, R. Groundwater Recharge Prediction Using Linear Regression, Multi-Layer Perception Network, and Deep Learning. Water 2019, 11, 1879. [Google Scholar] [CrossRef]
- Subramani, N.; Mohan, P.; Alotaibi, Y.; Alghamdi, S.; Khalaf, O.I. An Efficient Metaheuristic-Based Clustering with Routing Protocol for Underwater Wireless Sensor Networks. Sensors 2022, 22, 415. [Google Scholar] [CrossRef]
- Ben Brahim, F.; Boughariou, E.; Hajji, S.; Bouri, S. Assessment of groundwater quality with analytic hierarchy process, Boolean logic and clustering analysis using GIS platform in the Kebili’s complex terminal groundwater, SW Tunisia. Environ. Earth Sci. 2022, 81, 419. [Google Scholar] [CrossRef]
- Romero-Ben, L.; Cembrano, G.; Puig, V.; Blesa, J. Model-free Sensor Placement for Water Distribution Networks using Genetic Algorithms and Clustering*. IFAC-PapersOnLine 2022, 55, 54–59. [Google Scholar] [CrossRef]
- Neupane, J.; Guo, W. Agronomic Basis and Strategies for Precision Water Management: A Review. Agronomy 2019, 9, 87. [Google Scholar] [CrossRef]
- Egbueri, J.C. Groundwater quality assessment using pollution index of groundwater (PIG), ecological risk index (ERI) and hierarchical cluster analysis (HCA): A case study. Groundw. Sustain. Dev. 2019, 10, 100292. [Google Scholar] [CrossRef]


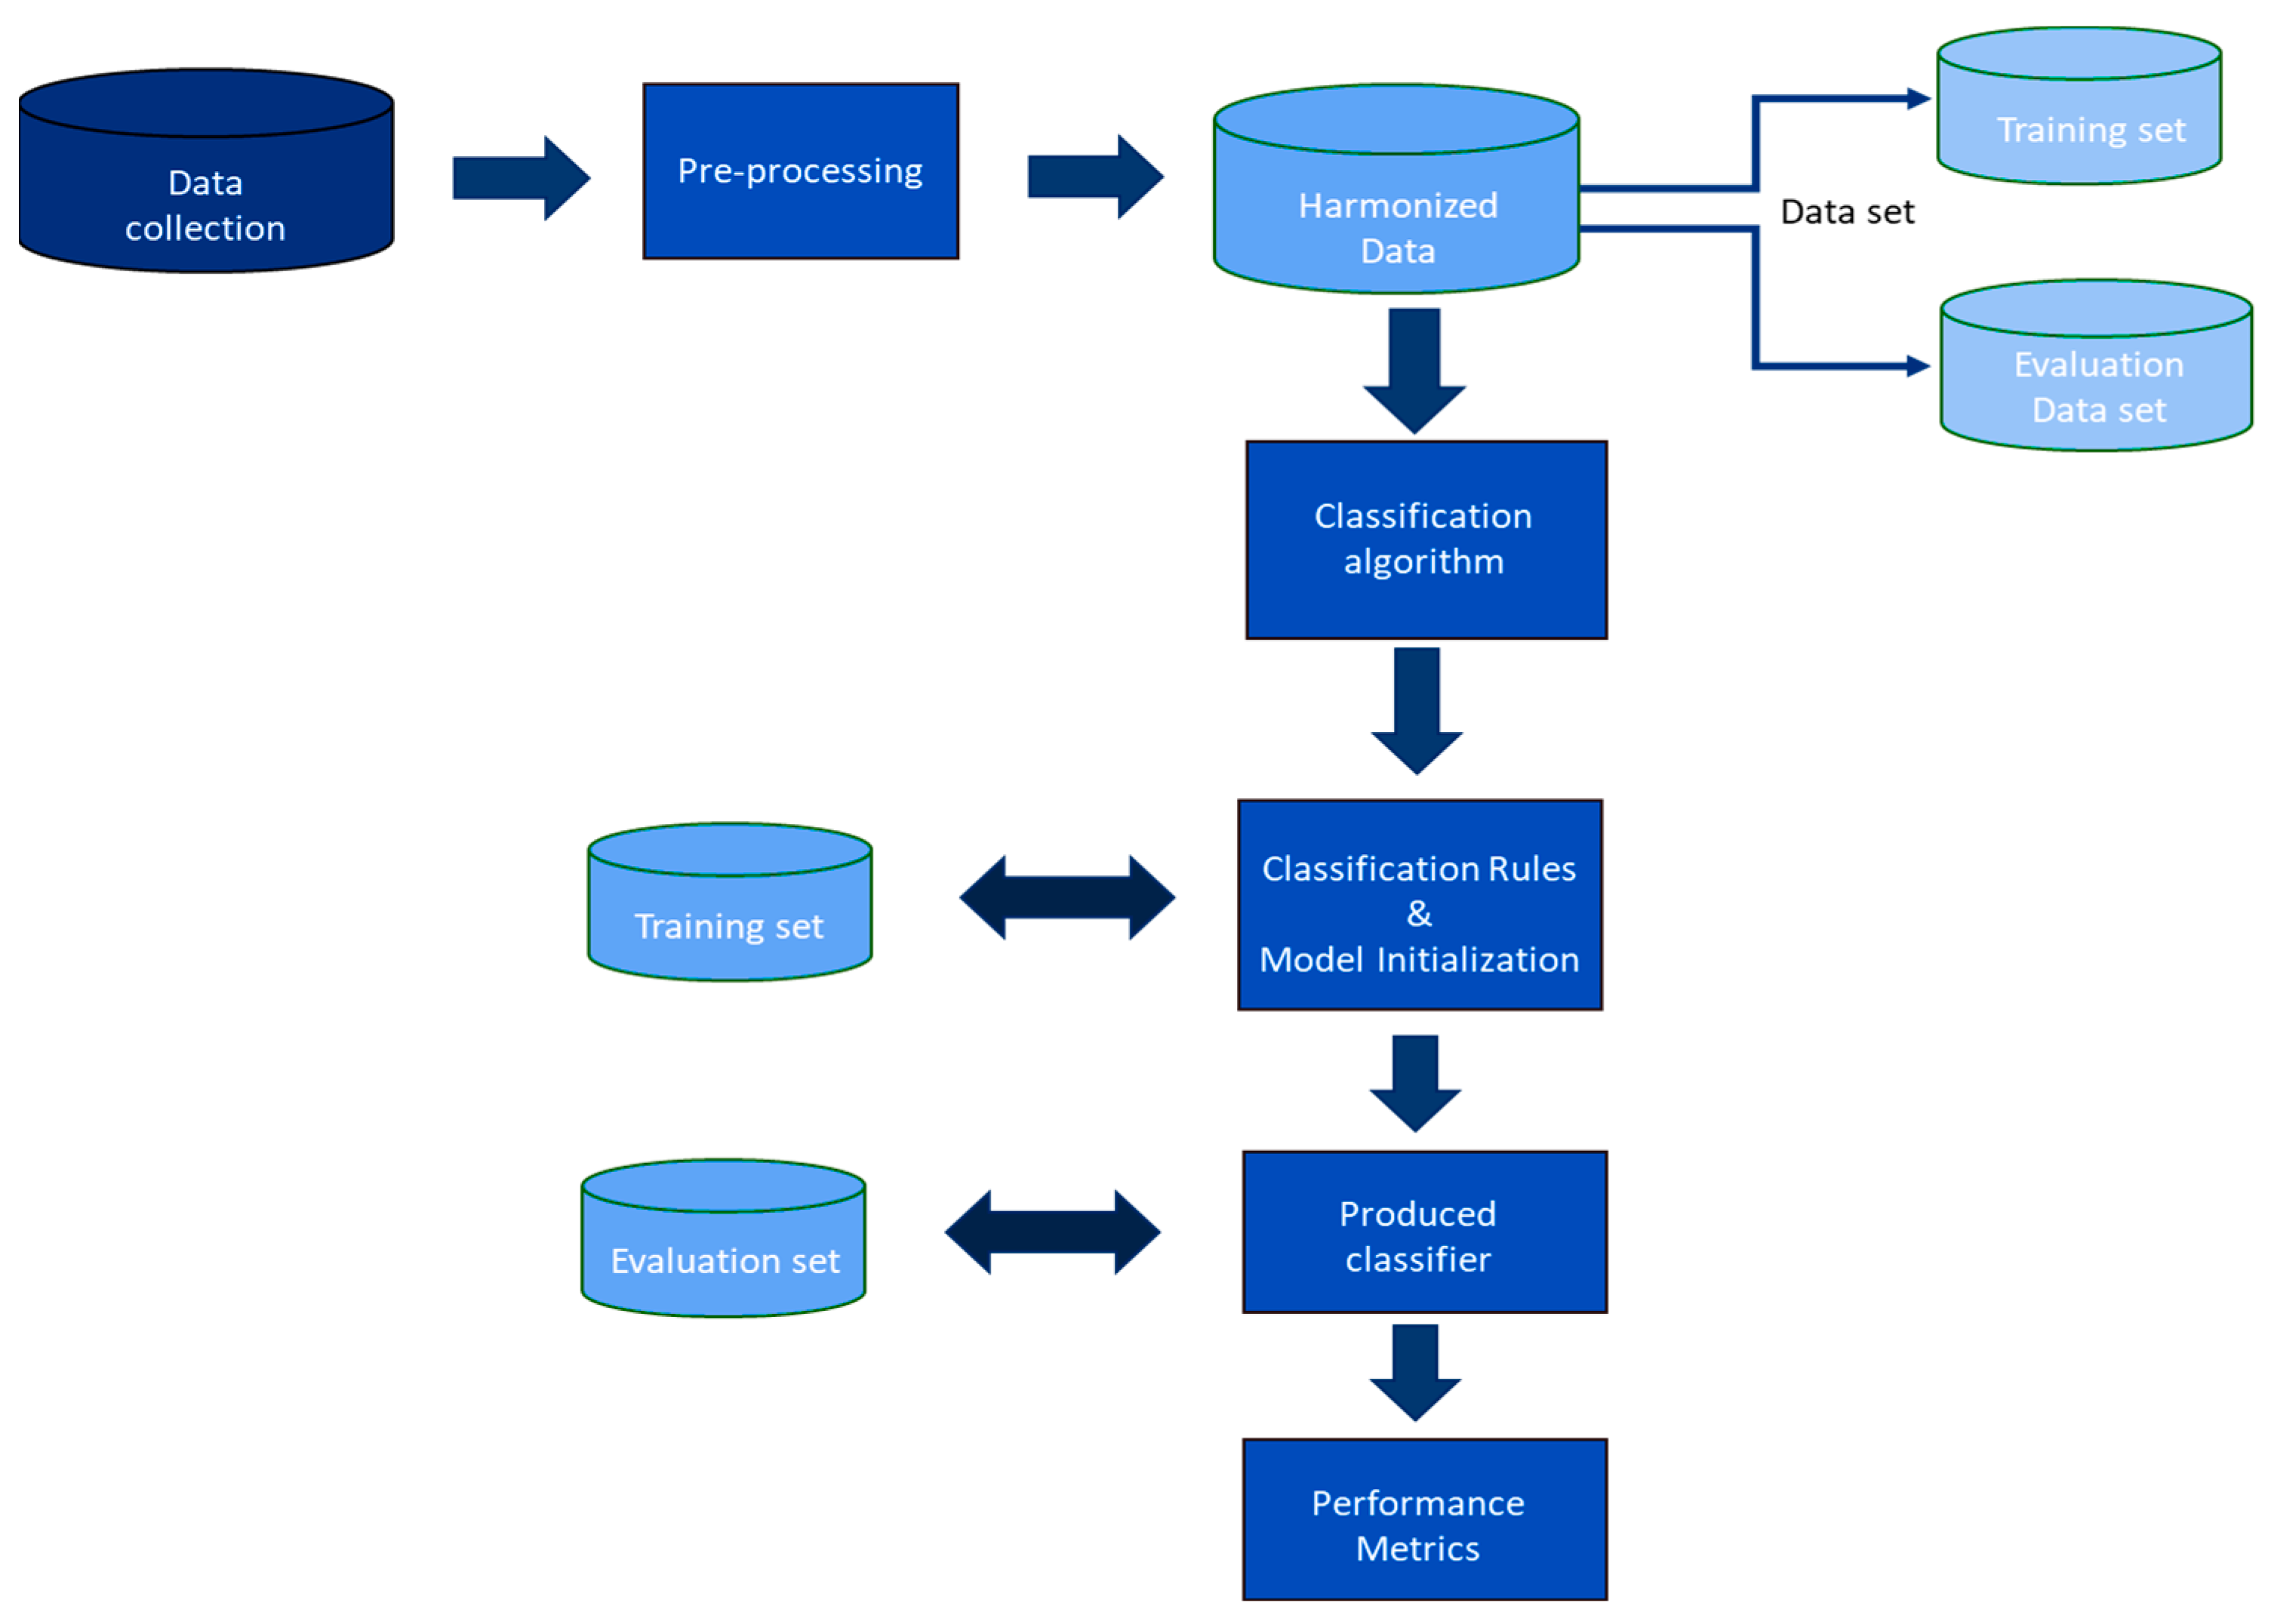
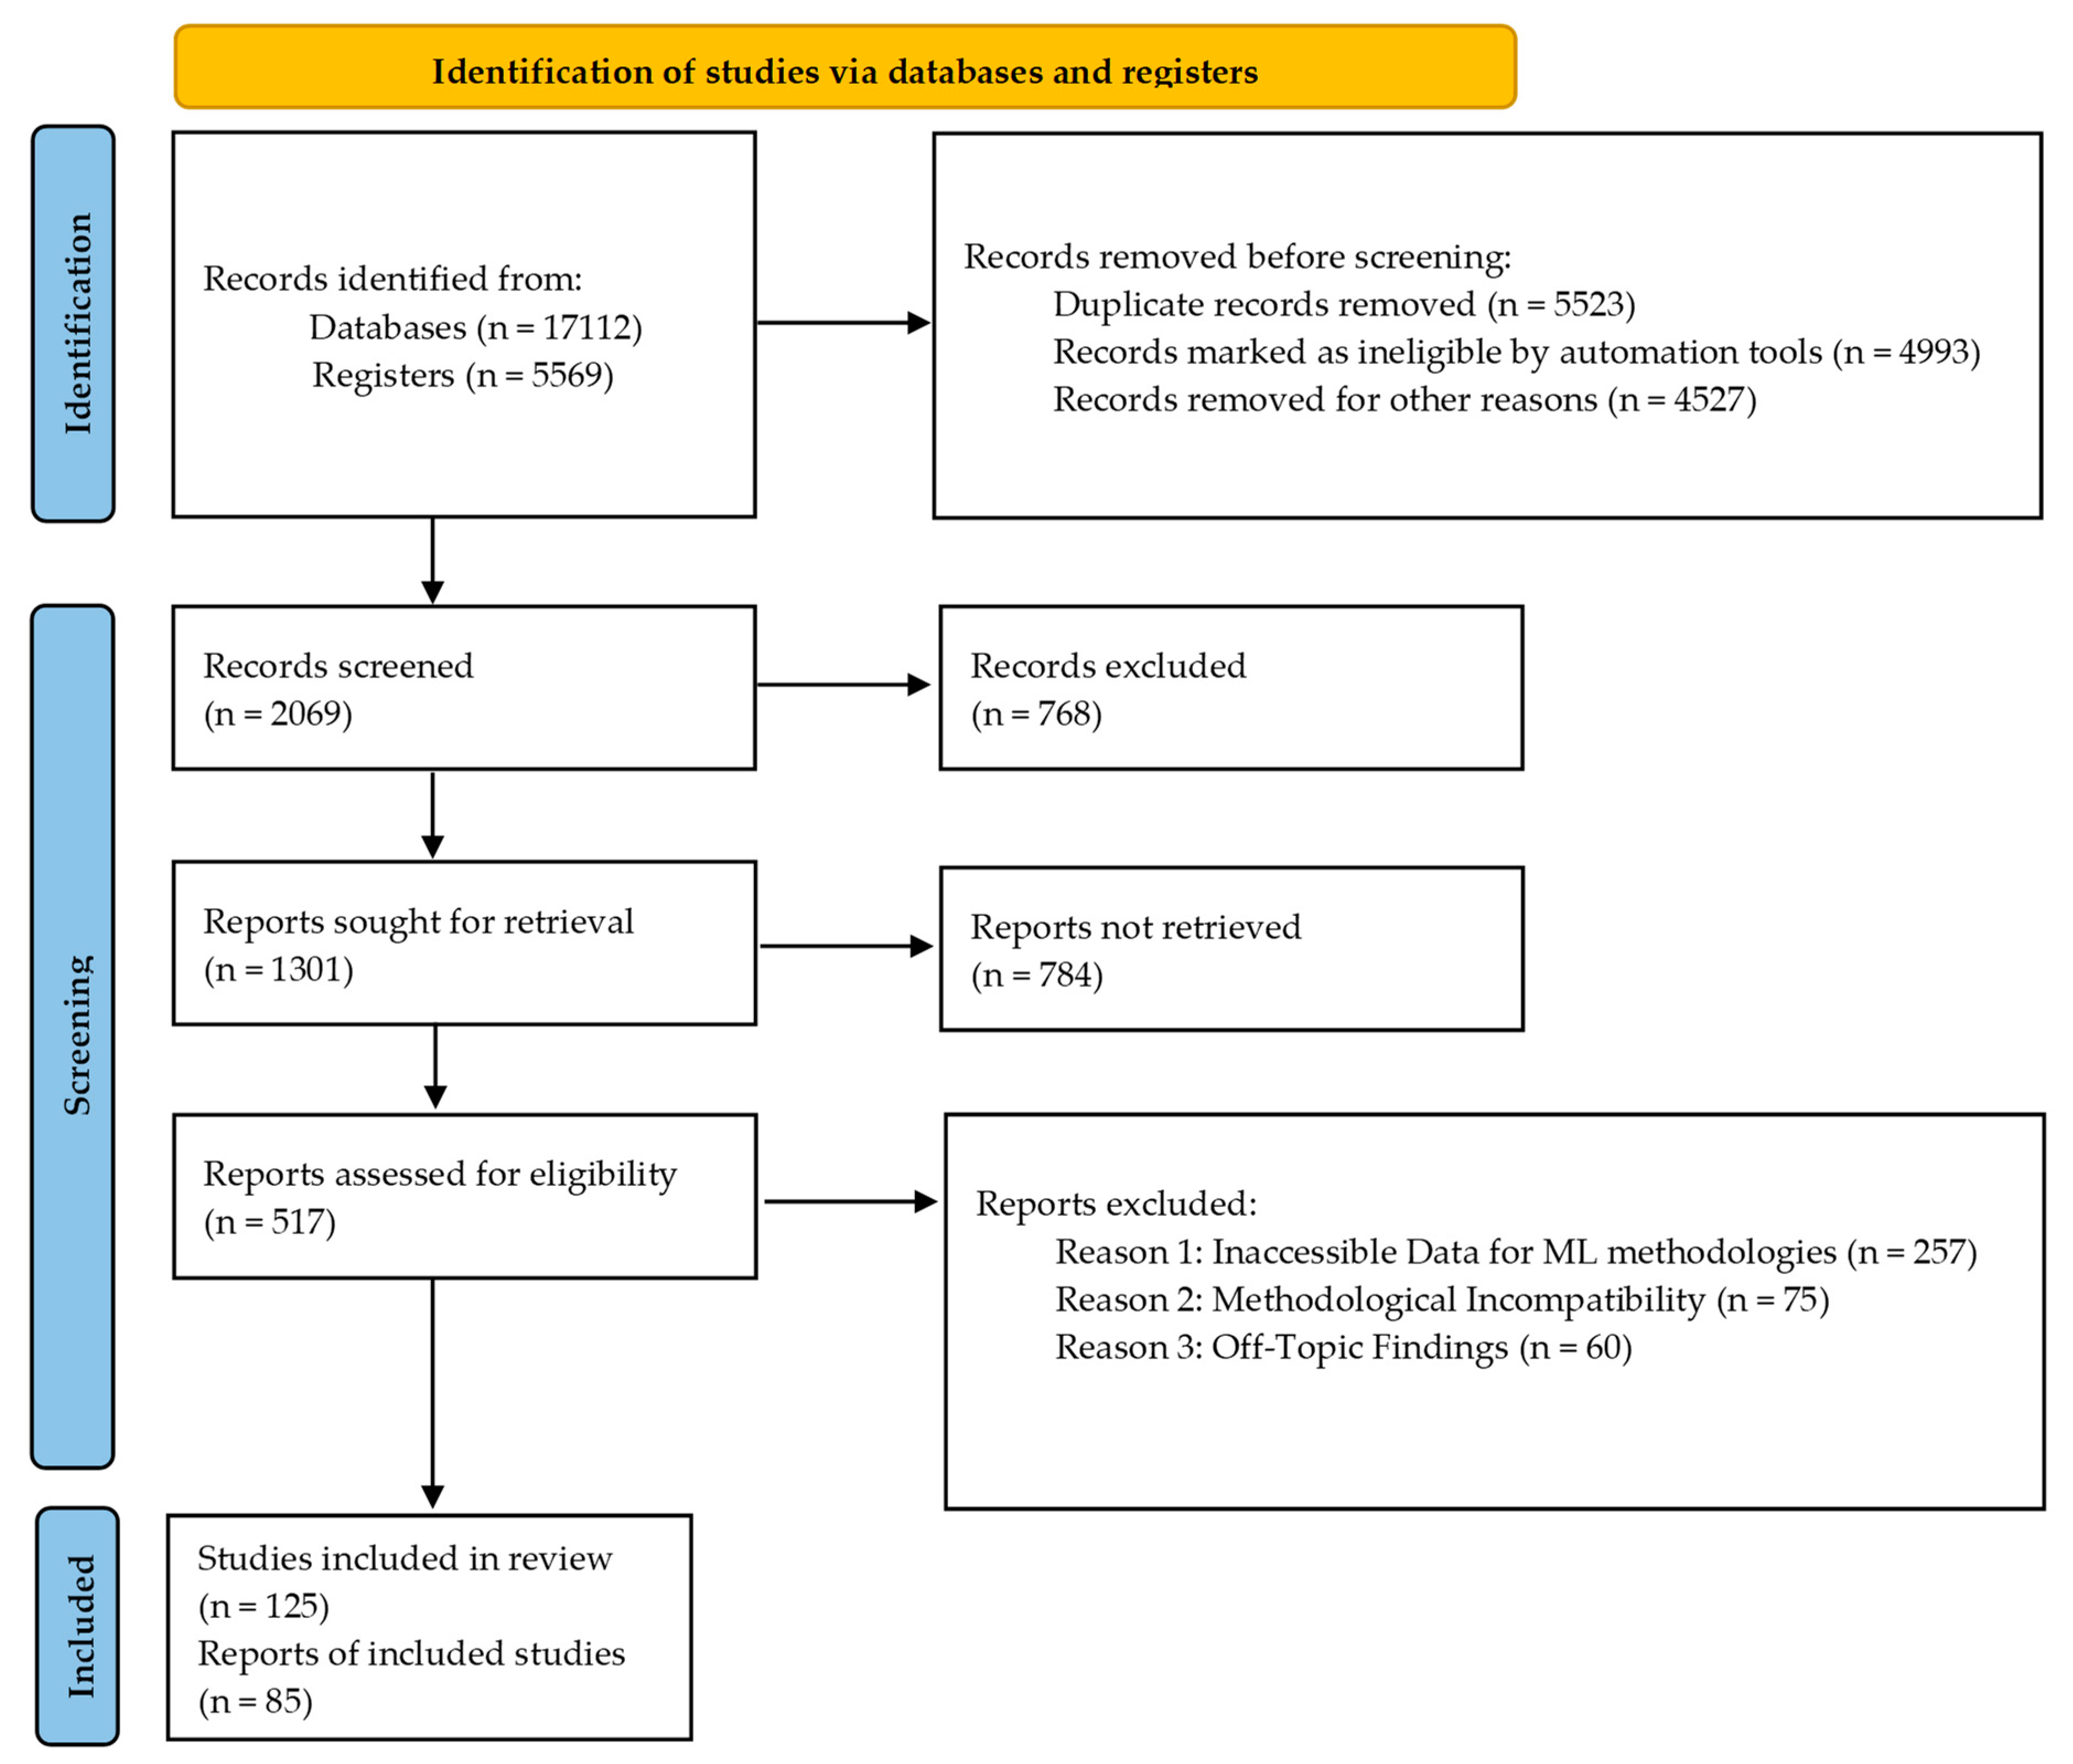
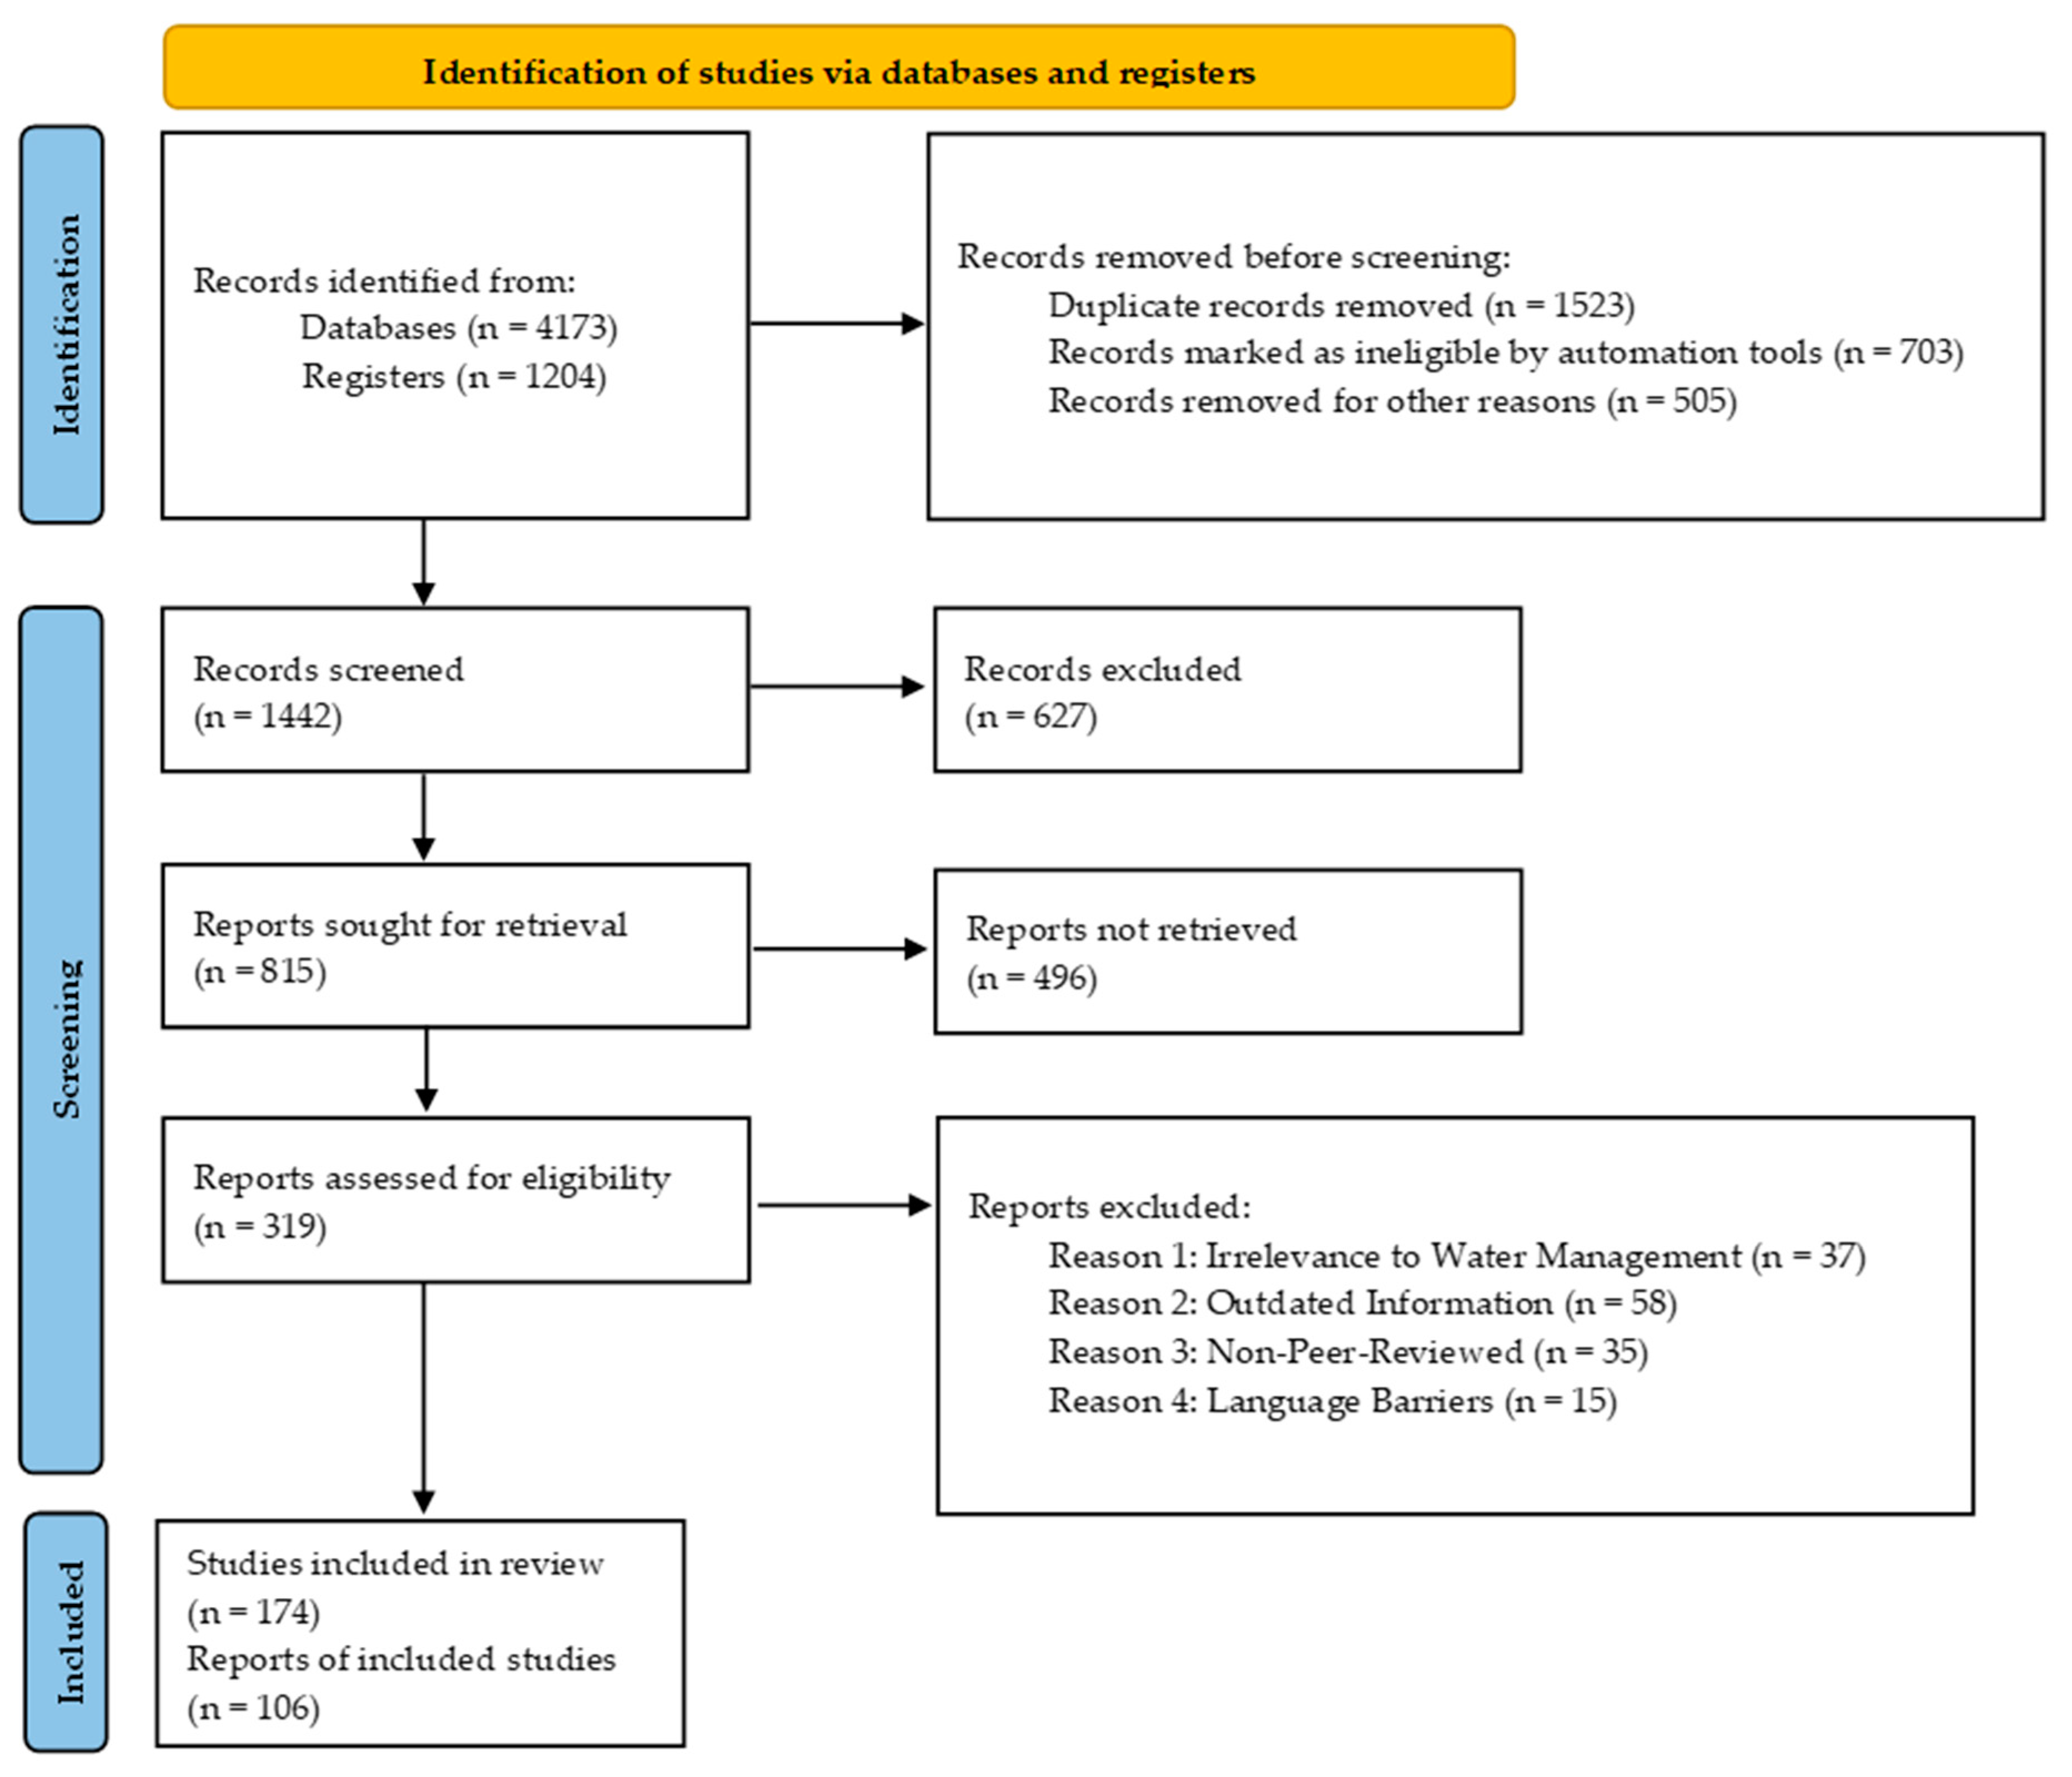
| Algorithm | Ref. | Description |
|---|---|---|
| Logistic regression | [33] | Logistic regression models the probability of a binary outcome by fitting a linear function to the input features and applying a logistic (sigmoid) function to obtain the predicted class probabilities. It is widely used for binary classification tasks. |
| Support vector machine (SVM) | [34] | SVM is a powerful linear classification algorithm that aims to find an optimal hyperplane that separates the input data into different classes. It maximizes the margin between the hyperplane and the nearest data points from each class. SVM can also handle nonlinear data by using kernel functions to map the data into a higher-dimensional space. |
| Perceptron | [35] | The perceptron algorithm is a fundamental linear classification algorithm. It is a single-layer neural network that learns to classify input data into two classes by adjusting their weights based on misclassification errors. |
| Ridge classifier | [36] | Ridge classifier is a linear classification algorithm that employs ridge regression to address the issue of multicollinearity in the input features. It introduces a regularization term to the logistic regression cost function, but applies L2 regularization, which helps stabilize the model and reduce the impact of correlated features. |
| Lasso classifier | [37] | The lasso classifier is similar to logistic regression but applies L1 regularization, resulting in sparse feature selection. It can be useful for identifying the most relevant features when dealing with high-dimensional datasets and reducing model complexity. |
| Elastic net classifier | [38] | The elastic net classifier combines both L1 (lasso) and L2 (ridge) regularization terms to overcome the limitations of each. It strikes a balance between feature selection and feature grouping, making it effective in scenarios with correlated features and when there are more predictors than observations. |
| Least squares classifier | [39] | The least squares classifier, also known as linear regression for classification, fits a linear function to the input features using the least squares method. It assigns class labels based on the threshold of the predicted continuous values. It can be used for both binary and multiclass classification. |
| Stochastic gradient descent (SGD) classifier | [40] | The SGD classifier optimizes the model parameters using stochastic gradient descent. It updates the weights with a small subset of training samples (minibatches) at each iteration, making it efficient for large-scale datasets. It is widely used for linear classification problems and can be extended to handle nonlinear data using kernel tricks. |
| Naïve Bayes classifier | [41] | Naïve Bayes is a probabilistic linear classification algorithm based on Bayes’ theorem. It assumes that the features are conditionally independent given the class label. Naïve Bayes calculates the probability of each class and predicts the class with the highest probability. When using linear kernels, naïve Bayes can be considered a linear classifier. |
| Linear discriminant analysis (LDA) | [42] | LDA is a linear classification algorithm that models the distribution of each class by assuming a Gaussian distribution. It projects the input data onto a lower-dimensional space while maximizing the class separability. The algorithm then assigns the class based on the projected values. |
| Passive aggressive classifier | [43] | The passive aggressive algorithm is a linear classification algorithm that is especially useful for online learning scenarios. It updates the weights based on misclassification errors, but in a more “passive” or “aggressive” manner depending on the confidence of the prediction. This algorithm is suitable for situations where the data distribution might change over time. |
| Quadratic discriminant analysis (QDA) | [44] | QDA is a variant of LDA that allows for quadratic decision boundaries. While it involves quadratic terms, it can be considered a linear classifier if the feature space is transformed to include those quadratic terms. QDA models the distribution of each class using quadratic terms and assigns class labels based on the calculated probabilities. |
| Category | Algorithm | Description | Applications | Ref. |
|---|---|---|---|---|
| Hydrological modeling | Logistic regression | Statistical modeling for hydrological data. | Predicting flood occurrence based on rainfall data. | [45] |
| Support vector machine | SVM-based modeling for hydrology. | Forecasting drought severity using climate data. | [46] | |
| Naïve Bayes classifier | Probabilistic classification for water quality. | Identifying waterborne contaminants in drinking water. | [47] | |
| Water quality analysis | Ridge classifier | Regularized classification for water quality. | Detecting sources of pollution in rivers and lakes. | [48] |
| Lasso classifier | Lasso-based classification for water resources. | Classifying land use for urban water management. | [49] | |
| Elastic net classifier | Elastic net regularization for water data. | Monitoring and classifying water sources for quality. | [50] | |
| Streamflow forecasting | Least squares classifier | Linear regression for streamflow prediction. | Forecasting river discharge for flood risk assessment. | [51] |
| Stochastic gradient descent (SGD) classifier | Gradient-based modeling for streamflow. | Real-time streamflow forecasting for water resource planning. | [52] | |
| Data-driven analysis | Linear discriminant analysis (LDA) | Dimensionality reduction for water data. | Feature extraction for water quality classification. | [53] |
| Water resources classification | Passive aggressive classifier | Online learning for water resource classification. | Land use classification for watershed management. | [54] |
| Quadratic discriminant analysis (QDA) | Nonlinear classification for water data. | Ecosystem classification in aquatic environments. | [55] | |
| Perceptron | Simple binary classification algorithm. | Initial water quality classification in field surveys. | [56] |
| Algorithm | Ref. | Description |
|---|---|---|
| Support vector machine (SVM) | [57] | SVM is a powerful algorithm that can perform both linear and nonlinear classification by transforming the data into a higher-dimensional feature space. It finds the optimal hyperplane that maximizes the margin between different classes. |
| Decision trees | [58] | Decision trees partition the feature space into smaller regions based on different attribute values. They can capture nonlinear relationships by splitting the data based on various conditions at each internal node. The data are separated into specific parameters and located in nodes, while decisions are contained in leaves. The use of decision trees helps us better approximate and interpret categorical and quantitative values, as well as address issues like filling in missing values in attributes with the most likely value. |
| Random forest | [9,59] | Random forest is an ensemble method that combines multiple decision trees. It creates a diverse set of trees by using random subsets of the features and then aggregates their predictions to make the final classification. The goal of this method is to reduce the number of variables required to make a prediction, alleviate the data collection burden, accurately evaluate the prediction error rate, and improve efficiency in terms of the number of variables, computation times, and the area under the receiver operating curve. |
| Gradient boosting | [60] | Gradient boosting is another ensemble method that builds a sequence of weak learners (typically decision trees) in a stage-wise manner. Each subsequent learner focuses on correcting the mistakes made by the previous ones, resulting in a powerful nonlinear classifier. |
| K-nearest neighbors (KNN) | [61] | KNN classifies new instances based on their proximity to labeled instances in the training data. It can handle nonlinear classification by considering the class labels of the k-nearest neighbors. The KNN algorithm calculates the probability that the test data belong to the classes of the “K” training data, and the class with the highest probability will be selected. |
| Neural networks | [62] | Neural networks consist of interconnected nodes (neurons) organized in layers. By using nonlinear activation functions and multiple hidden layers, neural networks can capture complex nonlinear relationships between the input features and the target variable. |
| Gaussian naïve Bayes | [63] | Gaussian naïve Bayes assumes that features are normally distributed and calculates the posterior probability of each class using Bayes’ theorem. Although it assumes feature independence, it can still capture nonlinear decision boundaries in the data. |
| Kernel methods (e.g., kernel SVM) | [64] | Kernel methods use a nonlinear mapping of the input space to a higher-dimensional feature space. By using a kernel function, they can implicitly compute the dot products in the higher-dimensional space, enabling nonlinear classification. |
| Bayesian networks | [65] | Bayesian networks model the probabilistic relationships among variables using directed acyclic graphs. They can capture nonlinear dependencies between variables and are particularly useful when dealing with uncertain data. |
| Category | Algorithm | Description | Applications | Ref. |
|---|---|---|---|---|
| Hydrological modeling | Support vector machines (SVMs) | SVM-based modeling for classification. | Flood risk assessment based on historical data. | [66] |
| Decision trees | Tree-based models for classification. | Predicting river flow patterns in watersheds. | [67] | |
| Random forest | Ensemble of decision trees for improved accuracy. | Forest cover classification for water conservation. | [68] | |
| Gradient boosting | Ensemble method for boosted decision trees. | Estimating groundwater contamination sources. | [69] | |
| Water quality analysis | K-nearest neighbor (KNN) | Classify data based on neighboring points. | Water quality monitoring using sensor networks. | [70] |
| Neural networks | Deep learning models with multiple layers. | River pollution detection from satellite imagery. | [71] | |
| Gaussian naïve Bayes | Probabilistic classifier based on Bayes’ theorem. | Forecasting of lake water quality and algal bloom prediction in reservoirs. | [72] | |
| Kernel methods (e.g., kernel SVM) | Nonlinear classification with kernel functions. | Soil moisture prediction for agricultural planning. | [73] | |
| Data-driven analysis | Bayesian networks | Probabilistic graphical models for classification. | Hydrological risk assessment in watersheds. | [74] |
| Algorithm | Ref. | Description |
|---|---|---|
|
Ordinary least squares (OLS) | [78] | OLS is a commonly used linear regression algorithm that minimizes the sum of squared residuals to find the best-fitting line. It assumes a linear relationship between the input variables and the output. |
|
Ridge regression | [79] | Ridge regression is a regularized linear regression algorithm that adds a penalty term to the least squares objective function. It helps reduce the impact of multicollinearity and can prevent overfitting. |
|
Lasso regression | [80] | Lasso regression is a regularized linear regression algorithm that adds a penalty term based on the absolute values of the coefficients. It promotes sparsity by shrinking some coefficients to exactly zero. |
|
Elastic net regression | [81] | Elastic net regression combines L1 (lasso) and L2 (ridge) regularization to address some limitations of both methods. It balances between variable selection and coefficient shrinkage. |
|
Bayesian linear regression | [82] | Bayesian linear regression incorporates prior knowledge about the coefficients and allows for probabilistic inference. It estimates a posterior distribution over the coefficients using Bayes’ theorem. |
|
Stepwise regression | [83] | Stepwise regression is an iterative method that automatically selects a subset of input variables by adding or removing them based on statistical criteria. It helps to build a parsimonious model. |
| Category | Algorithm | Description | Applications | Ref. |
|---|---|---|---|---|
| Regression and water resources management | Ordinary least squares (OLS) | Minimizes the sum of squared differences between observed and predicted values. | River flow forecasting, reservoir management. | [84] |
| Hydrological modeling and prediction | Ridge regression | Adds L2 regularization to OLS, helps prevent overfitting by adding a penalty for large coefficients. | Groundwater level prediction, water quality modeling. | [85] |
| Water quality analysis and pollution tracking | Lasso regression | Adds L1 regularization to OLS, encourages sparse coefficient selection by penalizing nonessential features. | Streamflow modeling, feature selection in hydrology. | [86] |
| Hydrological modeling and data fusion | Elastic net regression | Combines L1 (lasso) and L2 (ridge) regularization to balance feature selection and coefficient shrinkage. | Hydrological modeling, water resource Optimization. | [87] |
| Water resource allocation and management | Bayesian linear regression | Uses Bayesian framework to estimate model parameters and uncertainty in predictions. | Flood risk assessment, climate change impact modeling. | [88] |
| Environmental data analysis and modeling | Stepwise regression | Iteratively adds or removes predictors to build the best-fitting model. | Water resource allocation, reservoir operation optimization. | [89] |
| Algorithm | Ref. | Description |
|---|---|---|
| Polynomial regression | [90] | Fits a polynomial function to the data by including higher-order terms of the input variables. It can capture nonlinear relationships by introducing polynomial features, allowing for more flexible curve fitting. |
| Support vector regression (SVR) | [91] | Uses support vector machines to perform regression. It aims to find a nonlinear function that best fits the data by mapping the input variables to a higher-dimensional feature space. SVR uses a loss function that allows for a certain tolerance or margin around the predicted values, providing flexibility to capture nonlinear patterns. |
| Decision tree regression | [92] | Builds a regression model by recursively splitting the data based on the values of the input variables. Each internal node represents a test on a specific feature, and each leaf node represents a predicted value. Decision trees can capture complex nonlinear relationships and are easily interpretable. |
| Random forest regression | [93] | An ensemble learning method that combines multiple decision trees to perform regression. It constructs a multitude of decision trees and generates predictions by averaging the predictions of individual trees. Random forest regression is capable of handling nonlinear relationships and reducing overfitting. |
| Gradient boosting regression | [60] | Builds a regression model by iteratively adding weak learners, typically decision trees, to minimize the loss function. It constructs an ensemble of models where each subsequent model focuses on reducing the errors made by the previous models. Gradient boosting regression can effectively capture nonlinear relationships and handle complex datasets. |
| Neural network regression | [94] | Utilizes artificial neural networks (ANNs) to perform regression. ANNs consist of interconnected nodes (neurons) organized into layers. By learning the weights and biases of these connections, neural networks can model complex nonlinear relationships between input variables and the target variable. |
| K-nearest neighbor (KNN) regression | [95] | Predicts the target variable based on the average of the values of its k-nearest neighbors in the feature space. KNN regression can capture nonlinear relationships by considering local patterns in the data. |
| Gaussian process regression | [96] | Uses a Gaussian process to model the relationship between the input variables and the target variable. It can capture complex nonlinear relationships and provides uncertainty estimates for predictions. |
| Support vector machines (SVMs) | [97] | Originally designed for classification, SVM can be extended to regression tasks. It aims to find a hyperplane that best separates the data points while maximizing the margin. SVM regression can handle nonlinear relationships by using kernel functions. |
| Bayesian regression | [98] | Combines prior knowledge with observed data to estimate the posterior distribution of the model parameters. Bayesian regression can capture nonlinear relationships by using flexible probabilistic models. |
| Category | Algorithm | Description | Applications | Ref. |
|---|---|---|---|---|
| Regression and water resources management | Polynomial regression | Fits a polynomial equation to the data, allowing for curved relationships between variables. | Time-series forecasting, hydrological modeling. | [99] |
| Hydrological modeling and prediction | Support vector regression (SVR) | Uses support vector principles to find a hyperplane that best fits the data in a higher-dimensional space. | Groundwater level prediction, water quality modeling. | [100] |
| Water quality analysis and prediction | Decision tree regression | Uses a tree-like model to represent decisions based on feature values, suitable for nonlinear relationships. | River flow forecasting, water resource optimization. | [101] |
| Hydrological modeling and risk assessment | Random forest regression | Ensemble of decision trees to improve prediction accuracy and reduce overfitting. | Land use change prediction, flood risk assessment. | [102] |
| Streamflow forecasting and hydrology | Gradient boosting regression | Builds multiple decision trees sequentially, each correcting the errors of the previous one. | Streamflow modeling, feature selection in hydrology. | [103] |
| Hydrological data modeling and analysis | Neural network regression | Utilizes artificial neural networks to model complex relationships between inputs and outputs. | Rainfall-runoff modeling, water demand forecasting. | [104] |
| Water resource allocation and prediction | K-nearest neighbor (KNN) regression | Predicts values based on the average of its k-nearest neighbors in the training dataset. | Water quality prediction, aquifer characterization. | [105] |
| Environmental data analysis and modeling | Gaussian process regression | Models the relationship between variables as a distribution, allowing for uncertainty quantification. | Climate modeling, uncertainty analysis. | [106] |
| Water resource management and assessment | Bayesian regression | Uses Bayesian framework to estimate model parameters and uncertainty in predictions. | Flood risk assessment, climate change impact modeling. | [107] |
| Algorithm | Ref. | Description |
|---|---|---|
| K-means | [114] | K-means is an iterative algorithm that divides data into k clusters. It aims to minimize the sum of squared distances within each cluster. Initially, k centroid points are randomly assigned, and each data point is assigned to the nearest centroid. The centroids are updated iteratively by computing the mean of the points within each cluster until convergence is achieved. |
| DBSCAN | [115] | DBSCAN is a density-based clustering algorithm that groups data points based on their density. It defines clusters as dense regions separated by areas of lower density. The algorithm starts with an arbitrary point and expands the cluster by adding nearby points that have a sufficient number of neighbors within a specified distance. Outliers are considered as points with low density and are not assigned to any cluster. |
| Hierarchical clustering | [116] | Hierarchical clustering builds a tree-like structure of clusters by iteratively merging or splitting clusters based on similarity. It can be agglomerative, starting with individual data points as separate clusters and merging the most similar ones, or divisive, starting with a single cluster and recursively splitting it into smaller clusters. The result is a dendrogram that provides insights into the hierarchical structure of the data. |
| Gaussian mixture models (GMMs) | [117] | GMM assumes that the data are generated from a mixture of Gaussian distributions. It models each cluster as a Gaussian distribution with its own mean and covariance matrix. The algorithm estimates the parameters of the Gaussian components using the expectation maximization (EM) algorithm, which maximizes the likelihood of the observed data. GMM provides probabilistic cluster assignments, allowing soft assignments where data points can belong to multiple clusters with varying probabilities. |
| Mean shift | [118] | Mean shift is an iterative algorithm that aims to find the modes or peaks of the data distribution. It starts with an initial set of points and iteratively shifts them towards the direction of the highest density, which is determined by a kernel density estimation. The algorithm continues until convergence, resulting in clusters centered around the modes of the data distribution. |
| Spectral clustering | [119] | Spectral clustering transforms the data into a lower-dimensional space using eigenvectors of a similarity matrix and then applies traditional clustering techniques. It considers the pairwise similarity between data points and constructs a similarity matrix. The eigenvectors corresponding to the largest eigenvalues are used to embed the data into a lower-dimensional space, where clustering algorithms like k-means or Gaussian mixture models can be applied. Spectral clustering can handle nonlinearly separable data and is particularly effective for graph-based clustering. |
| OPTICS | [120] | OPTICS (ordering points to identify the clustering structure) is a density-based clustering algorithm similar to DBSCAN. It creates a reachability plot that represents the ordering of data points based on their density reachability. It captures both dense regions and density-based hierarchical relationships in the data. OPTICS is particularly useful for analyzing the varying density of clusters and identifying clusters of different sizes and shapes. |
| Agglomerative clustering | [121] | Agglomerative clustering is a hierarchical clustering algorithm that starts with each data point as a separate cluster and iteratively merges the most similar clusters until a stopping criterion is met. It can be based on various distance metrics and linkage criteria such as single linkage, complete linkage, or average linkage. The result is a dendrogram that shows the hierarchical structure of the data. |
| Density-based clustering | [122] | Density-based clustering algorithms identify clusters as areas of high data density separated by regions of low density. These algorithms, such as DBSCAN and OPTICS, do not require specifying the number of clusters in advance and can handle datasets with varying densities and irregular shapes. They are robust to noise and capable of identifying outliers. |
| Metric. | Ref. | Description |
|---|---|---|
| Calinski–Harabasz | [123] | The CH index measures the quality of a clustering algorithm by evaluating the distance between cluster centroids and the global centroid (numerator), and the distances between centroids within each cluster (denominator). A higher CH index indicates a valid optimal partition with well-separated clusters. |
| Chou–Su–Lai | [124] | The CS index assesses the quality of a clustering partition by calculating the sum of average maximum distances within each cluster (numerator) and the sum of minimum distances between clusters (denominator). The clustering partition with the smallest CS index is considered valid and optimal. |
| Dunn’s index | [125] | The DI index evaluates the quality of a partition by measuring the minimum between-cluster distance (numerator) and the maximum within-cluster distance (denominator). An optimally valid partition is indicated by the largest DI index. |
| Davies–Bouldin’s index | [126] | The DB index measures the quality of a clustering partition, with the optimal partition identified by the smallest DB index value. |
| Davies–Bouldin’s index | [127] | The DB index identifies a valid and optimal partition, similar to the original DB index, with the smallest DB value indicating the optimal partition. |
| Silhouette coefficient | [128] | An optimal and valid partition is indicated by the largest SC (silhouette coefficient) value. |
| Hybrid validity index | [129] | SCD (cluster validity index) encompasses three robust measures of cluster validity: silhouette coefficient (SC), connectivity and separation (CS), and Davies–Bouldin (DB) index. |
| Category | Algorithm | Description | Applications | Ref. |
|---|---|---|---|---|
| Water resources management and analysis | K-means | Divides water quality data into clusters based on similarity, aiding in pollution source identification. | Water quality analysis, source tracking. | [130] |
| Water resources management and monitoring | DBSCAN | Identifies spatial clusters of monitoring stations for efficient water quality network design. | Sensor network optimization, anomaly detection. | [131] |
| Hydrological modeling and watershed planning | Hierarchical clustering | Groups similar hydrological stations for the purpose of watershed delineation and land use classification. | Watershed management, land use planning. | [132] |
| Hydrological data analysis and modeling | Gaussian mixture models (GMMs) | Models complex hydrological data patterns to identify different flow regimes in river systems. | Hydrological data modeling, flow regime analysis. | [133] |
| Rainfall pattern analysis and forecasting | Mean shift | Detects peaks in rainfall patterns to identify areas with similar precipitation characteristics. | Rainfall pattern analysis, flood forecasting. | [134] |
| Remote sensing and water quality monitoring | Spectral clustering | Clusters remote sensing images of water bodies to monitor changes in water quality and quantity. | Remote sensing in water resources, image analysis. | [135] |
| Environmental impact assessment and monitoring | OPTICS | Identifies spatial clusters of water quality anomalies for environmental hotspot detection. | Water quality monitoring, anomaly identification. | [136] |
| Hydrological network design and data collection | Agglomerative clustering | Clusters hydrological monitoring stations to optimize network design for efficient data collection. | Hydrological network design, data collection. | [137] |
| Anomaly detection and environmental assessment | Density-based clustering | Detects anomalies in water quality data, such as pollutant spikes, for environmental impact assessment. | Anomaly detection in water quality data. | [138] |
| Algorithm | Ref. | Description |
|---|---|---|
| Apriori | [141] | Apriori is a classic algorithm for mining frequent itemsets and generating association rules. It uses a breadth-first search approach to discover itemsets and prune infrequent ones based on minimum support. |
| FP-Growth | [142] | FP-Growth is an algorithm that efficiently discovers frequent itemsets by using a prefix tree (FP-tree) data structure. It avoids candidate generation and employs a divide-and-conquer strategy for mining. |
| Eclat | [143] | Eclat (equivalence class transformation) is an algorithm for mining frequent itemsets based on vertical data format. It uses a depth-first search strategy to explore the itemset lattice and identify frequent itemsets. |
| CAR-SPAN | [144] | CAR-SPAN (closed and approximate repeated sequential pattern mining) is an algorithm that discovers closed and approximate frequent sequential patterns. It adopts a two-phase approach involving pattern growth and pruning. |
| FPMax | [145] | FPMax is an algorithm that extends FP-Growth to mine maximal frequent itemsets. It efficiently discovers itemsets that are not a subset of any other frequent itemsets, reducing redundancy in the results. |
| RuleGrowth | [146] | RuleGrowth is an algorithm that integrates pattern growth and rule generation. It discovers frequent itemsets using a compact pattern tree and generates high-quality association rules based on interestingness measures. |
| R-Mine | [147] | R-Mine is an algorithm that mines rules from relational databases. It uses a lattice structure to represent itemsets and employs an efficient method for computing the support of rules. |
| Tertius | [148] | Tertius is an algorithm that focuses on mining association rules with time constraints in transactional databases. It incorporates temporal information to capture time-dependent associations in the data. |
| Category | Algorithm | Description | Applications | Ref. |
|---|---|---|---|---|
| Data mining and water resources management | Apriori | Discovers frequent itemsets in water quality data for association rule mining. | Pattern discovery in water quality data, anomaly detection. | [149] |
| Data mining and hydrological analysis | FP-Growth | Efficiently mines frequent patterns in hydrological time series data. | Hydrological pattern discovery, streamflow analysis. | [150] |
| Water quality analysis and pattern mining | Eclat | Identifies frequent itemsets in water quality datasets, aiding in pollution source identification. | Water quality assessment, pollution source tracking. | [151] |
| Data mining and water quality monitoring | CAR-SPAN | Discovers closed frequent patterns in sensor data to monitor water quality changes. | Sensor network data analysis, water quality monitoring. | [152] |
| Hydrological pattern recognition | FPMax | Extends FP-Growth for maximal frequent pattern mining in hydrological datasets. | Hydrological pattern recognition, rainfall analysis. | [153] |
| Data mining and environmental assessment | RuleGrowth | Mines association rules to identify relationships between environmental variables. | Environmental impact assessment, ecological modeling. | [154] |
| Hydrological data analysis and pattern mining | R-Mine | Discovers recurring patterns in hydrological time series data. | Hydrological forecasting, drought prediction. | [155] |
| Data mining and water resource allocation | Tertius | Supports decision making in water allocation by mining patterns in water usage data. | Water resource allocation optimization, demand management. | [156] |
| Algorithm | Ref. | Description |
|---|---|---|
| Self-training | [158] | In self-training, a model is initially trained on the labeled data and then used to make predictions on the unlabeled data. The confident predictions are added to the labeled set, and the process is iterated to improve the model’s performance. |
| Co-training | [159] | Co-training involves training multiple models on different subsets of features or data and then using their predictions to label the unlabeled data. The models iteratively update each other by adding the confident predictions, enhancing classification accuracy. |
| Multiview learning | [160] | Multiview learning utilizes multiple views or perspectives of the data to improve classification performance. Each view provides different information and combining them leads to a more comprehensive understanding of the underlying patterns and relationships. |
| Generative models | [161] | Generative models, such as Gaussian mixture models (GMM) or variational autoencoders (VAE), learn the underlying data distribution and generate synthetic samples. These models can be used to generate additional labeled data for training the classification model. |
| Graph-based methods | [162] | Graph-based methods construct a graph representation of the data, where nodes represent instances and edges capture relationships. Techniques like label propagation or graph-based regularization propagate labels through the graph to classify unlabeled instances. |
| Transductive support vector machines (TSVMs) | [163] | TSVM treats the labeled and unlabeled data as separate sets and aims to find a decision boundary that separates the labeled instances while considering the unlabeled instances as potential support vectors. It leverages the information in both labeled and unlabeled data for classification. |
| Category | Algorithm | Description | Applications | Ref. |
|---|---|---|---|---|
| Machine learning and water resources management | Self-training | Utilizes unlabeled water quality data to improve water quality prediction models. | Water quality prediction, sensor data enhancement. | [164] |
| Machine learning and hydrological analysis | Co-training | Leverages data from multiple hydrological sensors to enhance streamflow forecasting accuracy. | Hydrological modeling, streamflow prediction. | [165] |
| Data integration and water quality monitoring | Multiview learning | Combines diverse water quality data sources (e.g., remote sensing and in situ measurements) for more comprehensive assessments. | Water quality assessment, pollution source tracking. | [166] |
| Machine learning and environmental assessment | Generative models | Generates synthetic environmental data for simulating scenarios in impact assessments. | Environmental impact assessment, scenario modeling. | [167] |
| Graph-based methods and hydrological analysis | Graph-based methods | Utilizes graph-based representations to model hydrological networks and optimize water resource allocation. | Hydrological network analysis, water allocation optimization. | [168] |
| Machine learning and environmental monitoring | Transductive support vector machines (TSVMs) | Labels data points based on their relationships with labeled instances, aiding in anomaly detection. | Environmental anomaly detection, sensor data analysis. | [169] |
| Algorithm | Ref. | Description |
|---|---|---|
| Co-training clustering | [170] | Co-training clustering utilizes multiple clustering algorithms trained on different subsets of features or data. The algorithms iteratively update each other by assigning labels to the unlabeled data points. By leveraging the agreement between the algorithms, it enhances clustering accuracy and mitigates the impact of noise and outliers. |
| Self-training clustering | [171] | Self-training clustering initially trains a clustering algorithm on the labeled data and then uses it to cluster the unlabeled data. The most confident cluster assignments are added to the labeled data, and the process is iterated. This approach improves the clustering performance by progressively incorporating the unlabeled data into the training process. |
| Constrained clustering | [172] | Constrained clustering integrates prior knowledge in the form of constraints into the clustering process. These constraints can be pairwise must-link and cannot-link constraints or other forms of side information. By incorporating the constraints, the algorithm guides the clustering to respect the specified relationships, resulting in more accurate and meaningful clustering outcomes. |
| Semisupervised expectation maximization (semi-EM) | [173] | Semi-EM is an adaptation of the expectation maximization (EM) algorithm for semisupervised clustering. It incorporates both labeled and unlabeled data in the estimation of cluster parameters. The algorithm iteratively assigns data points to clusters and updates the parameters based on the expectations and maximization steps. Semi-EM improves clustering results by leveraging the information in both labeled and unlabeled data. |
| Co-EM clustering | [174] | Co-EM clustering is an extension of the EM algorithm for semisupervised clustering. It simultaneously estimates cluster parameters and assigns labels to the unlabeled data points. The algorithm iteratively updates the cluster parameters and refines the labels by incorporating information from both labeled and unlabeled data, improving the clustering accuracy. |
| Category | Algorithm | Description | Applications | Ref. |
|---|---|---|---|---|
| Machine learning and water resources management | Co-training | Enhances water quality prediction models by leveraging data from multiple sources, such as remote sensing and in situ measurements. | Water quality prediction, data fusion from diverse sources. | [175] |
| Data mining and water quality assessment | Clustering | Clusters water quality data to identify patterns and anomalies for improved monitoring and assessment. | Water quality analysis, anomaly detection in sensor data. | [176] |
| Machine learning and environmental monitoring | Self-training clustering | Utilizes unlabeled water quality data to improve clustering algorithms for water quality assessment. | Water quality clustering, unsupervised anomaly detection. | [177] |
| Data integration and environmental assessment | Constrained clustering | Applies constraints to clustering algorithms to account for domain knowledge in water quality analysis. | Water quality clustering with domain-specific constraints. | [178] |
| Semisupervised learning and environmental data | Semisupervised | Combines labeled and unlabeled environmental data to improve water quality modeling and assessment. | Water quality prediction, leveraging partial labels. | [179] |
| Statistical modeling and environmental data | Expectation maximization (semi-EM) | Uses the expectation maximization algorithm to estimate parameters in semisupervised water quality models. | Parameter estimation in semi-supervised models. | [180] |
| Machine learning and environmental data | Co-EM clustering | Integrates expectation maximization and clustering for semisupervised water quality analysis. | Semisupervised clustering in water quality assessment. | [181] |
| Algorithm | Ref. | Description |
|---|---|---|
| Q-learning | [185] | Q-learning is a model-free reinforcement learning algorithm that learns an action-value function, known as the Q-function. It iteratively updates the Q-values based on the rewards received and estimates the optimal policy for an agent to maximize its cumulative reward over time. |
| Deep Q-network (DQN) | [186] | DQN is an extension of Q-learning that utilizes deep neural networks to approximate the Q-values. It overcomes the limitations of traditional Q-learning by enabling the agent to handle high-dimensional state spaces. DQN incorporates experience replay and target networks to stabilize and improve learning performance. |
| Policy gradient methods | [187] | Policy gradient methods directly learn a parameterized policy that determines the agent’s actions based on the observed state. These methods use gradient ascent to iteratively update the policy parameters, aiming to maximize the expected cumulative reward. Common variants include REINFORCE, proximal policy optimization (PPO), and trust region policy optimization (TRPO). |
| Actor–critic methods | [188] | Actor–critic methods combine policy gradient and value function estimation. The actor learns the policy, while the critic estimates the value function to evaluate the policy’s performance. This approach provides a balance between exploring new actions and exploiting the current policy, enhancing the stability and efficiency of learning. |
| Proximal policy optimization (PPO) | [189] | PPO is a policy optimization algorithm that employs a surrogate objective function to update the policy parameters. It ensures that policy updates remain within a specified range, preventing drastic policy changes. PPO is known for its sample efficiency and stable learning performance, making it a popular choice for continuous control tasks. |
| Deep deterministic policy gradient (DDPG) | [190] | DDPG is an off-policy actor–critic algorithm that is well suited for continuous action spaces. It uses a deterministic policy to learn the optimal policy, and a deep neural network is employed to approximate both the actor and critic functions. DDPG combines Q-learning and policy gradient methods, enabling stable learning in continuous action domains. |
| Monte Carlo methods | [191] | Monte Carlo methods estimate the value of states or state–action pairs by averaging the observed returns from sampled trajectories. These methods do not rely on a model of the environment and learn directly from episodes of interaction. They are suitable for episodic tasks where the complete trajectory is available. |
| Temporal difference (TD) learning | [192] | TD learning combines ideas from both Monte Carlo methods and dynamic programming. It updates value estimates based on bootstrapping, using estimates from subsequent time steps. TD algorithms, such as SARSA and Q-lambda, enable learning during ongoing interactions without requiring complete episodes of experience. |
| Asynchronous advantage actor–critic (A3C) | [193] | A3C is an actor–critic algorithm that uses multiple agents operating in parallel to learn a policy and value function. Each agent interacts with a separate copy of the environment, and their experiences are asynchronously combined to update the shared network parameters. A3C is known for its scalability and efficient use of computational resources. |
| Proximal value optimization (PPO) | [194] | PPO is a policy optimization algorithm that focuses on updating the policy within a trust region. It leverages a clipped surrogate objective function to ensure conservative policy updates. PPO offers a balance between sample efficiency and stable learning, making it suitable for a wide range of reinforcement learning tasks. |
| Soft actor–critic (SAC) | [195] | SAC is an off-policy actor–critic algorithm that incorporates the concept of entropy regularization. It maximizes the expected cumulative reward while also maximizing the entropy of the policy distribution, promoting exploration and robustness. SAC is particularly effective in continuous action spaces and has been successful in various domains, including robotics and control tasks. |
| Twin delayed deep deterministic policy gradient (TD3) | [196] | TD3 is an off-policy actor–critic algorithm that builds upon DDPG. It addresses overestimation bias and enhances stability by introducing twin critics and delayed policy updates. TD3 has shown improved sample efficiency and robustness in continuous control tasks with large action spaces. |
| Category | Algorithm | Description | Applications | Ref. |
|---|---|---|---|---|
| Reinforcement learning and water resources management | Q-learning | Learns optimal control policies for water resource management through exploration and exploitation. | Optimal water resource allocation, reservoir management. | [197] |
| Machine learning and hydrological modeling | Deep Q-network (DQN) | Utilizes deep neural networks to approximate Q-values in hydrological decision-making problems. | Flood control, reservoir operation, hydrological modeling. | [198] |
| Reinforcement learning and environmental management | Policy gradient methods | Directly optimizes the policy of water resource management based on gradients. | Water allocation optimization, river basin management. | [199] |
| Machine learning and water resource allocation | Actor–critic methods | Combines actor and critic networks to balance exploration and exploitation in water resource management. | Water allocation decision making, adaptive control. | [200] |
| Reinforcement learning and environmental policy | Proximal policy optimization (PPO) | Employs the PPO algorithm to optimize water resource management policies while ensuring stability. | Sustainable water resource management, policy optimization. | [201] |
| Machine learning and water resource allocation | Deep deterministic policy gradient (DDPG) | Utilizes deep reinforcement learning for continuous action spaces in water allocation problems. | Irrigation management, water distribution control. | [198] |
| Reinforcement learning and hydrological modeling | Monte Carlo methods | Estimates value functions and policies through episodic simulations in hydrological decision making. | Hydrological modeling, reservoir operation. | [202] |
| Machine learning and water resource management | Temporal difference (TD) learning | Learns from consecutive time steps to update value functions and improve water management strategies. | Water resource allocation, real-time decision making. | [203] |
| Reinforcement learning and water resource allocation | Asynchronous advantage actor–critic (A3C) | Utilizes asynchronous training for more efficient learning of water allocation policies. | Efficient water allocation, reservoir control. | [204] |
| Machine learning and water resource policy | Proximal value optimization (PVO) | Optimizes value functions and policies for water resource management in a stable manner. | Sustainable water policy development, adaptive control. | [205] |
| Reinforcement learning and environmental management | Soft actor–critic (SAC) | Enhances exploration in continuous action spaces of water management problems for better policies. | River flow control, ecological preservation. | [206] |
| Machine learning and water allocation | Twin delayed deep deterministic policy gradient (TD3) | Extends DDPG to improve stability and convergence in water allocation problems. | Water distribution optimization, adaptive control. | [207] |
| Metric. | Description | |
|---|---|---|
| Mean normalized bias error | Estimation of the average bias of the prediction approach used to decide on measures for correcting the approach bias. | |
| Mean percentage error | The average percentage error, calculated by comparing the forecasts of a model with the actual values of the quantity being predicted. | |
| Mean absolute error. | The mean absolute error (MAE) is a statistical measure that evaluates the average magnitude of errors in a set of forecasts, irrespective of their direction. | |
| Mean absolute percentage error | The accuracy rating metric assesses accuracy as a percentage by calculating the average absolute percentage error minus the actual amounts divided by the actual amounts. | |
| Relative absolute error | A relative performance metric used to evaluate the effectiveness of a prediction model. | |
| Weighted mean absolute percentage error | A weighted version of the mean absolute percentage error (MAPE) that serves as a measure of prediction accuracy for a forecasting method. | |
| Normalized mean absolute error | A metric designed to facilitate the comparison of datasets with varying scales in relation to the mean absolute error (MAE). | |
| Mean squared error | This metric quantifies the discrepancy between the mean squares of the actual and forecasted values. | |
| Root mean square error | An estimation of the average error magnitude. | |
| Coefficient of variation | The relative standard deviation is a standardized measure that quantifies the dispersion of a probability distribution. | |
| Normalized root mean square error | A normalized root mean square error (RMSE) that enables comparisons between datasets and models with different scales. | |
| Coefficient of determination | A metric that measures the variance ratio of a dependent variable with respect to an independent variable. | |
| Willmott’s index agreement | A metric that measures the ratio between the mean square error and the potential error. | |
| Legates–McCabe’s | A robust alternative metric for evaluating goodness-of-fit or relative error that addresses the limitations of correlation-based metrics. | |
| Kling–Gupta efficiency | This metric assesses model efficiency by considering accuracy, precision, and consistency components. It incorporates the correlation coefficient (r), bias (α), and variance ratios (β) between predicted and observed values, with σ representing the standard deviation. | |
| Akaike information criterion | This measure evaluates model performance while considering model complexity. It utilizes the vector of maximum likelihood estimates of the model parameters () and the number of observed values (i). | |
| Probabilistic Metric | Description | |
| Continuous ranked probability score | This metric quantifies the quadratic difference between the forecasted and empirical cumulative distribution functions (CDF). It involves the prediction CDF () and the Heaviside step function (H), which equals 0 if the forecasted value () is less than the observed value (), and 1 otherwise. | |
| Average width of the prediction intervals | This is an estimation of an interval, with a specified confidence level, within which a future observation is expected to fall based on prior observations. The upper and lower bounds of the 95% prediction interval are denoted by u and l, respectively. | |
| Prediction interval coverage | The proportion of instances in a holdout set for which the prediction interval successfully captures the actual value. | |
| Prediction interval normalized average width | This metric quantifies the width or extent of the prediction interval. The range of variation of the observed value (R) is used to determine the width of the interval. |
Disclaimer/Publisher’s Note: The statements, opinions and data contained in all publications are solely those of the individual author(s) and contributor(s) and not of MDPI and/or the editor(s). MDPI and/or the editor(s) disclaim responsibility for any injury to people or property resulting from any ideas, methods, instructions or products referred to in the content. |
© 2023 by the authors. Licensee MDPI, Basel, Switzerland. This article is an open access article distributed under the terms and conditions of the Creative Commons Attribution (CC BY) license (https://creativecommons.org/licenses/by/4.0/).
Share and Cite
Drogkoula, M.; Kokkinos, K.; Samaras, N. A Comprehensive Survey of Machine Learning Methodologies with Emphasis in Water Resources Management. Appl. Sci. 2023, 13, 12147. https://doi.org/10.3390/app132212147
Drogkoula M, Kokkinos K, Samaras N. A Comprehensive Survey of Machine Learning Methodologies with Emphasis in Water Resources Management. Applied Sciences. 2023; 13(22):12147. https://doi.org/10.3390/app132212147
Chicago/Turabian StyleDrogkoula, Maria, Konstantinos Kokkinos, and Nicholas Samaras. 2023. "A Comprehensive Survey of Machine Learning Methodologies with Emphasis in Water Resources Management" Applied Sciences 13, no. 22: 12147. https://doi.org/10.3390/app132212147