
Reverse Engineering Used to Profile a Gerotor Pump Rotor
 , , , and
Abstract
:1. Introduction
2. Materials and Methods
2.1. The Scanning Process of the Gerotor Pump Components
2.2. Inspection of Gerotor Pump Components
2.3. CAD Modeling of the Gerotor Pump
3. Results
3.1. CAD Model vs. Scanned Model of the Inner Rotor and the Outer Rotor
3.2. Study of the Enwrapping Profiles of Z4/Z5 Gerotor Pump Rotors
3.3. Verification of the Minimum Rolling Radius
3.4. Modifications in Order to Increase the Efficiency of the Pump
3.5. Optimized Profile of the Z4 Rotor
3.6. Calculation of the Enwrapping Profile
4. Discussion
- -
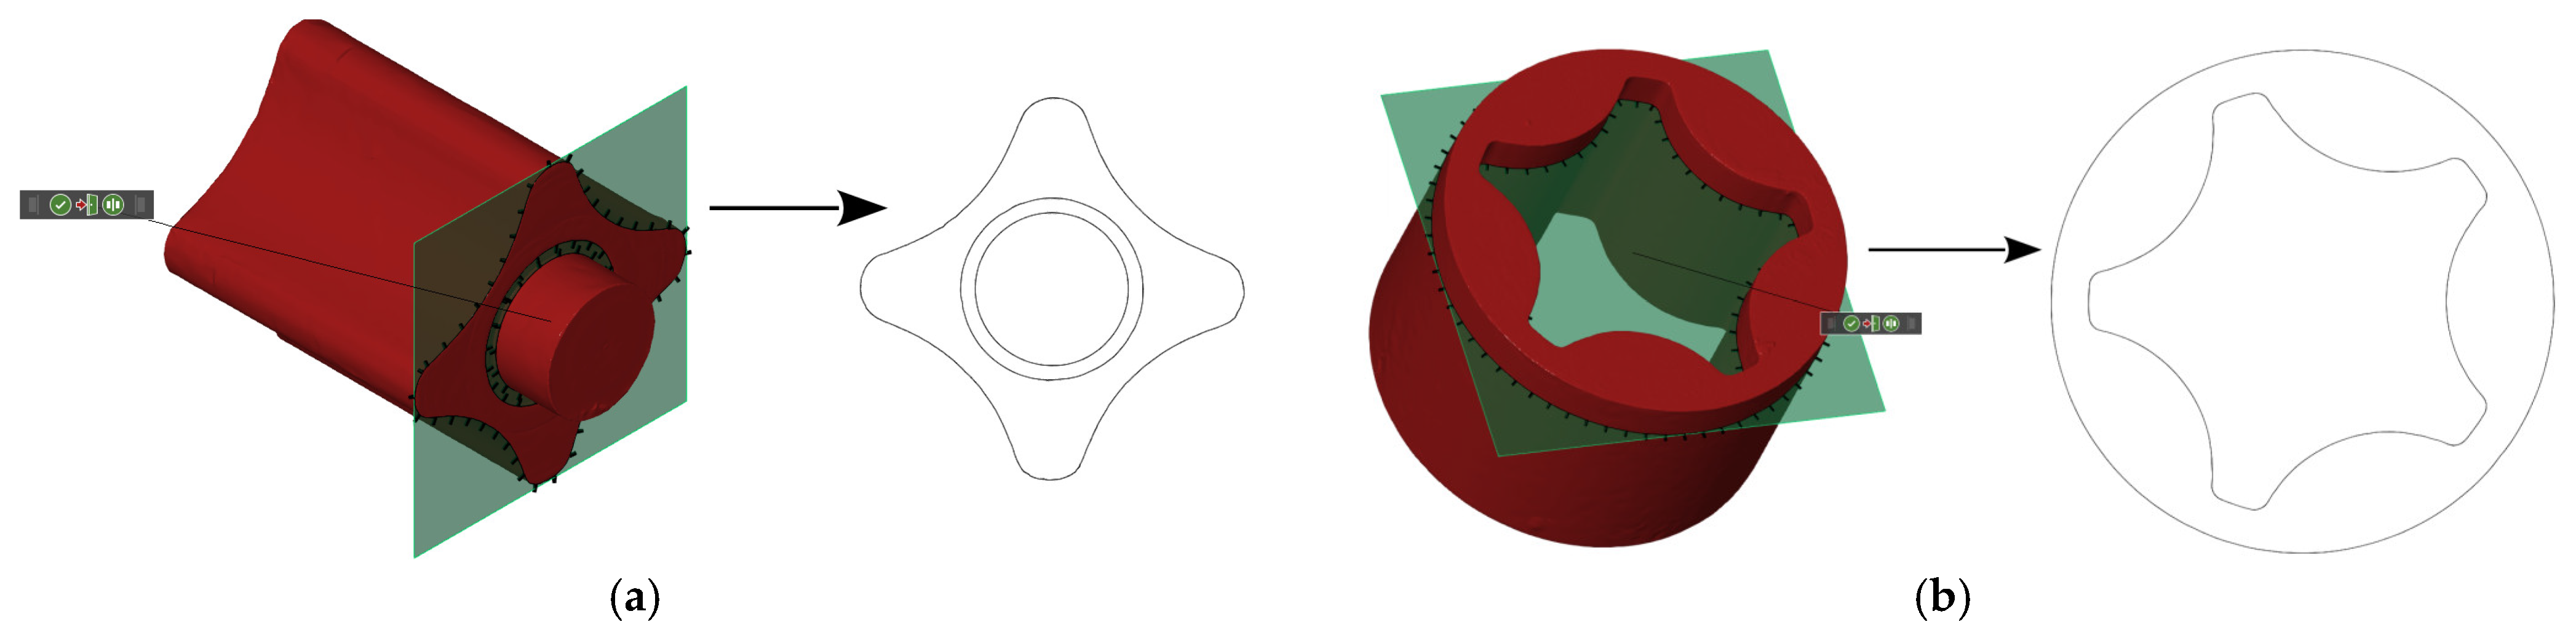
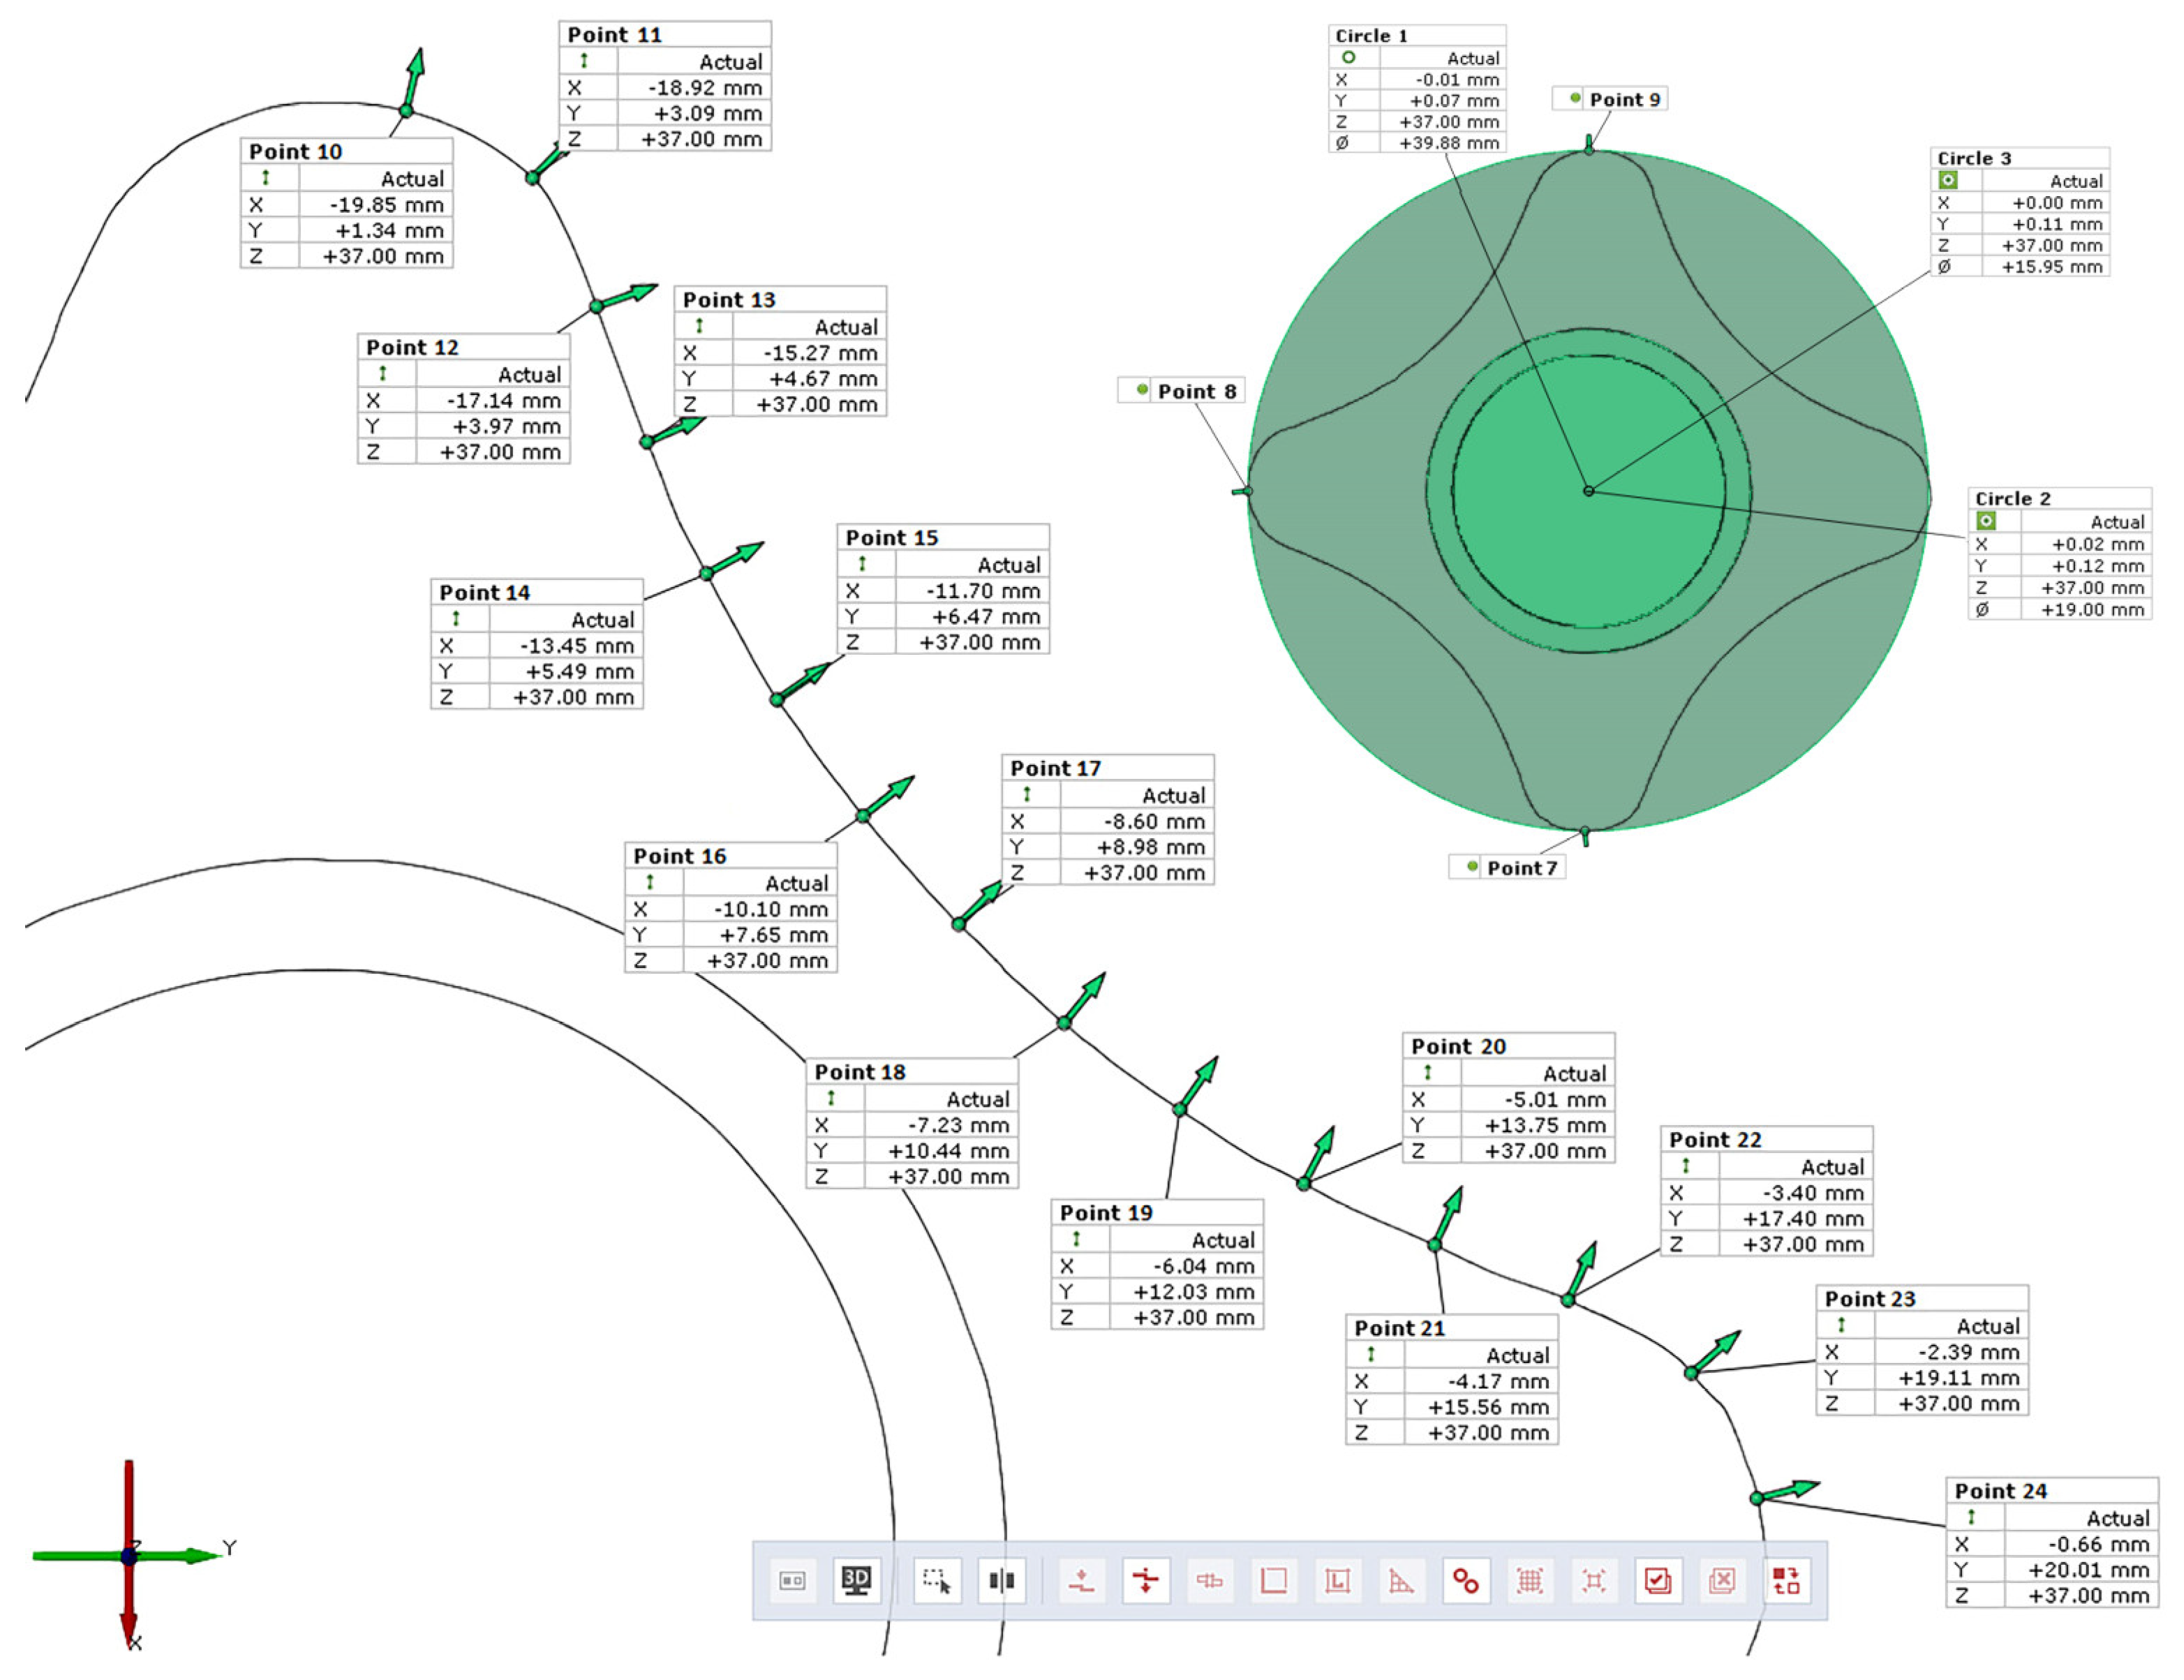
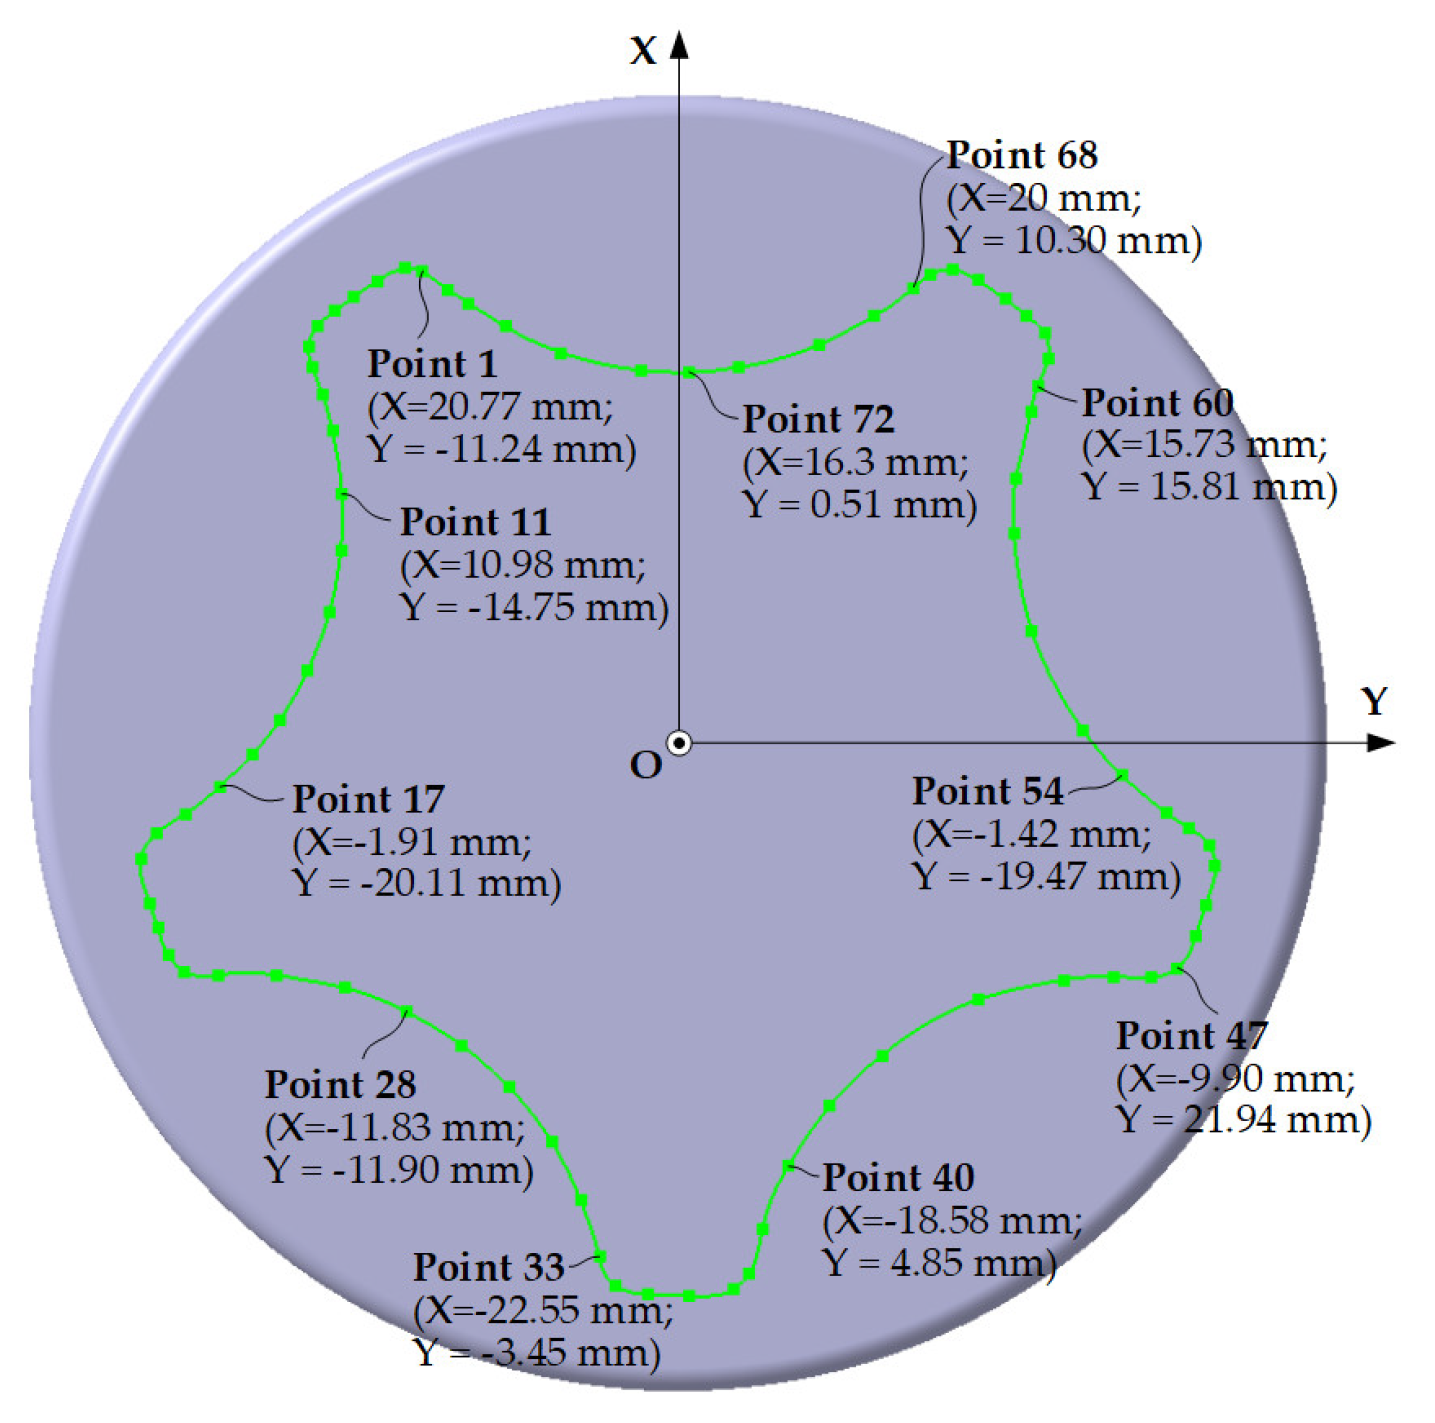
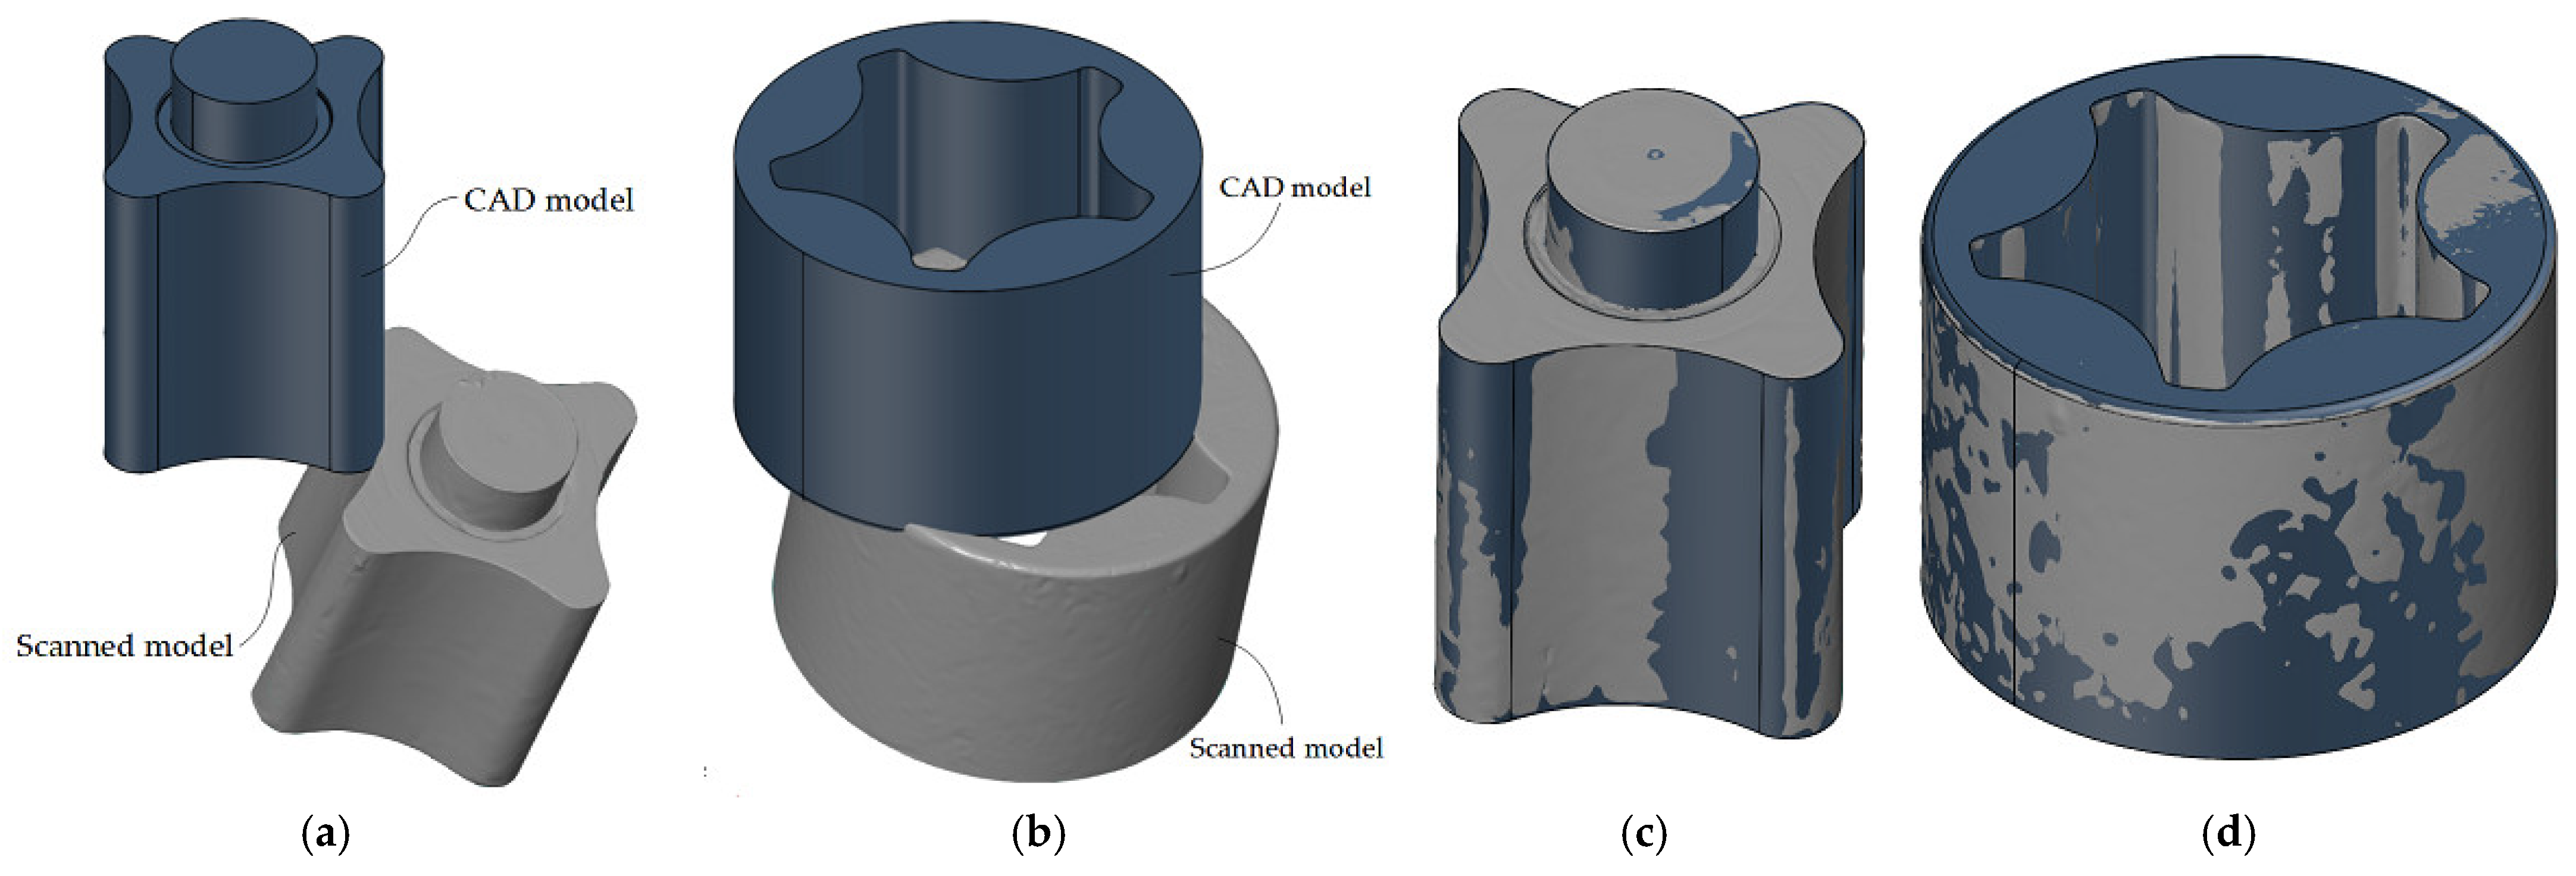
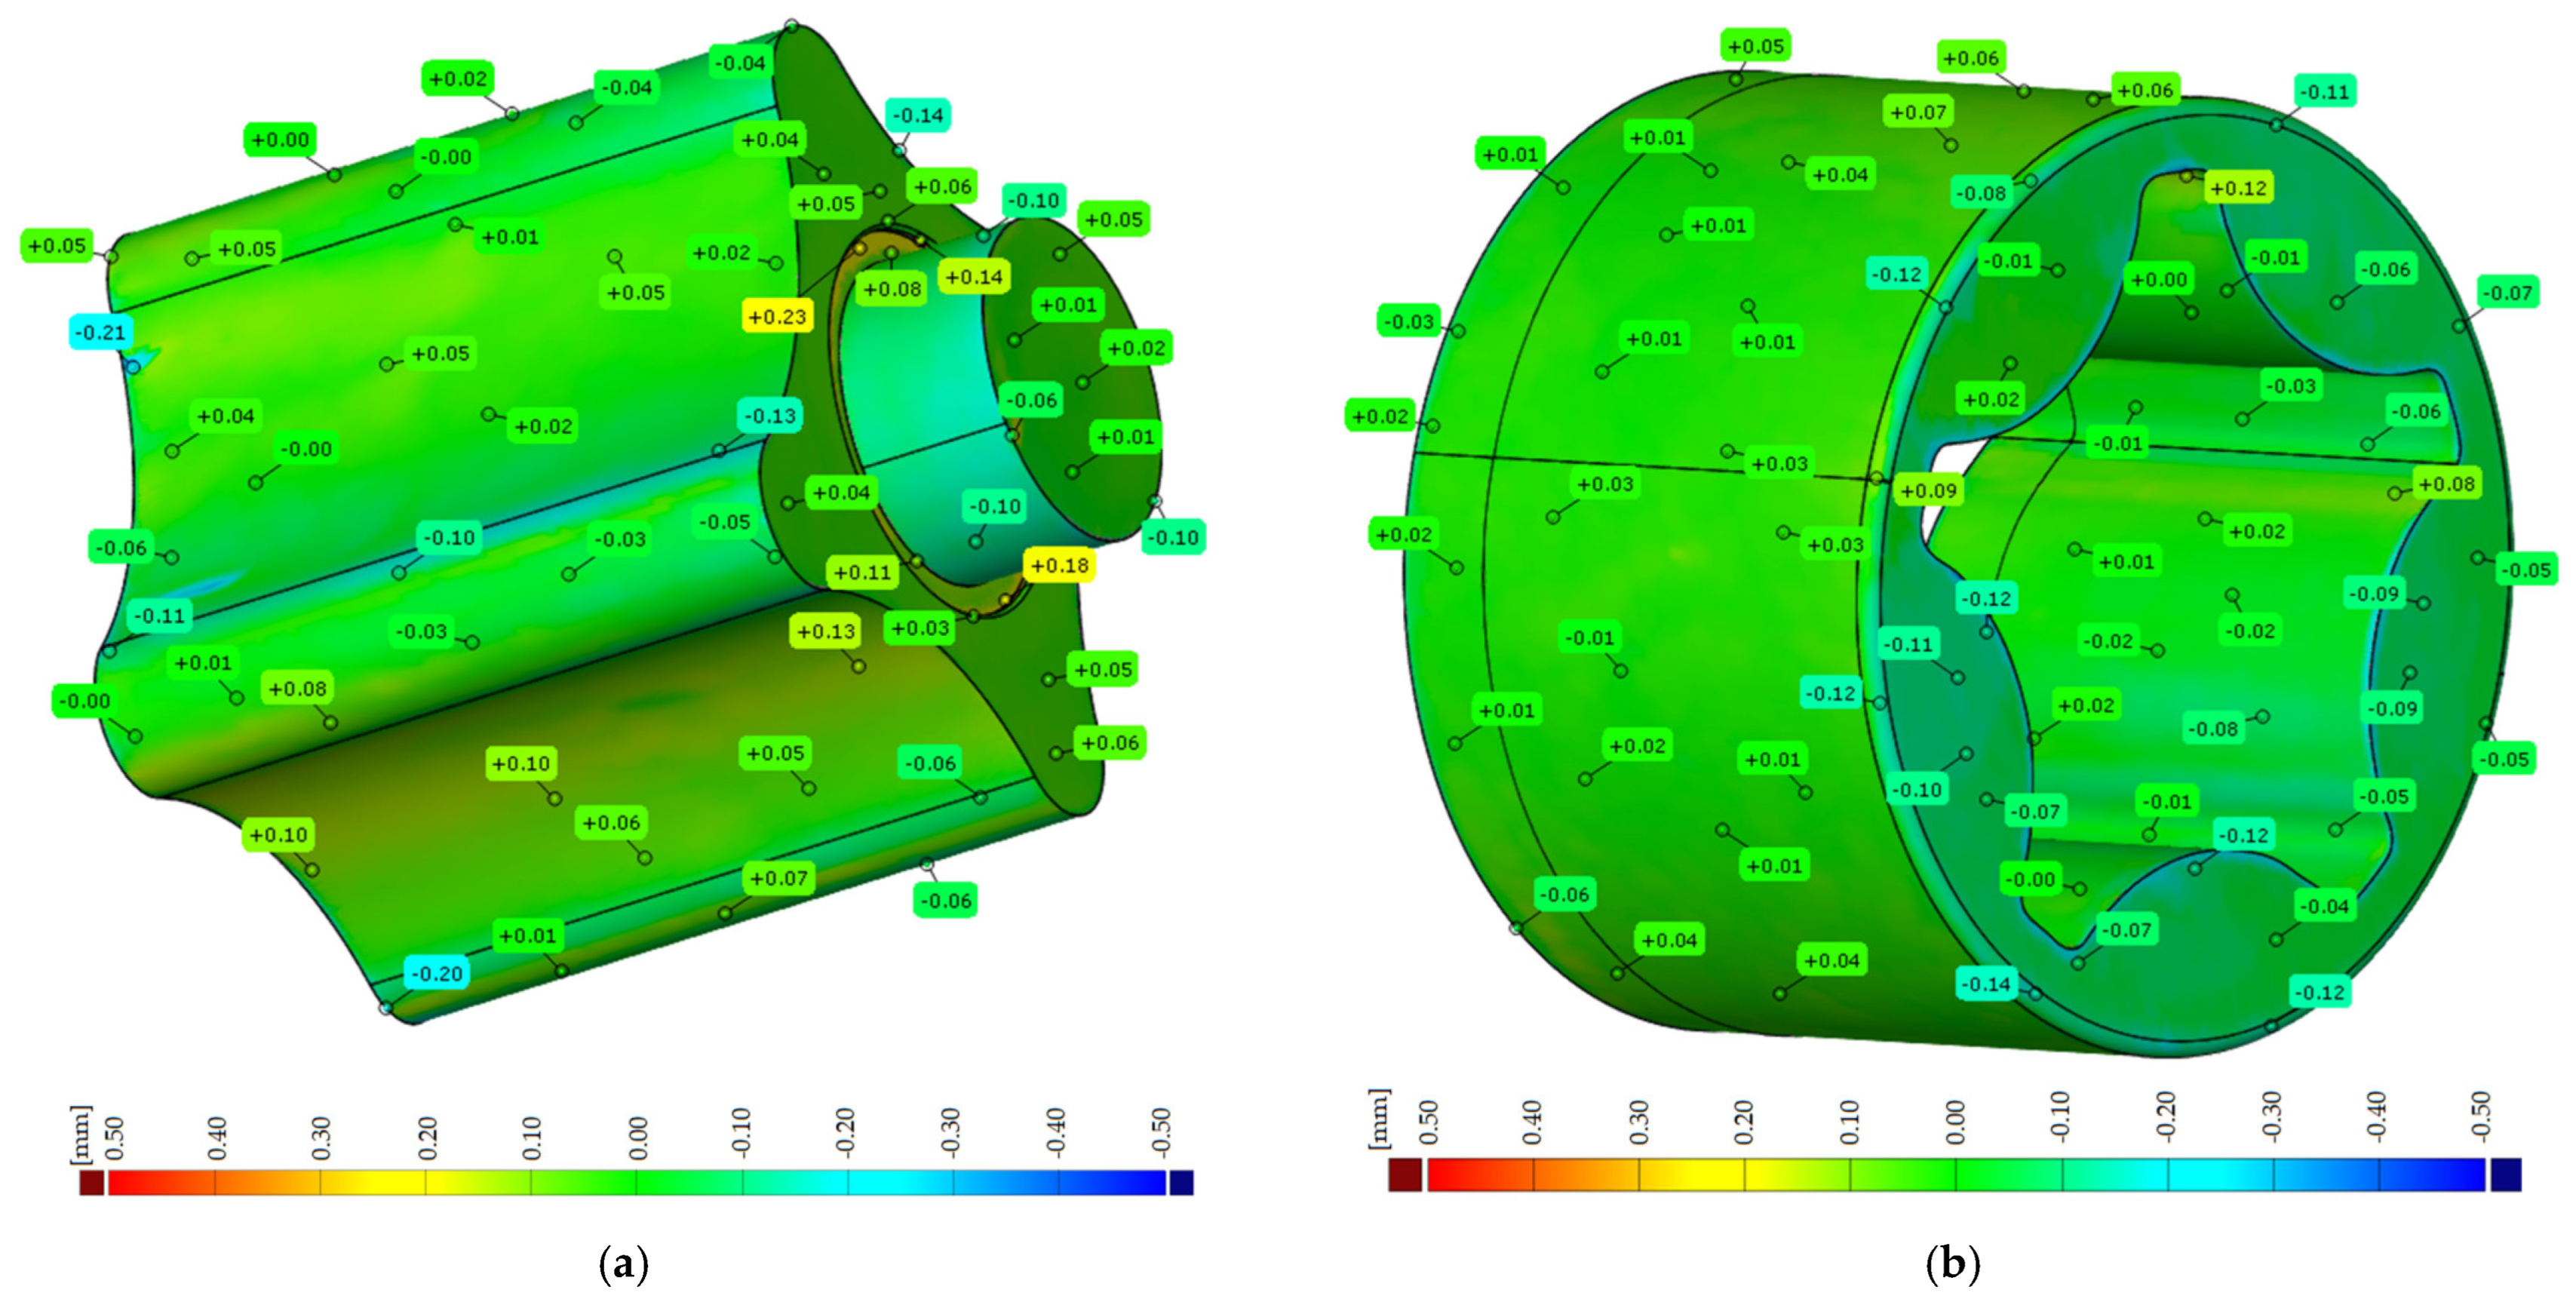
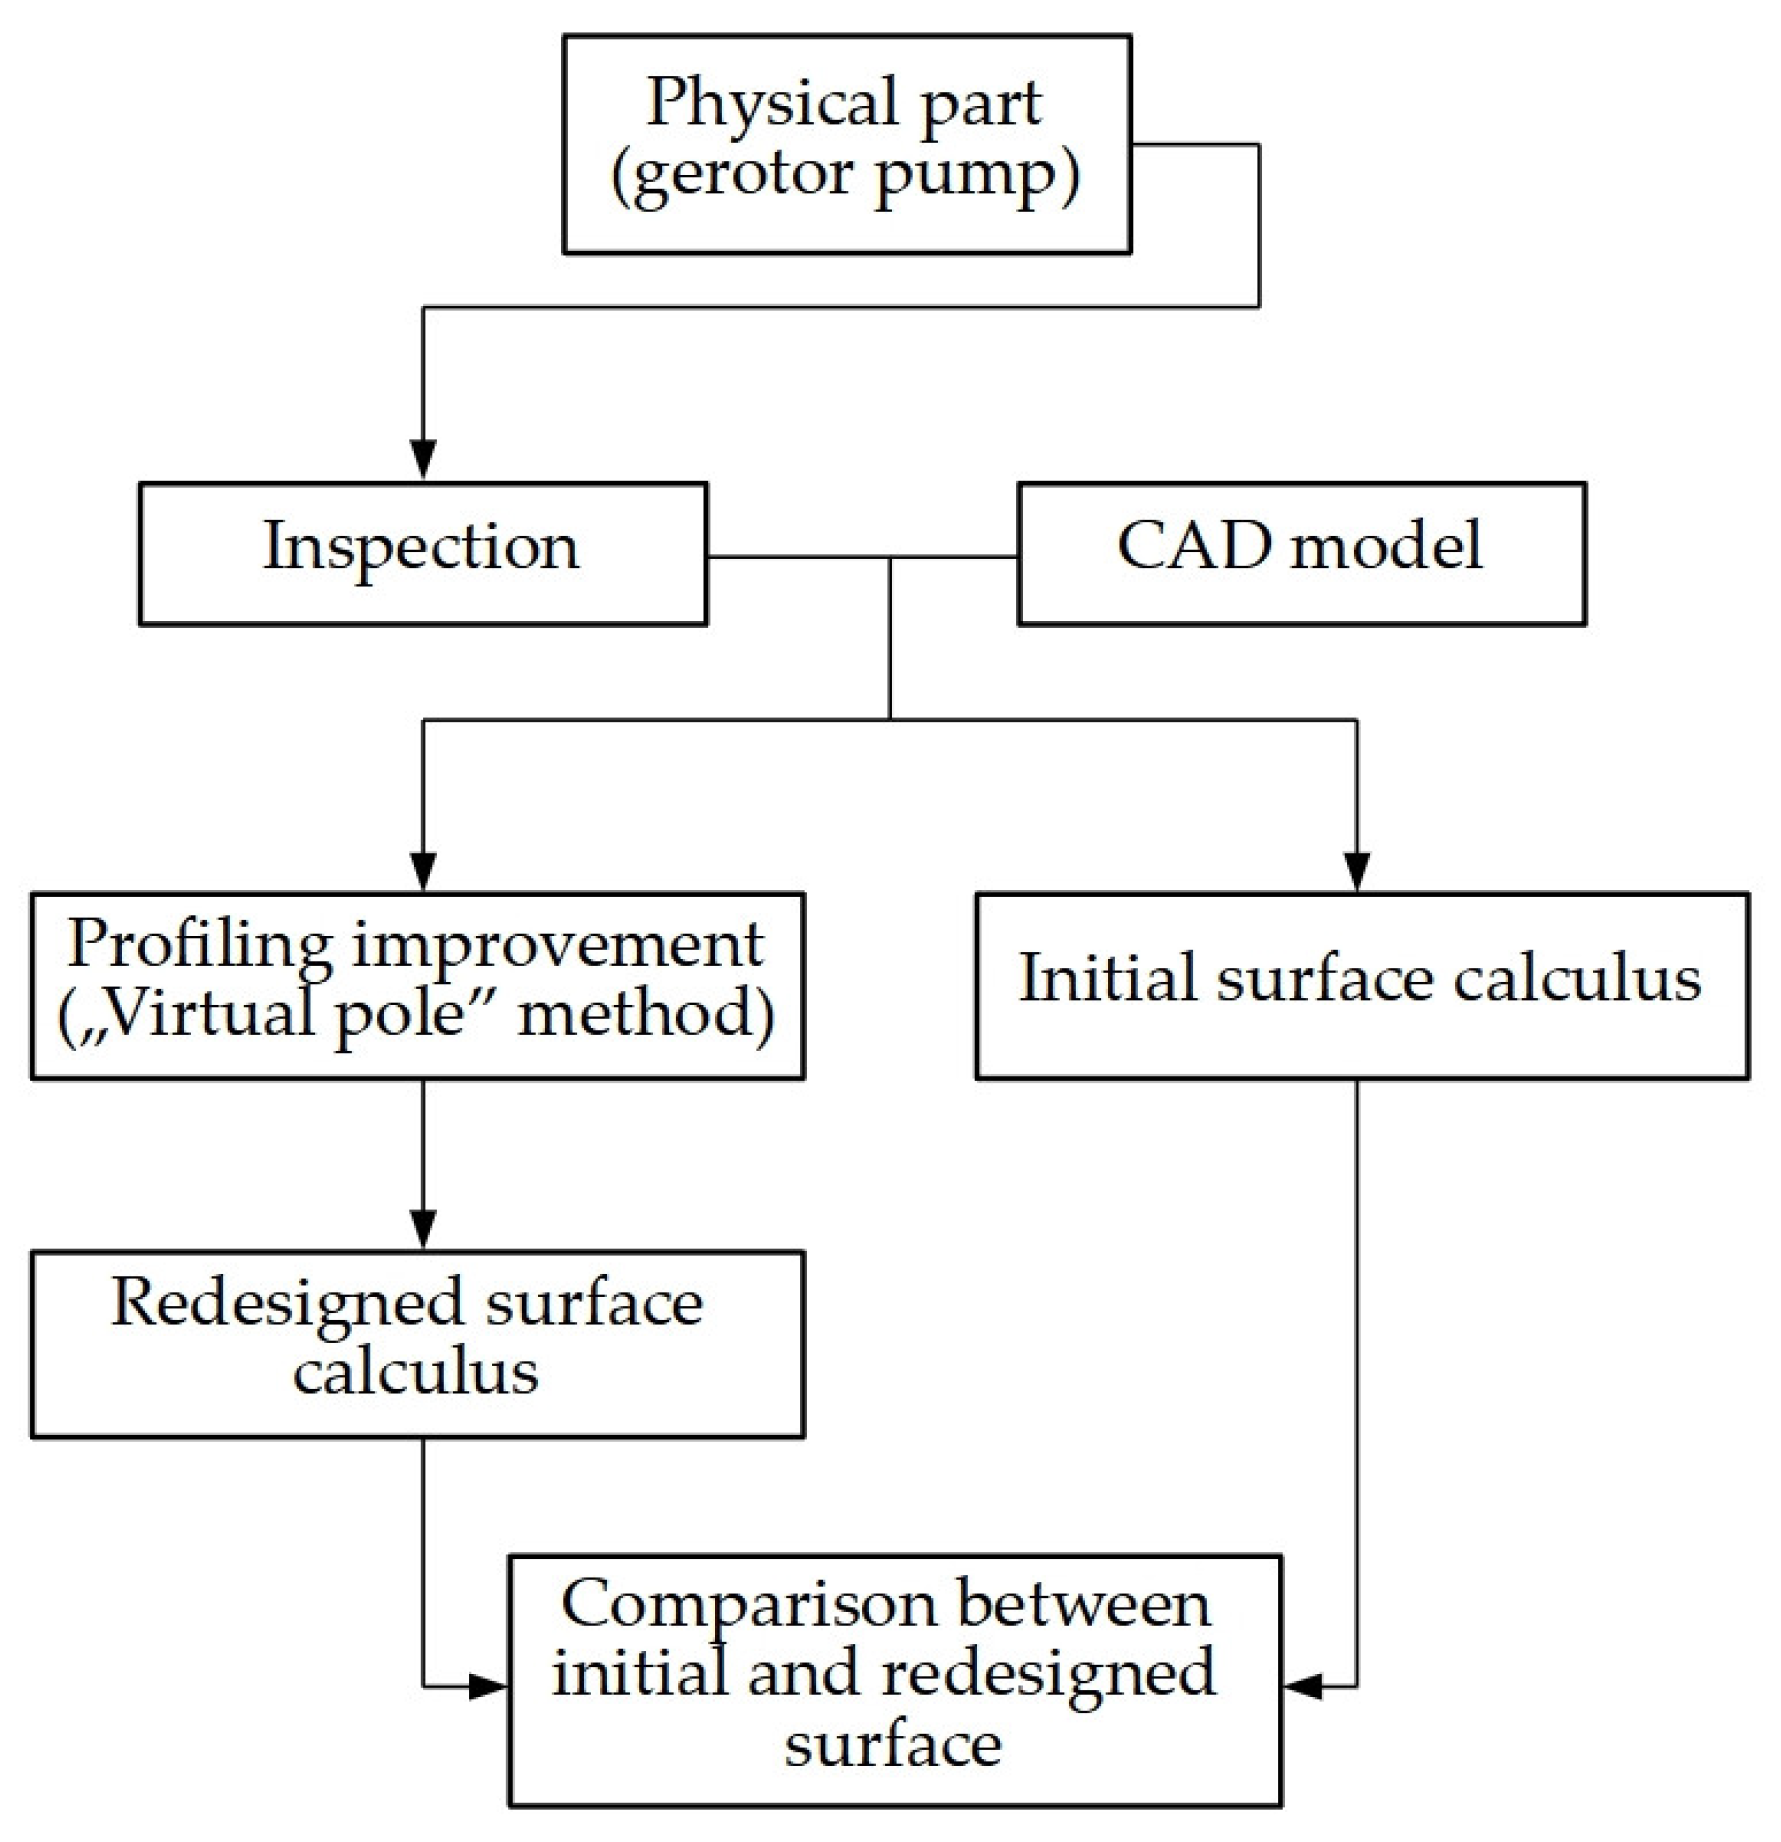
- The use of a three-dimensional measurement technique specific to reverse engineering, 3D scanning, as a developing technology, is increasingly used in dimensional quality control due to its capabilities to provide precise geometrical information for complex or assembled parts. The inspection of the reciprocally enwrapping surfaces for the rotors of the gerotor pump had the role of quickly creating a 3D model consisting of a ”cloud of points” obtained after scanning the surfaces of the parts, the ”cloud of points” being later used in their reconstruction (Figure 1, Figure 2, Figure 3 and Figure 4). The major advantage of using the automated scanning and analysis system was that a quick and accurate inspection of the rotors could be achieved, significantly reducing the time and effort required compared to traditional manual measurement methods. At the same time, the CAD model was created based on the dimensions from the gerotor pump data sheet, respectively, based on the scanned model (Figure 5 and Figure 6). The comparison of the two models was made by choosing the upper limit value of the represented deviations to be 0.5 mm and the lower limit value to be −0.5 mm (Figure 7), demonstrating the accuracy of the models and showing that the significant deviations that appear in Figure 8 are limited and represent exceptions. These areas of deviation are due to the imperfections present in the scanned parts and the measurement difficulties caused by their complex shape. It is important to emphasize that these deviations do not indicate errors in the numerical models obtained by design. Of course, the possibility of making a rapid comparison between the initial model and the redesigned one allows a theoretical analysis of the change in the volume efficiency of the pumps and, therefore, the increase in productivity in industrial processes.
- -
- The use of a new complementary method of analytical profiling of enwrapping generating cutting tools, an original method called the “virtual pole” method, by which calculation errors due to writing complicated calculation equations can be avoided if the fundamental theorems and consecrated methodologies are used in order to solve the problem of profiling the generating tools. Under these conditions, the prospects are open for the application of the “virtual pole” method for the corrective profiling of tools that generate by enwrapping and also the extension of the study methods for enwrapping other types of surfaces, such as helical surfaces, by analyzing the frontal profiles of various types of hydraulic pumps.
- -
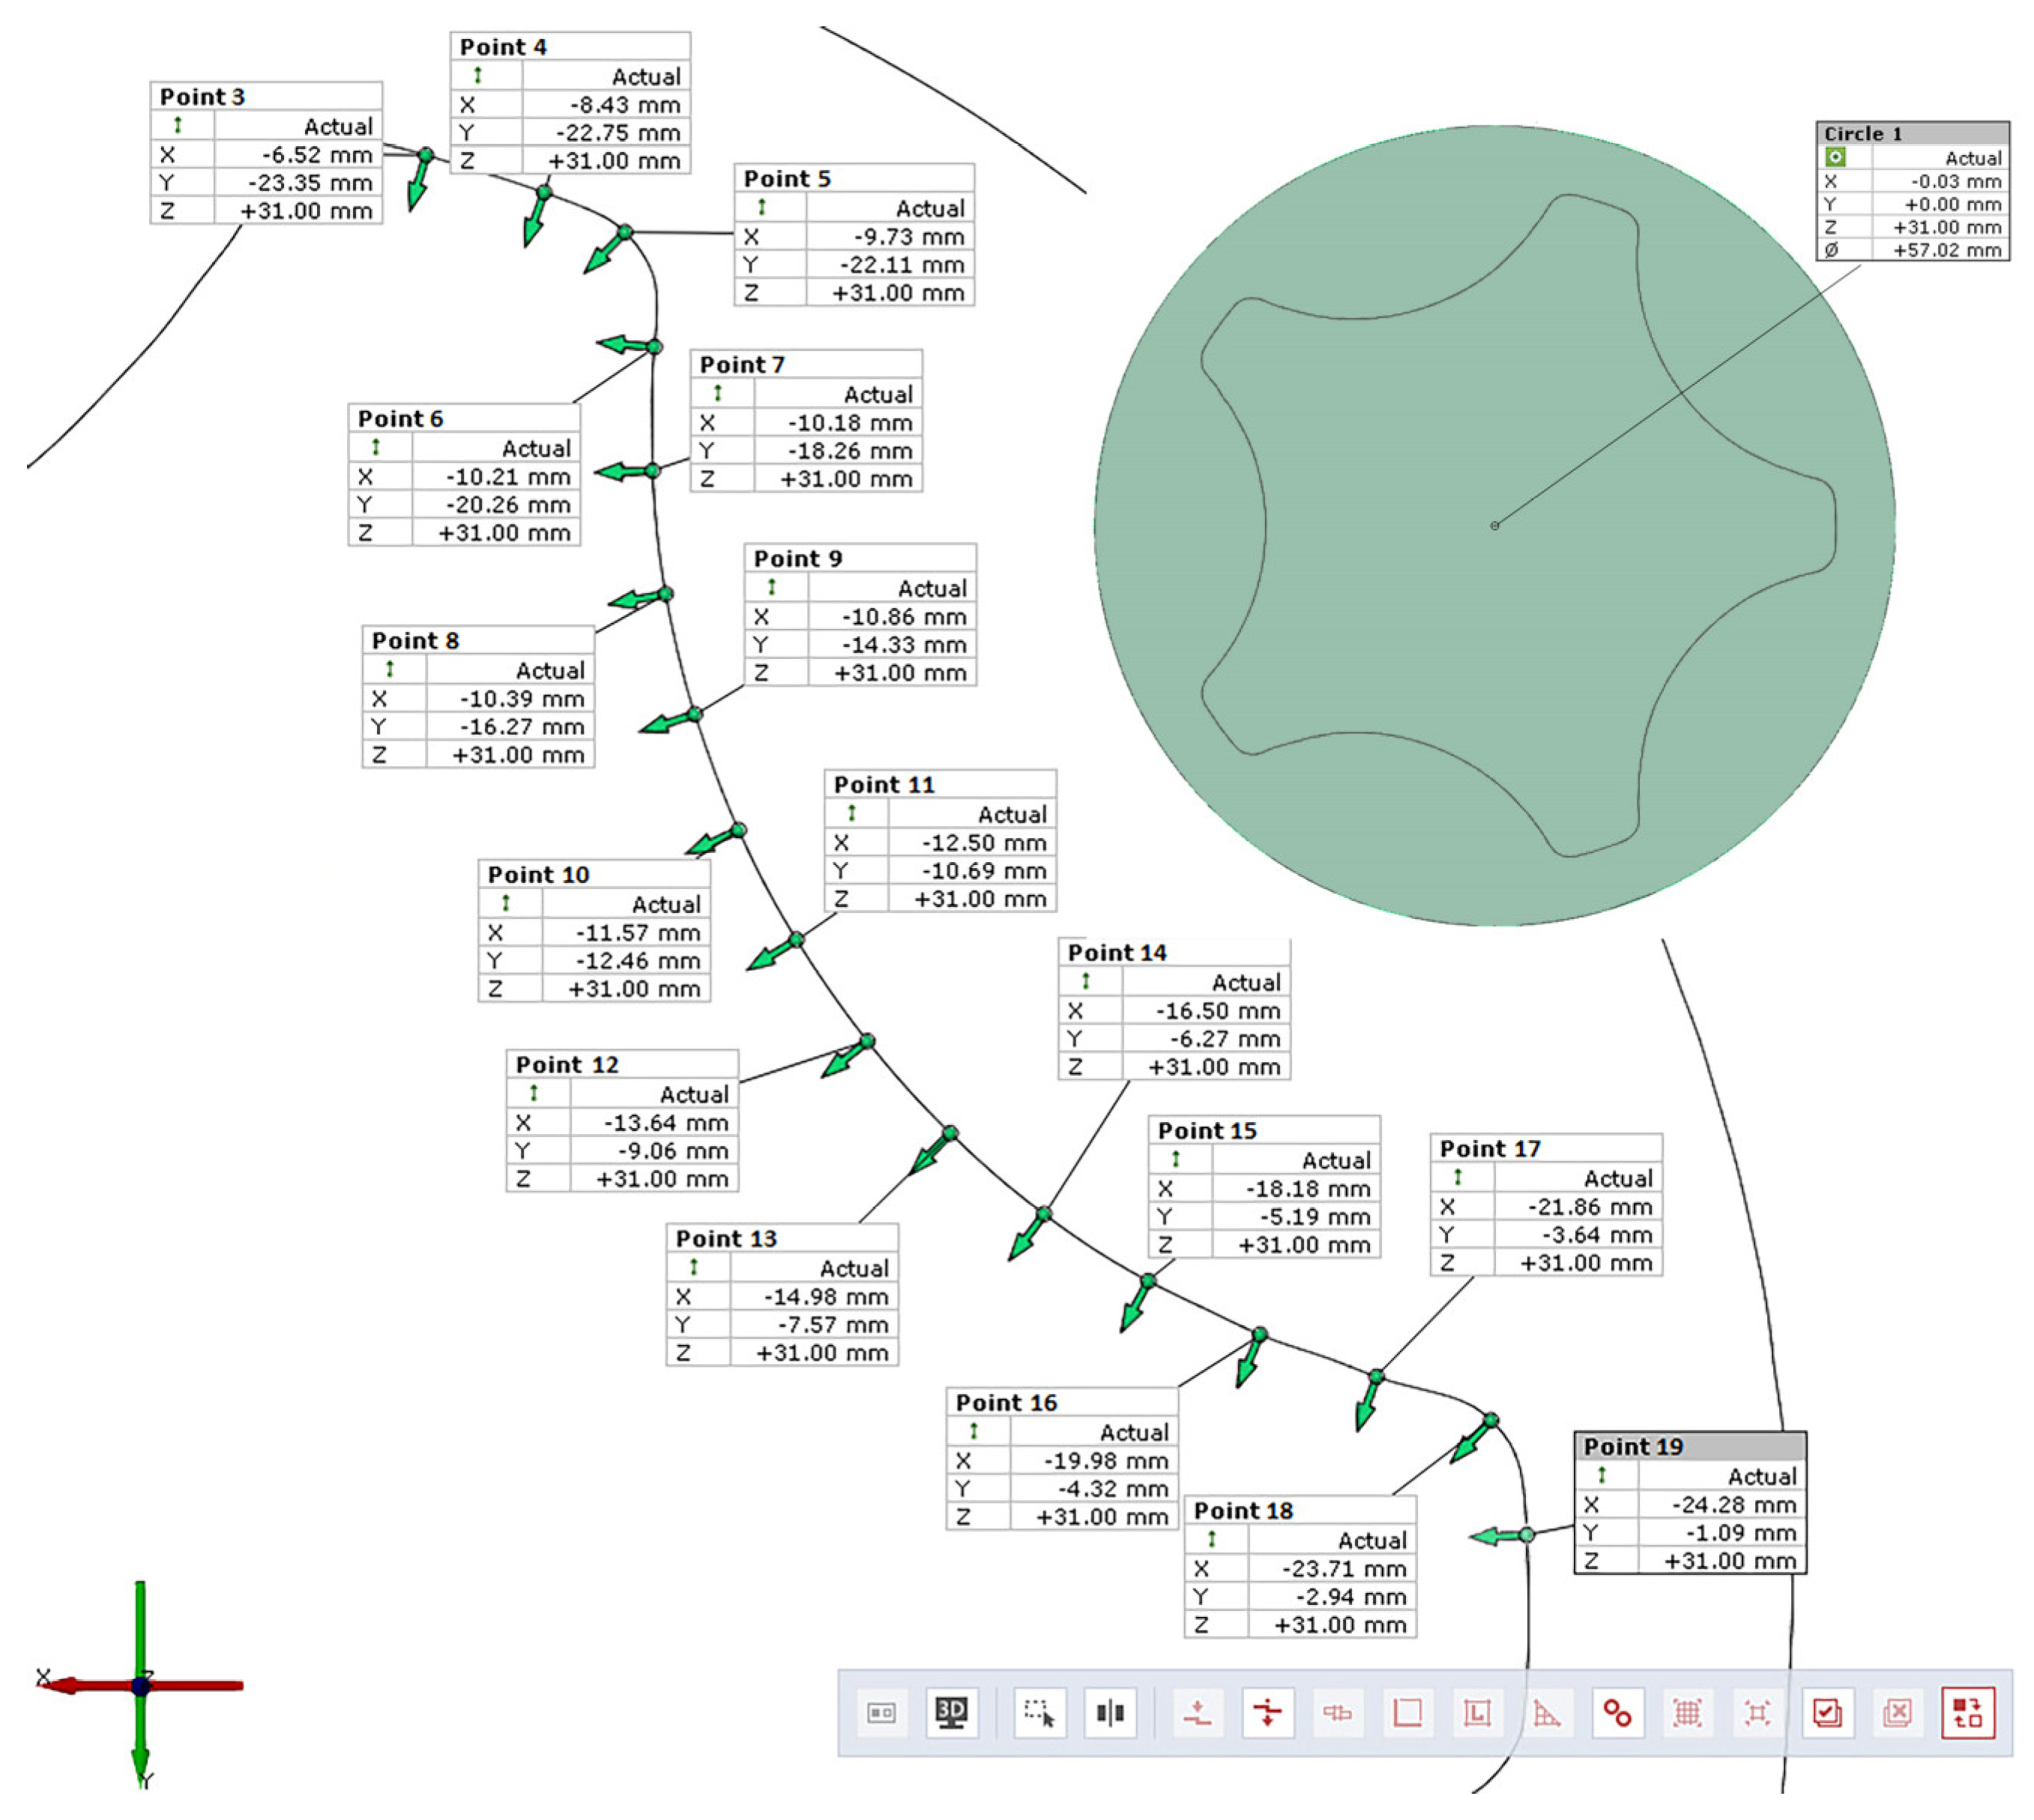
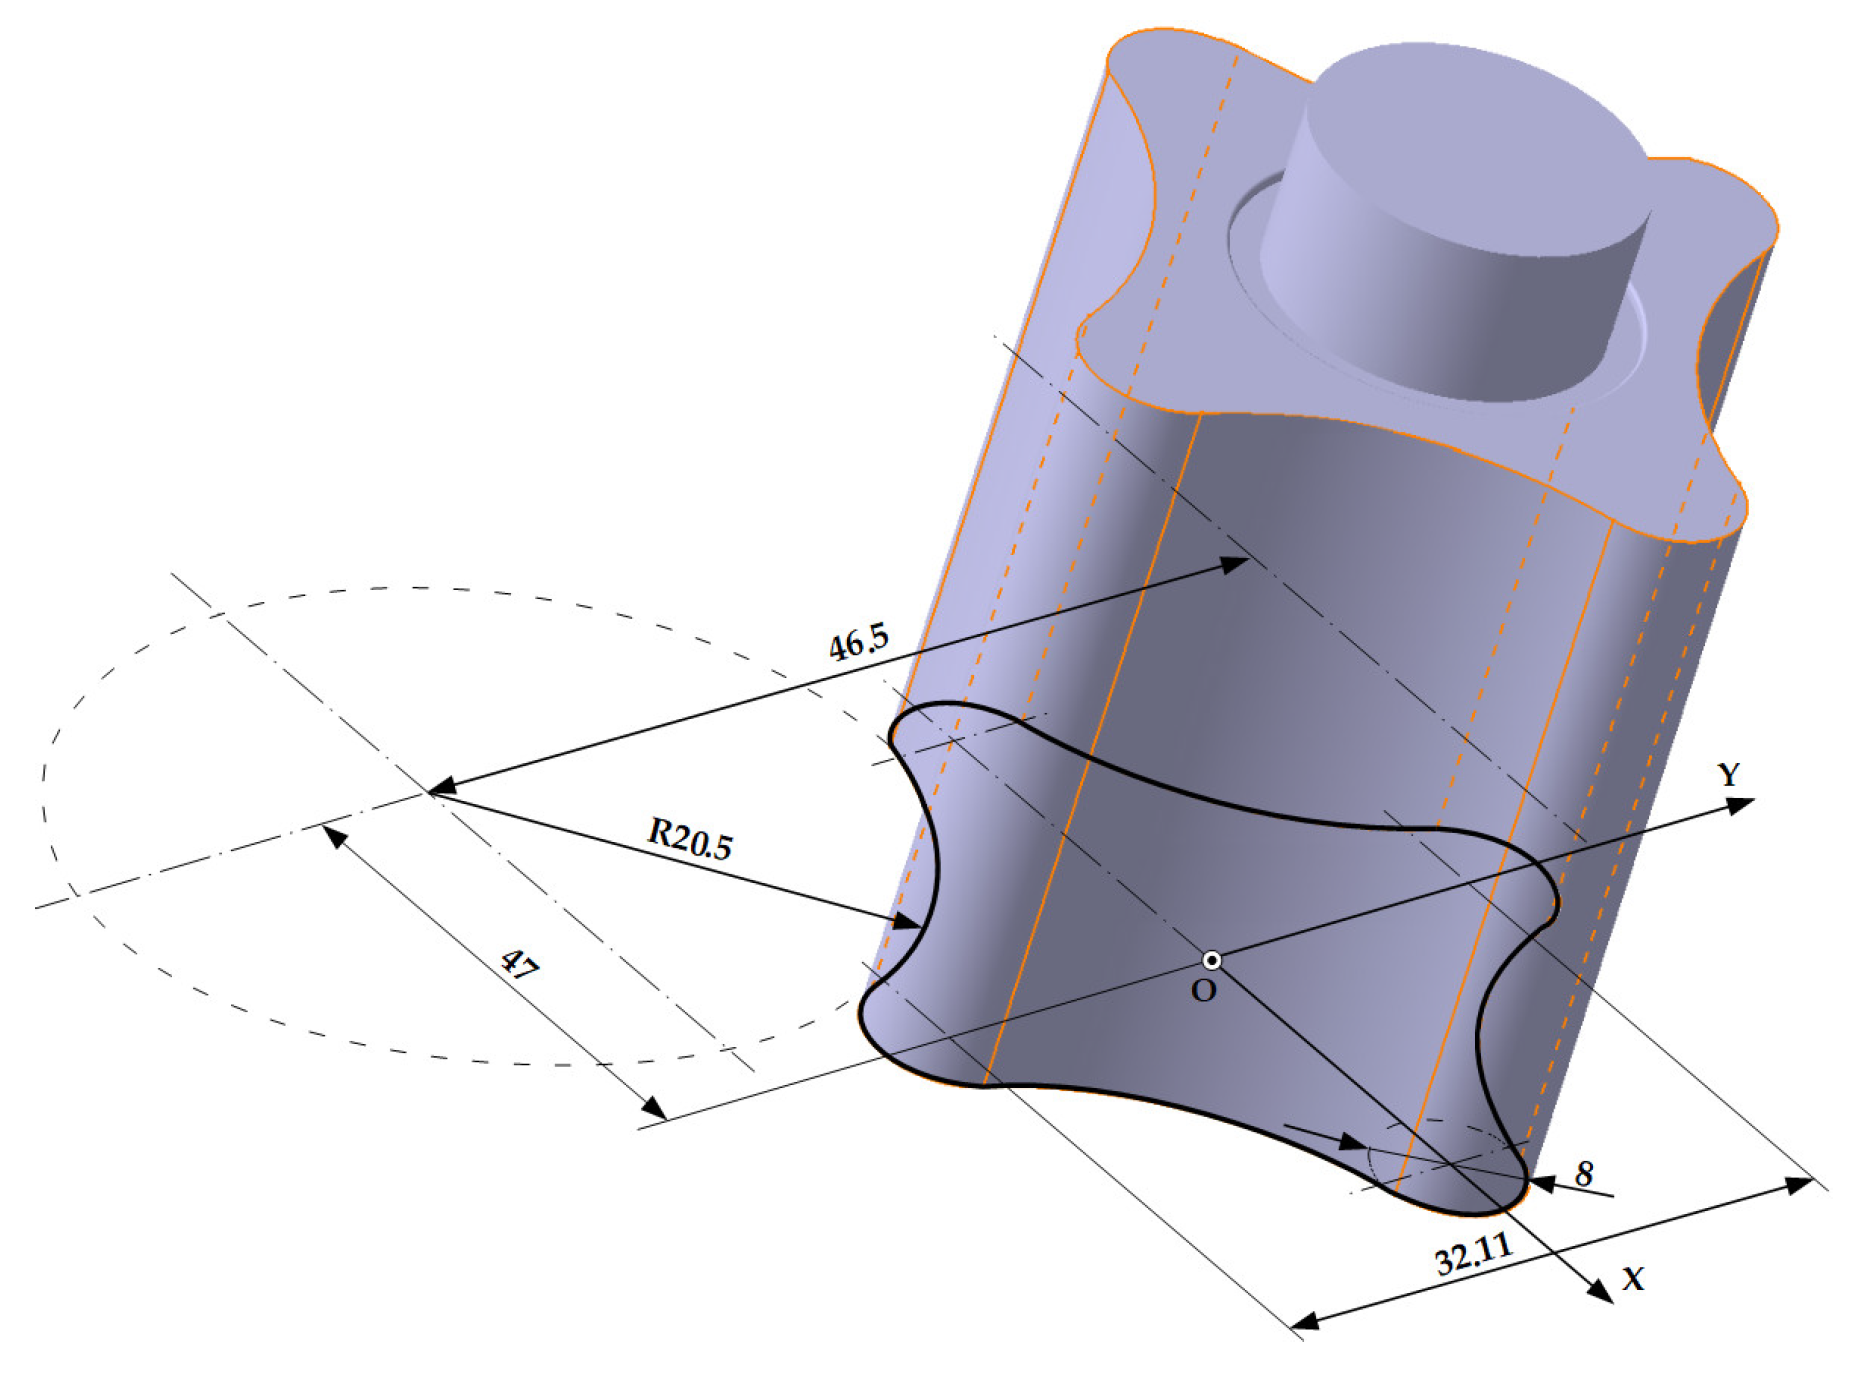
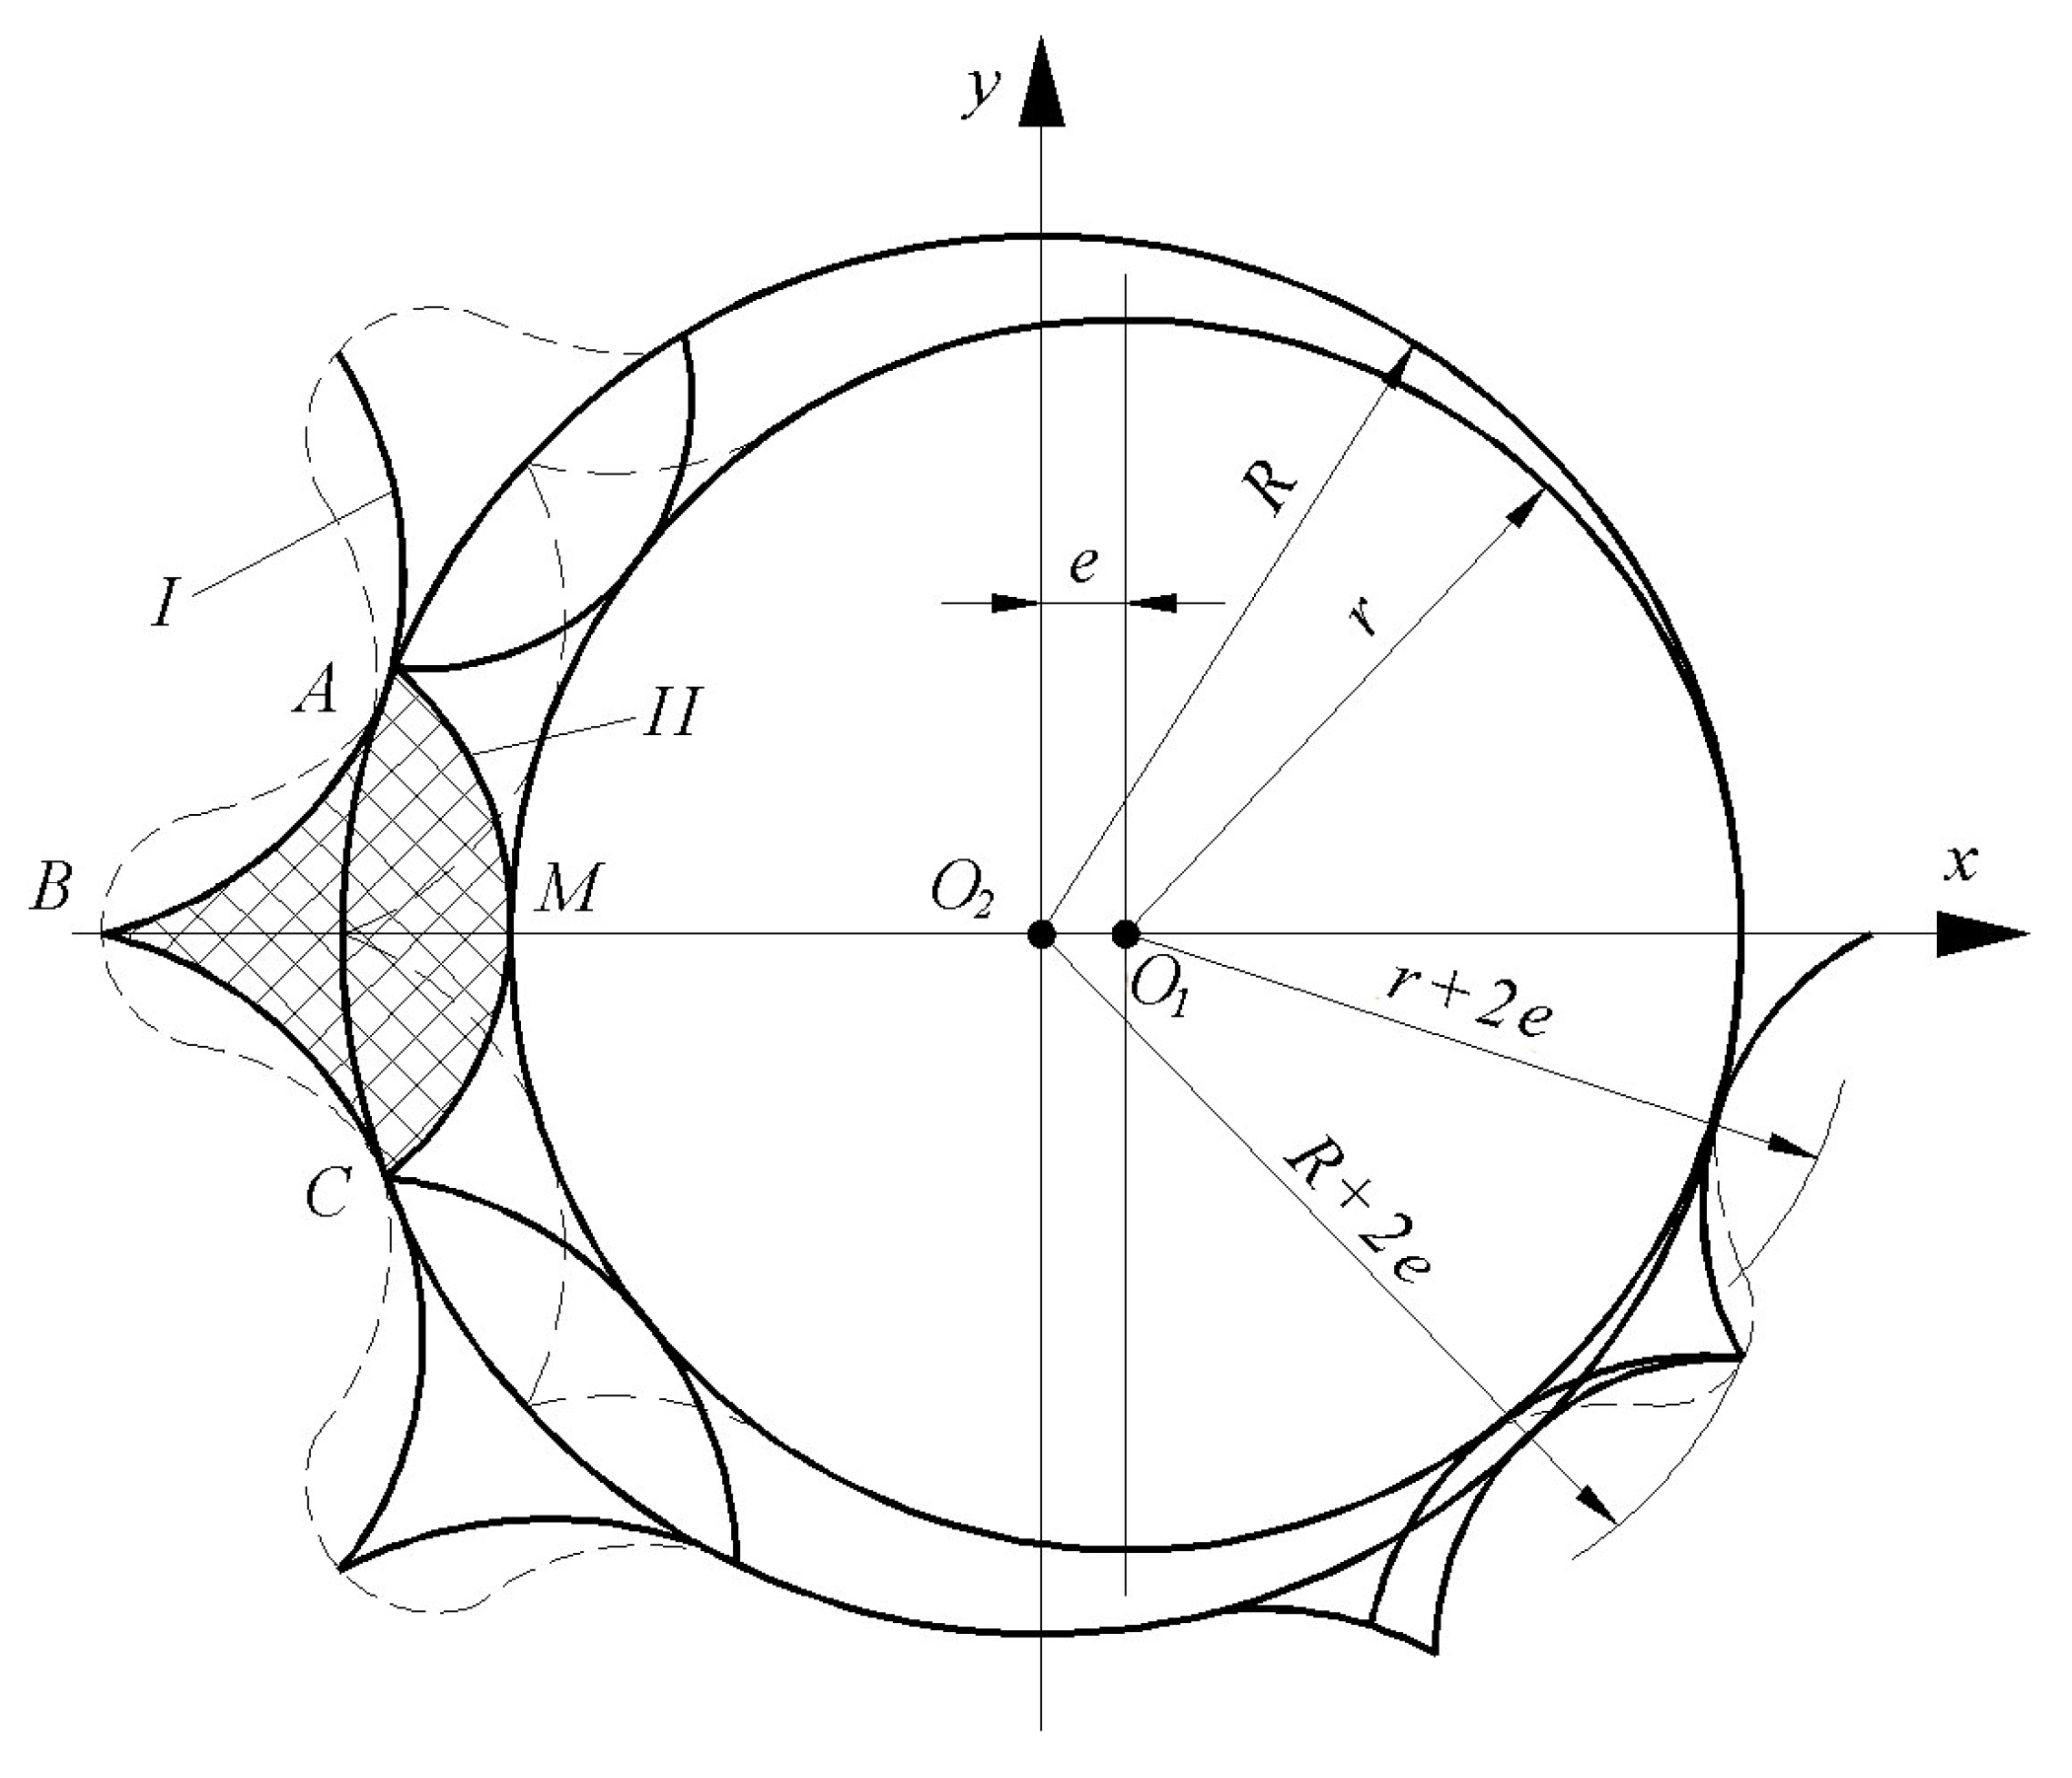
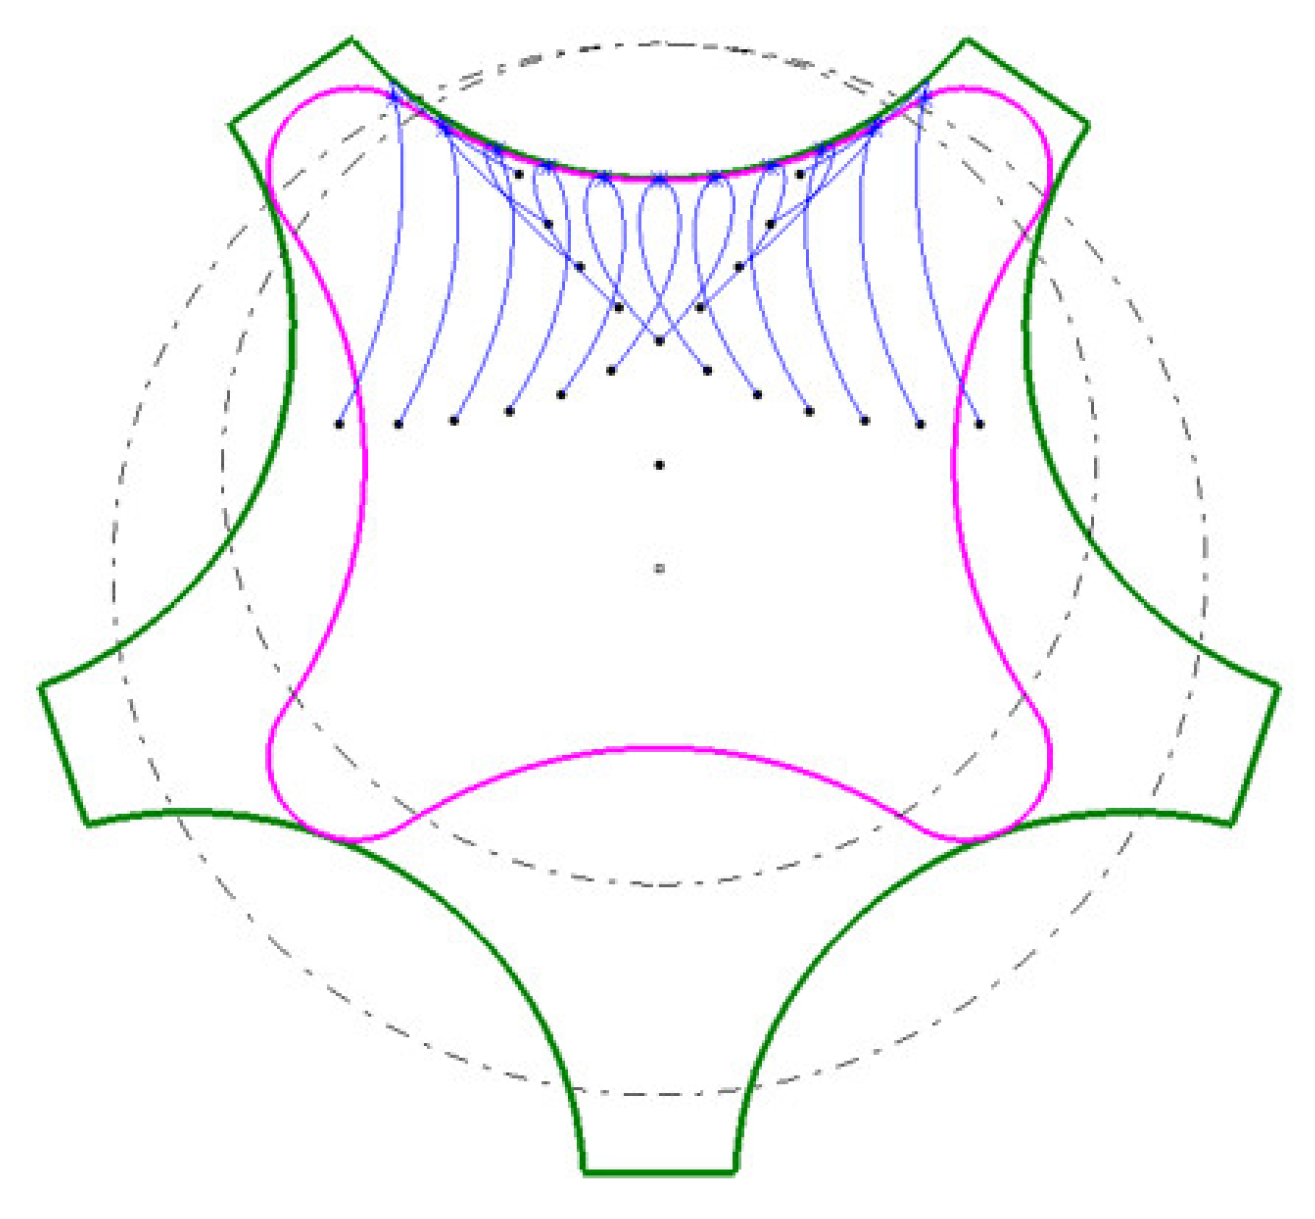
- The use of an analytical calculation method, in this case the “virtual pole” method, has demonstrated that it can allow the second enwrapping component to be accurately redesigned when the dimensions of the other are known, provided based on the three-dimensional measurement technique specific to reverse engineering. Thus, the method was beneficial in recalculating the profile of the Z4 rotor so that it is reciprocally enwrapped to the circle arc profile of the Z5 rotor, as evidenced by the coordinates that define the trajectories of the points on the profile of the Z4 rotor in relative movement to Z5, Figure 9, Figure 10, Figure 11, Figure 12 and Figure 13.
- -
- If the rolling radius had a value lower than the value of the minimum rolling radius, then there would have been an area on the profile of the inner rotor that was not wrapped with the profile of the outer rotor.
- -
- A running radius greater than the calculated minimum value would have had the effect of increasing the size of the outer and inner rotors. Due to the ease of processing, the specific recalculated values for the rolling radii of the form were adopted: for u = 42.1°.
5. Conclusions
- -
- The use of three-dimensional scanning allows complex numerical models to be obtained on which geometric measurements and features can be determined, allowing an accurate and complete CAD model to be produced. By comparison, obtaining the numerical model using a coordinate measuring machine would require a higher workload and a more skilled operator. In this case, it was estimated that the time savings achieved using the ATOS measuring system compared to using a coordinate measuring machine were about 50%, since both features have relatively simple geometry. The advantage of scanning techniques increases even more with increasing part complexity and is recommended for one-off or small-series products.
- -
- By overlapping the scanned models over the CAD models, it was observed that the upper limit value of the represented deviations is 0.5 mm and the lower limit value is −0.5 mm, demonstrating the accuracy of the models.
- -
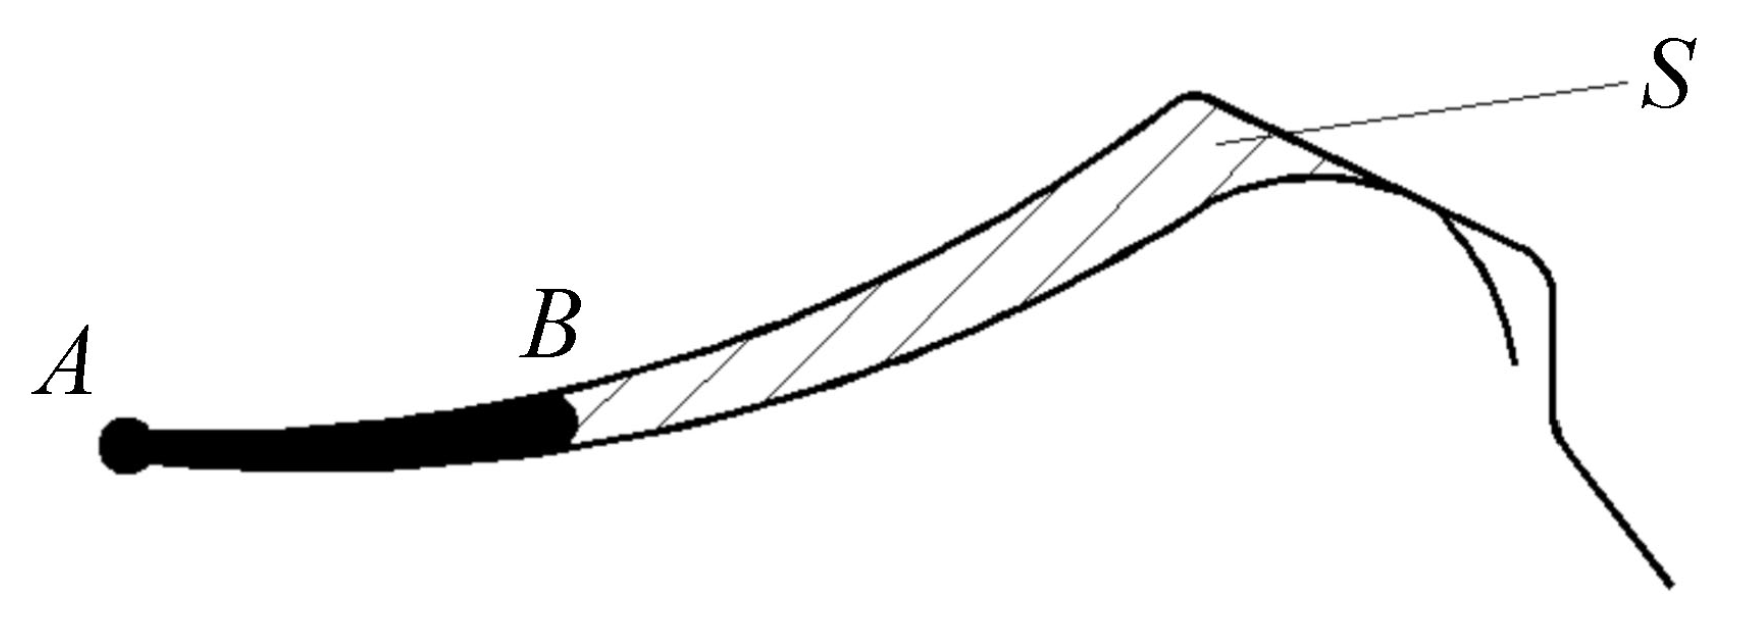
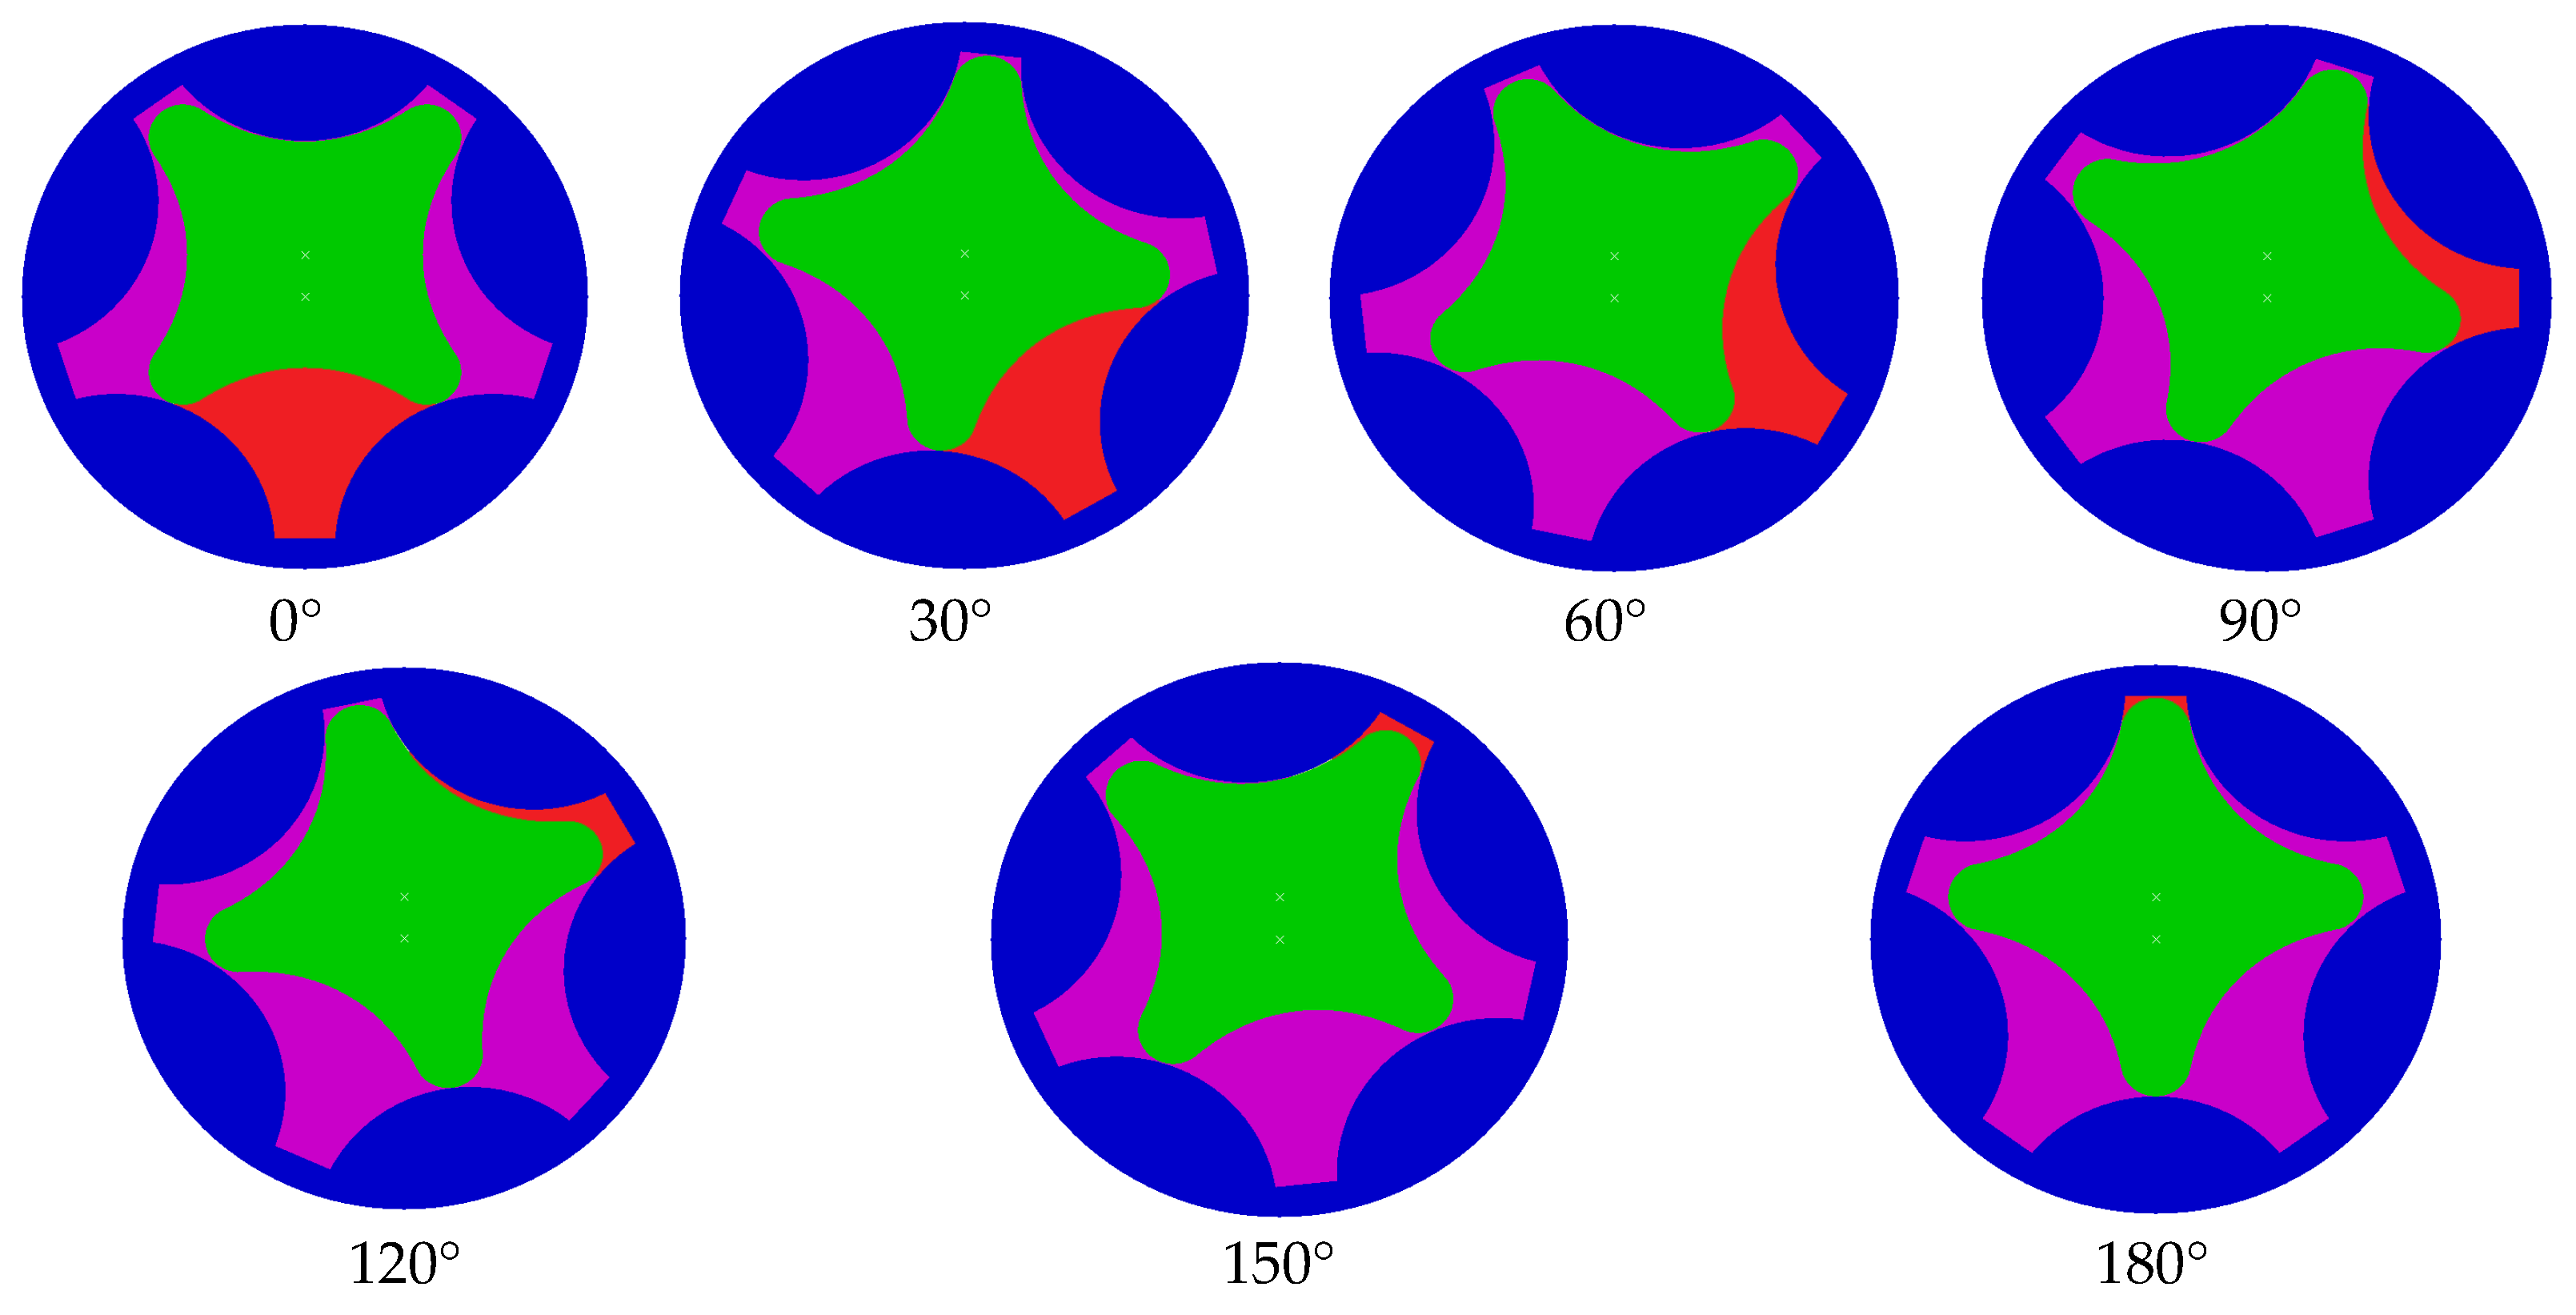
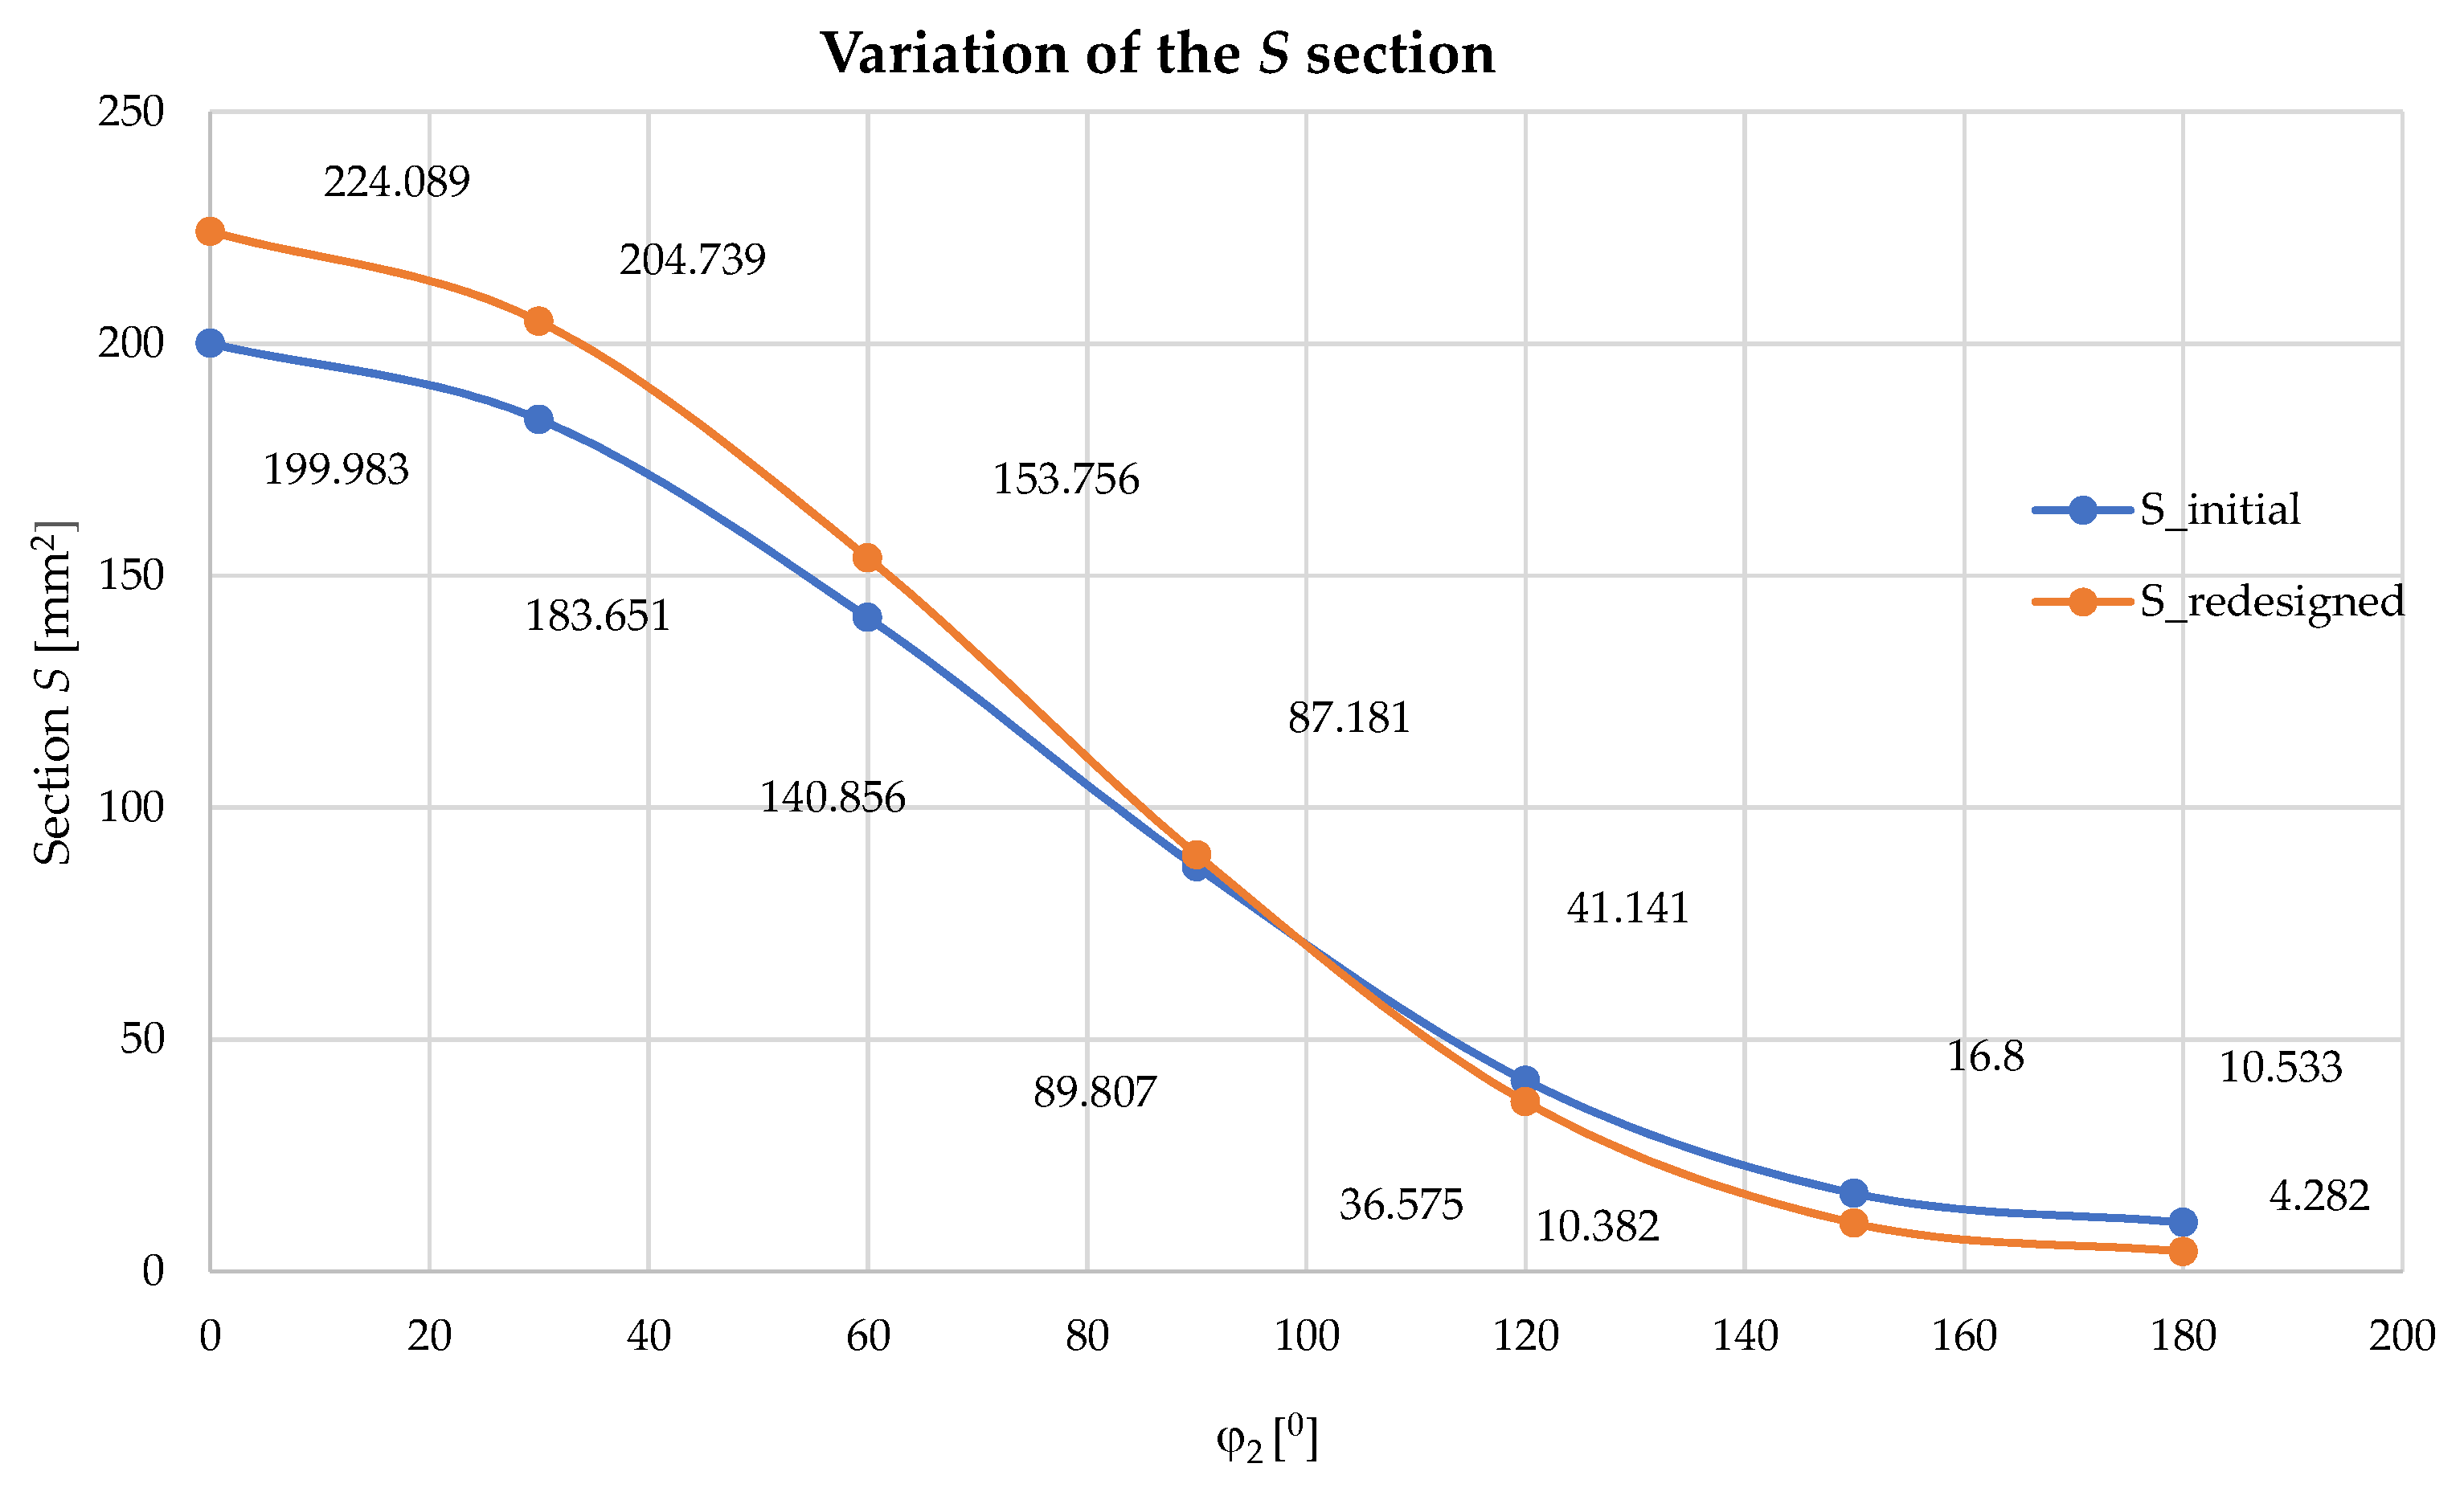
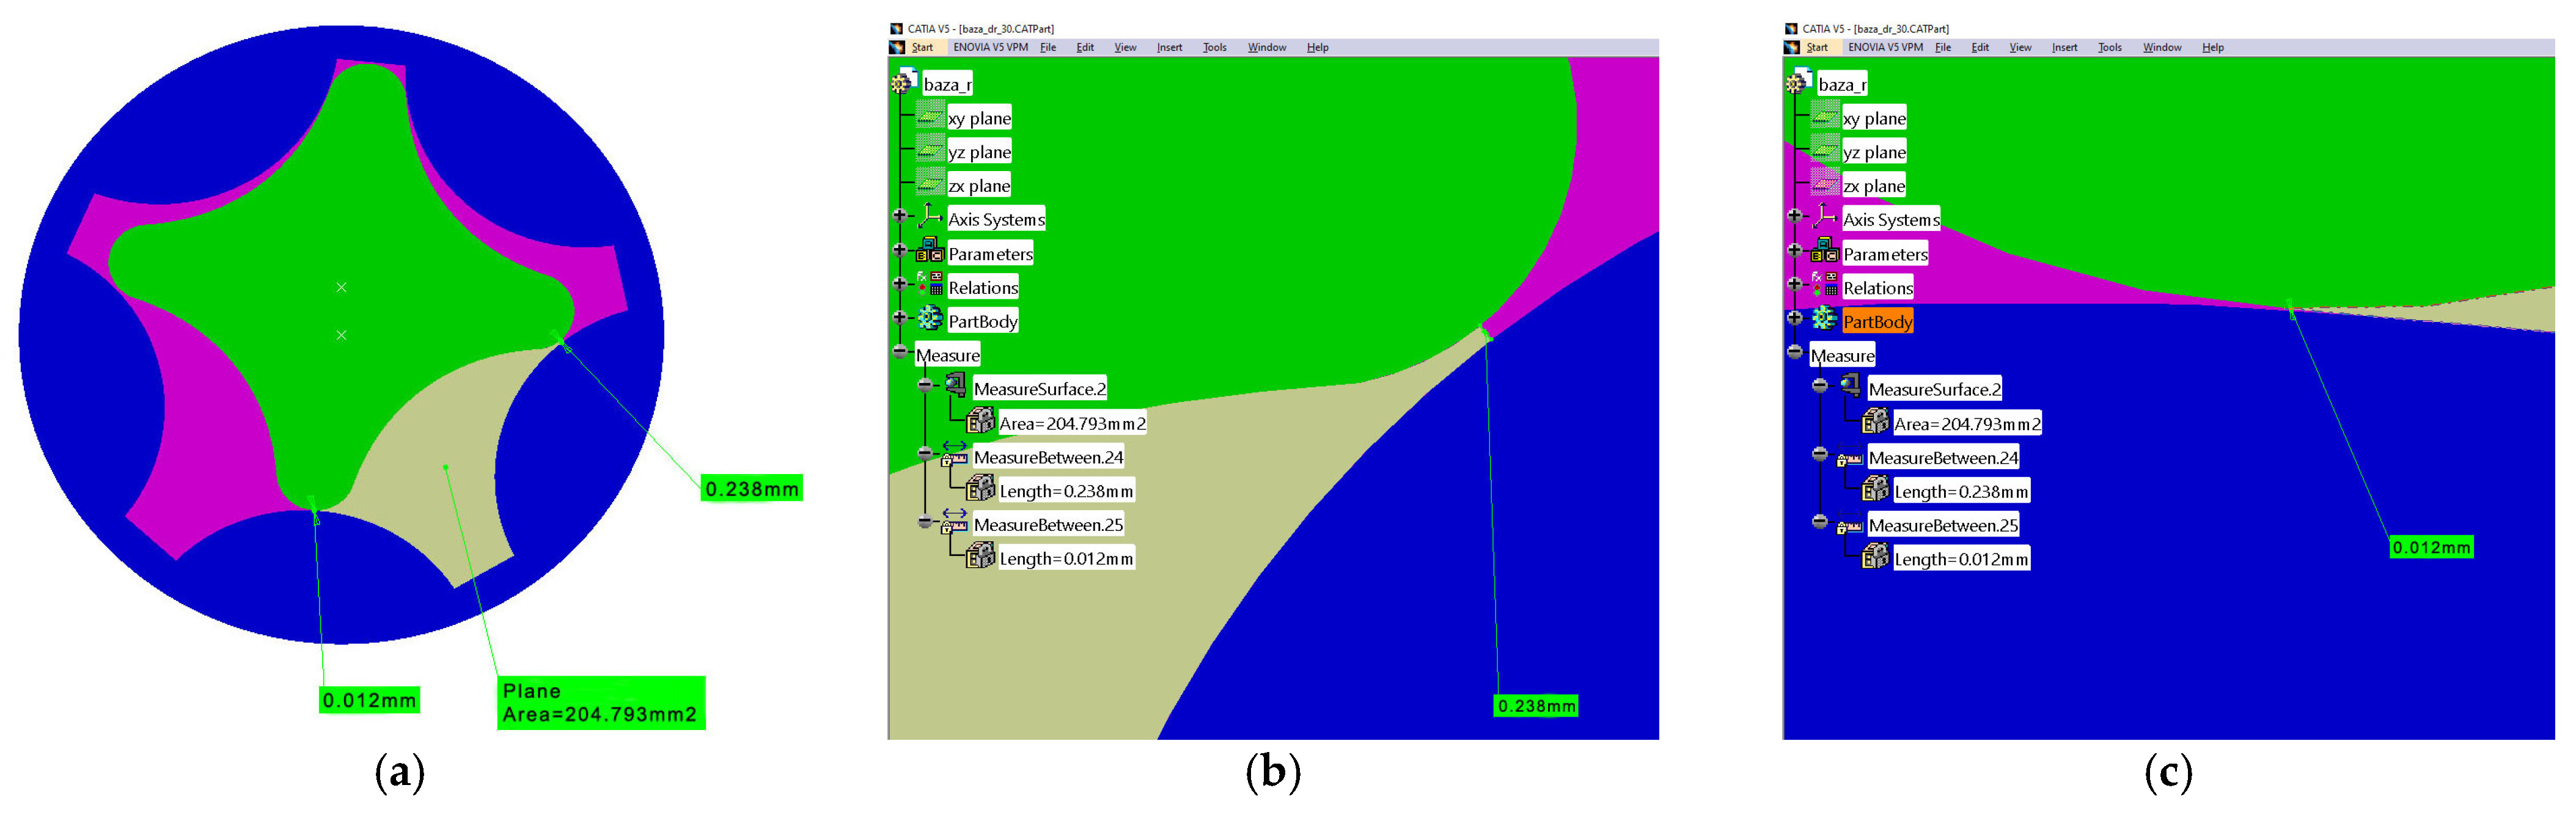
- The use of the “virtual pole” method, the original method, the foundations of which were laid by members of the authors’ team, facilitated the redesign of the existing models, leading to a substantial improvement by decreasing the distances d between the inner and outer rotors, which are in the enclosure, leading to better tightness between the moving components, as well as by increasing the theoretical area S in which fluid accumulates in various angular positions in the rotational motion. Thus, for the distances d a difference between 4.2% (at an angle ) and 57.8% (at an angle ) is observed on the left side, and 17.9% (at an angle ) and 54.4% (at an angle ) on the right side. In the case of the S area, overall, there is an increase of about 16% for the redesigned, improved model.
Author Contributions
Funding
Institutional Review Board Statement
Informed Consent Statement
Data Availability Statement
Conflicts of Interest
Abbreviations
| xy | fixed reference system |
| I, II | hypocycloids |
| e | eccentricity |
| BAM, BCM | partial sections |
| BAMC | total section |
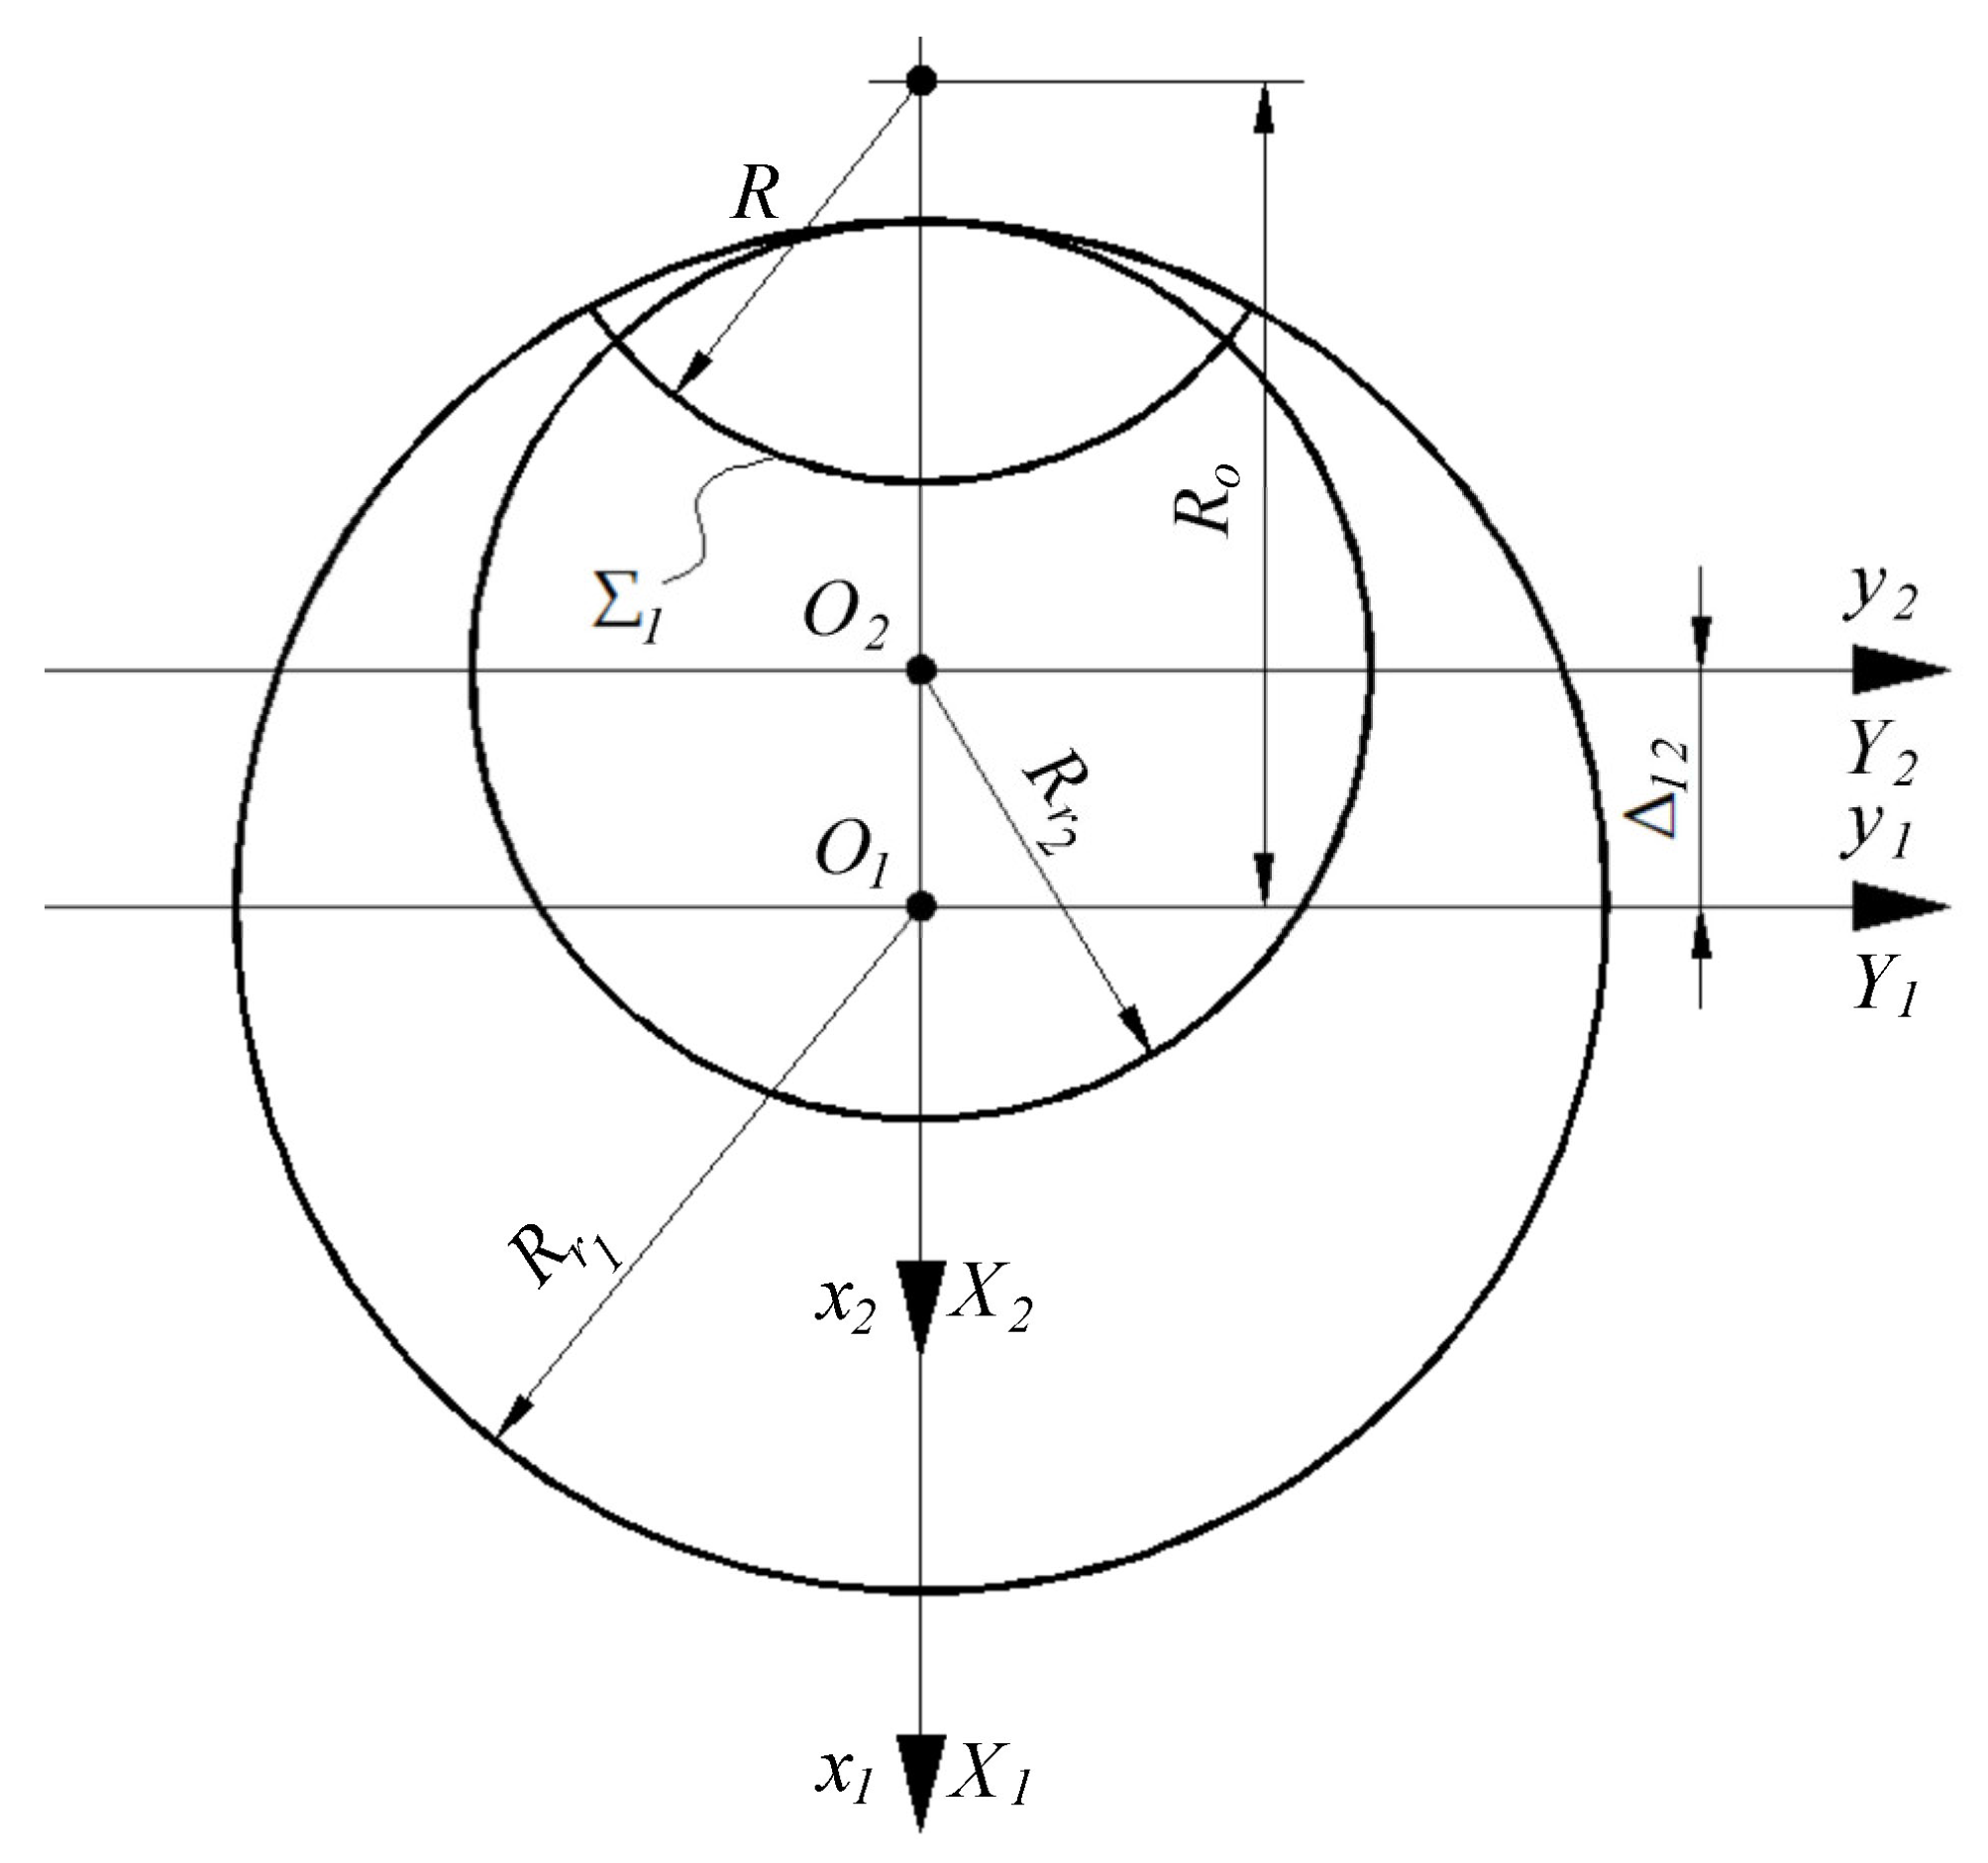
| A12 | the distance between the centers of the rolling circles and |
| the rolling radius of the C1 centrode associated with the Z5 rotor | |
| the rolling radius of the C2 centrode associated with the Z4 rotor | |
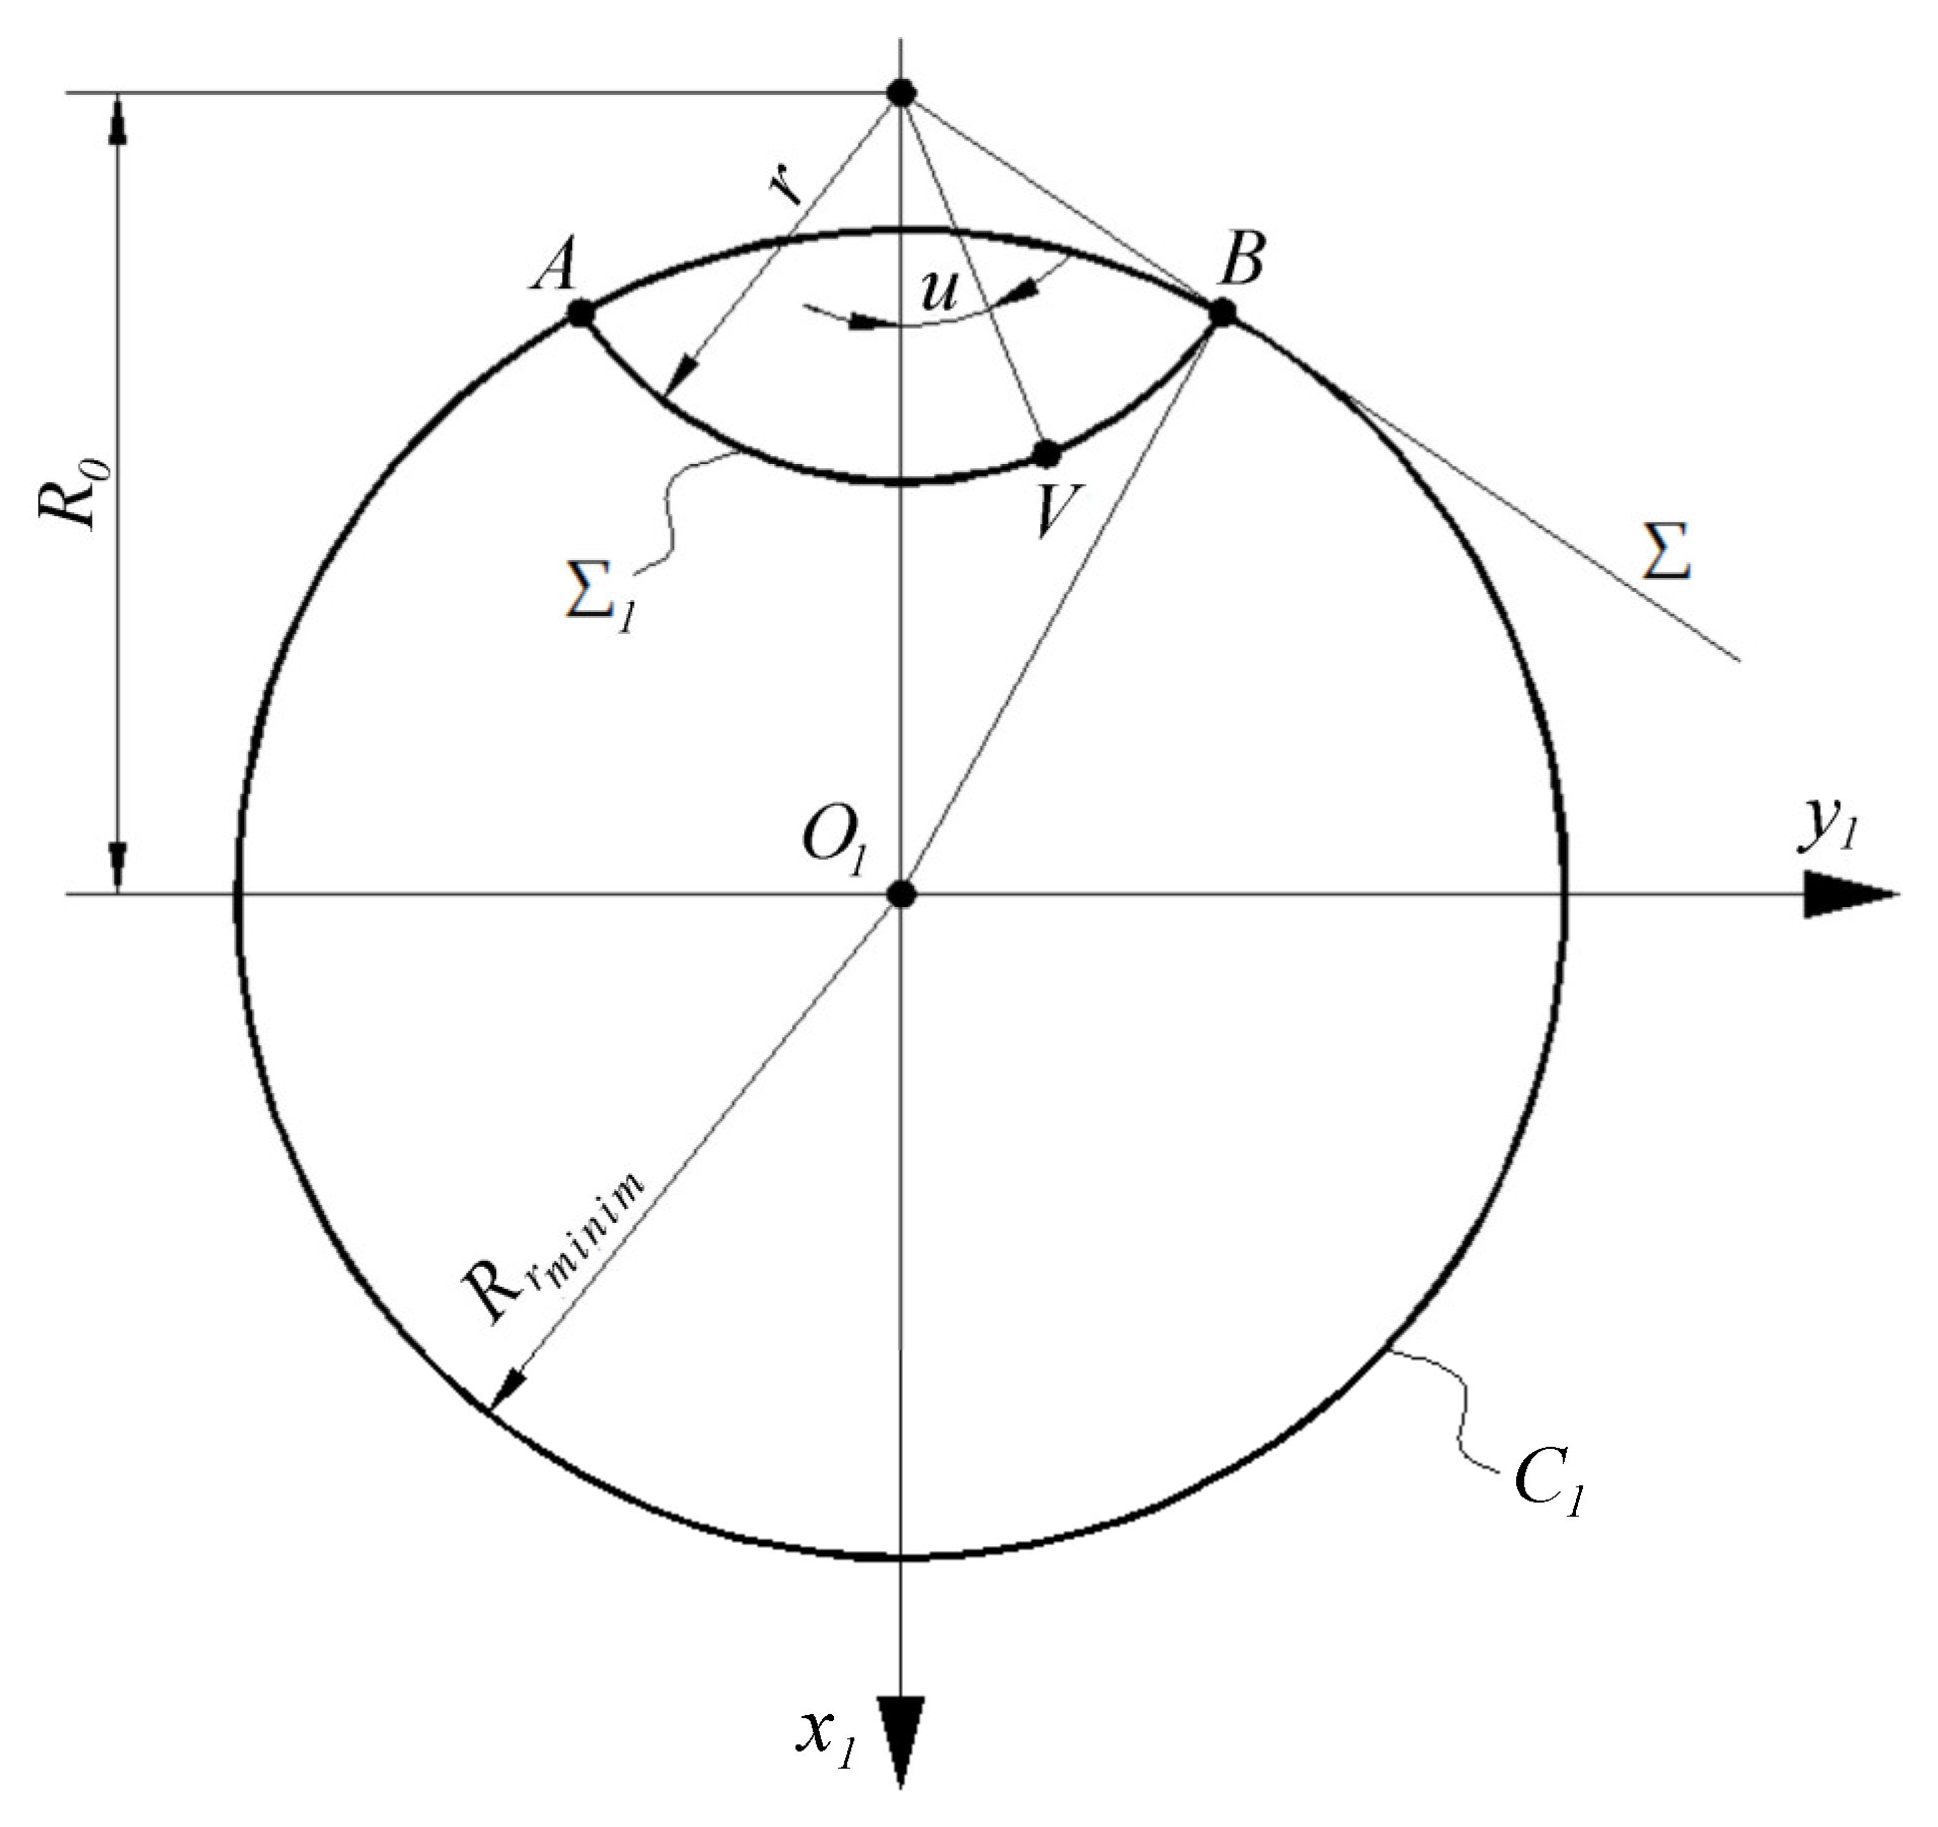
| r | the radius of the profile of outer rotor |
| Ro | the distance between the rolling radius of the centrode associated with the Z5 rotor și radius of the inner rotor, R |
| x1y1 | fixed reference system, with the origin at the rotation center of the Z5 rotor, O1 point |
| x2y2 | fixed reference system, with the origin at the rotation center of the Z4 rotor, O2 point |
| X1Y1 | mobile reference system, joined with the Z5 rotor |
| X2Y2 | mobile reference system, joined with the Z4 rotor |
| R | the radius of the profile of inner rotor |
| Σ1 | the profile of the outer rotor |
| minimum rolling radius | |
| u | angular parameter that describes the Σ1 profile |
| V | point on the rotor surface |
| Σ | the profile to be generated |
| t-t | tangent to the Σ1 profile |
| n-n | normal to the Σ1 profile, which passes through the O1 origin |
| X(u); Y(u) | the parametric equations of the Σ1 profile |
| Δ | the maximum distance between the current point on the Σ1 profile și and the intersection point between the tangent to Σ1 at the current point and the normal to Σ1, which passes through the origin of the reference system, O1 |
| Σ2′ | rolling profile |
| normal to the Σ or Σ1 profile | |
| C1 | centrode associated with the Z5 rotor |
| C2 | centrode associated with the Z4 rotor |
| φ1 | the rotation angle of the reference system associated with the profile to be generated |
| φ2 | the movement parameter of the mobile reference system, joined with the tool profile, related to the φ1 angle, by the rolling condition |
| Pv | virtual pole |
| the position vector of the virtual pole |
References
- Gamez-Montero, P.J.; Codina, E.; Castilla, R. A Review of Gerotor Technology in Hydraulic Machines. Energies 2019, 12, 2423. [Google Scholar]
- Vílchez, M.G. Design Tools Applied to a Trochoidal Gear Pump. Ph.D. Thesis, Universitat Politècnica de Catalunya (UPC), Barcelona, Spain, 2014. [Google Scholar]
- De Martin, A. Development of a Novel Gerotor Pump for Lubrication Systems of Aeronautic Engines. Ph.D. Thesis, Politecnico di Torino, Turin, Italy, 2018. [Google Scholar]
- Sang, X.; Zhou, X.; Liu, X. Numerical simulation of an inner engaging gerotor based on the optimization of inlet and outlet cavities. In Proceedings of the 5th International Conference on Advanced Design and Manufacturing Engineering, Shenzhen, China, 19–20 September 2015. [Google Scholar]
- Demenego, A.; Vecchiato, D.; Litvin, F.L.; Nervegna, N.; Mancó, S. Design and simulation of meshing of a cycloidal pump. Mech. Mach. Theory 2002, 37, 311–332. [Google Scholar] [CrossRef]
- Sliwinski, P.; Patrosz, P.; Bak, M.; Stosiak, M.; Urbanowicz, K.; Šukevičius, Š. Experimental Study of Flow Rate in Hydraulic Satellite Motor with the Rotating Case at a Low Constant Rotational Speed. In Proceedings of the International Conference Transbaltica XIII: Transportation Science and Technology, Vilnius, Lithuania, 15–16 September 2022. [Google Scholar]
- Baroiu, N.; Moroșanu, G.A. Hydraulic Drive Systems; Academica Publishing House: Galati, Romania, 2022; ISBN 978-606-606-011-0. [Google Scholar]
- Litvin, F.L. Theory of Gearing; Reference Publication 1212; NASA, Scientific and Technical Information Division: Washington, DC, USA, 1984. [Google Scholar]
- Bonandrini, G.; Mimmi, G.; Rottenbacher, C. Theoretical analysis of internal epitrochoidal and hypotrochoidal machines. Proc. Inst. Mech. Eng. C 2009, 223, 1469–1480. [Google Scholar] [CrossRef]
- De Martin, A.; Jacazio, G.; Sorli, M. Optimization of Gerotor Pumps with Asymmetric Profiles through an Evolutionary Strategy Algorithm. Machines 2019, 7, 17. [Google Scholar] [CrossRef]
- Lee, S.H.; Kwak, H.S.; Han, G.B.; Kim, C. Design of Gerotor Oil Pump with 2-Expanded Cardioids Lobe Shape for Noise Reduction. Energies 2019, 12, 1126. [Google Scholar]
- Kwak, H.-S.; Li, S.-H.; Kim, C. Performance improvement of an oil pump: Design of port assembled with gerotor (2-ellipses-combined lobe). Int. J. Precis. Eng. Manuf. 2016, 17, 1017–1024. [Google Scholar]
- Gamez-Montero, P.J.; Castilla, R.; Codina, E.; Freire, J.; Morató, J.; Sanchez-Casas, E.; Flotats, I. GeroMAG: In-House Prototype of an Innovative Sealed, Compact and Non-Shaft-Driven Gerotor Pump with Magnetically-Driving Outer Rotor. Energies. 2017, 10, 435. [Google Scholar]
- Liu, H.; Lee, J.C. Development of Combined Trochoidal Profile of a Gerotor Pump. J. Appl. Math. Phys. 2016, 4, 28–32. [Google Scholar] [CrossRef]
- Liu, H.; Lee, J.C.; Yoon, A.; Kim, S.T. Profile design and numerical calculation of instantaneous flow rate of a gerotor pump. J. Appl. Math. Phys. 2015, 3, 92–97. [Google Scholar]
- Pellegri, M.; Vacca, A.; Devendran, R.S. A Lumped Parameter Approach for Gerotor Pumps: Model Formulation and Experimental Validation. In Proceedings of the 10th International Fluid Power Conference, Dresden, Germany, 8–10 March 2016. [Google Scholar]
- Arinaga, S.; Yoshida, K.; Takada, S.; Noda, M.; Inoue, K. The Latest Trends in Oil Pump Rotors for Automobiles. SEI Tech. Rev. 2016, 82, 59–65. [Google Scholar]
- Mancò, S.; Nervegna, N.; Rundo, M. A contribution to the design of hydraulic lube pumps. Int. J. Fluid Power 2002, 3, 21–32. [Google Scholar]
- Hussain, T.; Kumar, M.U.; Sarangi, N.; Sivaramakrishna, M. A Study on Effect of Operating Conditions on Gerotor Pump Performance. Def. Sci. J. 2022, 72, 146–150. [Google Scholar] [CrossRef]
- Buono, D.; di Cola, F.D.S.; Senatore, A.; Frosina, E.; Buccilli, G.; Harrison, J. Modelling approach on a Gerotor pump working in cavitation conditions. Energy Procedia 2016, 101, 701–709. [Google Scholar]
- Hsieh, C.F. Influence of gerotor performance in varied geometrical design parameters. J. Mech. Des. 2009, 131, 121008. [Google Scholar]
- Kwon, S.M.; Kang, H.S.; Shin, J.-H. Rotor profile design in a hypogerotor pump. J. Mech. Sci. Technol. 2010, 23, 3459–3470. [Google Scholar]
- Kwon, S.M.; Kim, C.-H.; Shin, J.-H. Optimal rotor wear design in hypotrochoidal gear pump using genetic algorithm. J. Cent. South Univ. Technol. 2011, 18, 718–725. [Google Scholar]
- Robison, A.; Vacca, A. Multi-objective optimization of circular-toothed gerotors for kinematics and wear by genetic algorithm. Mech. Mach. Theory 2018, 128, 150–168. [Google Scholar]
- Strmčnik, E.; Majdič, F. The Pressure and Efficiency Characteristic of Hydraulic Gerotor Motor with the Floating Outer Ring. Teh. Vjesn. 2018, 25, 609–615. [Google Scholar]
- Ivanović, L.; Stojanović, B.; Blagojević, J.; Bogdanović, G.; Marinković, A. Analysis of the Flow Rate and the Volumetric Efficiency of the Trochoidal Pump by Application of Taguchi Method. Teh. Vjesn. 2017, 24, 265–270. [Google Scholar]
- Ippoliti, L.; Berten, O. Influence of inlet piping conditions on the performance of an aircraft engine lubrication system pump. In Proceedings of the 9th National Congress on Theoretical and Applied Mechanics, Brussels, Belgium, 9–11 May 2012. [Google Scholar]
- Gamez-Montero, P.J.; Bernat-Maso, E. Taguchi techniques as an effective simulation-based strategy in the design of numerical simulations to assess contact stress in gerotor pumps. Energies. 2022, 15, 7138. [Google Scholar]
- Liu, Y.; Huang, L.; Xu, J.; Wang, Y. Analysis of flow field characteristics of cycloidal pump based on fluid solid interaction. J. Braz. Soc. Mech. Sci. Eng. 2021, 43, 465. [Google Scholar]
- Joshi, R.H.; Patel, J.N.; Patwa, K.M.; Prajapati, S.U.; Banker, V.J.; Joshi, H.B. Design and development of rotor profile for screw pump–a review. Int. J. Eng. Sci. Invent. 2020, 9, 13–19. [Google Scholar]
- Jeong, S.W.; Chung, W.J.; Kim, M.S.; Kim, M.S. Application of SolidWorks® & AMESim®—Based Updated Simulation Technique to Back-flow Analysis of Trochoid Hydraulic Pump for Lubrication. In Proceedings of the 2014 World Congress in Computer Science, Computer Engineering and Applied Computing, Las Vegas, NV, USA, 21–24 July 2014. [Google Scholar]
- Yanhua, W.; Longlong, H.; Yong, L.; Jingsong, X. Comparative analysis of cycloid pump based on CFD and fluid structure interactions. Adv. Mech. Eng. 2020, 12, 1687814020973533. [Google Scholar]
- Carconi, G.; D’Arcano, C.; Nervegna, N.; Rundo, M. Geometric Features of Gerotor Pumps: Analytic vs. CAD Methods. In Proceedings of the Bath/ASME Symposium on Fluid Power and Motion Control, Bath, UK, 12–14 September 2012. [Google Scholar]
- Ivanović, L.T.; Veličković, S.N.; Stojanović, B.Ž.; Kandeva, M.; Jakimovska, K. The Selection of Optimal Parameters of Gerotor Pump by Application of Factorial Experimental Design. FME Trans. 2017, 45, 159–164. [Google Scholar] [CrossRef]
- Kim, M.S.; Chung, W.J.; Jung, C.D.; Park, S.S.; Ahn, H.C.; Kim, H.C. On new methodology of AMESim® & CATIA® V5—Based cavitation simulation for flow rate control of trochoid hydraulic pump. In Proceedings of the 2011 International Conference on Mechatronics and Automation, Beijing, China, 7–10 August 2011. [Google Scholar]
- Ivanović, L.; Rakic, B.; Stojanovic, B.; Matejic, M. Comparative analysis of analytical and numerical calculations of contact stresses at rotational elements of gerotor pumps. Appl. Eng. Lett. 2016, 1, 1–7. [Google Scholar]
- Pareja-Corcho, J.; Moreno, A.; Simoes, B.; Pedrera-Busselo, A.; San-Jose, E.; Ruiz-Salguero, O.; Posada, J. A virtual prototype for fast design and visualization of gerotor pumps. Appl. Sci. 2021, 11, 1190. [Google Scholar] [CrossRef]
- Akerdad, M.; Aboutajeddine, A.; Elmajdoubi, M. Reverse Engineering Canvas (REC): A Visual Tool for Supporting Reverse Engineering Activities. Int. J. Interact. Des. Manuf. 2021, 15, 249–257. [Google Scholar]
- Zhang, E.; Chen, M.; Deng, B. Parametric Design on Internal Gear of Cycloid Gear Pump with NX10.0. IOP Conf. Ser. Mater. Sci. Eng. 2017, 250, 012068. [Google Scholar] [CrossRef]
- Litvin, F.L.; Ignacio, G.P.; Alfonso, F. Generalized concept of meshing and contact of involute crossed helical gears and its application. Elsevier Comput. Methods Appl. Mech. Eng. 2005, 194, 3710–3745. [Google Scholar]
- Baroiu, N.; Moroșanu, G.A.; Teodor, V.G.; Crăciun, R.S.; Păunoiu, V. Use of reverse engineering techniques for inspecting screws surfaces of a helical hydraulic pump. Int. J. Mod. Manuf. Technol. 2022, XIV, 20–29. [Google Scholar] [CrossRef]
- Berbinschi, S.; Teodor, V.; Baroiu, N.; Oancea, N. Profiling methodology for side mill tools for generation of helical compresor rotor using reverse engineering. Ann. Dun. Jos Univ. of Galati. 2011, V, 111–116. [Google Scholar]
- Baroiu, N.; Berbinschi, S.; Teodor, V.G.; Susac, F.; Oancea, N. The complementary graphical method used for profiling side mill for generation of helical surface. IOP Conf. Ser. Mater. Sci. Eng. 2017, 227, 012013. [Google Scholar]
- Baroiu, N.; Moroşanu, G.A.; Teodor, V.G.; Oancea, N. Roller profiling for generating the screw of a pump with progressive cavities. Inventions. 2021, 6, 34. [Google Scholar] [CrossRef]
- ATOS Core in Use with GOM Scan Software. Available online: https://www.youtube.com/watch?v=751kz4SF7ME (accessed on 15 March 2023).
- Oprean, A.; Marin, V.; Dorin, A. Acționări Hidraulice (Hydraulic Drives); Tehnică: Bucharest, Romania, 1976. [Google Scholar]
- Galluzzi, R.; Xu, Y.; Amati, N.; Tonoli, A. Optimized design and characterization of motor-pump unit for energy-regenerative shock absorbers. Appl. Energy 2018, 210, 16–27. [Google Scholar]
- Oancea, N. Surfaces Generation through Winding; Galati University Press: Galati, Romania, 2004; Volume I–III. [Google Scholar]
- Costin, G.A.; Teodor, V.G.; Oancea, N. “Virtual Pole” method applied at the profiling of the rotary cutter tool for processing of ball screw. IOP Conf. Ser. Mater. Sci. Eng. 2020, 916, 012022. [Google Scholar]
- Costin, G.A.; Teodor, V.G.; Oancea, N. The Virtual Pole method—An alternative method for profiling tools which generate by enwrapping. Ann. of Dun. Jos Univ. Galati. 2019, V, 31–34. [Google Scholar]


| X [mm] | Y [mm] |
|---|---|
| −16.26 | 0 |
| −16.2964 | 1.122976 |
| −16.4052 | 2.241001 |
| −16.5857 | 3.34923 |
| −16.8364 | 4.443046 |
| −17.1556 | 5.518244 |
| −17.5408 | 6.571349 |
| −17.9893 | 7.600286 |
| −18.4988 | 8.606171 |
| −19.0703 | 9.599994 |
| −19.7401 | 10.66095 |
| φ2 [°] | Initial S [mm2] | Initial d— Left [mm] | Initial d— Right [mm] | Redesigned S [mm2] | Redesigned d— Left [mm] | Redesigned d— Right [mm] |
|---|---|---|---|---|---|---|
| 0° | 199.983 | 0.366 | 0.363 | 224.089 | 0.106 | 0.106 |
| 30° | 183.651 | 0.289 | 0.437 | 204.739 | 0.012 | 0.238 |
| 60° | 140.856 | 0.328 | 0.449 | 153.756 | 0.047 | 0.233 |
| 90° | 87.181 | 0.461 | 0.392 | 89.807 | 0.182 | 0.108 |
| 120° | 41.141 | 0.484 | 0.259 | 36.575 | 0.259 | 0.061 |
| 150° | 16.8 | 0.412 | 0.143 | 10.382 | 0.181 | 0.06 |
| 180° | 10.533 | 0.383 | 0.39 | 4.282 | 0.073 | 0.07 |
Disclaimer/Publisher’s Note: The statements, opinions and data contained in all publications are solely those of the individual author(s) and contributor(s) and not of MDPI and/or the editor(s). MDPI and/or the editor(s) disclaim responsibility for any injury to people or property resulting from any ideas, methods, instructions or products referred to in the content. |
© 2023 by the authors. Licensee MDPI, Basel, Switzerland. This article is an open access article distributed under the terms and conditions of the Creative Commons Attribution (CC BY) license (https://creativecommons.org/licenses/by/4.0/).
Share and Cite
Baroiu, N.; Teodor, V.G.; Păunoiu, V.; Moroșanu, G.-A.; Dumitrescu, I.-C. Reverse Engineering Used to Profile a Gerotor Pump Rotor. Appl. Sci. 2023, 13, 11069. https://doi.org/10.3390/app131911069
Baroiu N, Teodor VG, Păunoiu V, Moroșanu G-A, Dumitrescu I-C. Reverse Engineering Used to Profile a Gerotor Pump Rotor. Applied Sciences. 2023; 13(19):11069. https://doi.org/10.3390/app131911069
Chicago/Turabian StyleBaroiu, Nicușor, Virgil Gabriel Teodor, Viorel Păunoiu, Georgiana-Alexandra Moroșanu, and Ionaș-Cătălin Dumitrescu. 2023. "Reverse Engineering Used to Profile a Gerotor Pump Rotor" Applied Sciences 13, no. 19: 11069. https://doi.org/10.3390/app131911069