Article

Power Drive Architectures for Industrial Hydraulic Axes: Energy-Efficiency-Based Comparative Analysis

Department of Mechanical and Industrial Engineering, University of Brescia, Via Branze 38, 25123 Brescia, Italy
Appl. Sci. 2023, 13(18), 10066; https://doi.org/10.3390/app131810066
Submission received: 17 August 2023 / Revised: 4 September 2023 / Accepted: 5 September 2023 / Published: 6 September 2023
(This article belongs to the Special Issue Hydraulic and Pneumatic Drives)

Abstract

:
In hydraulic systems, energy dissipation can be significant. The pressure losses that can occur in the hydraulic circuit, which are influenced by the adopted drive architecture, result in power consumption that is often significantly higher than that required by the mechanical system. This paper presents a comparative study of the energy efficiency of five common drive architectures in industrial hydraulic axes. The analysis is applied to a variable speed and force hydraulic blanking press, a fairly common industrial system, e.g., in the manufacture of semi-finished brass products. Standard, regenerative, high–low, variable-displacement pumps and variable speed drive configurations for a fixed-displacement pump were analyzed and compared. In each case, an appropriate and optimized sizing of the different components of the system was performed, and then the energy consumption was estimated for a load cycle common to all the considered cases. The results show that the choice of the power generation architecture of the hydraulic system has a very significant impact on the energy efficiency and consequently on the operating costs and the carbon footprint. The performed quantification of the potential energy efficiency of the considered drive architectures can be very useful in helping to make energy-conscious decisions.

1. Introduction

The global energy market has been experiencing a considerable growth in demand in recent years. This has been accompanied by a significant increase in sales and delivery prices and it is very likely that this trend will continue in the coming years [1]. The growing demand for energy is most evident in the industrial sector [2], where processes of various kinds are very often carried out with high or very high energy requirements [3]. The higher the power requirements of a process, the more important the optimal selection of the drive technology of the machine used to perform the task. Typically, hydraulic technology is characterized by a high power density, far exceeding that of pneumatic or electric drives [4]. Therefore, hydraulic technology is the preferred choice when the energy input in an industrial plant is high. In these circumstances, the economic savings that result from pursuing energy efficiency goals is a business priority. Energy dissipation in hydraulic systems can be significant [5]. The distributed pressure losses that may occur in the piping network or in the components of the hydraulic circuit determine upstream a pressure higher than the one actually required by the actuators, resulting in an increase in power consumed [6,7].
In addition, the architecture chosen for power generation has a very large impact on the energy efficiency of the system. For example, in many systems a significant amount of oil-hydraulic energy is dissipated between the inlet and outlet ports of the pressure relief valve when dissipative speed adjustments of the actuators are achieved [8]. This peculiarity of hydraulic technology is clearly a contributing factor to some degree of inherent inefficiency, but it also determines a significant potential for improvement that can be achieved through innovation. Therefore, hydraulic technology intended for the actuation and control of industrial machinery, is fertile ground for the development of design solutions characterized by an ever-increasing level of energy efficiency.
Control systems with low energy consumption and architectures that optimize overall efficiency have been studied and developed for hydraulic applications in industrial or mobile fields [4,5,9,10,11,12,13,14,15,16,17]. Numerous circuits for recovering energy for hydraulic devices have been studied. The most studied energy recovery circuits are based on accumulators, gas cylinders, gravity energy, flywheels, generator supercapacitors, or generator–battery circuits. The hydraulic energy regeneration system (ERS) with accumulator is ideal for machines that need to be started and stopped frequently, according to Tianliang et al. [18], who discussed various forms of ERS used in hydraulic construction equipment.
Ho and Le presented, in [19], a high efficiency hydraulic system with high efficiency that saves about 20% energy compared to systems without energy recovery. A high-pressure hydraulic accumulator, a relief valve, an AC servomotor, a fixed-displacement hydraulic pump, a hydraulic cylinder, seven directional control valves, and a tank are the main components of the system. The method uses a check valve to boost the pump and a low-pressure accumulator as the tank. The direction of flow to the pump is controlled by two check valves, and the the speed of the hydraulic cylinder is controlled by the speed regulation of the motor. The high-pressure accumulator boosts the pump and is used to store recovery energy. Due to the switching algorithm of the valves, this system can be operated in different configurations, so that it can be flexibly adapted to the desired operating requirements, e.g., high speed, or high torque, but also high effectiveness of energy recovery from the load.
Niu et al., in [11], propose an innovative multifunctional energy-saving electro-hydraulic servo system. A servomotor actuates the pump with a pressure control, two proportional valves, and four switches, the settings of which allow the selection of three different control modes: independent single-valve control (SI), separate meter in and separate meter out control (SMISMO), and parallel dual valve control (DP). The supply pressure is controlled by a disturbance observer and the supply flow is controlled by a gray predictor. Experiments have shown that supply pressure and flow losses can be reduced, resulting in energy savings.
In [20], Schmidt and Hansen present the concept of connecting multi-cylinder/motor drives as a variable-speed drive network. Electrically and hydraulically interconnected variable-speed displacement units allow the complete elimination of throttle elements, and the sharing of auxiliary functions and fluid reservoirs, as well as hydraulic and electrical power.
Xu et al., presented, in [4], an analytical technique based on a mathematical energy dissipation model of hydraulic components to calculate the energy dissipation of the system by building a high-precision simulation model. They applied the method to a 10,000 kN fine blanking press.
To determine the cause of the low energy efficiency in large and medium-sized hydraulic presses, Zhao et al. [21] suggested an analytical method to quantify the energy flow in the system. Starting from the basic formula of energy consumption, they determined a limited number of unknown coefficients whose values can be estimated by experiments.
Based on a study of the energy flow characteristics of the hydraulic system, Li et al. [15] propose an energy-saving strategy by balancing the load of the press operations. The method is to share the motor pumps of the drive system at different times with a unit consisting of two hydraulic presses to minimize the energy loss during unloading operations. These two presses are also coupled, and during certain operations, the excess energy from one press can be used as input energy for the other to increase the efficiency of the drive system. In addition, the potential energy can also be used directly. To supply energy to both hydraulic presses, the drive systems of the two presses are combined into one combined drive system (CDS). Presses 1 and 2 receive energy from each motor-pump of the combined drive system at specific times, with each motor-pump being controlled separately.
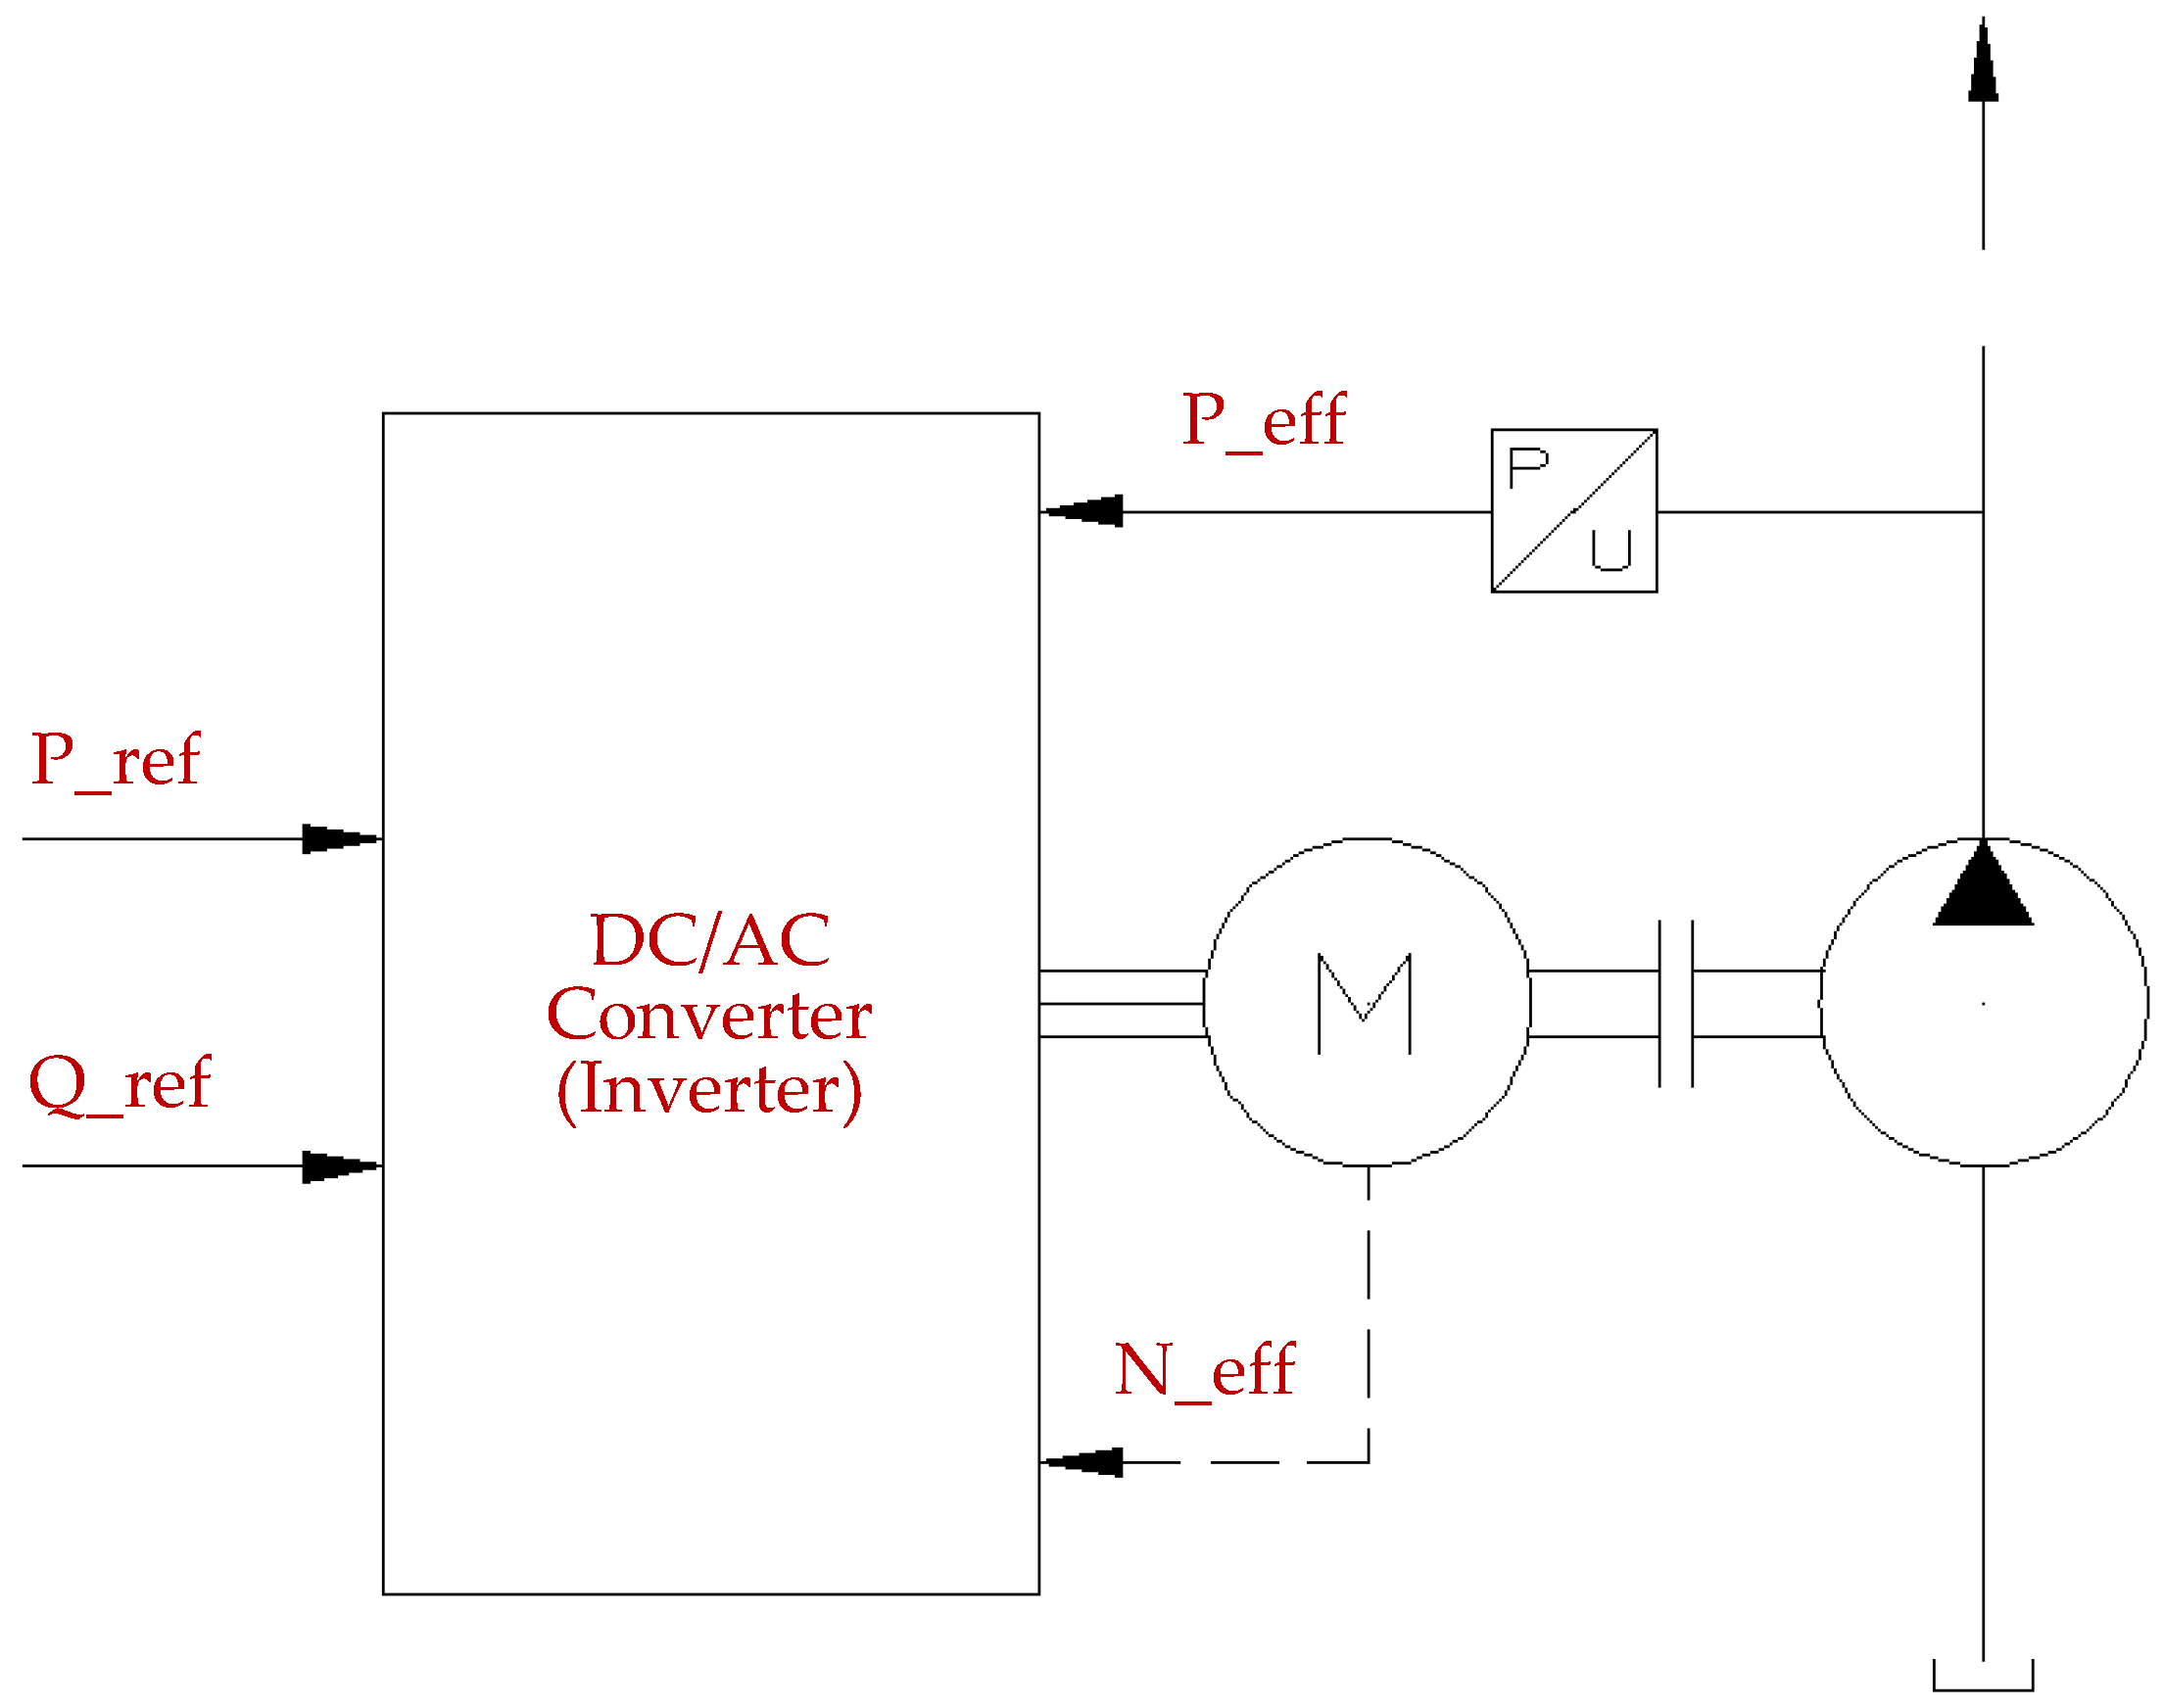
A direct-drive pump-controlled hydraulic (DCP) system, characterized by a closed circuit type, speed-controlled electric servomotor, and fixed-displacement pump, was studied by Koitto et al. [14] for a stationary industrial material-handling application that sequentially lifts and lowers a fixed mass. Energy savings ranged from 53 to 87% compared to a conventional valve-controlled approach. Although the actuator tended to vibrate when reaching the desired position and the system pressures varied greatly as the cylinder moved, the dynamics of the system did not quite meet the stated requirements.
Some recent studies are concerned with the theoretical or experimental determination of the efficiency of hydraulic components or systems. Zhang et al. [22] propose a new method for calculating the volumetric efficiency and hydraulic efficiency of centrifugal pumps based on the principle of energy balance. Using a low-specific-speed centrifugal pump pumping media with different viscosities, two efficiencies are calculated at the points with the best efficiency and compared with those of two existing methods. Benić et al. [23] performed a detailed analysis of energy efficiency between a direct-drive hydraulic system (DDH) and a proportional electro-hydraulic system. The analysis was based on experimental results. They concluded that the efficiency of the DDH system with a fully loaded cylinder was 28%, while the efficiency of the proportional electro-hydraulic system was 4%. Rana et al. [9] studied the effect of the bypass valve in a conventional lifting system with a vertical servohydraulic cylinder and experimentally compared the improvement in energy efficiency. The study found that the energy efficiency is higher at low pressure and gradually decreases when the operating pressure becomes high. The energy efficiency is inversely proportional to the operating pressure for the larger load. When the weight of the cylinder load is doubled, the energy efficiency also increases. Maximum energy efficiency can be achieved by keeping the pressure as low as possible to overcome gravity, and the required speed can be achieved by maintaining the maximum load on the cylinder.
Studies have also been conducted in the industrial sector to increase the energy efficiency of hydraulic injection molding machines (HIMMs). Clamping force control (FC) requires a high pressure but a low flow rate, so only a small amount of energy is needed. Widely used hydraulic valve-controlled cylinder systems, in which the maximum supply pressure is set with a relief valve and constant-displacement pumps, offer good servo control performance but poor energy efficiency. To increase energy efficiency, energy-saving control methods based on an electro-hydraulic variable-displacement pump system (EHVDPS), such as load-sensing control (LSC) and constant supply pressure control (CSPC) are used. From the studies of Chiang et al. [24], it emerged that the energy consumptions of (FC + LSC) and (FC + CSP) are 17.9 and 67.4% of the input energy of the EHVDPS method, respectively.
Table 1 summarizes solutions presented in the literature for energy saving in industrial hydraulic applications.
The high power-to-weight ratio and increasing miniaturization of components make hydraulics increasingly suitable for applications in robotics: in exoskeletons [25,26], in humanoid, bipedal, or quadrupedal robots [27,28], and in industrial and collaborative robots [29]. Energy efficiency is fundamental in these systems because their autonomy must be maximized. There are numerous studies in the literature that address the energy efficiency of these systems and propose innovative implementation solutions [30,31,32].
System power consumption can also be an indicator of operating conditions. In particular, application-independent variations in power consumption can be associated with hydraulic system malfunctions [33,34,35,36,37,38]. Condition monitoring techniques based on artificial intelligence algorithms can be used to prevent system malfunction.
The following is an overview of the reviews available in the literature on hydraulic systems and their energy efficiency.
Some reviews on the energy efficiency of hydraulic systems energy can be found in the literature. Mahato et Goshal [6] provide an overview of energy-saving approaches for hydraulic drive systems. They divide the energy-saving approaches into four categories: hybridization, control algorithms, energy recovery, and energy loss reduction, and for each category they provide a detailed literature review.
Quan et al. [39] investigate direct pump control technology, that eliminates the throttle losses in the main power line and achieves high energy efficiency. Their work focuses on the system structure, control system, and derived energy recovery system.
A classification and overview of pump-controlled differential cylinder drives is given by Ketelsen et al. [40], starting with systems based on variable-displacement hydraulic pumps and vented reservoirs to more modern hydraulic system architectures based on variable-speed electric motors and sealed reservoirs. They classify the architectures discussed in the literature into some basic classes, and highlight the advantages and disadvantages of each class.
Shen et al. [41] provide an overview of common pressure rail-based hydraulic systems, that can be widely used for construction equipment. Energy savings can be achieved through the ability to maintain a high power density of the hydraulic system, elimination of throttling losses, and energy recovery from actuators.
Xu et al. [42] review the development of electro-hydraulic control valves, industry 4.0 oriented, and their related technologies. The three topics covered in this review paper are: condition sensing with sensors or indirect sensing; control approaches with digital controllers and innovative valves; and online condition monitoring through data interaction and problem detection.
Schmidt and Hansen [20] introduce the idea of electro-hydraulic variable-speed drive networks, with interconnected multi cylinder/motor drives that do not have throttle control. They discuss design considerations, integration of hydraulic accumulators, compactness of the drive, and control concepts.
An analysis of the literature shows that various solutions have been proposed in terms of plant architecture or control systems to increase the energy efficiency of hydraulic systems. However, a timely comparison of the energy consumption of the different solutions has not been investigated so far.
Analytical modeling of all phenomena involved in the operation of an oil-hydraulic drive architecture to estimate overall efficiency is complex [43]. Distributed and concentrated pressure drops, temperature-induced variations in fluid viscosity, the influence of fluid viscosity, pressure, and speed on pump volumetric hydromechanical efficiency, valve switching delay, active and reactive electric current components absorbed by the power supply (influenced by speed), and dynamic friction between the piston and cylinder body are some of the many factors that affect the operation and efficiency of a hydraulic system.
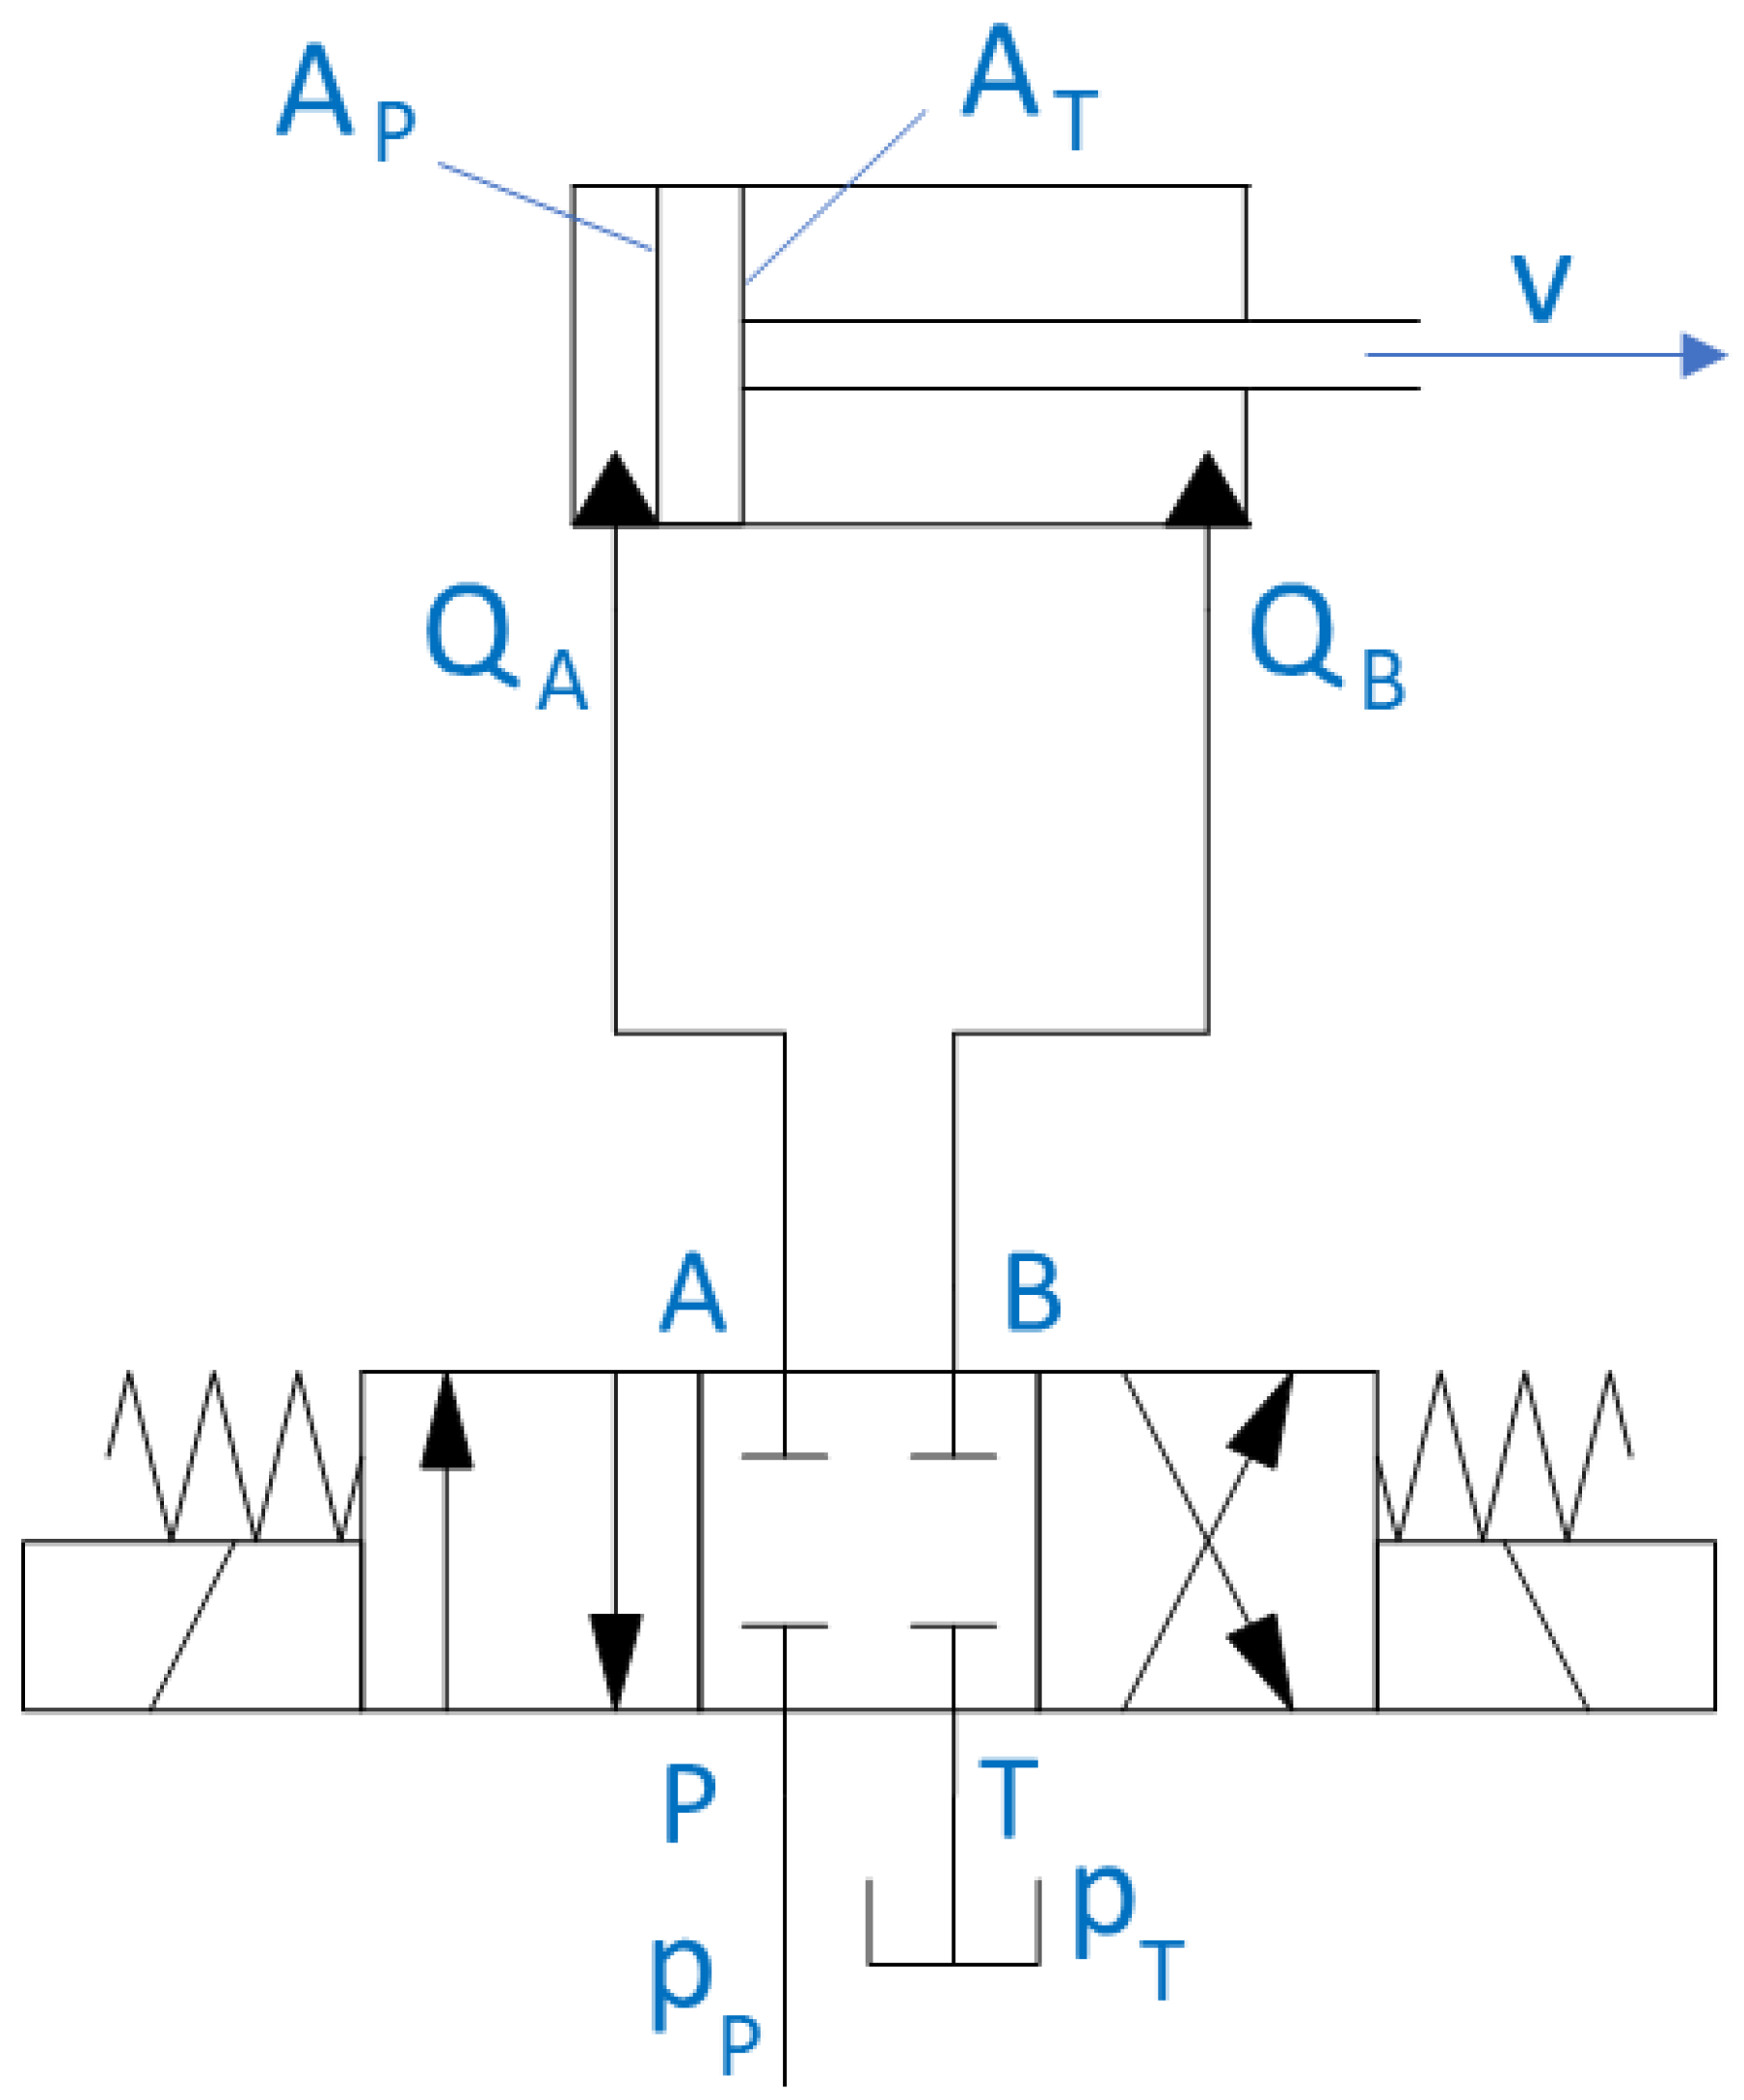
However, an estimate of energy efficiency and the impact of energy consumption on operating costs for different system architectures is information of considerable value for the design of these systems. In order to fill this gap, in the present work a comparative study is carried out in terms of the energy efficiency of different architectural solutions for the power section of a variable speed and force hydraulic blanking press, a very common industrial process, for example, in the production of semi-finished brass products. In a variable speed and force process, the flow rate and pressure of a fluid change over time, under these operating conditions, the different technical solutions that can be used for the power section have significantly different energy efficiency levels.
The energy losses that distinguish one solution from another were examined in the analysis, while the contributions common to all solutions were ignored.
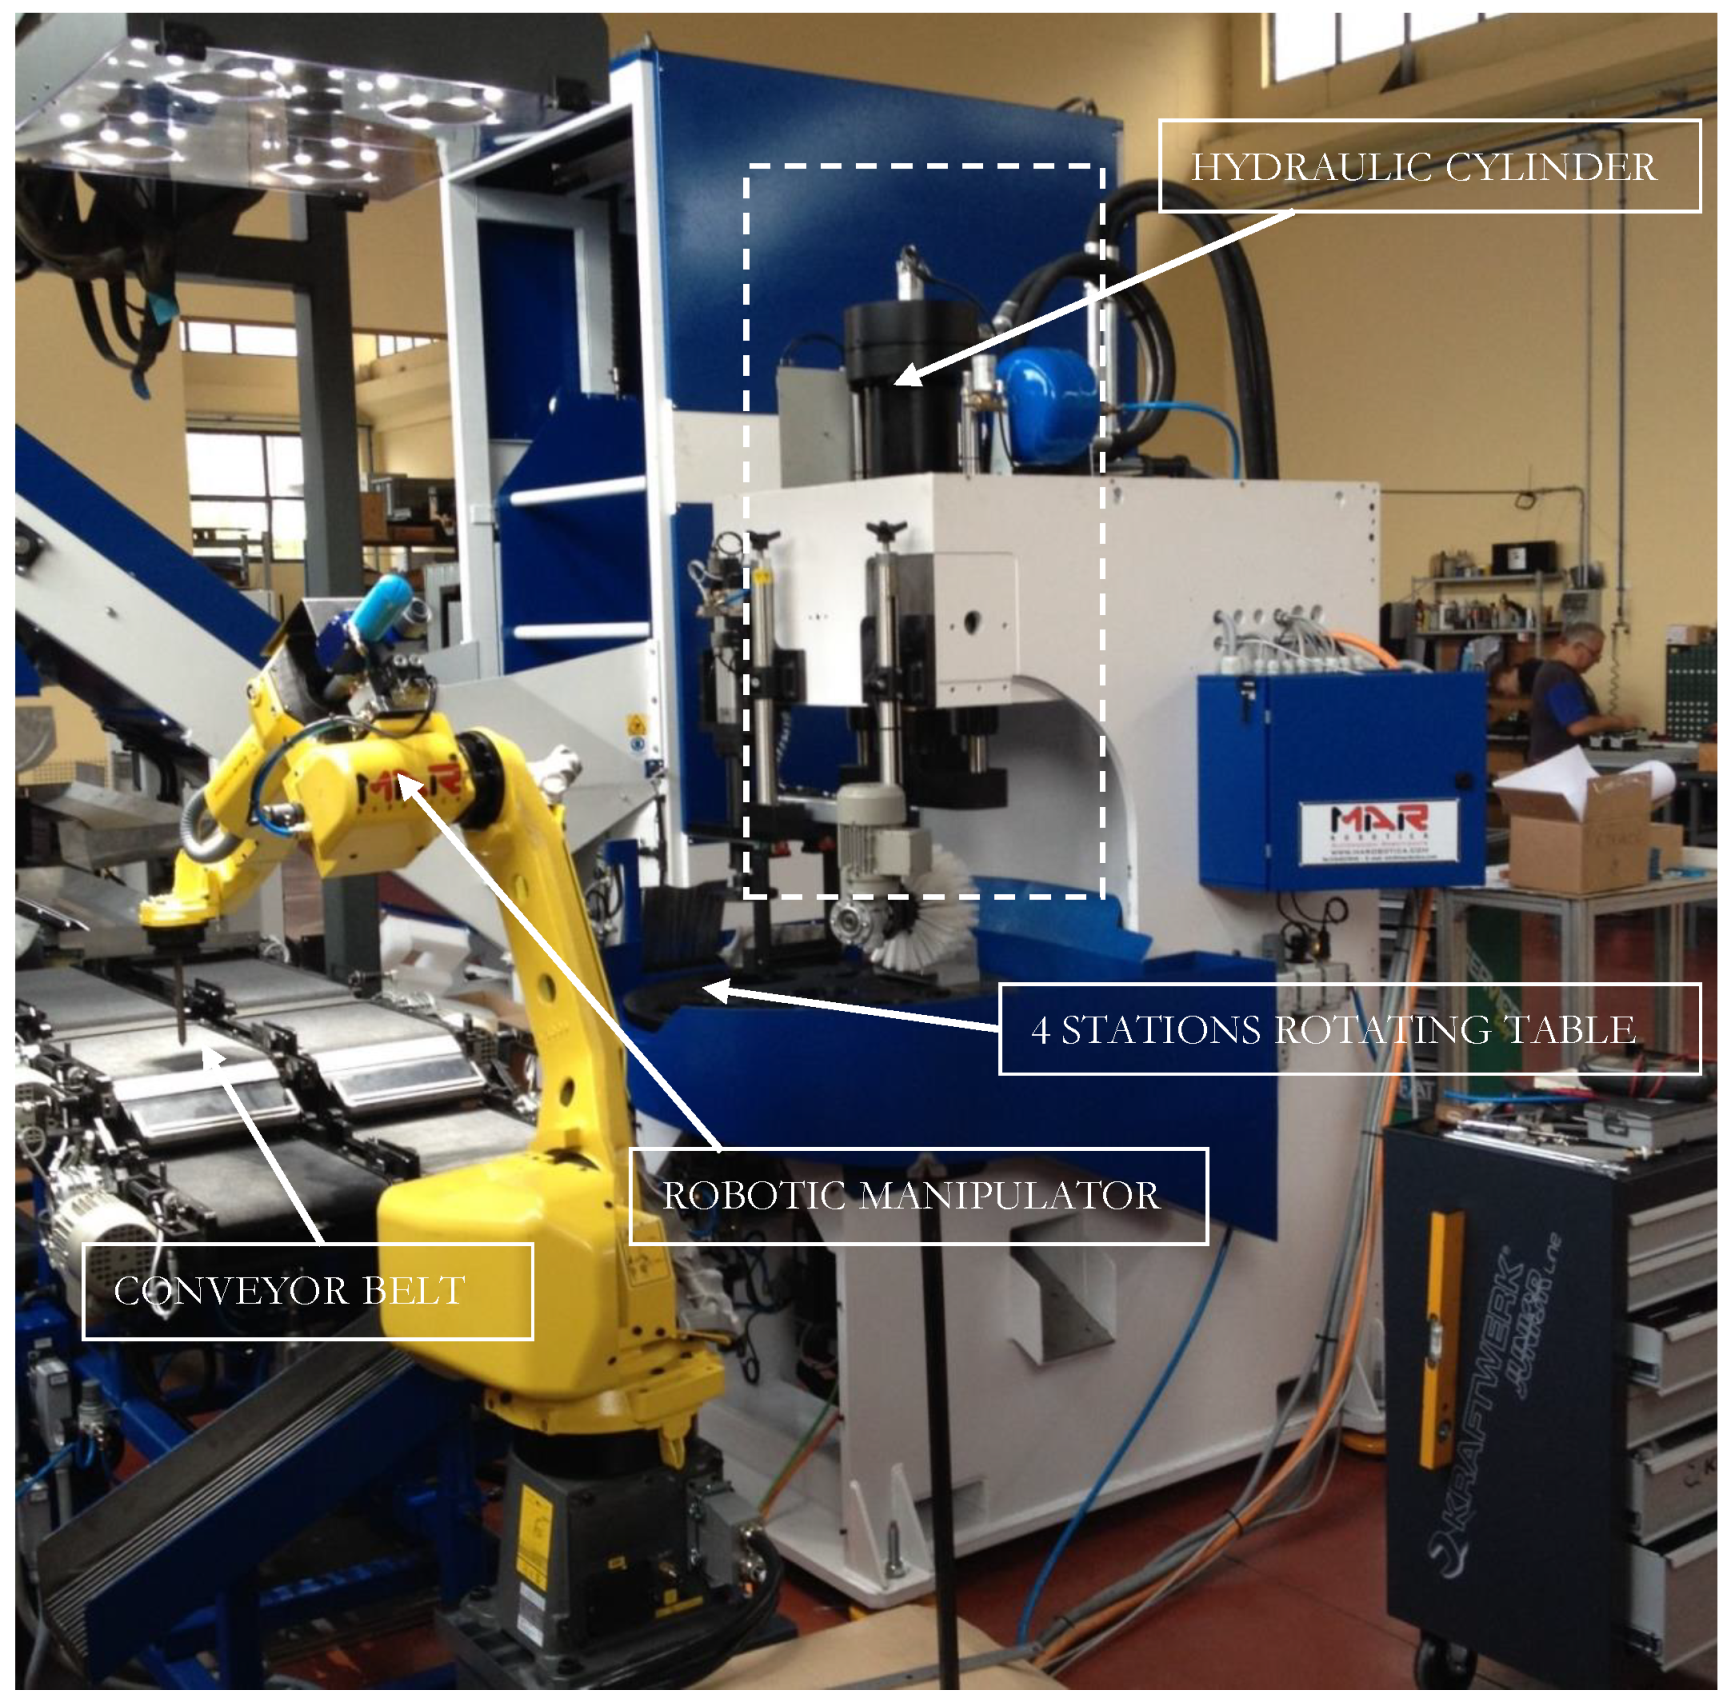
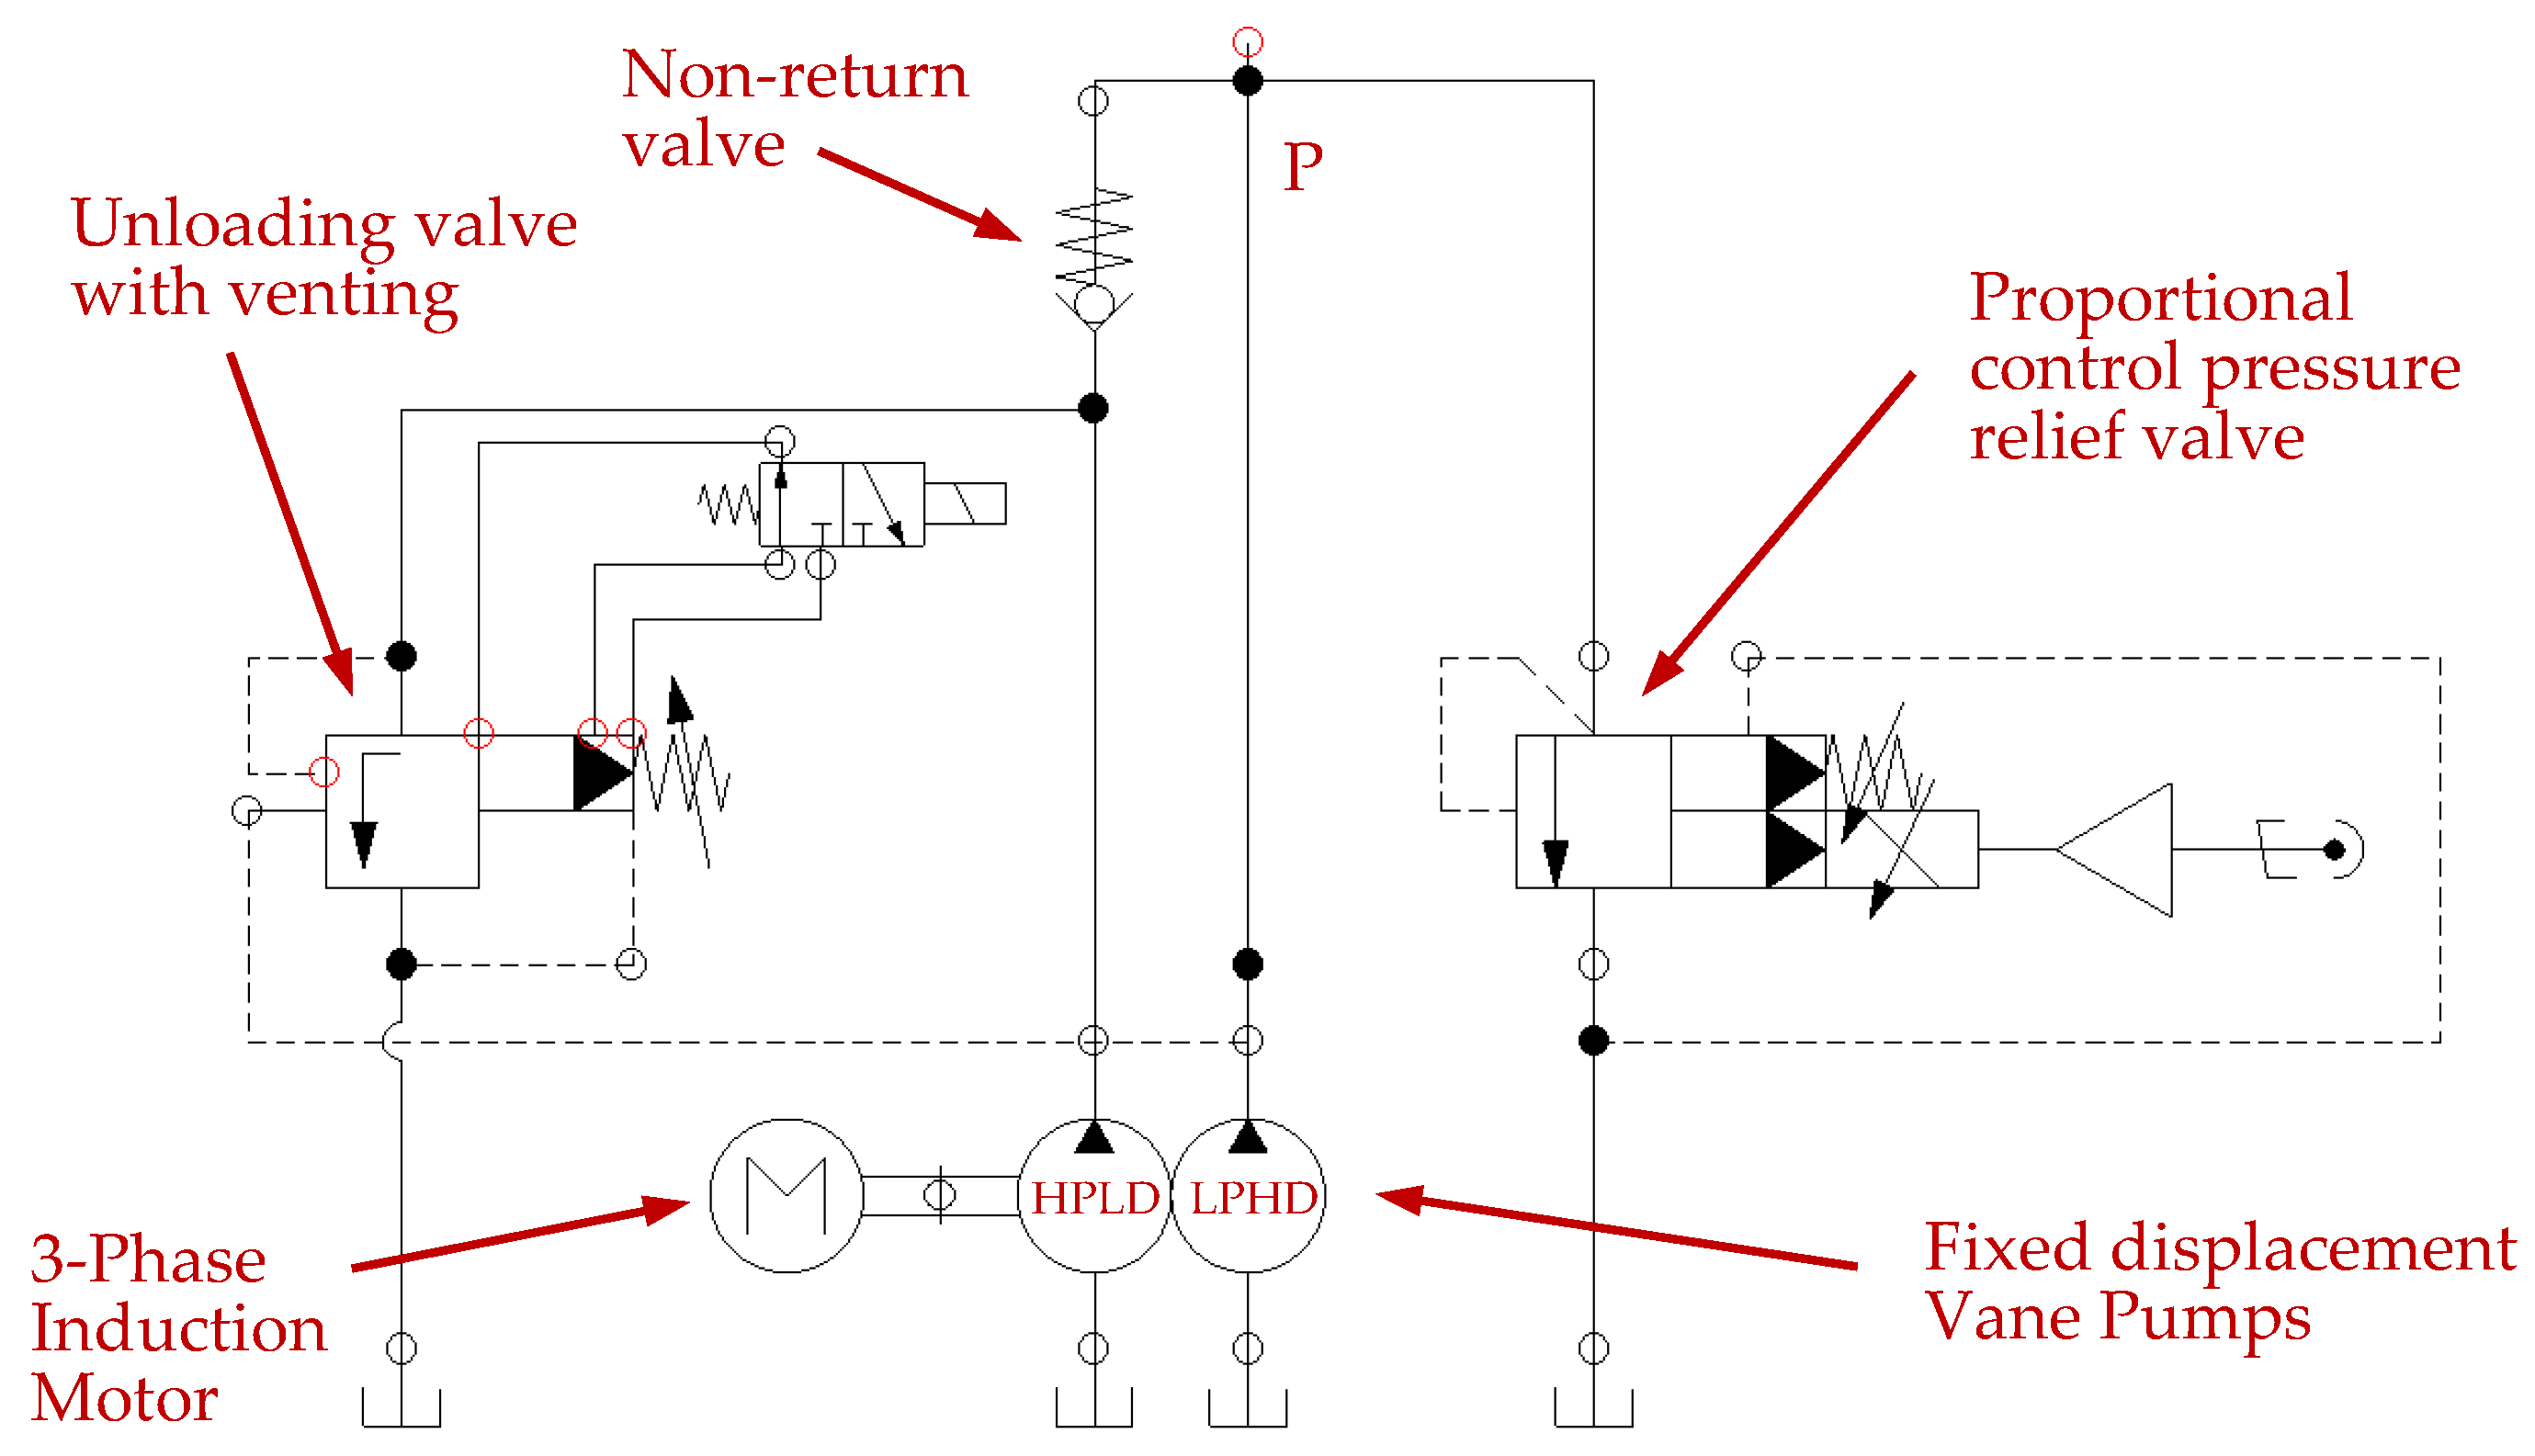
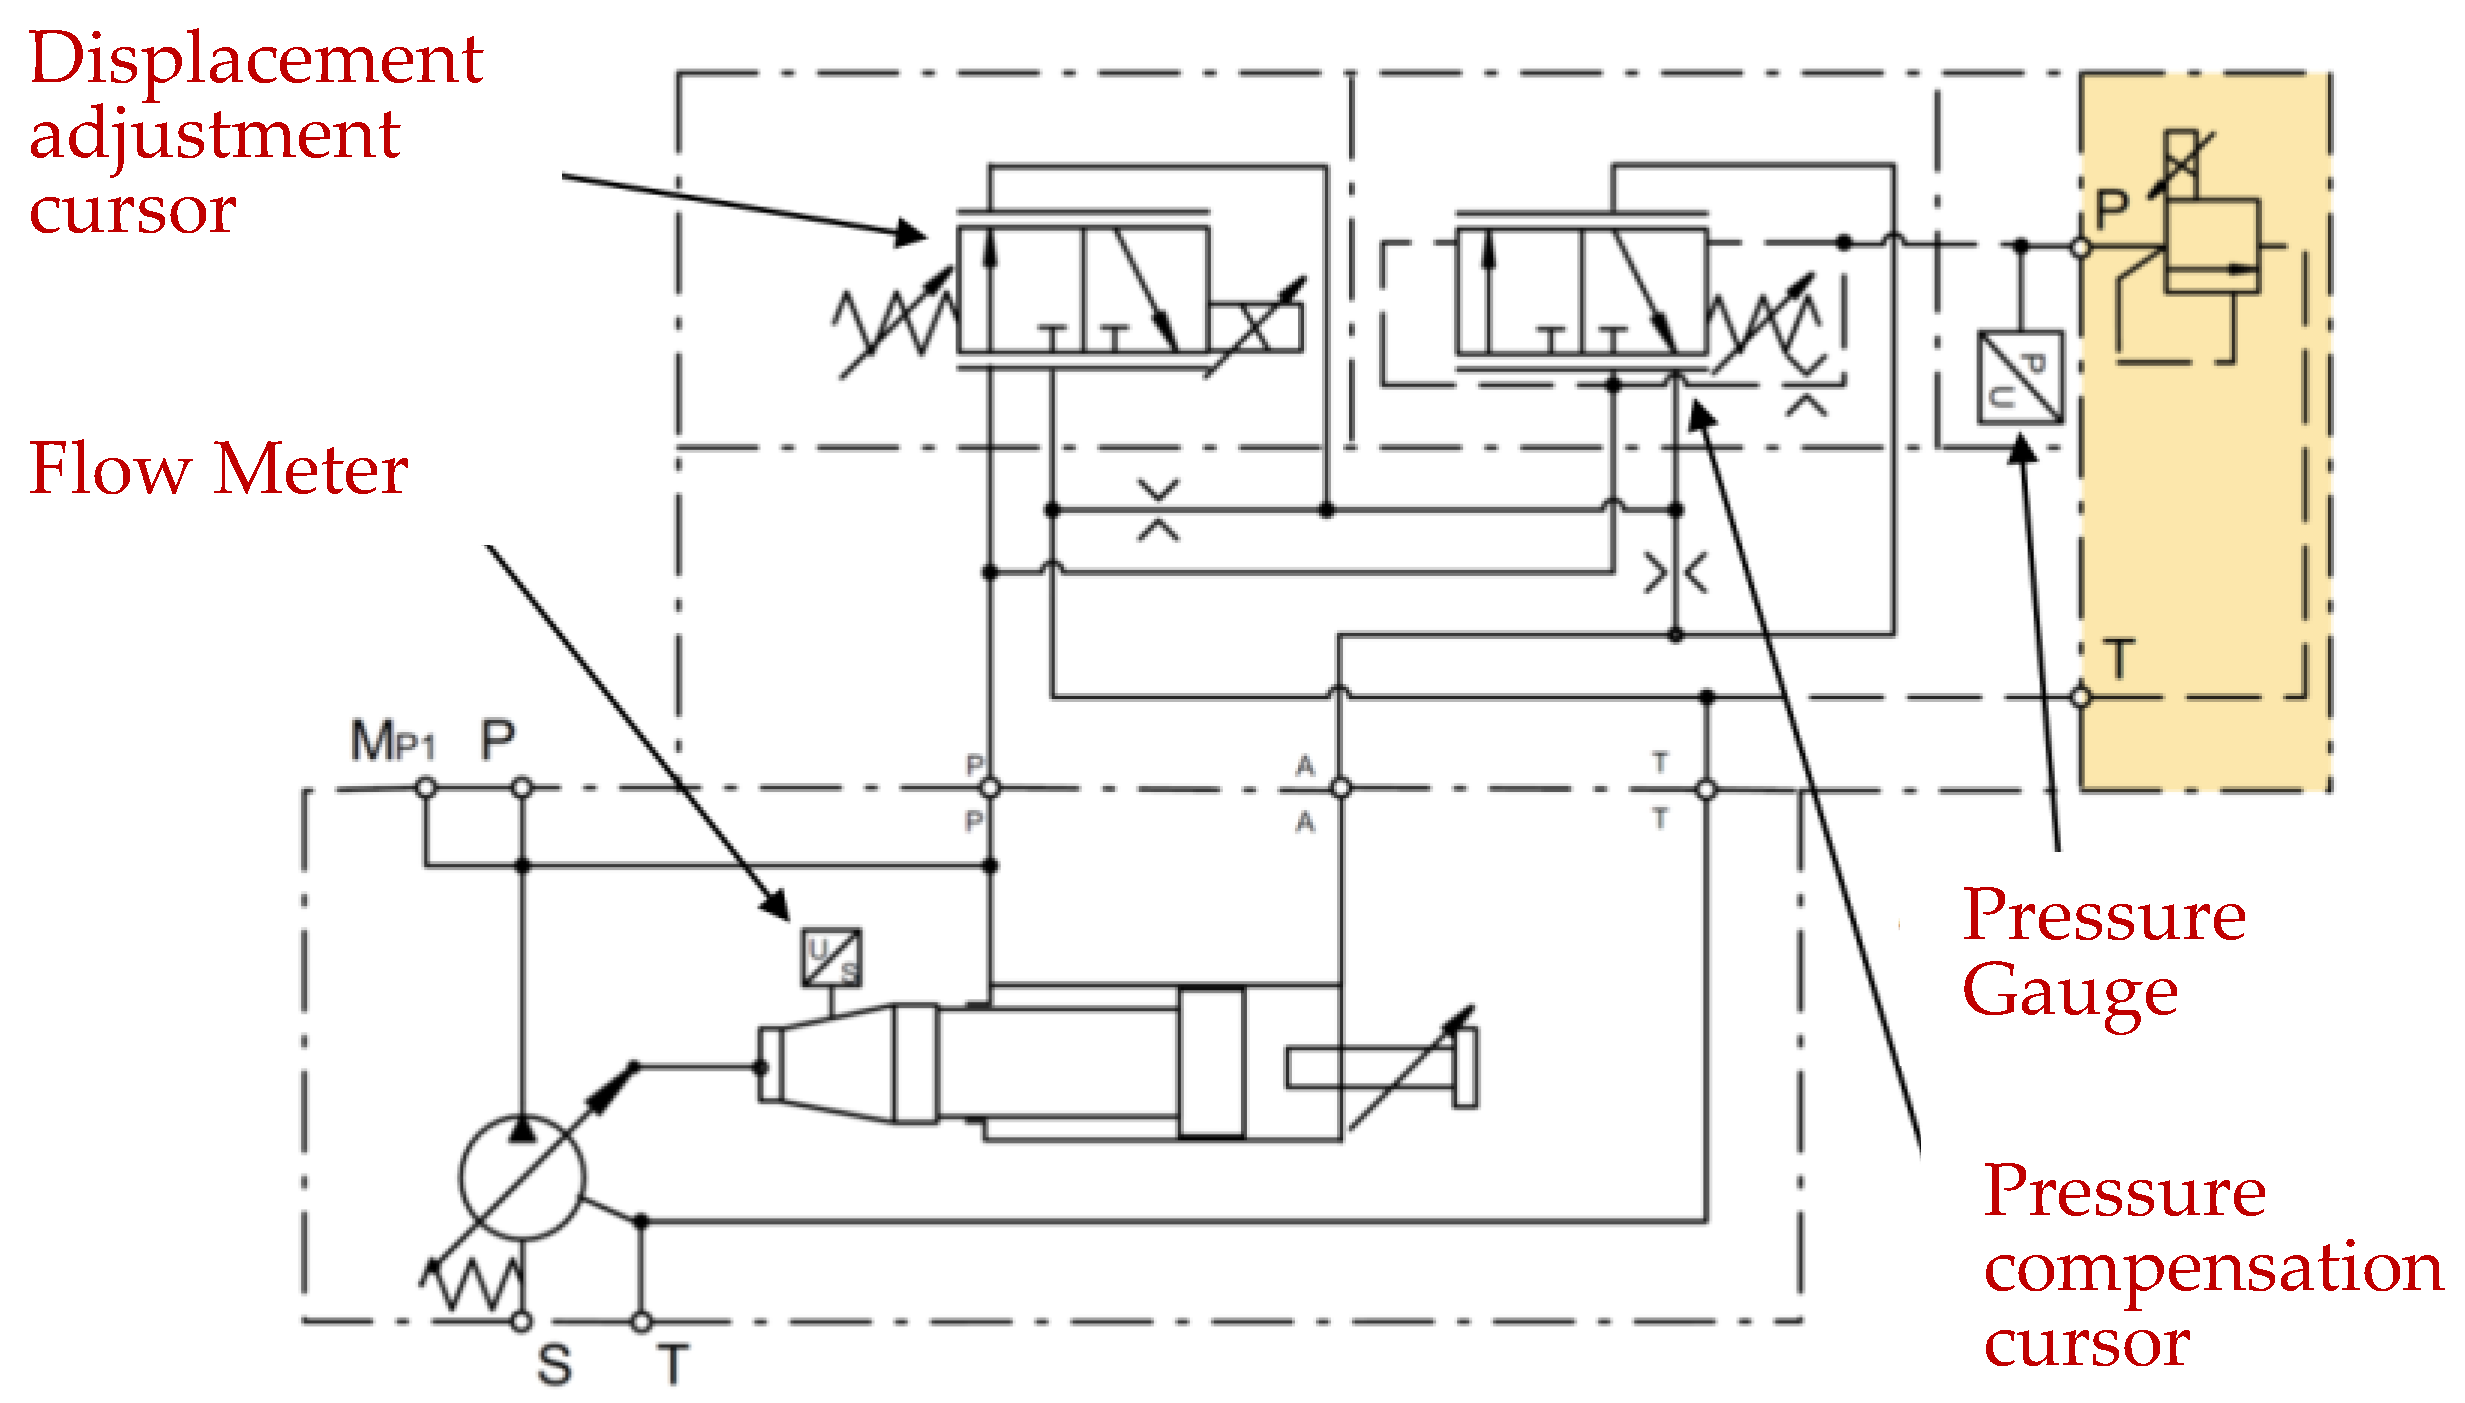
The analysis is applied to a specific industrial process, namely, the pressing of semi-finished brass products. Different hydraulic architectures are presented, all equally capable of providing the required performance, but characterized by increasingly higher energy efficiency. The different configurations analyzed, starting from a traditional hydraulic architecture with low energy efficiency, are characterized by the introduction of the regenerative technique and variations in the unit for converting electrical energy into hydraulic energy carried by the pressurized fluid.
Five configurations, whose architecture is described below and summarized in Table 2, have been analyzed and compared.
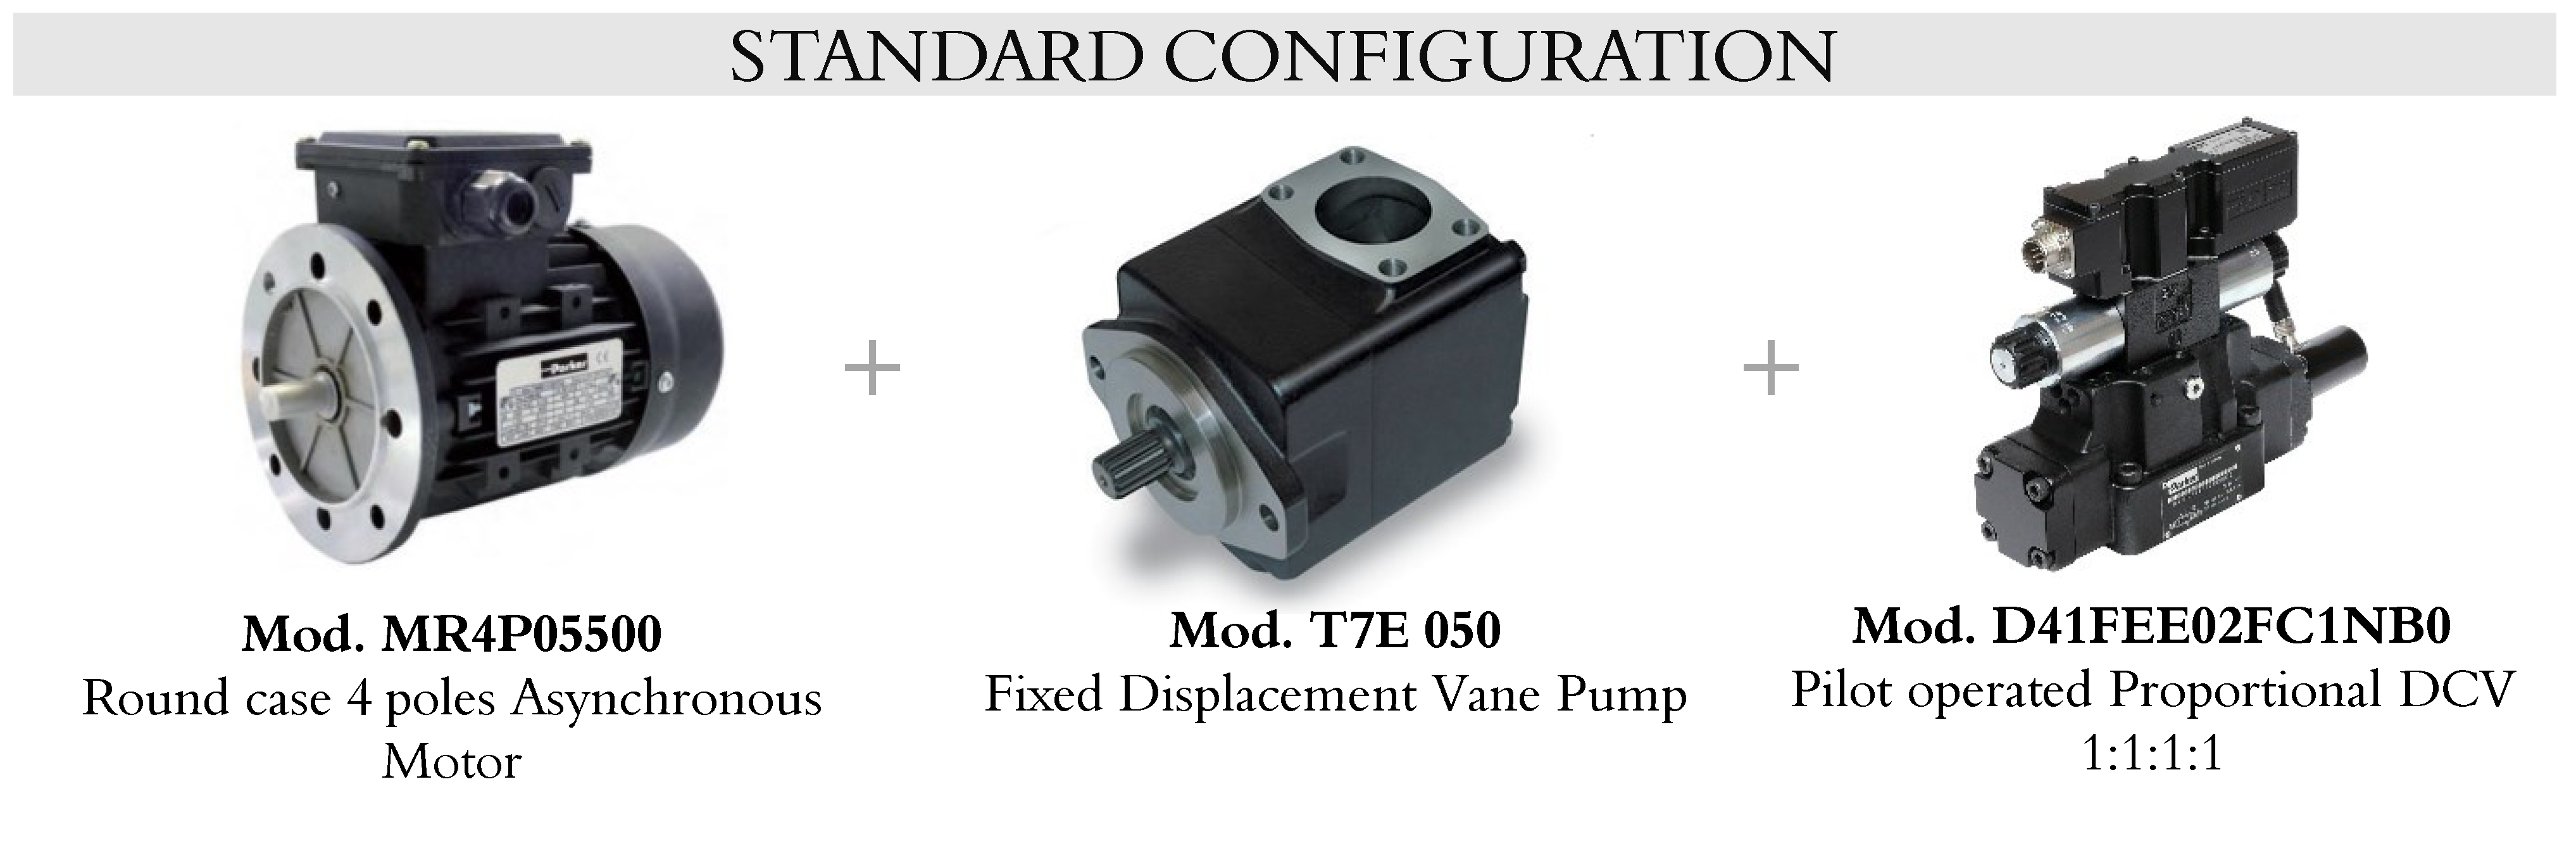
1.
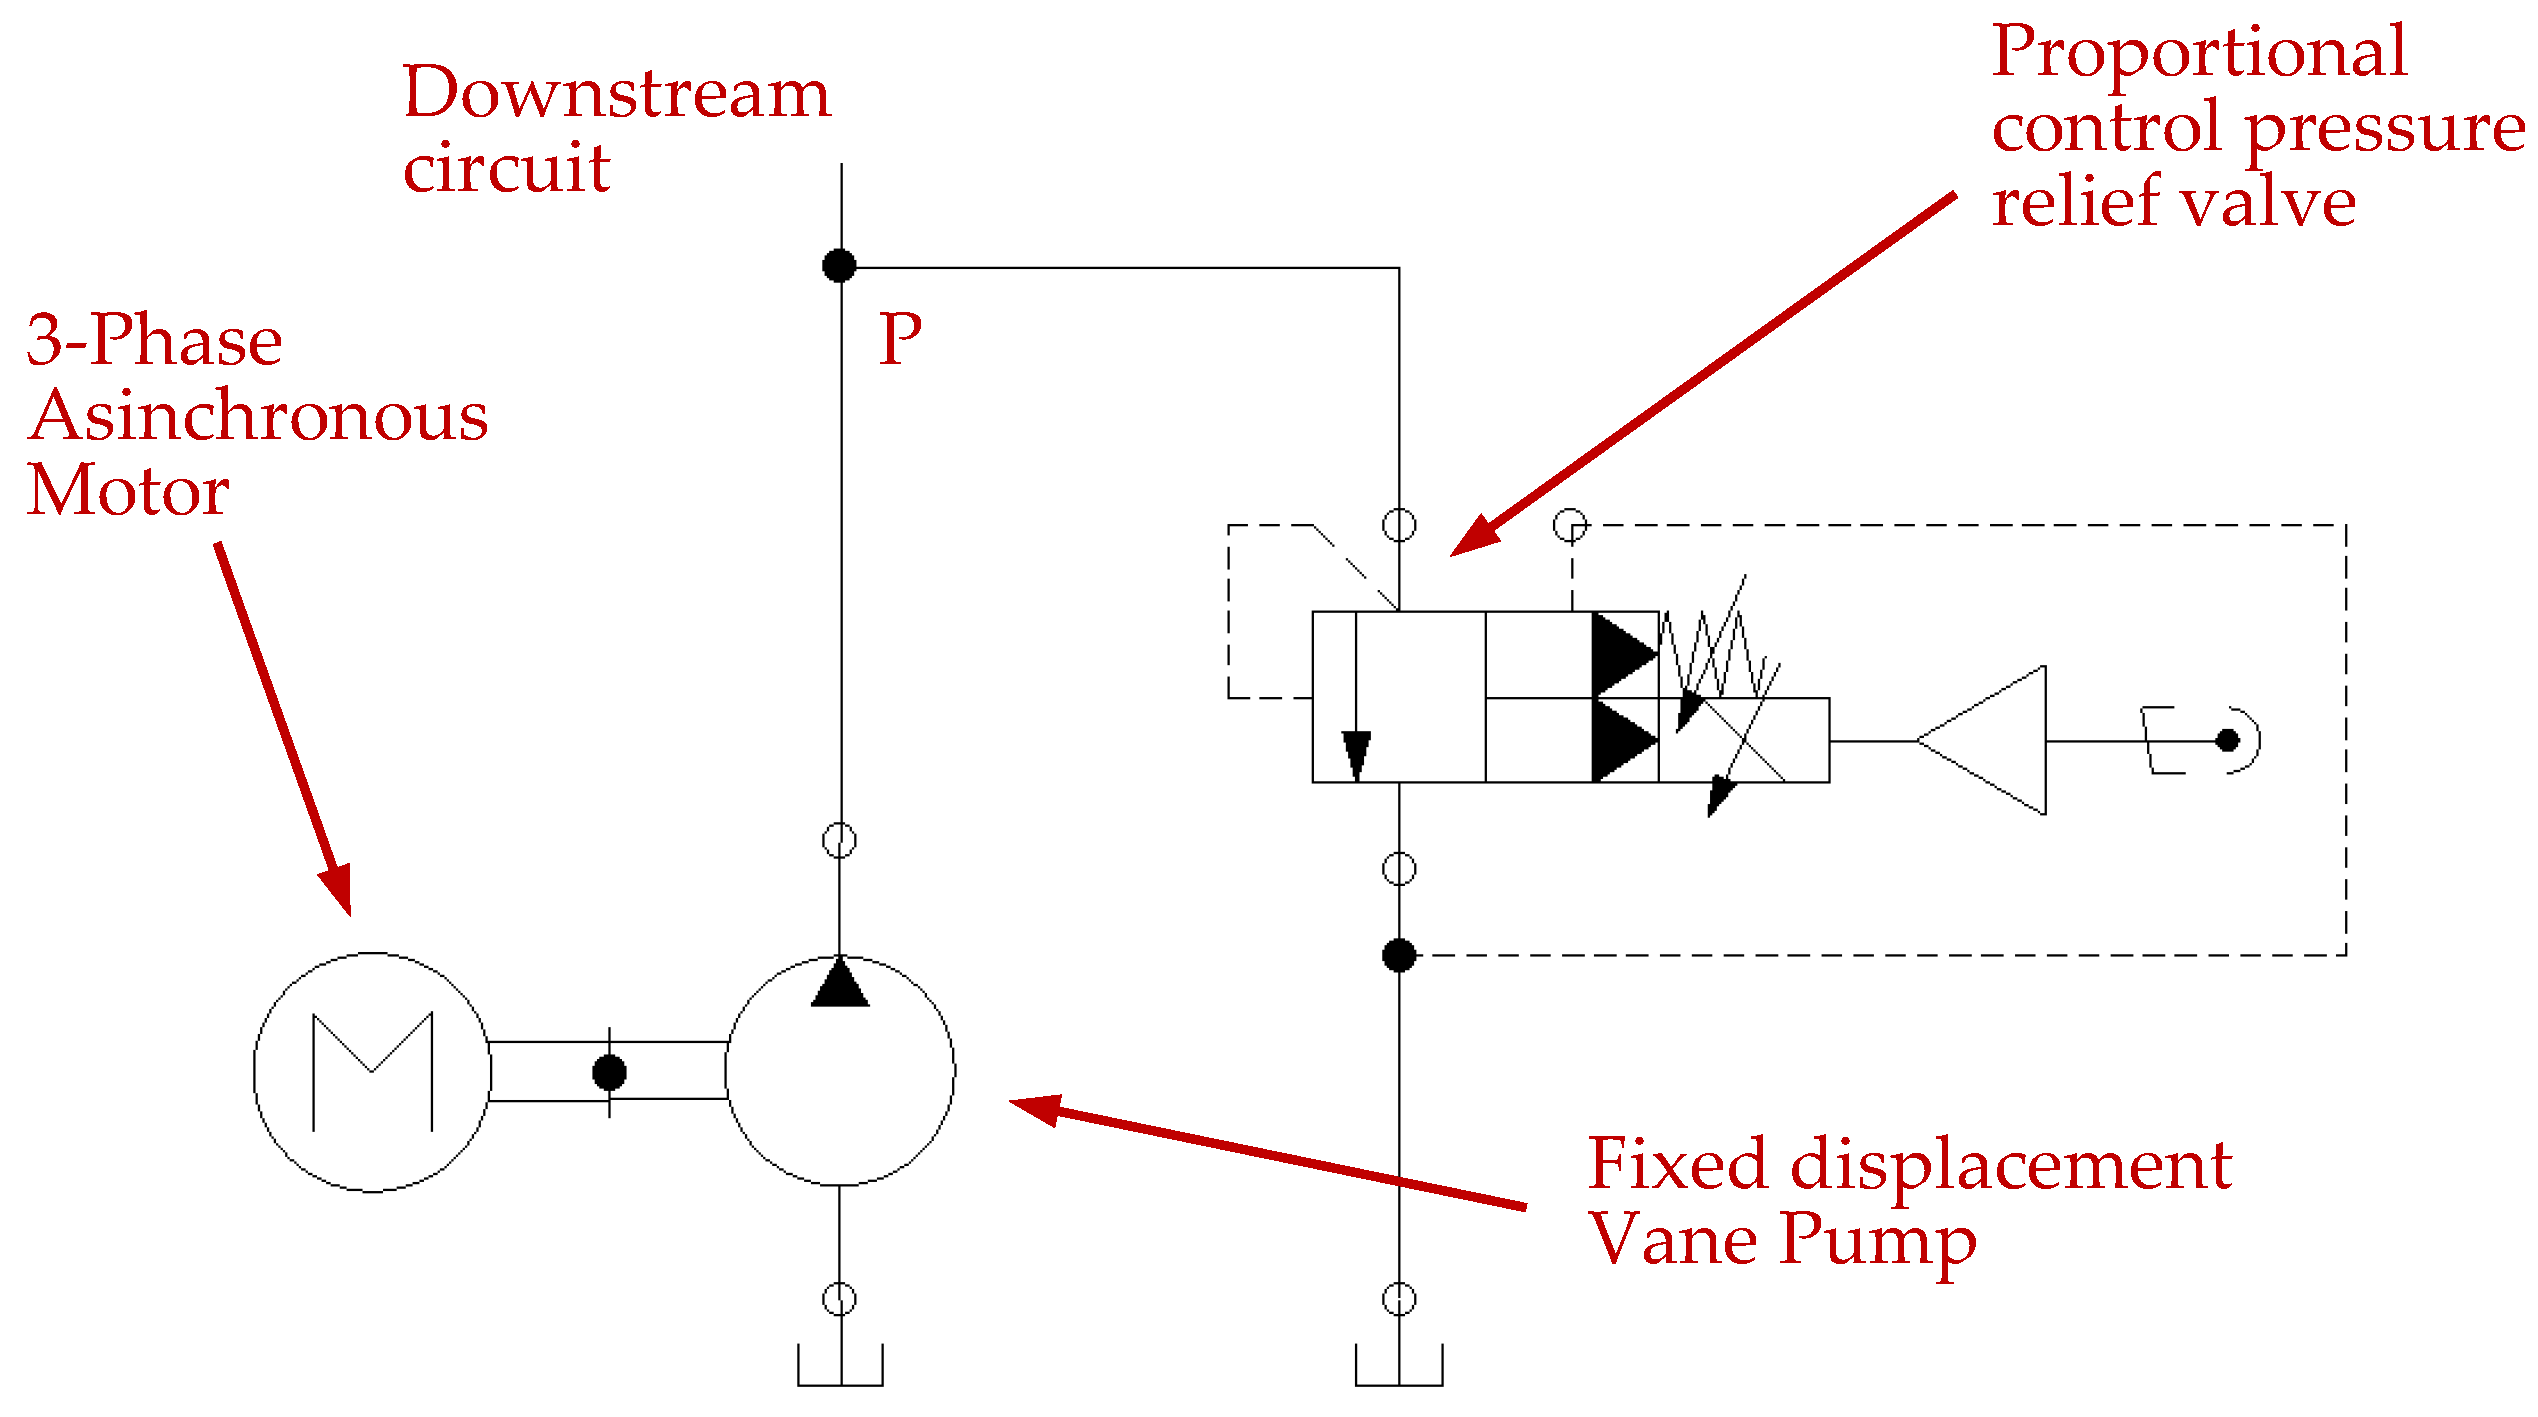
Standard configuration: traditional architecture consisting of a round-case induction electric motor, a fixed-displacement vane pump, a pressure relief valve, and a standard directional control valve (DCV).
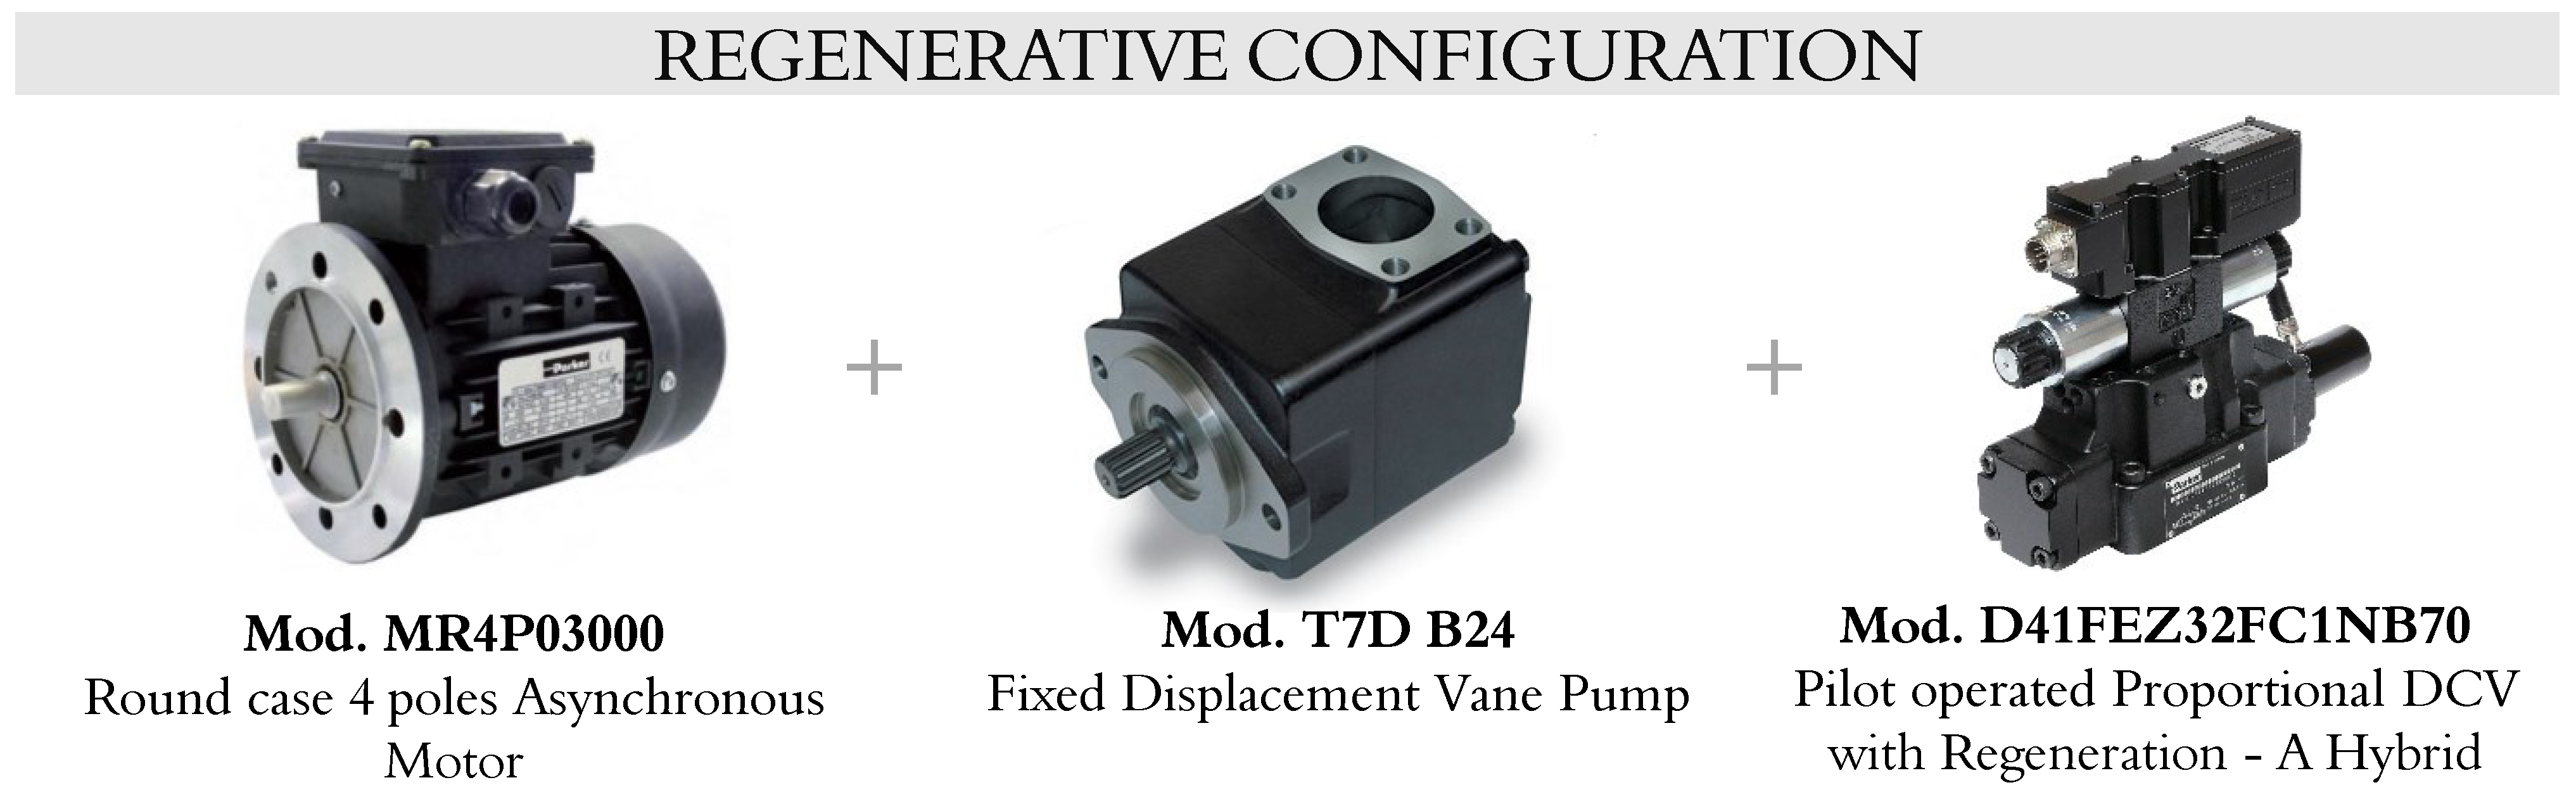
2.
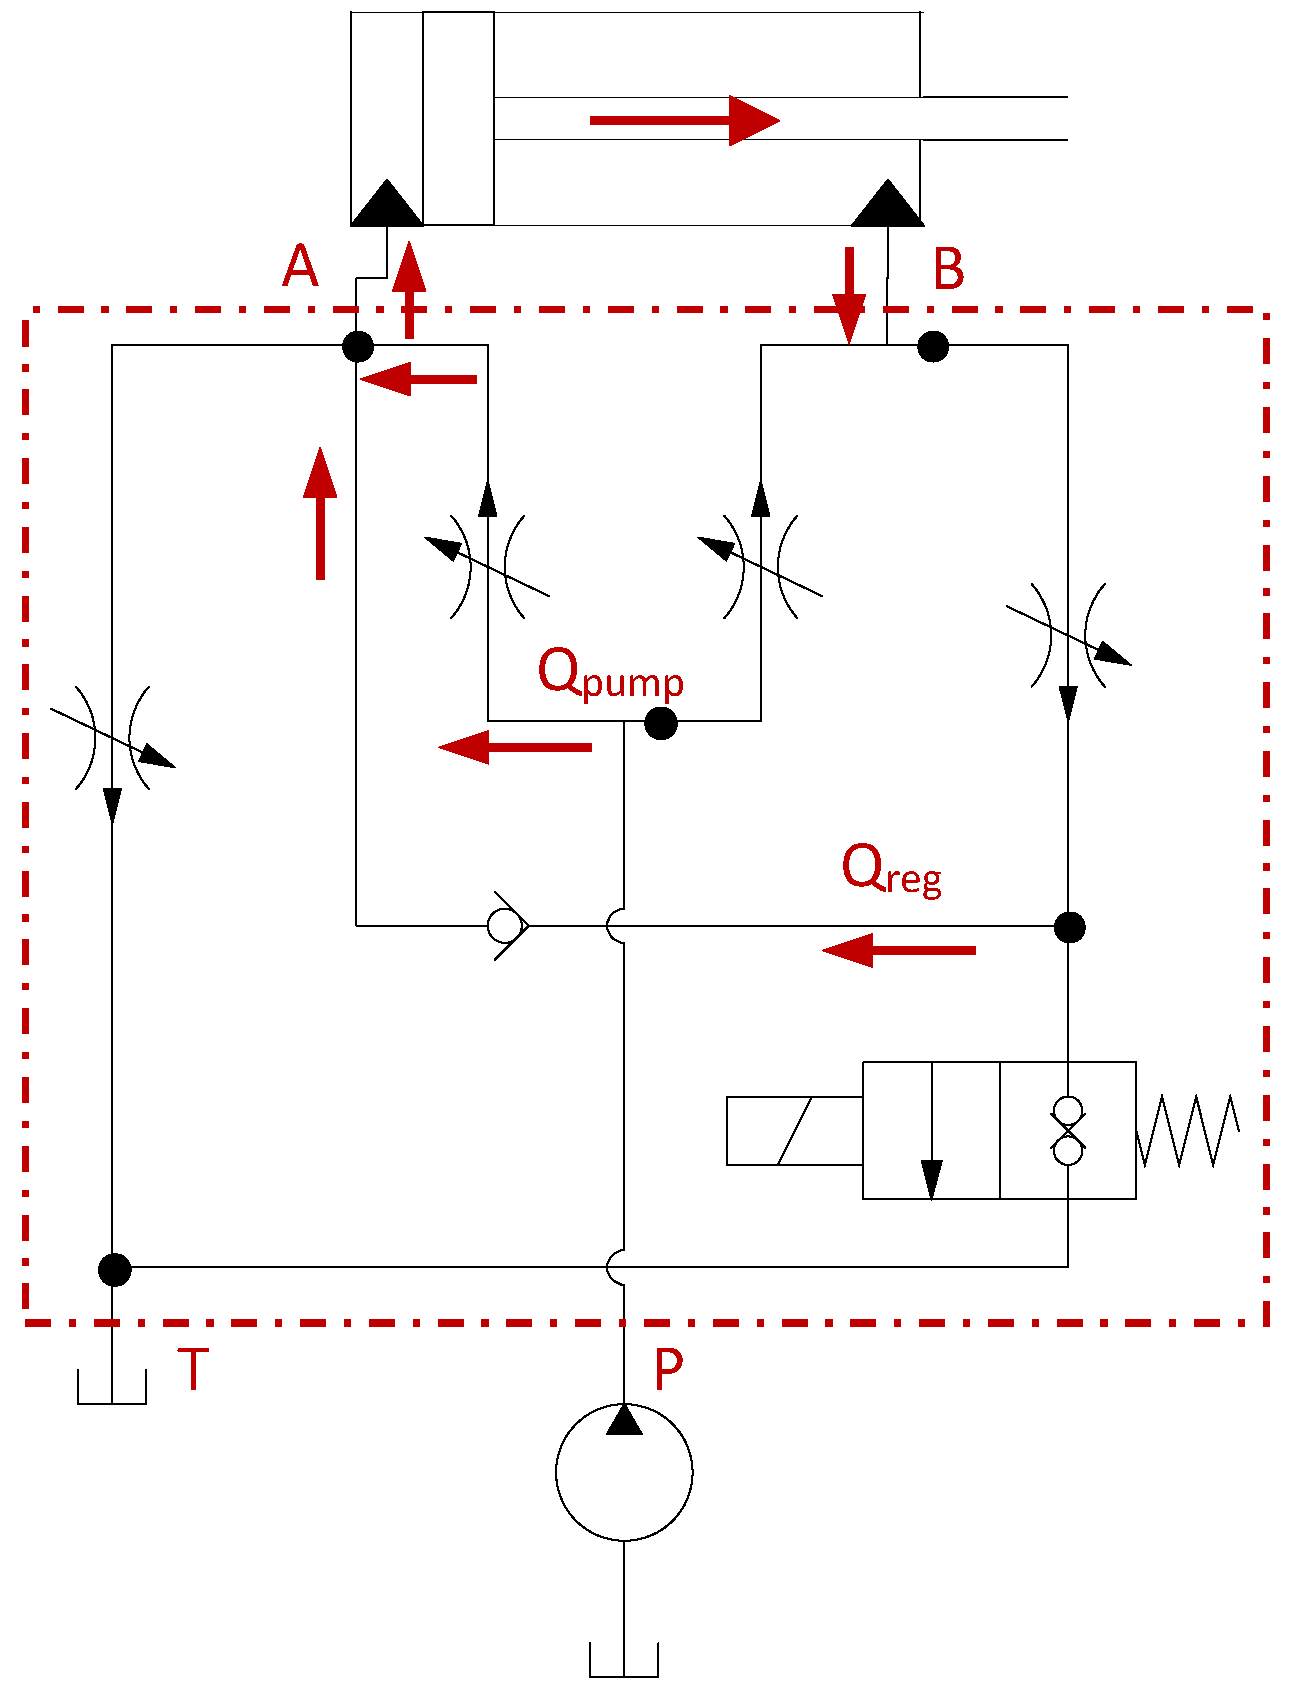
Regenerative configuration: standard configuration with DCV with regeneration A—hybrid.
3.
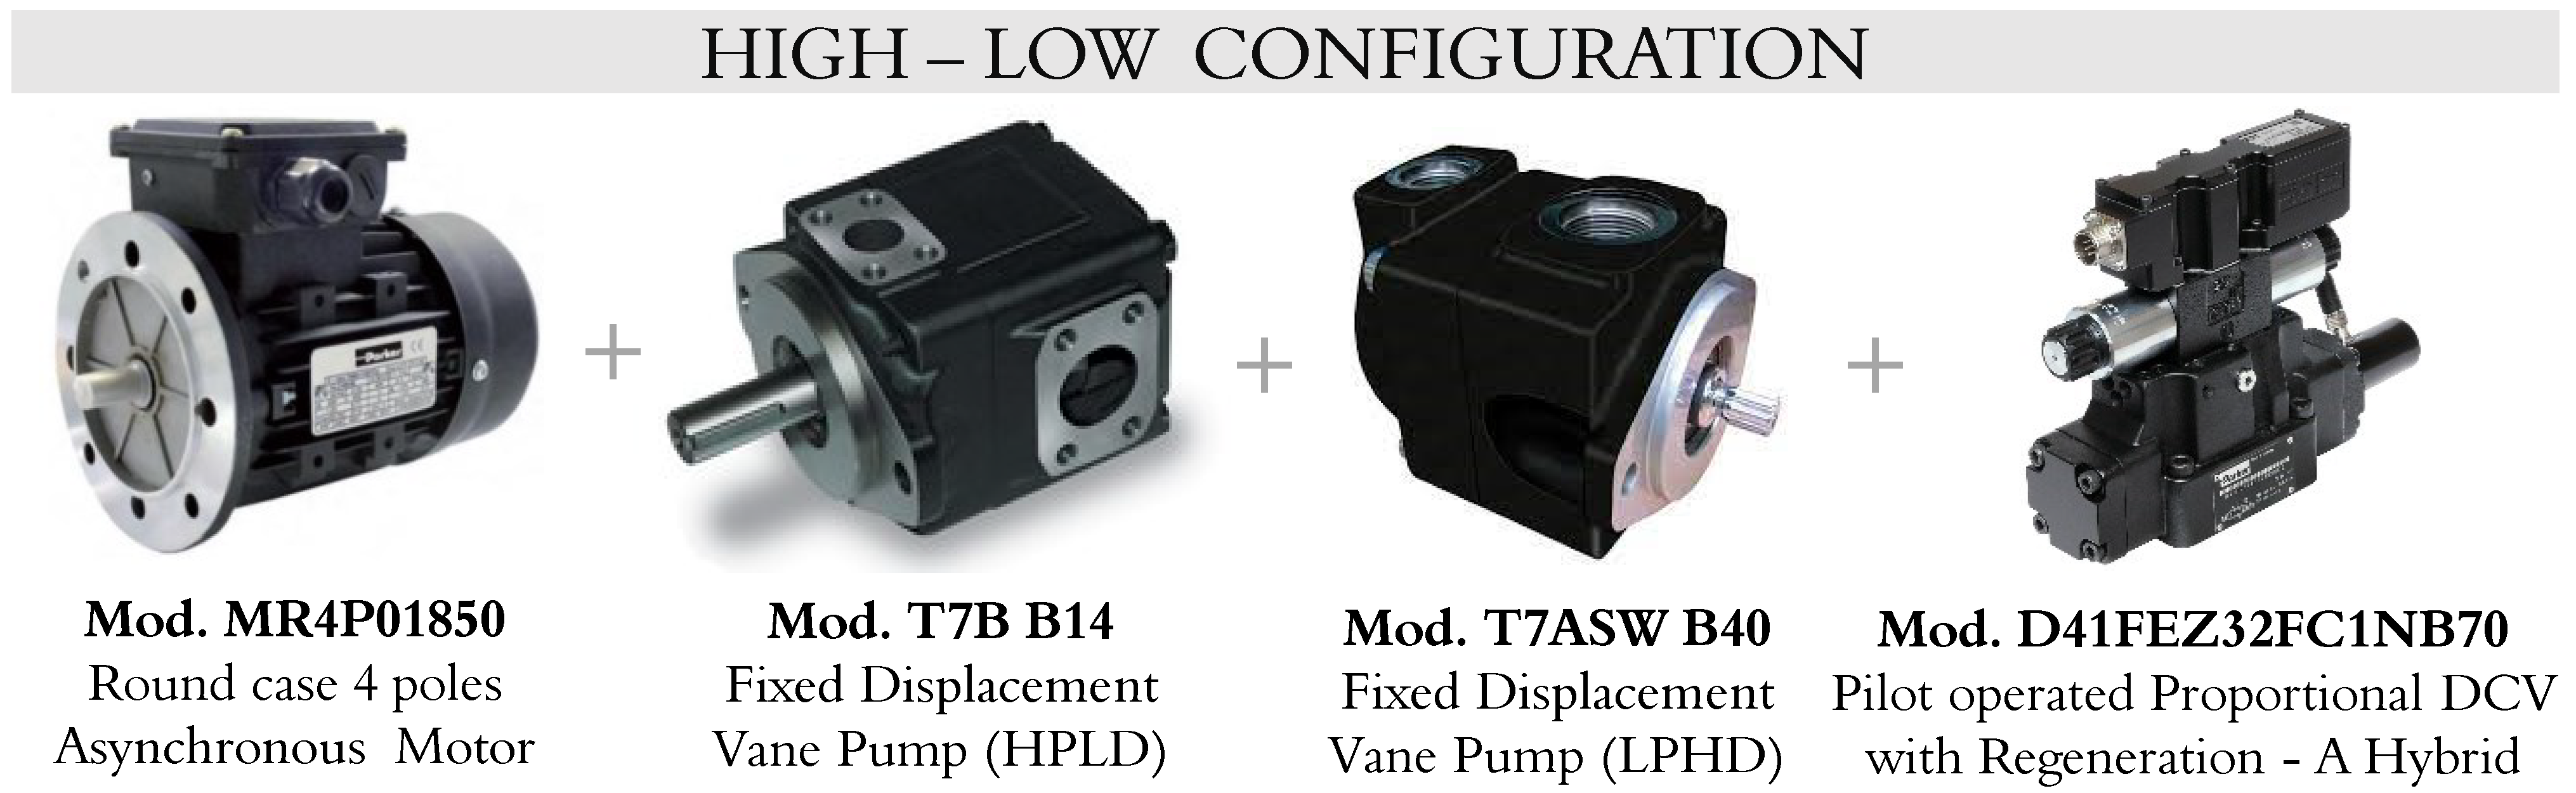
High–low configuration: regenerative A—hybrid configuration in which the single fixed-displacement vane pump is replaced by two pumps of the same type, one with high flow rates and low maximum pressures, one with low flow rates and high maximum pressures.
4.
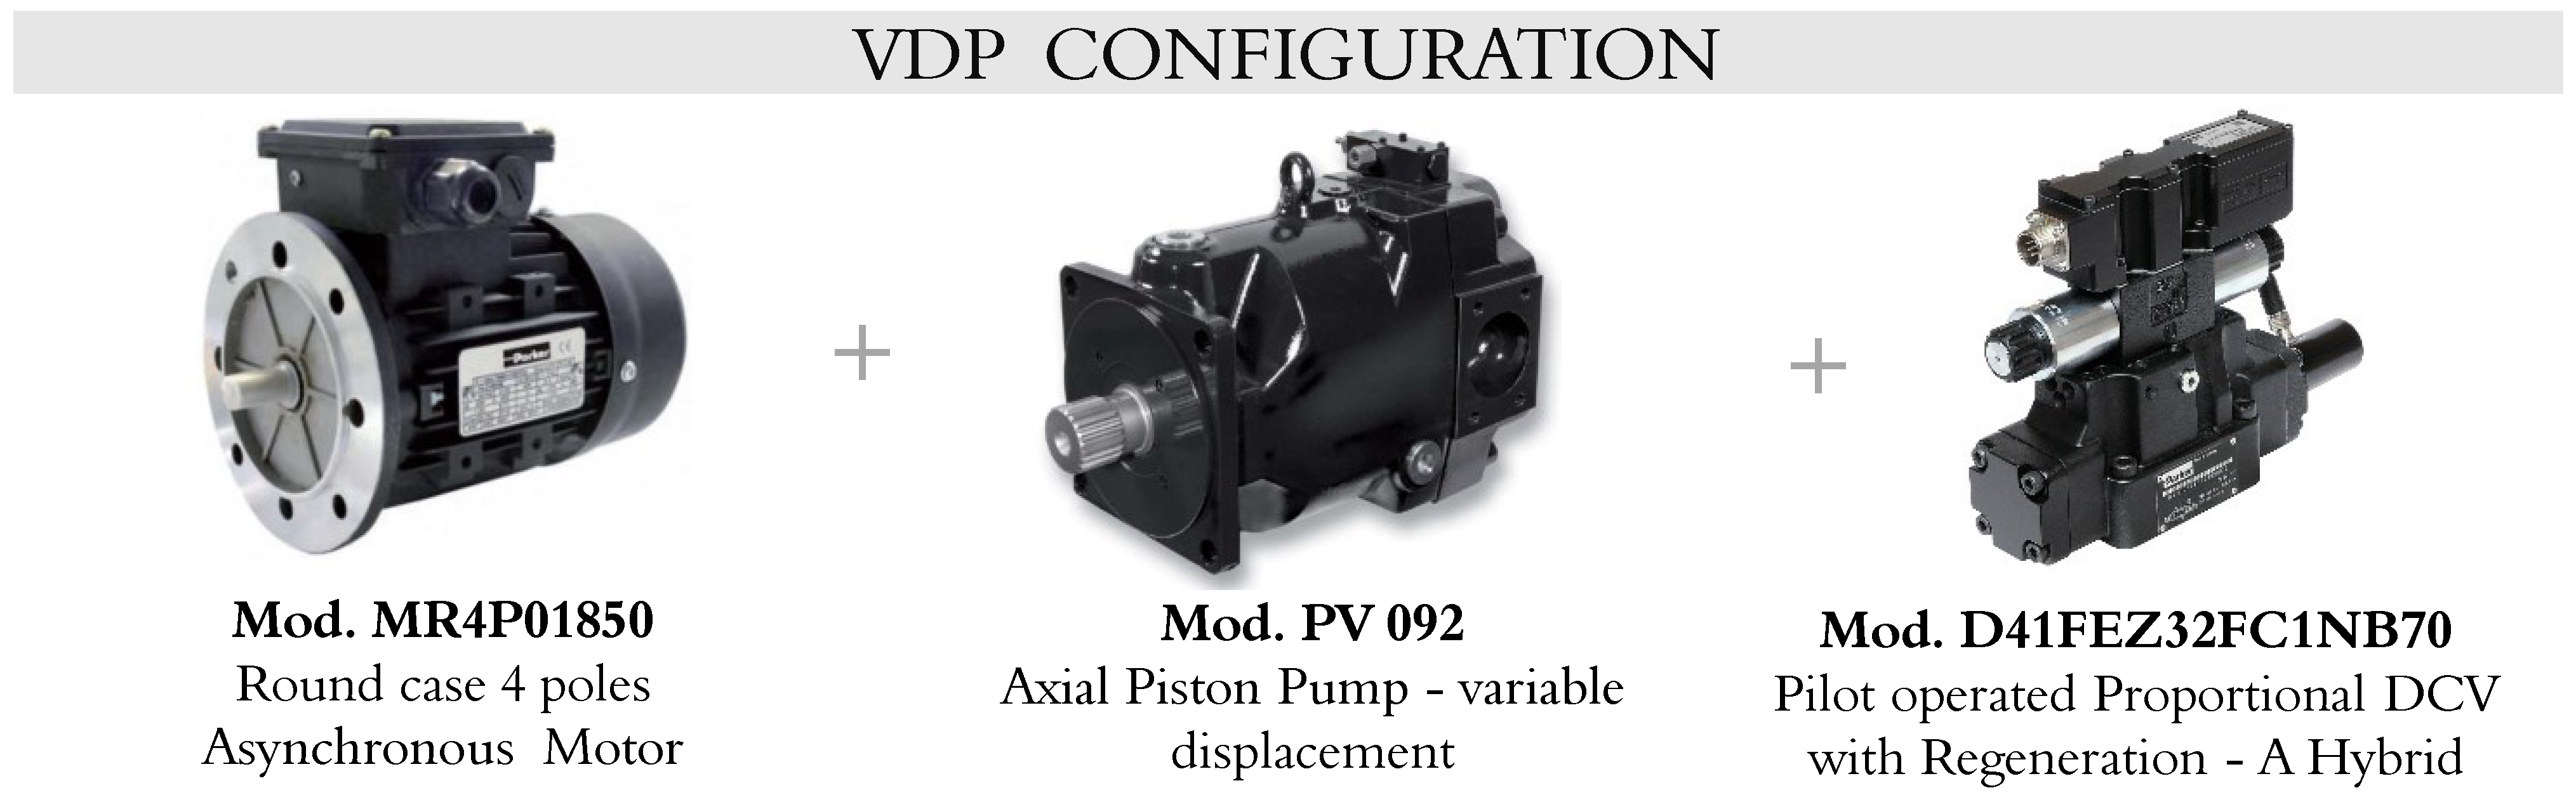
VDP (variable-displacement pump) configuration: regenerative A—hybrid configuration in which the single fixed-displacement vane pump is replaced by a variable-displacement axial piston pump.
5.
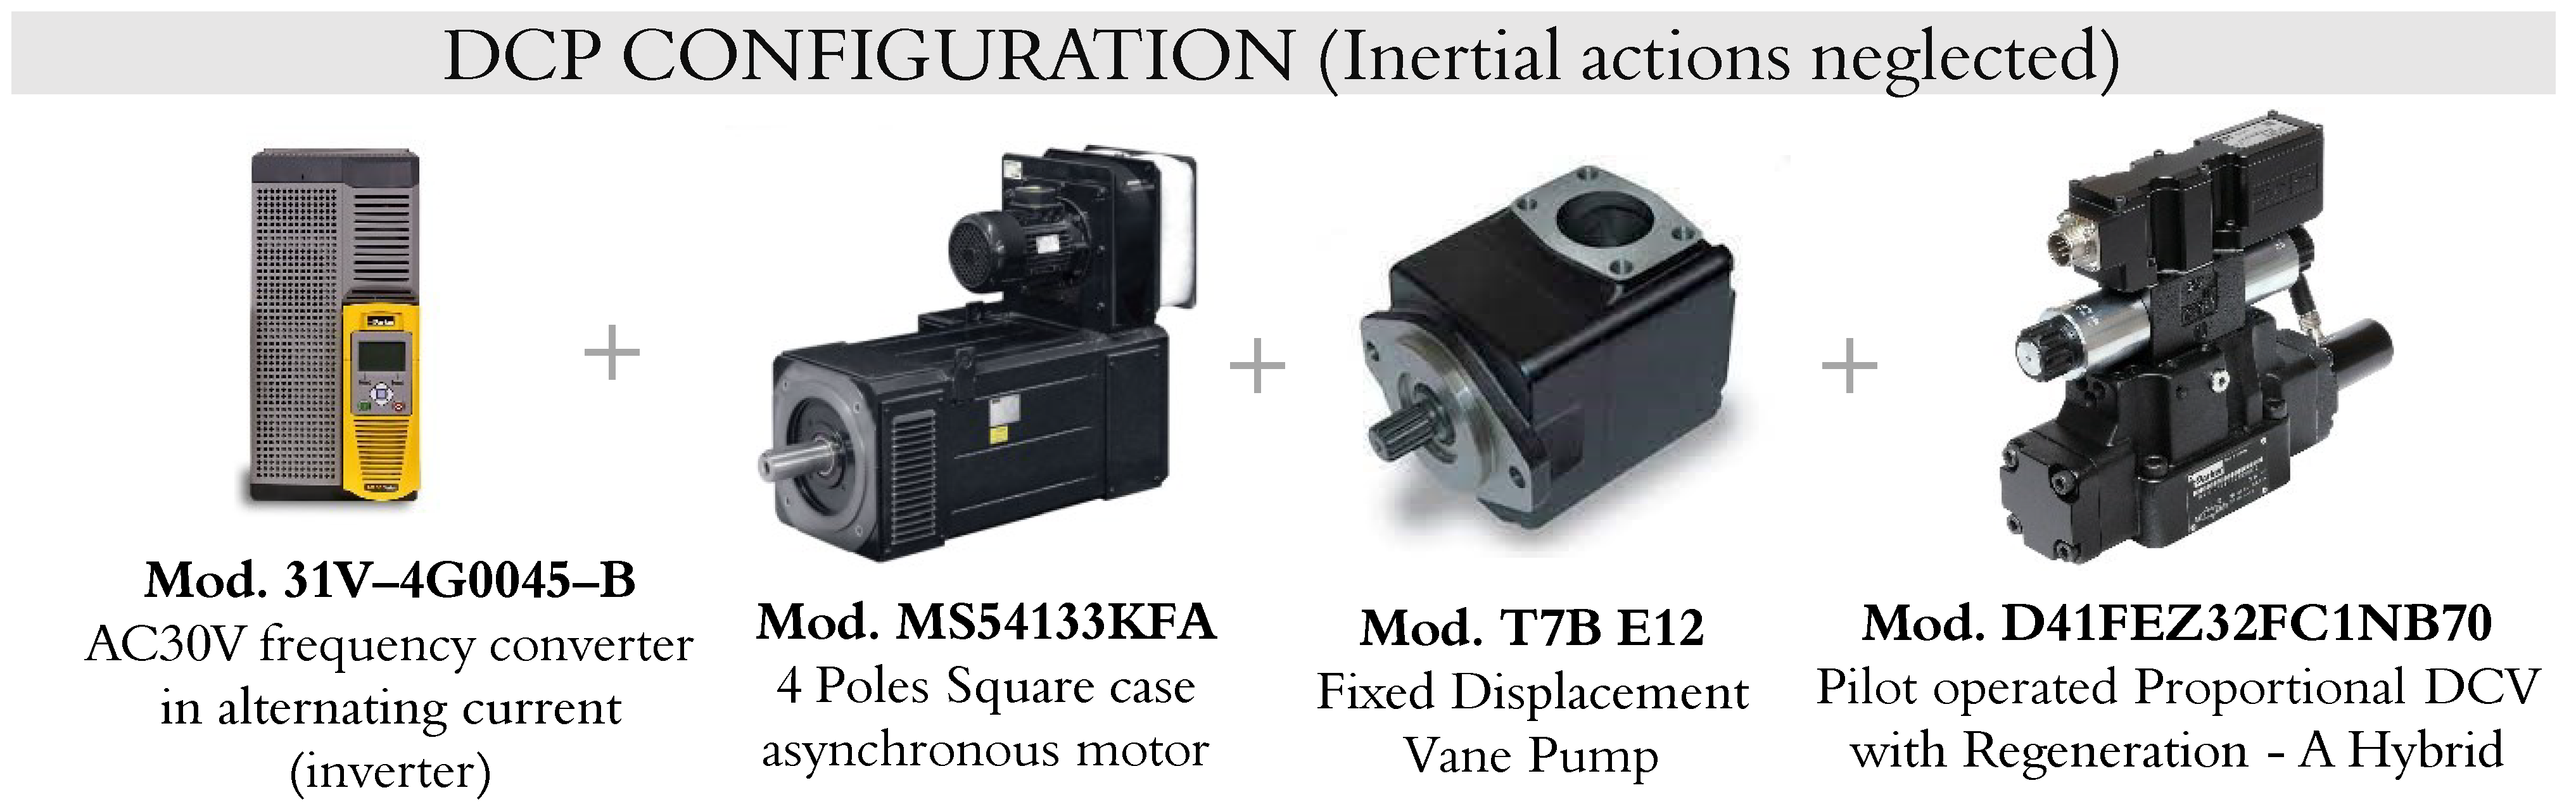
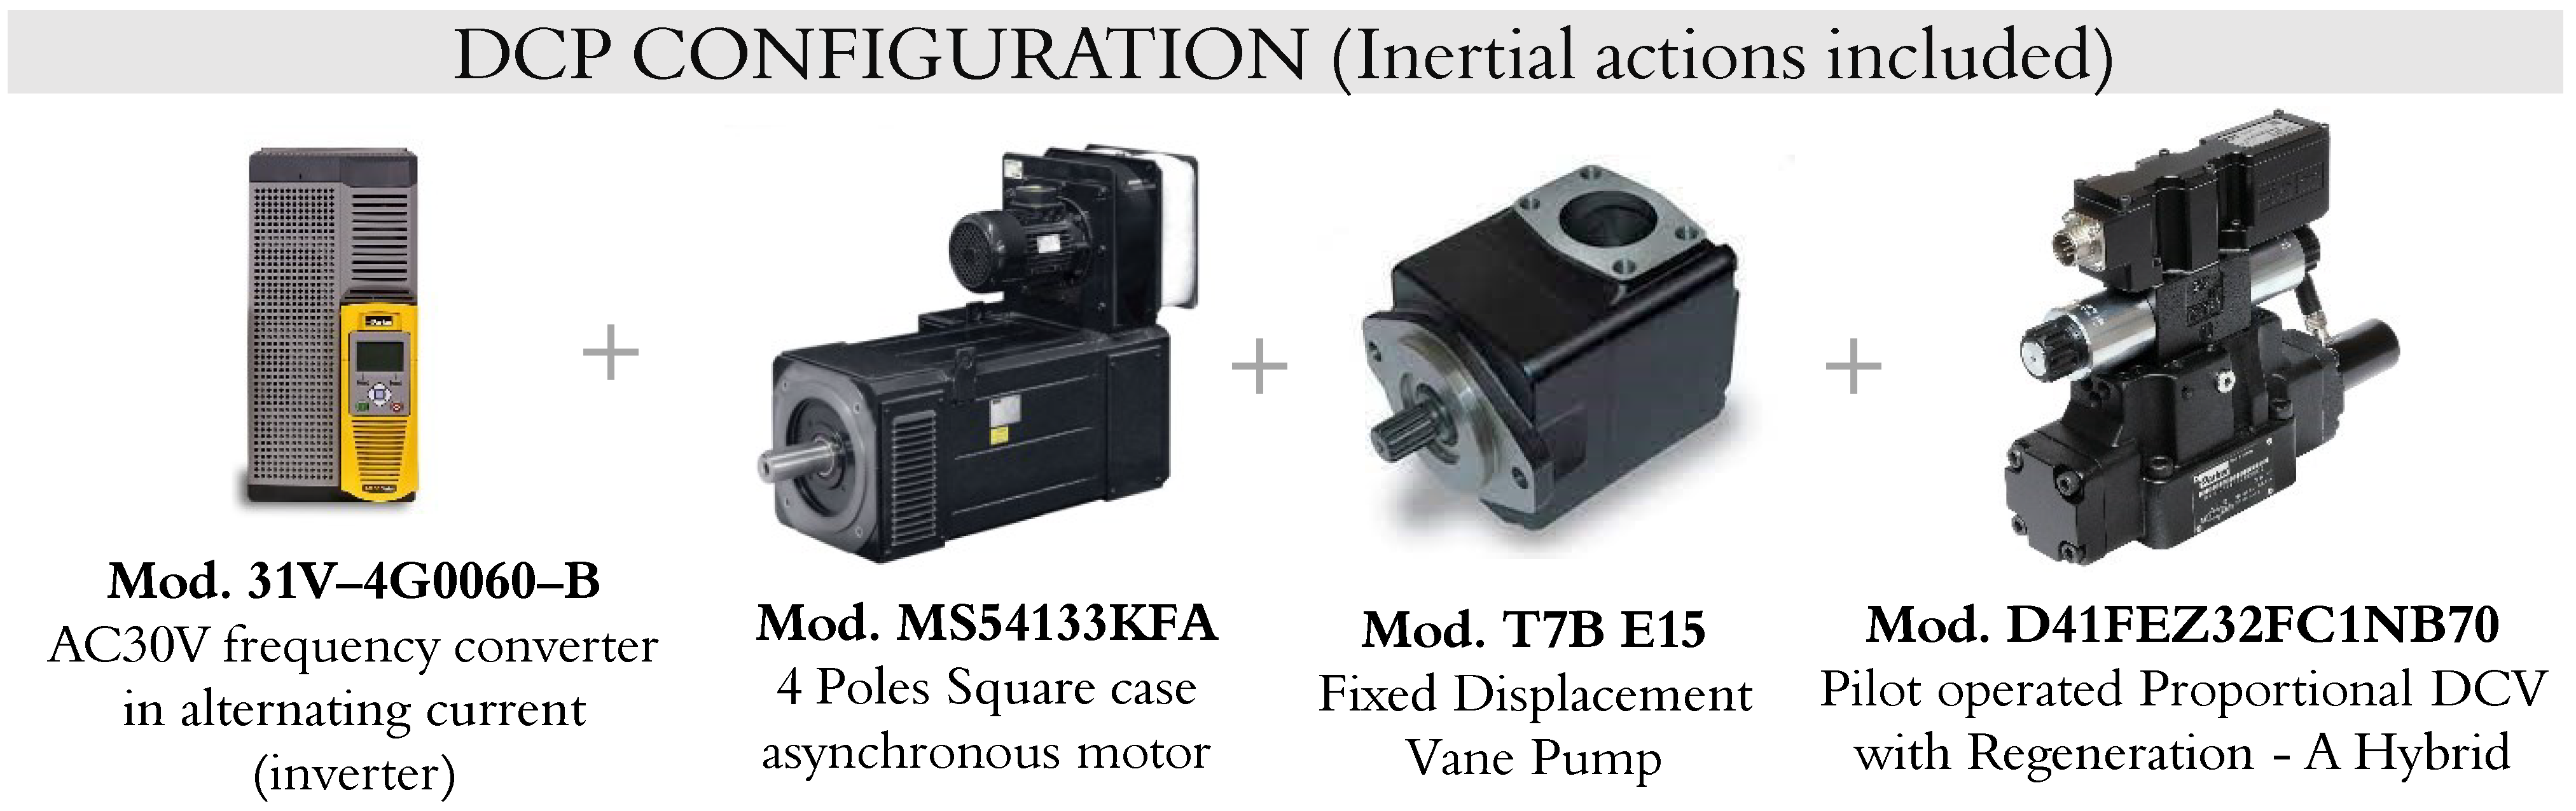
DCP (drive-controlled pump) configuration: regenerative A—hybrid configuration in which rotational speed of the asynchronous motor is continuously adjustable through an AC frequency converter.
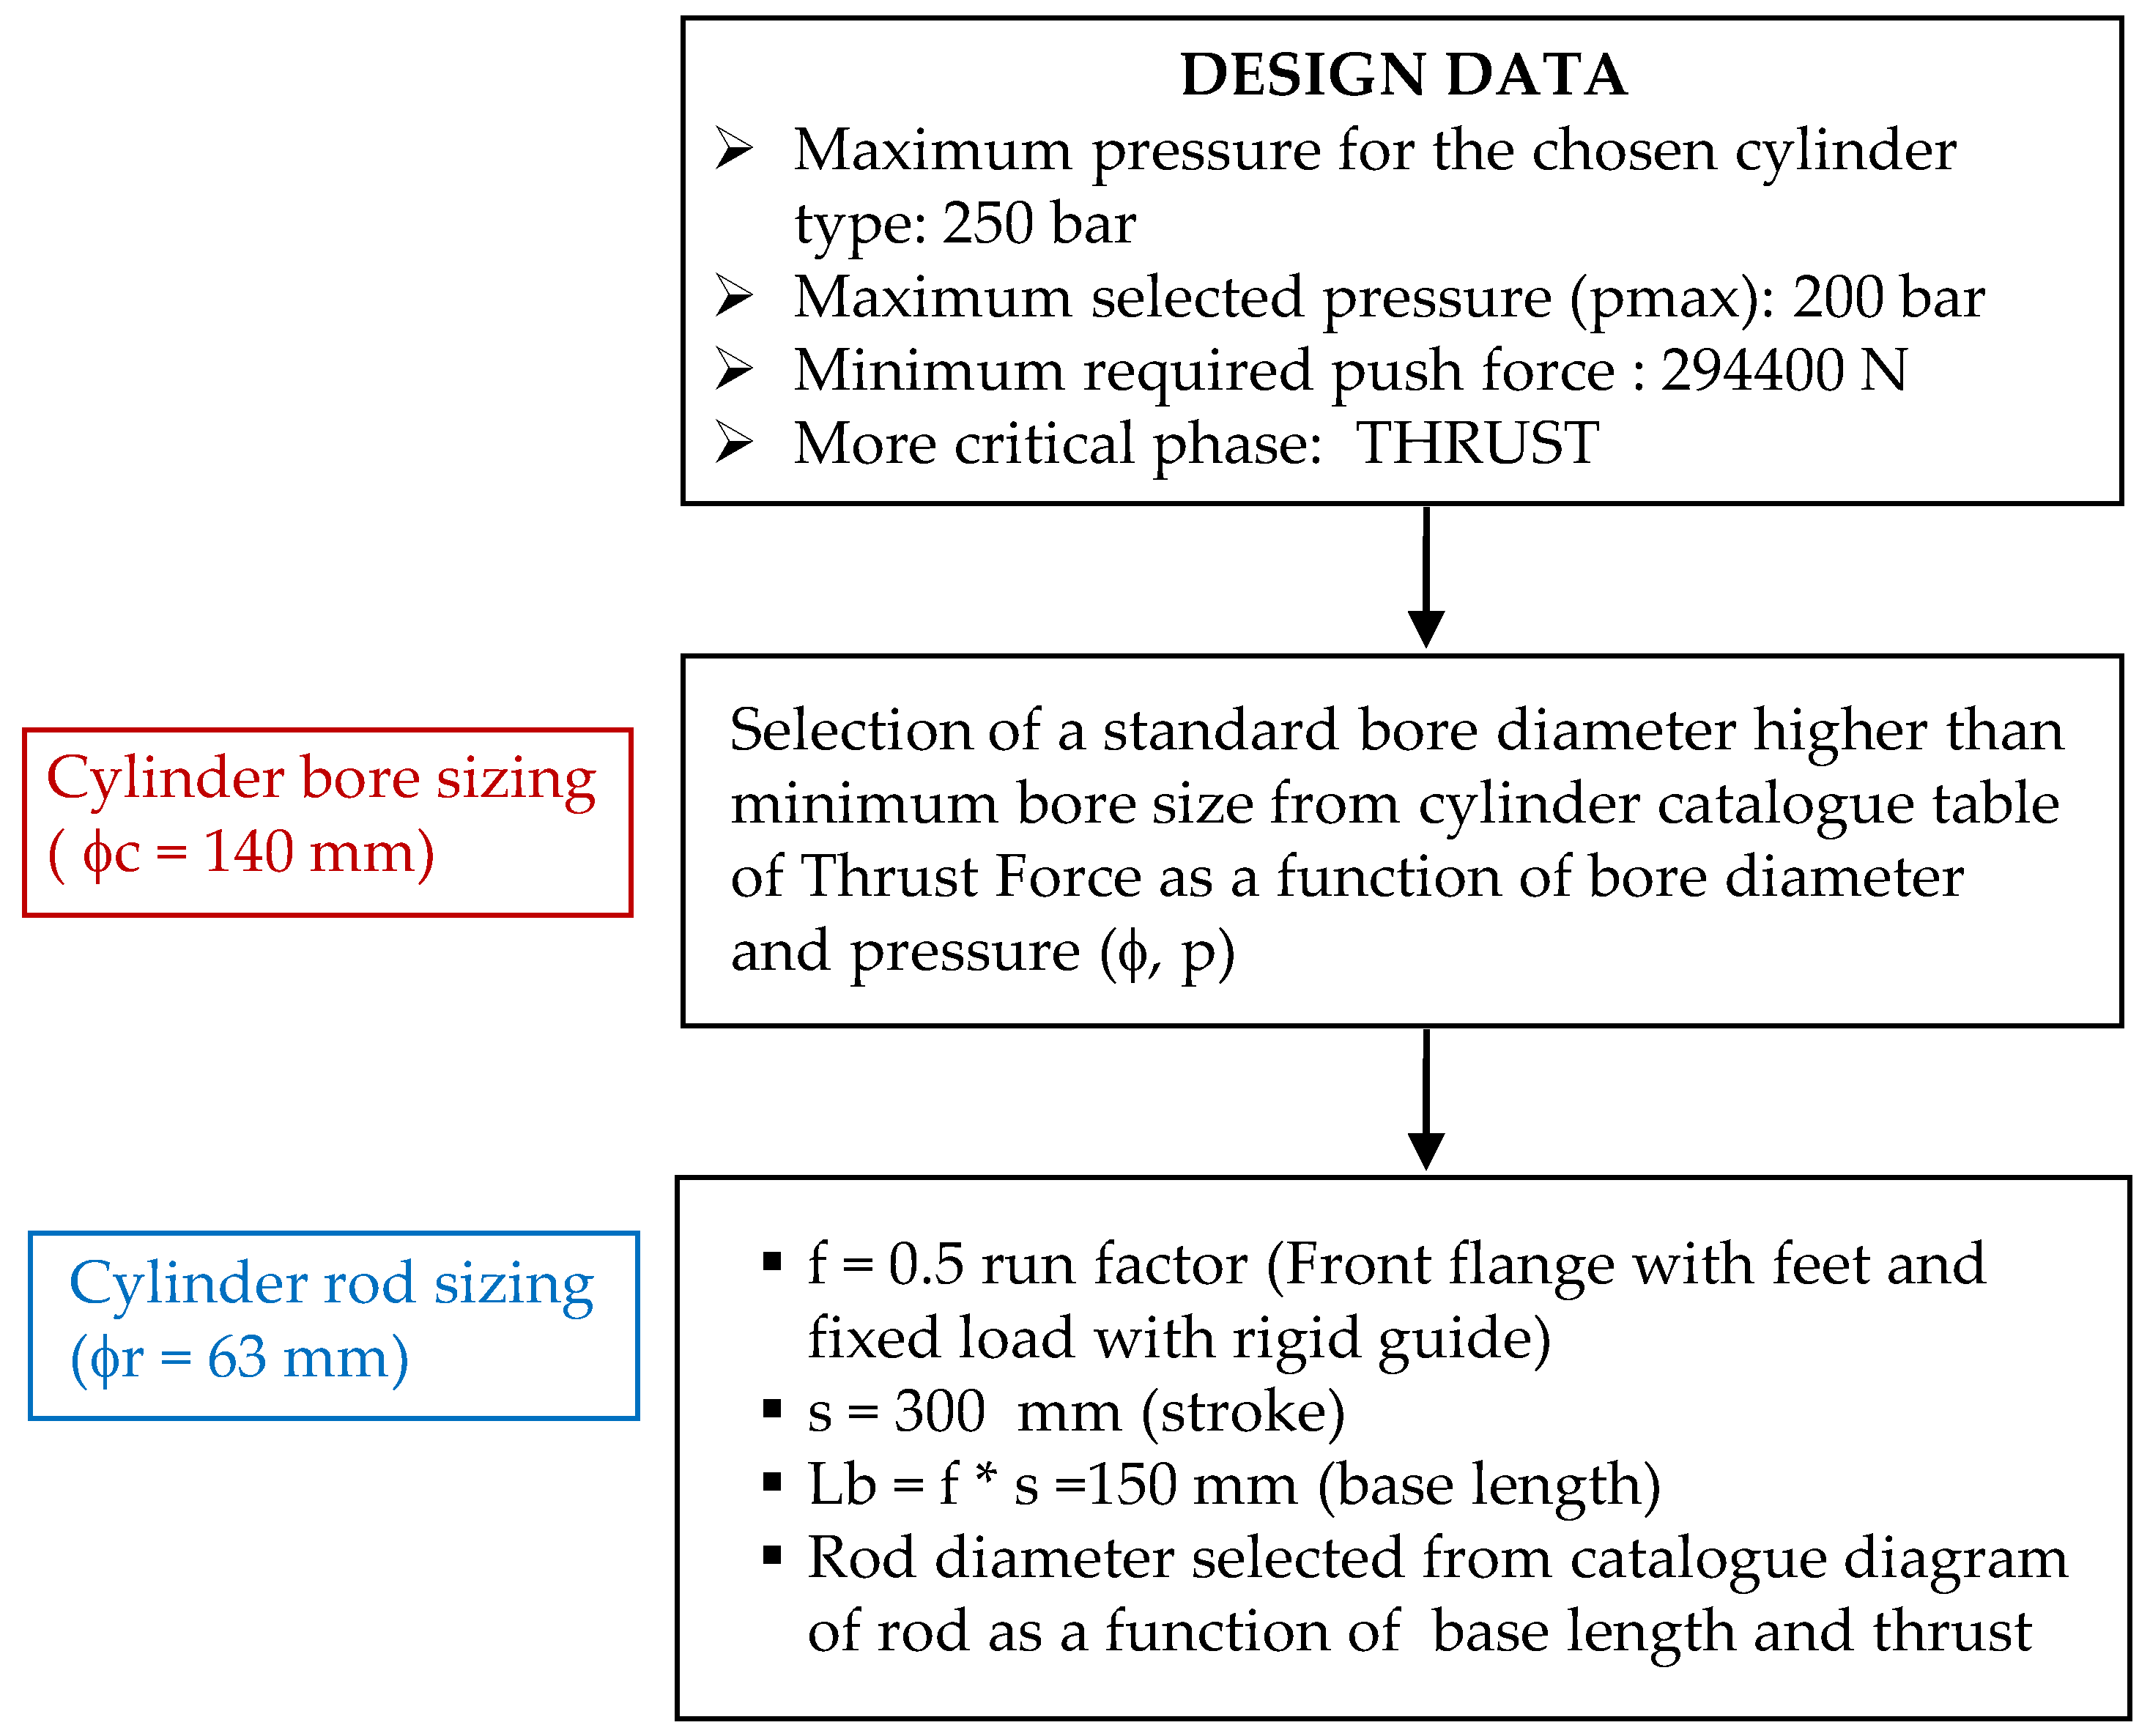
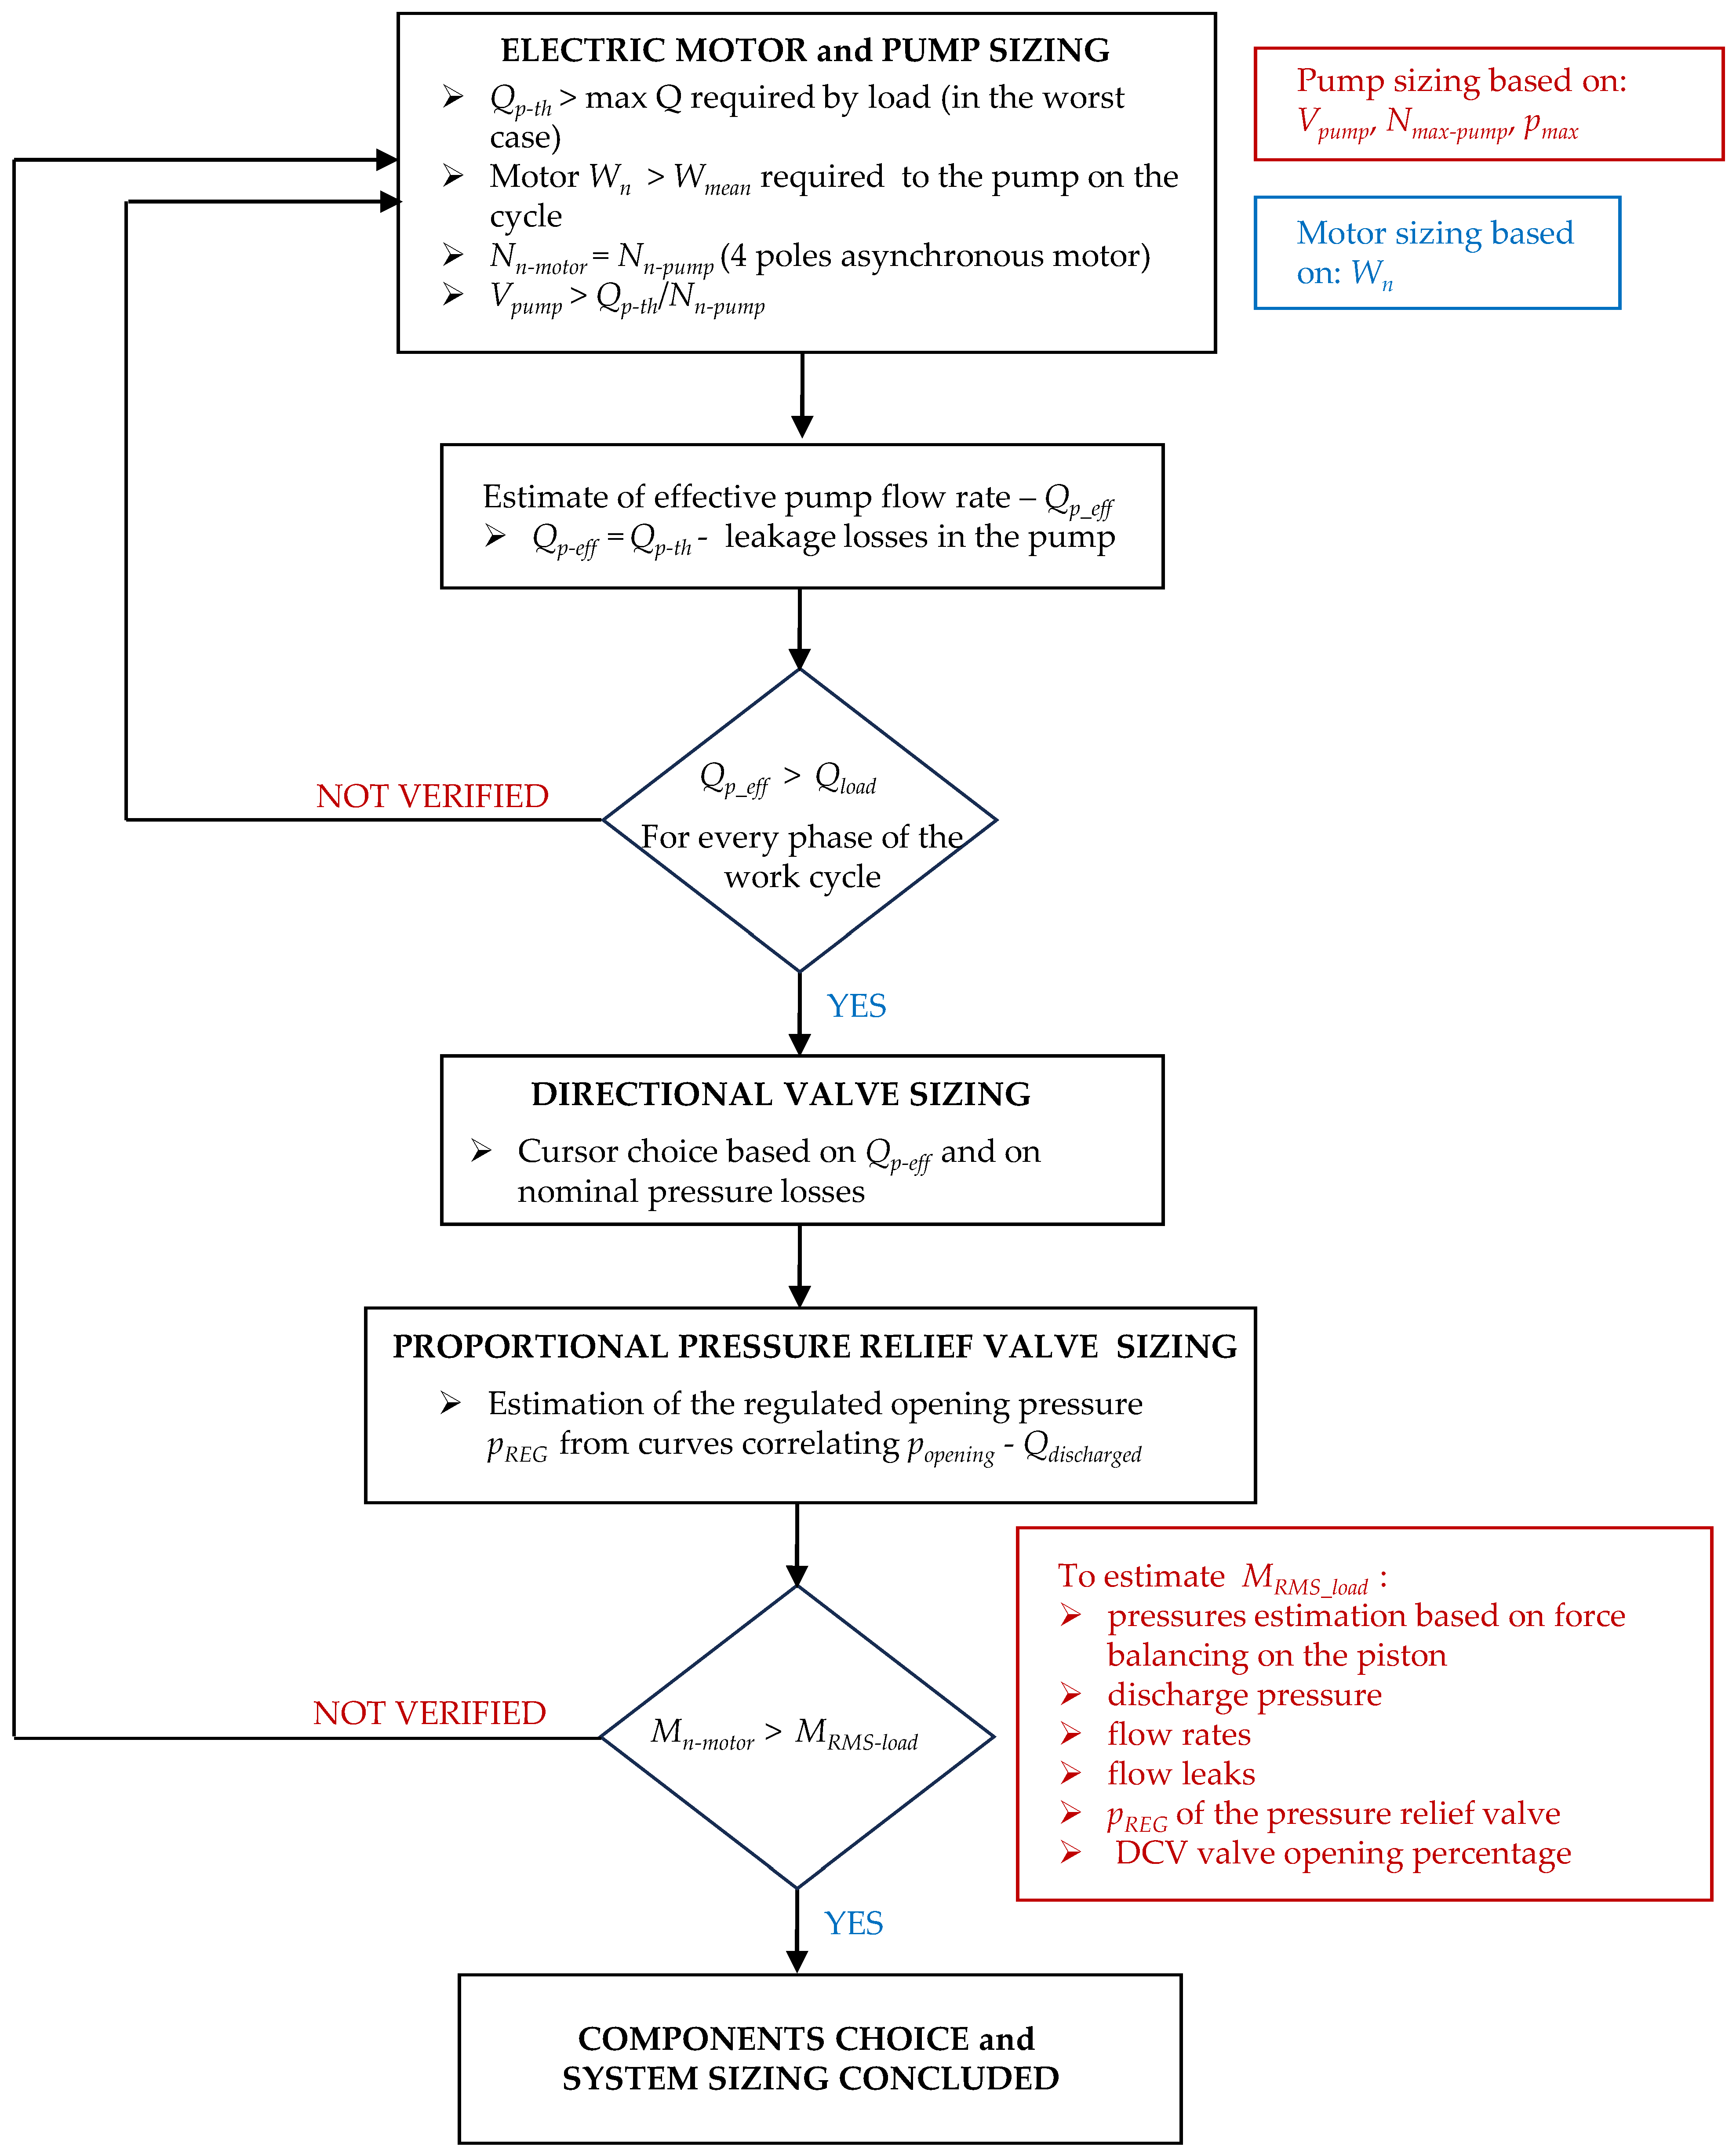
For a quantitative comparison of the energy efficiency of the studied configurations, it is necessary to perform an optimized dimensioning of the main components for each of them.
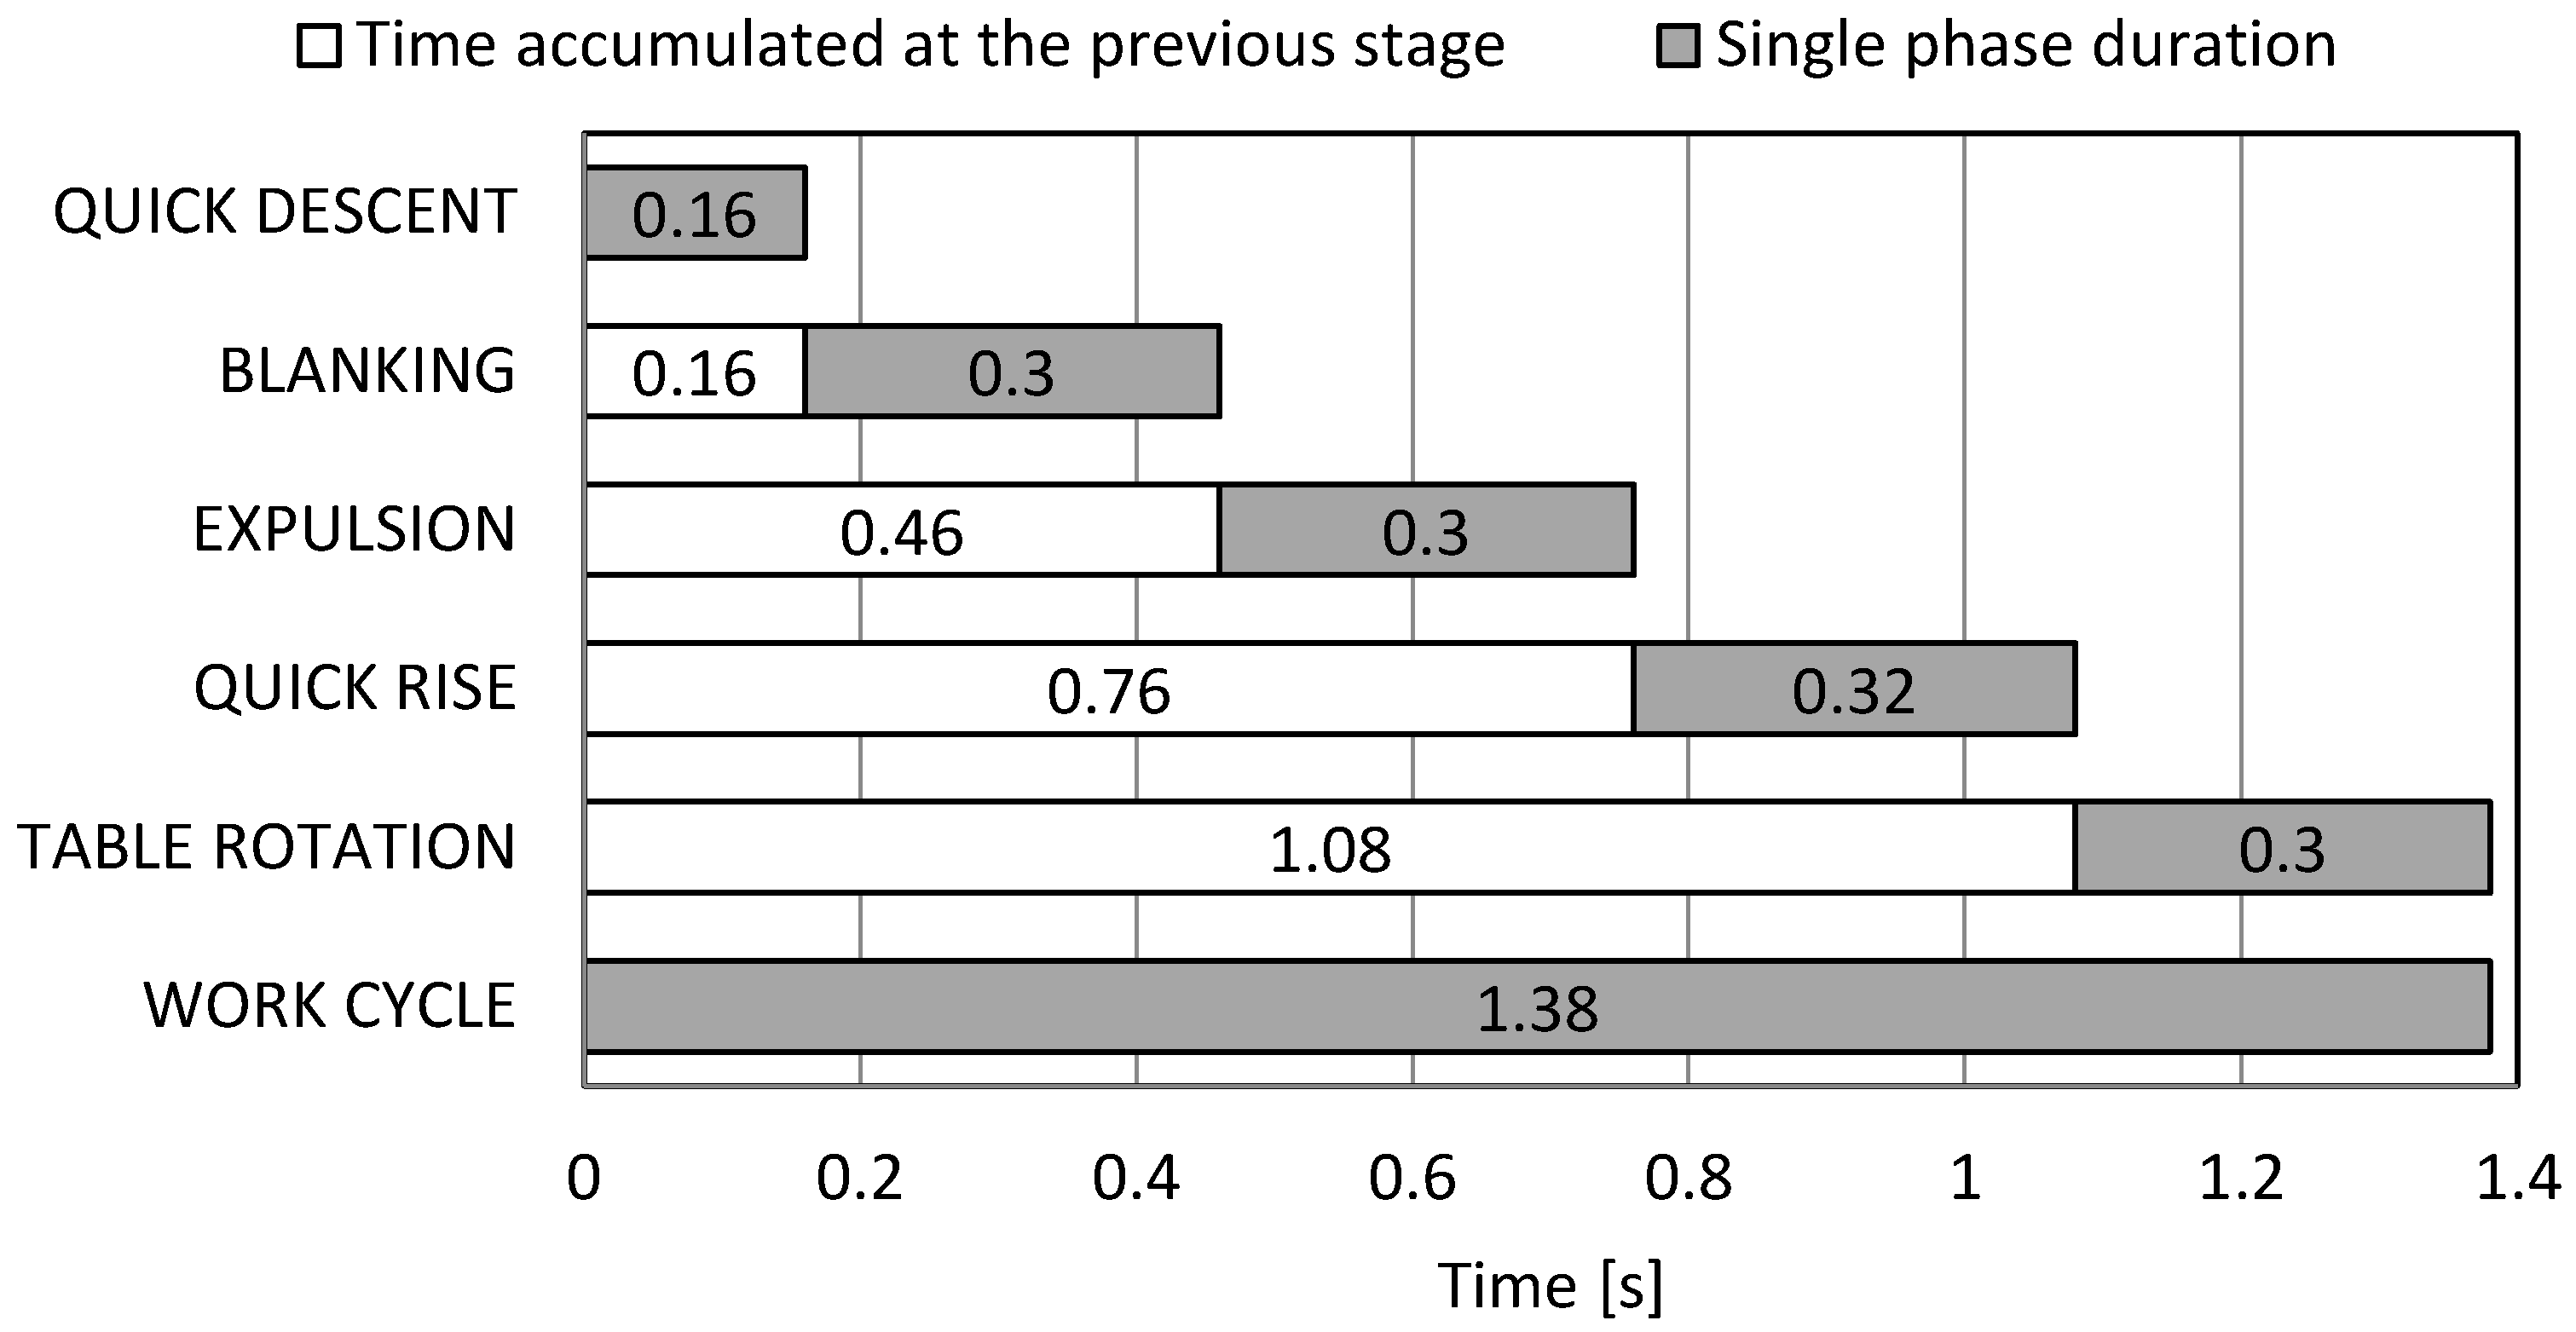
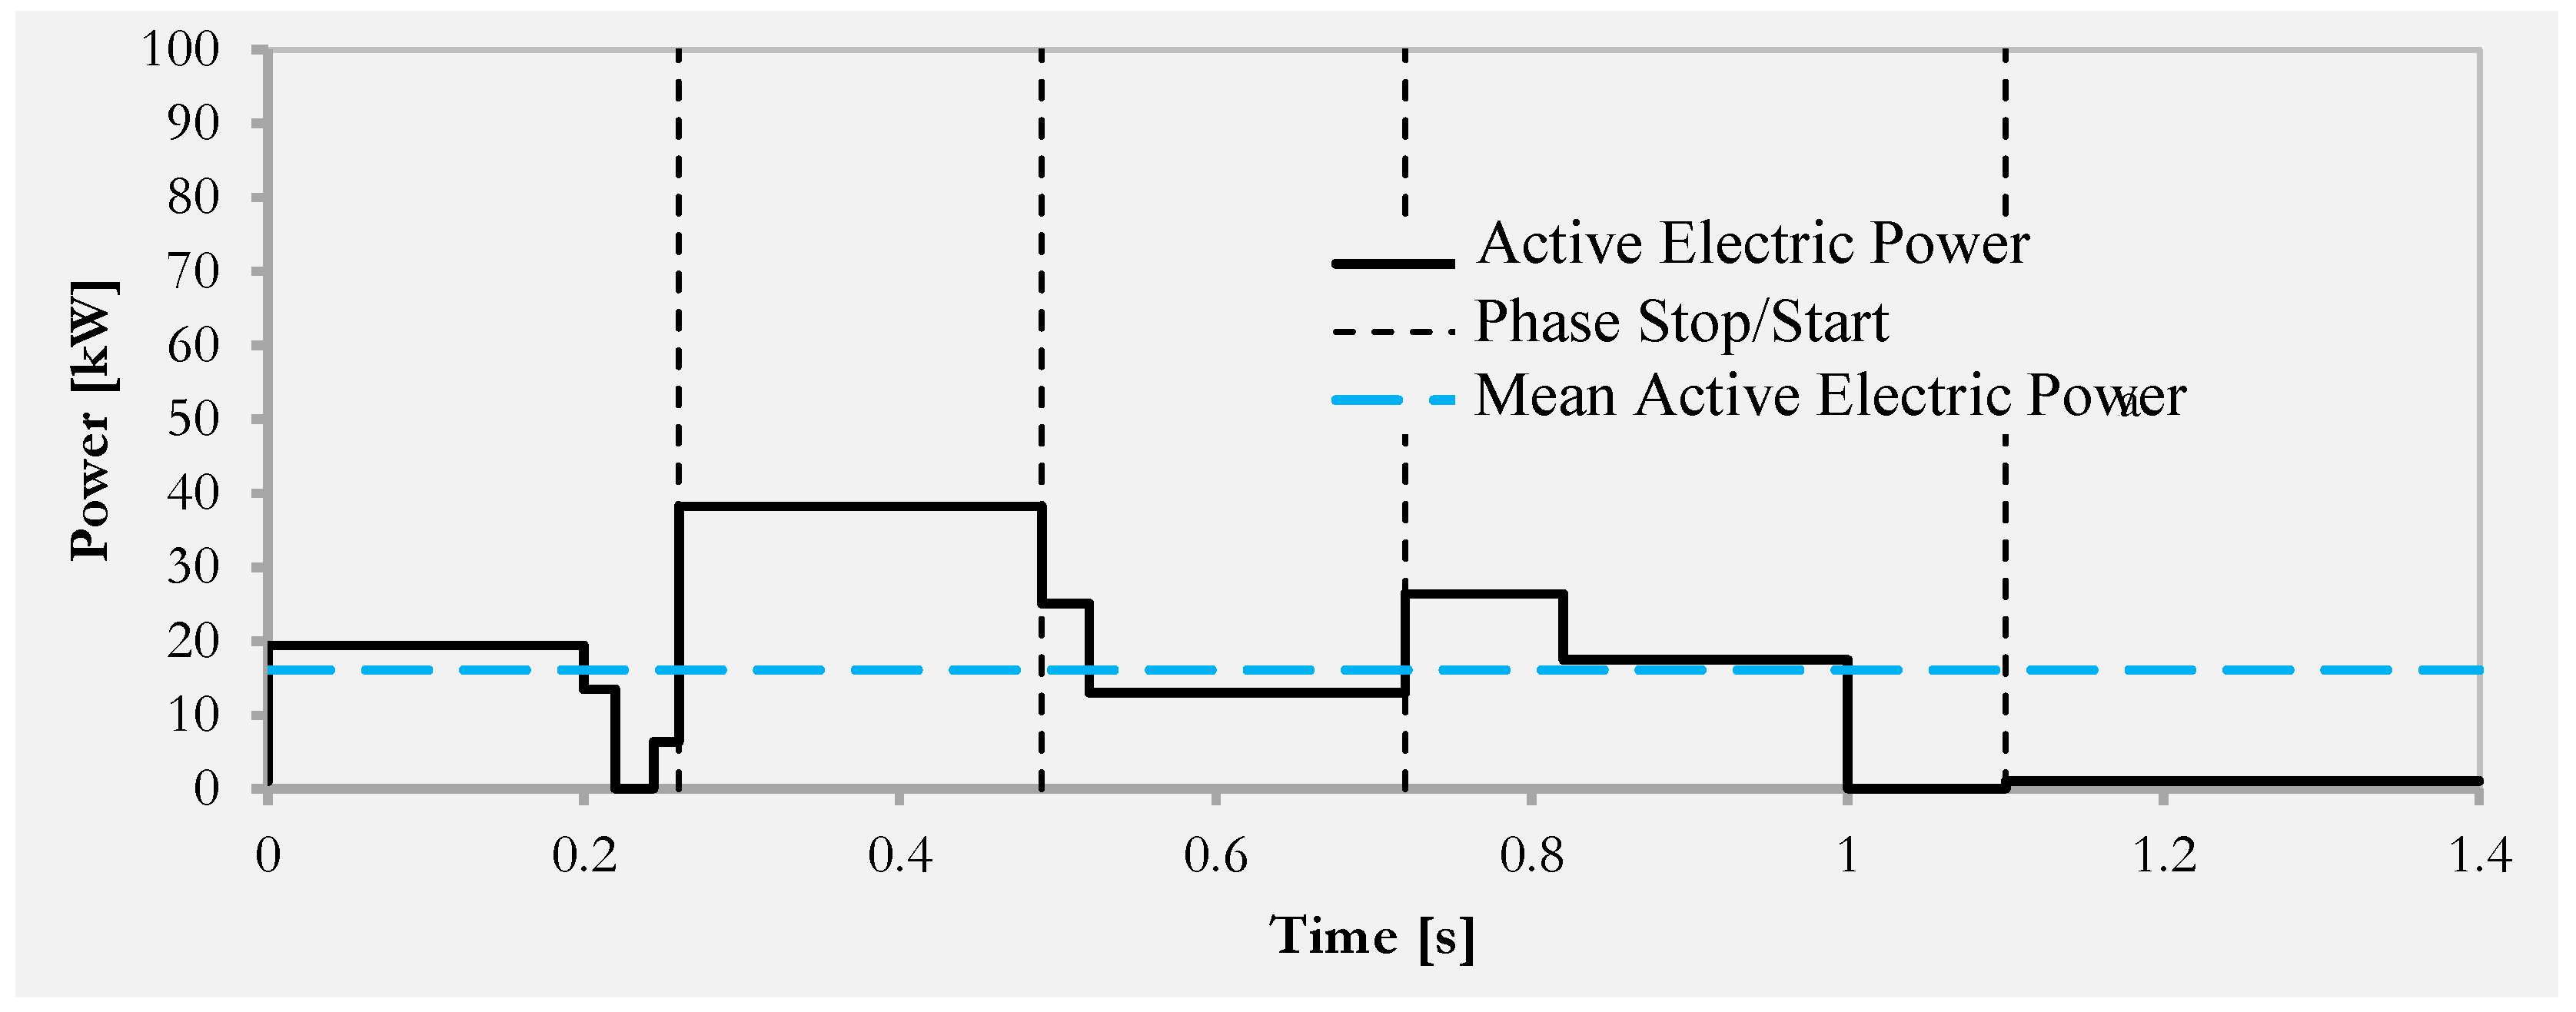
For configurations 1 to 4, the sizing can be achieved by neglecting the angular acceleration or deceleration ramps that characterize the transition from one speed range to another, since for architectures that use an asynchronous motor fed directly from the grid, the inertial torques resulting from the acceleration or deceleration ramps can be neglected in a first approximation. On the other hand, the contribution of inertial torques becomes more relevant when the motor is fed by a frequency converter, since in this mode of operation the motor is subjected to speed variations of very large amplitude, even in very short periods, which leads to non-negligible inertia torques. For architecture 5, both an approximate sizing, in which the inertial contribution was neglected, and a more accurate sizing, in which the inertial contribution, was also considered, were performed.
The remainder of the paper is organized as follows. Section 2 is devoted to the description of the variable speed and force hydraulic blanking press, the selection of the hydraulic cylinder and fluid, the theoretical analysis of a valve-controlled hydraulic system, and the description of all architectural configurations considered. In 
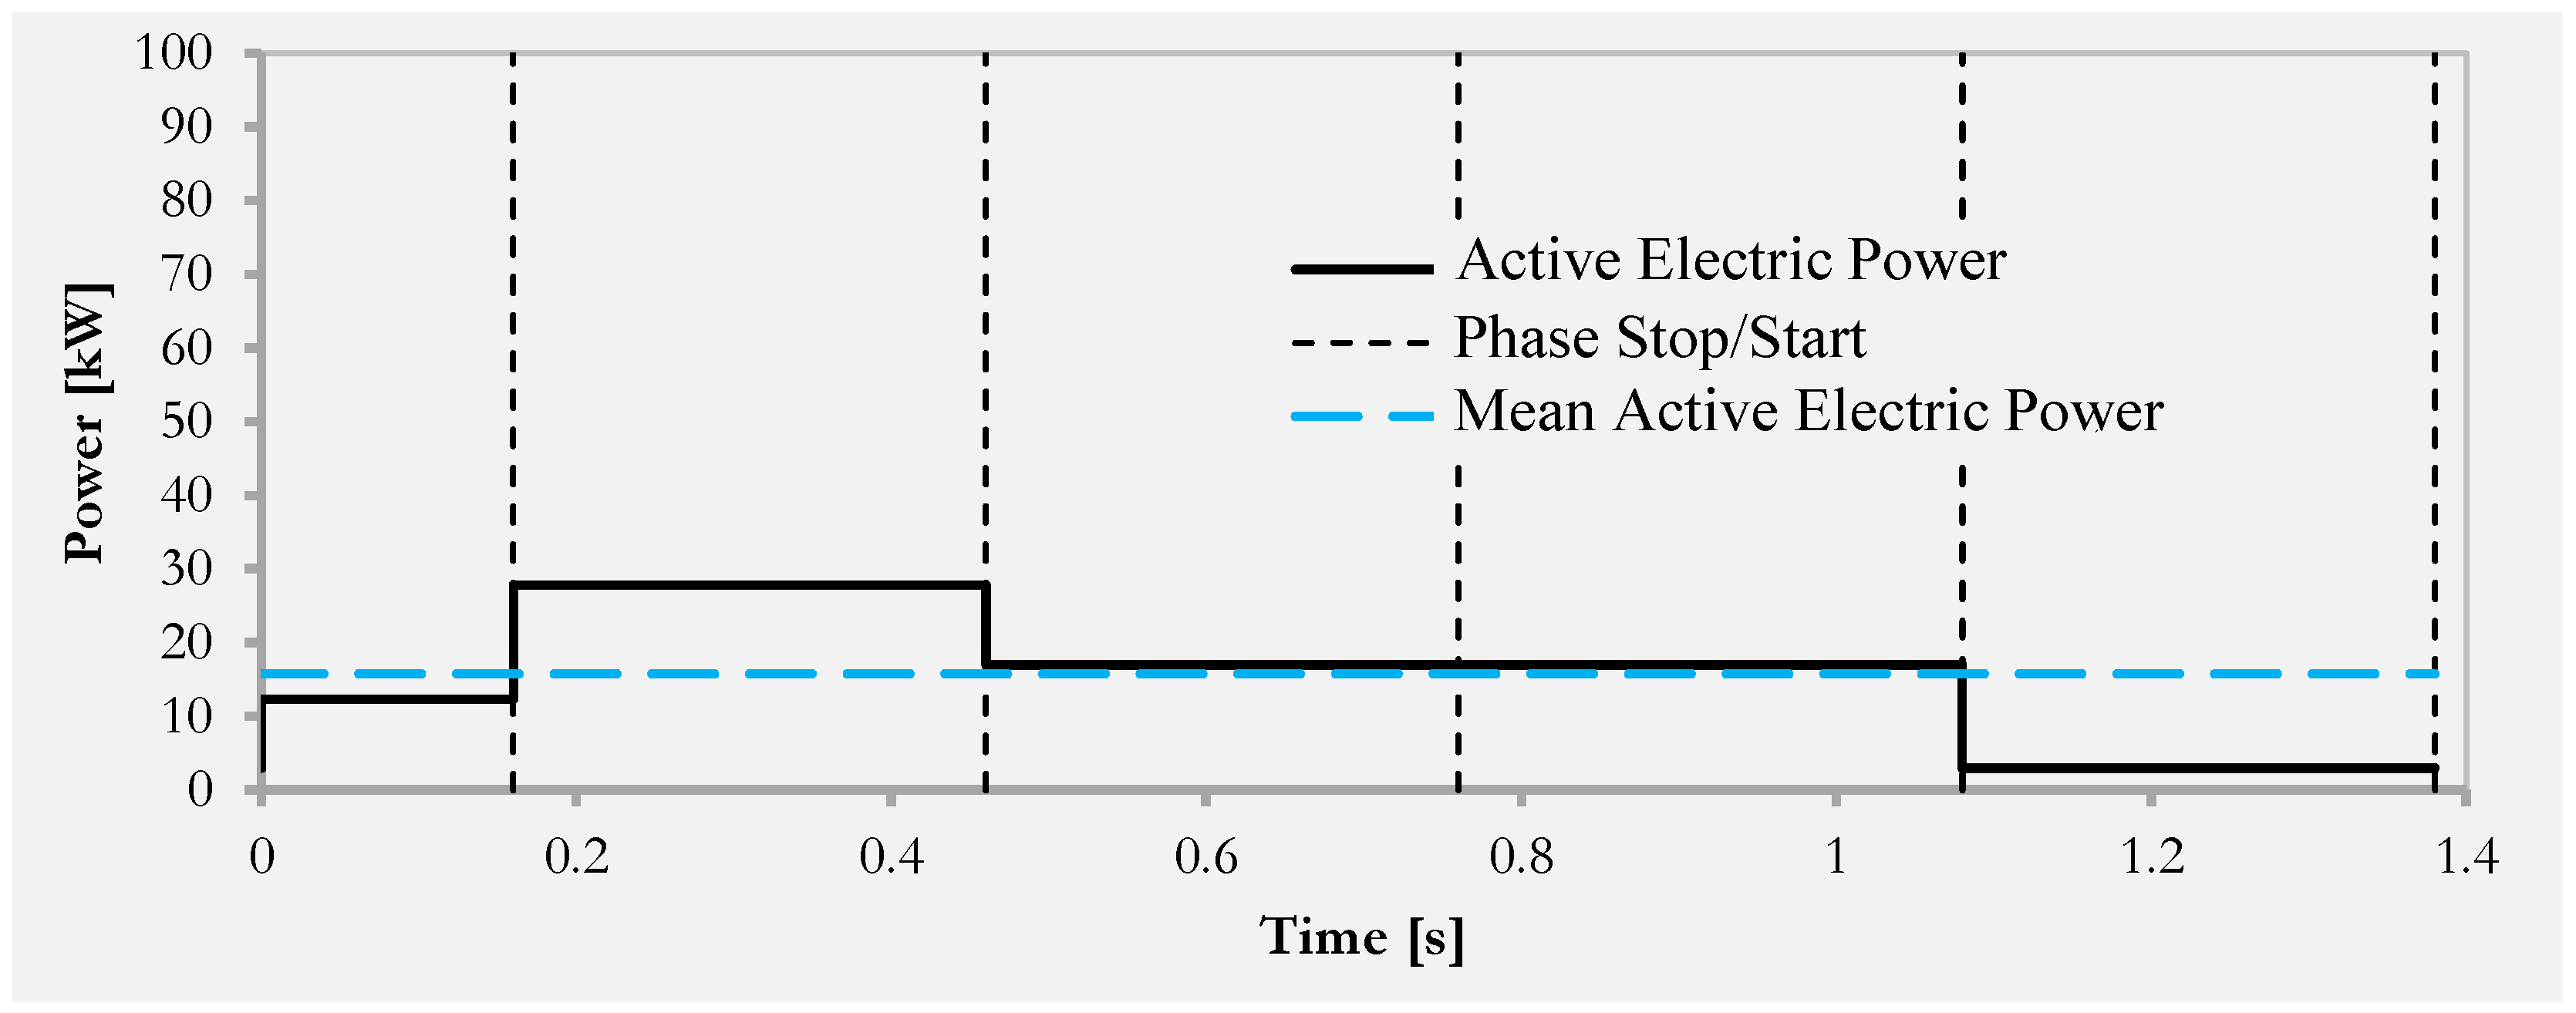
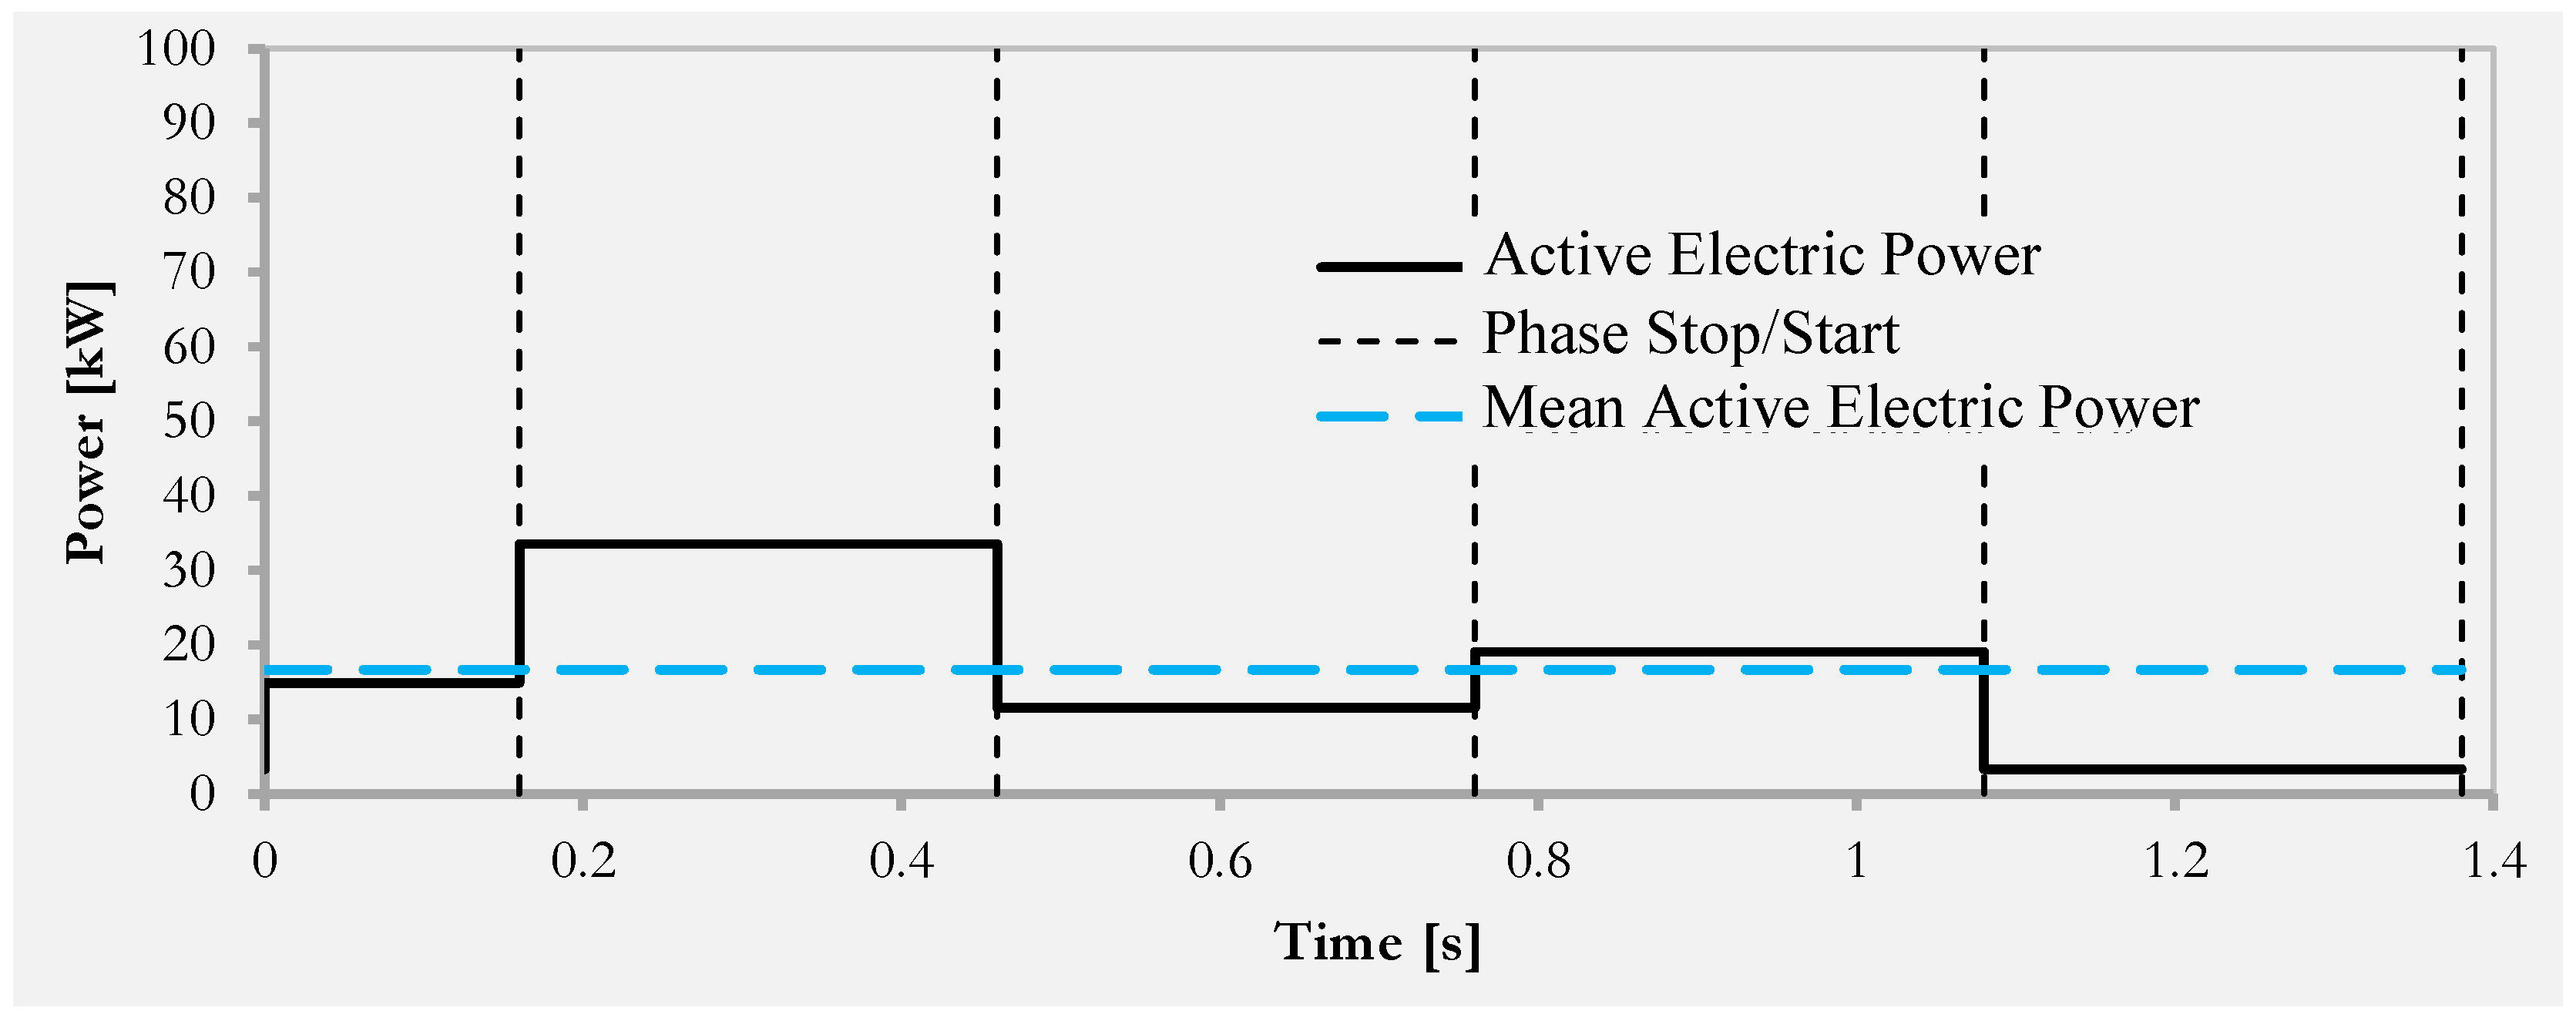
Section 3, the results are presented, in terms of estimated absorbed power (active and reactive), mean active electric power on the working cycle, and hourly cost of energy absorbed by the electricity grid, for each configuration considered. Furthermore, the results of the experimental measurements in the plant where the architecture with DCP was implemented are reported. Section 4 provides an analysis of the results. Section 5 summarizes the main findings of the work.

2. Materials and Methods: Architectural Configurations for the Case Study

This section is devoted to the description of the characteristics of the solutions considered, applied to a case study with reference to a real application. In detail, the following are presented: the structure and parameters of the process considered as a case study, the technical requirements, the elements common to all the cases analyzed, i.e., actuator and fluid, the theoretical analysis applied to estimate physical quantities required to the dimensions of the system, the procedures applied to select and dimension the circuit components, and, finally, all the final configurations of the architectures considered, as reported in Table 2.

2.1. The Hydraulic System

In this section, the main characteristics of the hydraulic system under study are described. First, the structure of the system is described and the technical specifications considered for performing the quantitative analysis are identified, then the technical data of the circuit elements common to all the configurations considered are given. Appendix A contains a graphical representation of the main components of each configuration considered.

2.1.1. System Structure and Technical Requirements

The main technical requirements for the actuator during operation are two: the minimum thrust force that the rod must exert during the blanking of the semi-finished product and the maximum duration of the entire working cycle of the press. The system considered as a case study for pressing semi-finished brass products consists of a hydraulic press with a system for feeding/unloading parts that includes a rotary table with four stations, a robot manipulator, and a conveyor belt, as shown in Figure 1.
The typical blanking work cycle is divided into two macro-phases. The first includes the rod quick descent, the blanking, the expulsion of the piece, and the rode quick rise. In this first macro-phase the cylinder is actively involved in the work cycle. The second, on the other hand, involves only the rotation of the table for loading the parts to be machined. In this case the cylinder rod does not perform any movement and remains in a waiting state. The duration of this second macro-phase is usually set by the end user of the machine and is 0.3 s in the process considered as a case study. It is, therefore, obvious that the constraint on the maximum duration of the blanking cycle determines a limit on the maximum duration of the first macro-phase, in which the cylinder is in motion. In addition to the specifications for the minimum force that must be generated during operation and for the maximum duration of the working cycle, a third limitation is established. This defines the limit mass of the tool that can be anchored to the free end of the actuator rod. The numerical values of the above parameters are summarized in Table 3.
The entire process consists of five individual phases: quick descent (QD), blanking (B), expulsion (E), quick rise (QR), and table rotation (TR). During the blanking phase, pressure and velocity have a rather complex trend, that should be determined either experimentally or by simulating the process. For the purposes of this work, i.e., the functional comparison between the different system architectures in terms of energy efficiency, the impact of the variation in these two quantities during the blanking phase on the overall energy consumption values is limited. The discussion is, therefore, made under the simplified assumption that the speed of the load is uniform, and corresponds to the average value during the cutting operation and that the oil pressure is constant and corresponds to the maximum value reached during blanking.
First of all, it is necessary to define the main project specifications, which include the translation speed of the cylinder rod, the stroke, and the delivery pressure for each working phase. The choice of values for the translation speed is arbitrary and limited only by mechanical or other constraints. The stroke is defined as a function of the thickness of the semi-finished product to be sheared in the shearing phase and of the characteristics of the system in the other phases. For the feeding pressure, a pressure level is chosen that is considered sufficient to maintain the control of the valves, to compensate for the load losses distributed in the tubes, and to overcome the resistance of any load at the free end of the cylinder rod. In Table 4, the values of these parameters are given for each phase of the blanking cycle. Figure 2 shows the cyclogram of the working phases, obtained considering a periodic cyclic load with negligible dynamics on the actuator. For each phase, the gray rectangle represents its duration, while the white rectangle indicates the total duration of the previous phases.
The dynamic effects at the shaft of the electric motor are much more relevant. In architectures where the three-phase induction motor is directly connected to the electrical network, the motor maintains a speed that is close to the rated speed. The only deviations from the rated speed, excluding the start and stop phases, are caused by the phenomenon of motion irregularity due to the periodicity of the load. The amplitude of the speed deviation is very small, so the inertia effects on the crankshaft can be neglected. For the DCP architecture, where an inverter is used, given the total cycle time of 1.4 s, it is obvious that the acceleration and angular deceleration ramps cause moments of inertia on the motor shaft that must be taken into account. In summary, the inertial aspects of the crankshaft can be neglected in the design of standard, high–low, and VDP architectures. However, they must be taken into account when dimensioning the architecture with DCP.

2.1.2. Hydraulic Cylinder and Fluid

Figure 3 shows the flowchart of the cylinder sizing process. A family of cylinders is selected that is characterized by a maximum pressure. The maximum working pressure is chosen; therefore, considering the most critical phase and the respective maximum force that can be developed, the minimum bore of the actuator is calculated and a normalized value is chosen. Starting from the cylinder mounting, the running factor (f) is selected, the basic length (Lb) is calculated, and the rod diameter in the catalog is selected based on Lb and the maximum thrust.
Table 5 lists the designations and associated technical characteristics of the selected cylinder and fluid, which are common to all configurations.

2.1.3. Theoretical Analysis of a Valve-Controlled Circuit

System sizing requires actual forces and velocities and consequently pressures and flow rates. This section contains the theoretical analysis required to calculate these quantities.
The simplest control circuit that can be used for a linear actuator combines the differential cylinder with an area ratio of 2:1 with a standard 1:1:1:1 directional control valve. Let us adopt the nomenclature from Figure 4: the flow rate through the rear chamber and flow rate through the front chamber of the actuator are defined as Q A and Q B , respectively. p A and p B denote the relative pressures occurring in the rear and front chambers of the cylinder, respectively. p P is the pressure occurring at the outlet of the pumping unit. The fluid pressure in the reservoir and pressure tank is denoted by p T . Since the oil pressure in the tank is generally equal to atmospheric pressure, the pressure p T is assumed to be zero as a value relative to atmospheric pressure. For a differential cylinder, the area ratio α is defined as α = A P A T and the flow rates for the two chambers in the exit stroke have the values given in Equation (1).
For the 4-way directional valve used (P = pressure, T = discharge, A = first port; B = second port), 1:1:1:1 means that for the paths AT:PA:PB:BT the pressure drop is equal to Δ p n when 100% of the nominal flow Δ Q n passes through it. The value 1 stands for 100%, another value means another percentage, e.g., 0.5 for 50%.
In the following, the pressure drops at the DCV, the pressures generated in the rear and front chambers of the cylinder, the thrust and traction forces that can be exerted by the rod, and the maximum speed it can reach during the outward and return phases are determined at the theoretical level. In the analysis, both the pressure and the translational velocities of the rod are assumed to be constants with respect to the ejection and the return. To distinguish the parameters related to the outward stroke from those related to the inward stroke, the superscripts “o” (outward) and “i” (inward) are used.
Q A o = v A P Q B o = Q A o α
The relationship between the flow rate traversing a DCV path and the pressure drop occurring on the path itself is expressed by Equation (2).
Q x = Q n Δ p x Δ p n
Consequently, the pressure drops on the PA and BT paths can be expressed using Equations (3) and (4).
Δ p P A = p P p A o = Δ p n Q A o Q n 2 = Δ p n v A p Q n 2
Δ p B T = p B o p T = p B o = Δ p n Q B o Q n 2 = Δ p n v A P α Q n 2
For a cylinder with area ratio 2, the ratio between the pressure drops between ports P and A and B and T is Δ p P A Δ p B T = α 2 = 4 . From Equations (3) and (4), the pressures in the rear and front chambers of the actuator can be derived (Equations (5) and (6)).
p A o = p P Δ p n v A p Q n 2
p B o = Δ p n v A P α Q n 2
The thrust force created by the rod is expressed by Equation (7).
F o = p A o A P p B o A P α = p P A P A P Δ p n v A P Q n 2 A P α Δ p n v A P α Q n 2
For inward motion, a similar analysis procedure is used as for outward motion, with flow rates, pressure drops on the valve paths, and pressures in the cylinder chambers determined as in Equations (8)–(12).
Q B i = v A T = v A P α Q A i = α Q B i = v A P
Δ p P B = p P p B i = Δ p n Q B i Q n 2 = Δ p n v A p α Q n 2
Δ p A T = p A i p T = p A i = Δ p n Q A i Q n 2 = Δ p n v A P Q n 2
p B i = p P Δ p n v A p α Q n 2
p A i = Δ p n v A P Q n 2
In the inward phase, the ratio between the pressure drops between ports P and B and A and T is Δ p B T Δ p A T = 1 α 2 = 1 4 .
During the retraction phase, the stem exerts a pulling action. This force is expressed by Equation (13).
F i = p B i A T p A i A P = p B i A P α p A i A P = p P A P α A P α Δ p n v A P α Q n 2 A P Δ p n v A P Q n 2
With v and p p being equal, the thrust force is greater than the pulling force. Both in the exit and retraction phases, the maximum force value is obtained for v = 0 . In this case, the ratio between F o and F i is equal to α .
F o F i v = 0 = α
If Q P is the effective flow rate delivered by the pumping group, the maximum translation speed of the rod during the output stroke is the minimum value between the one obtained from Equation (1) setting Q A o = Q P and the one that derives from setting F o equal to zero.
v m a x o = min Q P A P , v | F o = 0 = p P Δ p n A p 2 Q n 2 1 + 1 α 3
Similarly, the maximum translational velocity of the rod during the return stroke is the minimum value between the value obtained from Equation (8) when Q B i = Q P is set and the value obtained when the force F i is set equal to zero.
v m a x i = min Q P A T , v | F i = 0 = p P α Δ p n A p 2 Q n 2 1 + 1 α 3
Regeneration usually occurs during rod extension and consists in directing the oil flow, which exits the front chamber of the actuator as a result of the translational motion of the piston, into the sleeve of the rear chamber cylinder. This results in a sensitive energy saving, which is why architectures that use DCVs with regeneration are called economizer circuits.
In the proposed study, the point where the fluid is re-supplied is downstream of the PA path, i.e., towards the user, therefore, the regeneration is of type A, and A—hybrid.
The configuration with regeneration A—hybrid integrates in the valve body the functions of a check valve in the line BA and an on–off valve in the connection between point A and the tank. These two functions allow it to go from a configuration with internal regeneration—A to a standard configuration during the discharge stroke. In this way, it is possible to take advantage of both the benefits of internal regeneration—A (energy efficiency) and the benefits of the standard configuration (high forces), if necessary.
The analysis of flow rates, pressures, velocities, and forces for the outward stroke in the case of regeneration A—internal follows Equations (17)–(21), in a similar manner as for the standard configuration.
Δ p P A = p P p A o = Δ p n Q P Q n 2 p A o = p P Δ p n Q P Q n 2
Δ p B A = p B o p A o = Δ p n Q B o Q n 2 = Δ p n v A P α Q n 2 p B o = p P Δ p n Q P Q n 2 + Δ p n v A P α Q n 2
F o = p P A P 1 1 α A P Δ p n 1 1 α Q P Q n 2 A P α Δ p n v A P α Q n 2
F o = p P A P 1 1 α A P Δ p n v A P α Q n 2
v | F o = 0 = p P 1 1 α Δ p n A p 2 Q n 2 α 2
With regeneration, the maximum thrust that can be exerted when the rod is extended is only half that which can be generated with a standard circuit. In terms of design, the DCV used for regeneration—A hybrid integrates in its upper part the functions of the check valve and the on–off valve. The connections between the DCV and the branches of the hydraulic circuit, located in the lower part of the valve body, remain unchanged compared to those of a standard DCV. This allows modernizing an existing hydraulic actuator and increasing its energy efficiency by introducing regeneration technology, simply by replacing the body of a conventional directional control valve.

2.2. Standard Configuration

The main elements of the standard architecture are the actuator, a 3-phase 4-pole asynchronous motor with a round case connected directly to the grid, a fixed-displacement vane pump with a maximum pressure at the pressure port of 320 bar, a 1:1:1:1 DCV standard directional control valve, and a pilot-operated proportional pressure relief valve. The power source part of the standard configuration is shown in Figure 5.
A flowchart of the system sizing procedure for the standard configuration is shown in Figure 6. For the other configurations, a similar sizing approach is followed.
Pump sizing is based on pump displacement, maximum speed N m a x p u m p , and maximum pressure p m a x , while motor sizing is based on rated power W n . After selecting the motor and pump types (in this case, a 4-pole 3-phase induction motor and a rotary vane pump), an initial design attempt is performed for the electric motor and pump. The theoretical flow rate of the Q p t h pump must be higher than the flow rate Q required by the load in the most critical condition. The rated power of the electric motor must be higher than the average power required in the cycle by its load, in this case the pump. In the case of an asynchronous drive directly connected to the mains, the motor speed is very close to the rated speed, and in the case of direct connection between the motor and the pump, the speeds of the motor and the pump are the same. Knowing the speed N p u m p and the theoretical flow rate of the pump Q p - th , it is possible to calculate the minimum pump volume V p u m p and select the pump (considering the minimum flow rate, maximum speed, and maximum pressure limits). After determining the effective flow rate of the pump Q p e f f (by subtracting the leakage losses from the theoretical flow rate), it is necessary to verify that it is sufficient under all operating conditions. If this is verified, it is possible to proceed, otherwise another pump size must be selected. Then, the directional valve and the maximum pressure valve are sized: the first one based on the effective flow Q p e f f and the pressure losses between the paths depending on the opening degree; the second one based on the estimated control pressure depending on the characteristic curve (opening pressure p o p e n i n g , flow Q f l o w ). Finally, the torque to be supplied by the motor must be verified. The nominal torque of the motor M n m o t o r must be greater than the root mean square of the torque M R M S l o a d required in the cycle. In estimating M R M S l a s t many factors must be considered, e.g., flow rates, leakage, pressures, the regulated pressure of the relief valve, and the percentage of opening of the DCV. Therefore, the estimation of pressures and flow rates (according to the theoretical approach in Section 2.1.3) is required for the application of the method.
Table 6 shows the main technical data of the selected components; Figure A1 shows the main components; and Figure 7 shows the active electric power absorbed in the cycle for the standard configuration.

2.3. Regenerative Configuration

The regenerative configuration differs from the standard configuration by introducing the regeneration function in the fast descent phase, i.e., when a higher flow rate is required. The DCV valve used allows a new path for the oil flow leaving the chamber on the actuator stem side, the BA path, and this internal path allows regeneration. Therefore, a valve with regeneration A—hybrid is chosen, which allows the introduction of regeneration—A (Figure 8) during the phase in which the spindle requires a high translation speed at the output, and to go to the standard configuration when the spindle must realize a considerable thrust. Table 7 shows the characteristics of the components used in this configuration. The regenerative function allows a significant reduction in the flow rate that must be delivered by the pump during the rapid descent phase: with regeneration, the value is 117 L/min, compared to the 230.8 L/min required without regeneration. Consequently, the motor and electric and pump sizes are significantly reduced, as can be seen from the comparison between data in Table 6 and Table 7.
Table 7 shows the most significant technical data of the chosen components, Figure A2 the main components, and Figure 9 the active electrical power absorbed in the cycle for the regenerative A—hybrid configuration.

2.4. High–Low Configuration

The high–low architecture allows time-varying generation of hydraulic power. The generation of hydraulic power is divided into two distinct phases, such as the initial stroke of the rod, and meets the variable needs of the user rather than considering only the heaviest operating condition. The first phase of power generation takes place during the rapid descent, and the second during the release. Thus, the generation of hydraulic power is divided into a period in which a high oil flow rate is required at relatively low pressure, and a period in which the fluid flow rate is reduced, accompanied by a pressure increase. The designation high–low is due to this change in operating conditions to which the power generation must adapt. This architecture is very suitable for the punching operation carried out by the press. In Figure 10, the circuit diagram of the power generation part for the high–low architecture is reproduced. The system consists of two fixed-displacement hydraulic vane pumps. The pumps are driven by a single round-case asynchronous motor connected directly to the power supply system and have opposite hydraulic characteristics. One pump has a relatively low maximum operating pressure limit and high displacement capacity and is referred to as LPHD (low pressure high displacement). The other pump features a high maximum operating pressure and relatively low displacement and is referred to as HPLD (high pressure low displacement). The effectiveness and proper functioning of this architecture depends largely on the choice of maximum pressure limits that can be achieved when pumping the two pumps and on the displacement of the pumps. The high–low configuration also differs from the standard architecture by the presence of two additional valves: an unloading valve and a check valve. Table 8 shows the characteristics of the components chosen with the high–low architecture for the case study.
From the analysis of the operation of the system, it can be deduced that the shear phase is the only phase in which the flow reaching the actuator is supplied only by the HPLD pump, while in the other phases both pumps contribute to the supply of the cylinder. The values for the opening and closing pressure of the drain valve must be 97.2 bar and 70 bar, respectively. The high–low configuration allows a significant reduction in the size of the electric motor (as seen in a comparison between Table 6, Table 7 and Table 8), and of the maximum pressure range, since the maximum pressure values are no longer required simultaneously.
Table 8 shows the most significant technical data of the chosen components; Figure A3 the main components; and Figure 11 the active electrical power absorbed in the cycle for the high–low configuration.

2.5. VDP Configuration

The VDP configuration has the same elements as the regenerative configuration, except for the pump, which is of the variable-displacement type. In the case study, an axial piston pump is considered. There are several control configurations for a variable-displacement piston pump that allow the theoretical flow rate of the pump to be adjusted during operation. Among the available configurations, the one most suitable for direct comparison with the configurations considered in this analysis must be selected. The discussion will refer to a proportional-displacement closed-loop pressure control (Figure 12).
The main components of the VDP configuration are listed in Table 9, with their main features.
Figure A4 shows the principal components, and Figure 13 shows the active electric power absorbed in the cycle for the VDP configuration.

2.6. DCP Configuration

In this configuration, a square-case three-phase asynchronous motor is connected to the power supply network through an AC frequency converter (inverter), and the motor speed is controlled using vector control, while the pump is a fixed-displacement pump (Figure 14). As with the VDP, it is also possible with the DCP configuration to adjust the flow rate delivered by the pump to the needs of the drive. In this case, however, the flow rate is fixed while the speed is varied. While in the previous configurations the speed of the electric motor varies little around the nominal speed (there are only oscillations caused by the phenomenon of motion irregularity associated with cyclic and periodic loading), in this architecture the asynchronous motor varies its own speed considerably. The transition from one speed to another occurs with acceleration or deceleration ramps that generate non-negligible inertia torques and consequently the profile of the flow rate required by the actuator and the desired pressure at the pump outlet are very different from what characterizes the architectures considered previously. Therefore, two sizing procedures are carried out: in a first phase the inertial actions are neglected, then they are included in the calculations, to verify how much their real contribution is and whether they have a very large impact on the consumption.

2.6.1. DCP Configuration—Static Sizing

The pump selected shall be a fixed-displacement vane pump suitable for variable speed drives and shall be sized so that the allowable speed range will provide the minimum and maximum flow required by the cylinder. Table 10 contains the technical data of the system components for the DCP configuration. For the asynchronous motor in this case, it is advisable to use a different type than in the previous configurations, i.e., an asynchronous motor with a square housing, because although there are no significant differences at the electromechanical level compared to an asynchronous motor with a round housing, the inertia is significantly lower.
Table 10 shows the main technical data of the selected components; Figure A5 the main components; and Figure 15 the active electric power absorbed in the cycle for the static DCP configuration.

2.6.2. DCP Configuration—Dynamic Sizing

If the contribution of the moments of inertia is also considered in the sizing, the size of the pump and the inverter (Table 11) changes compared to the simplified case (Table 10) in which they were neglected. The size of the electric motor, on the other hand, does not change.
Figure A6 shows the main components, and Figure 16 the active electrical power absorbed in the cycle for the DCP dynamic configuration.

3. Results

3.1. Estimated Absorbed Power for the Considered Architectures

For standard, regenerative, high–low, and VPD plant architectures, the inertial effects can usually be neglected; however, this is not true for the architecture with DCP. For the first four architectures, the angular acceleration or deceleration ramps experienced by the asynchronous motor during operation are caused by the phenomenon of motion irregularity. As a result of the cyclic and periodic loading (the motion of the pumping unit), the speed of the electric motor fluctuates in a typically very small range, which is around the rated speed. The resulting moments of inertia generally do not significantly change the electrical active power consumption data. Table 12 summarizes the absorbed active and reactive power in each phase and their values in the cycle for each architecture considered. They have been estimated on the basis of the previously performed dimensioning and the mechanical and electrical analysis of the system.
In Figure 17, the average values of the active power absorbed in the working cycle for each considered architecture are drawn with histograms for a more effective visual comparison. For the regenerative configuration, the white part of the bar shows the energy savings compared to the standard solution. For the other configurations, the portion of energy saved is also visually represented, but the regenerative configuration is used as a reference. The analysis was performed for both the static and dynamic cases for the DCP architecture, and the estimated data of active electrical power consumption with respect to the architectures with DCP show that the estimated average active power consumption is 1.63 kW higher when dynamics are taken into account. This obviously non-negligible difference is caused by the presence of very strong dynamic effects during the operation of the architecture with DCP. In this system architecture, the fluctuations of the motor speed are very large (even on the order of 1000 RPM) and typically occur in times on the order of fractions of a second in the considered application. In contrast, for the architectures that do not use DCP, the motor speed fluctuations are on the order of 10 RPM. In the case of the DCP architecture, therefore, dynamic sizing that takes inertial effects into account provides a more reliable estimate of the energy savings than static sizing.
Figure 18 reports a comparison between the considered architectures, similarly structured to the one in Figure 17, referring in this case to the hourly cost of the electricity absorbed.
The matrix in Table 13 shows the percentage variation between the average active power required by one architecture (in the rows) versus another (in the columns). In Table 14, a similar comparison is reported for absorbed reactive power, and in Table 15 for the hourly cost of absorbing electricity from the power supply grid.

3.2. Experimental Results

Figure 19 reports the results of experimental measurements conducted on the plant in which the architecture with DCP was implemented. More specifically, Figure 19a reports the profile of the absorbed current by phase; Figure 19b reports the electrical active power absorbed by the frequency converter. The average value of the experimentally measured active electric power is 14.85 kW.

4. Discussion

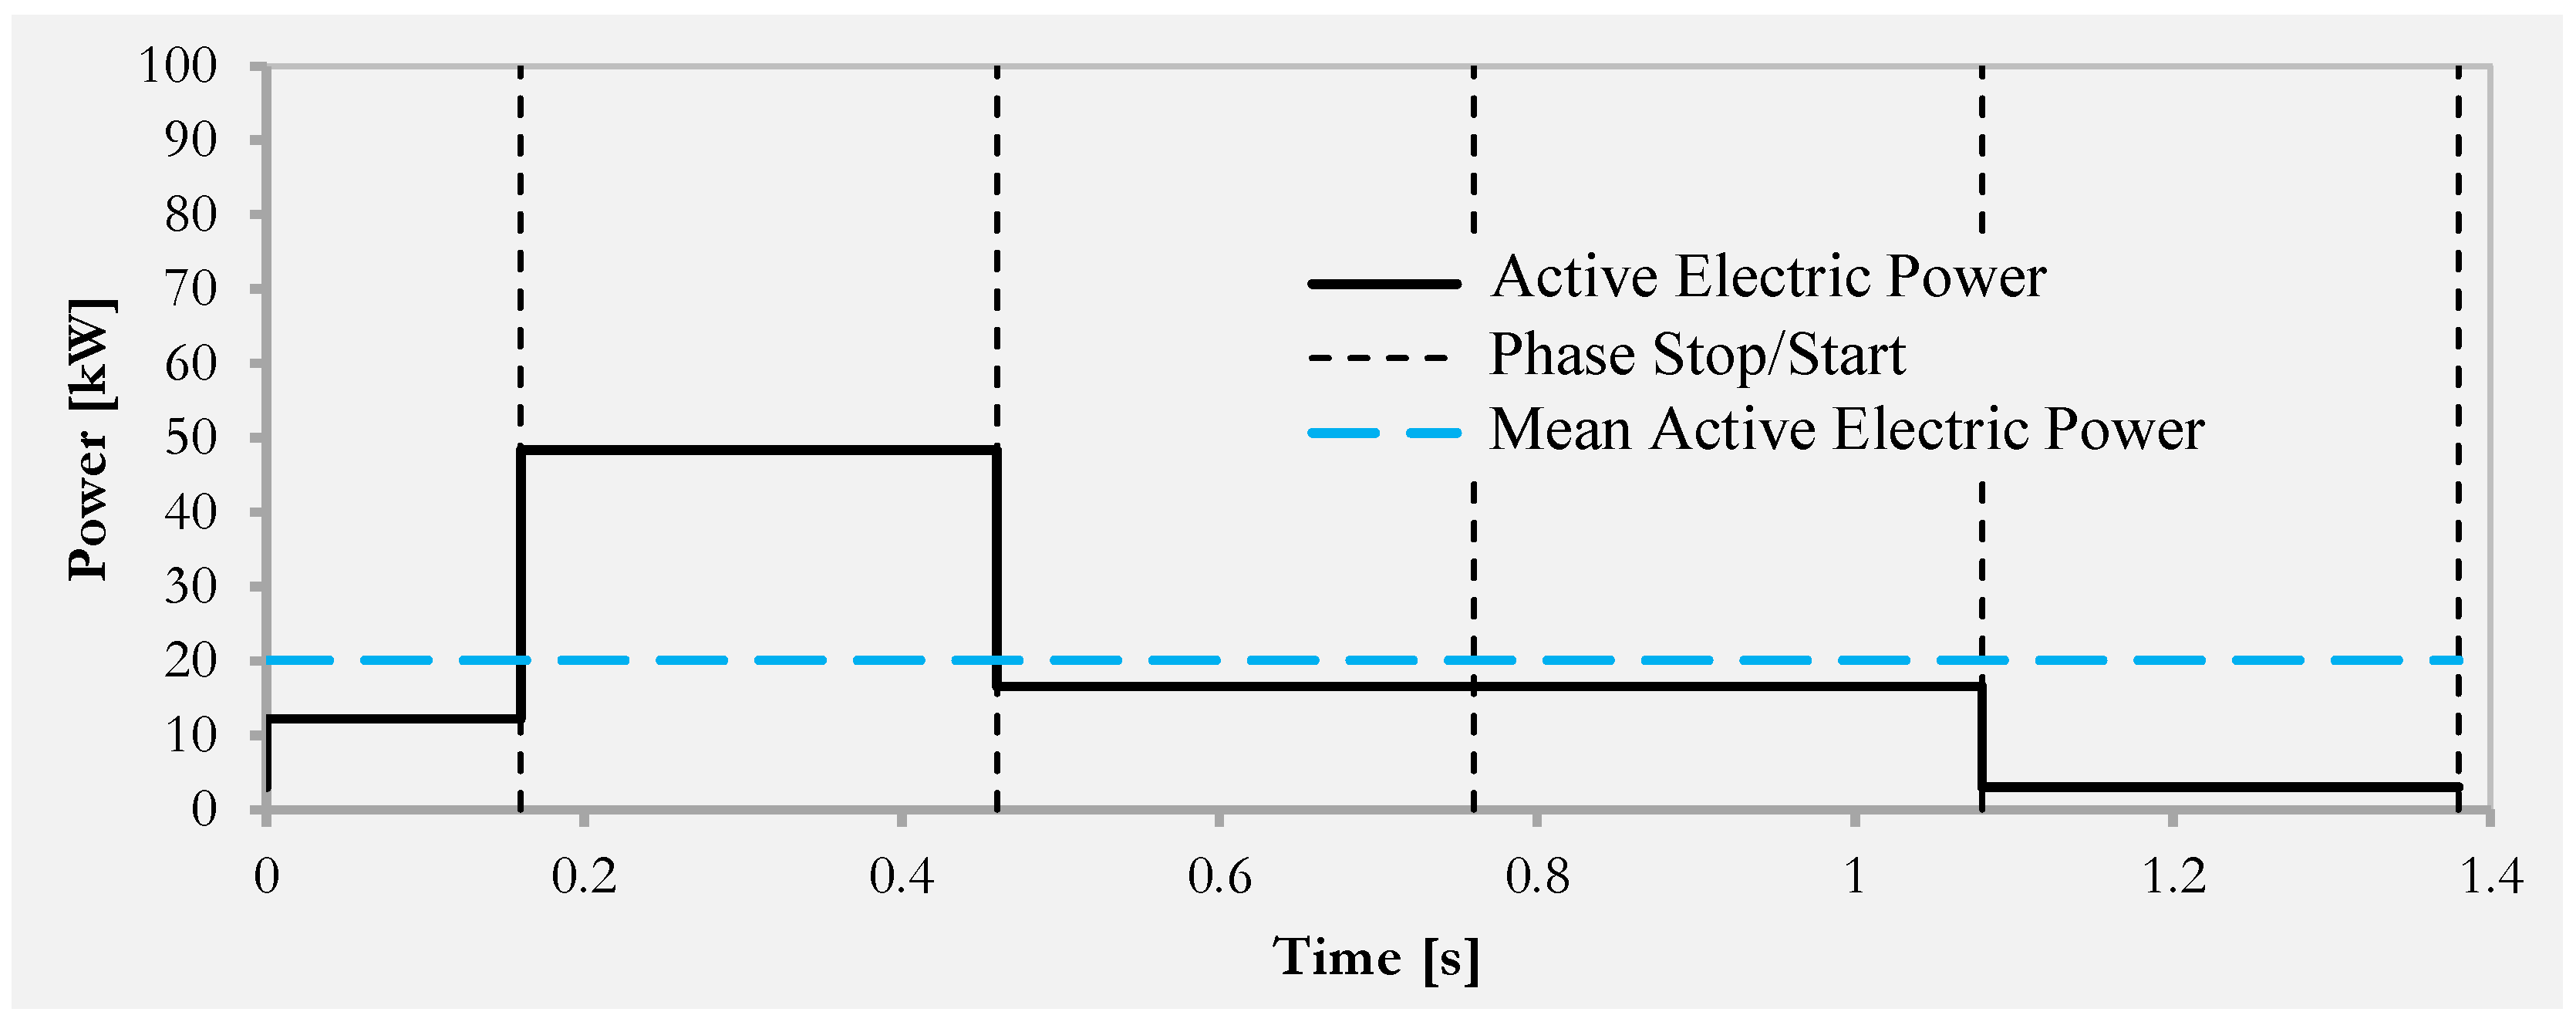
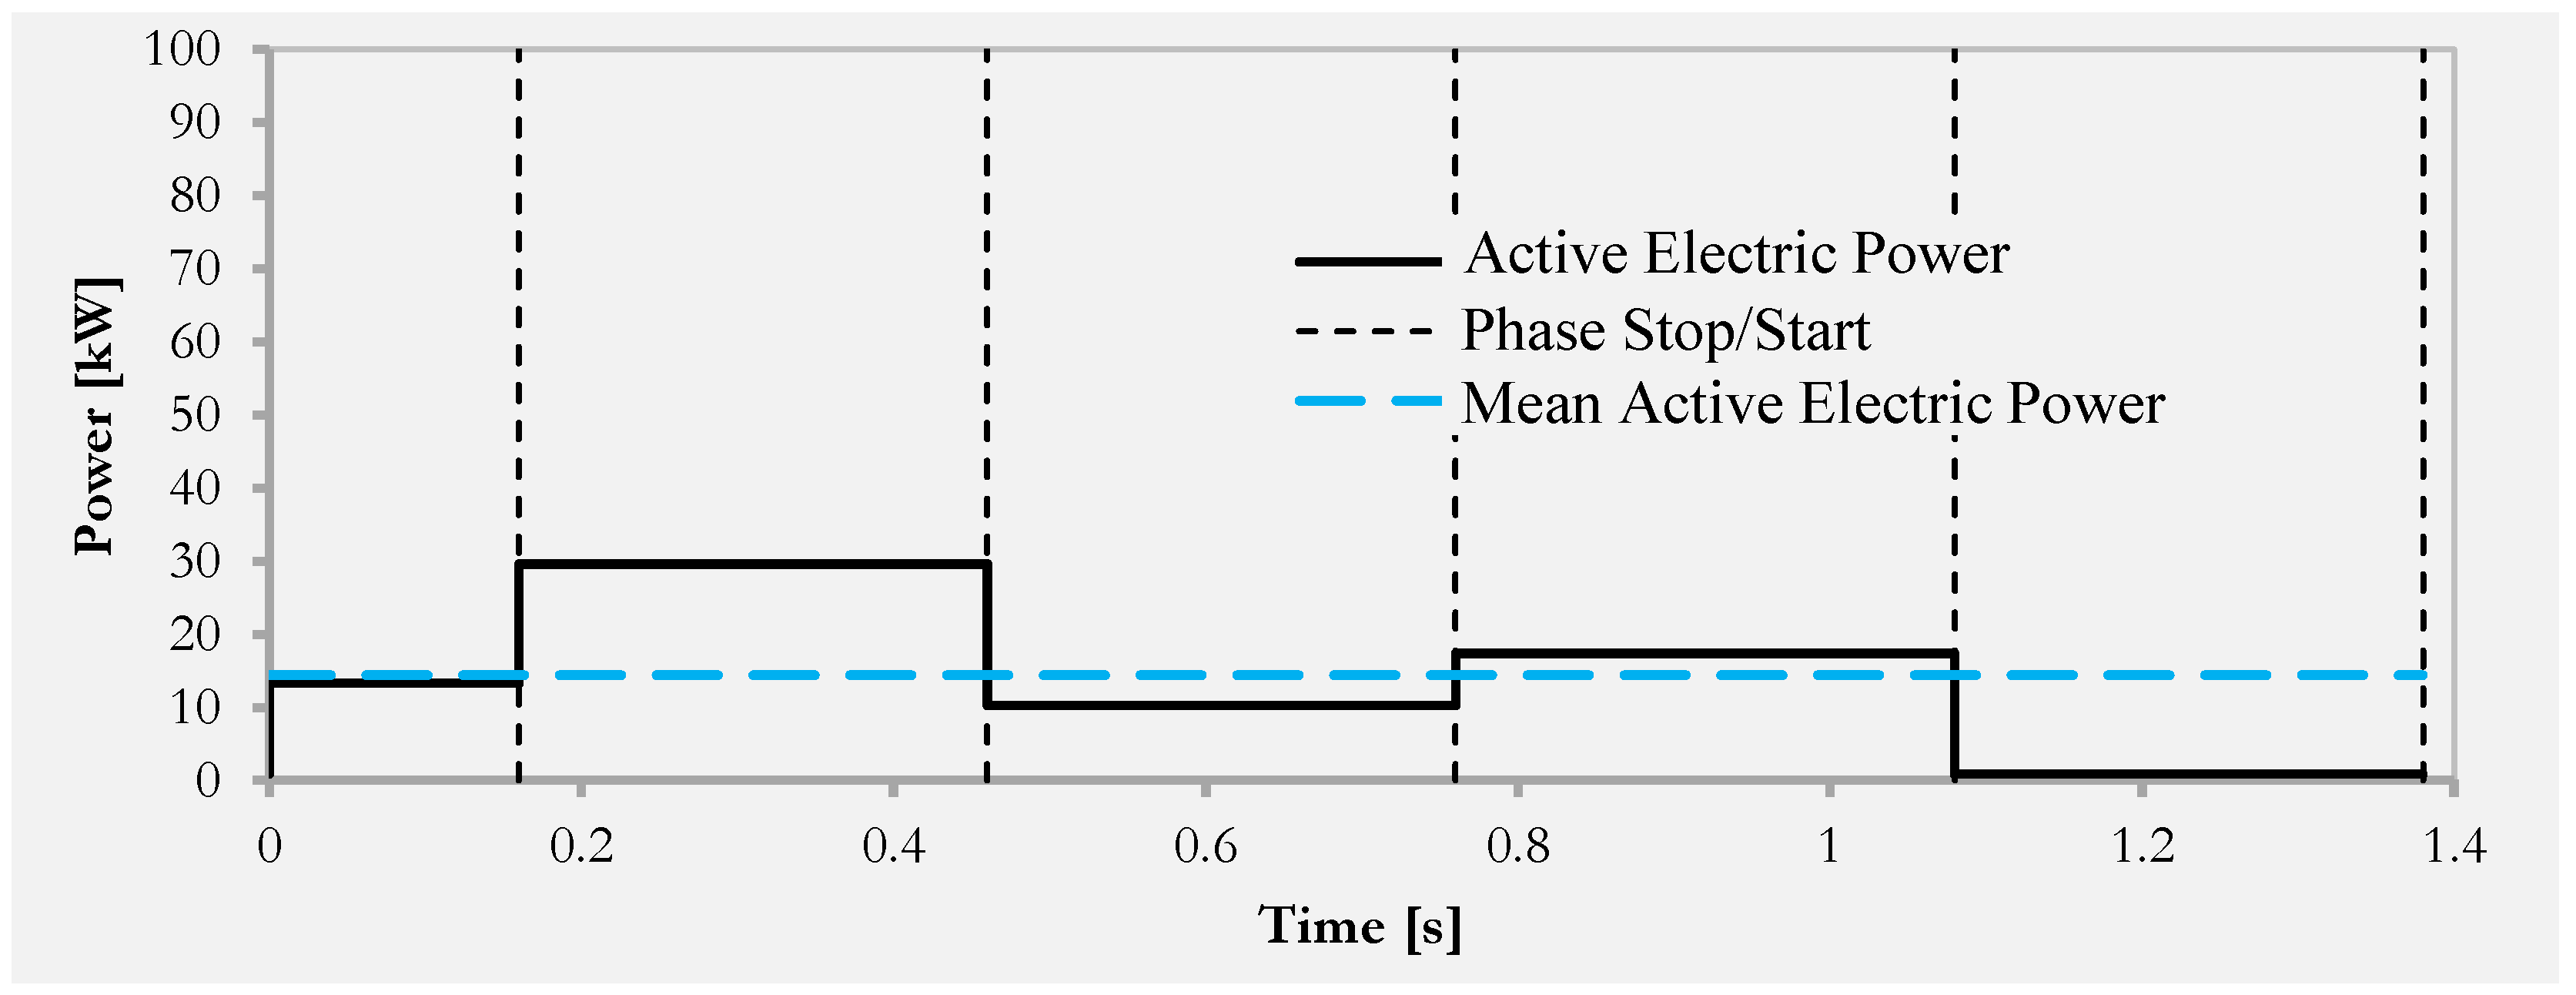
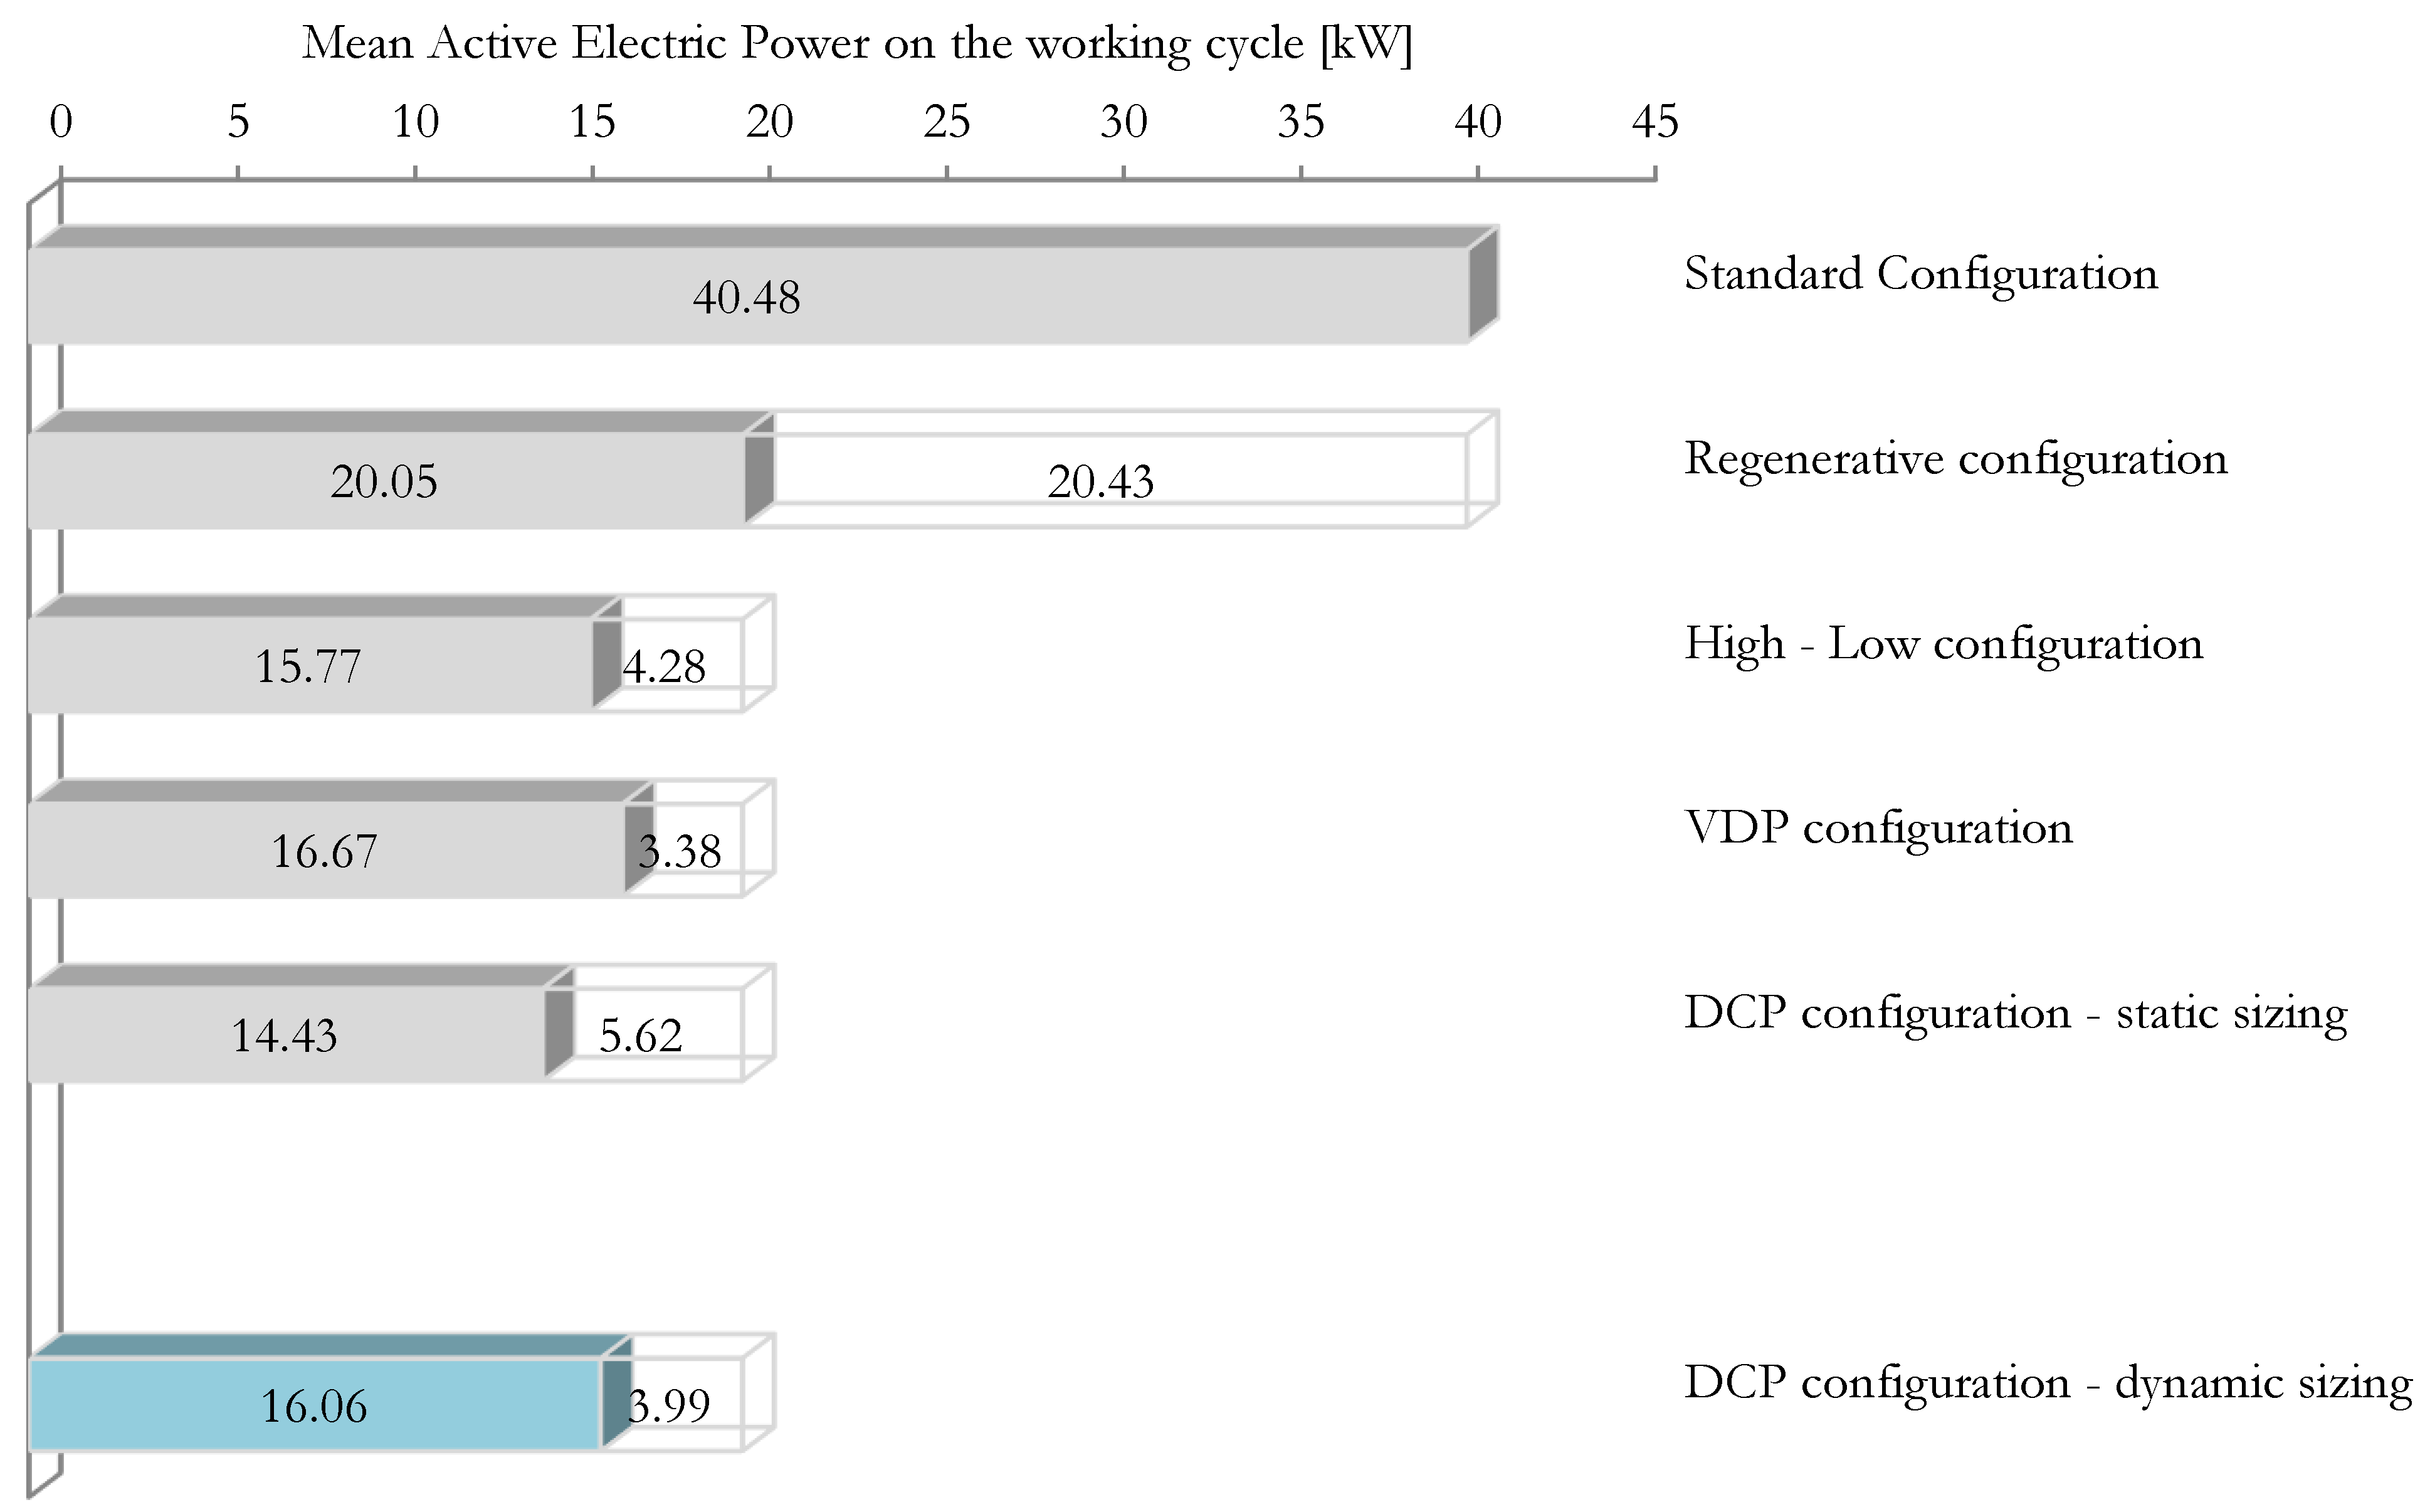
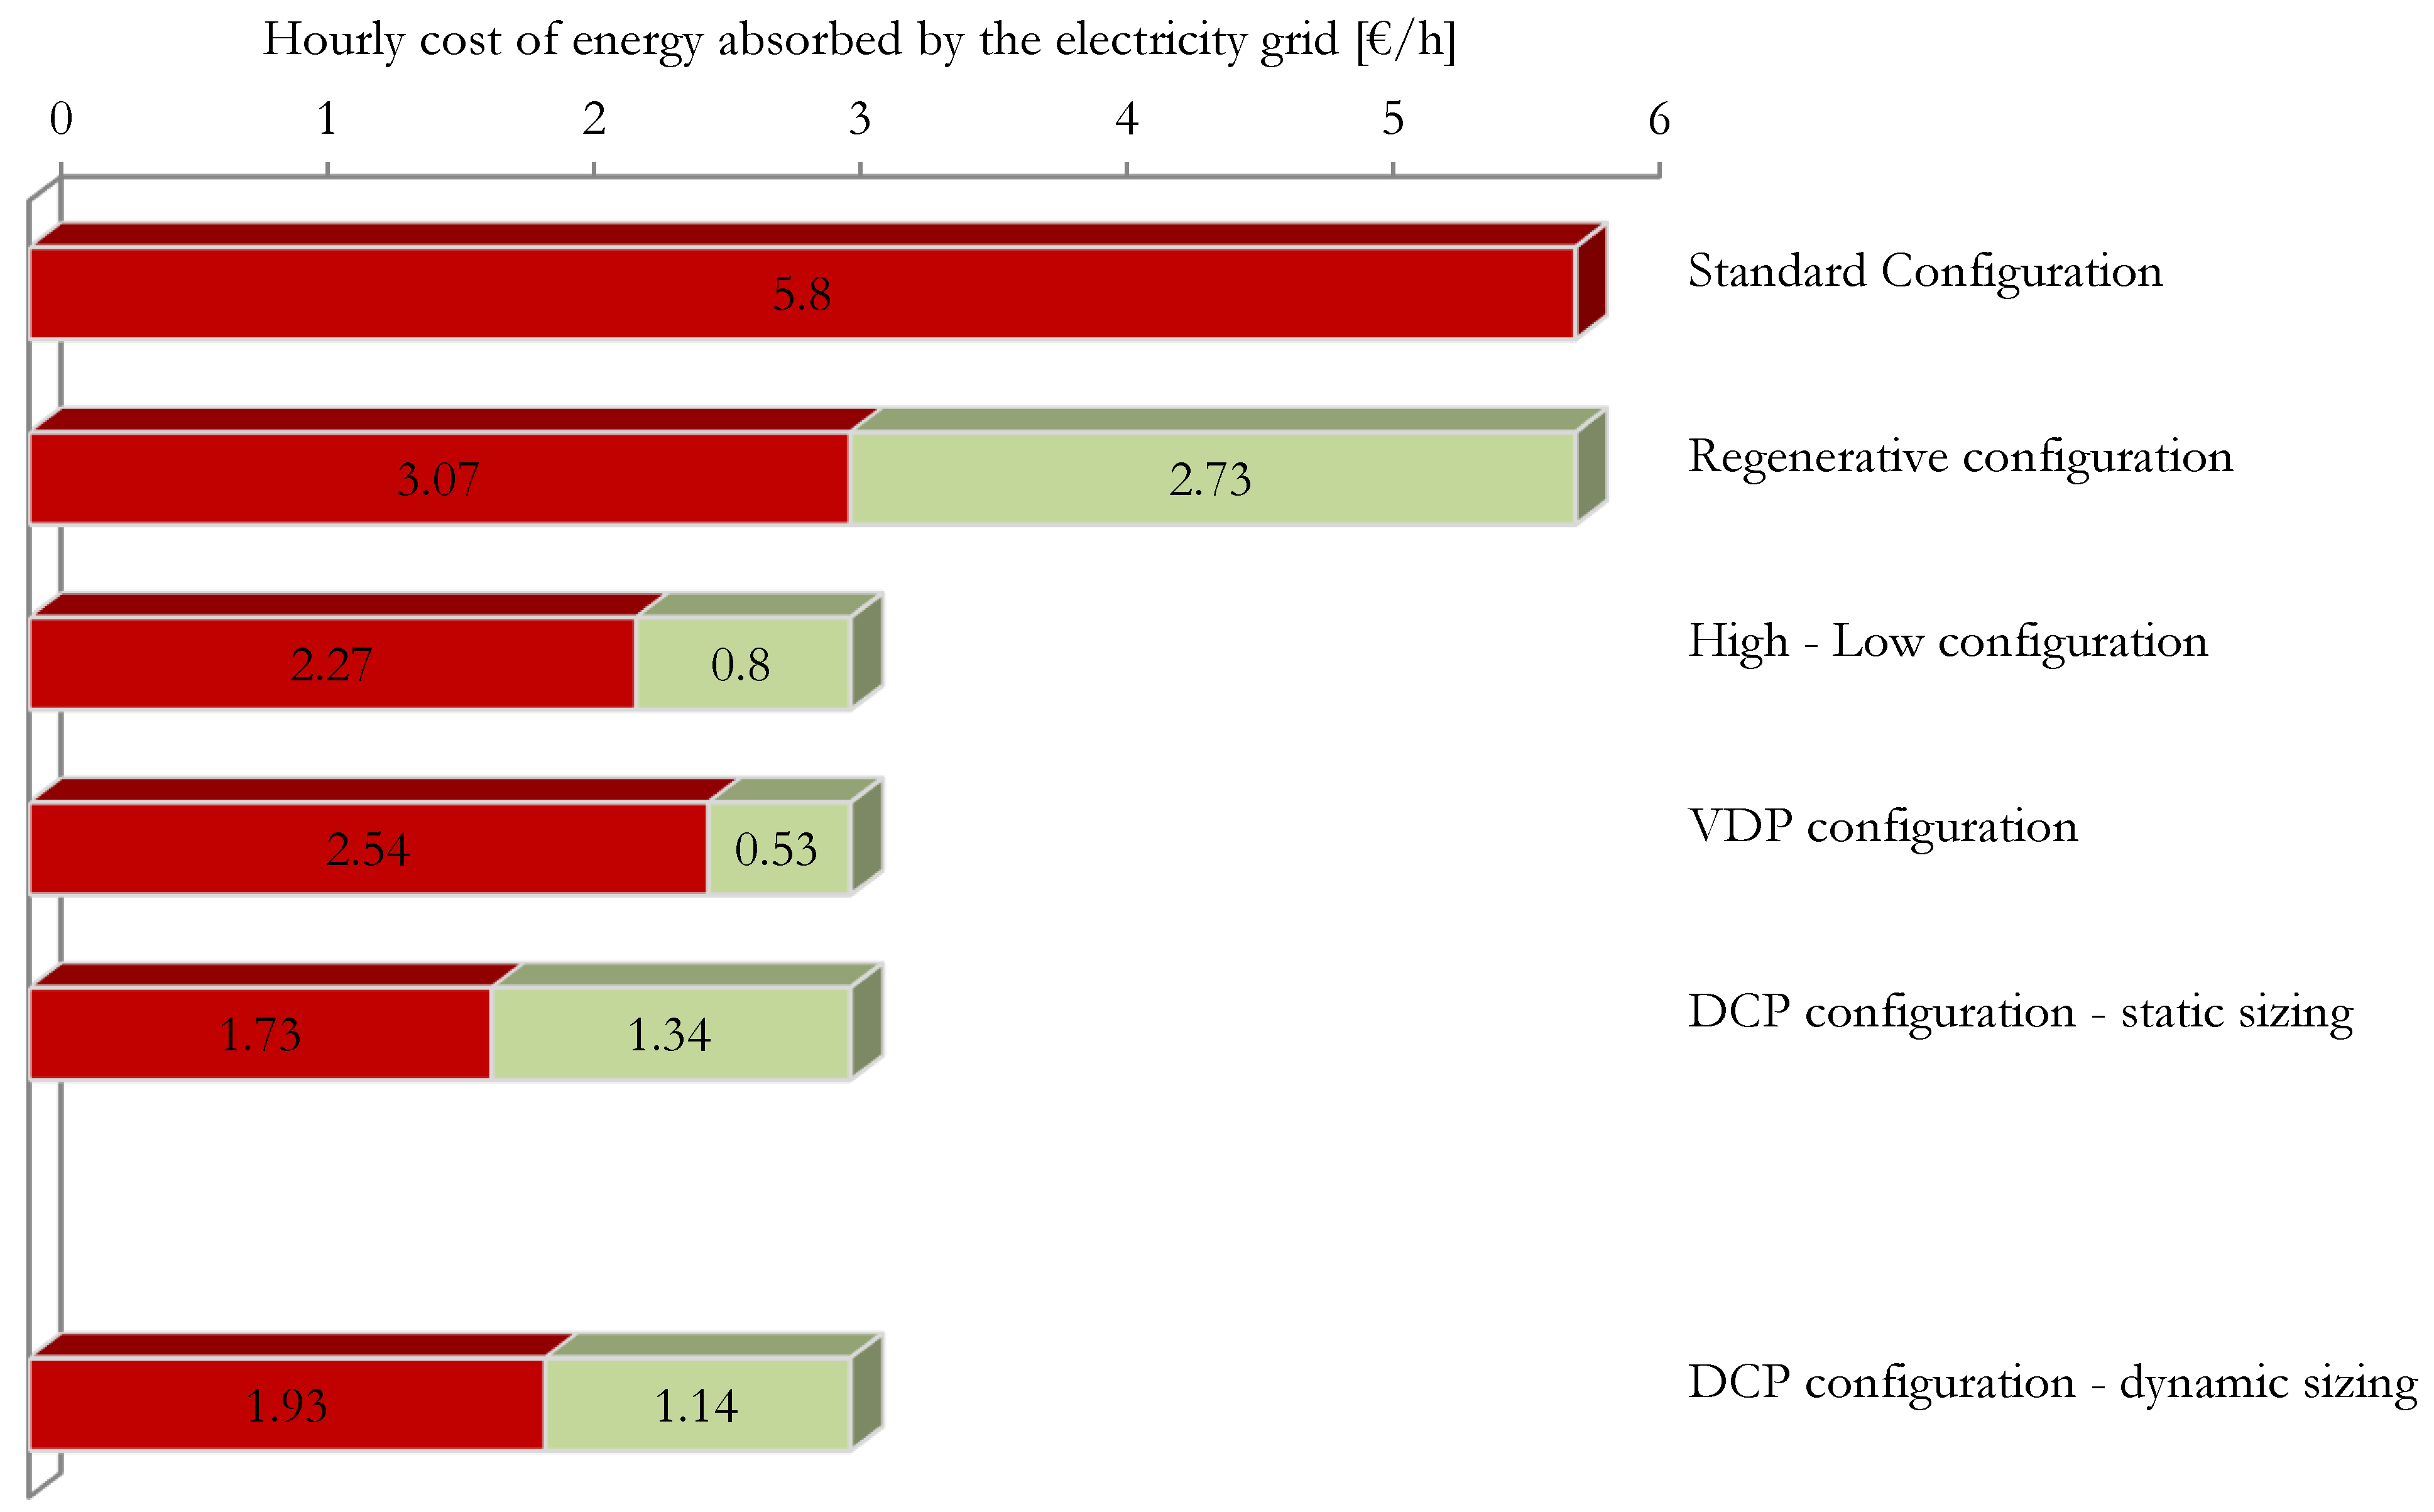
From the analysis performed on the basis of the system modeling, it appears that the difference in the absorbed active power is underestimated by 1.63 kW in the case of the DCP architecture neglecting the dynamic aspects, compared to the case in which the dynamic effects are taken into account. This difference is significant, which is why the following considerations take into account the dynamic DCP architecture.
The introduction of regeneration in the directly controlled valve leads to a reduction in the average active power consumption by 50.5%. In architectures 3, 4, and 5, regeneration is kept as a common element, so the differences in active power consumed are determined only by the differences in the configurations.
From the results summarized in Table 13, it appears that the high–low, VDP, and DCP solutions achieve higher energy efficiency for the plant than the purely renewable architecture. In fact, in all three cases there is a more or less pronounced decrease in the active electric power absorbed from the grid.
The solutions that achieve the greatest savings in terms of active power consumption are, in order, the high–low configuration, followed by DCP, and finally VDP. The difference between the high–low configuration and DCP is very small (1.8%).
The particular efficiency of the high–low architecture for this application is due to the nature of the variable speed industrial process. In fact, the high–low architecture is particularly well suited for operation with phases in which high oil flow rates at low pressure alternate with phases of low liquid flow rates at high pressure. This is typically the case with punching. The lower energy efficiency of the solution with VDP is caused by the additional control oil flow that must be continuously ensured to maintain the flow rate control of the axial piston pump.
Comparing the VDP configuration with the DCP configuration, it can be seen that the DCP configuration provides savings in power consumption, even if the savings are small in the case considered. It can be concluded that the DCP solution is slightly more advantageous than the VDP solution from the point of view of absorbing the average active electric power during the duty cycle, or that the VDP solution is in no way better than the DCP solution.
From the data referring to the active electrical power parameter (Figure 13 and Table 13), the solution with DCP realized a marked advantage over the standard architecture, a slight advantage over the VDP configuration, and a comparable, or even slightly lower, result than the high–low solution.
If, on the other hand, the comparison is made using the cost parameter for electrical energy (based on Italian energy prices), the DCP architecture is significantly cheaper, even compared to the high–low and VDP solutions. This is due to the reactive power component of the electric power (Table 14), for which there are economic disadvantages when there is a high absorption of reactive power from the power grid. In the DCP architecture, these economic disadvantages do not exist. This is ensured by the effect of the capacitor bank present in the drive, which brings the absorbed electrical reactive energy (inductive) below 50% of the active energy or lowers the power factor below the value of 0.9. Therefore, taking into account the contributions of both active and reactive power, the DCP solution is the most advantageous among the solutions studied in terms of energy operating costs, which also results in a saving of 15% compared to the high–low architecture.
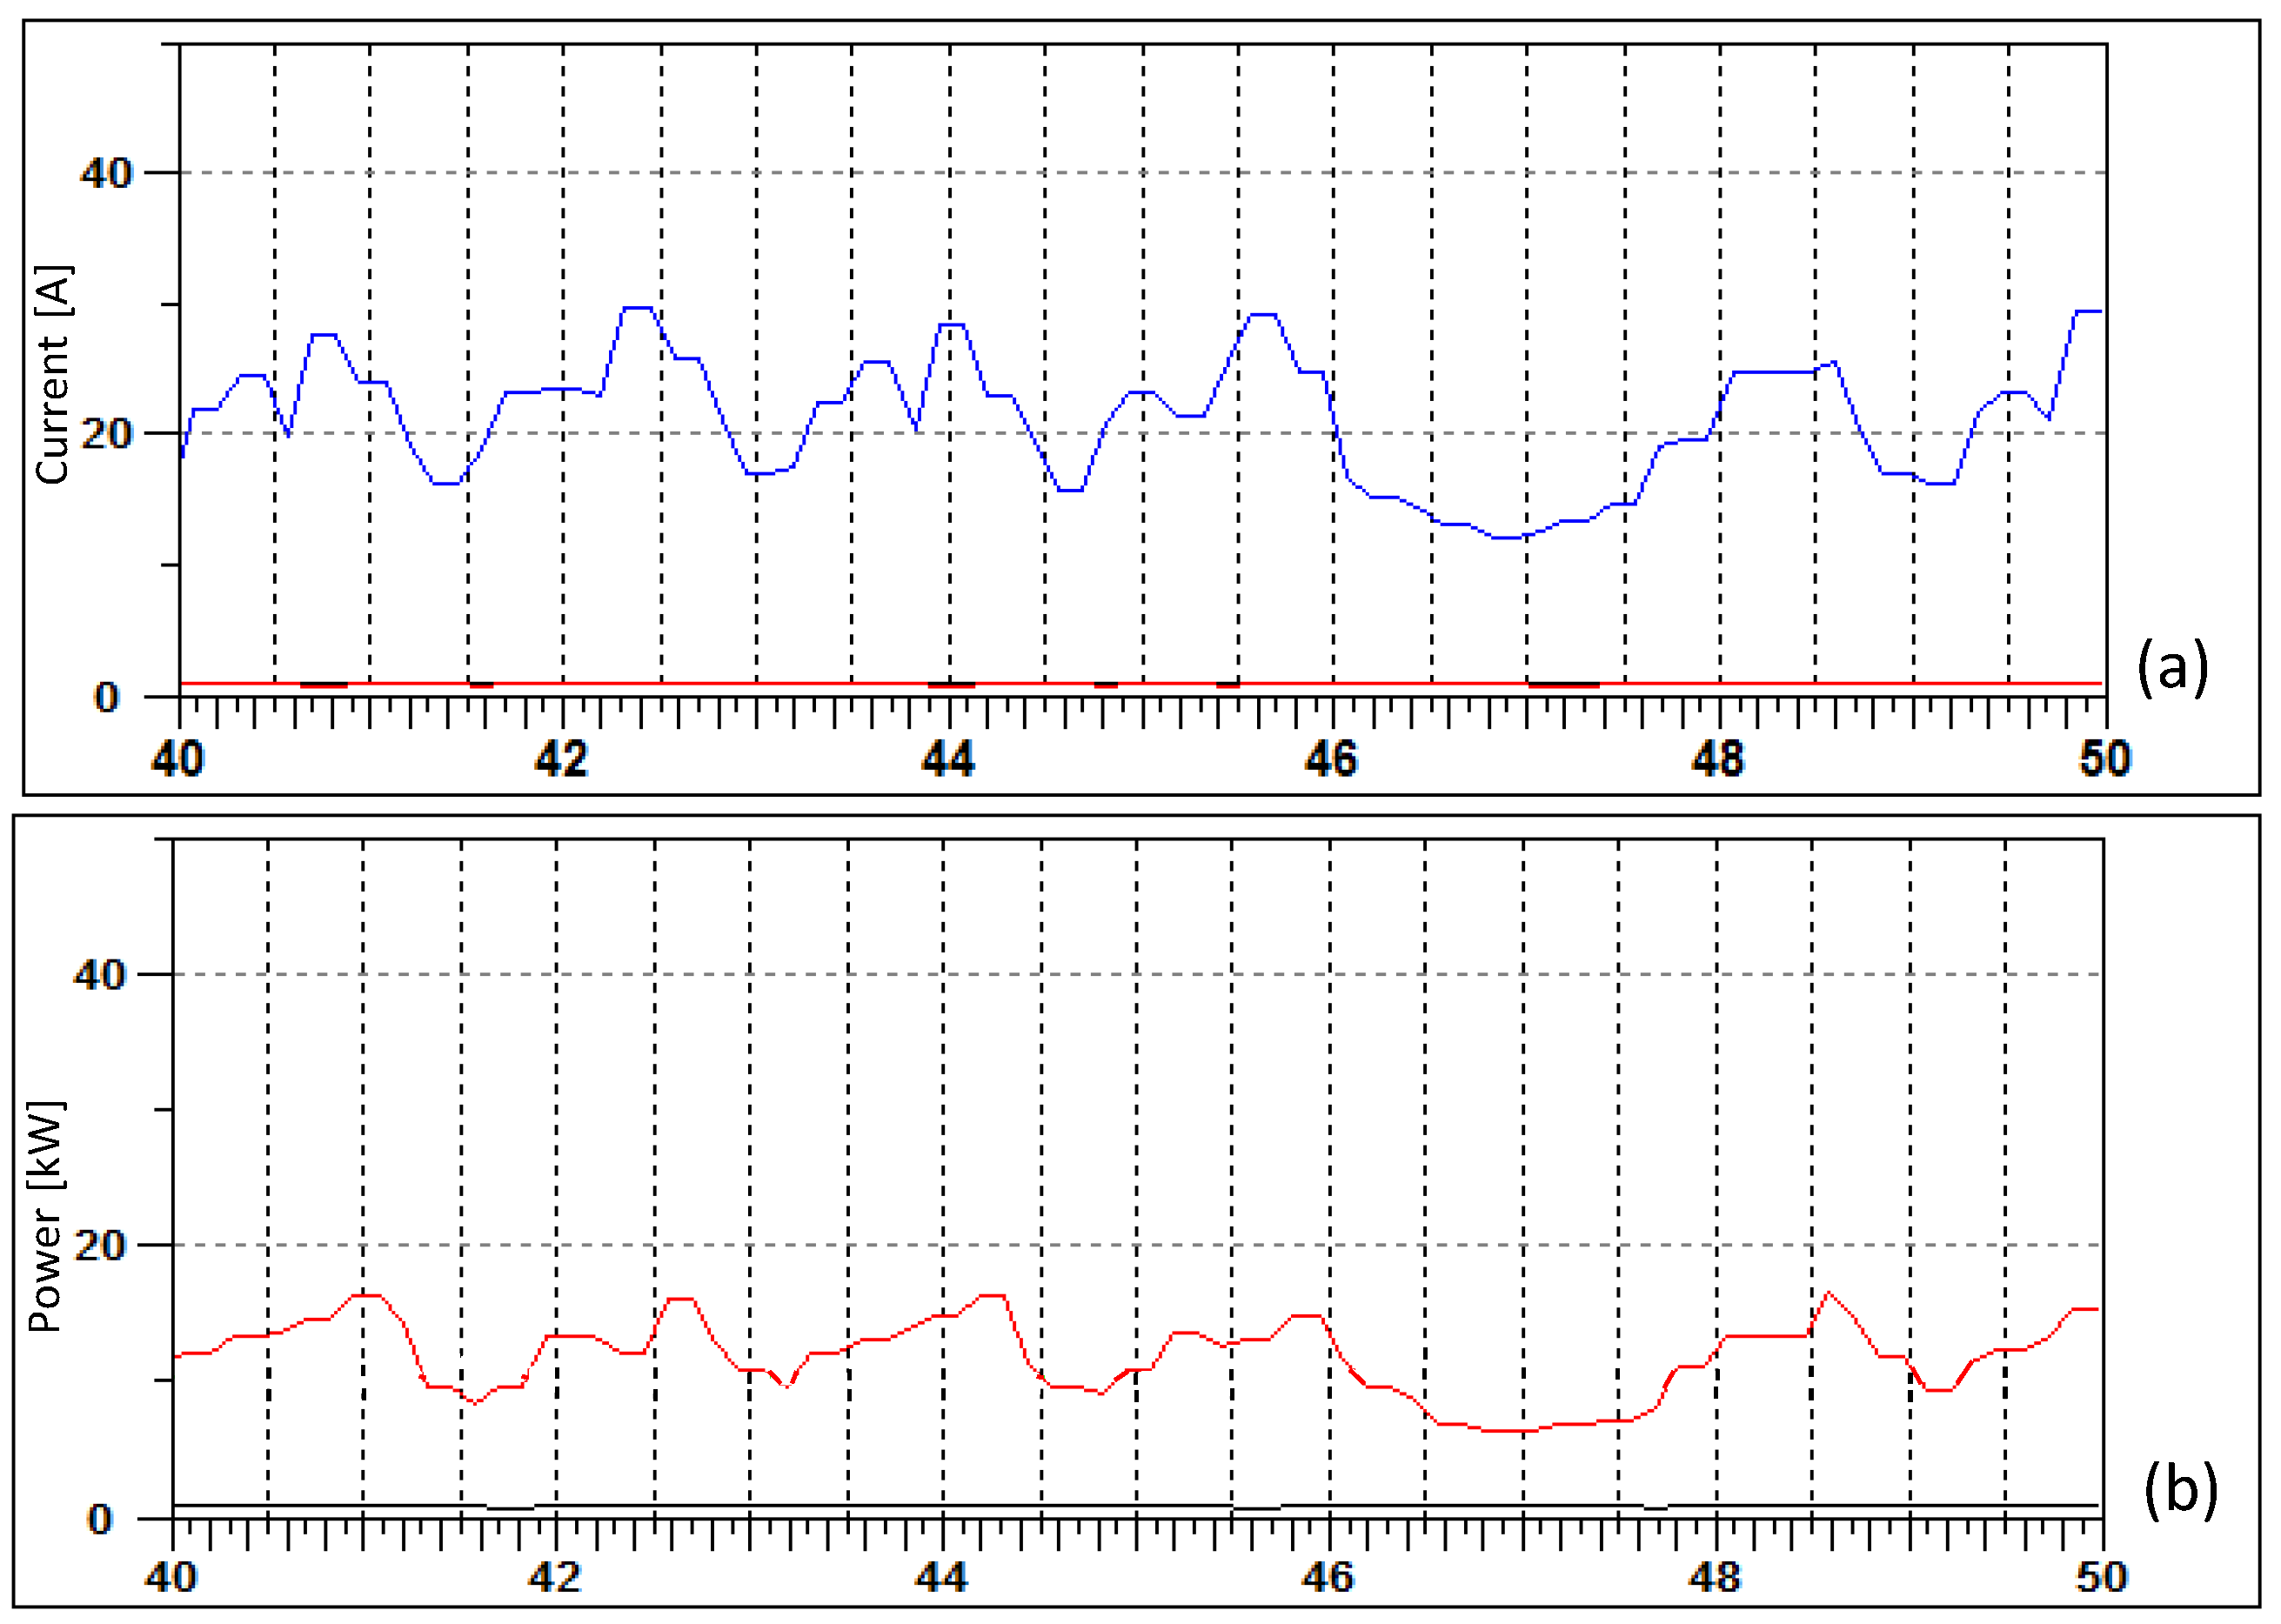
For the case of the architecture with DCP, a comparison can be made between the theoretical absorption of the active electric power input (16.06 kW) and the absorption actually measured on the system in one cycle (14.85 kW). An overestimation of the actual value of about 8% is found. This value is quite low. Therefore, it can be assumed that the performed analysis reflects the reality sufficiently well.

5. Conclusions

The choice of power generation architecture of a hydraulic system has a very large impact on the energy efficiency and operating costs.
All the architectures considered provide a significant reduction in active power consumption compared to the standard architecture, ranging from 50.5% to 64.3%. The hourly cost of electricity absorption is also significantly reduced, with percentages ranging from 47.1% to 70.1%. This shows the importance of the architecture of the system. Moreover, the comparative study of the most common hydraulic architectures used to drive an industrial process with time-varying speeds and work forces has highlighted the differences between the various solutions in quantitative terms and provided objective comparative data that was not available in the literature.
Comparing the values of energy savings with those reported in the literature for different approaches, it can be observed that the values obtained for the considered architectures are consistent with the best ones reported in Table 1. Moreover, it can be deduced that even with a simple and low-cost solution such as regeneration, significant and larger energy savings can be achieved than with the more complex solutions reported in the literature.
The modern hydraulic architecture with drive-controlled pump and DCV with regeneration—A hybrid, limited to the category of industrial processes, is a very efficient solution in terms of energy consumption and economy.
It has been shown that the dynamic phenomena, often overlooked in the sizing, have a significant impact on the total energy absorption.
The oleo-hydraulic architectures studied represent a significant part of the state of the art in hydraulic technology for the actuation of industrial machinery, but not its entirety. Other solutions characterized by high energy efficiency include architectures with high-efficiency square-case induction motors or architectures with a brushless synchronous electric motor and an internally geared pump.
Another oleo-hydraulic architecture that could be explored, but which is a poor fit for the industrial process example, involves the use of an accumulator installed in parallel with a fixed-displacement pump.
Furthermore, from an economic point of view, the analysis could be complemented by an analysis of the initial investment costs required for each architecture considered.
However, it can be concluded that energy-conscious decisions for the power architecture of a hydraulic axis can benefit from the presented analysis.

Funding

This research received no external funding.

Acknowledgments

Acknowledgement of the valuable technical contribution of the engineers Davide Ceppelli, Alessandro Pennacchio, and Felice Lanzetti.

Conflicts of Interest

The authors declare no conflict of interest.

Abbreviations and Nomenclature

Abbreviations

The following abbreviations are used in this manuscript:
ERSEnergy regeneration system
SISingle-valve independent control
SMISMOSeparate meter in and separate meter out control
DPDual valve parallel control
DCPDirect-driven pump-controlled hydraulic system
DCVDirectional control valve
CDSCombined drive system
HIMMsHydraulic injection molding machines
FCForce control
EHVDPSElectro-hydraulic variable-displacement pump system
LSCLoad-sensing control
CSPCConstant supply pressure control
VDPVariable-displacement pump
QDQuick descent
BBlanking
EExpulsion
QRQuick rise
TRTable rotation

Nomenclature

The following mathematical symbols are used in this manuscript:
sStroke
vVelocity
ϕ c Cylinder bore
ϕ r Rod bore
A P Piston area in the rear chamber side
A T Piston area in the front chamber side
α Cylinder area ratio
Q A o Outward flow rate from the rear chamber
Q B o Outward flow rate from the front chamber
Q A i Inward flow rate into the rear chamber
Q B i Inward flow rate into the front chamber
p P Pressure at the delivery of the pump
p T Pressure inside the tank
Q n Nominal flow rate
Q x Generic flow rate
Δ p n Nominal pressure drop
Δ p x Generic pressure drop
Δ p P A           Pressure drop on the PA way
Δ p A T Pressure drop on the AT way
Δ p P B Pressure drop on the PB way
Δ p B T Pressure drop on the BT way
p B o Pressure in the front chamber for the outward stroke
p A o Pressure in the rear chamber for the outward stroke
p B i Pressure in the front chamber for the inward stroke
p A i Pressure in the rear chamber for the inward stroke
F o Thrust force
F i Pull force
v m a x o Maximum rod speed during the outward stroke
v m a x i Maximum rod speed during the inward stroke
Q p t h Theoretical pump flow rate
Q p e f f Effective pump flow rate
W n Electric motor nominal power
V P Pump displacement
N m a x p u m p Maximum pump speed
p m a x Maximum pump pressure
Q l o a d Flow rate required by the load
p o p e n i n g Pressure relief valve opening pressure
p R E G Regulated pressure of the pressure relief valve
Q d i s c h a r g e d Flow rate discharged through the pressure relief valve
M n m o t o r Nominal torque of the electric motor
M R M S l o a d Root mean square torque required by the load

Appendix A. Main Components for Each Considered Configuration

In this appendix, the chosen main components for each considered configuration are shown.
Figure A1. Main components of the standard configuration.
Applsci 13 10066 g0a1
Figure A2. Main components of the regenerative A—hybrid configuration.
Applsci 13 10066 g0a2
Figure A3. Main components of high–low configuration.
Applsci 13 10066 g0a3
Figure A4. Main components of VDP configuration.
Applsci 13 10066 g0a4
Figure A5. Main components of DCP static configuration.
Applsci 13 10066 g0a5
Figure A6. Main components of DCP dynamic configuration.
Applsci 13 10066 g0a6

References

  1. Yagi, M.; Managi, S. The spillover effects of rising energy prices following 2022 Russian invasion of Ukraine. Econ. Anal. Policy 2023, 77, 680–695. [Google Scholar] [CrossRef]
  2. Hu, Y.; Man, Y. Energy consumption and carbon emissions forecasting for industrial processes: Status, challenges and perspectives. Renew. Sustain. Energy Rev. 2023, 182, 113405. [Google Scholar] [CrossRef]
  3. Li, B. Modeling Energy Consumption in the Production Processes of Industrial Units Based on Load Response Programs in the Energy Market. Energy Eng. J. Assoc. Energy Eng. 2023, 120, 461–481. [Google Scholar] [CrossRef]
  4. Xu, Z.; Liu, Y.; Hua, L.; Zhao, X.; Guo, W. Energy analysis and optimization of main hydraulic system in 10,000 kN fine blanking press with simulation and experimental methods. Energy Convers. Manag. 2019, 181, 143–158. [Google Scholar] [CrossRef]
  5. Yan, X.; Chen, B.; Yin, F.; Ji, H.; Ma, Z.; Nie, S. Energy optimization of main hydraulic system in a forging press by simulation and experimental methods. Energy 2023, 277, 127620. [Google Scholar] [CrossRef]
  6. Mahato, A.C.; Ghoshal, S.K. An Overview of Energy Savings Approaches on Hydraulic Drive Systems. Int. J. Fluid Power 2020, 21, 81–118. [Google Scholar] [CrossRef]
  7. Schmidt, C.; Li, W.; Thiede, S.; Kara, S.; Herrmann, C. A Methodology for Customized Prediction of Energy Consumption in Manufacturing Industries. Int. J. Precis. Eng.-Manuf.-Green Technol. 2015, 2, 163–172. [Google Scholar] [CrossRef]
  8. Lyu, L.; Chen, Z.; Member, S.; Yao, B.; Member, S. Energy Saving Motion Control of Independent Metering Valves and Pump Combined Hydraulic System. IEEE Asme Trans. Mechatron. 2019, 24, 1909–1920. [Google Scholar] [CrossRef]
  9. Rana, M.; Nahian, S.A.; Chowdhury, H. Energy efficiency improvement of a vertical hydraulic system Energy Efficiency Improvement of a Vertical Hydraulic System. In AIP Conference Proceedings; AIP Publishing: New York, NY, USA, 2022; Volume 2681. [Google Scholar]
  10. Helian, B.; Chen, Z.; Yao, B. Energy-saving and accurate motion control of a hydraulic actuator with uncertain negative loads. Chin. J. Aeronaut. 2021, 34, 253–264. [Google Scholar] [CrossRef]
  11. Niu, S.; Wang, J.; Zhao, J.; Shen, W.; Yang, J. A Novel Multifunctional Energy-saving Electro-hydraulic Servo System. In Proceedings of the 2021 IEEE/ASME International Conference on Advanced Intelligent Mechatronics (AIM), Delft, Netherlands, 12–16 July 2021; IEEE: Toulouse, France, 2021; pp. 314–319. [Google Scholar] [CrossRef]
  12. Dindorf, R.; Wos, P. Energy-Saving Hot Open Die Forging Process of Heavy Steel Forgings on an Industrial Hydraulic. Energies 2020, 13, 1620. [Google Scholar] [CrossRef]
  13. Huang, H.; Zou, X.; Li, L.; Li, X.; Liu, Z. Energy-Saving Design Method for Hydraulic Press Drive System with Multi Energy—Saving Design Method for Hydraulic Press Drive System with Multi Motor—Pumps. Int. J. Precis. Eng.-Manuf.-Green Technol. 2019, 6, 223–234. [Google Scholar] [CrossRef]
  14. Koitto, T.; Calonius, O.; Kauranne, H.; Minav, T.; Pietola, M. Enhanced energy efficiency of industrial application by direct driven hydraulic unit. In Proceedings of the 2018 Global Fluid Power Society PhD Symposium (GFPS), Samara, Russia, 18–20 July 2018; IEEE: Toulouse, France, 2018; pp. 1–6. [Google Scholar] [CrossRef]
  15. Li, L.; Huang, H.; Zhao, F.; Sutherland, J.W.; Liu, Z. An Energy-Saving Method by Balancing the Load of Operations for Hydraulic Press. IEEE Asme Trans. Mechatron. 2017, 22, 2673–2683. [Google Scholar] [CrossRef]
  16. Wang, T.; Wang, Q. An Energy-Saving Pressure-Compensated Hydraulic System With Electrical Approach. IEEE/Asme Trans. Mechatron. 2014, 19, 570–578. [Google Scholar] [CrossRef]
  17. Duflou, J.R.; Sutherland, J.W.; Dornfeld, D.; Herrmann, C.; Jeswiet, J.; Kara, S.; Hauschild, M.; Kellens, K. CIRP Annals—Manufacturing Technology Towards energy and resource efficient manufacturing: A processes and systems approach. CIRP Ann.—Manuf. Technol. 2012, 61, 587–609. [Google Scholar] [CrossRef]
  18. Lin, T.; Chen, Q.; Ren, H.; Huang, W.; Chen, Q.; Fu, S. Review of boom potential energy regeneration technology for hydraulic construction machinery. Renew. Sustain. Energy Rev. 2017, 79, 358–371. [Google Scholar] [CrossRef]
  19. Ho, T.H.; Le, T.D. Development and Evaluation of Energy-Saving Electro-Hydraulic Actuator. Actuators 2021, 10, 302. [Google Scholar] [CrossRef]
  20. Schmidt, L.; Hansen, K.V. Electro-Hydraulic Variable-Speed Drive Networks;Idea, Perspectives, and Energy Saving Potentials. Energies 2022, 15, 1228. [Google Scholar] [CrossRef]
  21. Zhao, K.; Liu, Z.; Yu, S.; Li, X.; Huang, H.; Li, B. Analytical energy dissipation in large and medium-sized hydraulic press. J. Clean. Prod. 2015, 103, 908–915. [Google Scholar] [CrossRef]
  22. Zhang, Y.L.; Li, W.G. A precisive calculation method of volumetric and hydraulic efficiency of centrifugal pumps. Phys. Fluids 2023, 35, 077104. [Google Scholar] [CrossRef]
  23. Benić, J.; Brezak, D.; Željko, Š.; Kolar, D.; Lisjak, D. Detailed experimental comparison of energy efficiency between proportional and direct driven hydraulic system. Results Eng. 2023, 18, 101178. [Google Scholar] [CrossRef]
  24. Chiang, M.H.; Yeh, Y.P.; Yang, F.L.; Chen, Y.N. Integrated control of clamping force and energy-saving in hydraulic injection moulding machines using decoupling fuzzy sliding-mode control. Int. J. Adv. Manuf. Technol. 2005, 27, 2673–2683. [Google Scholar] [CrossRef]
  25. Tiboni, M.; Borboni, A.; Vérité, F.; Bregoli, C.; Amici, C. Sensors and Actuation Technologies in Exoskeletons: A Review. Sensors 2022, 22, 884. [Google Scholar] [CrossRef] [PubMed]
  26. Tiboni, M.; Amici, C. Soft Gloves: A Review on Recent Developments in Actuation, Sensing, Control and Applications. Actuators 2022, 11, 232. [Google Scholar] [CrossRef]
  27. Cho, B.; Kim, S.W.; Shin, S.; Oh, J.H.; Park, H.S.; Park, H.W. Energy-Efficient Hydraulic Pump Control for Legged Robots Using Model Predictive Control. IEEE ASME Trans. Mechatron. 2023, 28, 3–14. [Google Scholar] [CrossRef]
  28. Yang, K.; Rong, X.; Zhou, L.; Li, Y. Modeling and Analysis on Energy Consumption of Hydraulic Quadruped Robot for Optimal Trot Motion Control. Appl. Sci. 2019, 9, 1771. [Google Scholar] [CrossRef]
  29. Ntsiyin, T.; Markus, E.D.; Masheane, L. A Survey of Energy-Efficient Electro-hydraulic Control System for Collaborative Humanoid Robots. In Proceedings of the IOT with Smart Systems; Senjyu, T., Mahalle, P., Perumal, T., Joshi, A., Eds.; Springer Nature: Singapore, 2022; pp. 65–77. [Google Scholar]
  30. Fang, D.; Shang, J.; Xue, Y.; Yang, J.; Wang, Z. Energy-Saving Control of a Novel Hydraulic Drive System for Field Walking Robot. IOP Conf. Ser. Mater. Sci. Eng. 2018, 301, 12141. [Google Scholar] [CrossRef]
  31. Moshayedi, A.J.; Shuvam Roy, A.; Sambo, S.K.; Zhong, Y.; Liao, L. Review On: The Service Robot Mathematical Model. EAI Endorsed Trans. Robot. 2022, 1, 8. [Google Scholar] [CrossRef]
  32. Zhang, J.; Xue, Y.; Yang, J.H.; Wang, Z.; Shang, J.Z. Mobile Robot Hydraulic Drive Energy-Saving Circuit Simulation Based on the High-Frequency Switching Valve. Appl. Mech. Mater. 2013, 278, 568–575. [Google Scholar] [CrossRef]
  33. Teguede, A.; Kamsu-foguem, B.; Houe, R. Advances in Engineering Software Health condition monitoring of a complex hydraulic system using Deep Neural Network and DeepSHAP explainable XAI. Adv. Eng. Softw. 2023, 175, 103339. [Google Scholar] [CrossRef]
  34. Tiboni, M.; Remino, C.; Bussola, R.; Amici, C. A Review on Vibration-Based Condition Monitoring of Rotating Machinery. Appl. Sci. 2022, 12, 972. [Google Scholar] [CrossRef]
  35. Tiboni, M.; Incerti, G.; Remino, C.; Lancini, M. Comparison of signal processing techniques for condition monitoring based on artificial neural networks. Appl. Cond. Monit. 2019, 15, 179–188. [Google Scholar] [CrossRef]
  36. Gu, L.; Shi, Y. Online Monitoring Technique of Power Condition for Inverter-Fed Motor Driven Hydraulic System. Math. Probl. Eng. 2019, 2019, 4908942. [Google Scholar] [CrossRef]
  37. Tiboni, M.; Remino, C. Condition monitoring of a mechanical indexing system with artificial neural networks. In Proceedings of the WCCM 2017—1st World Congress on Condition Monitoring, London, UK, 13–16 June 2017; British Institute of Non-Destructive Testing: Northampton, UK, 2017. [Google Scholar]
  38. Makansi, F.; Schmitz, K. Data-Driven Condition Monitoring of a Hydraulic Press Using Supervised Learning and Neural Networks. Energies 2022, 15, 6217. [Google Scholar] [CrossRef]
  39. Quan, Z.; Quan, L.; Zhang, J. Review of energy ef fi cient direct pump controlled cylinder electro-hydraulic technology. Renew. Sustain. Energy Rev. 2014, 35, 336–346. [Google Scholar] [CrossRef]
  40. Ketelsen, S.; Padovani, D.; Andersen, T.O.; Ebbesen, M.K.; Schmidt, L. Classification and Review of Pump-Controlled Differential Cylinder Drives. Energies 2019, 12, 1293. [Google Scholar] [CrossRef]
  41. Shen, W.; Huang, H.; Pang, Y.; Su, X. Review of the Energy Saving Hydraulic System Based on Common Pressure Rail. IEEE Access 2017, 5, 655–669. [Google Scholar] [CrossRef]
  42. Xu, B.; Shen, J.; Liu, S.; Su, Q.; Zhang, J. Research and Development of Electro—Hydraulic Control Valves Oriented to Industry 4.0: A Review. Chin. J. Mech. Eng. 2020, 33, 29. [Google Scholar] [CrossRef]
  43. Rydberg, K.E. Energy Efficient Hydraulics—System solutions for loss minimization. In Proceedings of the National Conference on Fluid Power, Linköping University, Linköping, Sweden, 16–17 March 2015; pp. 16–17. [Google Scholar]
Figure 1. Pressing system considered as a case study and main constituent elements. The vertical hydraulic cylinder of the press is located in the dashed square.
Applsci 13 10066 g001
Figure 2. Cyclogram with periodic cyclic loading at negligible dynamics.
Applsci 13 10066 g002
Figure 3. Flowchart of cylinder sizing.
Applsci 13 10066 g003
Figure 4. Symbols for theoretical analysis of the system.
Applsci 13 10066 g004
Figure 5. Standard architecture power source scheme.
Applsci 13 10066 g005
Figure 6. Standard architecture: system sizing flowchart.
Applsci 13 10066 g006
Figure 7. Standard configuration. Active electrical power absorbed over the work cycle: instantaneous value and average value.
Applsci 13 10066 g007
Figure 8. Active regeneration for high-speed movement.
Applsci 13 10066 g008
Figure 9. Regenerative A—hybrid configuration. Active electrical power absorbed over the work cycle: instantaneous value and average value.
Applsci 13 10066 g009
Figure 10. Circuit of the actuation architecture for the high–low configuration.
Applsci 13 10066 g010
Figure 11. High–low configuration. Active electrical power absorbed over the work cycle: instantaneous value and average value.
Applsci 13 10066 g011
Figure 12. VDP configuration: proportional-displacement control with closed-loop pressure control.
Applsci 13 10066 g012
Figure 13. VDP configuration. Active electrical power absorbed over the work cycle: instantaneous value and average value.
Applsci 13 10066 g013
Figure 14. Direct pump control architecture: power source scheme.
Applsci 13 10066 g014
Figure 15. DCP static configuration. Active electrical power absorbed over the work cycle: instantaneous value and average value.
Applsci 13 10066 g015
Figure 16. DCP dynamic configuration. Active electrical power absorbed over the work cycle: instantaneous value and average value.
Applsci 13 10066 g016
Figure 17. Comparison between the different plant architectures in terms of average active electrical power absorption during the work cycle. For the regenerative configuration, the white parts of the bars represent the power saving with respect to the standard configuration. For the other configurations, white parts of the bars represent power savings with respect to the regenerative configuration.
Applsci 13 10066 g017
Figure 18. Comparison between the different system architectures in terms of the hourly cost of electricity absorbed (active and reactive) during the work cycle. For regenerative configuration, the green parts of the bars represent the hourly energy cost reduction with respect to the standard configuration. For the other configurations, white parts of the bars represent the hourly energy cost reduction with respect to the regenerative configuration.
Applsci 13 10066 g018
Figure 19. Active and active electrical power absorbed by the real blanking press with DCP power architecture. (a) Active electrical current absorbed [A] by the architecture with DCP over time [s]. The measurement is made upstream of the frequency converter and is related to a single phase. To get the total current just multiply by 3 . (b) Active electrical power absorbed [kW] by the architecture with DCP over time [s]. The measurement is made upstream of the frequency converter.
Applsci 13 10066 g019
Table 1. Energy savings obtained in the literature with different methods.
Ref.MethodFieldPumpMotorEnergy Saving
[11]Control of an electro-hydraulic servo system, with two proportional directional valves, and four switch valvesIndustrialFixed displacementServo motorNot declared
[4]Low–high pressure system with accumulatorIndustrial (fine blanking press)Fixed displacementFixed speed50%
[13]Multiple motor pumps—system controlIndustrial (hydraulic press)Variable displacementFixed speed26.97%
[14]Direct-driven hydraulic systemIndustrial (hydraulic press)Fixed displacementServo motor53–87%
[15]Two presses combinationIndustrial (hydraulic forming presses)Variable displacementFixed speed36%
Table 2. Considered and compared power drive architectures for a press for semi-finished brass products.
ConfigurationElectric DrivePumpDirectional Valve
StandardRound-case induction electric motorFixed-displacement vane pumpStandard DCV
RegenerativeRound-case induction electric motorFixed-displacement vane pumpDCV with regeneration A—hybrid
High–lowRound-case induction electric motorTwo fixed-displacement vane pumpsDCV with regeneration A—hybrid
VDPRound-case induction electric motorVariable-displacement axial piston pumpDCV with regeneration A—hybrid
DCPAC frequency converter + round-case induction electric motorFixed-displacement vane pumpDCV with regeneration A—hybrid
Table 3. Technical requirements for the hydraulic system.
ParameterValueUnit
Minimum blanking force294,300(N)
Rotation phase duration for the rotary table0.3(s)
Maximum duration of the entire processing cycle1.4(s)
Maximum duration of operation for the actuator1.1(s)
Maximum mass of the tooling anchored to the rod80(kg)
Table 4. Rod stroke, piston translation speed, and maximum pressure on the delivery in the processing cycle phases.
ParameterUnitQuick Descent—QDBlanking—BExpulsion—EQuick Rise—QRTable Rotation—TR
Stroke (s)(mm)40202080-
Velocity (v)(mm/s)2506767250-
Max. pressure (P)(bar)50200707010
Table 5. Fluid and cylinder: designations and technical data.
Circuit ElementParameterValue
FluidCodeCastrol serie HYSPIN ZZ 46
Fluid typeMineral oil
ViscosityISO VG 46
CylinderCodeParker 140MF3MMAXRN23M300M1133AOAO
TypeDouble acting
Bore140 (mm)
Rod diameter100 (mm)
Stroke300 (mm)
FixingFront flange with feet and fixed load with rigid guide
Area Ratio1.96
Table 6. Designations and technical data of the main elements of the standard architecture.
Circuit ElementParameterValue
Electric motorCodeParker Mod. MR4P05500
Type4 poles—round case
Nominal power55 (kW)
Nominal speed1480 (RPM)
Nominal torque354.87 (Nm)
Efficiency0.935
PumpCodeParker Mod. T7E 050
TypeFixed-displacement vane pump
Nominal displacement158.5 (mL/min)
Speed range600–2200 (RPM)
Max continuous pressure210 (bar)
Directional ValveCodeParker Mod. D41FEE02FC1NB70
TypePilot-operated proportional DCV 1:1:1:1
Nominal flow rate200 (L/min)
Nominal pressure drop5 (bar)
Pressure Relief ValveCodeParker Mod. R4V03535P0PM10VA1
TypePilot-operated proportional pressure relief valve
Nominal flow rate250 (L/min)
Maximum pressure350 (bar)
Table 7. Designations and technical data of the main elements of the regenerative architecture.
Circuit ElementParameterValue
Electric motorCodeParker Mod. MR4P03000
Type4 poles—round case
Nominal power30 (kW)
Nominal speed1460 (RPM)
Nominal torque196.22 (Nm)
Efficiency0.923
PumpCodeParker Mod. Mod. T7D B24
TypeFixed-displacement vane pump
Nominal displacement81.1 (mL/min)
Speed range600–3000 (RPM)
Max continuous pressure250 (bar)
Directional ValveCodeParker Mod. D41FEZ32FC1NB70
TypePilot-operated proportional DCV with regeneration—A hybrid
Nominal flow rate200 (L/min)
Nominal pressure drop5 (bar)
Pressure Relief ValveCodeParker Mod. R4V03535P0PM10VA1
TypePilot-operated proportional pressure relief valve
Nominal flow rate250 (L/min)
Maximum pressure350 (bar)
Table 8. Designations and technical data of the main elements of the high-low architecture.
Circuit ElementParameterValue
Electric motorCodeParker Mod. MR4P01850
Type4 poles—round case
Nominal power18.5 (kW)
Nominal speed1460 (RPM)
Nominal torque121.32 (Nm)
Efficiency0.914
HPLD pumpCodeParker Mod. T7B B14
TypeFixed-displacement vane pump
Nominal displacement45 (mL/min)
Speed range600–3000 (RPM)
Max continuous pressure275 (bar)
LPHD PumpCodeParker Mod. T7ASW B40
TypeFixed-displacement vane pump
Nominal displacement40 (mL/min)
Speed range600–3000 (RPM)
Max continuous pressure240 (bar)
Directional ValveCodeParker Mod. D41FEZ32FC1NB70
TypePilot-operated proportional DCV with regeneration—A hybrid
Nominal flow rate200 (L/min)
Nominal pressure drop5 (bar)
Pressure Relief ValveCodeParker Mod. R4V03535P0PM10VA1
TypePilot-operated proportional pressure relief valve
Nominal flow rate250 (L/min)
Maximum pressure350 (bar)
Unloading ValveCodeParker Mod. R4U03—533
TypePilot-operated unloading valve with venting
Nominal flow rate150 (L/min)
Nominal open–close pressure drop28% of the setting pressure
Table 9. Designations and technical data of the main elements of the VDP architecture.
Circuit ElementParameterValue
Electric motorCodeParker Mod. MR4P01850
Type4 poles—round case
Nominal power18.5 (kW)
Nominal speed1460 (RPM)
Nominal torque121.32 (Nm)
Efficiency0.914
PumpCodeParker Mod. PV 092
TypeAxial piston pump—variable displacement
Max displacement92 (mL/min)
Speed range400–2500 (RPM)
Nominal pressure350 (bar)
Directional ValveCodeParker Mod. D41FEZ32FC1NB70
TypePilot-operated proportional DCV with regeneration—A hybrid
Nominal flow rate200 (L/min)
Nominal pressure drop5 (bar)
Pressure Relief ValveCodeParker Mod. R4V03535P0PM10VA1
TypePilot-operated proportional pressure relief valve
Nominal flow rate250 (L/min)
Maximum pressure350 (bar)
Table 10. Designations and technical data of the main elements of the DCP architecture, in the static case.
Circuit ElementParameterValue
Electric MotorCodeParker Mod. MS54133KFA
Type4 poles—square case
Nominal power16 (kW)
Nominal speed1500 (RPM)
Nominal torque102 (Nm)
Efficiency0.85
Frequency ConverterCodeParker Mod. 31V—4G0045
Nominal electric power22 (kW)
Nominal current45 (A)
Maximum current49.5 (A)
Efficiency0.98
PumpCodeParker Mod. T7B E12
TypeFixed-displacement vane pump for variable speed drives
Max displacement41 (mL/min)
Speed range300–3000 (RPM)
Nominal pressure275 (bar)
Directional ValveCodeParker Mod. D41FEZ32FC1NB70
TypePilot-operated proportional DCV with regeneration—A hybrid
Nominal flow rate200 (L/min)
Nominal pressure drop5 (bar)
Pressure Relief ValveCodeParker Mod. R4V03535P0PM10VA1
TypePilot-operated proportional pressure relief valve
Nominal flow rate250 (L/min)
Maximum pressure350 (bar)
Table 11. Designations and technical data of the main elements of the DCP architecture, in the dynamic case.
Circuit ElementParameterValue
Electric MotorCodeParker Mod. MS54133KFA
Type4 poles—square case
Nominal power16 (kW)
Nominal speed1500 (RPM)
Nominal torque102 (Nm)
Efficiency0.85
Frequency ConverterCodeParker Mod. 31V—4G0060
Nominal electric power30 (kW)
Nominal current60 (A)
Maximum current66 (A)
Efficiency0.98
PumpCodeParker Mod. Mod. T7B E15
TypeFixed-displacement vane pump for variable speed drives
Max displacement50 (mL/min)
Speed range300–2700 (RPM)
Nominal pressure240 (bar)
Directional ValveCodeParker Mod. D41FEZ32FC1NB70
TypePilot-operated proportional DCV with regeneration—A hybrid
Nominal flow rate200 (L/min)
Nominal pressure drop5 (bar)
Pressure Relief ValveCodeParker Mod. R4V03535P0PM10VA1
TypePilot-operated proportional pressure relief valve
Nominal flow rate250 (L/min)
Maximum pressure350 (bar)
Table 12. Active and reactive power absorbed in the cycle phases.
ConfigurationCycle PhaseActive Power (kW)Reactive Power (VAr)Mean Active Power (kW)Mean Reactive Power (VAr)
StandardQD24.3221.9240.4829.06
B93.3652.92
E32.6923.44
QR32.6923.44
TR12.3320.63
RegenerativeQD12.412.4420.0515.60
B48.3926.14
E16.5913.07
QR16.5913.07
TR3.0711.97
High–LowQD12.379.8115.7711.72
B27.8216.97
E16.9911.23
QR16.9911.23
TR2.998.52
VDPQD14.8510.516.6712.71
B33.5621.87
E11.539.62
QR19.0412.03
TR3.358.55
DCP StaticQD12.8624.5414.4316.49
B29.1822.29
E9.839.29
QR16.9128.05
TR0.441.27
DCP DynamicQD Acc12.341.616.0621.26
QD Acc235.2548.47
QD Unif12.920.63
QD Dec1−2541.62
QD Dec211.4411.58
QD Acc235.2548.47
B37.5846.75
E12.4111.74
QR Acc121.6616.89
QR Acc229.944.49
QR Unif16.9122.76
QR Dec1−24.2234.42
QR Dec2−3.192.15
TR0.441.05
Table 13. Comparison between the different configurations in terms of absorbed active power. Values in the matrix are the percentage saving/increase of the configuration in the row, with respect to the one in the column.
StandardRegenerativeHigh–LowVDPDCP Static
Regenerative−50.5%
High–Low−61.1%−21.3%
VDP−58.8%−16.8%+5.7%
DCP Static−64.3%−28.1%−8.4%−13.4%
DCP Dynamic−60.3%−19.9%+1.8%−3.6%+11.2%
Table 14. Comparison in percentage terms of reactive power absorbed with the different configurations. Values in the matrix are the percentage saving/increase of the configuration in the row, with respect to the one in the column.
StandardRegenerativeHigh–LowVDPDCP Static
Regenerative−46.3%
High–Low−59.7%−24.8%
VDP−56.3%−18.5%+8.4%
DCP Static−43.2%+5.7%+40.6%+29.6%
DCP Dynamic−26.8%+36.2%+81.3%+67.1%+28.9%
Table 15. Comparison in percentage terms of the hourly cost of absorbing electricity from the power supply grid between the different configurations (based on Italian energy market rules). Values in the matrix are the percentage saving/increase of the configuration in the row, with respect to the one in the column.
StandardRegenerativeHigh–LowVDPDCP Static
Regenerative−47.1%
High–Low−60.8%−26.1%
VDP−56.2%−17.3%+11.9%
DCP Static−70.1%−43.7%−23.8%−31.9%
DCP Dynamic−66.7%−37.1%−15.1%−24%+11.5%
Disclaimer/Publisher’s Note: The statements, opinions and data contained in all publications are solely those of the individual author(s) and contributor(s) and not of MDPI and/or the editor(s). MDPI and/or the editor(s) disclaim responsibility for any injury to people or property resulting from any ideas, methods, instructions or products referred to in the content.

