Article

An Investigation into the Friction of Cold-Rolled Low-Carbon DC06 Steel Sheets in Sheet Metal Forming Using Radial Basis Function Neural Networks

by
Tomasz Trzepieciński
1,*,
Krzysztof Szwajka
2 and
Marek Szewczyk
2
1
Department of Manufacturing Processes and Production Engineering, Rzeszow University of Technology, al. Powst. Warszawy 8, 35-959 Rzeszów, Poland
2
Department of Integrated Design and Tribology Systems, Faculty of Mechanics and Technology, Rzeszow University of Technology, ul. Kwiatkowskiego 4, 37-450 Stalowa Wola, Poland
*
Author to whom correspondence should be addressed.
Appl. Sci. 2023, 13(17), 9572; https://doi.org/10.3390/app13179572
Submission received: 19 July 2023 / Revised: 17 August 2023 / Accepted: 23 August 2023 / Published: 24 August 2023
(This article belongs to the Special Issue Advanced Processing of Steels and Their Alloys)

Abstract

:
This article presents the friction test results for cold-rolled low-carbon DC06 steel sheets, which are commonly processed into finished products using sheet metal forming methods. A strip drawing test with flat dies was used in the experimental tests. The strip-drawing test is used to model the friction phenomena in the flange area of the drawpiece. The tests were carried out using a tester that enabled lubrication with a pressurised lubricant. The friction tests were carried out at different nominal pressures, oil pressures, and friction conditions (dry friction and oil lubrication). Oils destined for deep-drawing operations were used as lubricants. Neural networks with radial base functions (RBFs) were used to explore the influence of individual friction parameters on the value of the coefficient of friction (COF). Under lubrication with both oils considered, the value of the COF increased with decreasing oil pressure. This confirms the correctness of the concept of the device for reducing friction in the flange area of the drawpiece. The developed concept of pressurised lubrication is most effective at relatively small nominal pressures of 2–4 MPa. This range of nominal pressures corresponds to the actual nip pressures when forming deep-drawing steel sheets. Under conditions of dry friction, the values obtained for the COF rise above 0.3, while under lubrication conditions, even without pressure-assisted lubrication, the COF does not exceed 0.2. As the nominal pressure increases, the effectiveness of the lubrication exponentially decreases. It was found that the Sq parameter carries the most information regarding the value of the COF. The RBF neural network with nine neurons in the hidden layer (RBF-8-9-1) and containing the Sq parameter as the input was characterised by an R2 of 0.989 and an error of 0.000292 for the testing set.

1. Introduction

Sheet metal forming (SMF) is the basic process for obtaining a finished product with a complex shape. When designing the deep drawing process for a product or a semi-finished product from sheet metal, the mechanisms specific to this technology need to be taken into account to guarantee the appropriate surface roughness of the drawpiece and high durability of the tool [1]. In the cylindrical drawpieces formed, there is the so-called drawing zone (in the flange part of the drawpiece) and the stretching zone in the bottom of the drawpiece [2]. In the bottom, there are tensile stresses in both radial and circumferential directions, and in the flange area, there are circumferential compressive and radial tensile stresses [2,3].
Basically, stamping tools consist of a punch, a die, and a blank holder. In the SMF process, there are two phenomena that hinder being able to obtain drawpieces of the desired shape and dimensions [2]: wrinkling in the flange zone and circumferential cracking of the wall of the drawpiece. The task of the blankholder is to prevent wrinkling of the sheet in the flange zone. At the same time, the blankholder should not block the movement of the sheet. Therefore, the blankholder force, specifically the nominal pressure, should be properly selected [4,5]. When forming drawpieces with complex shapes, especially in the automotive industry, draw beads are additionally used to direct the flow of material in key areas around the perimeter of the drawpiece [6].
Friction is a complex function of, above all, normal pressures [7,8], lubrication conditions [9], load type (static or dynamic load) [10], sliding speed [11], material combination of the friction pair [12], tool coating [13], temperature [14], and surface roughness and topography both of the tool and the sheet metal [15]. The phenomenon of friction in the blankholder zone is experimentally modelled using the strip drawing test [16] with different tool geometries: flat/flat, cylinder/cylinder, and flat/cylinder. In such tests, a strip of sheet metal is pulled between the countersamples, and the pulling force (friction force) is measured. Based on the value of the clamping force of the countersamples, it is possible to estimate the value of the coefficient of friction (COF). The variable parameters in the strip drawing test are the clamping force, the surface roughness of the tools and countersamples, the countersample material, and the friction conditions. An overview of various tribometers for modelling the phenomenon of friction in specific places of a formed sheet can be found in papers by Trzepieciński and Lemu [17] and Schell et al. [18]. The strip drawing test is one of the most commonly used experimental models for determining the COF in SMF [19].
The effect of changing the lubrication conditions on the value of the COF and the friction behaviour of sheets is the most studied issue. Rakotomahefa [20] used the strip drawing test to analyse the tribological behaviour of a zinc-coated dual-phase steel strip. Various sliding speeds, nominal contact pressures, and the amount of lubricant were considered as process parameters. It was found that the lubrication effect is closely related to the surface roughness of the sheet metal. Więckowski et al. [21] analysed the effectiveness of vegetable-based lubricants in the friction testing of X20Cr13 stainless steel in contact with X165CrV12 flat countersamples. The effect of unit pressure on the value of the COF was considered. It was found that an oil-based lubricant with the addition of boric acid is very effective in protecting the forming tools against galling. Schell et al. [22] developed the flat die strip drawing test for hot forming. The transferability of friction between three lubricants at various temperatures when testing AW-7075 aluminium alloy sheets was tested. It was shown that the performance of the lubricant may depend on its ability to transfer from the die to the blank at low contact pressure. Trzepieciński [23] analysed the effect of lubrication with vegetable oils on the COF of DC04 steel sheets using the strip drawing test with rounded (r = 200 mm) dies. The effect of tool surface roughness on the value of the COF was also investigated. It was found, in general, that all the vegetable oils (i.e., linseed, rapeseed, sunflower, and palm) with the addition of boric acid were shown to be effective in lowering the COF. Jewvattanarak et al. [24] used different lubrication conditions at two sliding speeds (10 and 100 mm/min) to determine the COF of a hot-rolled JSH780R steel sheet. The experimental results revealed that a mixture of chlorine and sulphur additives in the lubricant provided the best adsorption ability for the metal oxides. At higher sliding speeds, a higher amount of sulphur could interact with the metal oxides due to the increase in temperature and higher adsorption.
The metal sheet undergoes deformation during the deep drawing process, which changes the initial roughness of the sheet metal surface. Masters et al. [25] tested the frictional behaviour of AW-5754, AW-6111, and AW-6451 aluminium alloy sheets pre-stretched at strains of 2%, 5%, 10%, and 15%. They found that the COF increases with the level of pre-strain. However, the use of solid lubricants maintains uniform friction at strains up to 10%. Trzepieciński et al. [26] used the flat die strip drawing test to investigate the frictional performance of DC04 steel strips pre-strained at 7, 14, and 21% in the presence of non-edible oils (Moringa and Karanja). The COF decreased with increasing contact pressure in the range of pressures between 3 and 12 MPa.
The shape of the countersamples and the protective coating on the tool ensure that specific contact conditions are created. Wu and Groche [27] analysed the wear development of galvanised high-strength dual-phase steel HCT98 in the strip drawing test with rounded dies. The results revealed that wear development, wear mechanisms, and tool life span depend on the initial surface roughness and tool hardness. Groche and Wu [28] demonstrated in strip drawing tests that tools with higher hardness show better wear resistance to galling when in contact with low-alloy, high-strength steels. Zabala et al. [29] used the strip drawing test with rounded dies to analyse the interplay between the sheet and tool surface roughness on the friction of an AW-1050 aluminium strip against different die surface topographies. This paper underlines the key role of die surface functionalization in preventing galling. The authors concluded that the reduced friction could be attributable to the greater ability to retain lubricant in the oil pockets. Makhkamov [11] determined the COF of high-strength, low-alloy HSLA 380 steel sheets in a flat die strip drawing tribometer. Lubricant type, sliding speed, contact area, contact pressure, and surface roughness of the samples were considered. It was concluded that lubrication minimises the effect of the directionality of the tool surface topography on the friction behaviour. Ter Haar [30] developed a strip-drawing tribotester with cylindrical dies. Coated and uncoated steel sheets were tested. Based on the test results, several fitting curves were used to describe the frictional behaviour of sheet metal in terms of a generalised Stribeck curve. Guillon et al. [31] proposed a method to reduce extended slippage of EN AW-6061 aluminium alloy sheets by using a strip drawing test with rounded CrN and amorphous diamond-like carbon (DLC)-coated dies. They concluded that CrN-coated dies seem to be the best solution for producing well-drawn specimens. Payen et al. [32] used a flat die strip drawing test to investigate the effects of contact pressure on the frictional behaviour and roughness changes of hot-dip galvanised mild steel sheets. Contact pressures, sliding speeds, and four morphological surface chemical treatment textures were analysed as the process parameters. It was revealed that the surface roughness of sheet metals is a decreasing function of pressure except during the stick-slip phase, when the surface roughness evolves erratically. The COF above a certain pressure, depending on the texture morphology, decreases as pressure increases. In this article, lubrication with forced oil pressure is proposed for increasing the efficiency of sheet lubrication in the flange zone in SMF. A cold-rolled low-carbon DC04 steel sheet, which exhibits excellent deep-drawing properties under all types of deformation, was used as the test material. A proprietary friction tester integrated with an oil pump was designed and manufactured. According to the best of the authors’ knowledge, there are no other studies on forced oil pressure in the blankholder zone. An experimental campaign was planned, taking into account the variable pressure of the blankholder and the variable oil pressure. Two commercial oils of different viscosities and grades adapted to the deep-drawing process were used. Due to the analytically unpredictable interactive influence of many parameters on the friction phenomenon, radial basis function (RBF) artificial neural networks (ANNs) were used to determine the interaction between the input parameters and the output parameter (COF). In Section 2.1, the research material is characterised. The experimental campaign and friction process parameters using strip drawing tests with flat dies are described in Section 2.2. The RNF ANN characteristics and verification method of the best RBF network structure are shown in Section 2.3. Experimental results presenting the influence of friction process parameters on the change of COF and coefficient of efficiency are presented and discussed in Section 3.1. Finally, Section 3.2 presents the main results of neural modelling. The work is completed with the quantitative and qualitative conclusions shown in Section 4.

2. Materials and Methods
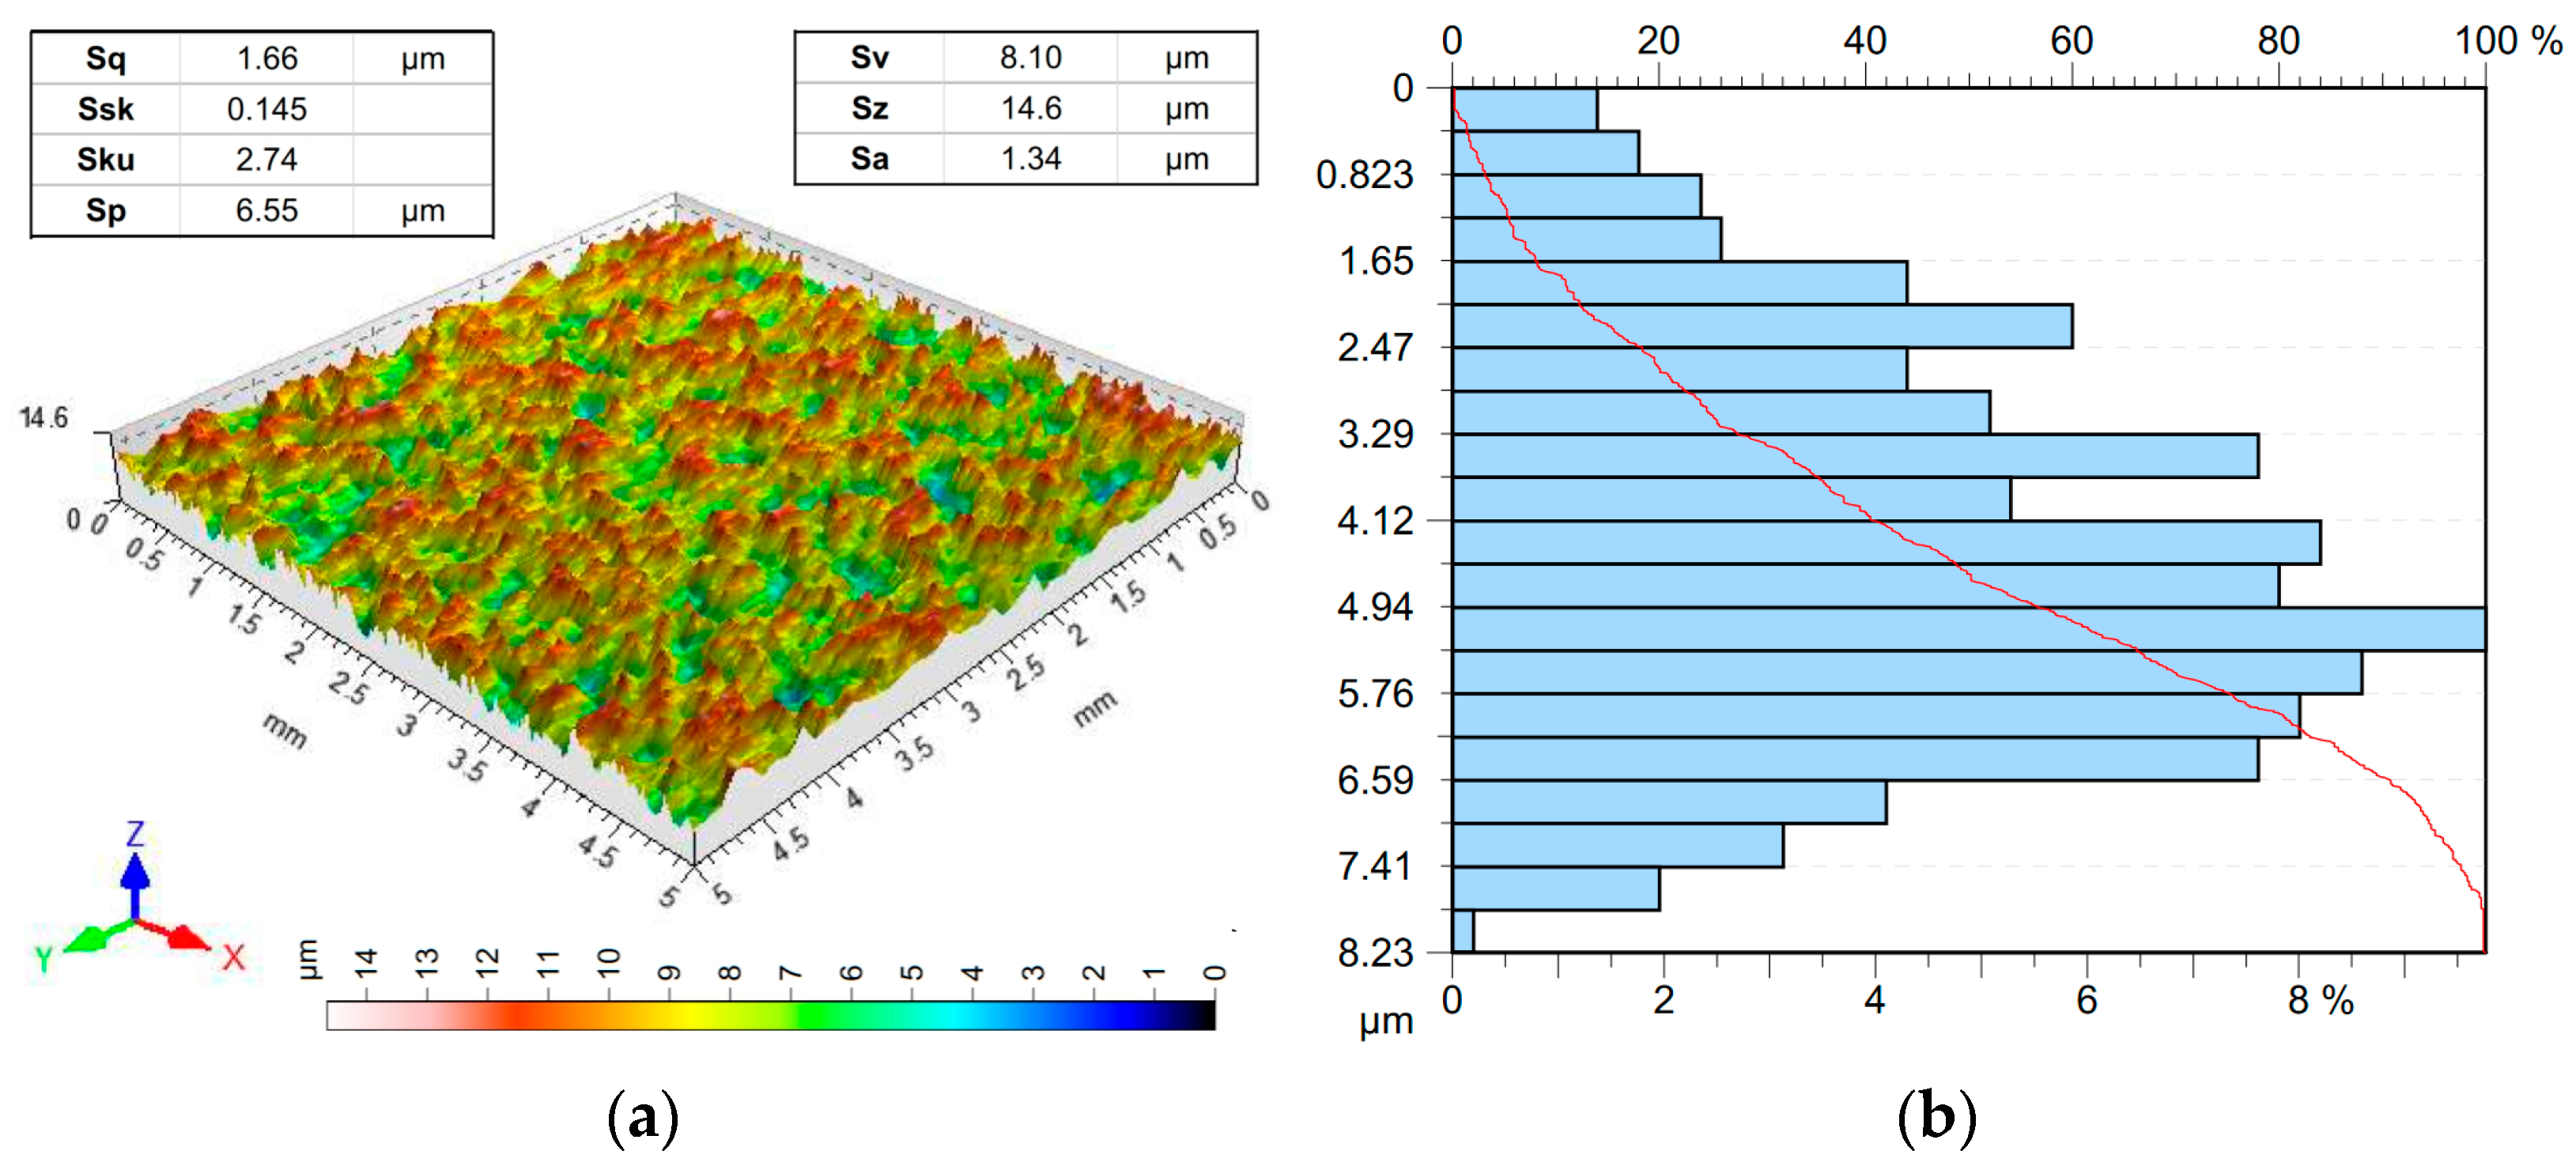
2.1. Test Material

The research material was a 0.75-mm-thick cold-rolled low-carbon DC06 (1.0873) steel sheet. Samples oriented according to the sheet rolling direction were guillotined from the sheet metal. For information purposes, the chemical composition of the DC06 steel sheet, according to the EN 10130 standard, is as follows (wt.%): C—0.02 (max.), Mn—0.25 (max.), S—0.02 (max.), P—0.02 (max.), Ti—0.3 (max.), Fe—the remainder. The basic mechanical properties of the sheet metal in the rolling direction were determined using a Z100 uniaxial tensile testing machine. The tests were carried out at ambient temperature in accordance with the requirements of the EN ISO 6892-1 standard. Three replicates were performed, and the average values of the basic mechanical parameters (Table 1) were determined.
The surface roughness parameters of the DC06 sheet metal in the as-received state were determined using a T8000RC profilometer. The measuring area was 5 mm × 5 mm. The surface roughness parameters and the topography of the test material are shown in Figure 1a. In turn, Figure 1b shows the Abbott–Firestone curve. The method for determining the surface roughness parameters and their meaning can be found in ISO 25178-2.

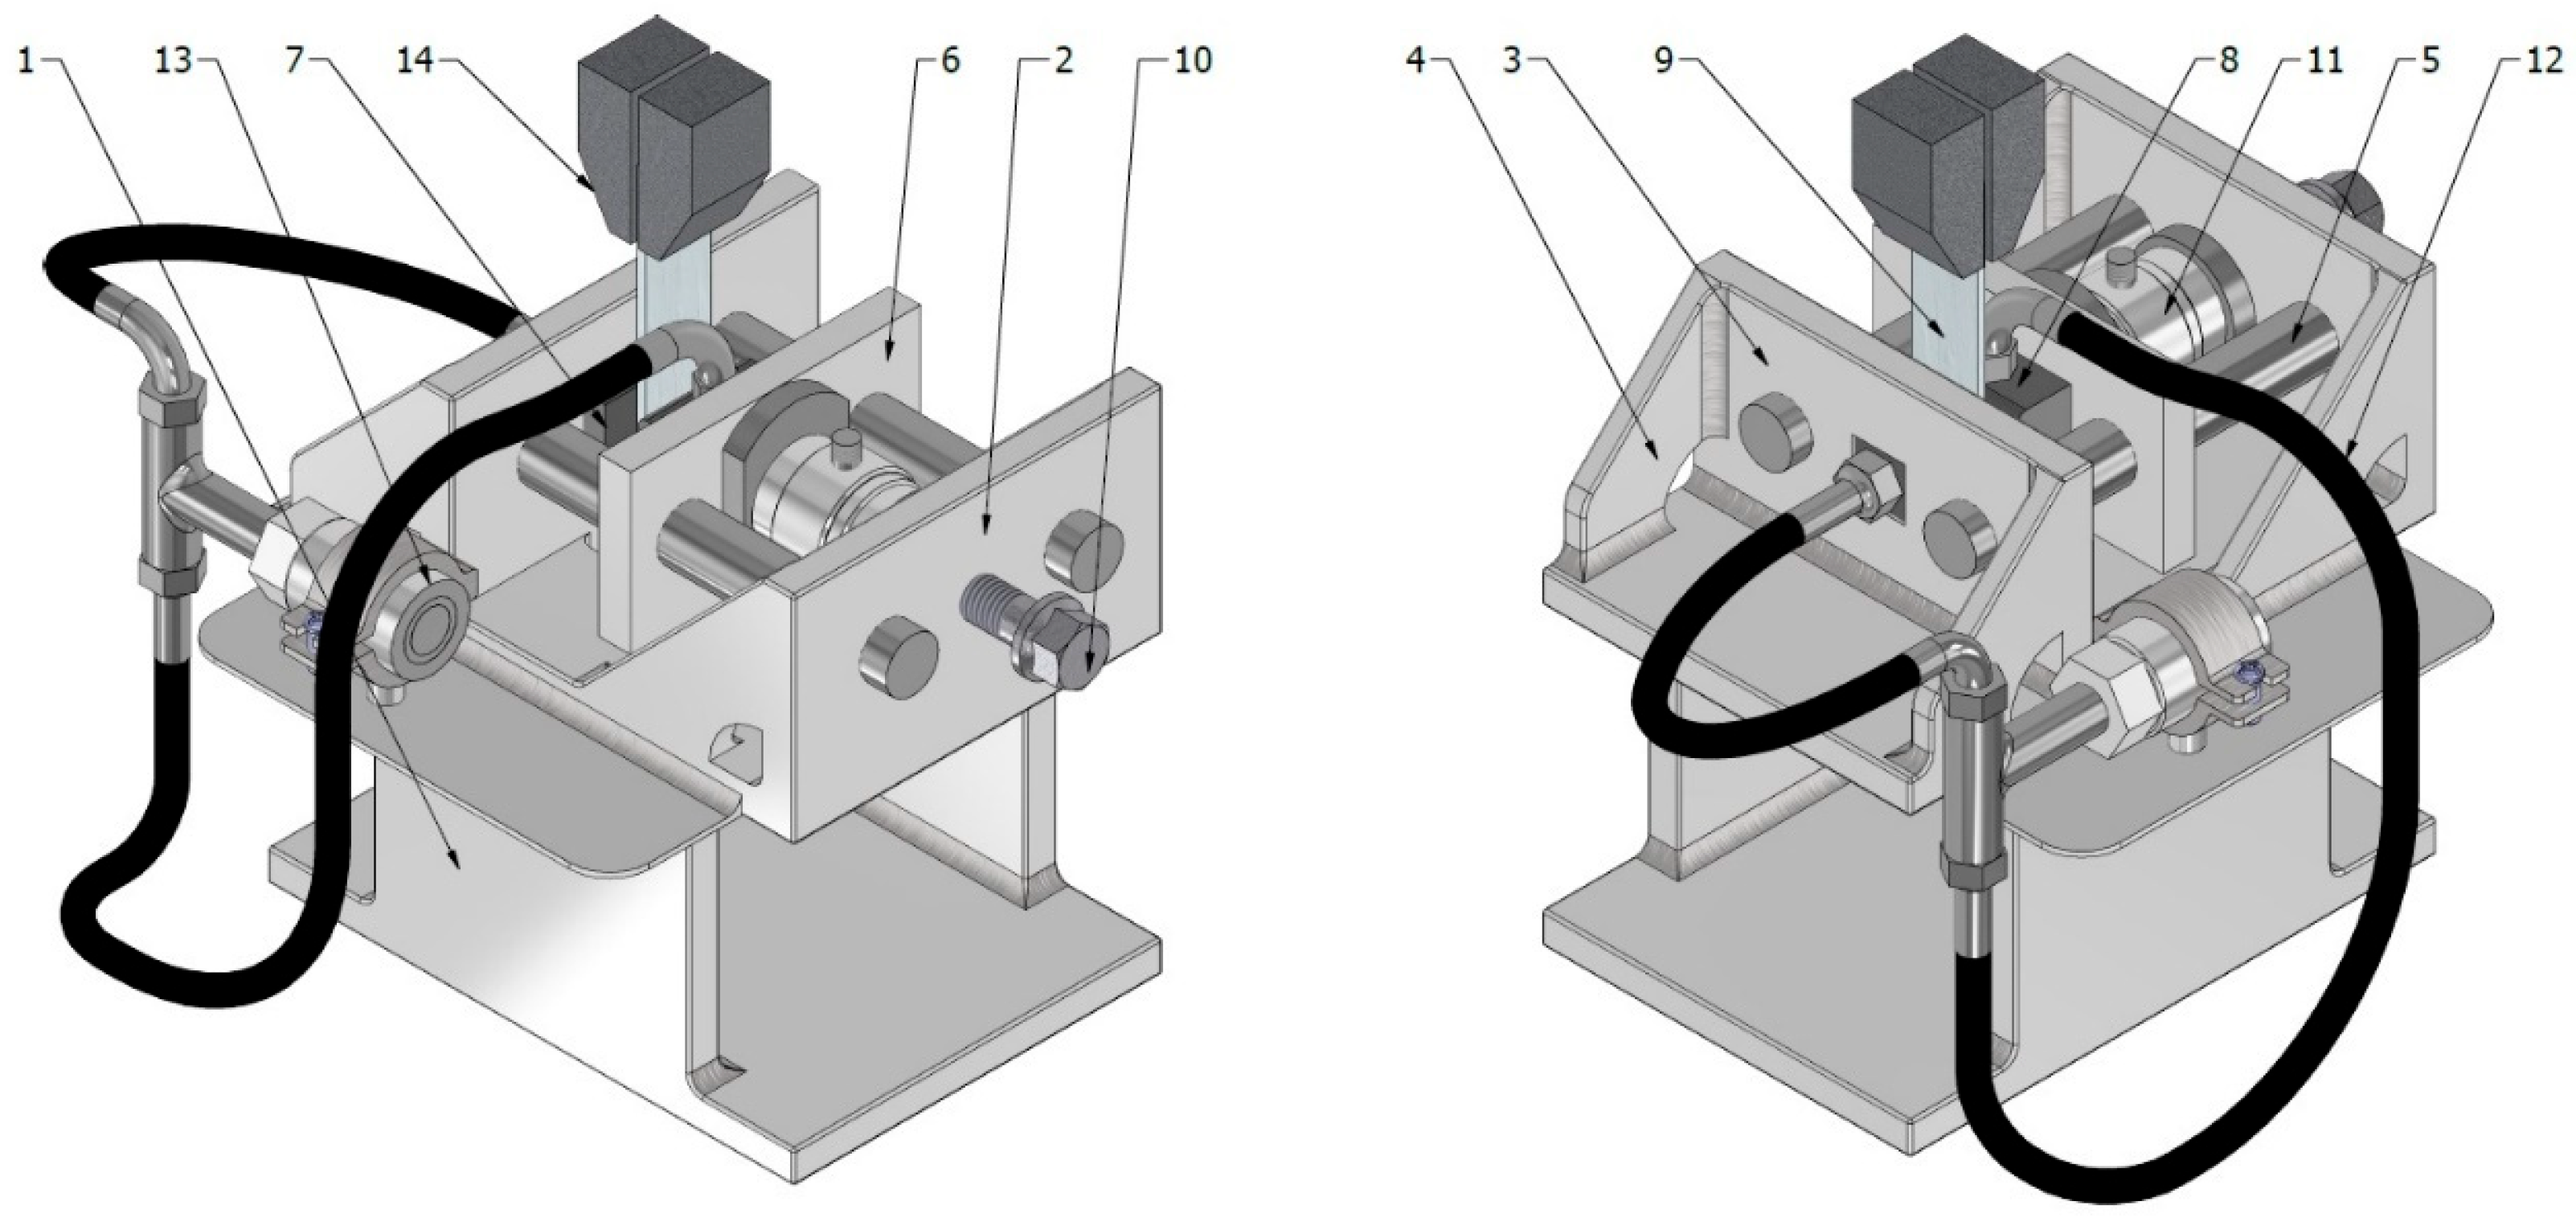
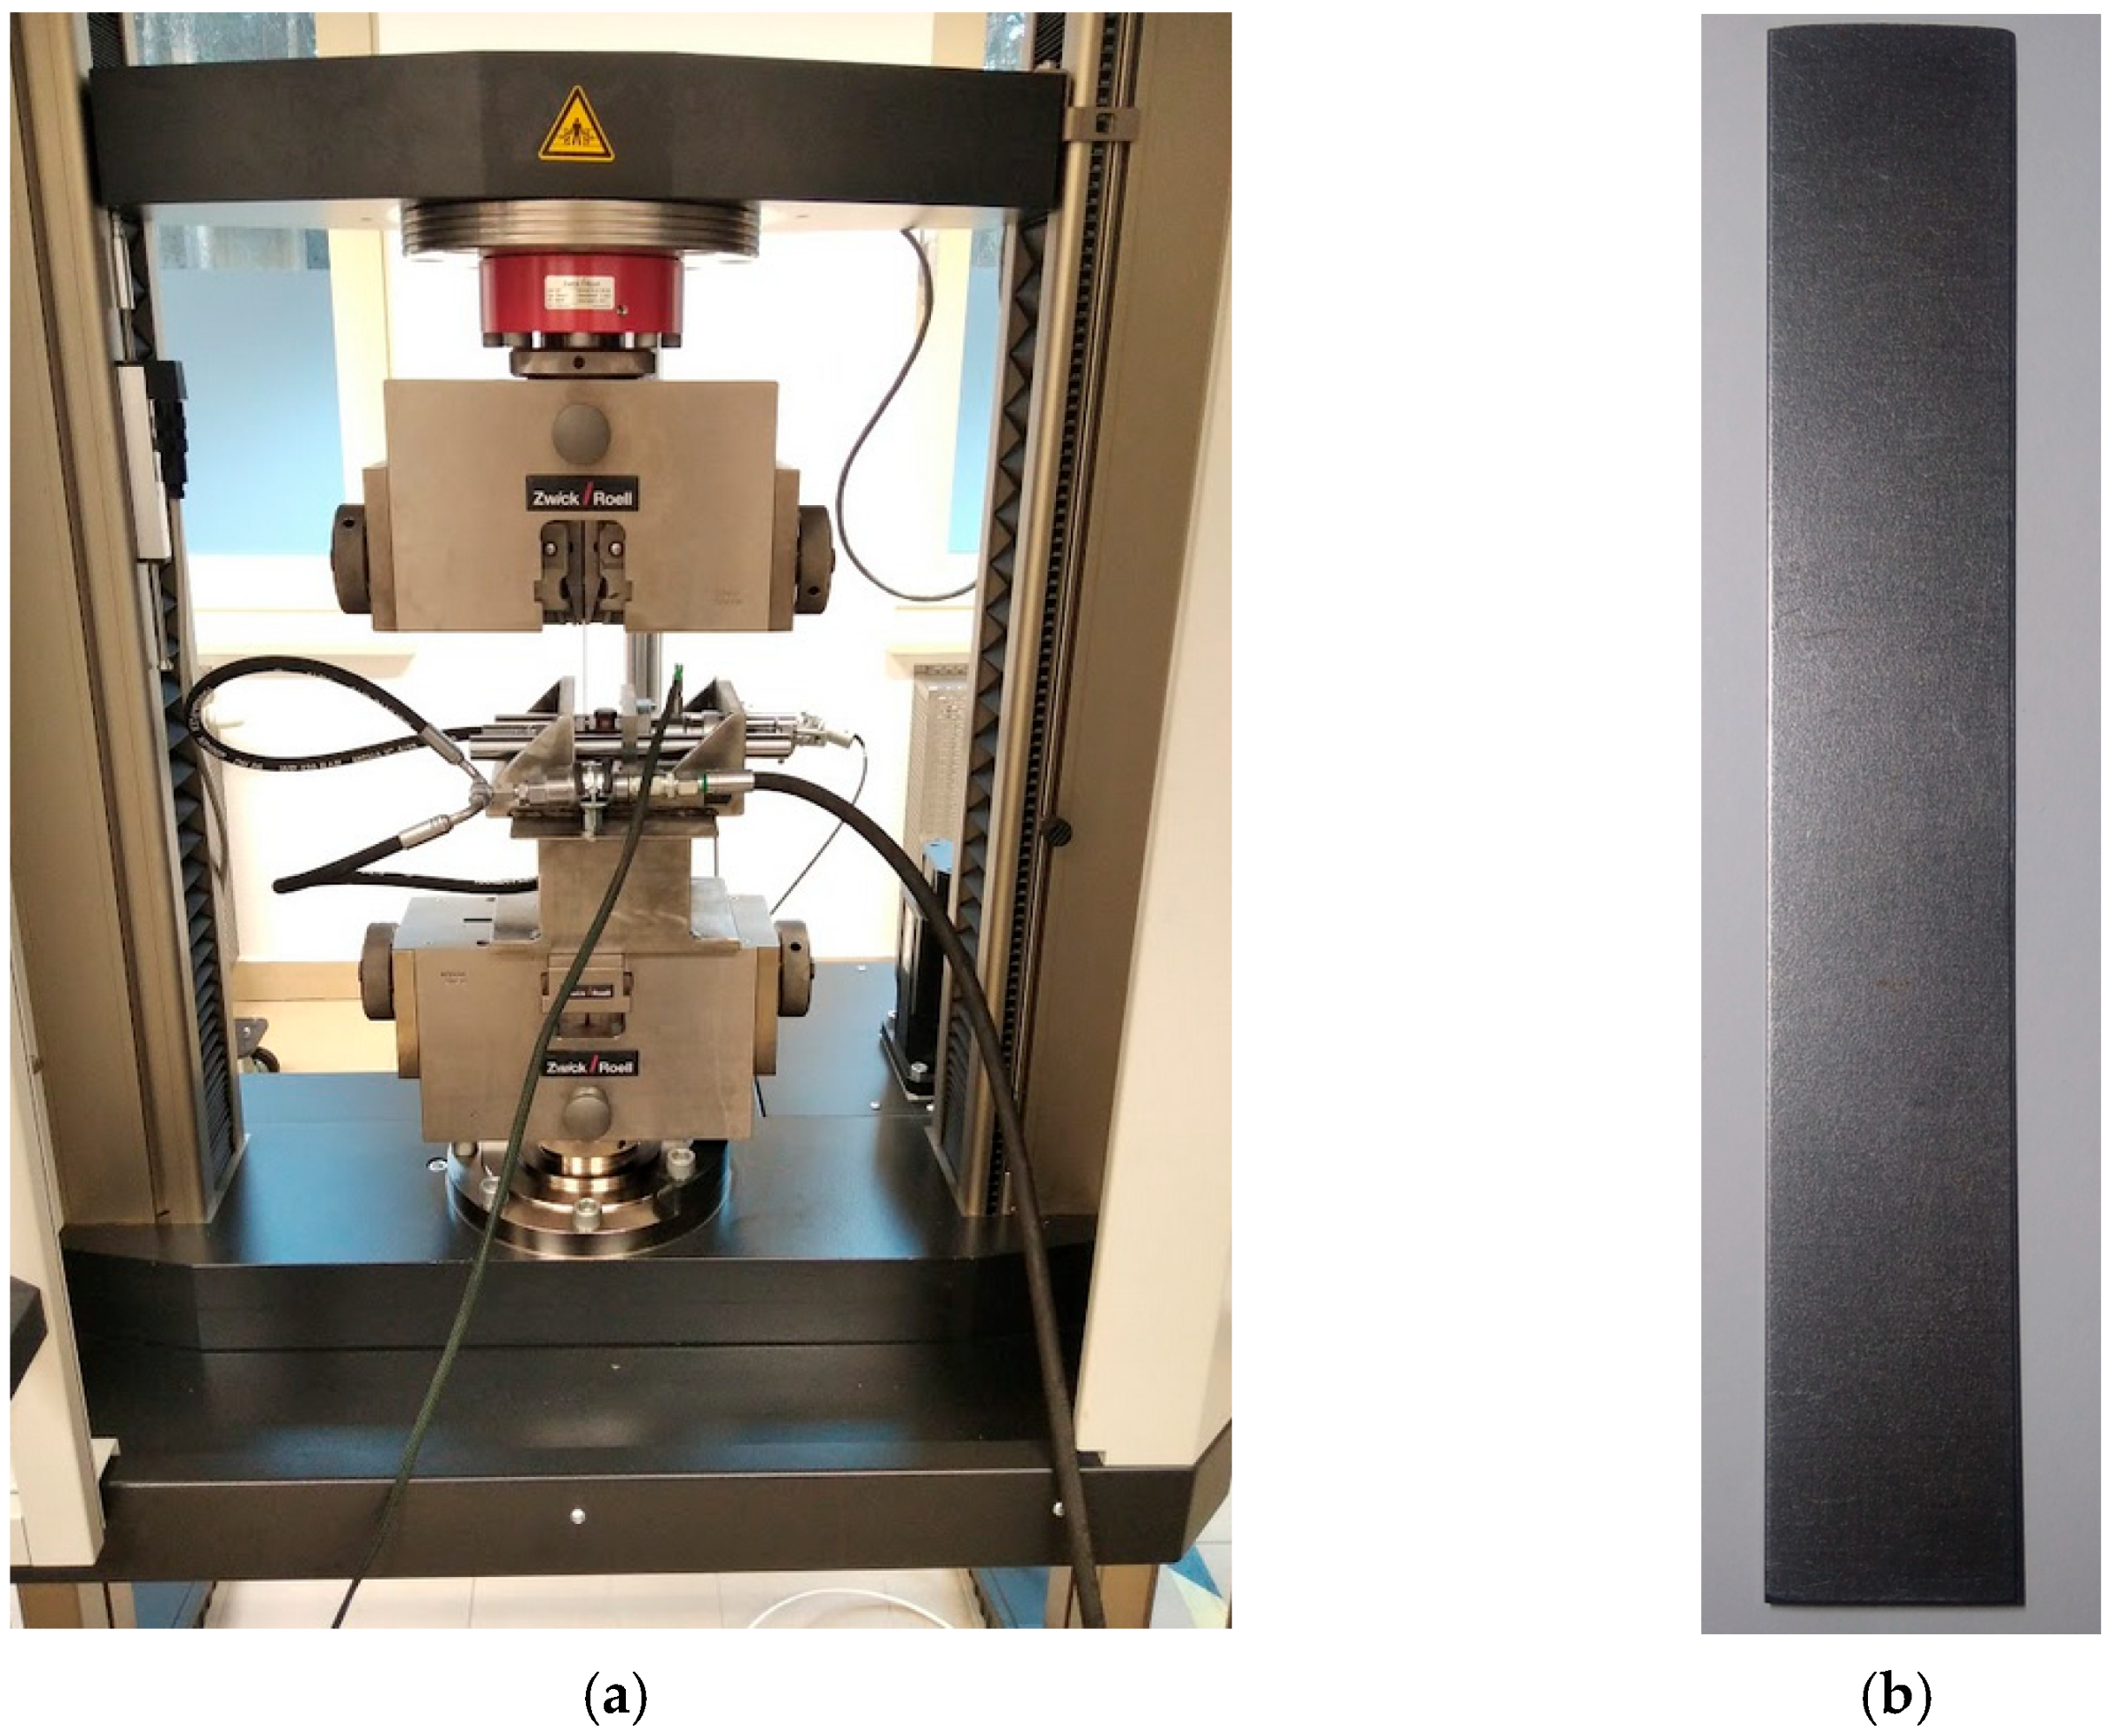
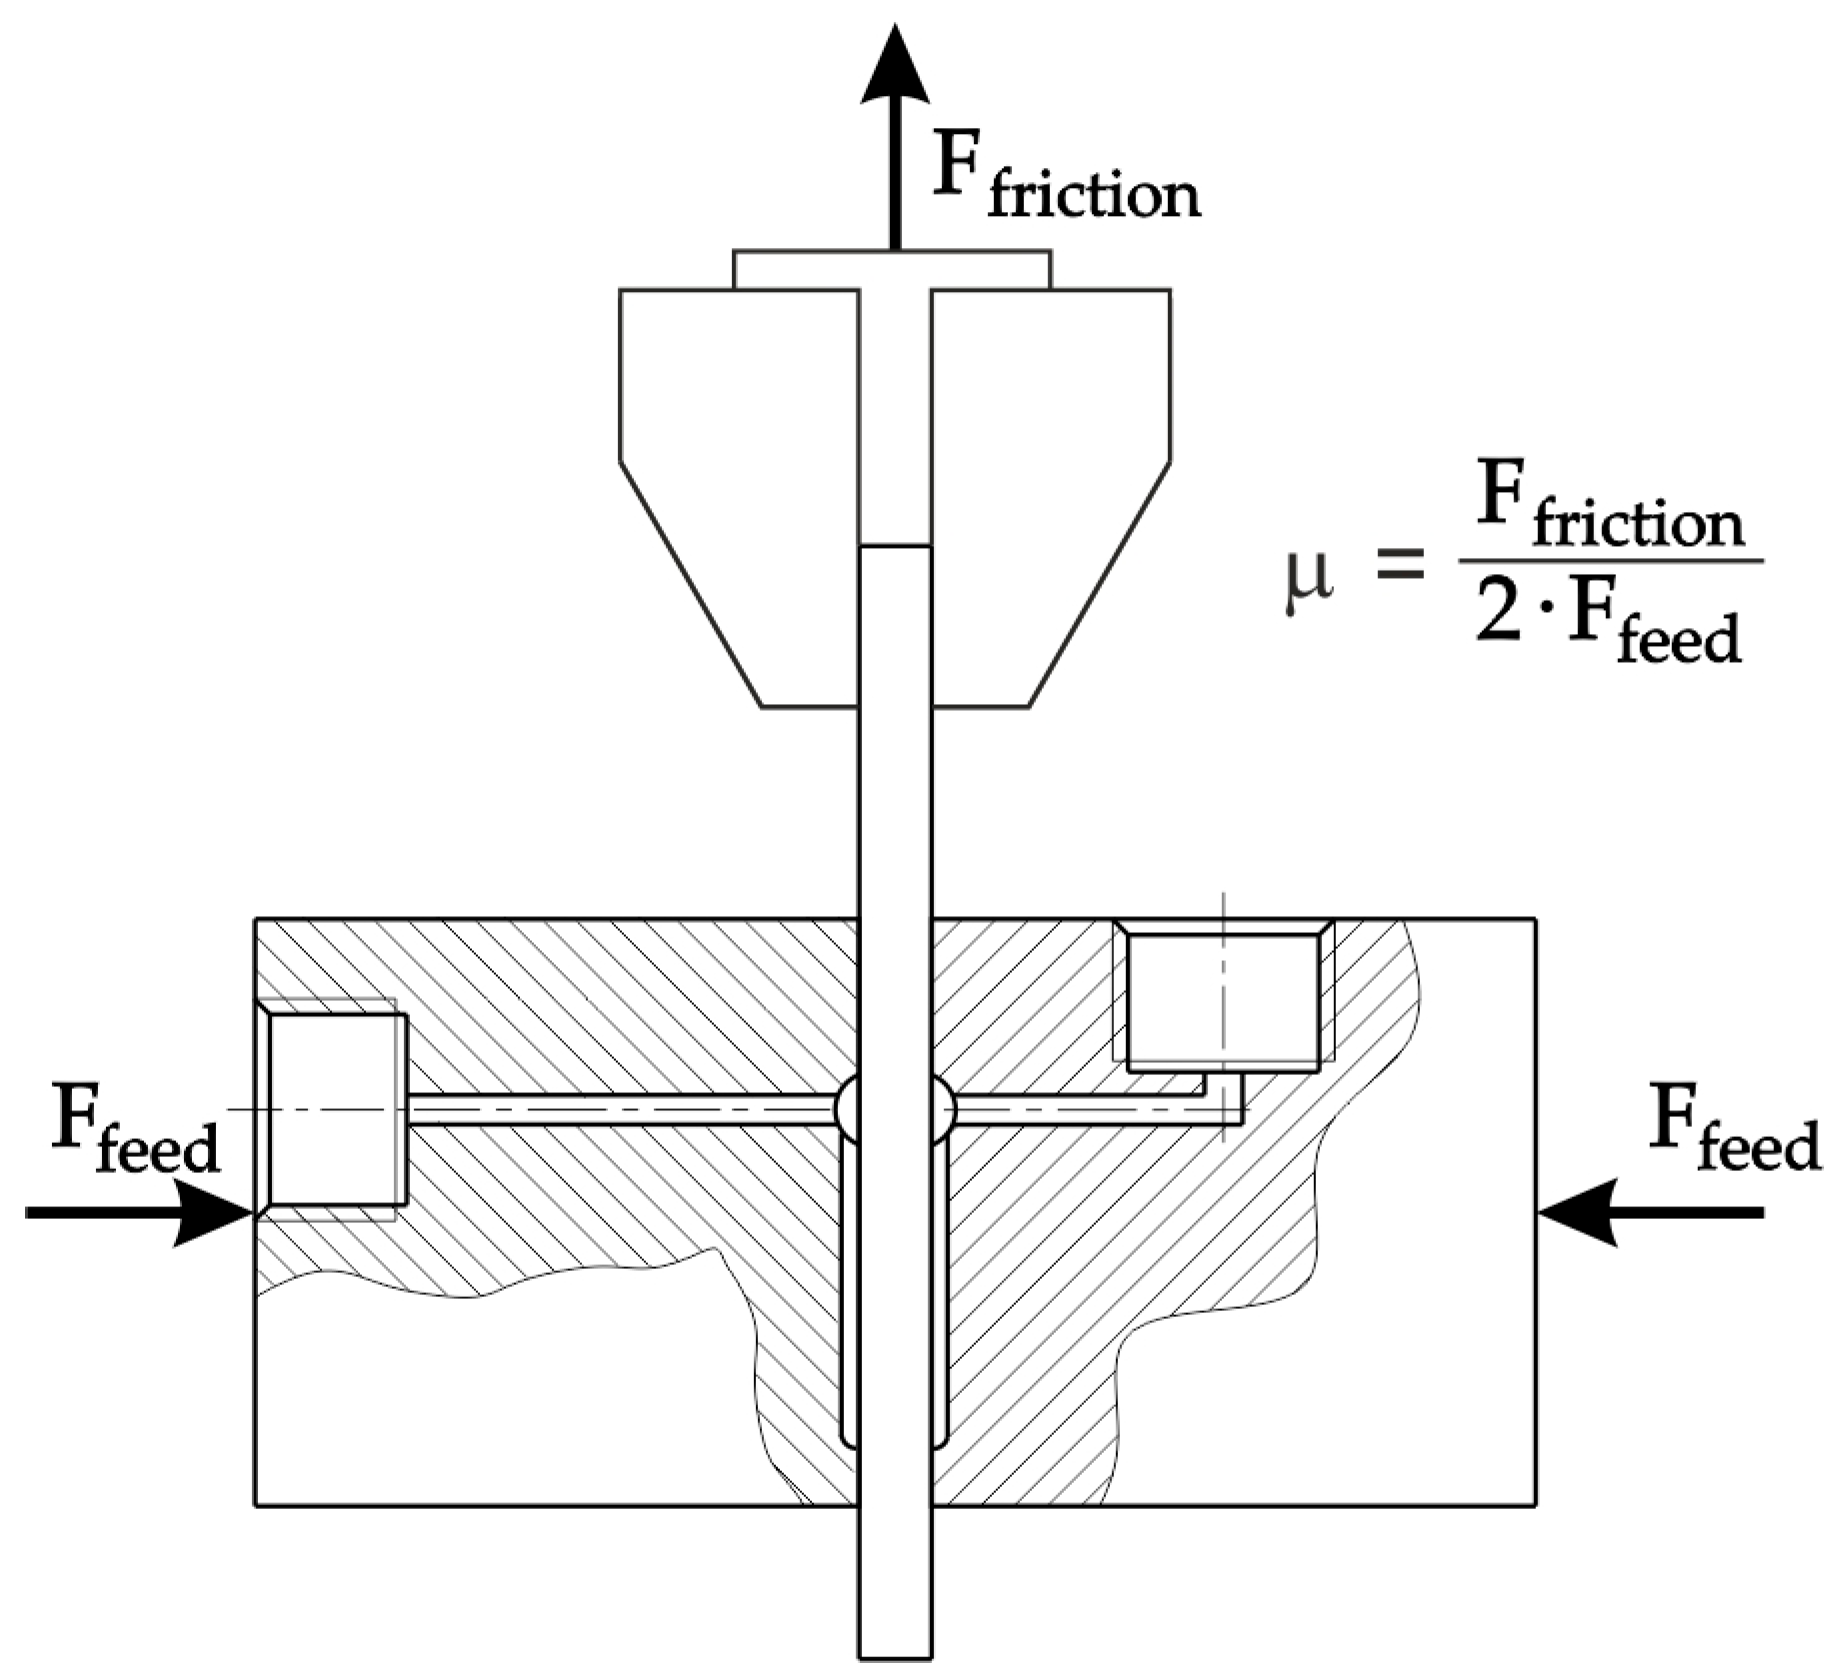
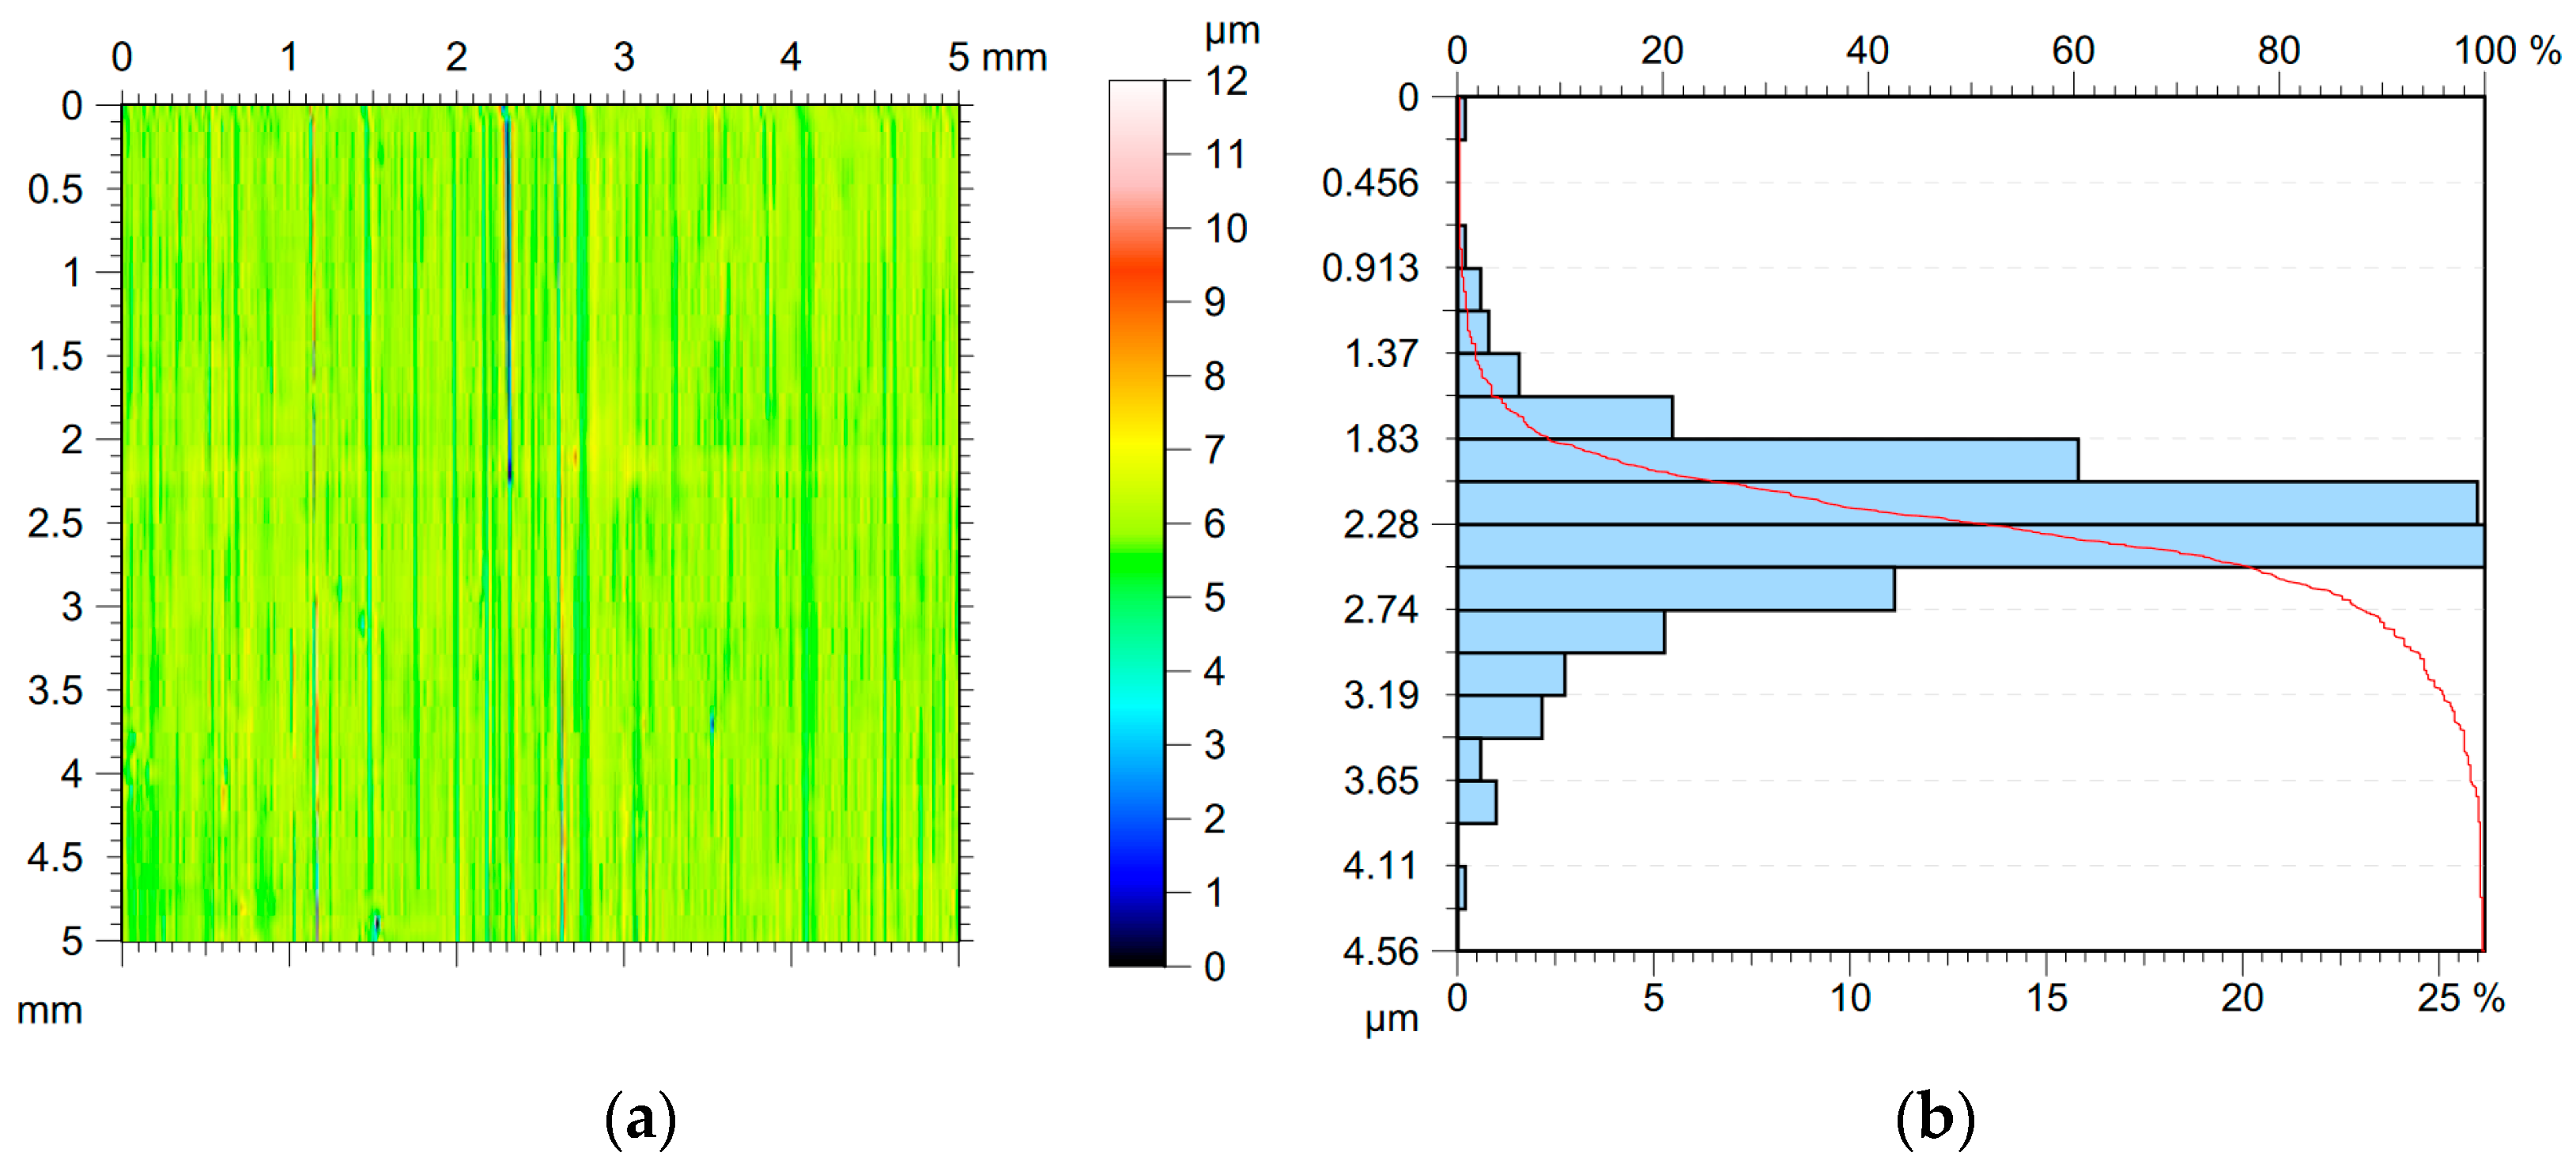
2.2. Experimental Testing

The authors’ own friction tester (Figure 2 and Figure 3a) integrated with an Argo-Hytos hydraulic power pack (max. pressure 6.3 MPa, power 0.18 kW, flow 0.4 dm3/min) was used in the experimental tests for determination of the COF. The tribotester was mounted in the lower gripper of a commercial Zwick-Roell Z100 testing machine. Strips of sheet steel measuring 130 mm long by 25 mm wide were used as samples (Figure 3b) in the friction tests. The aim of the experimental research was to build a knowledge base for training ANNs. The strip drawing test consists of drawing a strip of sheet metal between flat counter-specimens (Figure 4), which contain the channels supplying oil to the contact zone. The value of the COF µ was determined on the basis of the value of the pulling force (friction force Ffriction) and the clamping force of the countersamples (feed force Ffeed).
The countersamples were made of cold-worked steel NC6 (1.2063) with a hardness of 197.2 HV. The hardness measurement was carried out using a Vickers hardness tester from the Qness 60 EVO series with a test force of 98.07 N. The topography of the countersamples and the Abbott–Firestone curve of countersample surface are presented in Figure 5a,b, respectively. The values of the basic parameters of the surface roughness are as follows: Sa = 0.338 µm, Sq = 0.531 µm, Sz = 11.7 µm, Sv = 5.95 µm, Sp = 5.72 µm, Sku = 18.2, Ssk = −0.308.
The friction tests were carried out for different contact pressures pn, corresponding to nominal pressures between 2 and 8 MPa. This range corresponds to typical blank holding pressures in the flange area of the drawpiece [2,33]. The value of the oil pressure po was in the range between 0.6 and 1.8 MPa. The maximum value of the oil pressure was selected to ensure there was no oil leakage between the countersamples and the tested sheet metal. Reference tests were also carried out with classic lubrication of the contact surface without supplying oil under forced pressure (po = 0 MPa). Two commercial oils, S100+ and S300, destined for deep-drawing operations with kinematic viscosities ηk at 20 °C of 360 mm2/s and 1135 mm2/s, respectively, were used. These oils contain additives that increase lubricating properties and anti-corrosion additives. The oil viscosity measurement test was carried out using an Ostwald viscometer. Dry friction tests were also carried out. The surfaces of all samples were cleaned before the friction tests.
The contact force value was recorded using a type 9345B force sensor and LabView software. The value of the friction force was recorded by the measuring system of the Zwick-Roell Z100 testing machine.

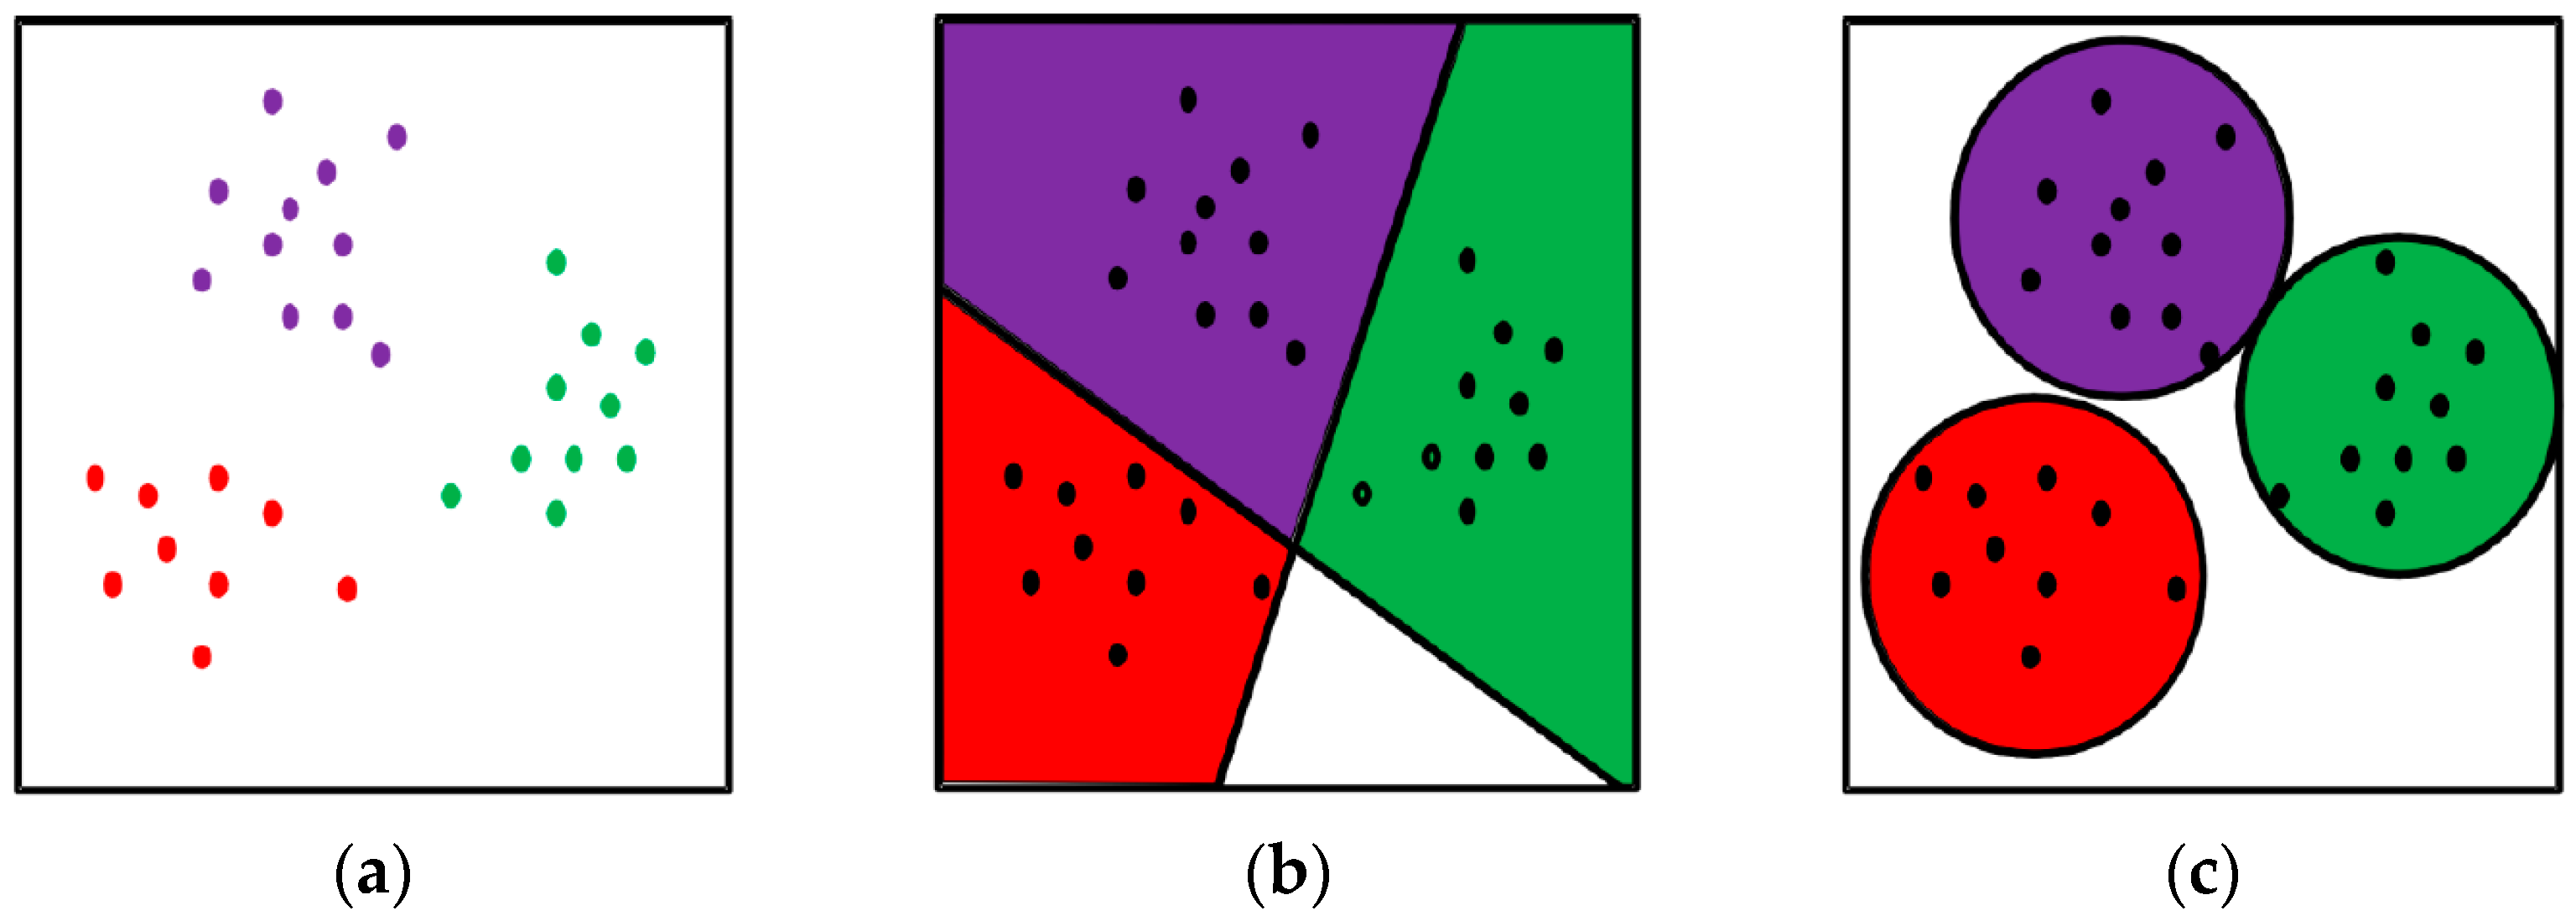
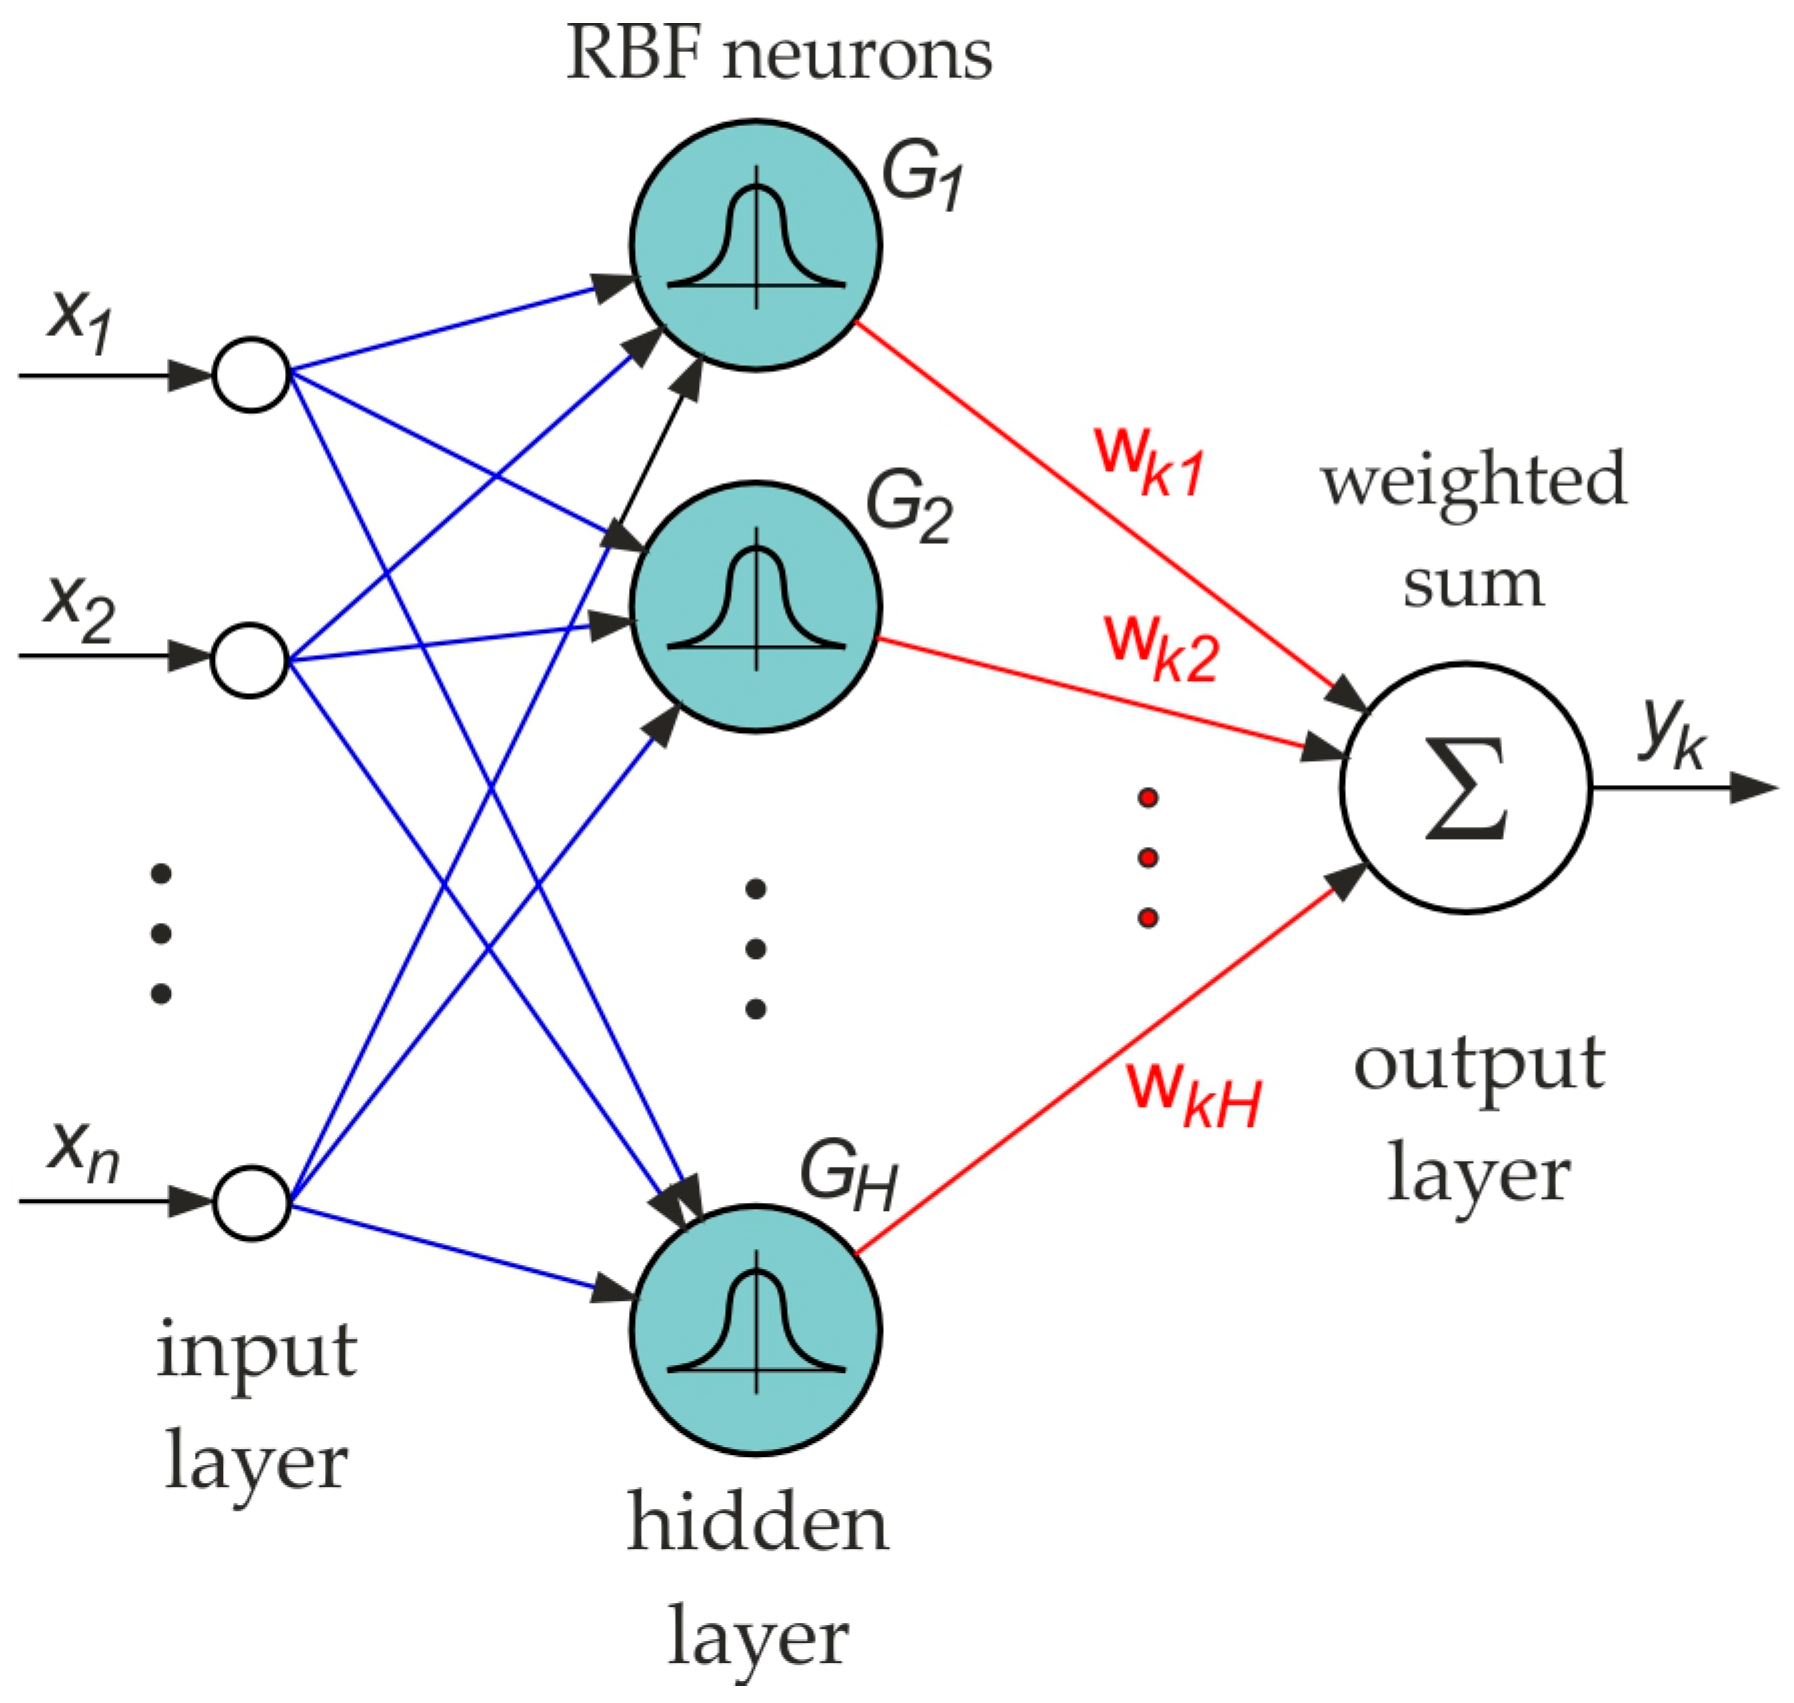
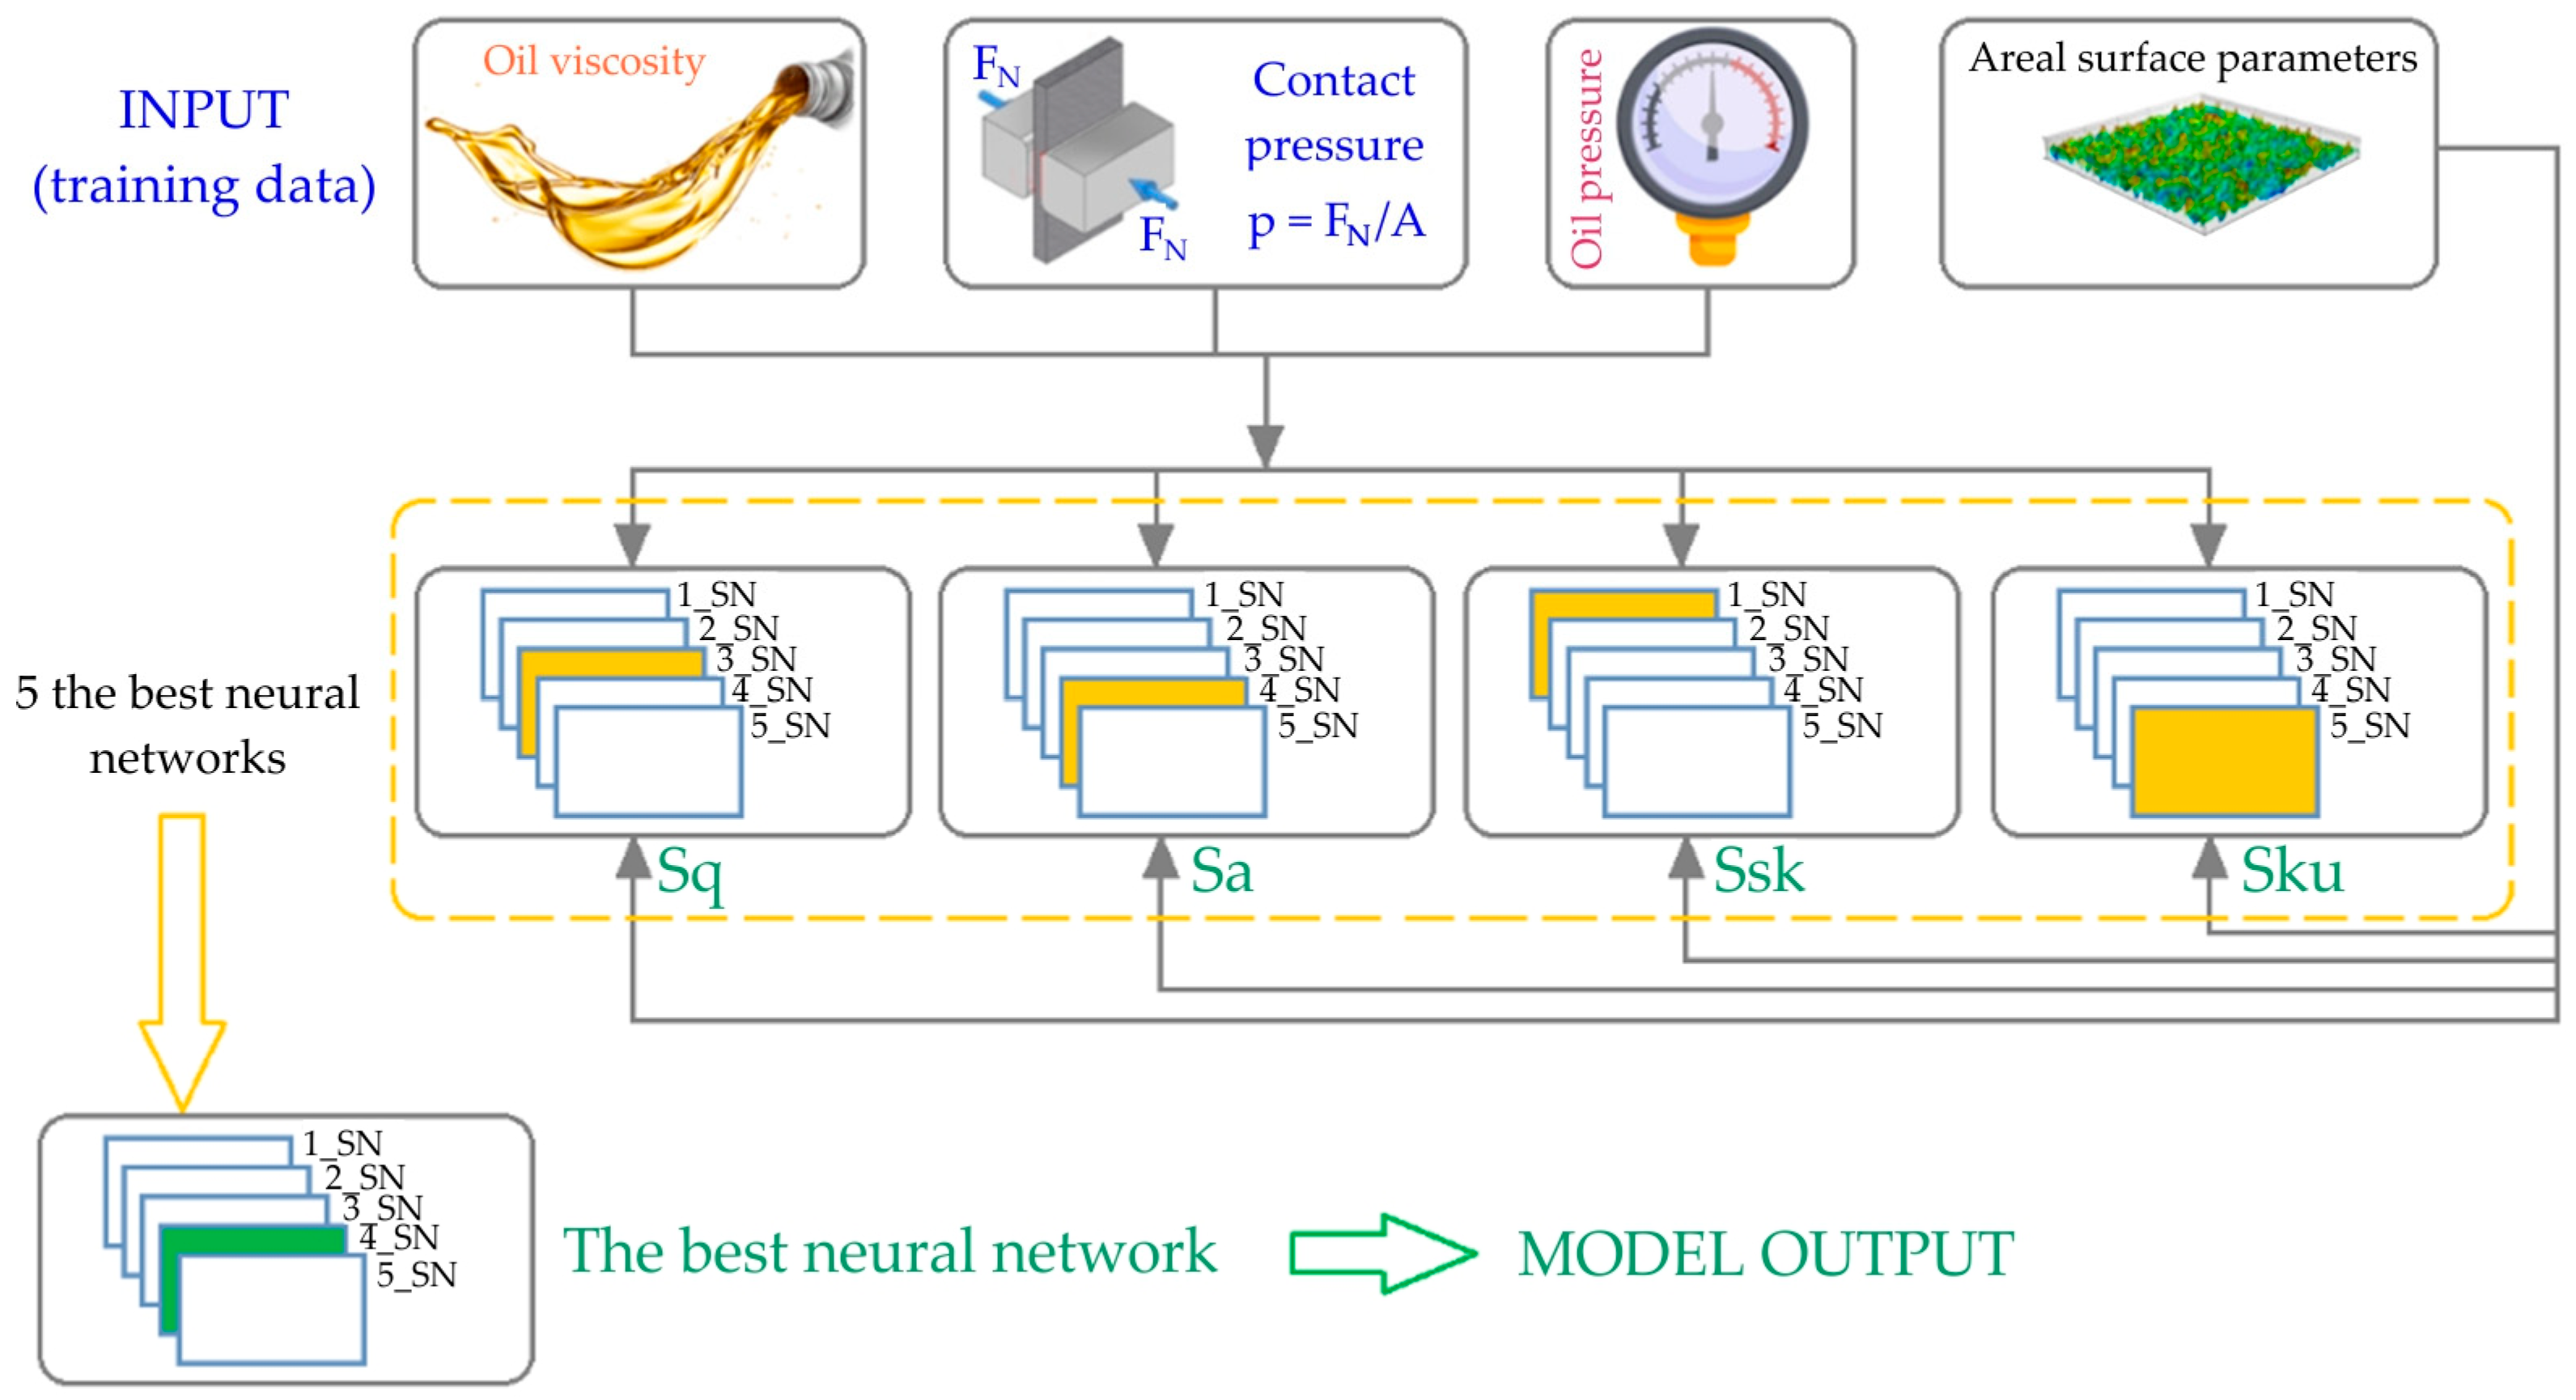
2.3. Artificial Neural Networks

It is worth mentioning that there are different types of neural networks that vary, among other things, in terms of the structure and applied functions of neural activation. In the hidden layers of a multilayer ANN (multilayer perceptron—MLP), there are usually neurons with sigmoidal activation functions. Therefore, the operation of the MLP consists of dividing the space between the input signals by means of hyperplanes—multidimensional equivalents of straight lines dividing two-dimensional space or planes dividing three-dimensional space—into areas corresponding to individual classes distinguished by the ANN. However, there are also networks capable of dividing space using other boundary surfaces, for example, hyperspheres (multidimensional equivalents of circles in a plane or spheres in three-dimensional space). Such surfaces are most often obtained by using RBF neural networks. The differences in the operation of the MLP and RBF ANNs are illustrated in Figure 6.
The effectiveness of the ANN model strongly depends on the set of data used for its training because the neural network in the learning process acquires the ability to model only those relationships that were observable in the training set. Therefore, one cannot expect correct solutions for issues that are fundamentally different from those used during training. When using neural networks, it is important to determine what data should be included in the training set in order to build an effective neural model. For this purpose, it is necessary to determine, first of all, on the basis of which variables (input data) it is possible to achieve the correct generation of the desired output data. At this stage, it is necessary to know the specifics of the model issue. One of the problems encountered in the learning process is so-called overfitting. This occurs when the model, at the end of the training process, no longer adjusts to the basic shape of the approximated relationship but to the fine details represented by individual data from the training set. A validation process is used to avoid overfitting the training set while training the network. For this purpose, a validation set is required for independent control of the training process based on the training set. The simultaneous reduction of the training error and the validation error proves the correct course of the learning process. On the other hand, reducing the learning error with a constant or increasing validation error suggests overfitting. This means losing the ability of the ANN to generalise and, as a result, getting worse and worse results for new cases while improving the fit only to the training set. By observing the training error and the validation error during training, the user can conclude whether the network architecture is correct or whether it needs to be extended or reduced. During training, the network does not adjust to the validation set in the same way as to the training set, but it indirectly influences the final model selection. For this reason, the quality of the responses provided by the ANN for the validation set also does not allow for completely certain conclusions about its effectiveness with regard to new data not used in the training process. It can be assumed that the accidental ANN model will work correctly in relation to the training set and the validation set; however, its ability to generalise will still be unsatisfactory. For this reason, it is advisable to create a third data set, used only to assess the quality of the model after its training is completed. This is the so-called test set. The data from this set is not involved in the training and validation processes. When reporting the results obtained by the ANN model, one should refer primarily to the test set because it is the only one that allows objectively concluding how the model will predict new, completely unknown cases.
Due to the simplified learning algorithm of RBF ANNs and smaller requirements regarding the amount of training data in relation to the MLP, in this article, RBF networks (Figure 7) were used to analyse the friction phenomena. In the analysis performed, the output and input variables were first selected.
The input variables were nominal pressure, oil pressure, viscosity, and selected surface roughness parameters (Sa, Sq, Sku, Ssk) of the sheet metal. These surface parameters were indicated in the literature [34,35,36] as the most important in analysis of the friction of sheet metals. Table 2 shows the groups of input and output variables used in the selection of the network structure, and Figure 8 presents a block diagram for selecting the best network structure. Table 3 presents the range for each input and output parameter.
The data set containing the results of 36 experiments was divided into three sets: training, validation, and testing. The purpose of the test and validation sets was to check the correct operation of the selected solution models, and the rest of the data were included in the training set (used directly for training the network). The following proportions were adopted: 70% of the experimental data were allocated to the training set, 15% to the test set, and 15% to the validation set. The experimental data were randomly assigned to specific sets. The ratio between the total number of data sets and the total number of input factors is equal to 9.
In the analyses regarding the search for optimal RBF ANN models, a tool supporting the creation and testing of neural networks, the so-called automatic network designer (AND), available in the Statistica 13.3 package, was used. AND uses advanced multi-parameter optimisation algorithms, which allow the testing of a large number of networks in a short time and facilitate the automatic selection of the best models. It was assumed that the AND will generate a certain number of networks that will be automatically trained based on the experimental data and that only the five best networks will be retained after validation of the training process.

3. Results and Discussion

3.1. Experimental Results

Under lubrication with both oils considered, the value of the COF increased with decreasing oil pressure. This conclusion is valid for all the nominal pressures analyzed. This confirms the correctness of the concept of the device for reducing friction in the flange area of the drawpiece. In general, the higher the nominal pressure value, the smaller the difference between the COF determined for different oil pressures. When the sheet is heavily loaded, the nominal pressure and mechanical cooperation of the summits of the surface asperities have a dominant influence on the friction phenomena. Under these conditions, the oil, even under high pressure, is not able to effectively reduce the COF. The developed concept of pressurised lubrication is most effective at relatively small nominal pressures of 2–4 MPa. Such pressure values correspond to the actual pressures applied during the deep-drawing of steel sheets [2,33]. Under conditions of dry friction, the values obtained for the COF rise above 0.3, while under conditions of lubrication, even without pressure-assisted lubrication, the COF values do not exceed 0.2 (Figure 9). The value of the COF initially increases in the nominal pressure range of 2–6 MPa and decreases after reaching the maximum value. This is a phenomenon also observed by other authors [37,38,39]: after exceeding a certain pressure value, the relationship between the friction force and the contact force is not proportional, and consequently, the value of the COF decreases. It should be remembered that in SMF, a very hard tool and a relatively soft sheet come into contact. So, the friction phenomena are more intense than in machine nodes. Oil lubrication significantly affects the stability of the friction process and reduces error bars.
It seems crucial to determine the effect of lubrication on the change in the COF in relation to the conditions of conventional lubrication (without pressurised lubricant). For this purpose, the coefficient of lubrication efficiency (CLE), defined as follows, has been introduced:
CLE = μ p μ p 0 μ p 100 %
where µp is the COF determined at pressure-assisted conditions and µp0 is the COF determined at conventional lubrication (po = 0 MPa).
Figure 10 confirms that pressure lubrication is most effective at low nominal pressures. Lubrication efficiency increases with increasing oil pressure. A liquid medium placed between two rubbing surfaces acts as a cushion. Oil pressure-assisted lubrication ensures better oil filling of all valleys in the surface topography. Under these conditions, the summits of the surface asperities are not flattened, and the surface topography is characterised by valleys with a large volume holding the lubricant. The lubrication efficiency of both oils, S100+ (Figure 10a) and S300 (Figure 10b), is similar, and for the nominal pressure of 2 MPa, it is about 15–50% depending on the oil pressure. As the nominal pressure is further increased, the value of the CLE decreases exponentially. At the highest tested nominal pressure of 8 MPa, the value of the CLE does not exceed 3–15%. The lubrication efficiency clearly decreases with the value of the oil pressure. It should be noted that the oil pressure cannot be increased arbitrarily because, at a certain pressure value, oil will leak from the contact zone and, consequently, reduce the pressure of the ‘lubricating cushion’. In the case of S300 oil lubrication (Figure 10b) with an oil pressure of 1.2 MPa, a favourable increase in the CLE was observed at a nominal pressure of 8 MPa. This behaviour was not observed in the tests with S100 oil (Figure 10a). The explanation may be a three-fold difference in the kinematic viscosity of these oils. Two commercial oils, S100+ and S300, are characterised by kinematic viscosities at 20 °C of 360 mm2/s and 1135 mm2/s, respectively. When testing sheets with a specific surface topography containing closed lubricant pockets under a sufficiently high nominal pressure, a sufficiently high hydrostatic pressure could be generated in the closed oil pockets, which, despite the increased nominal pressure, effectively separated the rubbing surfaces. As a consequence, there is a slight increase in the coefficient of lubrication efficiency. During friction with high pressures, the formation of hydrostatic pressure can only slightly increase the effectiveness of lubrication. It is known that during friction at high pressures, the mechanical contact between the summits of the surface asperities dominates.

3.2. Artificial Neural Networks

The possible influence of the selected surface roughness parameter was considered independently by building an independent network according to the scheme in Table 2. Table 4, Table 5, Table 6 and Table 7 present the statistics of the five networks with the best quality for data sets ANN_1, ANN_2, ANN3, and ANN_4, respectively. The statistical values were determined for all data sets. The network structure was saved as a code composed of four elements: RBF-x-y-z, (RBF—network type; x—number of inputs; y—number of neurons in the hidden layer; and z—number of outputs). The quality of the network is determined by the coefficient of determination, R2.
In the analysis of the experimental results, a search for the most promising network architecture was conducted. Due to the significant impact of random effects on the final efficiency of the obtained network, comparing the quality of individual models with different architectures cannot be the basis for recognising one particular architecture as ‘more promising’ than another. It often happens that a network with an architecture less suitable for modelling the specific phenomenon under consideration accidentally achieves better results than a model with a potentially more appropriate architecture because a more favourable initial set of weights will be randomly selected for it. In general, however, networks with a similar architecture are characterised by similar efficiency in solving a specific task.
As mentioned earlier, a group of five structures of different RBF networks was obtained with the help of the AND. Their effectiveness was then compared. On this basis, the architecture potentially most beneficial for the operation of the network was selected. In the case of neural networks, it is practically impossible to say with certainty that the developed model is ‘the best’ possible solution to the problem under consideration. When evaluating and comparing the efficiency of the neural networks of the models presented in this paper, the smallest training and validation errors were selected as indicators of the ANN’s quality.
In issues referring to the use of neural networks, the error measure referred to as the mean square error (MSE) is most often used. It is a measure based on the sum of the squares of the differences between the obtained and the actual value of the network output for all individual cases included in a given set of data [40]:
MSE = i = 1 n y i y i ^ 2 n p
where yi represents the actual COF values, y i ^ represents the predicted COF values, n represents the number of data, and p represents the number of parameters within the model.
Errors during summation are squared to avoid the effect of compensating positive errors by negative errors (after squaring, every error is positive), and moreover, squaring makes the measure used sensitive to large errors. The resulting SSE is divided by the number of elements in the considered set of cases in order to obtain the MSE (per single case). Often, the square root of the MSE is taken to obtain error values in the same units in which the network output value is measured, which facilitates their interpretation. Network training consists of minimising the MSE for the training set. The MSE is very intuitive and is mainly used in regression tasks when the trained network returns output numerical values that are a solution to the analysed problem. However, this error is less useful in classification tasks, where the network should indicate the correct category at the output.
Table 8 summarises ‘the best’ networks in terms of error values, one for each of the data sets ANN_1–ANN_4. In this way, it was determined which sheet surface roughness parameter, Sa, Sq, Ssk, or Sku, carries important information apart from the other parameters, determining the value of the COF. From this, the best network was determined as the RBF-8-9-1 network (Table 8) for the ANN_2 input parameters (Table 2): nominal pressure, oil pressure, oil viscosity, and the root mean square height Sq surface roughness parameter. The next part of the article will concern this network.
Figure 11, Figure 12 and Figure 13 show the dependence of the COF and the input variables for the experimental data and the response surfaces of the RBF-8-9-1 network. As expected, the highest value of the COF was observed for dry friction conditions. In lubrication conditions, initially with increasing oil viscosity, the COF value decreases and then begins to increase (Figure 11). This is due to the fact that the highly viscous oil adheres more to the rubbing surfaces, and consequently, the viscosity shear stability increases. The above conclusions are valid for the entire range of the analysed nominal pressures.
The ANN almost perfectly reflects the relationship between the nominal pressure and the root mean square height Sq of sheet metal on the value of the COF (Figure 13). The highest value of the COF in the entire range of the analysed pressures was observed for the average value of the Rq parameter. In addition, there is a tendency to decrease the value of the COF with increasing nominal pressure. In general, there is good agreement between the experimental data and those predicted by the RBF neural network. The scatterplot of the actual and predicted COFs for the 95% confidence interval shows that the COFs are distributed correctly along the diagonal (Figure 14). The four points on the right side of this graph correspond to dry friction conditions where the COF has reached significant values in excess of 0.3.
The graph in Figure 15a shows the comparison of the actual COF and the one estimated on the basis of the RBF-8-9-1 network. The first four points correspond to friction in non-lubricated conditions. So, initially, the COF has a much greater value than under lubrication conditions. In general, we can see that the forecasts are well matched to the experimental data. Figure 15b shows the performance of the ANN training. The y-axis shows the performance parameter (MSE). The individual epochs of network training were recorded on the axis of abscissa. The smallest MSE error in testing the neural network was achieved by the ANN for epoch no. 12 and was 0.009. It can be seen that the neural network continued the training algorithm for 52 more epochs in order to confirm the presumptive global minimum of the MSE. From epoch #1 to epoch #12, there is a downward trend in the MSE for the training and test sets.
The use of the radial basis function ANNs to analyse the influence of the input parameters of the friction process on the value of the COF made it possible to determine the correlation between the selected surface roughness parameters and the value of the COF. It was found that the surface roughness parameter Sq is the most correlated with the COF. The research confirmed the effectiveness of RBF ANNs for the analysis of the friction phenomenon based on a limited number of experimental data points. Recognising the relationship between many parameters, often synergistically interacting, using analytical methods would be difficult and complex. Meanwhile, ANNs allow for finding response surfaces to assess the interaction of individual input parameters in the multidimensional response of a neural network. Moreover, it is possible to forecast the value of the COF for data that did not participate in the training process. The only condition is that the values of the input parameters for the predicted parameter should be within the range of the values of the input parameters used in the training and validation processes of the ANN.

4. Conclusions

In this article, the authors put emphasis on modelling the friction phenomenon in SMF using RBF ANNs. Since it is analytically difficult to find complex interactions between input parameters and the COF value, ANNs can acquire the ability to predict the COF from a set of training data. The main conclusions from the experimental research and neural modelling are as follows:
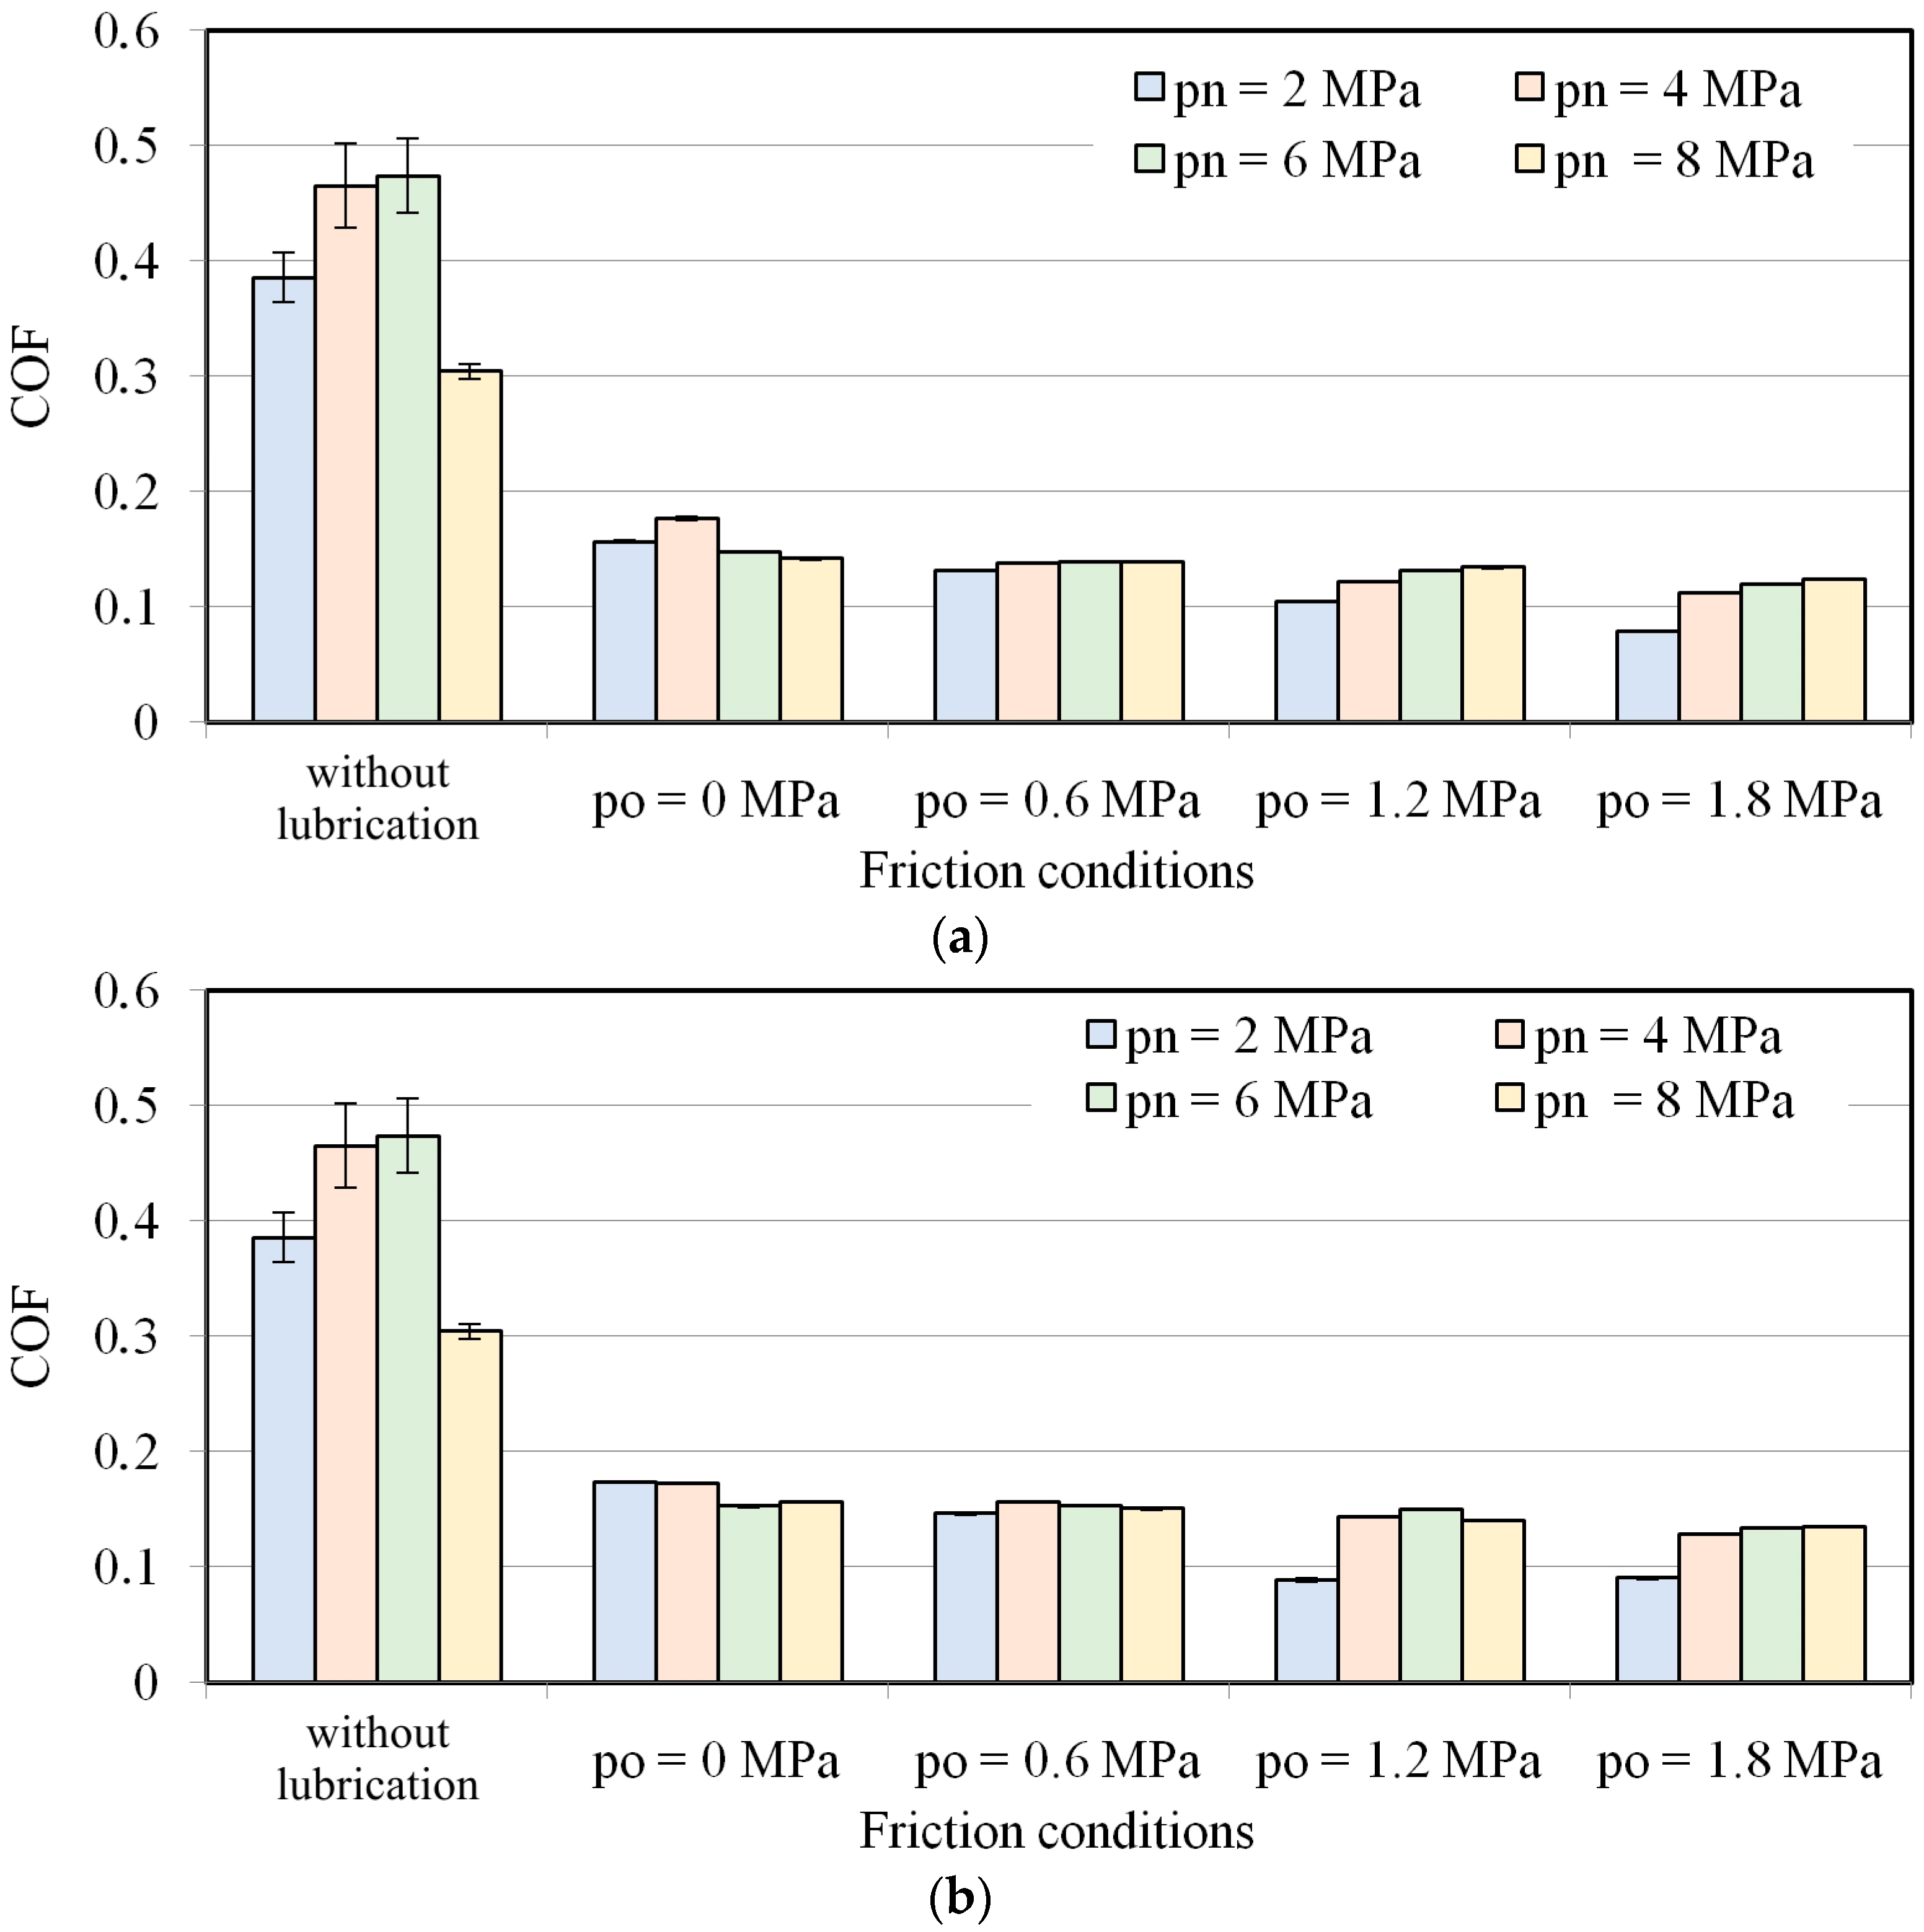
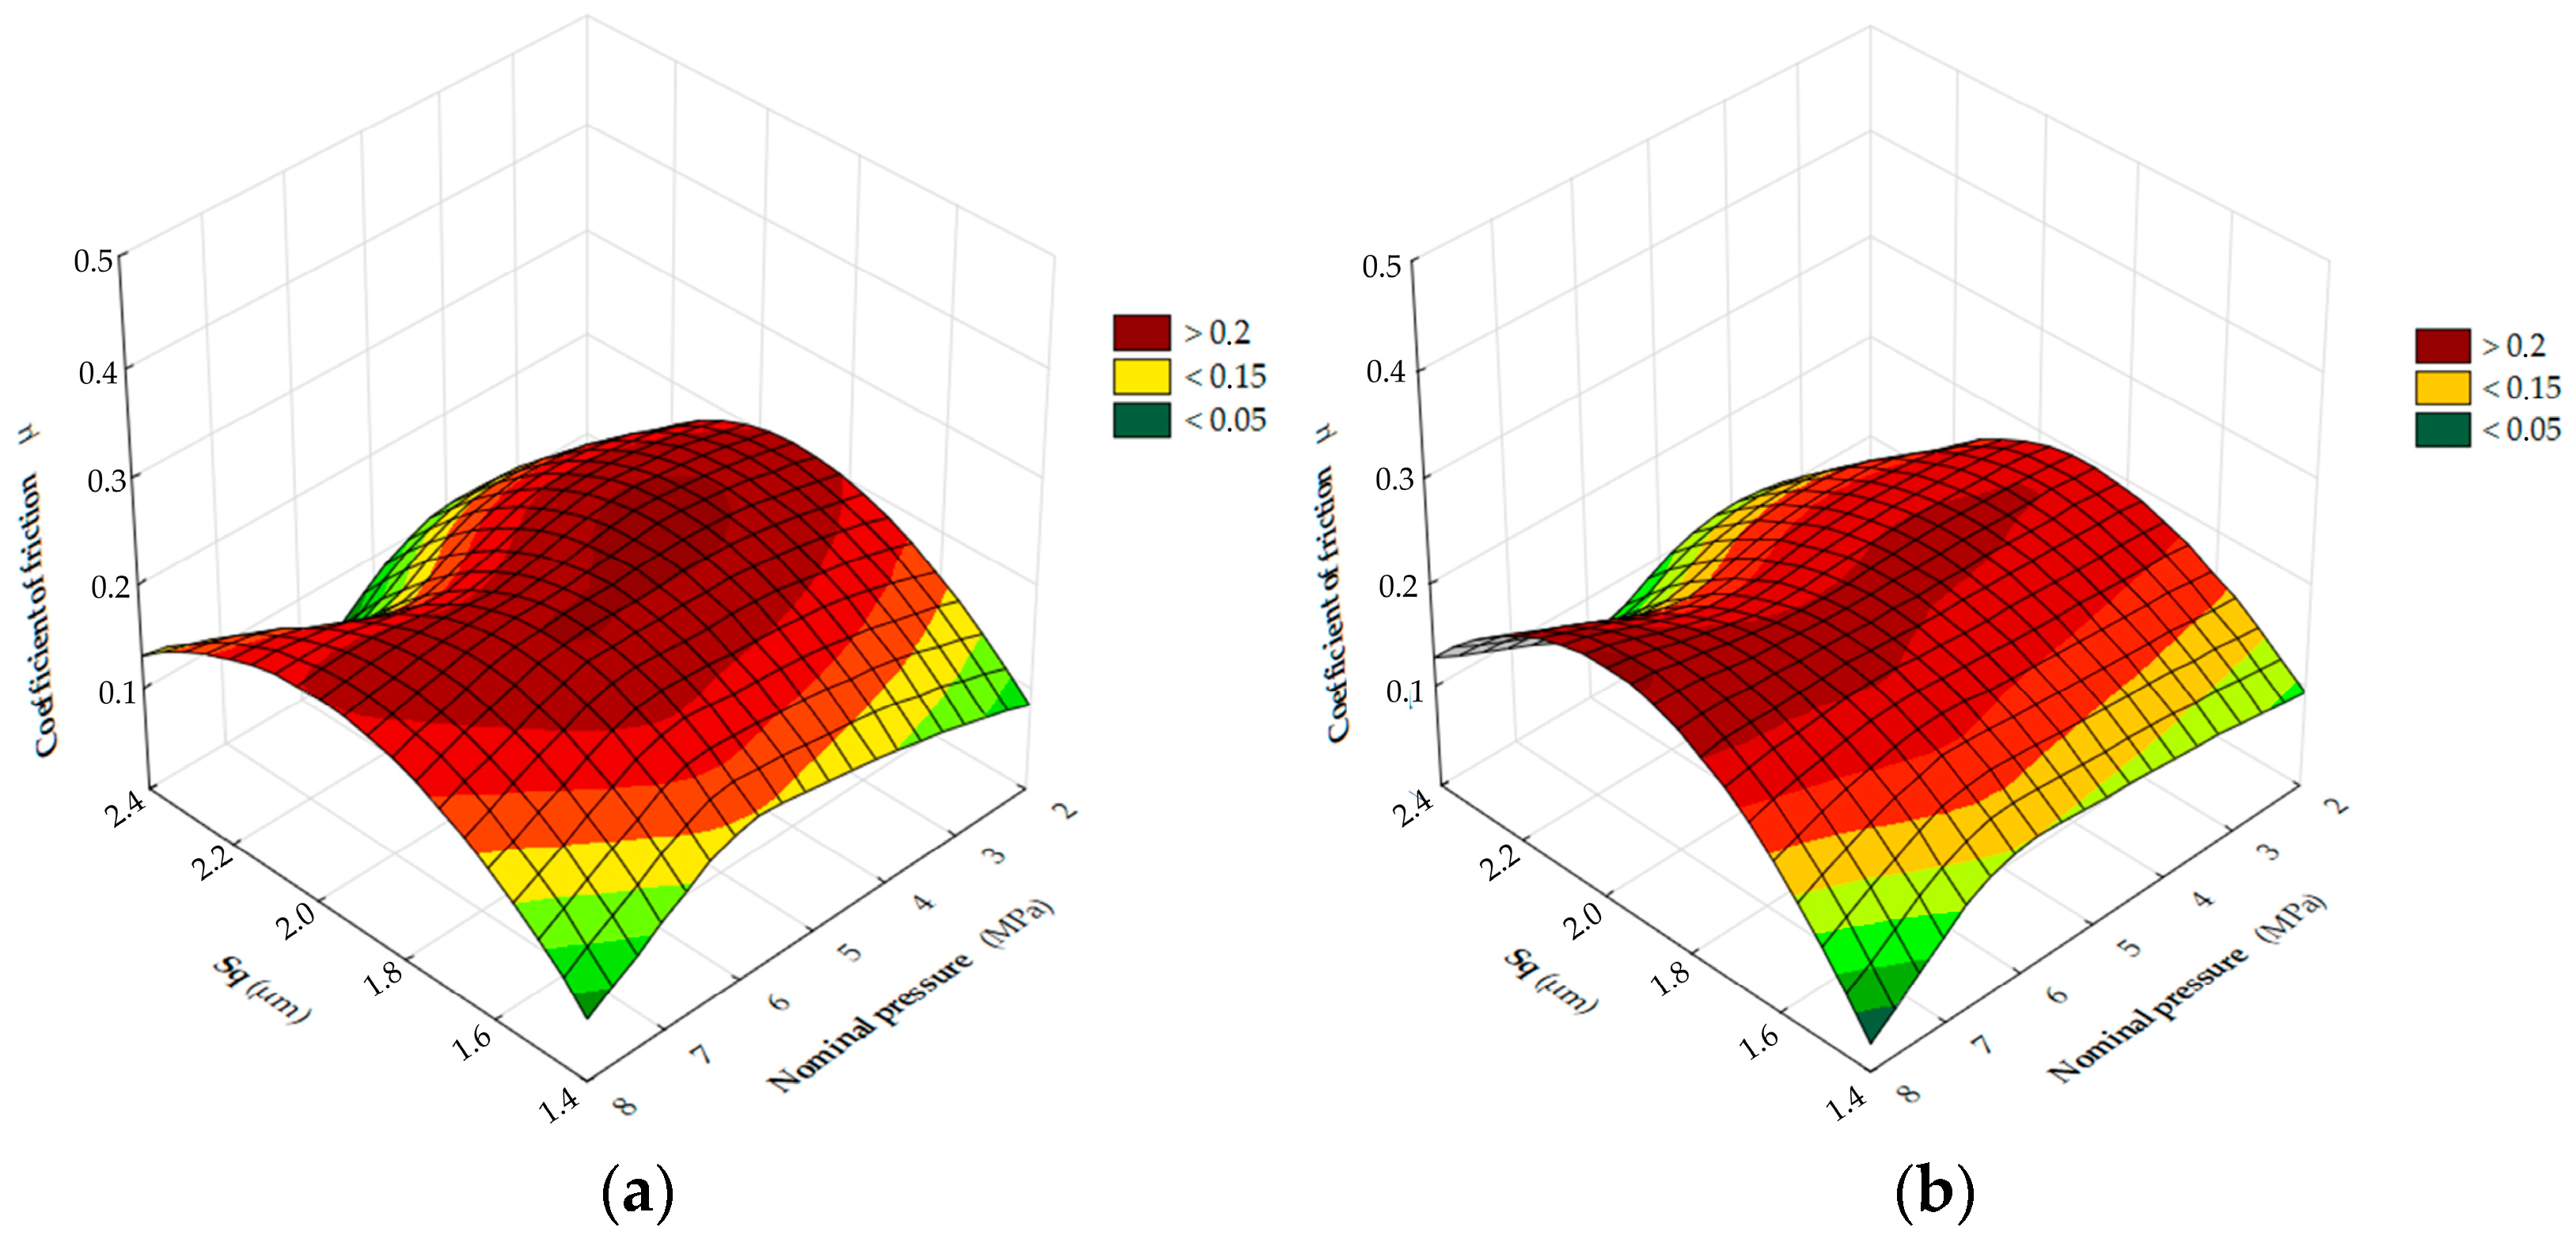
  • Under lubrication with both oils considered (S100+ and S300), the value of the COF increased with decreasing oil pressure. This relation is observed for the whole range of nominal pressures analysed.
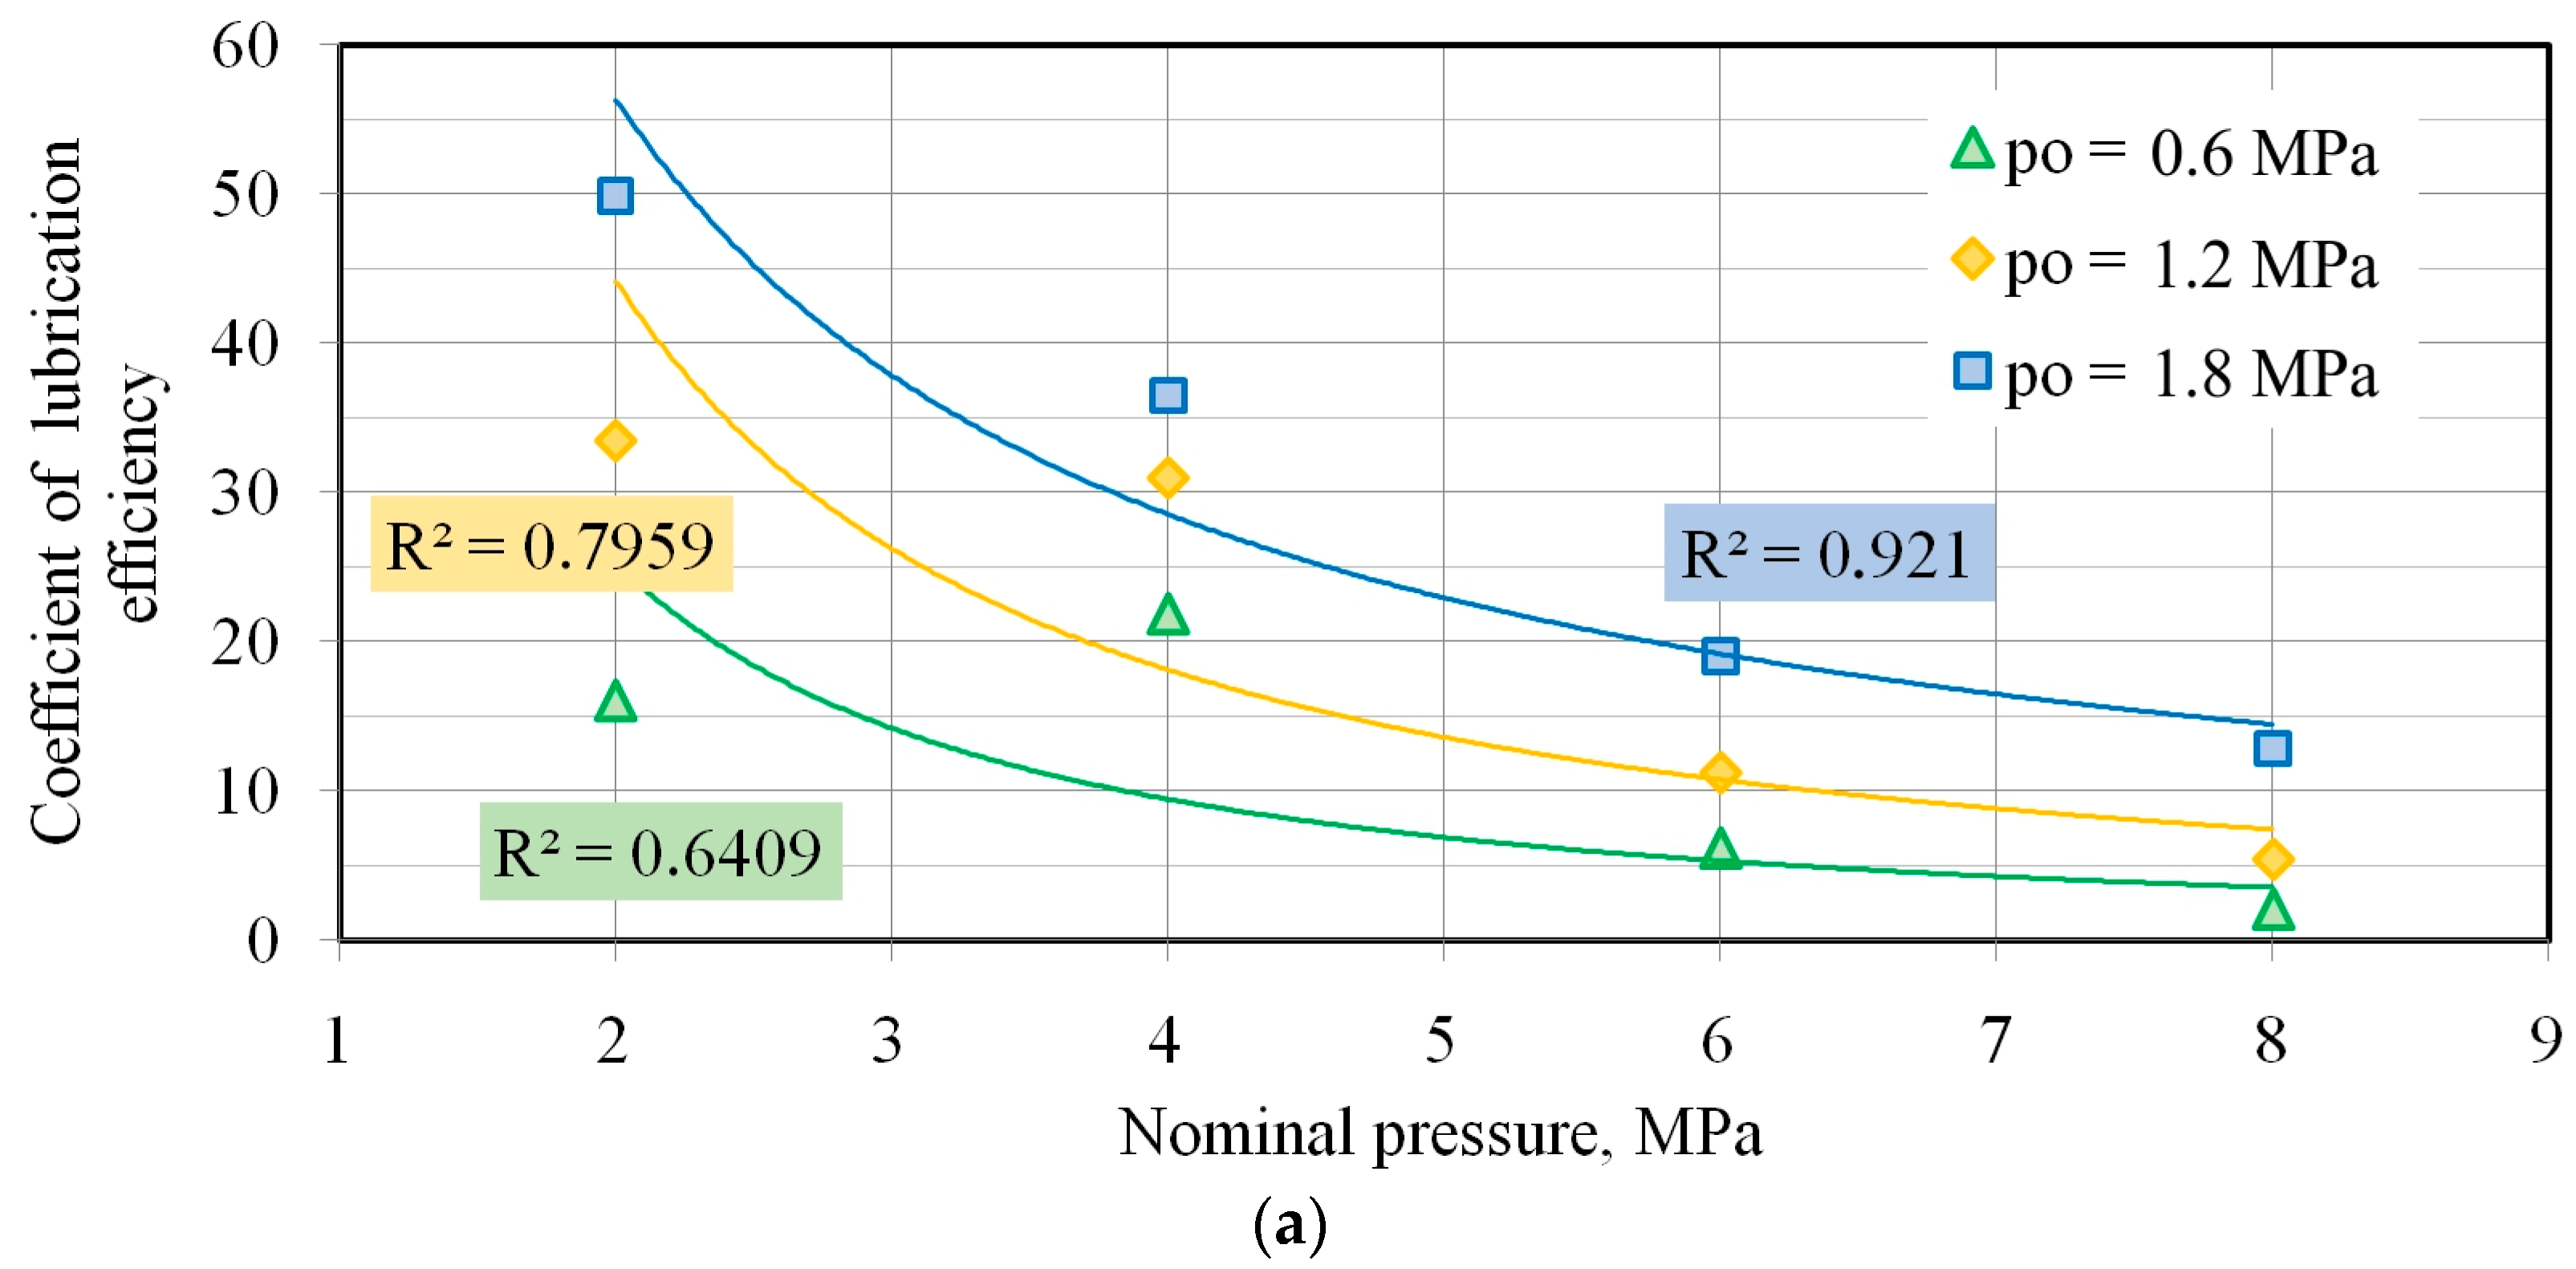
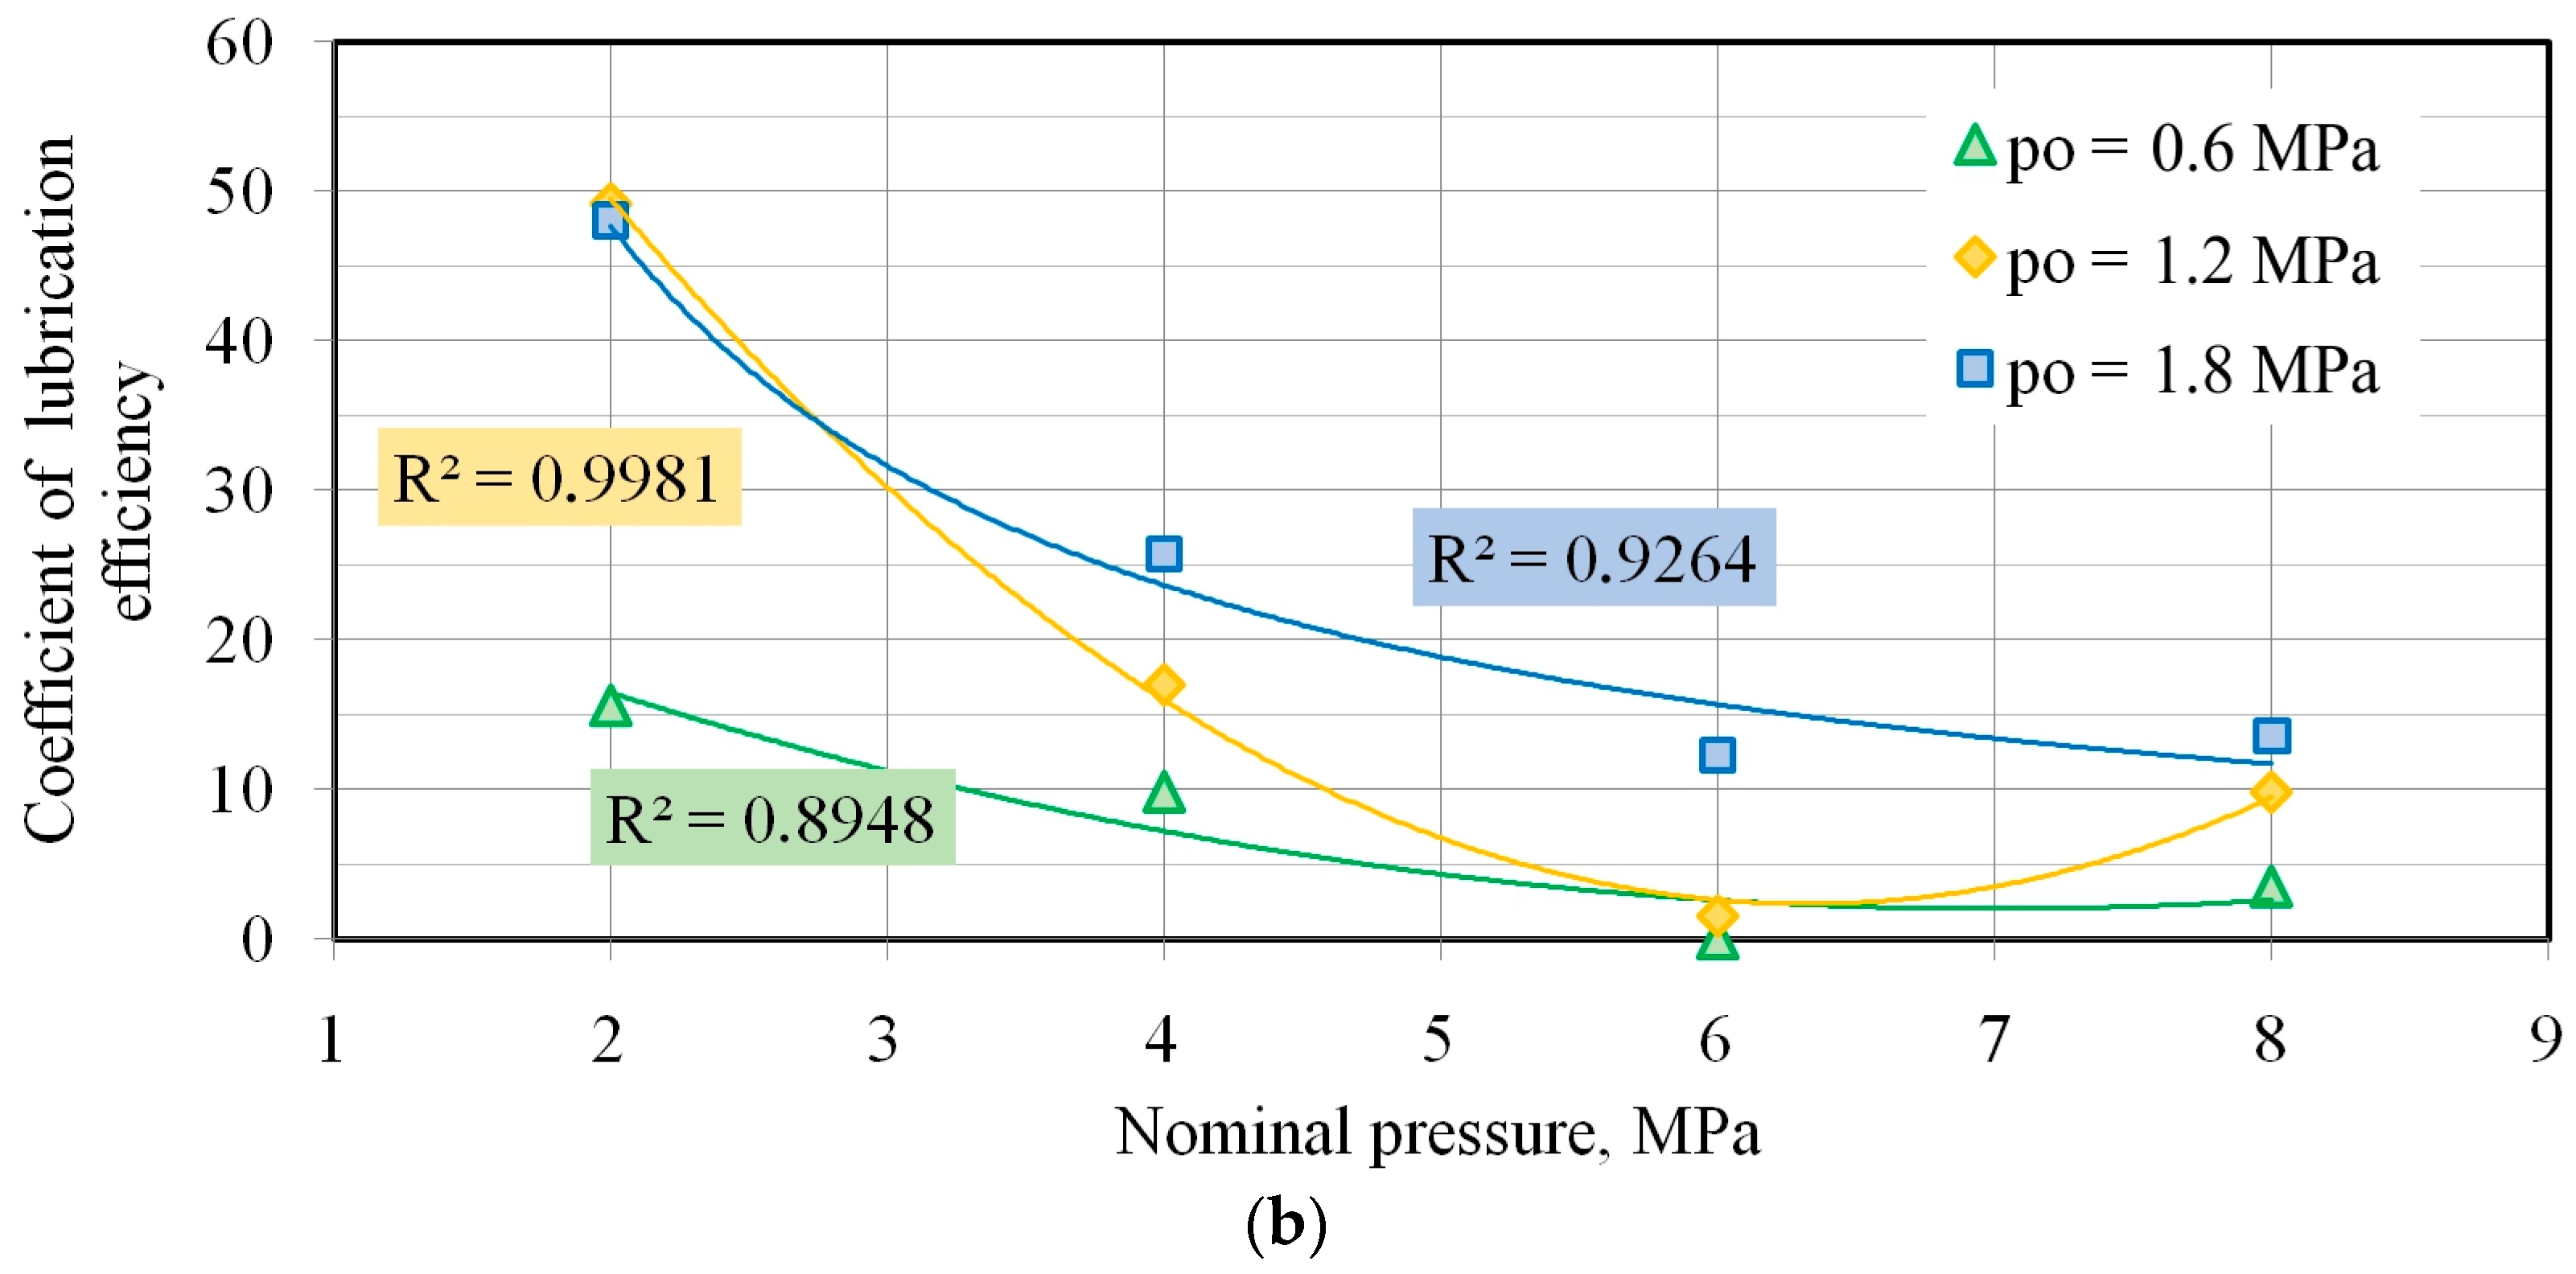
  • The higher the nominal pressure value, the smaller the difference between the COF determined for different oil pressures. So, in the case of pressurised lubrication, the viscosity of the oil becomes less important in SMF under high pressures.
  • The developed concept of pressurised lubrication is most effective at relatively small nominal pressures of 2–4 MPa. This range of nominal pressures corresponds to the actual nip pressures when forming deep-drawing steel sheets.
  • Under conditions of dry friction, the values obtained for the COF rise above 0.3, while under lubrication conditions, even without pressure-assisted lubrication, the COF values are reduced by at least 50%.
  • As the nominal pressure increases, the value of the coefficient of lubrication effectiveness decreases exponentially. Moreover, the lubrication efficiency clearly decreases with the value of the oil pressure.
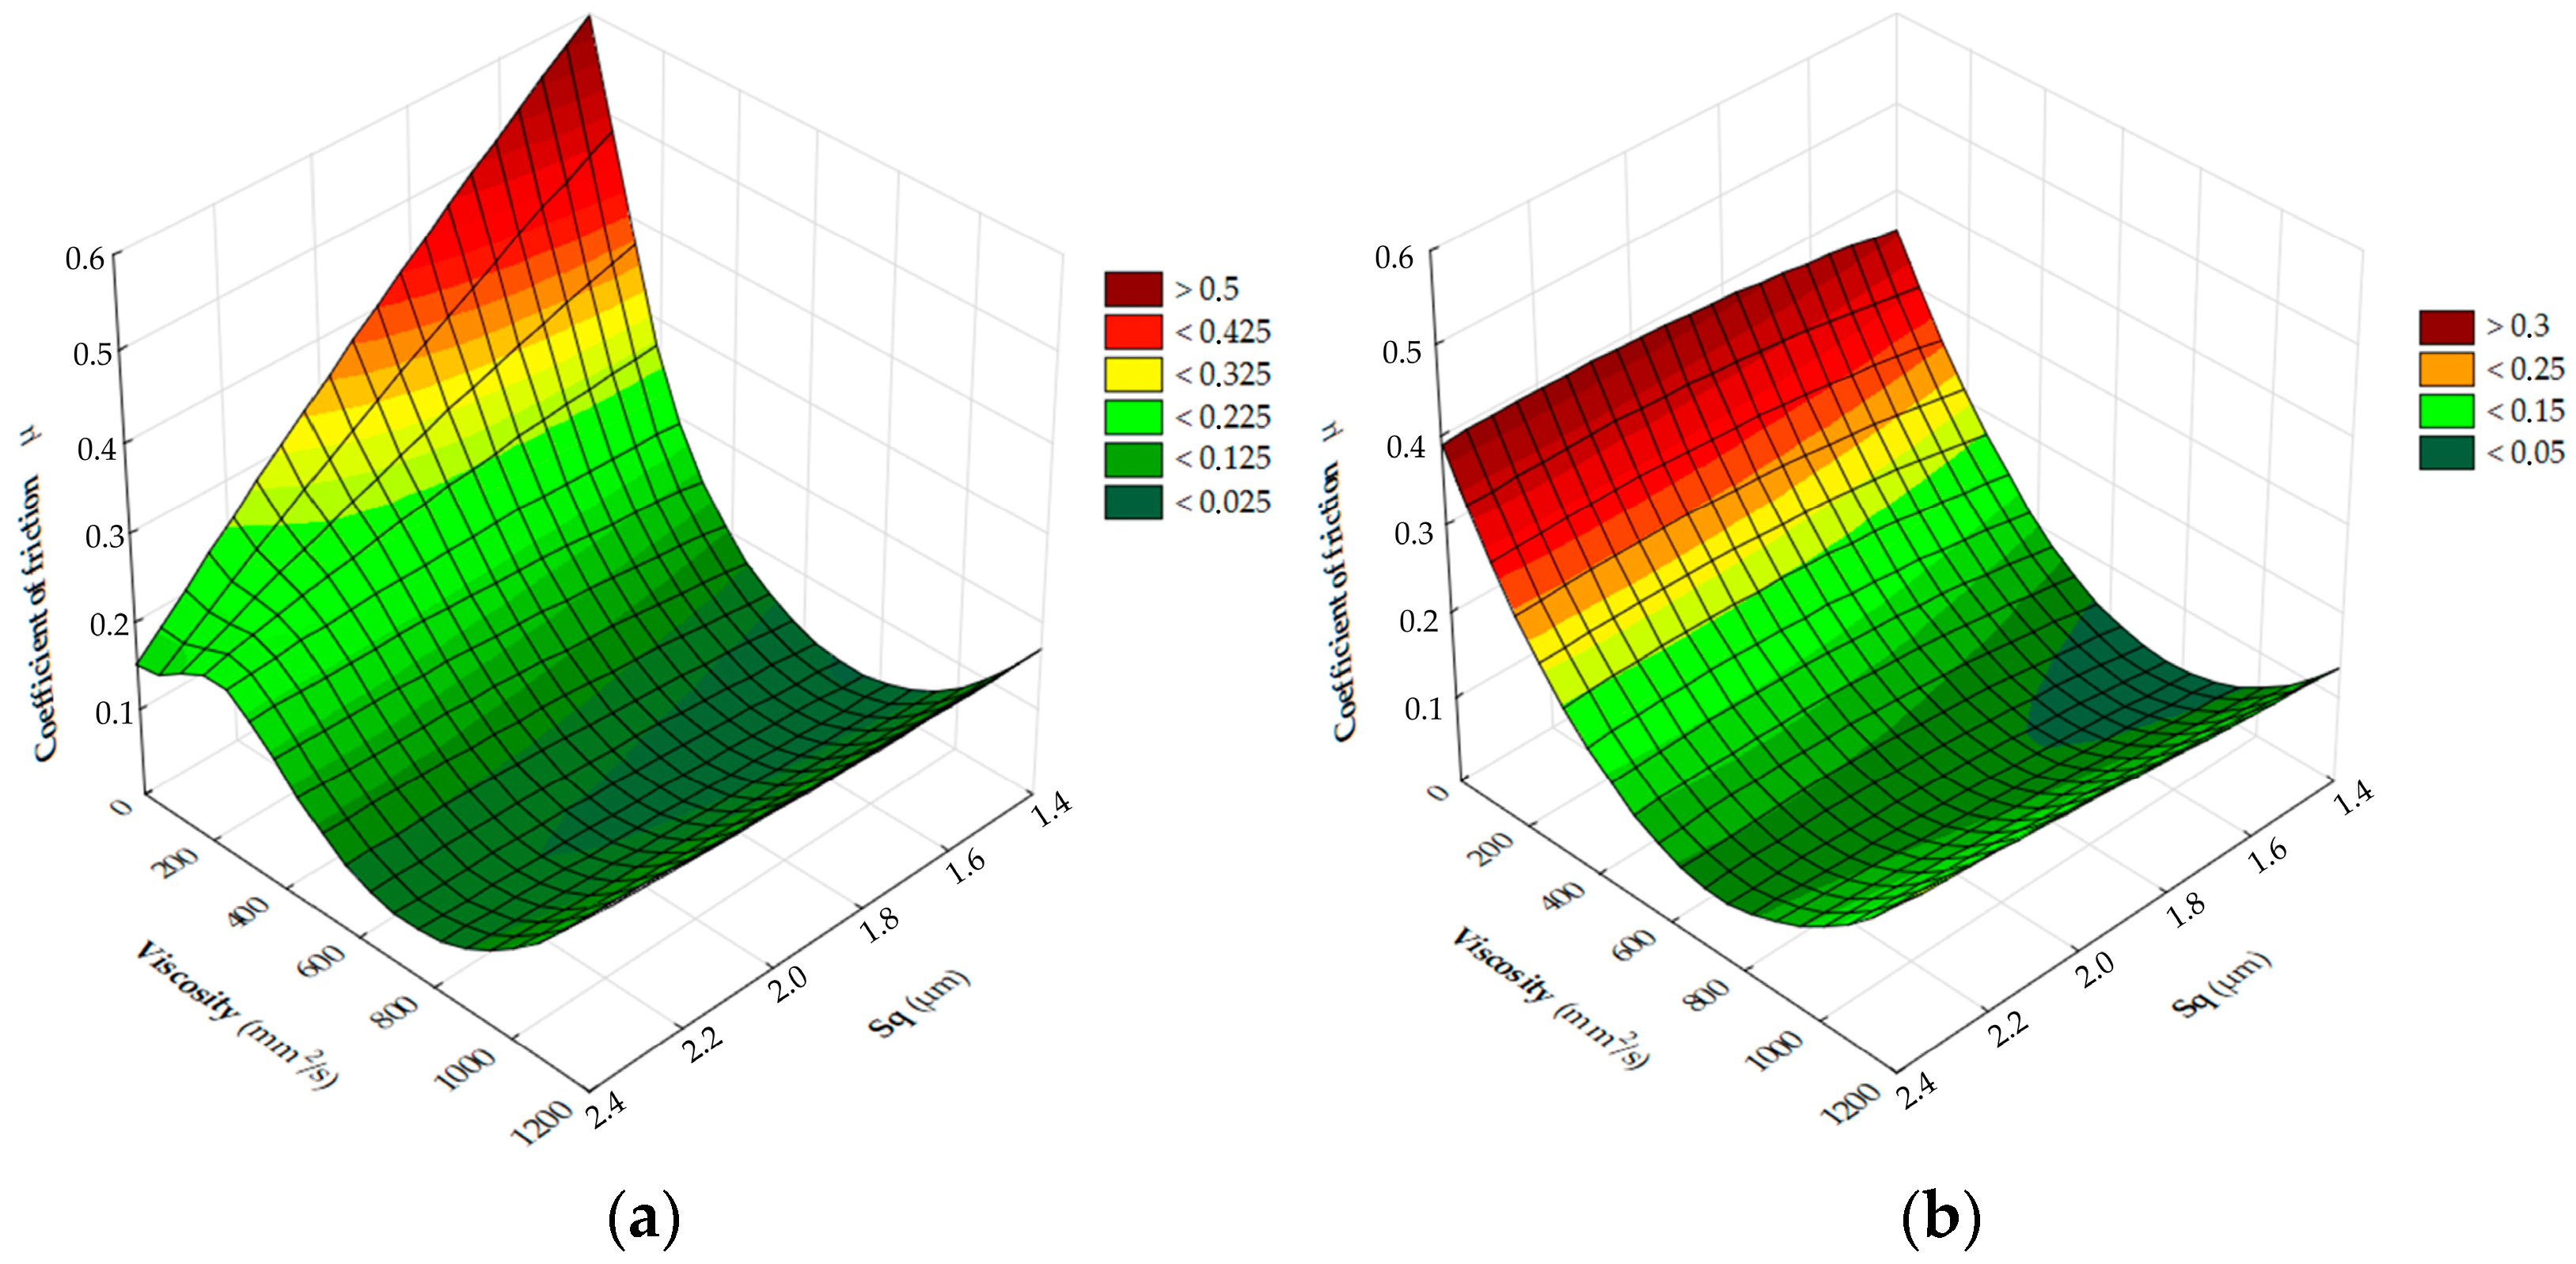
  • Several combinations of input parameters were tested using RBF ANNs. Among the sheet surface roughness parameters considered (Sa, Sq, Ssk, and Sku), the root mean square height Sq was found to be the most sensitive in relation to the COF.
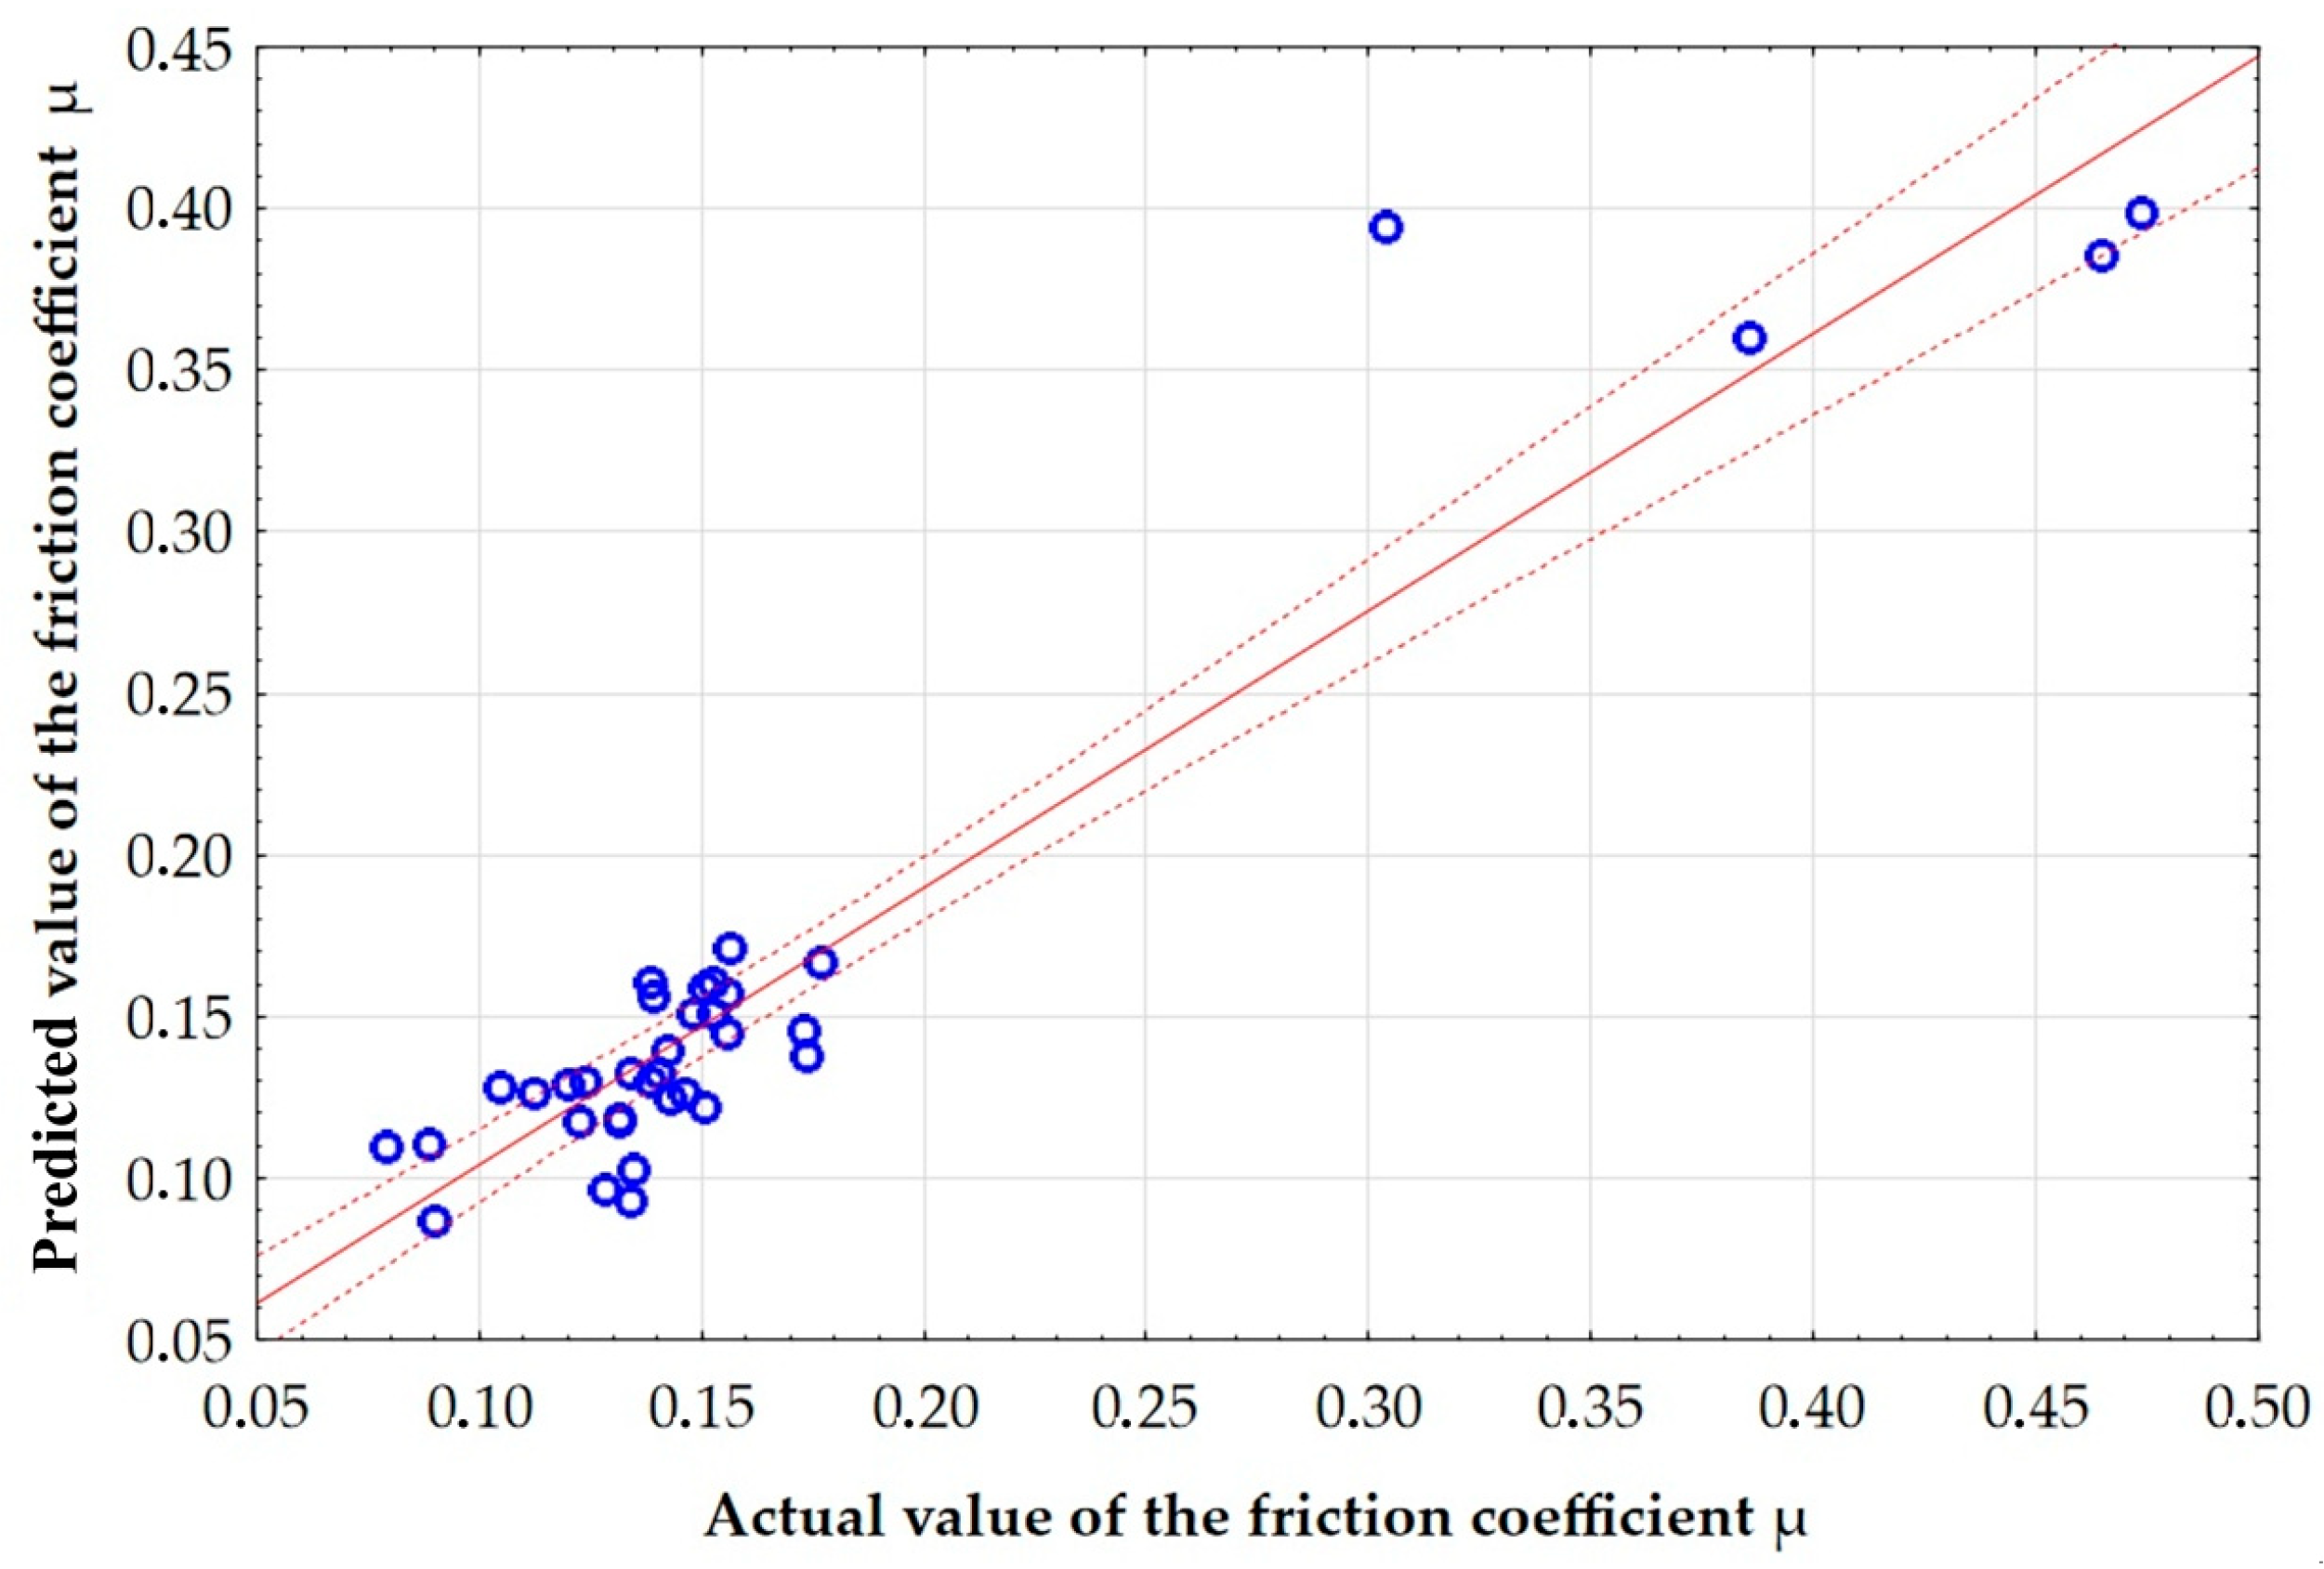
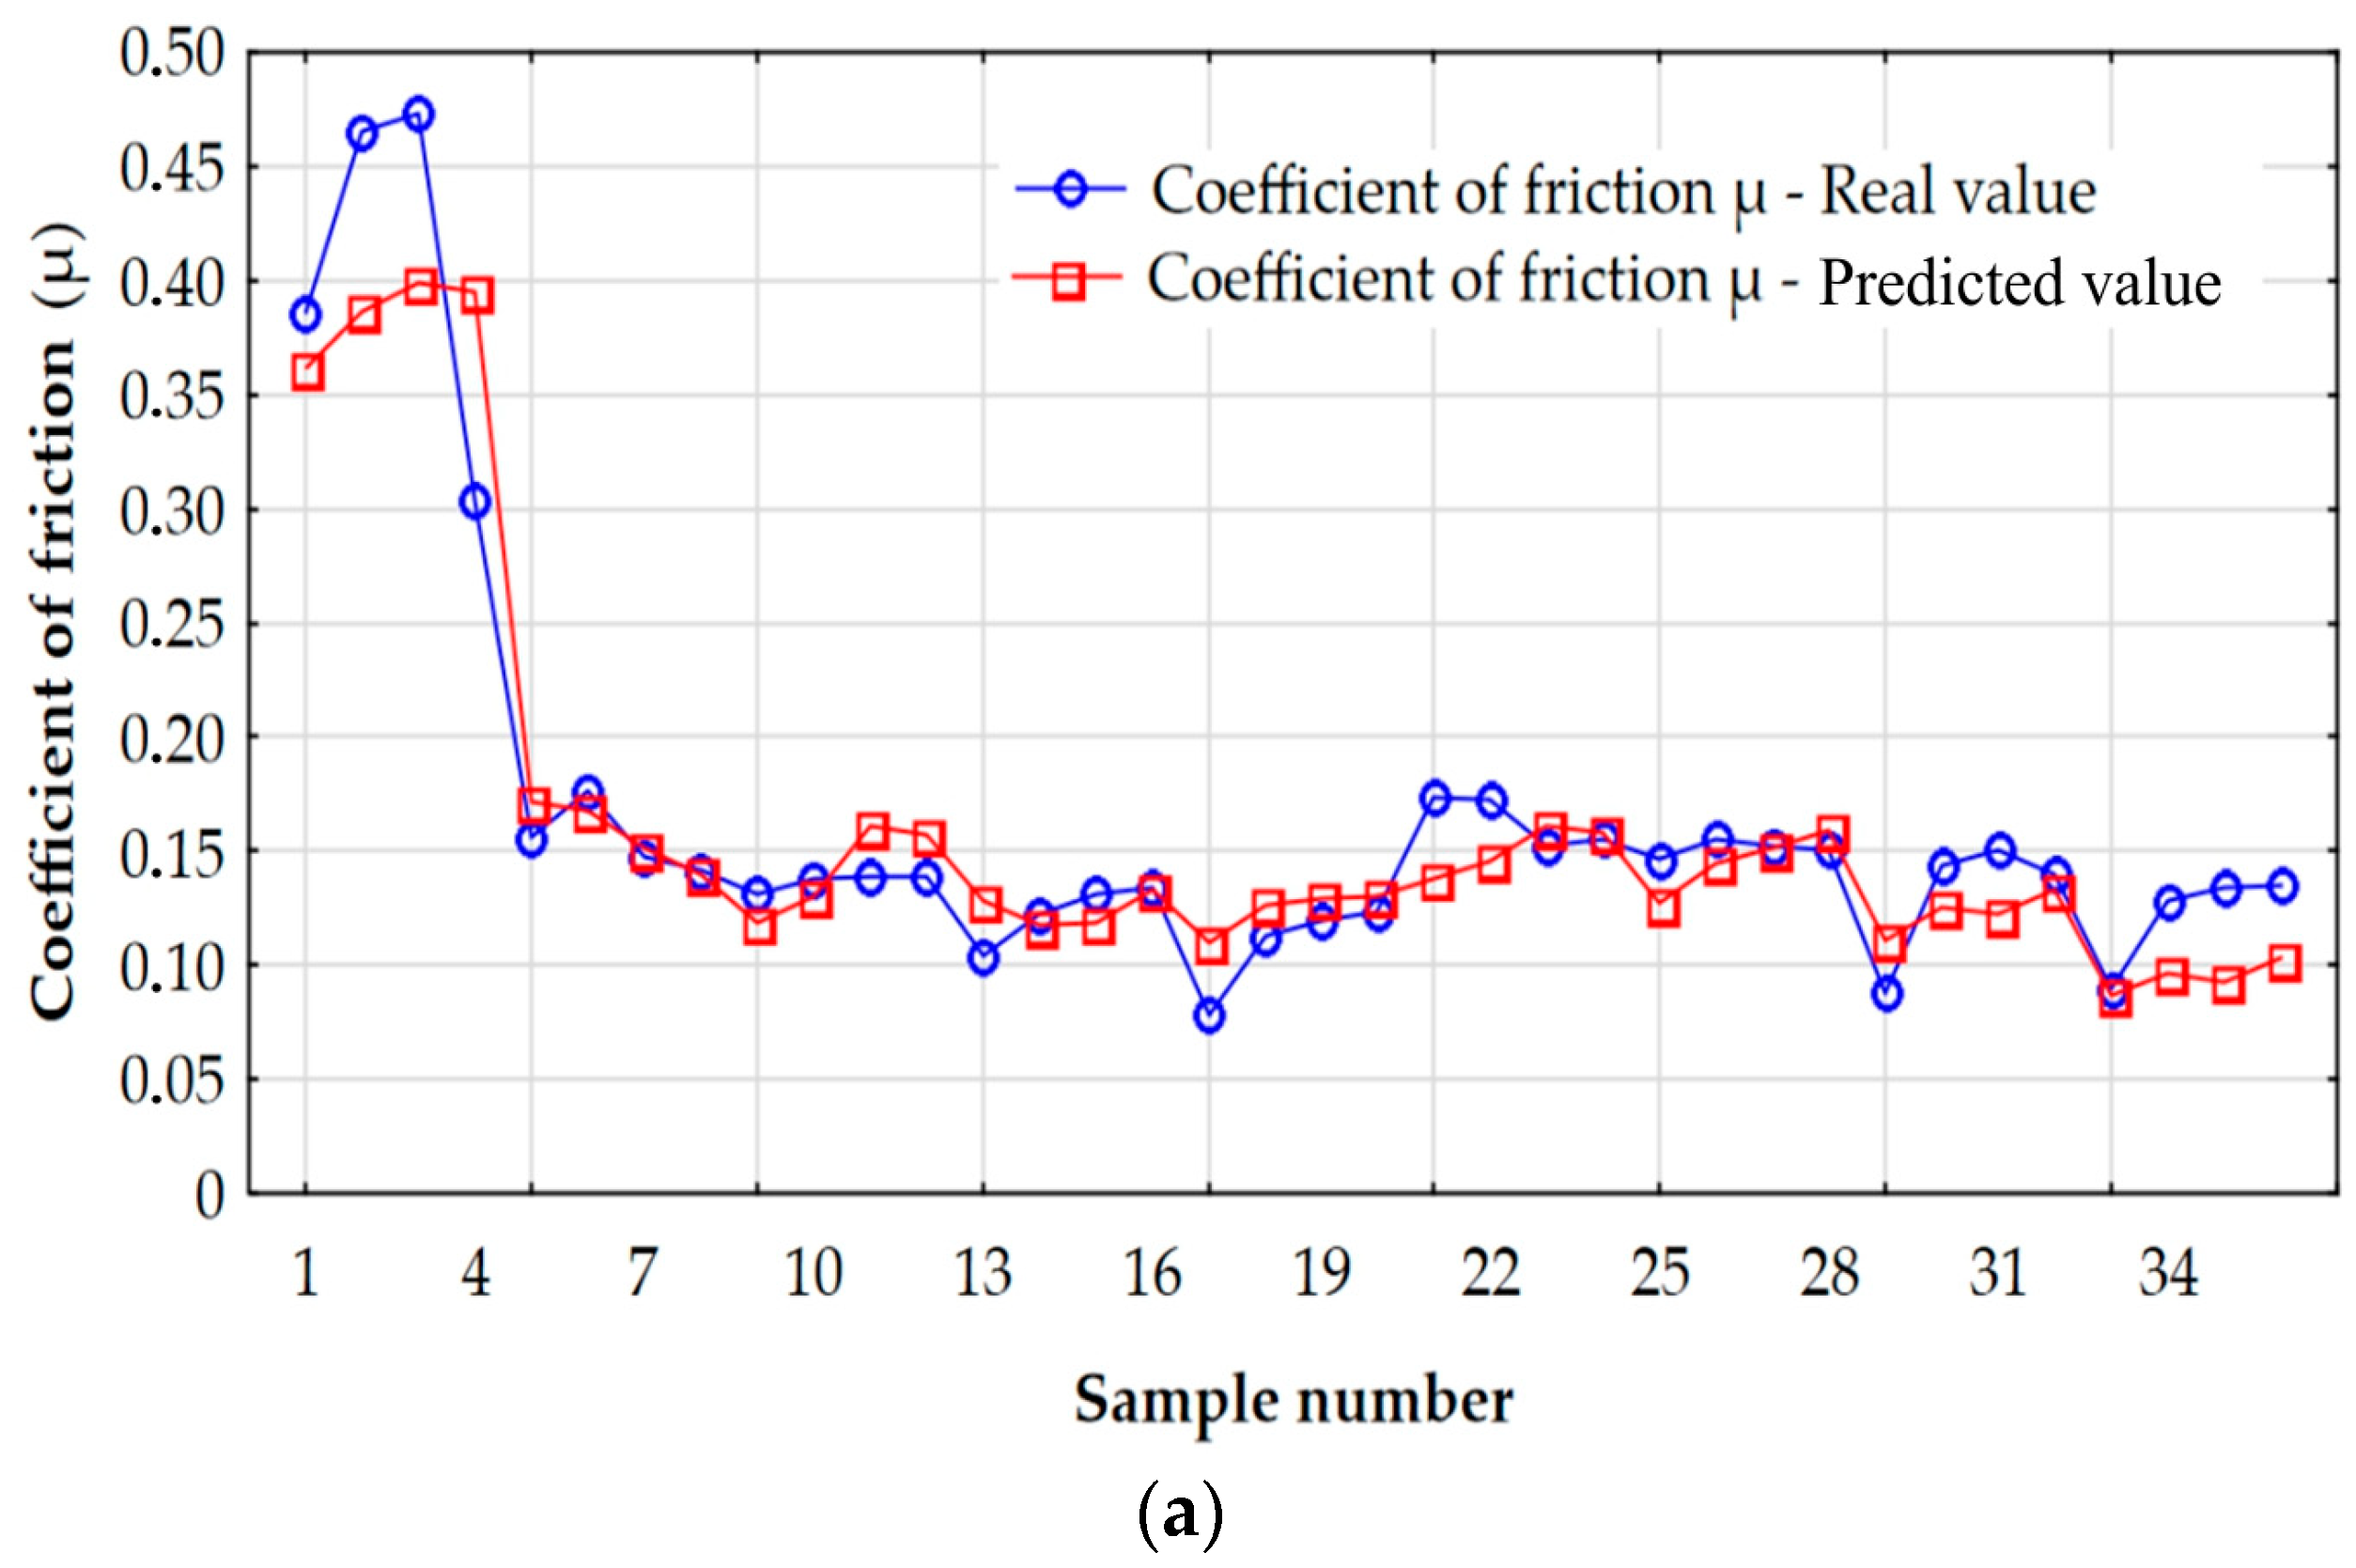
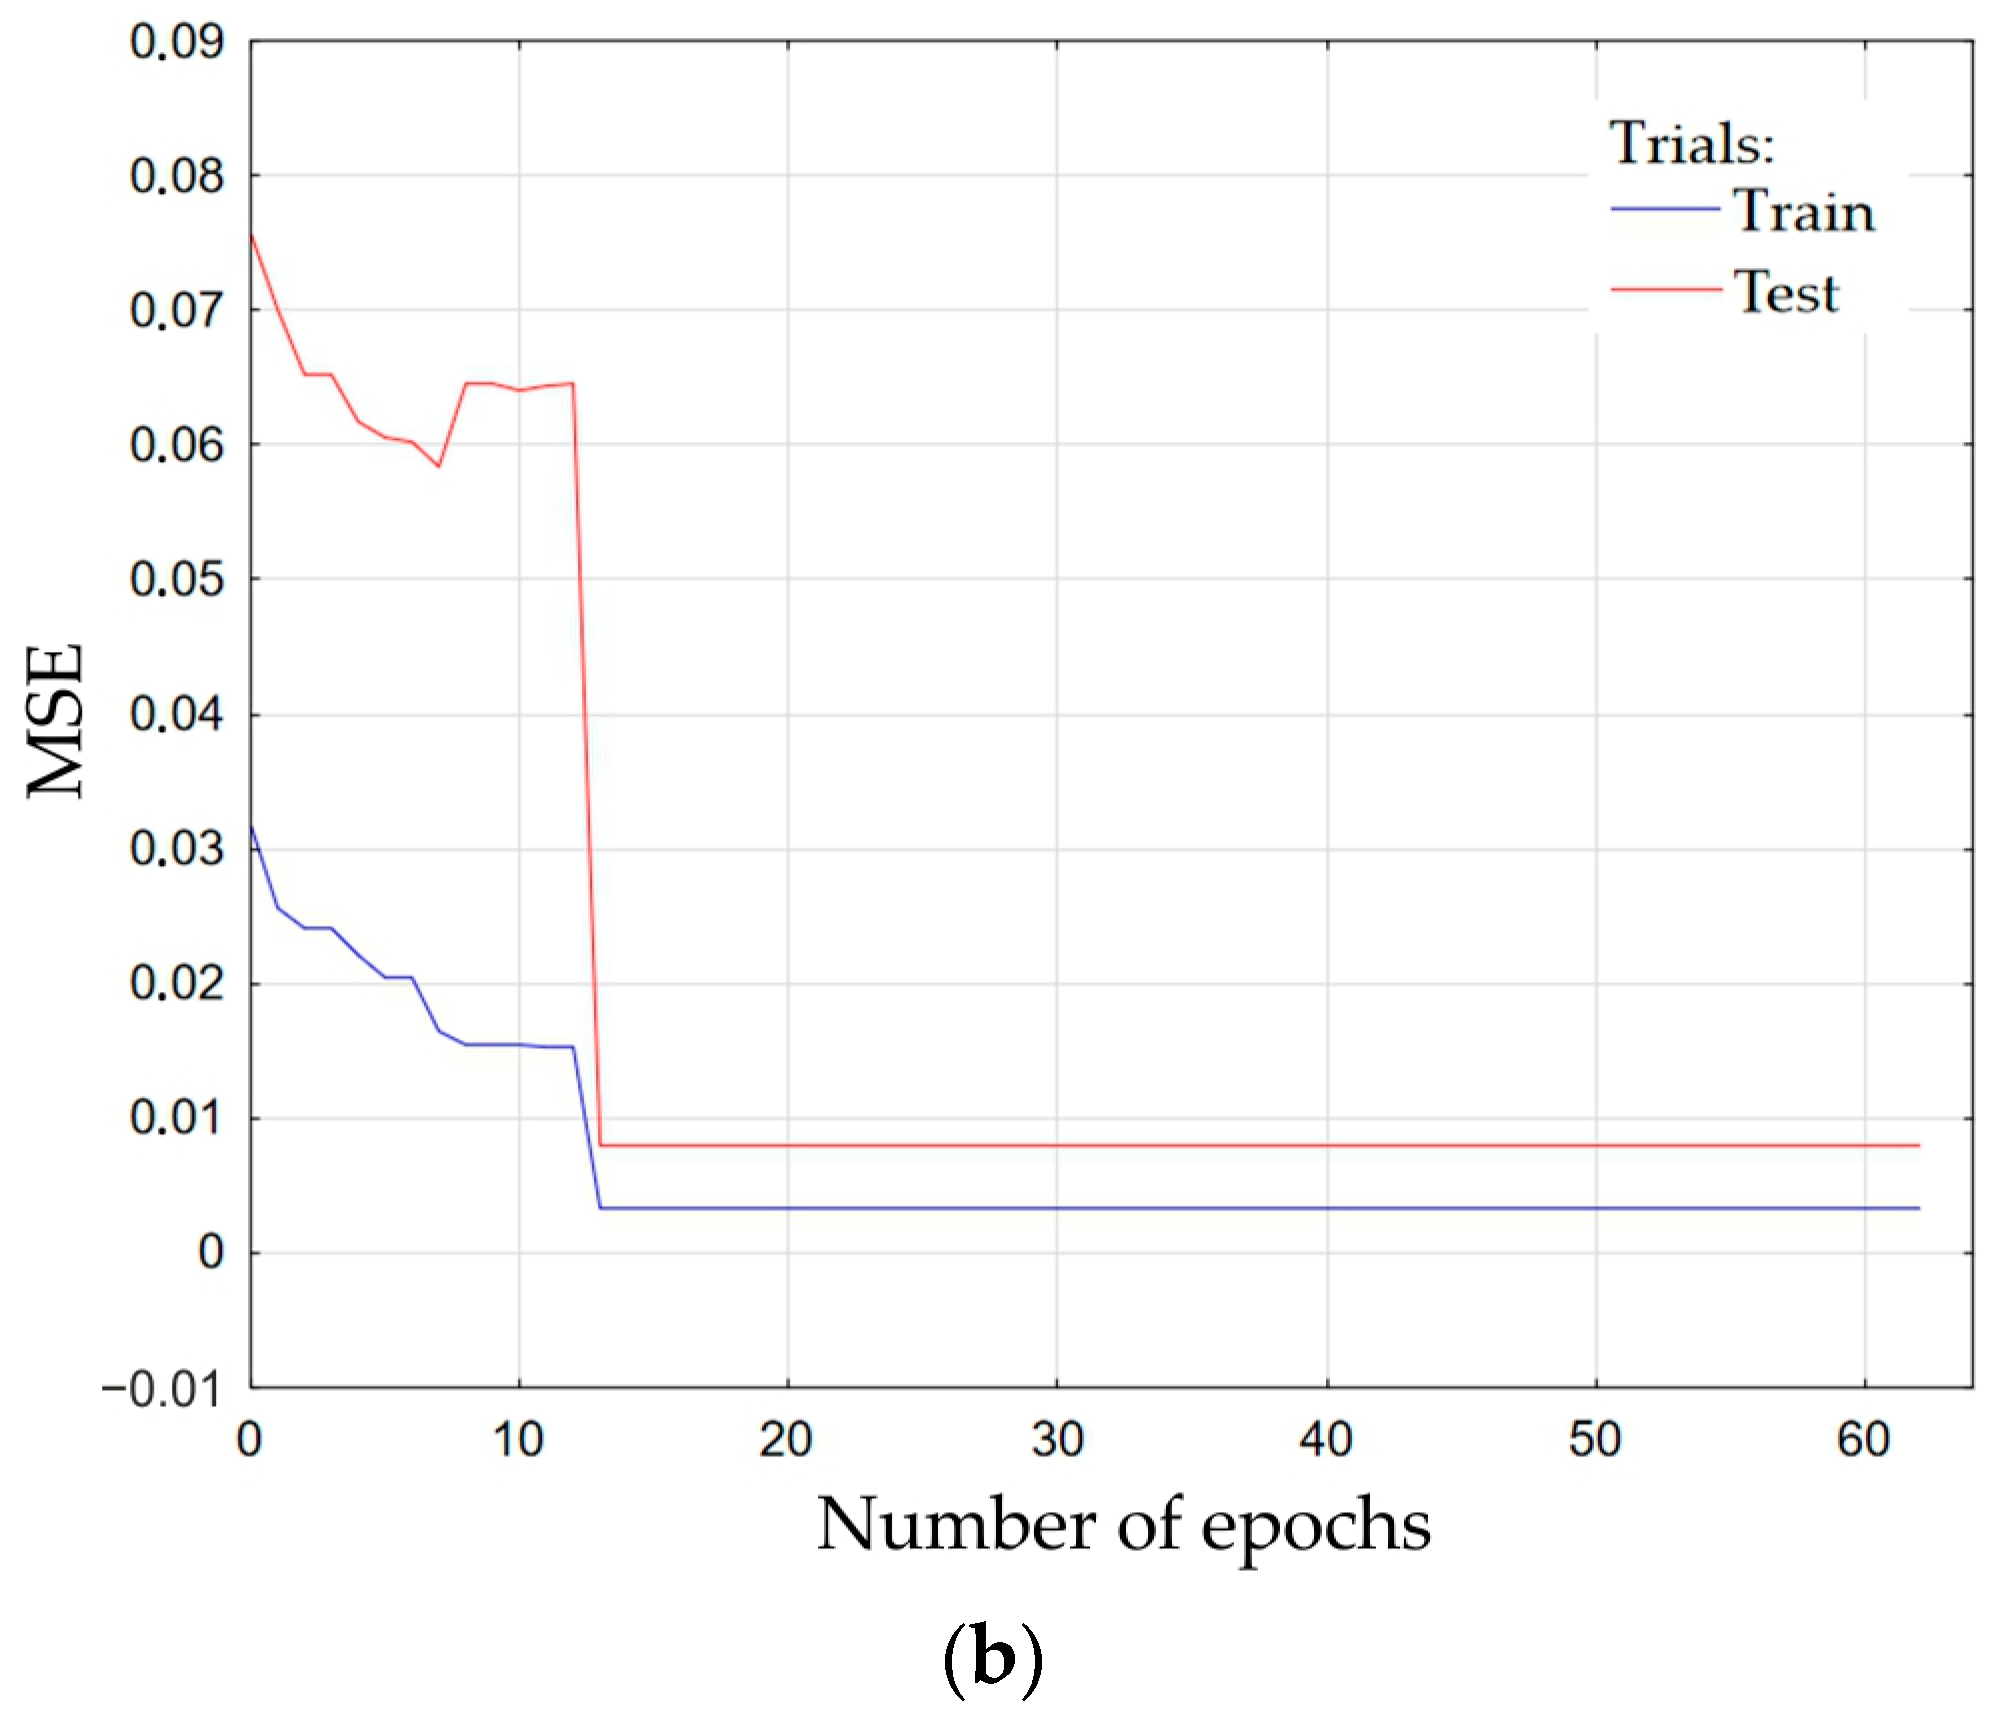
  • The smallest error for the test set (0.000292) was characteristic of the RBF network with nine neurons in the hidden layer. The ANN prediction value for the training set, determined by the coefficient of determination R2, was 0.989.
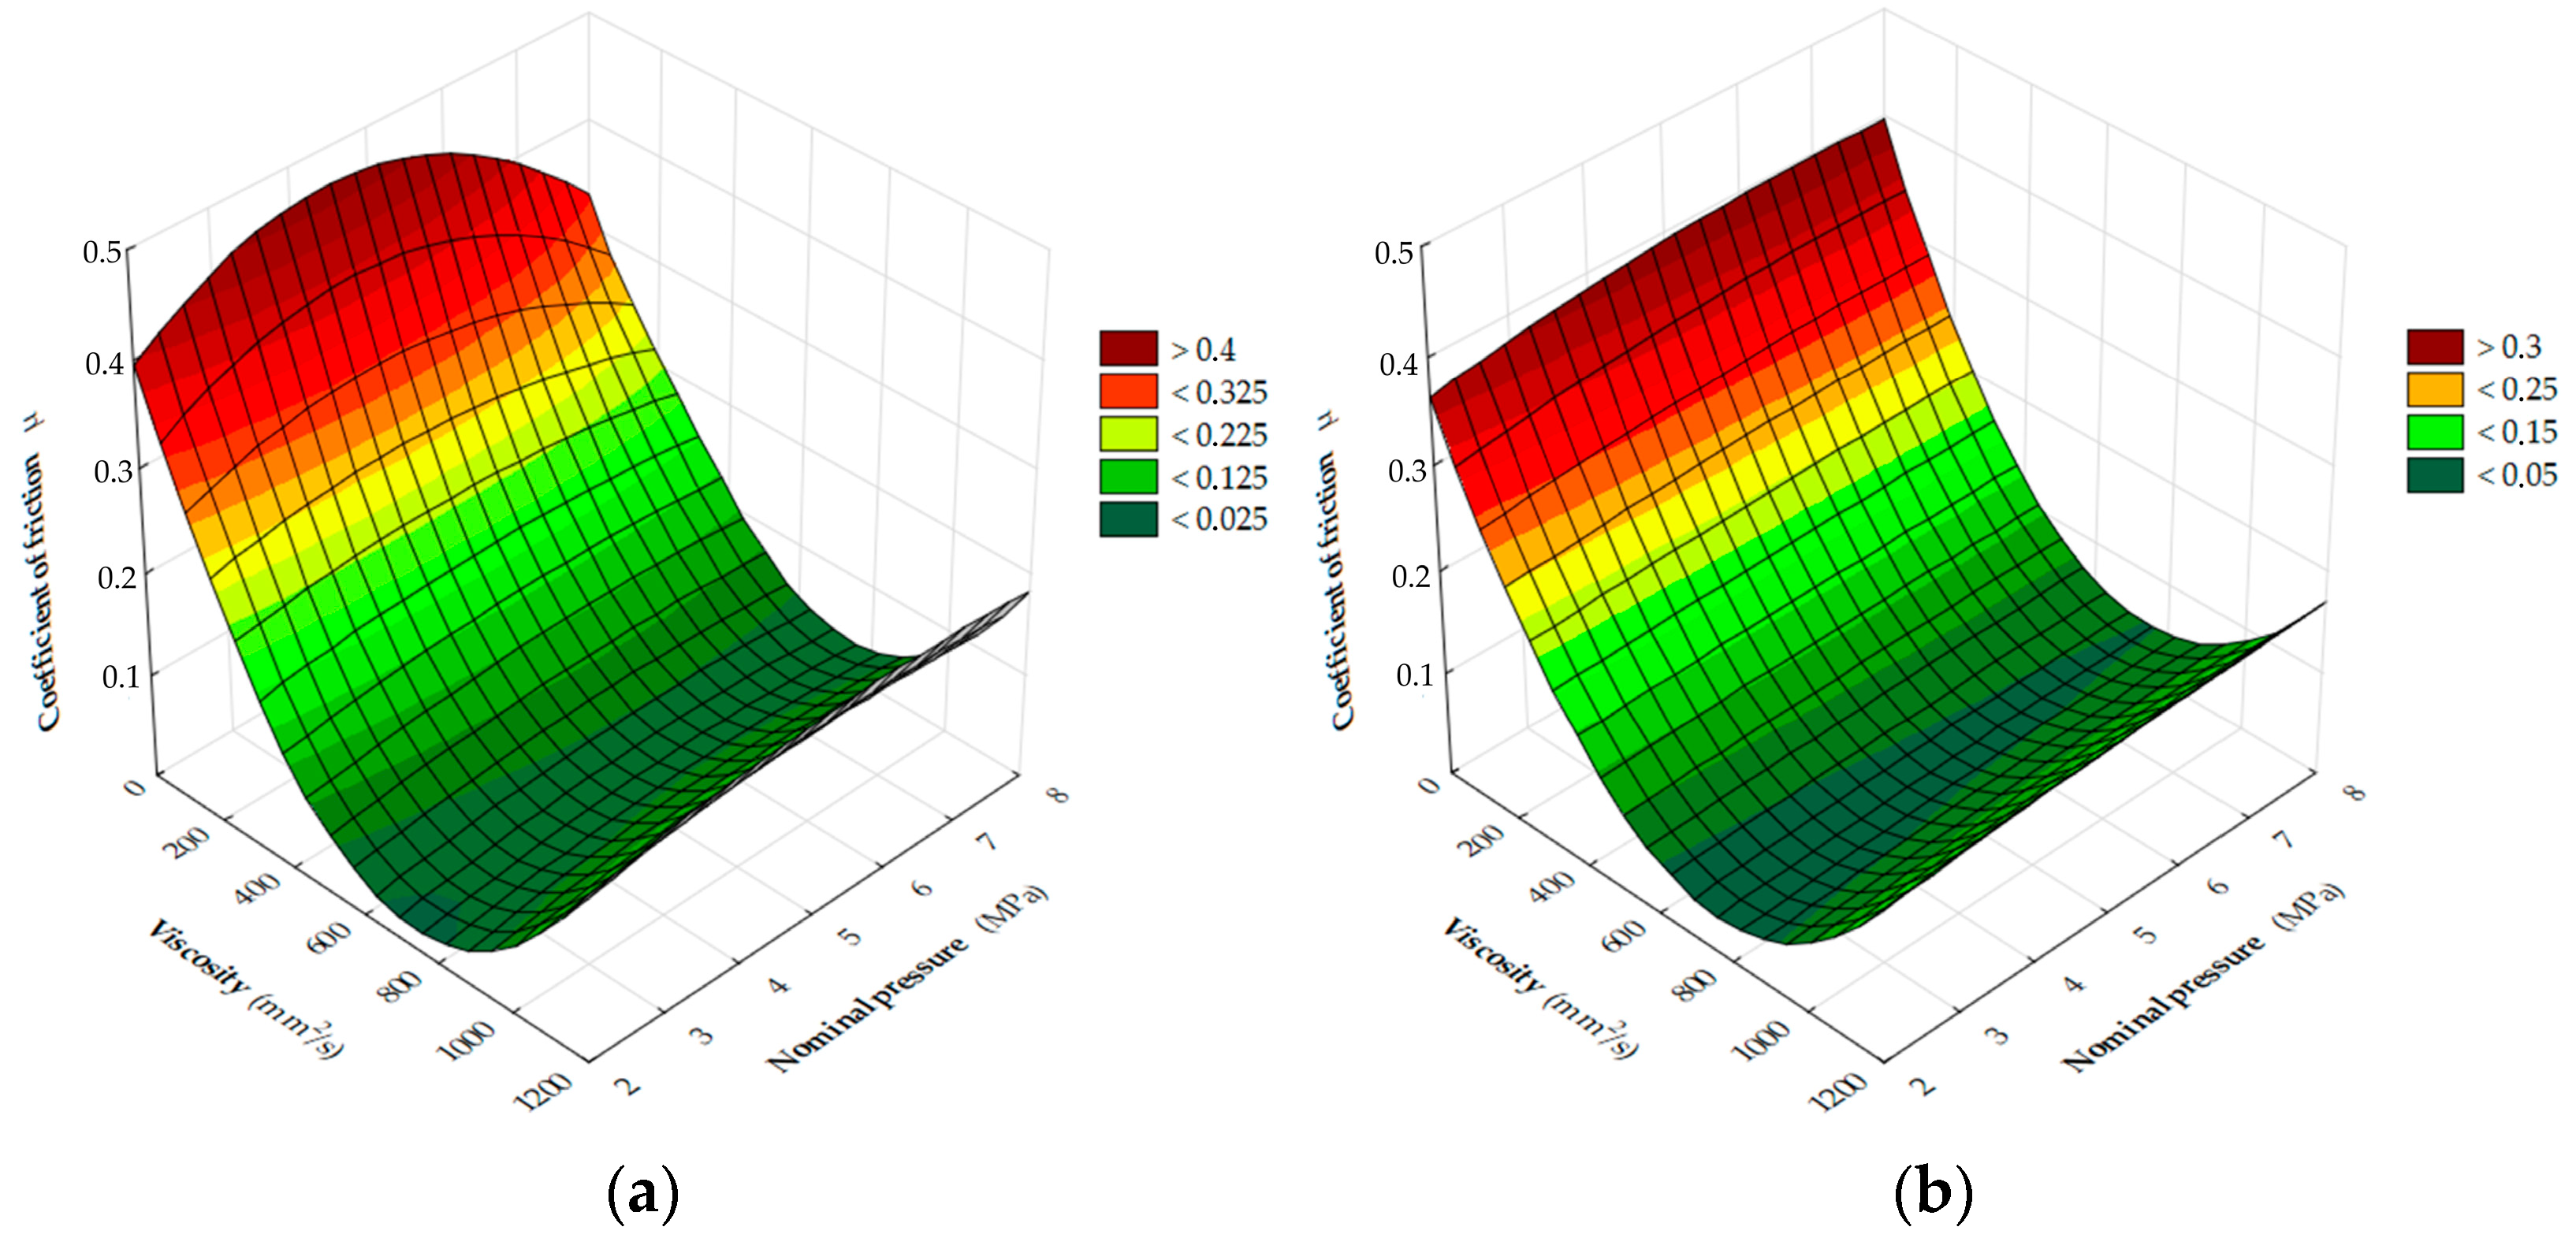
  • ANN response surfaces showed very good agreement with the experimental data, and the main experimental observations are also confirmed by the RBF ANN predictions.
The experimental results show that pressure-assisted lubrication in the blankholder area in sheet metal forming allows for a reduction of COF compared with conventional lubrication conditions. This confirms the correctness of the concept of the device for reducing friction in the flange area of the drawpiece. The use of channels in the construction of the die to supply lubricant to the zone of contact between the sheet metal and the surface of the stamping tool under the appropriate pressure, by reducing the value of the COF, will enable obtaining greater strains on the sheet metal without risk of fracture. Further research is required for the optimal arrangement of the supply channels and the selection of a lubricant with an appropriate viscosity and appropriate lubricant pressure for the specific conditions of forming various grades of sheet metal.
One of the basic limitations of neural networks is the possibility of predicting output parameters only in the range of input parameters used to train the RBF ANN. The second limitation of the neural network model is the strong relationship between the amount of training data and the quality of prediction. Therefore, it is planned to extend the variability range of input parameters and conduct more experiments for oils with different viscosities. In this paper, only four surface roughness parameters were considered, which, according to the literature, are the most representative in the analysis of the friction phenomenon in sheet metal forming. It is planned to check the correlation of the COF with other roughness parameters. The influence of pressure-assisted lubrication on the final surface roughness of the drawpieces also requires further research.

Author Contributions

Conceptualization, T.T., K.S. and M.S.; methodology, T.T., K.S. and M.S.; validation, T.T., K.S. and M.S.; investigation, T.T., K.S. and M.S.; data curation, T.T., K.S. and M.S.; writing—original draft preparation, K.S. and T.T.; writing—review and editing, T.T. All authors have read and agreed to the published version of the manuscript.

Funding

This research received no external funding.

Institutional Review Board Statement

Not applicable.

Informed Consent Statement

Not applicable.

Data Availability Statement

Data are contained within the article.

Conflicts of Interest

The authors declare no conflict of interest.

References

  1. Trzepieciński, T. Approaches for Preventing Tool Wear in Sheet Metal Forming Processes. Machines 2023, 11, 616. [Google Scholar] [CrossRef]
  2. Erbel, S.; Kuczyński, K.; Marciniak, Z. Obróbka Plastyczna; Państwowe Wydawnictwo Naukowe: Warszawa, Poland, 1975. [Google Scholar]
  3. Altan, T.; Tekkaya, A.E. Sheet Metal Forming Fundamentals; ASM International: Novelty, OH, USA, 2012. [Google Scholar]
  4. Brun, M.; Ghiotti, A.; Bruschi, S.; Filippi, S. Active control of blankholder in sheet metal stamping. Procedia CIRP 2021, 100, 151–156. [Google Scholar] [CrossRef]
  5. Manabe, K.-i.; Soeda, K.; Shibata, A. Effects of Variable Punch Speed and Blank Holder Force in Warm Superplastic Deep Drawing Process. Metals 2021, 11, 493. [Google Scholar] [CrossRef]
  6. Trzepieciński, T.; Najm, S.M. Application of Artificial Neural Networks to the Analysis of Friction Behaviour in a Drawbead Profile in Sheet Metal Forming. Materials 2022, 15, 9022. [Google Scholar] [CrossRef] [PubMed]
  7. Więckowski, W.; Dyja, K. The effect of the use of technological lubricants based on vegetable oils on the process of titanium sheet metal forming. Arch. Metall. Mater. 2017, 62, 489–494. [Google Scholar] [CrossRef]
  8. Adamus, J. Forming of the titanium implants and medical tools by metal working. Arch. Mater. Sci. Eng. 2007, 28, 313–316. [Google Scholar]
  9. Bay, N.; Olsson, D.D.; Andreasen, J.L. Lubricant test methods for sheet metal forming. Tribol. Int. 2008, 41, 844–853. [Google Scholar] [CrossRef]
  10. Corwin, A.D.; de Boer, M.P. Effect of adhesion on dynamic and static friction in surface micromachining. Appl. Phys. Lett. 2004, 84, 2451–2453. [Google Scholar] [CrossRef]
  11. Makhkamov, A. Determination of the Friction Coefficient in the Flat Strip Drawing Test. Engineering 2021, 13, 595–604. [Google Scholar] [CrossRef]
  12. Kirkhorn, L.; Bushlya, V.; Andersson, M.; Ståhl, J.E. The influence of tool steel microstructure on friction in sheet metal forming. Wear 2013, 302, 1268–1278. [Google Scholar] [CrossRef]
  13. Adamus, J.; Lackner, J.M.; Major, Ł. A study of the impact of anti-adhesive coatings on the sheet-titanium forming processes. Arch. Civ. Mech. Eng. 2013, 13, 64–71. [Google Scholar] [CrossRef]
  14. Waanders, D.; Marangalou, J.H.; Kott, M.; Gastebois, S.; Hol, J. Temperature Dependent Friction Modelling: The Influence of Temperature on Product Quality. Procedia Manuf. 2020, 47, 535–540. [Google Scholar] [CrossRef]
  15. Sigvant, M.; Pilthammar, J.; Hol, J.; Wiebenga, J.H.; Chezan, T.; Carleer, B.; van den Boogaard, T. Friction in sheet metal forming: Influence of surface roughness and strain rate on sheet metal forming simulation results. Procedia Manuf. 2019, 29, 512–519. [Google Scholar] [CrossRef]
  16. Behrens, B.-A.; Huebner, S.; Gnass, S.; Gaebel, C.M. Bewertung von Ziehund Schutzfolien für die Umformung von Organisch Bandbeschichteten Feinblechen; Verlag Meisenbach GmbH: Bamberg, Germany, 2017; Available online: https://www.umformtechnik.net/binary_data/3246315_2016-05-13-whitepaper.pdf (accessed on 15 November 2018).
  17. Trzepieciński, T.; Lemu, H.G. Recent developments and trends in the friction testing for conventional sheet metal forming and incremental sheet forming. Metals 2020, 10, 47. [Google Scholar] [CrossRef]
  18. Schell, L.; Groche, P. In Search of the Perfect Sheet Metal Forming Tribometer. In Forming the Future; Daehn, G., Cao, J., Kinsey, B., Tekkaya, E., Vivek, A., Yoshida, Y., Eds.; Springer International Publishing: Cham, Switzerland, 2021; pp. 81–96. [Google Scholar]
  19. Wagner, S. Tribologische Untersuchungen in der Blechumformung; Springer: Berlin/Heidelberg, Germany, 1997. [Google Scholar]
  20. Rakotomahefa, M. Fundamentals of Lubricated Friction in Deep Drawing of Zinc Coated Sheet Metal Considering Contacting Surface Morphology and Chemistry. Ph.D. Thesis, Karlsruher Instituts für Technologie, Karlsruhe, Germany, 30 January 2020. [Google Scholar]
  21. Więckowski, W.; Adamus, J.; Dyner, M. Sheet metal forming using environmentally benigh lubricant. Arch. Civ. Mech. Eng. 2020, 20, 51. [Google Scholar] [CrossRef]
  22. Schell, L.; Sellner, E.; Massold, M.; Groche, P. Tribology in Warm and Hot Aluminum Sheet Forming: Transferability of Strip Drawing Tests to Forming Trials. Adv. Eng. Mater. 2023, 25, 2201900. [Google Scholar] [CrossRef]
  23. Trzepieciński, T. Tribological Performance of Environmentally Friendly Bio-Degradable Lubricants Based on a Combination of Boric Acid and Bio-Based Oils. Materials 2020, 13, 3892. [Google Scholar] [CrossRef]
  24. Jewvattanarak, P.; Mahayotsanun, N.; Mahabunphachai, S.; Ngernbamrung, S.; Dohda, K. Tribological effects of chlorine-free lubricant in strip drawing of advanced high strength steel. Proc. Inst. Mech. Eng. Part J J. Eng. Tribol. 2016, 230, 974–982. [Google Scholar] [CrossRef]
  25. Masters, L.G.; Williams, D.K.; Roy, R. Friction behaviour in strip draw test of pre-stretched high strength automotive aluminium alloys. Int. J. Mach. Tools Manuf. 2013, 73, 17–24. [Google Scholar] [CrossRef]
  26. Trzepieciński, T.; Szewczyk, M.; Szwajka, K. The use of non-edible green oils to lubricate DC04 steel sheets in sheet metal forming process. Lubricants 2022, 10, 210. [Google Scholar] [CrossRef]
  27. Wu, Y.; Groche, P. Influence of Tool Finishing on the Wear Development in Strip Drawing Tests with High Strength Steels. Tribol. Online 2020, 15, 170–180. [Google Scholar] [CrossRef]
  28. Groche, P.; Wu, Y. Inline Observation of Tool Wear in Deep Drawing with Thermoelectric and Optical Measurements. CIRP Ann. 2019, 68, 567–570. [Google Scholar] [CrossRef]
  29. Zabala, A.; Galdos, L.; Childs, C.; Llavori, I.; Aginagalde, A.; Mendiguren, J.; Saenz de Argandoña, E. The Interaction between the Sheet/Tool Surface Texture and the Friction/Galling Behaviour on Aluminium Deep Drawing Operations. Metals 2021, 11, 979. [Google Scholar] [CrossRef]
  30. Ter Haar, R. Friction in Sheet Metal Forming, the Influence of (Local) Contact Conditions and Deformation. Ph.D. Thesis, Universiteit Twente, Enschede, The Netherlands, 17 May 1996. [Google Scholar]
  31. Guillon, O.; Roizard, X.; Belliard, P. Experimental methodology to study tribological aspects of deep drawing—Application to aluminium alloy sheets and tool coatings. Tribol. Int. 2001, 34, 757–766. [Google Scholar] [CrossRef]
  32. Payen, G.R.; Felder, E.; Repoux, M.; Mataigne, J.M. Influence of contact pressure and boundary films on the frictional behaviour and on the roughness changes of galvanized steel sheets. Wear 2012, 276–277, 48–52. [Google Scholar] [CrossRef]
  33. Prakash, V.; Kumar, D.R. Performance evaluation of bio-lubricants in strip drawing and deep drawing of an aluminium alloy. Adv. Mater. Process. Technol. 2022, 8, 1044–1057. [Google Scholar] [CrossRef]
  34. Sedlaček, M.; Podgornik, B.; Vižintin, J. Influence of surface preparation on roughness parameters, friction and wear. Wear 2009, 266, 482–487. [Google Scholar] [CrossRef]
  35. Sedlaček, M.; Vilhena, L.M.S.; Podgornik, B.; Vižintin, J. Surface topography modelling for reduced friction. Stroj. Vestn.-J. Mech. Eng. 2011, 57, 674–680. [Google Scholar] [CrossRef]
  36. Singh, R.; Melkote, S.N.; Hashimoto, F. Frictional response of precision finished surfaces in pure sliding. Wear 2005, 258, 1500–1509. [Google Scholar] [CrossRef]
  37. Dou, S.; Xia, J. Analysis of Sheet Metal Forming (Stamping Process): A Study of the Variable Friction Coefficient on 5052 Aluminum Alloy. Metals 2019, 9, 853. [Google Scholar] [CrossRef]
  38. Kirkhorn, L.; Frogner, K.; Andersson, M.; Ståhl, J.E. Improved Tribotesting for Sheet Metal Forming. Procedia CIRP 2012, 3, 507–512. [Google Scholar] [CrossRef]
  39. Vollertsen, F.; Hu, Z. Tribological Size Effects in Sheet Metal Forming Measured by a Strip Drawing Test. Ann. CIRP 2003, 55, 291–294. [Google Scholar] [CrossRef]
  40. Ercanlı, I.; Günlü, A.; Şenyurt, M.; Keleş, S. Artificial neural network models predicting the leaf area index: A case study in pure even-aged Crimean pine forests from Turkey. For. Ecosyst. 2018, 5, 29. [Google Scholar] [CrossRef]
Figure 1. (a) The surface roughness parameters and topography of the sheet metal, and (b) the Abbott–Firestone curve showing the distribution of the surface ordinates.
Applsci 13 09572 g001
Figure 2. The strip drawing tribotester: 1—base, 2, 3—bearing walls, 4—stiffening rib, 5—pilot bar, 6—bracket, 7, 8—countersamples, 9—specimen, 10—press bolt, 11—piezoelectric sensor, 12—pressure conduit, 13—joint, 14—holder of the testing machine.
Applsci 13 09572 g002
Figure 3. (a) experimental equipment and (b) experimental sample.
Applsci 13 09572 g003
Figure 4. Schematic of the strip drawing test.
Applsci 13 09572 g004
Figure 5. (a) The topography of the countersample surface, and (b) the Abbott–Firestone curve showing the distribution of the surface ordinates.
Applsci 13 09572 g005
Figure 6. (a) The distribution of data in two-dimensional space (different datasets are color-coded); (b) performance of the classification task by the MLP network; (c) performance of the classification task by the RBF network.
Applsci 13 09572 g006
Figure 7. Architecture of the RBF neural network.
Applsci 13 09572 g007
Figure 8. Block diagram of the selection and verification of the best RBF network structure. (SN—natural network).
Applsci 13 09572 g008
Figure 9. The effect of friction conditions on the COF for lubrication with (a) S100+ and (b) S300 oils.
Applsci 13 09572 g009
Figure 10. The effect of nominal pressure on the CLE for lubrication conditions with (a) S100+ and (b) S300 oils.
Applsci 13 09572 g010aApplsci 13 09572 g010b
Figure 11. The effect of oil viscosity and nominal pressure on the COF: (a) experimental data, (b) prediction of the COF by the RBF-8-9-1 network.
Applsci 13 09572 g011
Figure 12. The effect of oil viscosity and root mean square height Sq parameter on the COF: (a) experimental data, (b) prediction of the COF by the RBF-8-9-1 network.
Applsci 13 09572 g012
Figure 13. The effect of root mean square height Sq parameter and nominal pressure on the COF: (a) experimental data, (b) prediction of the COF by the RBF-8-9-1 network.
Applsci 13 09572 g013
Figure 14. Scatterplot of the actual and predicted COF for the 95% confidence interval.
Applsci 13 09572 g014
Figure 15. (a) Comparison of the actual and predicted values of the COF and (b) values of the MSE during the training process of the RBF-8-9-1-1 network.
Applsci 13 09572 g015aApplsci 13 09572 g015b
Table 1. Selected mechanical parameters of the test material.
Strength Coefficient K, MPa Strain Hardening Exponent nYield Stress Rp0.2, MPaUltimate Tensile Stress Rm, MPaElongation A50, %
561.40.242154.7310.925.3
Table 2. List of groups of input variables used in the selection of the network structure (an output variable was the COF): ● – variable included in the ANN.
ANN DenotationNominal Pressure pn
(MPa)
Oil Pressure po
(MPa)
Viscosity ηk
(mm2/s)
Sa
(μm)
Sq
(μm)
SkuSsk
ANN_1
ANN_2
ANN_3
ANN_4
Table 3. The range for each input and output parameter.
ParameterRange of Variability
pn (MPa)2–8
po (MPa)0.6–1.8
ηk (mm2/s)0–1135 *
Sa (μm)1.07–1.96
Sq (μm)1.33–2.42
Sku2.5–3.0
Ssk−0.0967–0.395
*—ηk = 0 is assumed for dry friction conditions (without lubrication).
Table 4. Statistics of the selected network for input data set ANN_1.
No.Architecture of RBF ANNQuality of Training Quality of TestingQuality of ValidationError for Training SetError for Testing SetError for Validation Set
1RBF-8-9-10.8716180.8037710.4389660.0008940.0038570.000901
2RBF-8-9-10.7835360.7718940.3352560.0014360.0043120.000897
3RBF-8-8-10.5530450.6016450.7533730.0025820.0074710.000725
4RBF-8-8-10.5963460.9031780.3322780.0024050.0060460.000817
5RBF-8-8-10.9377740.9860120.4879980.0004480.0005070.000147
Table 5. Statistics of the selected network for input data set ANN_2.
No.Architecture of RBF ANNQuality of Training Quality of TestingQuality of ValidationError for Training SetError for Testing SetError for Validation Set
1RBF-8-9-10.9780360.9897370.0891840.0001620.0002920.000204
2RBF-8-8-10.9123760.8987320.5197520.0006230.0019360.000446
3RBF-8-8-10.6224640.7044870.7741650.0022780.0067280.000407
4RBF-8-7-10.3074660.7725680.4548930.0033670.0091360.000272
5RBF-8-8-10.7195410.9078280.5183410.0017940.0046510.001069
Table 6. Statistics of the selected network for input data set ANN_3.
No.Architecture of RBF ANNQuality of Training Quality of TestingQuality of ValidationError for Training SetError for Testing SetError for Validation Set
1RBF-8-7-10.7478770.6970860.7966680.0016390.0056280.000335
2RBF-8-9-10.8098540.8666480.6356500.0012800.0037430.000738
3RBF-8-8-10.3973960.1886420.6708460.0031320.0096170.000299
4RBF-8-7-10.8472350.9876710.8892000.0010500.0016700.000087
5RBF-8-8-10.9655710.9808610.5210250.0002520.0004350.000256
Table 7. Statistics of the selected network for input data set ANN_4.
No.Architecture of RBF ANNQuality of Training Quality of TestingQuality of ValidationError for Training SetError for Testing SetError for Validation Set
1RBF-8-8-10.8945870.9745330.6279750.0007430.0021120.000280
2RBF-8-9-10.9343420.9741270.3231850.0004720.0007780.000374
3RBF-8-8-10.8742480.9878260.7825660.0008780.0032500.000074
4RBF-8-8-10.9252340.9822050.5790150.0005350.0012830.000071
5RBF-8-7-10.5919740.7101010.3469760.0024160.0067940.000429
Table 8. Summary of the best networks for COF prediction.
No.Architecture of RBF ANNInput Data SetQuality of TrainingQuality of TestingQuality of ValidationMSE for Training SetMSE for Testing SetMSE for Validation Set
1RBF-8-8-1ANN_10.9377740.9860120.4879980.0004480.0005070.000147
2RBF-8-9-1ANN_20.9780360.9897370.0891840.0001620.0002920.000204
3RBF-8-8-1ANN_30.9655710.9808610.5210250.0002520.0004350.000256
4RBF-8-8-1ANN_40.9252340.9822050.5790150.0005350.0012830.000071
Disclaimer/Publisher’s Note: The statements, opinions and data contained in all publications are solely those of the individual author(s) and contributor(s) and not of MDPI and/or the editor(s). MDPI and/or the editor(s) disclaim responsibility for any injury to people or property resulting from any ideas, methods, instructions or products referred to in the content.

