Article

Nitrogen and Phosphorus Discharge Loads Assessment Using the SWAT Model: A Case Study of the Shatt Al-Arab River Basin

Faculty of Geography, Philipps-University of Marburg, Deutschhausstr. 10, 35037 Marburg, Germany
*
Author to whom correspondence should be addressed.
Appl. Sci. 2023, 13(14), 8376; https://doi.org/10.3390/app13148376
Submission received: 16 May 2023 / Revised: 10 July 2023 / Accepted: 19 July 2023 / Published: 20 July 2023

Abstract

:
Understanding the link between land use/land cover (LULC) patterns and water quality can establish guidelines for non-point source pollution management and sustainable development. The transboundary Shatt Al-Arab river basin (Iraq-Iran) suffers from nutrient pollution problems. This study aimed to estimate flow volume, nitrogen, and phosphorus pollution in this basin and how such pollution relates to LULC and flow volume using the Soil and Water Assessment Tool (SWAT) model. The data used in the SWAT model were the Digital Elevation Model (DEM), slope, parent materials of soil, LULC, and weather data (i.e., precipitation, relative humidity, temperature, solar radiation, and wind speed). The results showed that from 2004 to 2021, the annual Total Nitrogen (TN) and Total Phosphorus (TP) outputs were 618 and 140 kg km−2, respectively. The TN discharge load ranged from 27 to 6500 kg km−2 yr−1, while the TP discharge load ranged from 1 to 1600 kg km−2 yr−1. Redundancy Analysis (RDA) revealed that cropland and urban cover ratios were positively correlated with the annual TN and TP discharge loads. On the contrary, shrubland and bare land ratios were negatively correlated with the annual TN and TP discharge loads. Results showed that flow volume is positively correlated with precipitation. Both annual TN and TP discharge loads exhibited a positive correlation with flow volume and a negative correlation with subbasin area. The highest annual TN and TP discharge loads were in the middle parts of the basin, where the cultivated land and construction land are concentrated and the flow volume is high. Thus, findings suggest that the basin is sensitive to shifts in flow volume associated with global climate change and to shifts in LULC change. No study for nutrient discharge load assessment for the entire Shatt Al-Arab river basin has been performed before. Hence, the novel contribution of this study will guide the hydrologists and water resource planners in the basin to establish effective water policies, climate change mitigation strategies, and environmental change adaptation strategies.

1. Introduction

The Shatt Al-Arab river, the primary freshwater source in a relatively arid region [1], delivers lifeline advantages for millions of people in its basin [2]. The river’s basin encompasses the major oil and gas fields in Iraq and Iran. The oil industry is the main artery for the federal budget in these two countries. The river provides water for domestic, industrial, agricultural, transportation, natural ecosystems, and recreational purposes [3]. Moreover, the river is the main freshwater source for the gulf and is essential to maintaining the marine ecosystems along the gulf’s northeastern coasts [4,5]. However, the oil industry, which has grown sharply in the last two decades, accompanied by population growth, has resulted in rigorous environmental impairment that not only threatened the environment but also made it impossible to maintain the consequent economic growth [3,6]. Industrial and residential waste represent major sources of pollution in the basin. Furthermore, agricultural practices are another source of contamination in the basin [7,8]. Usually dumped into the river, contaminated water has several long-term effects on the environment and human health [9].
When excessive nutrients, primarily nitrogen and phosphorus, enter water bodies, they promote excessive algae growth, known as eutrophication [10]. Cultivation significantly affects the stream’s nutrient concentrations [11]. N and P concentrations in cultivated land are generally high due to fertilization and agricultural management practices such as tillage and irrigation, which promote eutrophication of the water [12,13]. Urbanization is commonly linked to alterations in the physical and hydrogeological properties of basins as well as the formation of new nutrient sources. Sewage discharge, garden fertilizers, and domestic animal wastes in urbanized areas are all associated with high N and P loading and, as a result, water eutrophication [14,15,16]. Eutrophication has been attributed to increased blooms of algal organisms, water turbidity, oxygen depletion, the prevalence of certain species, and biodiversity loss [17,18]. For example, oxygen deficiency can mobilize elements such as heavy metals previously precipitated or bound to sediments [19]. Such metals adversely affect ecosystem health and water quality, e.g., [9,20,21].
Maintaining clean water is vital for habitat preservation, agricultural yield, and public health. Several research works on the evaluation of pollution status in the Shatt Al-Arab river have provided good knowledge of river pollution in terms of sources, processes, and management techniques [22,23,24,25]. For instance, Al-Yamani et al. [5] concluded that Shatt Al-Arab’s coastal pollution from upstream urban, industrial, and agricultural expansions has the potential to create considerable ecological and socioeconomic implications. Alhello et al. [26] collected 14 samples along the middle part of the Shatt Al-Arab river, starting from Shilha town to Abu Al-Khasib city, and reported high N and P loads. Likewise, Hassan [27] collected water samples monthly from October 2011 to October 2012 from five locations along the Shatt Al-Arab main course. The author detected N and P in high concentrations, demonstrating organic pollution in the river. Similarly, Al-Asadi et al. [28] reported N and P contamination in the river and attributed it to agriculture runoff and untreated sewage disposal. Ofogh et al. [29] collected 210 samples from 53 locations quarterly during 2018–2019 along the Karun river and its branches. They reported N and P concentration ranges of 6.79 to 10.91 and 0.49 to 1.78 mg L−1, respectively. Such concentrations exceed the acceptable levels set by the EPA (2–6 and 0.1 mg L−1 for N and P, respectively) [29,30]. These studies, however, were restricted to a certain reach of the river. Thus, it is essential to comprehensively identify the spatial distribution features of the nutrient contamination in the entire Shatt Al-Arab basin. While field monitoring data are required to simulate N and P pollution in the whole basin, limited transboundary monitoring due to high data collection costs and a lack of desire, interest, and clarity in information sharing seriously constrain such environmental assessments. Additionally, prior research has mostly concentrated on evaluating water quality indicators at sample locations to reflect the broader water environment. However, this does not fully capture the extent of contamination in the entire basin. In order to model surface-source pollution, hydrological models might be a feasible alternative strategy [31]. The Soil and Water Assessment Tool (SWAT), a basin-scale ecohydrological model, was created by the USDA in Tamburlaine, Texas, and the Texas A&M University Research Office [32]. A number of factors with physical and semi-empirical characteristics are included in the SWAT model, which is a chemical, physical, and continuous-time dynamical model. By entering different spatial and attribute data, such as weather data, the Digital Elevation Model (DEM), soil, and LULC data, this model can simulate a watershed’s hydrological cycle and nutrient loads [33]. It is possible to create the SWAT model without data using parameter transplanting factor transfer [34,35]. The model has been used in numerous studies around the world. However, such studies are limited in Iraq, especially in the Shatt Al-Arab basin.
Since the 1970s, the impact of LULC type on water quality has been a source of concern [36]. Previous research has demonstrated that LULC change driven by anthropogenic activities is the primary cause of declining water quality [37,38]. By altering the qualities of the underlying surface and soil composition, improper LULC alteration affects the hydrological processes of a watershed [39,40]. It may impact the watershed’s runoff formation process, which may then have an effect on the movement and transformation of non-point source pollutants, particularly N and P [41,42]. Some LULC types might enhance nutrient loading and decrease nutrient retention, causing eutrophication and hypoxia in the environment [37,43]. Other research has shown that regulating LULC artificially or modifying LULC practices can reduce non-point source pollution and effectively promote ecological functions [44]. For instance, Ockenden et al. [45] concluded that land cover changes, such as a reduction in agricultural land cover, could reduce nutrient loading. Moreover, agricultural practice modifications such as controlled-release fertilization can ensure that significantly higher levels of nutrients reach the crops, leading to higher yields with less fertilizer usage [46]. In addition to the effects of LULC change on nutrient discharge loads, climate change can also have an influence on river chemistry and nutrient discharge loads [47,48]. The catchment hydrology (such as precipitation-runoff response), microbial processes (such as denitrification), and, accordingly, nutrient sourcing and retention will likely vary as a result of climate change and shifting precipitation patterns [49].
As SWAT was successfully used to simulate LULC impacts on flow volume, sediment, and nutrient loads [50,51], this study used this model to simulate the N and P pollution in the entire Shatt Al-Arab basin to explore the effect of LULC and flow volume on water quality. The stability of the local societies in this basin and their quality of life depend greatly on maintaining good water quality. Thus, investigating how LULC patterns and water quality are related can help with LULC management, water contamination control, and assisting the government to safeguard the water resources in this basin and other basins. This study’s major goals are:
(1)
Observe LULC and landscape patterns in the Shatt Al-Arab river basin;
(2)
Assess water quality and simulate N and P contamination;
(3)
Investigate the correlations between N and P discharge loads, LULC, and flow volume.
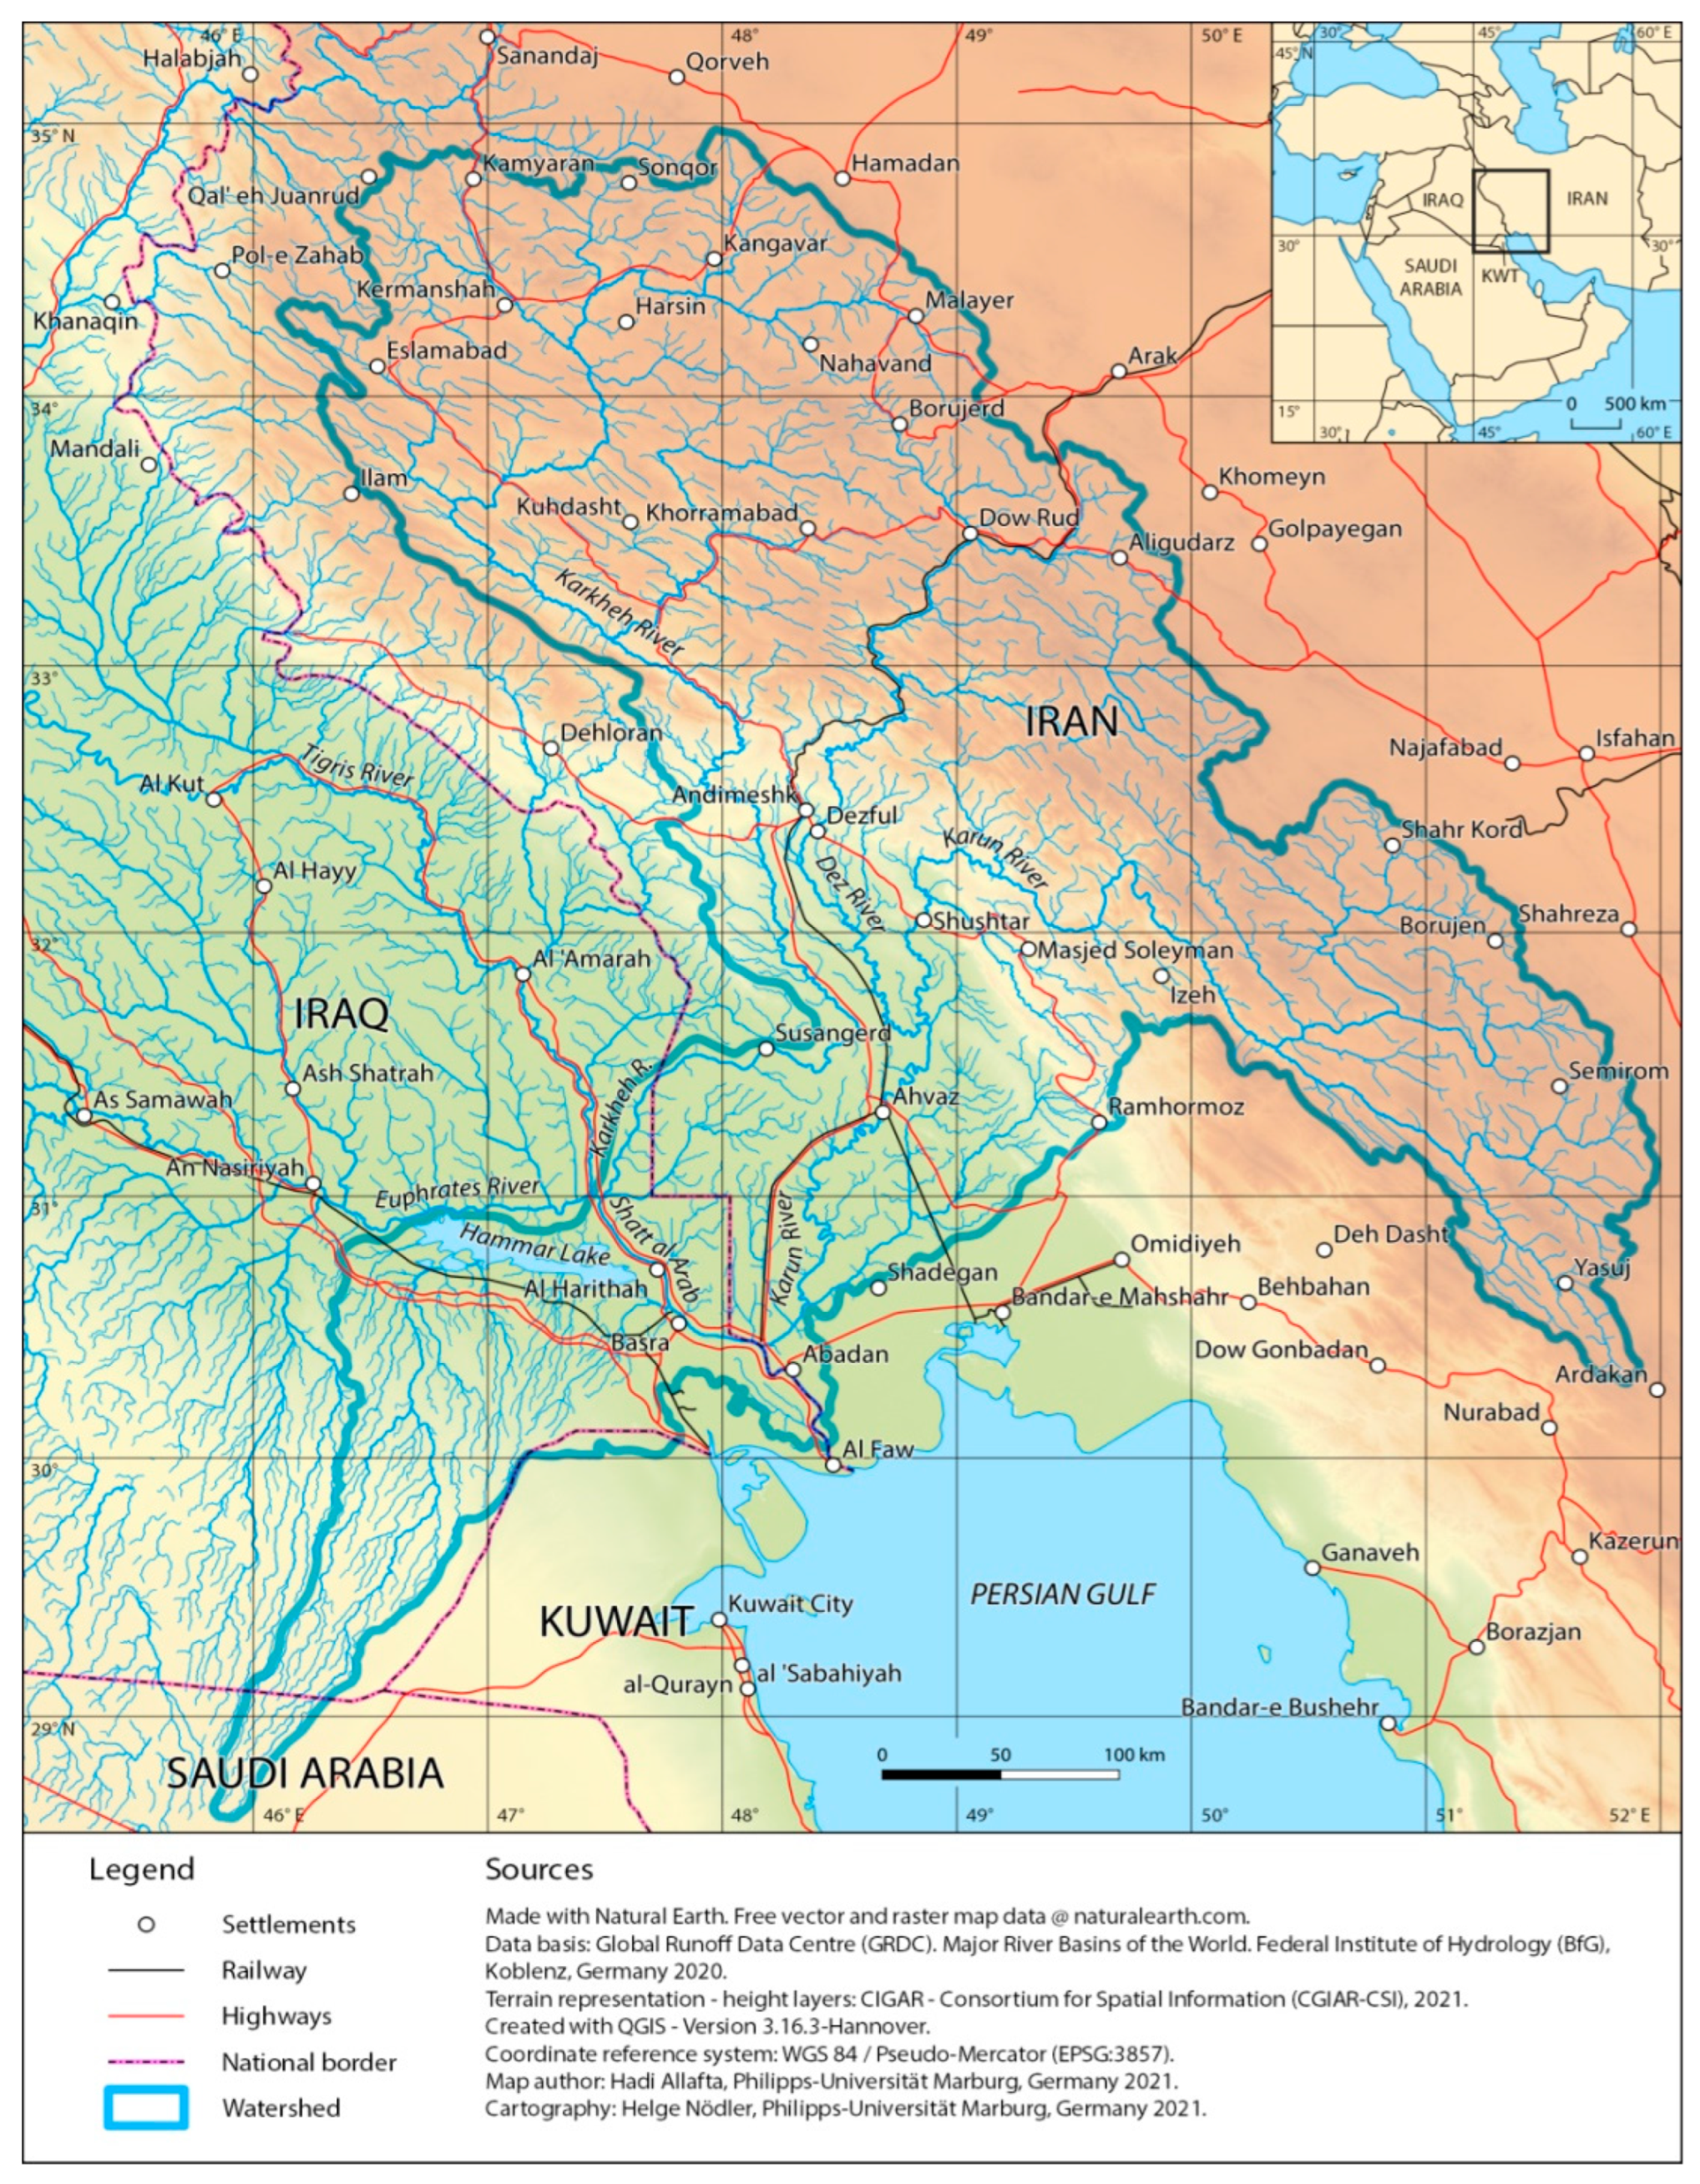
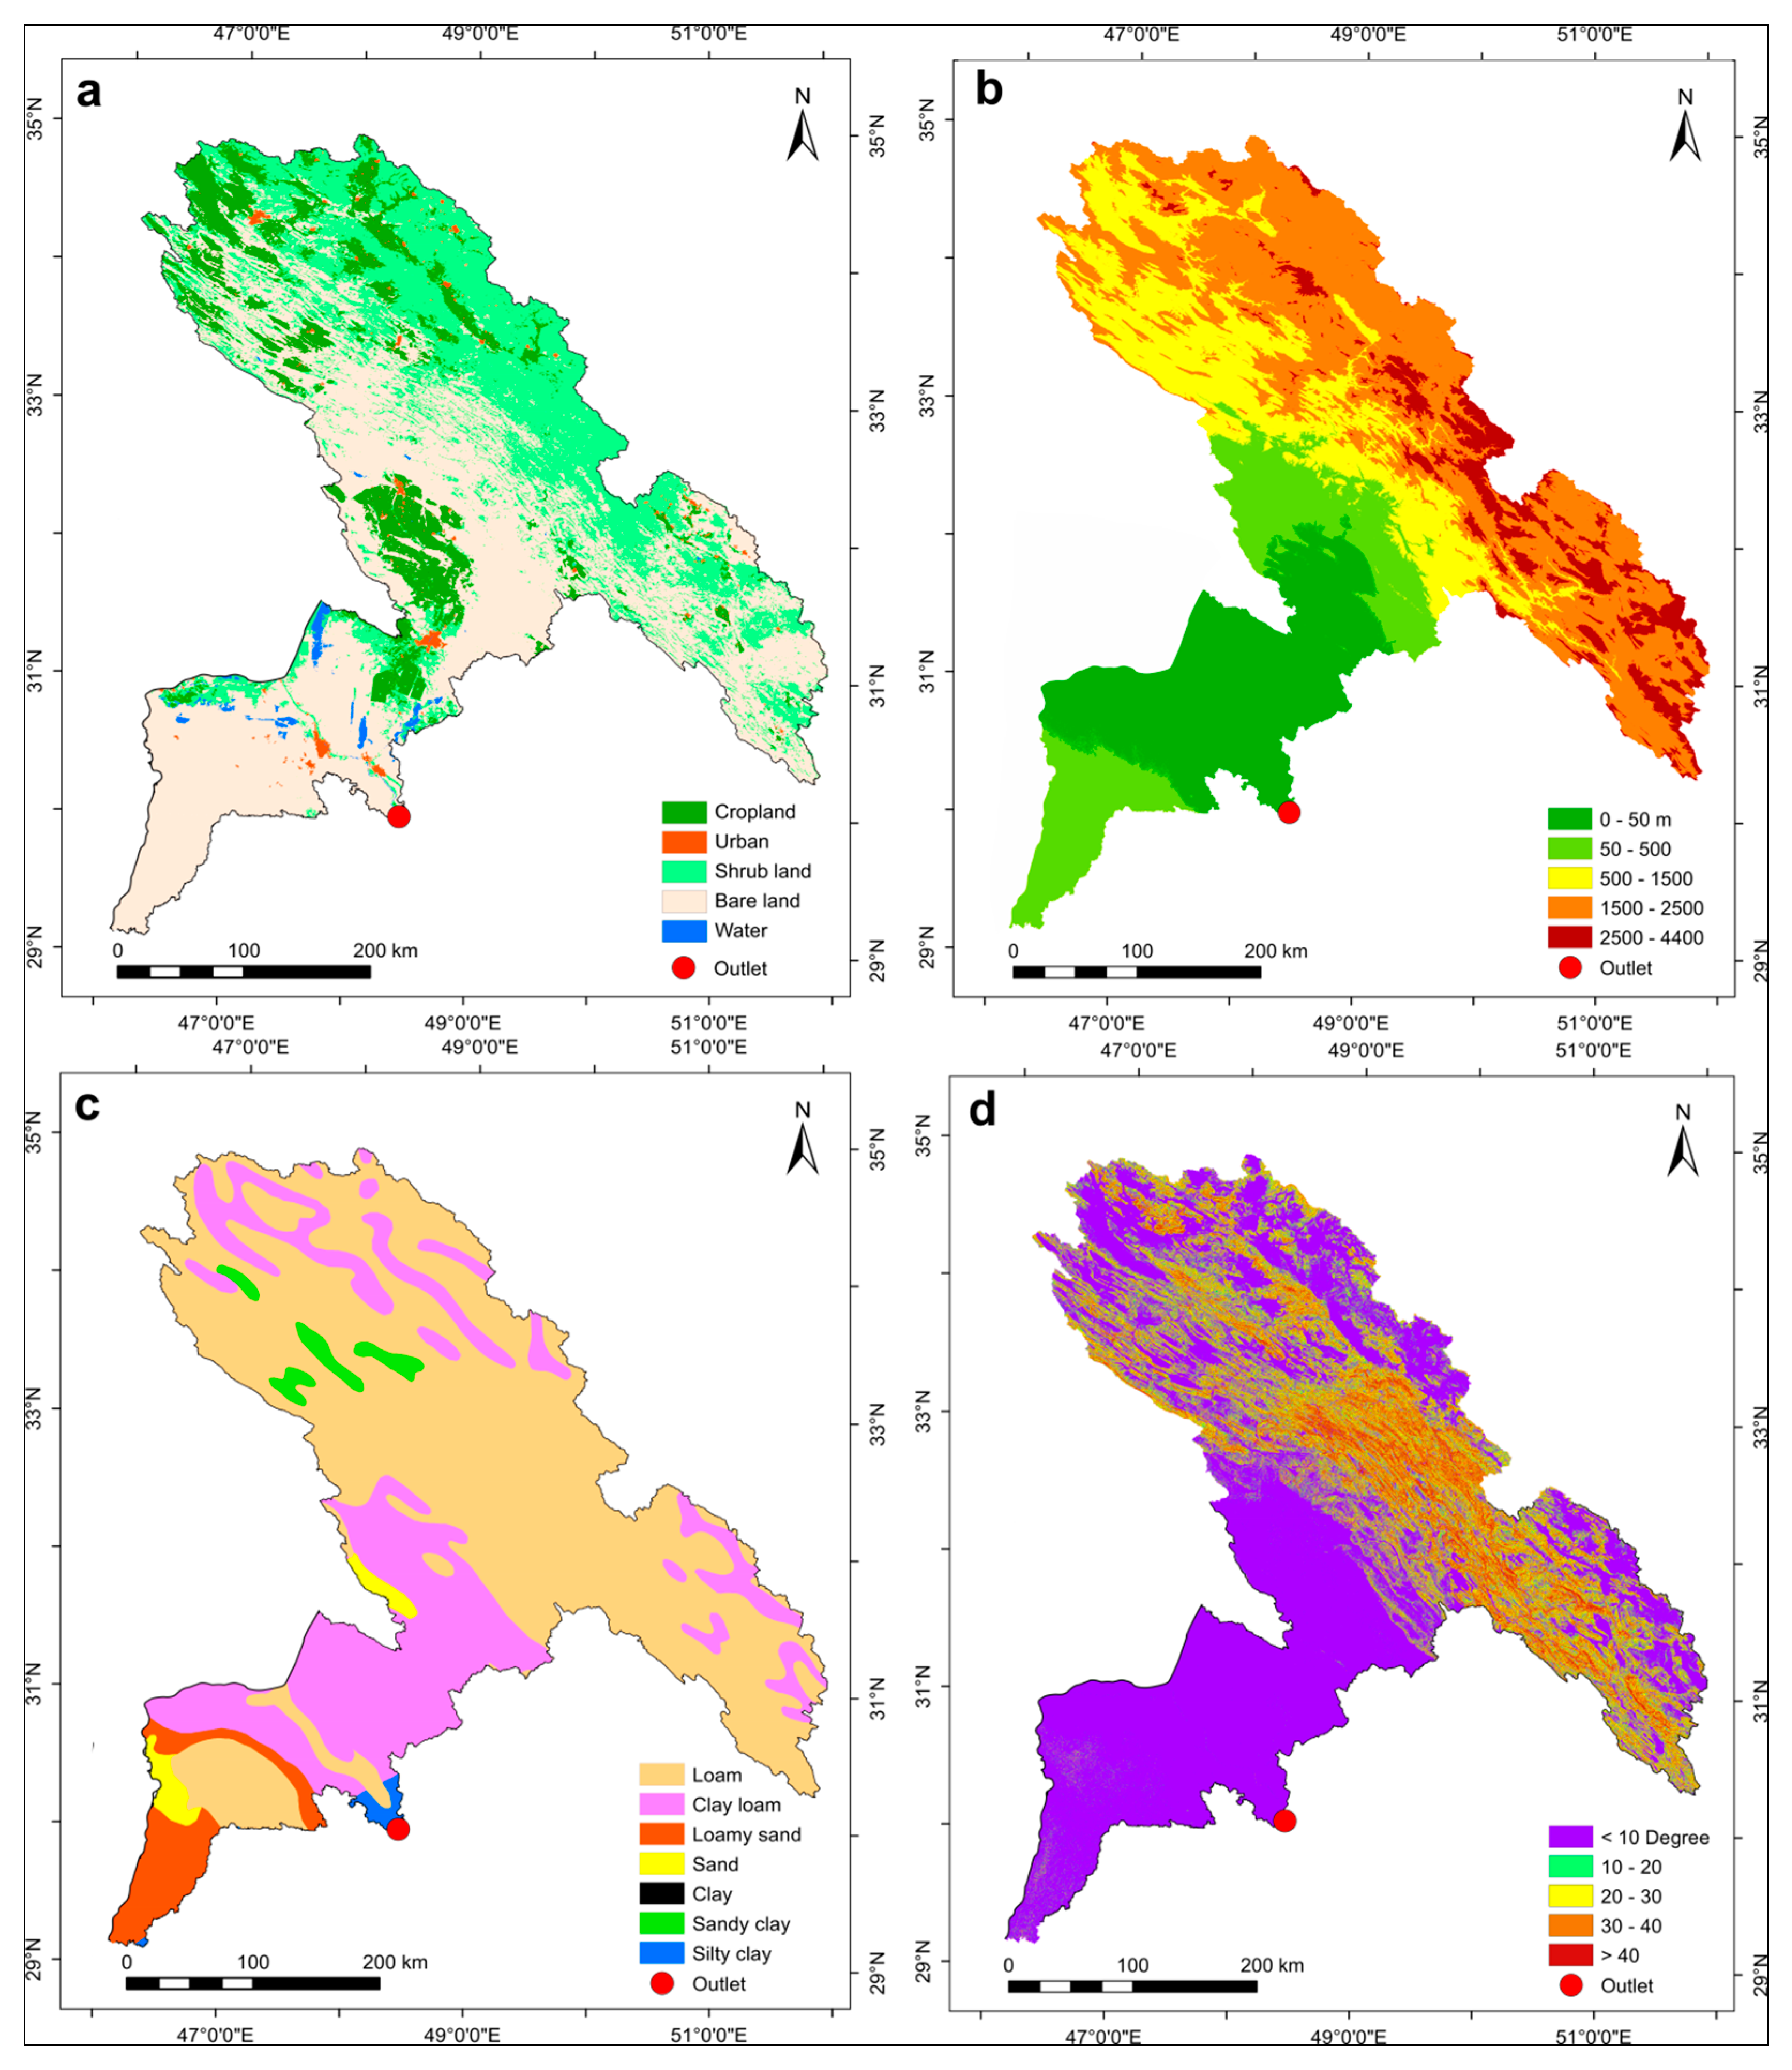
2. Study Site

The confluence of the Euphrates and Tigris rivers at Qurna town, southern Iraq, forms the Shatt Al-Arab river. Additionally, the Karkheh and the Karun rivers, originating from the Zagros mountains in Iran, flow into the Shatt Al-Arab river (Figure 1). The river extends around 200 km before it pours into the gulf [7,52]. The river has a width ranging from 300 m at its origin to 800 m at its mouth [53] and a depth between 8 and 15 m, considering tides [54]. An area of around 143,000 km2 drains directly into the river basin downstream of the confluence of the Euphrates and Tigris rivers [55]. The river’s annual discharge is approximately 75 billion cubic meters (BCM) as follows: 25.8 BCM from the Tigris river, 17.6 BCM from the Euphrates river, 24.6 BCM from the Karun river, and 5.8 BCM from the Karkheh river [53]. The Shatt Al-Arab basin is situated within the Mesopotamian Plain Zone and the Zagros Structural Zone. The Mesopotamian Plain, which belongs to the quaternary period, is divided into Pleistocene and Holocene sediments of more than 100 m thickness. The Pleistocene deposits consist primarily of fine-sized sand, silt, and clay [56]. Vertical lithological and facial variations are frequent in these fluvial deposits. These deposits originate from the Tigris and Euphrates floodplain systems. The upper contact with the Holocene deposits is represented by yellowish-brown clay or silty clay. The Holocene deposits consist mainly of fluviatile, Sabkhas, lacustrine, and marine deposits [57]. The river’s basin features a continental climate ranging from subtropical dry and hot summers to rainy and cold winters. In summer, the average temperature is around 45 °C in the daytime and around 30 °C at night. Winter temperatures range between 17 and 2 °C during the daytime and nighttime, respectively. The annual precipitation range is from 100 to 500 mm [58]. The basin’s population is approximately 12 million, and the annual population growth rate is around 2.5%.

3. Materials and Methods

The data used in the SWAT model were in two different modes: spatial and temporal. The spatial data included DEM, slope, parent material of soil, and LULC (Figure 2). The temporal data consisted of weather data (precipitation, relative humidity, temperature, solar radiation, and wind speed) (Table 1). We extracted the DEM data from EARTHDATA Search [60]. Images with a resolution of 30 m were downloaded from ASTER-DEM. These images were imported to ArcGIS and mosaicked using “Mosaic to New Raster”, which is a tool in “Data Management Tools”. The combined map was re-projected after determining the Universal Transverse Mercator (UTM) zone. Next, we used “DEM Manipulation” which is a tool under “Terrain Processing” which is in turn an option under “Arc Hydro Tools” > “Fill Sinks”. To obtain the flow accumulation, “Flow Direction” and “Flow Accumulation” were selected from “Terrain Processing”. The basin’s slope was obtained using “Spatial Analyst Tools” > “Surface” > “Slope”. We extracted the basin’s soil map from the Food and Agriculture Organization (FAO) [61]. Next, soil classes were accessed from the SWAT Soil Data [62]. Furthermore, we exported the soil map to ArcGIS 10.4.1 and georeferenced it into the associated UTM coordinate system. The soil map is geocoded for each parent material of the soil (here: soil type) according to the types retrieved from the SWAT Soil Data. LULC data were extracted from the Earth Explorer’s land cover data [63]. We selected “Land Cloud Cover” and “Scene Cloud Cover” of less than 10% to acquire images with minimal or no cloud cover. The ERDAS IMAGINE 2014 was utilized to analyze and improve the acquired images. We used ERDAS IMAGINE supervised classification to classify the LULC categories. Through the supervised classification process, polygons are selected, digitalized, and then placed in an “Area of Interest” layer to produce signature files. Numerous polygons for a certain LULC class were made to give this LULC a distinct class. The supervised classification approach is generally more accurate, although it is time-consuming and laborious compared to the unsupervised method [64]. LULC data were also made in the UTM zone (Figure 2). Furthermore, we extracted weather data (precipitation, relative humidity, temperature, solar radiation, and wind speed) from POWER‘s Data Access Viewer [65].
ArcSWAT in ArcGIS was enabled, and data were added. To obtain the subbasins in the Shatt Al-Arab basin, we selected Add DEM > Watershed Delineation > Create Streams and Outlets. The subbasins were numbered from the upper parts of the Shatt Al-Arab river to the outlet of the basin. Next, slope, soil, and LULC were set using the Hydrological Response Unit (HRU) Analysis tool. The HRU Analysis tool was used to define slope, soil, and LULC resolution (i.e., the number of classes in a unit area). HRU consists of distinct features of the slope, soil, and land use. Within a watershed, geographical variability in terms of slope, soil, and land use class is described using HRUs. For each HRU unit, the model calculates pertinent hydrologic components such as surface runoff, peak runoff, groundwater flow, evapotranspiration, and sediment yield [66,67]. We selected slope class percentage (%) over a slope area of 15%, soil class percentage (%) over a soil area of 15%, and LULC percentage (%) over a subbasin area of 12%. Similarly, weather data were also set by selecting Write Input Tables > Weather Stations > WGEN_CFSR_World. Then we looked at precipitation, relative humidity, temperature, solar radiation, and wind speed. Tables for such data were created, and SWAT data were updated. ArcSWAT divided the basin into multiple subbasins based on the DEM raster and drainage pattern. In the ArcSWAT window, we selected the commands “Watershed Delineator” > “Automatic Watershed Delineation”. For stream definition, we selected “DEM-Based”, and then pressed “Flow direction and accumulation”. ArcSWAT has a threshold for the area required to define the beginning of a stream and therefore the area of the corresponding subbasin. In this study, ArcSWAT automatically selected a threshold area of 320,781 hectares.
The SWAT model applies the water balance equation to simulate the hydrologic cycle:
SW t   i = SW 0   i + i = 1 t ( R day   i     Q surf   i E a   i W seep   i Q gw   i )
where SWt i, SW0 i, t, Rday i, Qsurf i, Ea i, Wseep i, and Qgw i represent final soil water content on day i (mm), initial soil water content on day i (mm), time (days), precipitation on day i (mm), surface runoff on day i (mm), evapotranspiration on day i (mm), water entering the vadose zone from the soil profile on day i (mm), and return flow on day i (mm), respectively. In the current study, we applied the Soil Conservation Service (SCS) curve number method in the SWAT model to calculate Qsurf i:
Q surf = ( R day I a ) 2 ( R day I a + S )
where S and Ia represent retention parameters (mm) and initial abstraction (mm), respectively.
S = 25.4   ( 100 CN 10 )
where CN represents the Curve Number. The CN is attained from tables with correlations with soil type, soil moisture, and land cover. ArcSWAT uses the Penman-Monteith equation to calculate evapotranspiration, which takes into account various factors such as solar radiation, air temperature, wind speed, and relative humidity. Moreover, ArcSWAT applies the Green Ampt equation to calculate infiltration.

4. Results

4.1. SWAT Parameters

21 parameters have been included in the calibration process (Table 2). The most sensitive parameters are the Curve Number (CN2), Soil Evaporation Compensation (ESCO), Groundwater Evaporation (GW_REEVAP), Available Water Capacity of the Soil Layer (SOL.AWC), and average slope of the main channel along the channel length (CH_S2).

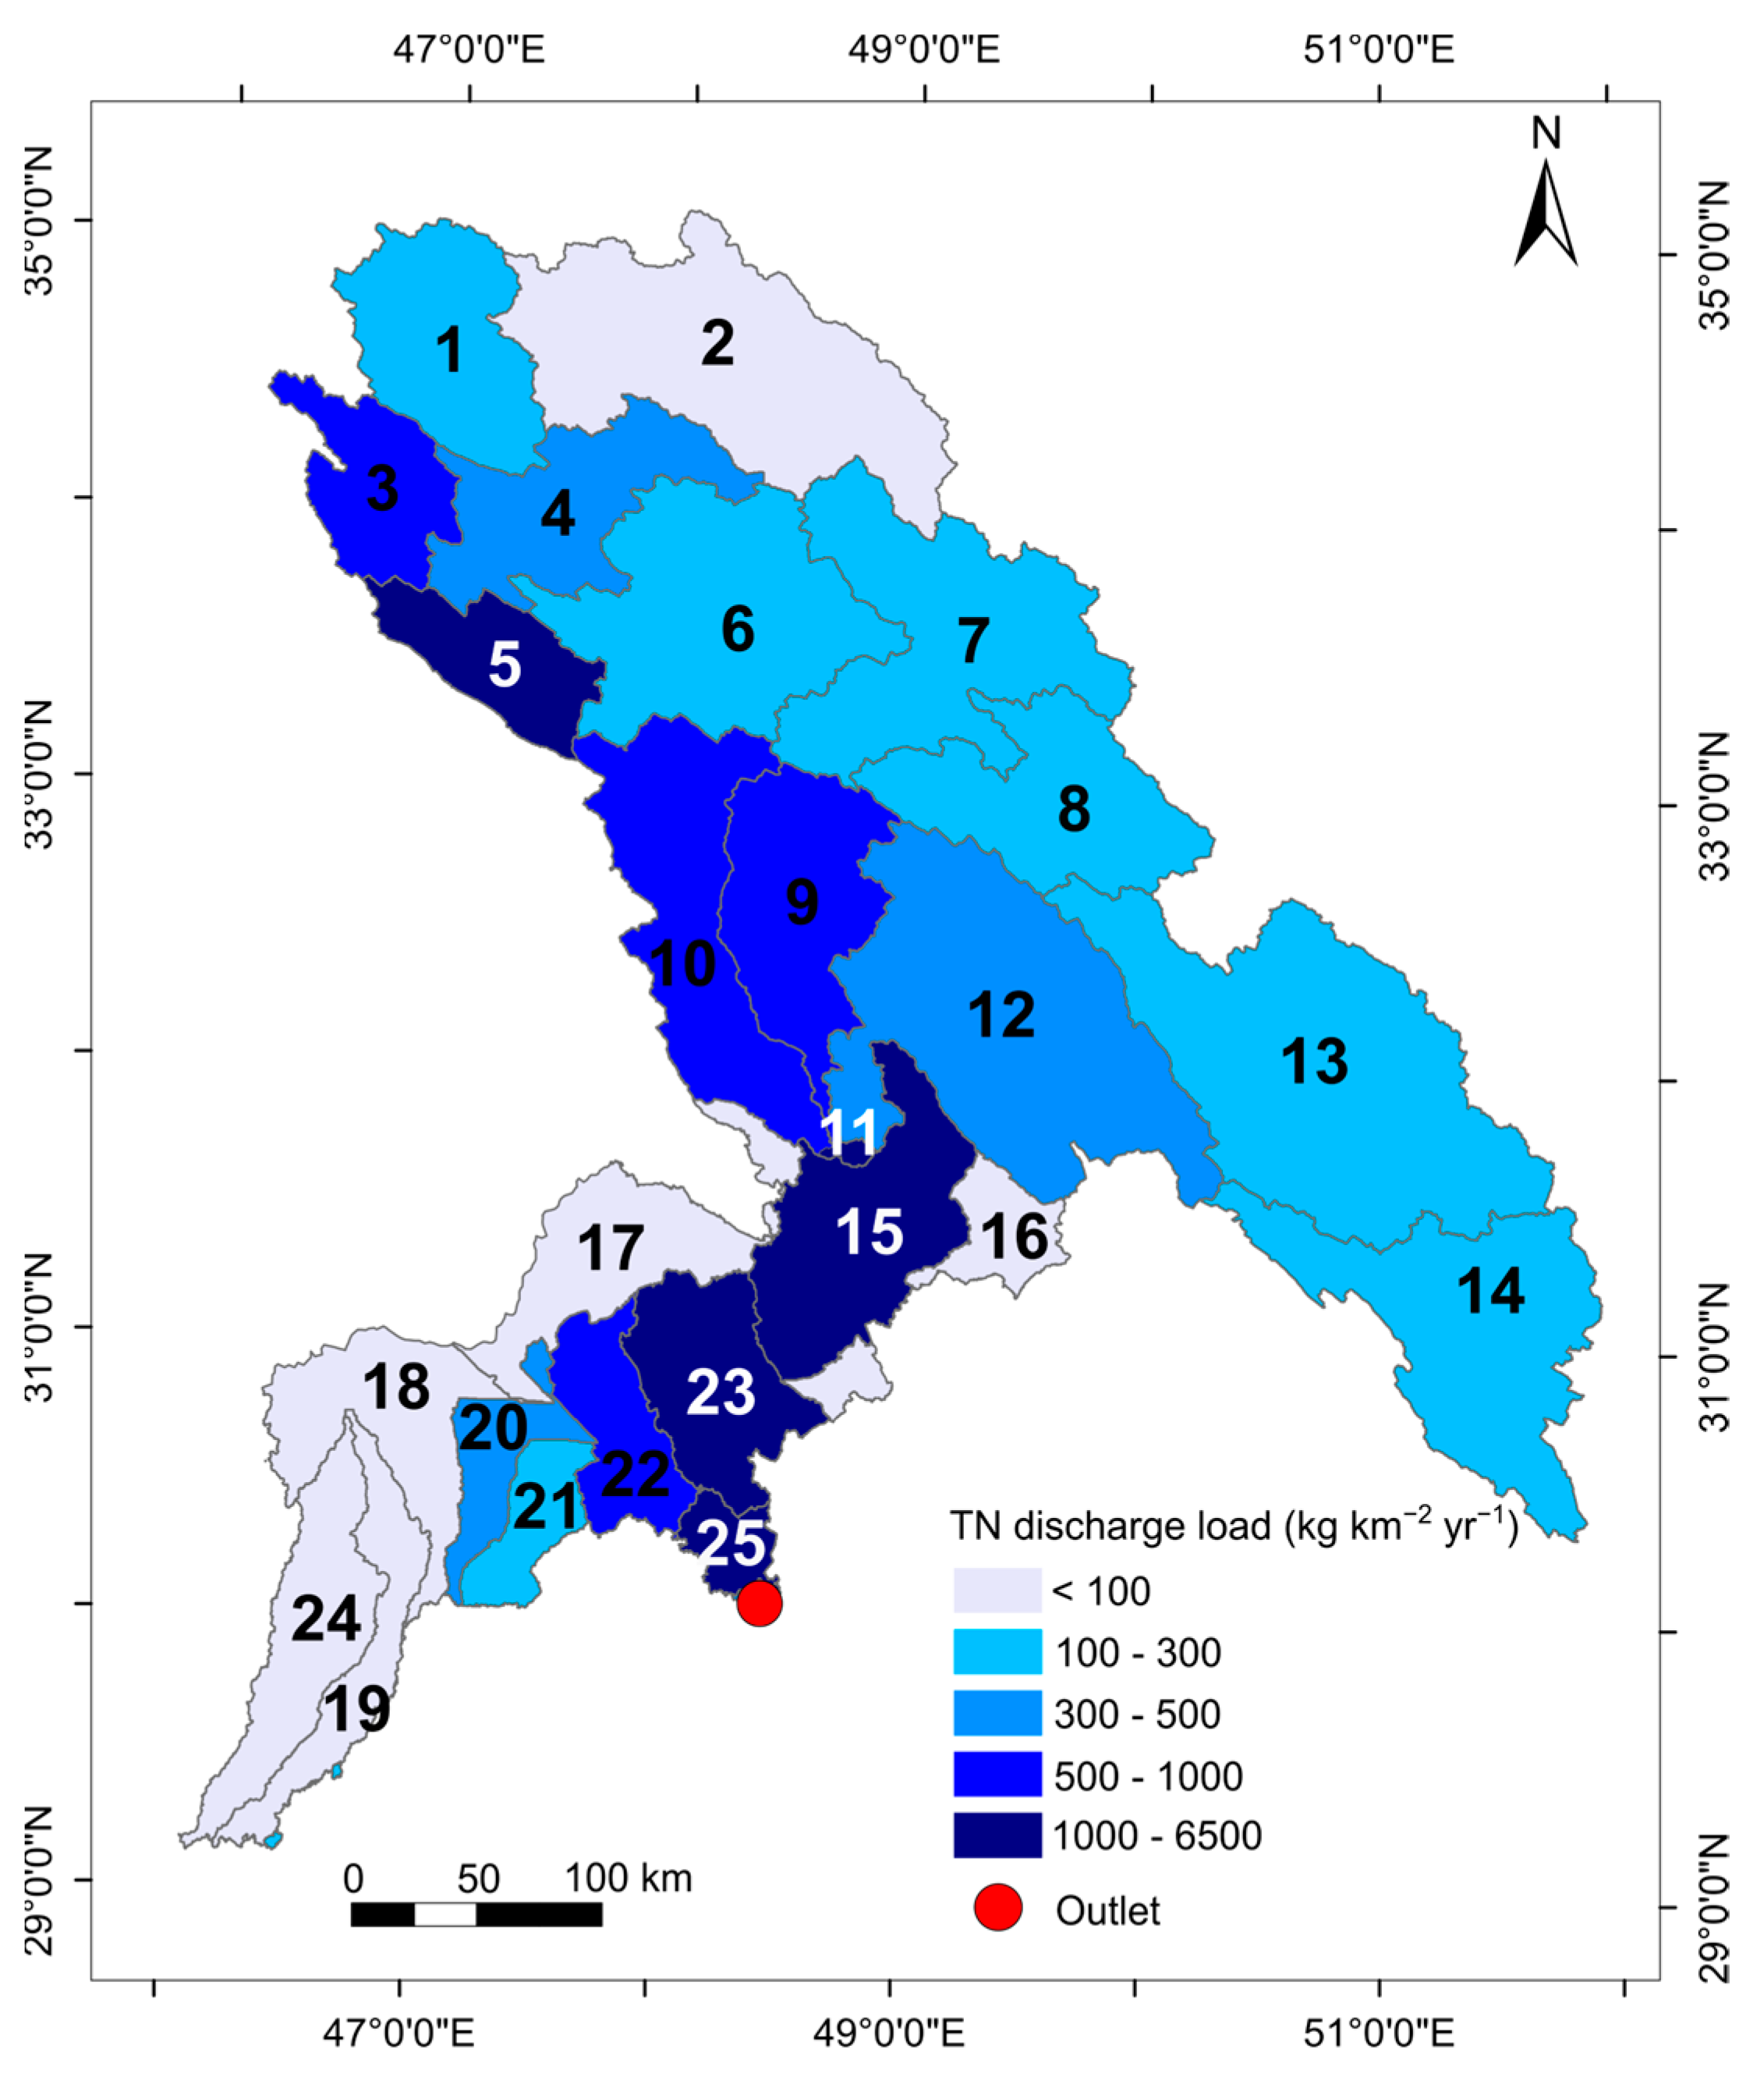
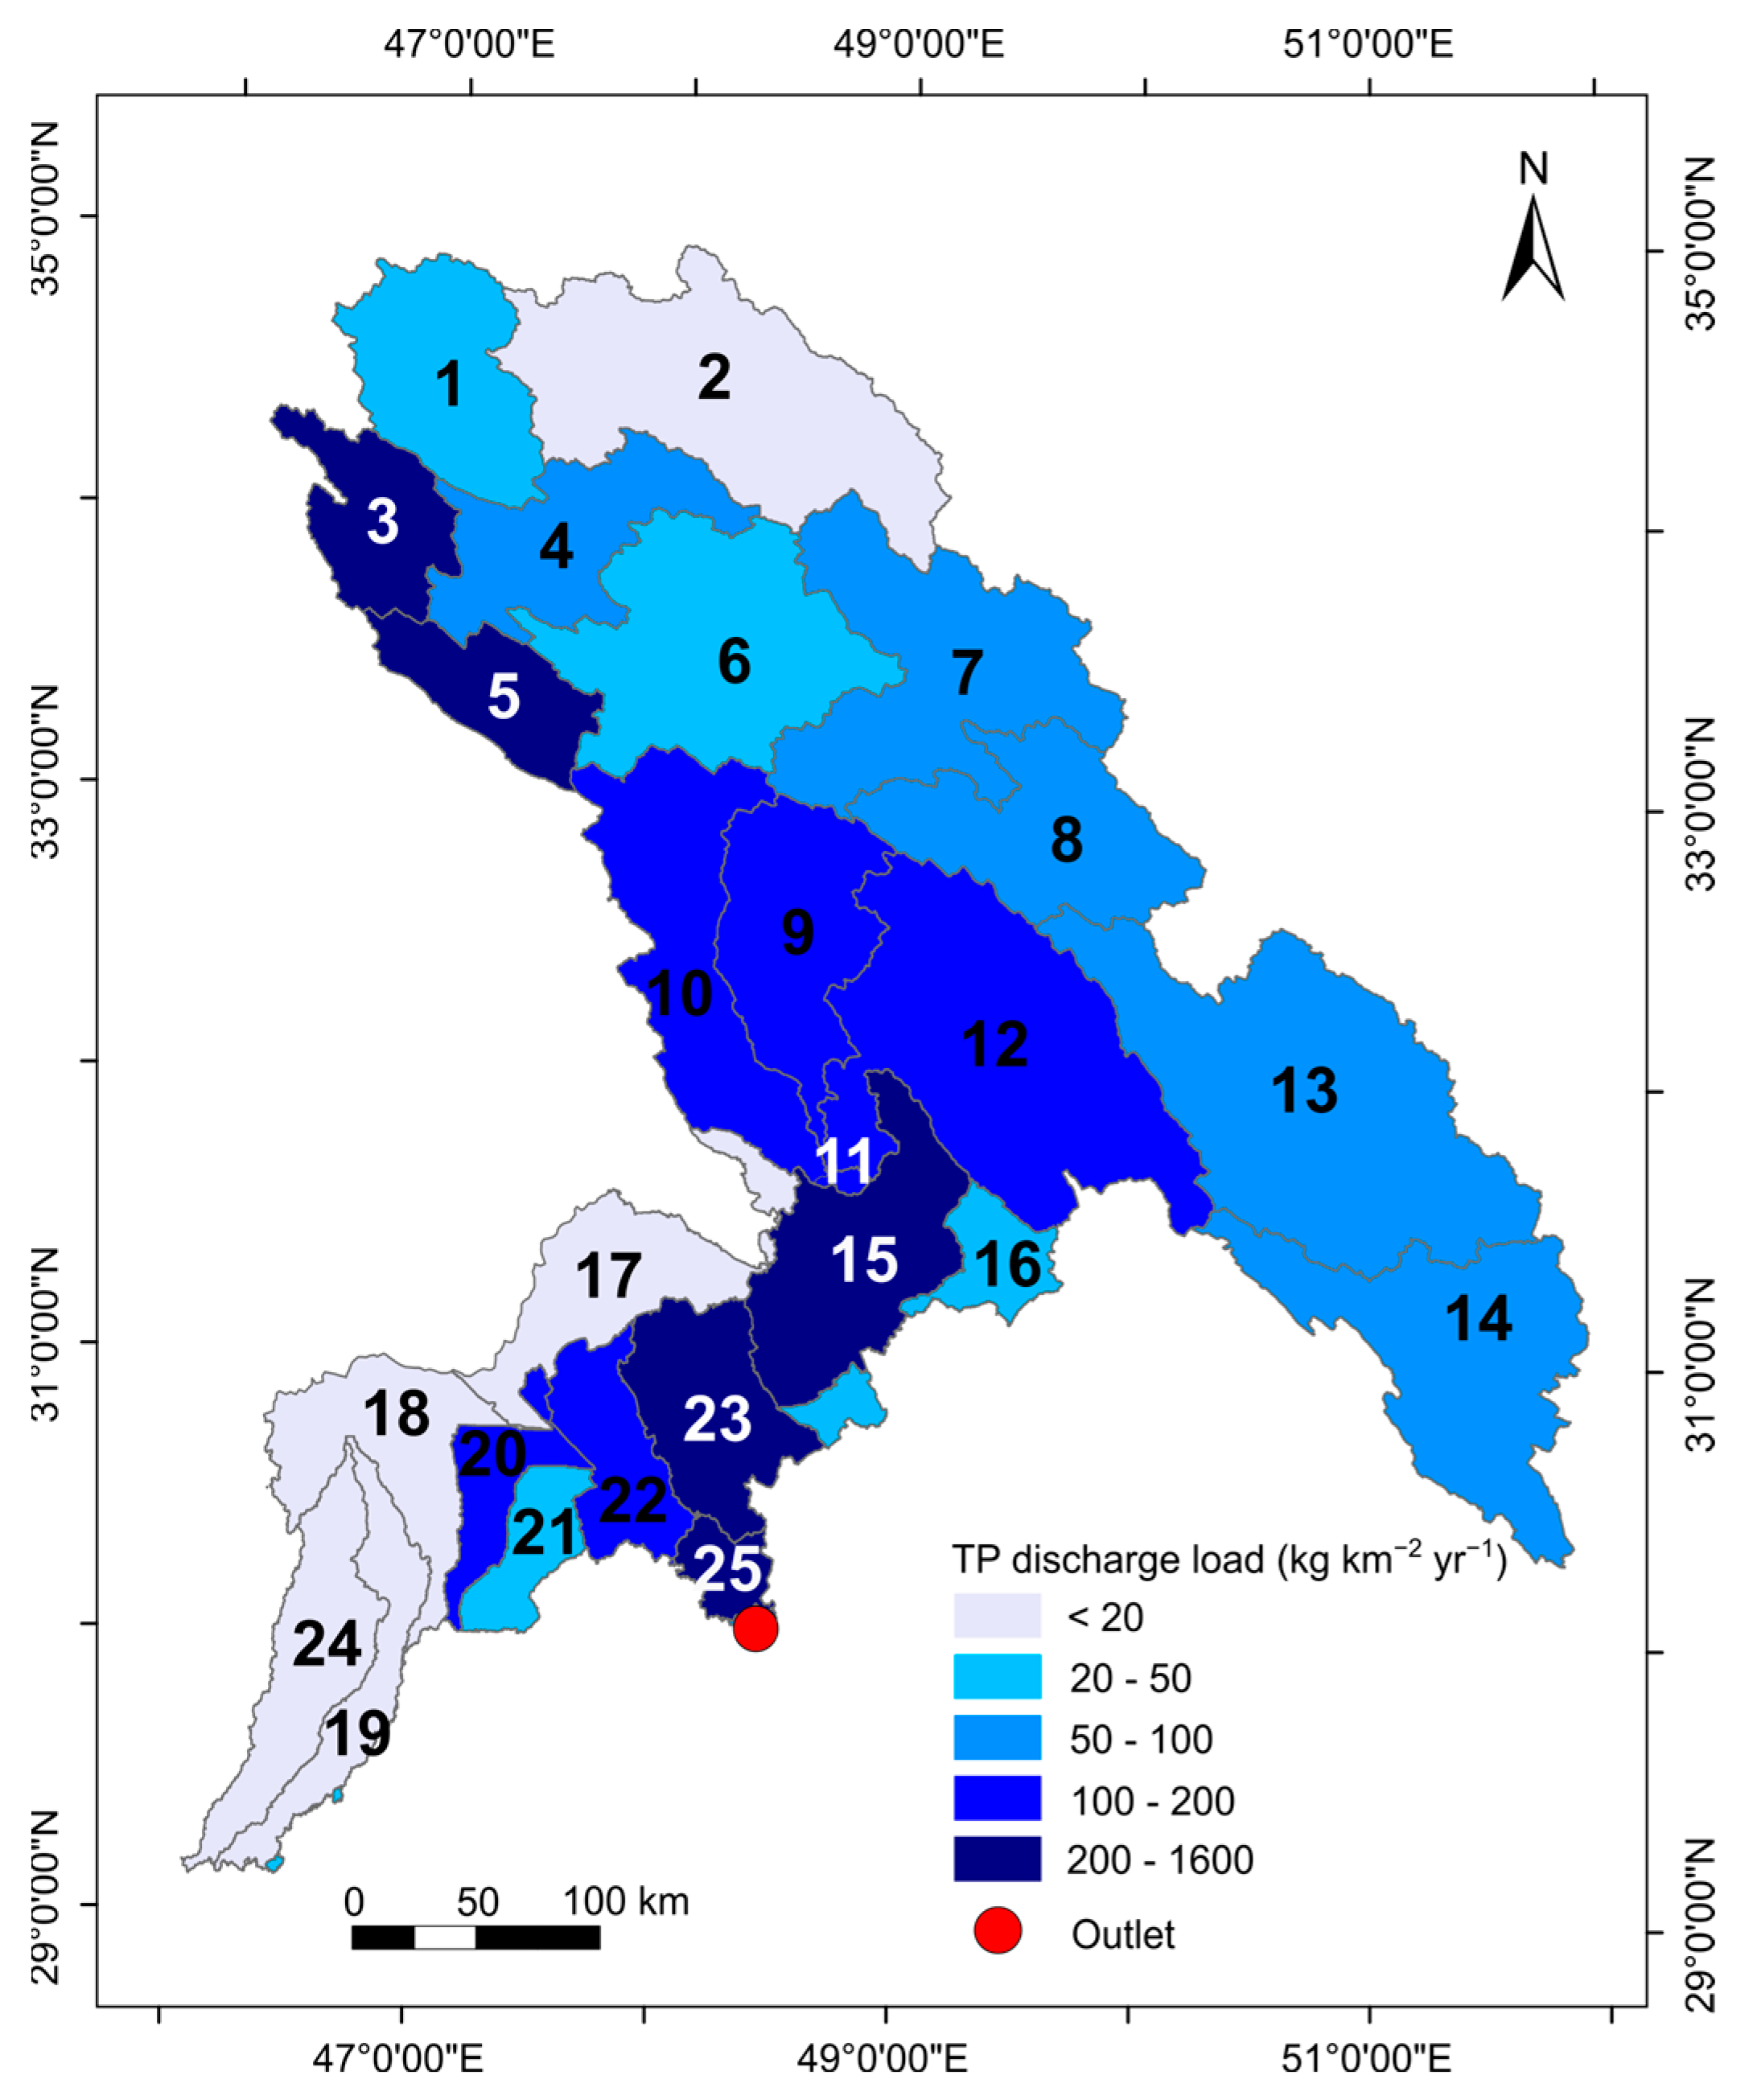
4.2. Spatial Variation Characteristics of Annual TN and TP Discharge Loads

Under the simulated results of the SWAT model, the annual TN and TP outputs were 618 and 140 kg km−2, respectively. The output per unit area of TN and TP in the river section was divided into five categories. The annual TN discharge load was highest in the middle parts of the basin, in subbasins 5, 11, 15, 23, and 25. The second grade was in subbasins 3, 9, and 22. The lowest TN output was mainly located in subbasins 2, 16, 17, 18, 19, and 24 (Figure 3). The annual TP discharge load generally exhibited similar spatial distribution characteristics as the annual TN discharge load. The annual TP discharge load was highest in the middle parts of the basin, in subbasins 3, 5, 15, 23, and 25. The second grade was in subbasins 9, 10, 11, 12, 20, and 22. The lowest annual TP discharge load was mainly located in subbasins 2, 17, 18, 19, and 24 (Figure 4). The areas with large annual TN and TP discharge loads were situated in the middle parts of the basin, where the cultivated and construction land are concentrated and the landscape pattern is relatively complex.

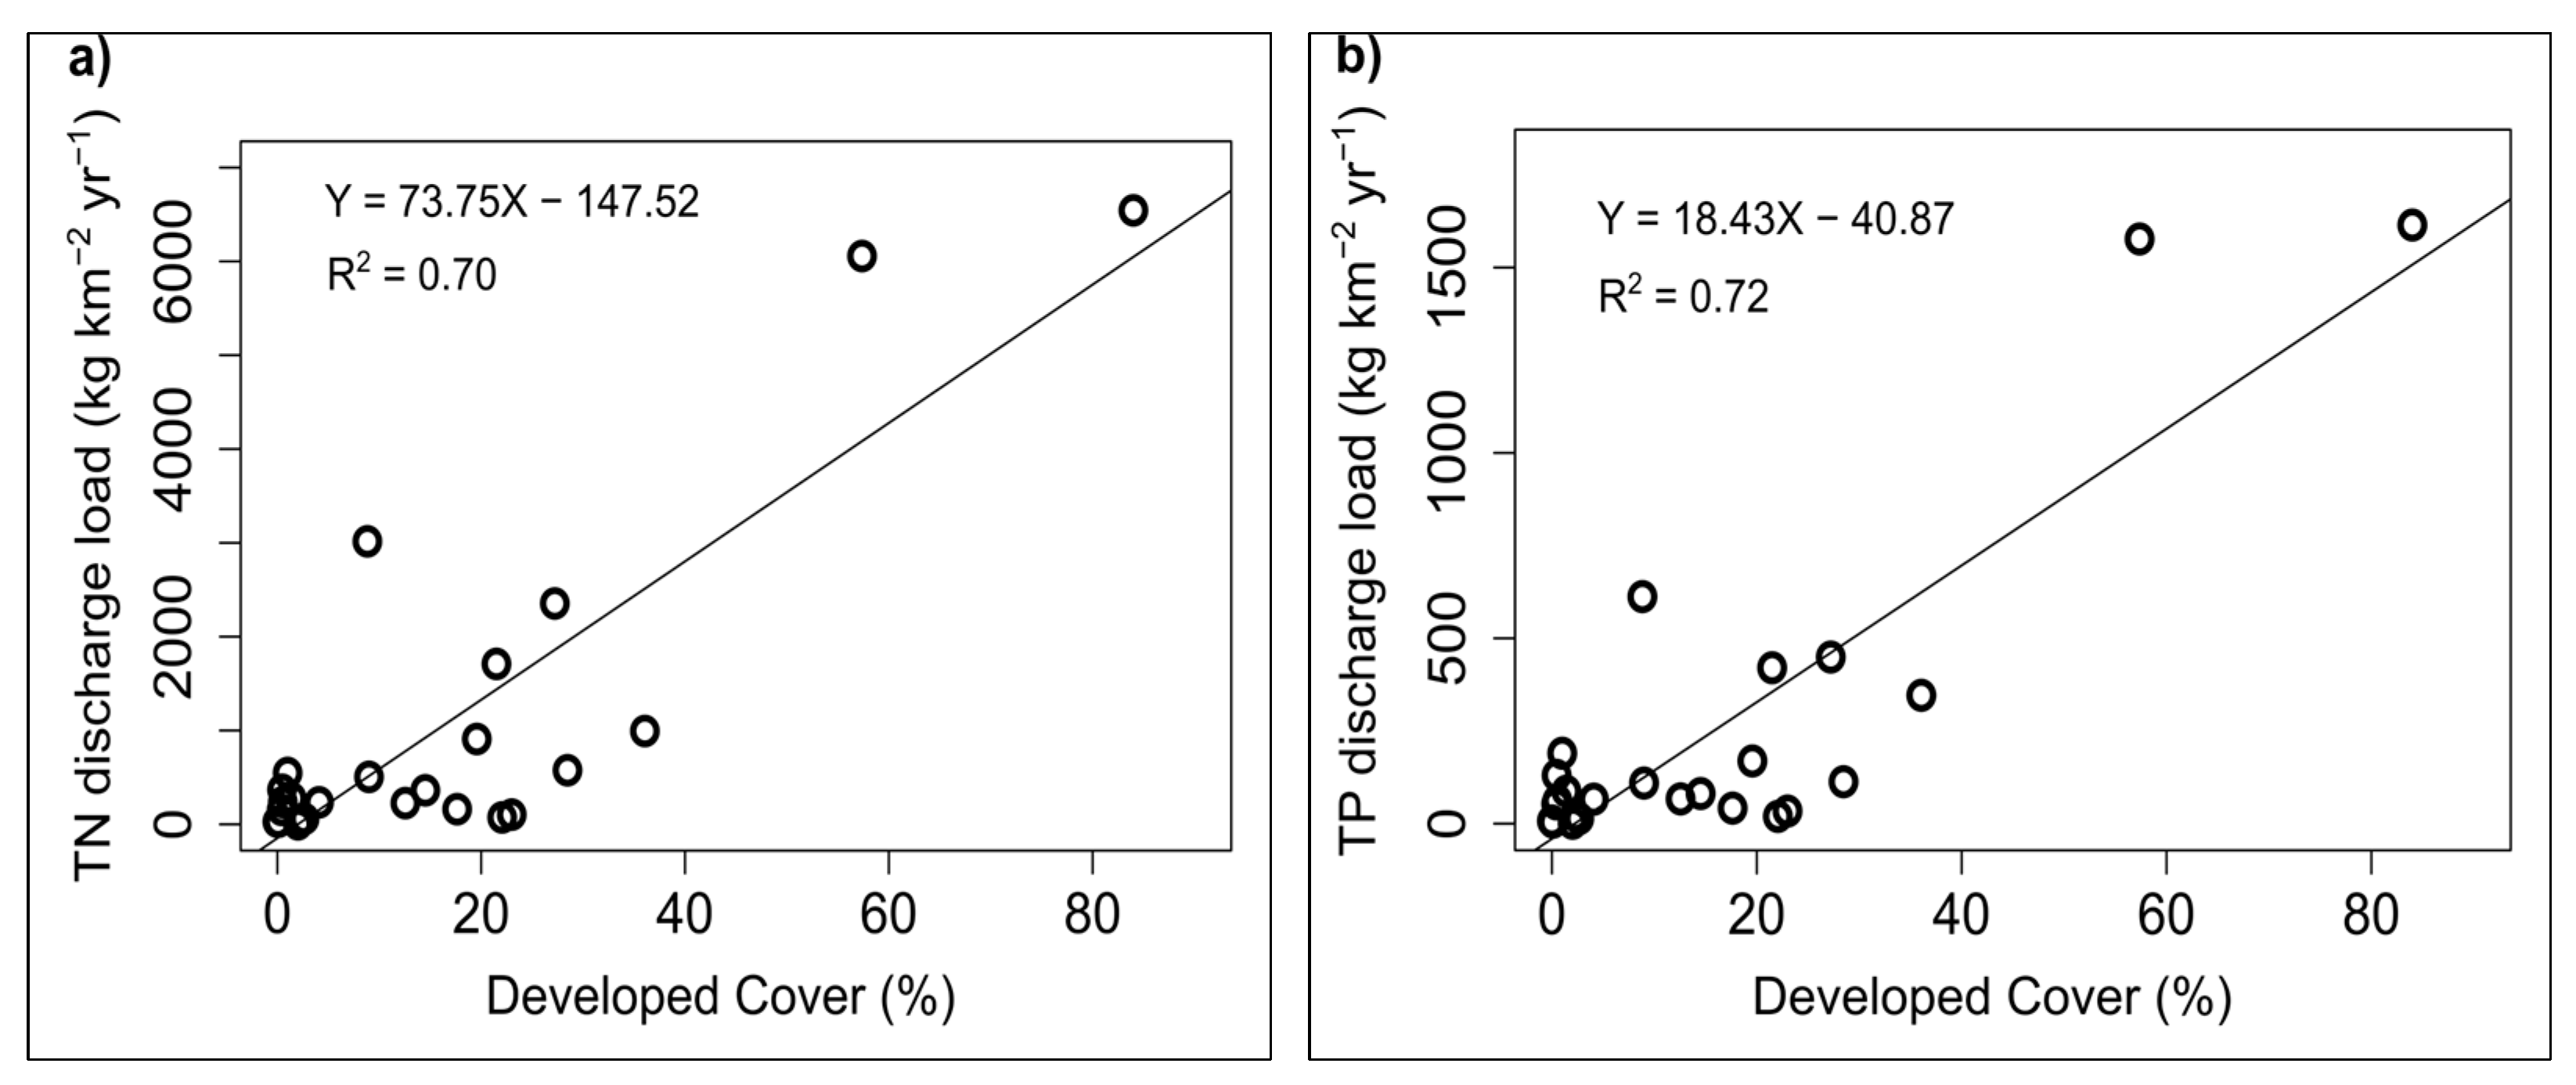
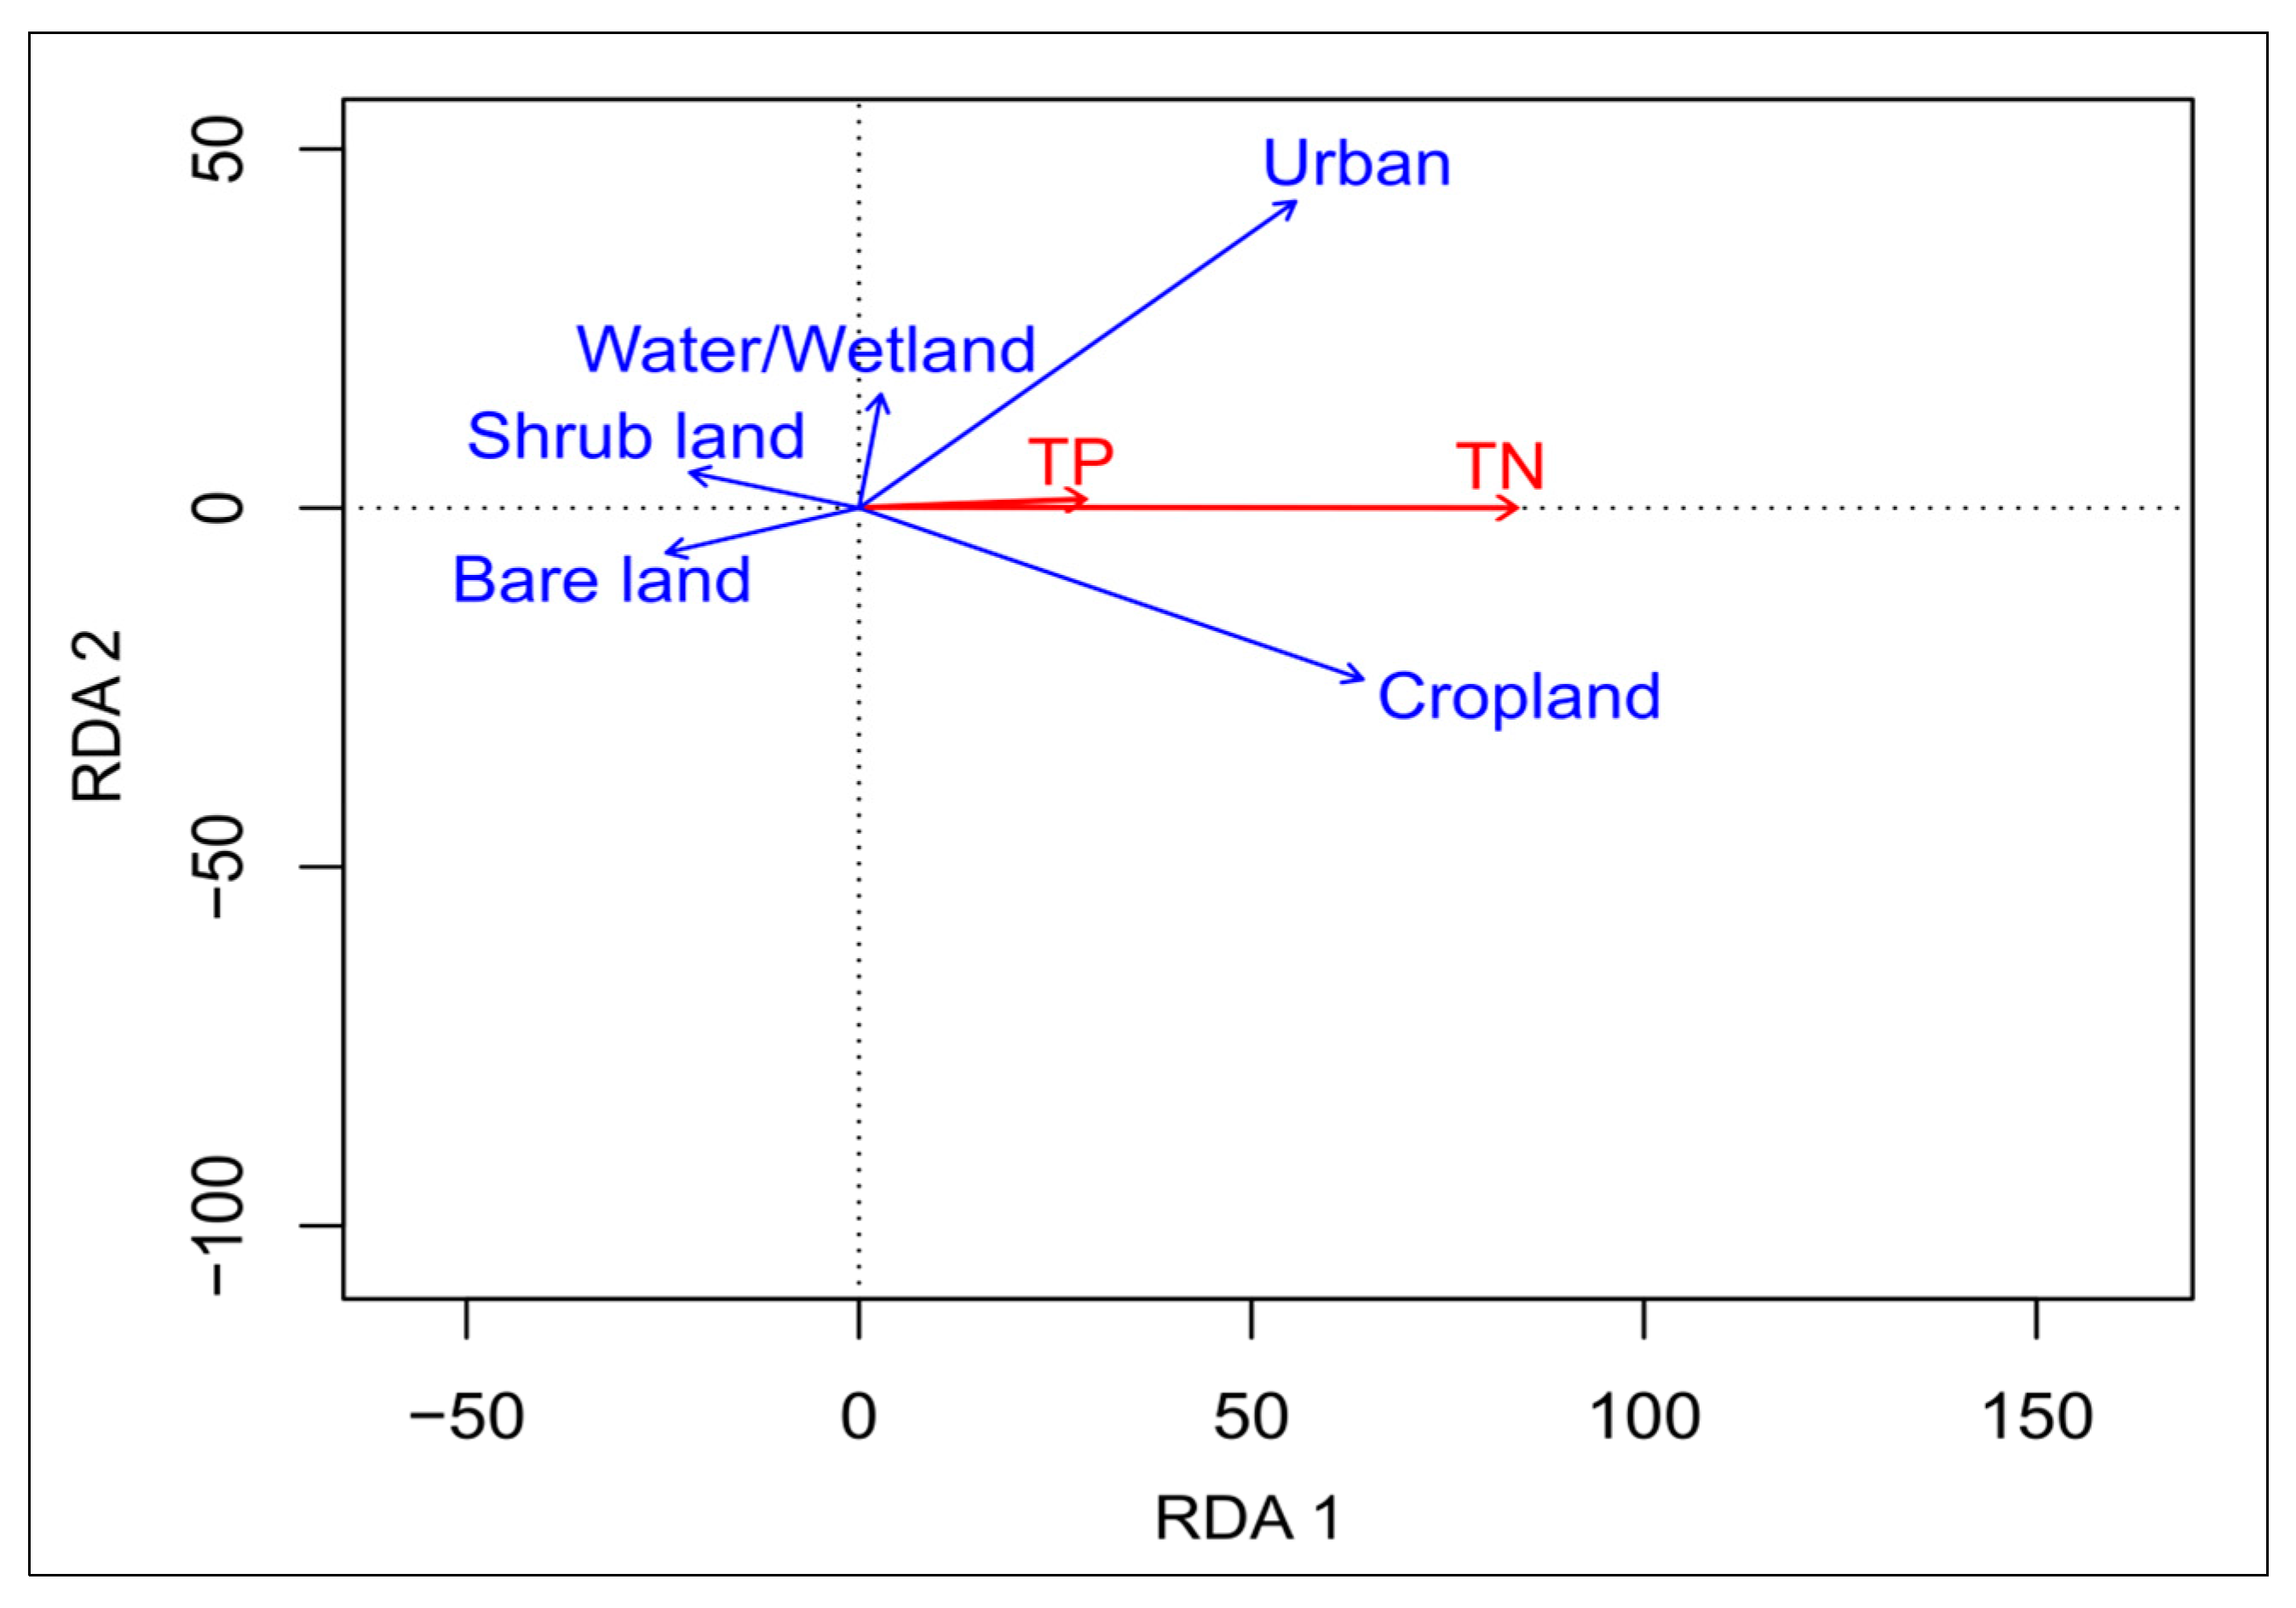
4.3. Relationship between LULC and Annual TN and TP Discharge Loads

The annual TN and TP discharge loads have significant (p < 0.05) positive correlations with the percentage of developed land cover (urban and agricultural land covers). The coefficient of determination (R2) of these correlations is 0.70 and 0.72, respectively (Figure 5). In the Redundancy Analysis (RDA), the distribution of LULC categories (environmental factors) and annual TN/TP discharge loads (species) was derived. The RDA revealed that urban and crop land ratios were positively correlated with the annual TN and TP discharge loads. On the contrary, shrub land and bare land ratios were negatively correlated with the annual TN and TP discharge loads (Figure 6). The annual TN and TP discharge loads from urban land cover are the highest, followed by cropland, barren, water/wetland, and shrub land covers, respectively (Table 3).

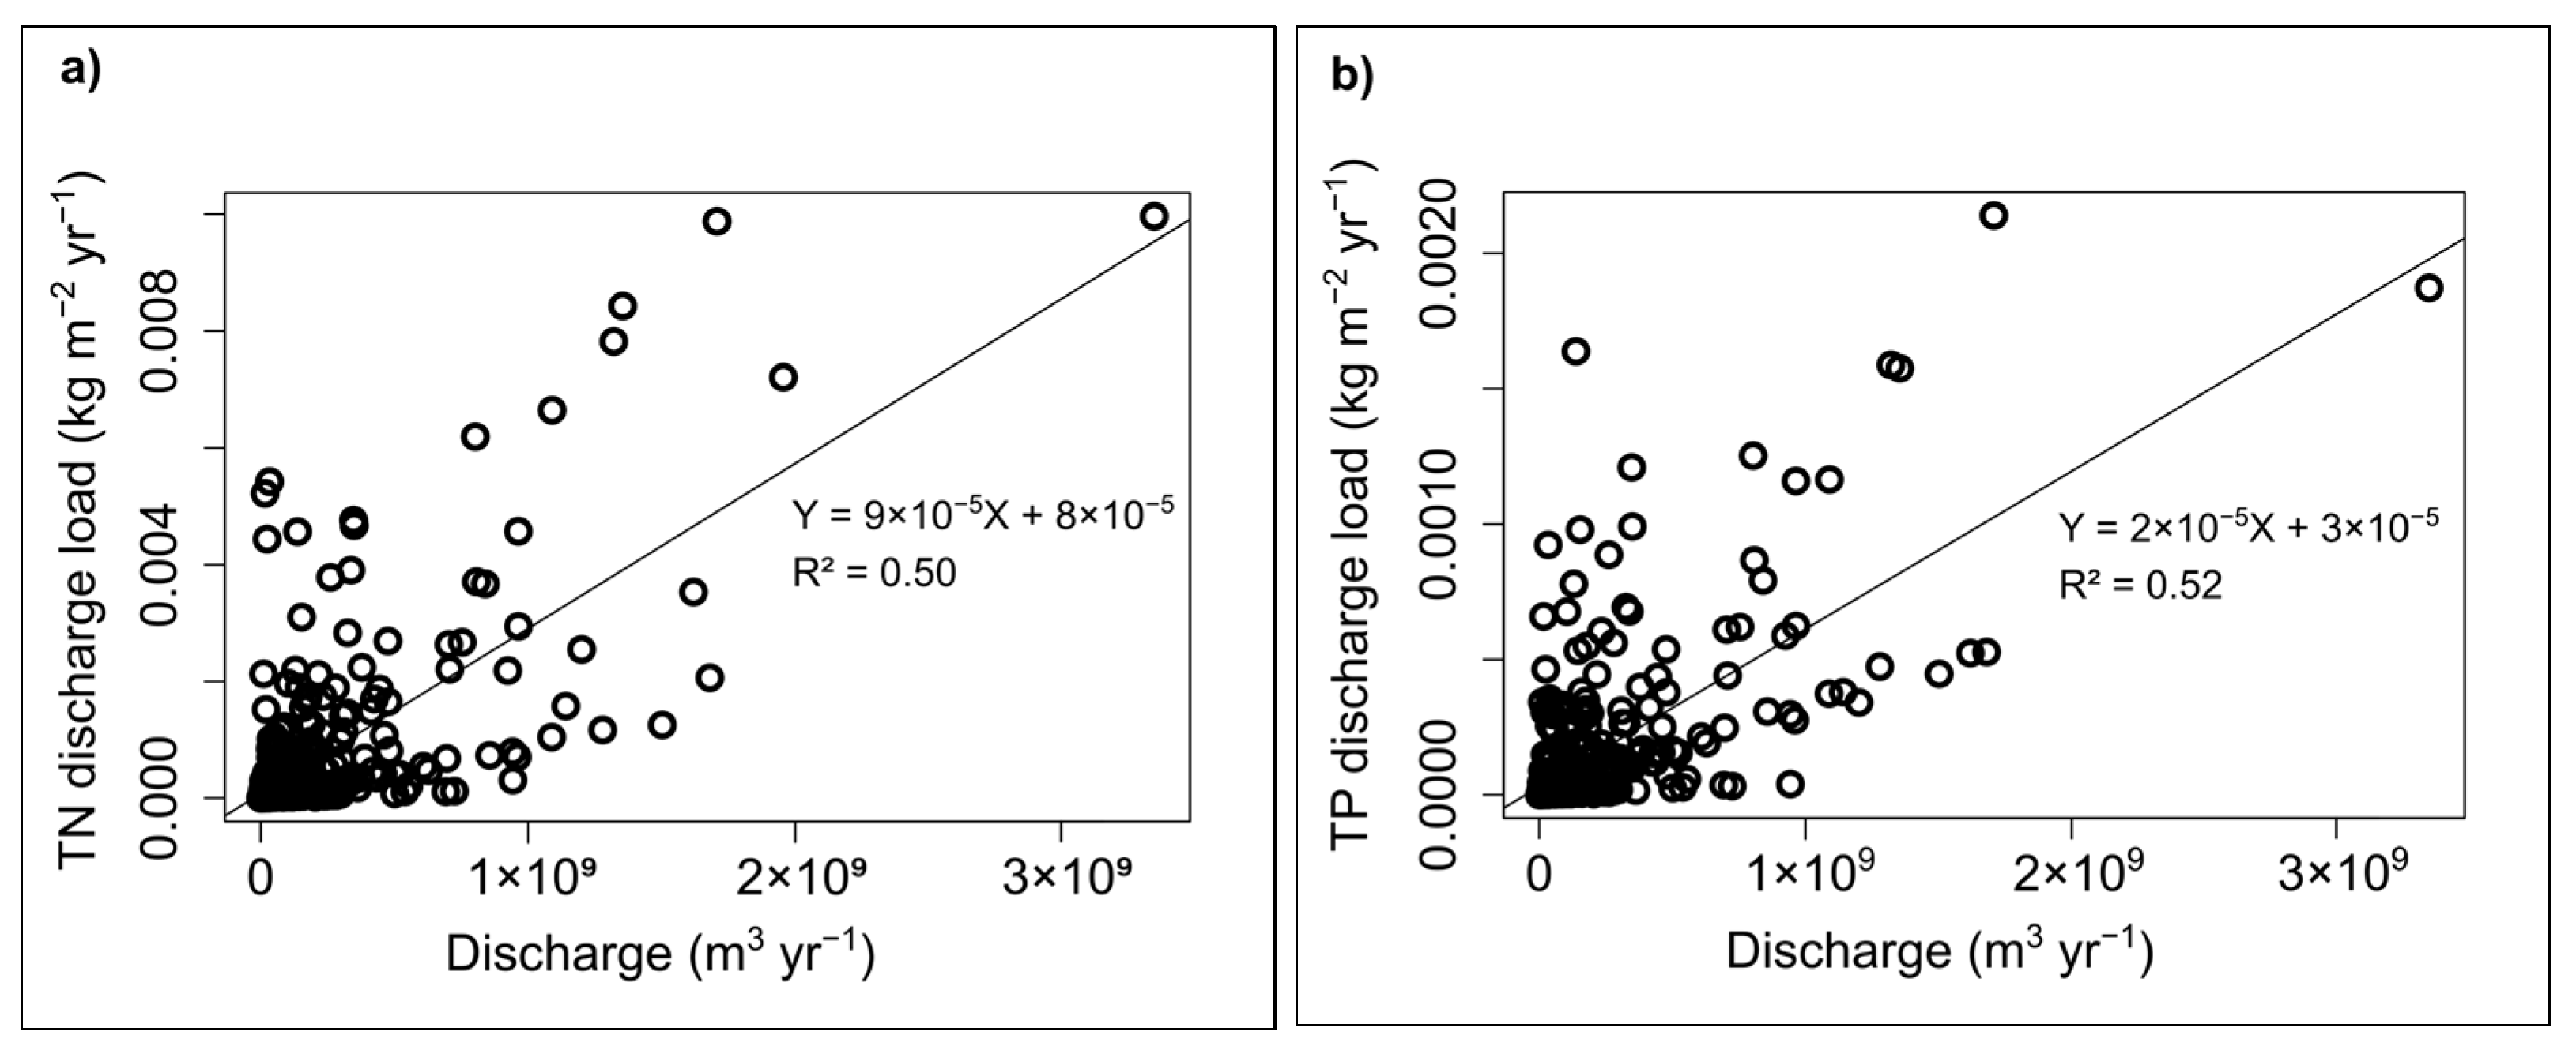
4.4. Relationship between Flow Volume and Annual TN and TP Discharge Loads

Flow volume is positively correlated with precipitation. Both annual TN discharge load and annual TP discharge load significantly (p < 0.05) and positively correlate with annual flow volume. The coefficient of determination (R2) of these correlations is 0.50 and 0.52, respectively (Figure 7).

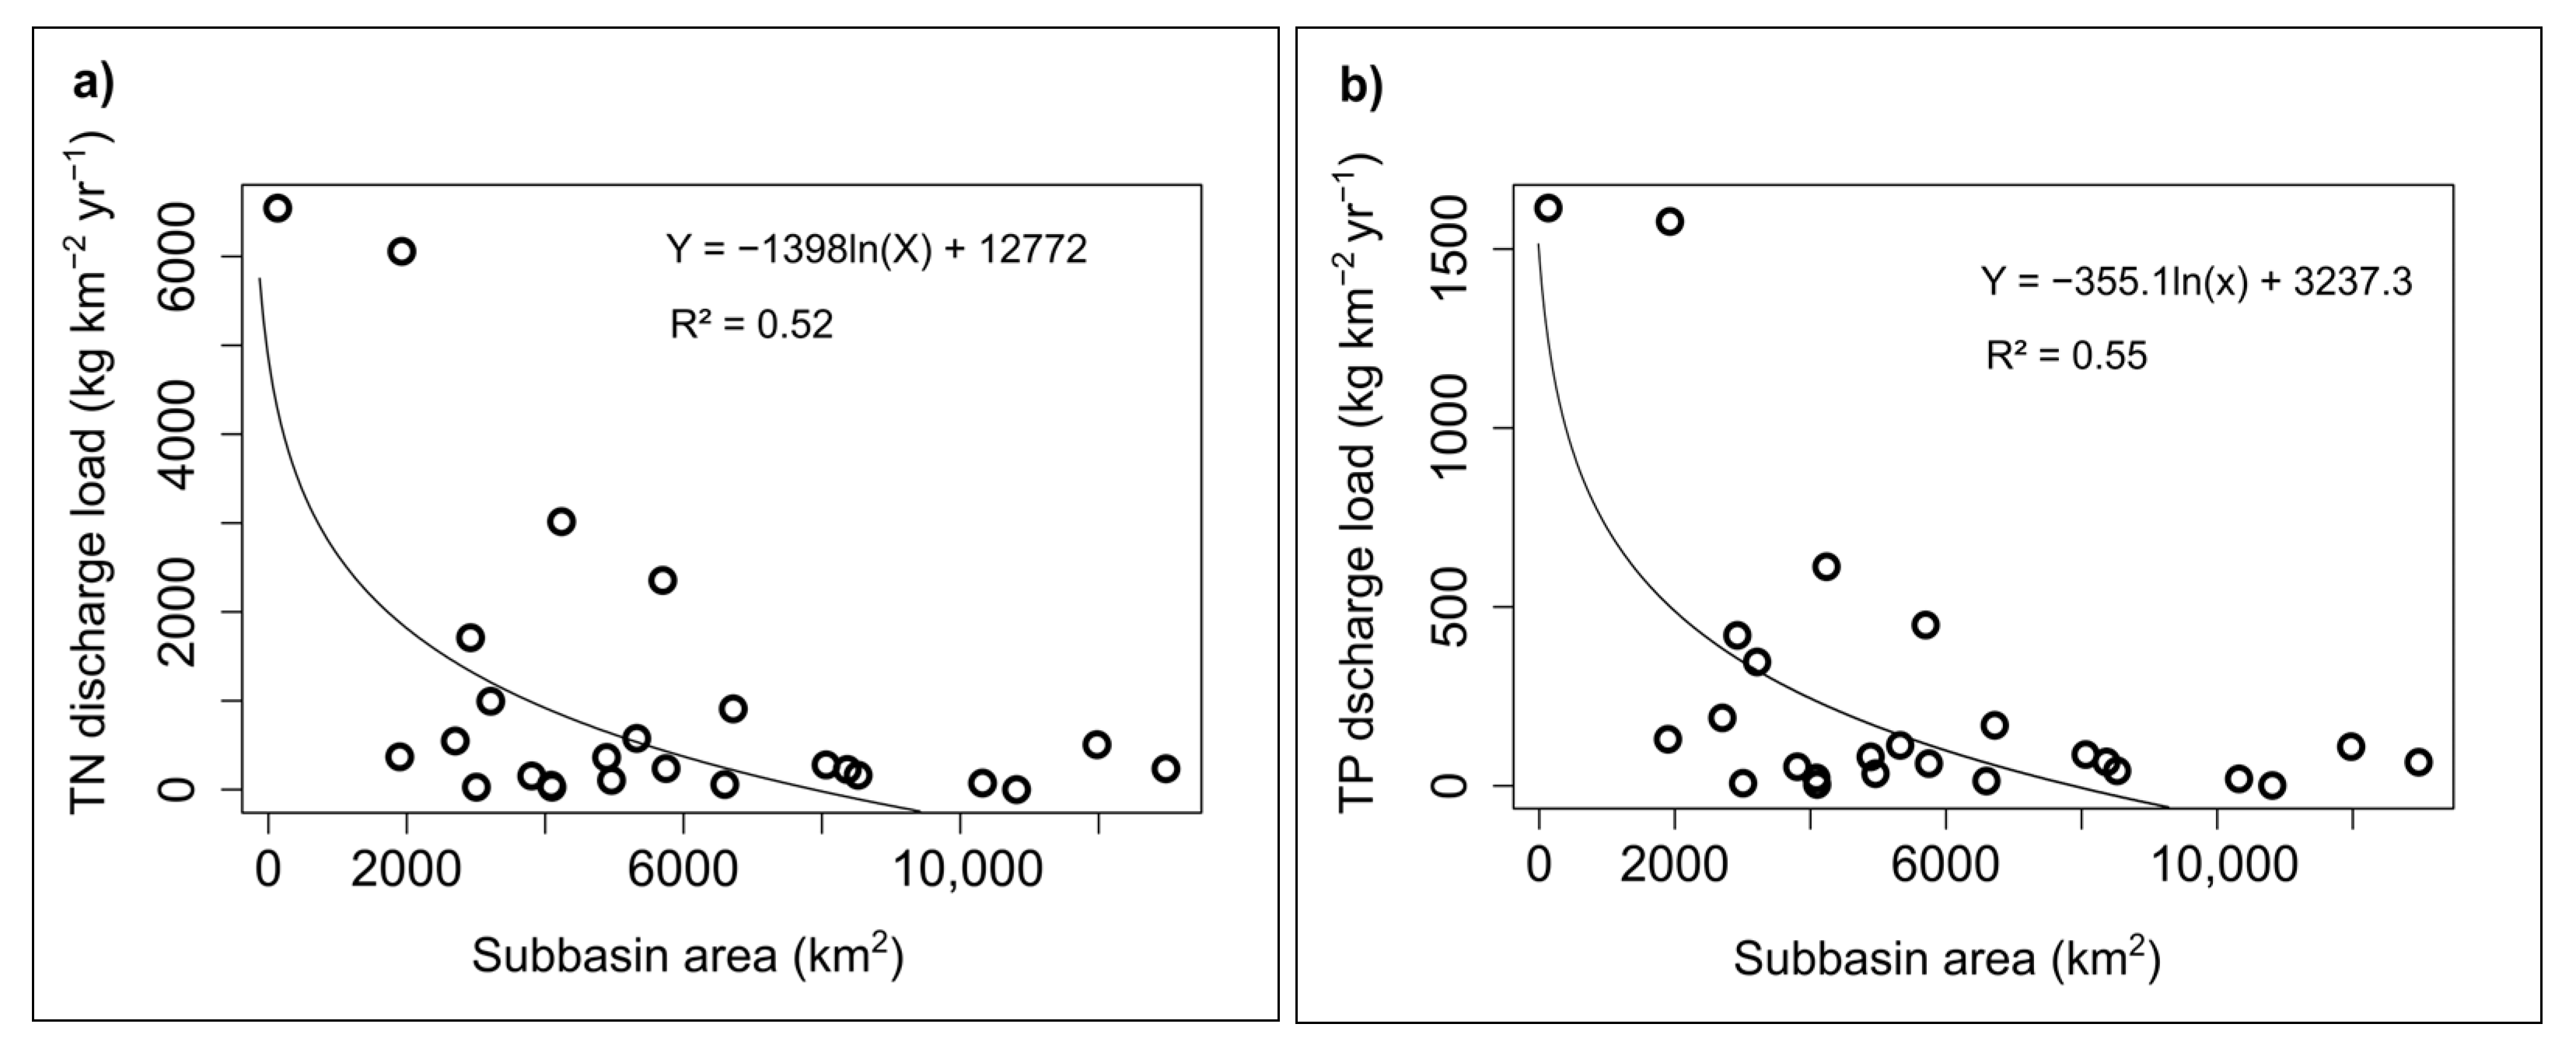
4.5. Relationship between Subbasin Area and Annual TN and TP Discharge Loads

A significant (p < 0.05) positive correlation was detected between the mean annual TN discharge load and the subbasin area and between the mean annual TP discharge load and the subbasin area. The coefficient of determination (R2) of these correlations is 0.52 and 0.55, respectively (Figure 8).

5. Discussion

5.1. Spatial Variation Characteristics of Annual TN and TP Discharge Loads

The annual TN and TP discharge load levels displayed the highest levels in the middle parts of the basin and exhibited decreasing trends towards the north-east and south-west (Figure 3 and Figure 4). Such trends followed LULC, flow volume, and subbasin area, as explained below.

5.2. Relationship between LULC and Annual TN and TP Discharge Loads

The high annual TN and TP discharge loads in the cultivated lands (Table 3; Figure 5 and Figure 6) can be attributed to the fact that the use of agricultural fertilizers generates high levels of nitrogen [68,69] and phosphorus [70]. Furthermore, tillage and other agricultural practices can promote erosion, resulting in higher losses of N [71,72,73] and P [74,75]. Likewise, the high annual N and P discharge loads associated with urban land cover (Table 3; Figure 5 and Figure 6) can be attributed to the alteration of the physical and hydrogeological properties of watersheds in urban areas and the development of nutrient sources in such areas. Septic tank drainage, yard fertilization, domestic pet wastes, and soil erosion in urban areas are widely connected to elevated N and P content [14,16]. On the other hand, the annual TN and TP discharge loads are quite low in shrubland areas due to the limited input of nitrogen and phosphorus in such areas. The main contributor to nitrogen accumulation in watersheds with natural vegetation (such as shrublands) is the buildup of atmospheric nitrogen. The natural source of phosphorus is the weathering of specific geologic formations [76]. However, such natural sources of N and P are remarkably less common than anthropogenic sources such as fertilizer application and wastewater disposal [77]. Furthermore, in the absence of anthropogenic sourcing, N and P transfer from upland shrublands into waterways can be significantly reduced by microbial absorption assimilation [78,79,80] and soil-stream interaction processes [81,82,83].

5.3. Relationship between Flow Volume and TN and TP Discharge Loads

The flow volume, which was strongly linked to precipitation, exhibited a positive correlation with both annual TN and TP discharge loads (Figure 7). Intensive winter rain events are responsible for accelerated erosion processes, both in the sloped subbasins and at the riverbanks. Such a correlation is consistent with other studies, e.g., [84,85,86,87,88,89], that detected a very strong relationship between flow volume and N and P discharge loads. Thus, in the future, nutrient flux changes in the basin will result from changes in land cover and precipitation. Moreover, the impact of land cover and precipitation changes can be coupled; for example, Thompson [90] found that agricultural lands leach relatively high nutrient amounts, but they do so even more during heavy rains. Therefore, large-scale land cover changes, for example, could alleviate the increase in nutrient loading in the basin due to precipitation increases. Land cover alteration can include, for instance, a substantial reduction in agricultural land cover and/or changes in agricultural practices and intensity in cultivated areas, as well as installing wastewater treatment facilities in urban areas.

5.4. Relationship between Subbasin Area and Annual TN and TP Discharge Loads

Previous studies, e.g., [91,92,93], detected a negative correlation between sediment discharge load and catchment area. Other studies found that erosion rate and, subsequently, nutrient discharge load decreased with catchment area [94,95]. The sediment sinking potential is often greater than the sediment sourcing potential in large catchments, which lowers the sediment discharge load [96]. This might be attributed to the fact that large catchments have more foothill terrain and floodplain development in which sediment can be settled compared with smaller catchments [94]. Thus, large catchments have smaller N and P discharge loads than small catchments due to their lower erosion rate, which is a primary driver of N and P export [97]. This can explain the current study’s finding that there is an inverse relationship between N and P discharge loads and subbasin area (Figure 8).

6. Conclusions

This work simulated the TN and TP discharge loads and their geographical distribution based on weather, elevation, slope, soil type, and LULC data in the Shatt Al-Arab river basin. It investigated the relationships of TN and TP discharge loads with both flow volume and LULC using linear regression and redundancy analyses. The annual TN and TP discharge loads were positively correlated with both flow volume and developed cover (i.e., agricultural and urban land covers). As such, future TN and TP discharge loads will be governed by a coupling of flow volume with land cover and will be sensitive to both land cover change and precipitation-flow volume response variation induced by climate change. We admit that observed data in the Shatt Al-Arab watershed for nutrient load verification are important for comprehensive SWAT modeling, and such data are unfortunately unavailable for the current study analysis. An integrated environmental assessment is severely hampered by inadequate monitoring in such an ungauged watershed, as well as by high data collection costs and a lack of desire, transparency, and interest in information sharing in this transboundary basin. Thus, this study represented the best currently viable plan in this research region. The findings of this study provide a platform for applying new agronomic and urban planning scenarios to achieve development and environmental goals in future targeted studies. The study’s outcomes also create a quantitative framework for assessing the influence of anthropogenic pressures on a river basin’s hydrological response.

Author Contributions

Conceptualization; methodology; software; formal analysis; investigation; resources; data curation; writing—original draft preparation; visualization; and project administration, H.S.A. and C.O. All authors have read and agreed to the published version of the manuscript.

Funding

This research received no external funding.

Institutional Review Board Statement

Not applicable.

Informed Consent Statement

Not applicable.

Data Availability Statement

The authors confirm that the data supporting the findings of this study are available within the article.

Conflicts of Interest

The authors declare no conflict of interest.

References

  1. Isaev, V.A.; Mikhailova, M.V. The Hydrography, Evolution, and Hydrological Regime of the Mouth Area of the Shatt Al-Arab River. Water Resour. 2009, 36, 380–395. [Google Scholar] [CrossRef]
  2. Mohamed, A.; Abood, A. Ecological Health Assessment of the Shatt Al-Arab River, Iraq. IOSR J. Agric. Vet. Sci. (IOSR-JAVS) 2017, 10, 1–8. [Google Scholar]
  3. Al-Aboodi, A.; Abbas, S.; Ibrahim, H. Effect of Hartha and Najibia power plants on water quality indices of Shatt Al-Arab River, south of Iraq. Appl. Water Sci. 2018, 8, 64. [Google Scholar] [CrossRef] [Green Version]
  4. United Nations New York. Shatt Al Arab, Karkheh and Karun Rivers. Inventory of Shared Water Resources in Western Asia. 2013. Available online: http://waterinventory.org/surface_water/shatt-al-arab-karkheh-and-karun-rivers (accessed on 23 May 2023).
  5. Al-Yamani, F.; Bishop, J.; Al-Rifaie, K.; Ismail, W. The effects of the river diversion, Mesopotamian marsh drainage and restoration, and river damming on the marine environment of the northwestern Arabian Gulf. Aquat. Ecosyst. Health Manag. 2007, 10, 277–289. [Google Scholar] [CrossRef]
  6. Al-Manssory, F.; Abdul Kareem, M.; Yassen, M. An Assessment of Environmental Pollution by Some Trace Metals in the Northern Part of Shatt Al-Arab Sediments, Southern Iraq. Iraqi J. Earth Sci. 2004, 4, 11–22. [Google Scholar]
  7. Al-Tawash, B.S.; Al-Lafta, H.S.; Merkel, B. Preliminary Assessment of Shatt Al-Arab Riverine Environment, Basra Governorate, Southern Iraq. J. Nat. Sci. Res. 2013, 3, 120–136. [Google Scholar]
  8. Jawad, A.H.M. Study of some chemical and physical indicators of water Shatt al Arab in Basra city. Mesop. Mag. 1994, 2, 189–203. [Google Scholar]
  9. Ip, C.C.; Li, X.-D.; Zhang, G.; Wai, O.W.; Li, Y.-S. Trace metal distribution in sediments of the Pearl River Estuary and the surrounding coastal area, South China. Environ. Pollut. 2007, 147, 311–323. [Google Scholar] [CrossRef] [PubMed] [Green Version]
  10. Howarth, R.; Swaney, D.; Billen, G.; Garnier, J.; Hong, B.; Humborg, C.; Johnes, P.; Mörth, C.M.; Marino, R. Nitrogen fluxes from the landscape are controlled by net anthropogenic nitrogen inputs and by climate. Front. Ecol. Environ. 2012, 10, 37–43. [Google Scholar] [CrossRef] [Green Version]
  11. Guo, M.; Zhang, T.; Li, J.; Li, Z.; Xu, G.; Yang, R. Reducing nitrogen and phosphorus losses from different crop types in the water source area of the Danjiang River, China. Int. J. Environ. Res. Public Health 2019, 16, 3442. [Google Scholar] [CrossRef] [Green Version]
  12. Shi, P.; Zhang, Y.; Li, Z.; Li, P.; Xu, G. Influence of land use and land cover patterns on seasonal water quality at multi-spatial scales. Catena 2017, 151, 182–190. [Google Scholar] [CrossRef]
  13. Räty, M.; Järvenranta, K.; Saarijärvi, E.; Koskiaho, J.; Virkajärvi, P. Losses of phosphorus, nitrogen, dissolved organic carbon and soil from a small agricultural and forested catchment in east-central Finland. Agric. Ecosyst. Environ. 2020, 302, 107075. [Google Scholar] [CrossRef]
  14. Carpenter, S.R.; Caraco, N.F.; Correll, D.L.; Howarth, R.W.; Sharpley, A.N.; Smith, V.H. Nonpoint pollution of surface waters with phosphorus and nitrogen. Ecol. Appl. 1998, 8, 559–568. [Google Scholar] [CrossRef]
  15. Soranno, P.A.; Hubler, S.L.; Carpenter, S.R.; Lathrop, R.C. Phosphorus loads to surface waters: A simple model to account for spatial pattern of land use. Ecol. Appl. 1996, 6, 865–878. [Google Scholar] [CrossRef]
  16. Tufford, D.L.; McKellar, H.N.; Hussey, J.R. Instream nonpoint source nutrient prediction with land-use proximity and seasonality. J. Environ. Qual. 1998, 27, 100–111. [Google Scholar] [CrossRef]
  17. Russell, M.J.; Weller, D.E.; Jordan, T.E.; Sigwart, K.J.; Sullivan, K.J. Net anthropogenic phosphorus inputs: Spatial and temporal variability in the Chesapeake Bay region. Biogeochemistry 2008, 88, 285–304. [Google Scholar] [CrossRef]
  18. WHO. Eutrophication and Health. 2002. Available online: https://ec.europa.eu/environment/water/water-nitrates/pdf/eutrophication.pdf (accessed on 23 May 2023).
  19. Antweiler, R.C.; Goolsby, D.A.; Taylor, H.E. Nutrients in the Mississippi River. In Contaminants in the Mississippi River 1987–1992; Meade, R.H., Ed.; USGS: Denver, CO, USA, 1995; Volume 1133, pp. 73–86. [Google Scholar]
  20. Moore, J.W.; Ramamoorthy, S. Impact of heavy metals in natural waters. In Heavy Metals in Natural Waters; Springer: New York, NY, USA, 1984; pp. 205–233. [Google Scholar]
  21. Jonsson, K.; Johansson, H.; Worman, A. Hyporheic exchange of reactive and conservative solutes in streams tracer methodology and model interpretation. J. Hydrol. 2003, 278, 153–171. [Google Scholar] [CrossRef]
  22. Abaychi, J.; Douabul, A. Trace metals in Shatt Al-Arab River, Iraq. Water Resour. 1985, 19, 457–462. [Google Scholar] [CrossRef]
  23. Al-Khfaji, B.; Mohamed, A.; Al-Imarah, F. Trace metals in water, sediments and green back mullet (Liza subviridis, Valencielles, 1836) of the Shatt Al-Arab estuary, northwestern Arabian Gulf. Mar. Mesop. 1997, 12, 7–23. [Google Scholar]
  24. Mahdi, B. Environmental pollution in Shatt Al-Arab estuary. J. Int. Acad. Res. Multidiscip. 2015, 3, 32–42. [Google Scholar]
  25. Shamsi, Z.; Mohammed, A.; Al-Saad, H. Heavy Metals in Residual Sediments Core along Shatt AL-Arab Estuary. J. Pharm. Chem. Biol. Sci. 2016, 4, 440–449. [Google Scholar]
  26. Alhello, A.A.; Talal, A.A.; Abdulrasool, R.M. Nutrients loads at Shatt Al-Arab River in Basra city-Iraq. J. Biol. Innov. 2019, 8, 330–345. [Google Scholar]
  27. Hassan, W.F. The nitrogen and phosphate forms in water of Shatt Al-Arab River in Basra/Iraq. Marsh Bull. 2013, 8, 182–192. [Google Scholar]
  28. Al-Asadi, M.S.; Salman, N.A.; Mahdi, A.A. Effect of Waste Discharges on Nutrients Content and Growth of Chlorella sp. from Shatt Al-Arab River. JKAU Mar. Sci. 2006, 17, 89–101. [Google Scholar] [CrossRef]
  29. Ofogh, A.R.E.; Dorche, E.E.; Birk, S.; Bruder, A. Effect of seasonal variability on the development and application of a novel Multimetric Index based on benthic macroinvertebrate communities—A case study from streams in the Karun river basin (Iran). Ecol. Indic. 2023, 146, 109843. Available online: https://www.sciencedirect.com/science/article/pii/S1470160X22013164 (accessed on 25 May 2023). [CrossRef]
  30. Environmental Protection Agency (EPA). Available online: https://nepis.epa.gov/Exe/ZyPURL.cgi?Dockey=P10070OQ.txt (accessed on 4 May 2023).
  31. Beven, K. How to make advances in hydrological modelling. Hydrol. Res. 2019, 50, 1481–1494. [Google Scholar] [CrossRef] [Green Version]
  32. Abbaspour, K.C.; Vaghefi, S.A.; Yang, H.; Srinivasan, R. Global soil, landuse, evapotranspiration, historical and future weather databases for SWAT Applications. Sci. Data 2019, 6, 263. [Google Scholar] [CrossRef] [Green Version]
  33. Krysanova, V.; White, M. Advances in water resources assessment with SWAT—An overview. Hydrol. Sci. J. 2015, 60, 771–783. [Google Scholar] [CrossRef] [Green Version]
  34. Andrianaki, M.; Shrestha, J.; Kobierska, F.; Nikolaidis, N.P.; Bernasconi, S.M. Assessment of SWAT spatial and temporal transferability for a high-altitude glacierized catchment. Hydrol. Earth Syst. Sci. 2019, 23, 3219–3232. [Google Scholar] [CrossRef] [Green Version]
  35. Meng, F.; Sa, C.; Liu, T.; Luo, M.; Liu, J.; Tian, L. Improved model parameter transferability method for hydrological simulation with SWAT in Ungauged Mountainous Catchments. Sustainability 2020, 12, 3551. [Google Scholar] [CrossRef]
  36. Johnson, L.; Richards, C.; Host, G.; Arthur, J. Landscape influences on water chemistry in midwestern stream ecosystems. Freshw. Biol. 1997, 37, 193–208. [Google Scholar] [CrossRef]
  37. Castillo, M.; Morales, H.; Valencia, E.; Morales, J.; Cruz-Motta, J. The effects of human land use on flow regime and water chemistry of headwater streams in the highlands of Chiapas. Knowl. Manag. Aquat. Ecosyst. 2012, 347, 135–152. [Google Scholar] [CrossRef] [Green Version]
  38. Mirhosseini, M.; Farshchi, P.; Noroozi, A.A.; Shariat, M.; Aalesheikh, A.A. Changing land use a threat to surface water quality: A vulnerability assessment approach in Zanjanroud Watershed, Central Iran. Water Resour. 2018, 45, 268–279. [Google Scholar] [CrossRef]
  39. Valle, R.F.; Varanda, S.; Fernandes, L.; Pacheco, F.A.L.; Junior, R.V. Groundwater quality in rural watersheds with environmental land use conflicts. Sci. Total Environ. 2014, 485–486, 110–120. [Google Scholar] [CrossRef] [PubMed]
  40. Gu, Q.; Hu, H.; Ma, L.; Sheng, L.; Yang, S.; Zhang, X.; Zhang, M.; Zheng, K.; Chen, L. Characterizing the spatial variations of the relationship between land use and surface water quality using self-organizing map approach. Ecol. Indic. 2019, 102, 633–643. [Google Scholar] [CrossRef]
  41. Ongley, E.D.; Zhang, X.; Yu, T. Current status of agricultural and rural non-point source pollution assessment in China. Environ. Pollut. 2010, 158, 1159–1168. [Google Scholar] [CrossRef]
  42. Pacheco, F.A.L.; Fernandes, L.S. Environmental land use conflicts in catchments: A major cause of amplified nitrate in river water. Sci. Total Environ. 2016, 548, 173–188. [Google Scholar] [CrossRef]
  43. Rodrigues, V.; Estrany, J.; Ranzini, M.; de Cicco, V.; Martin-Benito, J.M.T.; Hedo, J.; Lucas-Borja, M.E. Effects of land use and seasonality on stream water quality in a small tropical catchment: The headwater of Córrego Água Limpa, São Paulo (Brazil). Sci. Total Environ. 2018, 622–623, 1553–1561. [Google Scholar] [CrossRef] [Green Version]
  44. Patino, R.; Asquith, W.H.; VanLandeghem, M.M.; Dawson, D. Long-term trends in reservoir water quality and quantity in two major river basins of the southern great plains. Lake Reserv. Manag. 2015, 31, 254–279. [Google Scholar]
  45. Ockenden, M.C.; Hollaway, M.J.; Beven, K.J.; Collins, A.L.; Evans, R.; Falloon, P.D.; Forber, K.J.; Hiscock, K.M.; Kahana, R.; Macleod, C.J.A.; et al. Major agricultural changes required to mitigate phosphorus losses under climate change. Nat. Commun. 2017, 8, 161. [Google Scholar] [CrossRef] [Green Version]
  46. Carbeck, J. Smarter Fertilizers Can Reduce Environmental Contamination, Scientific American. 2019. Available online: https://www.scientificamerican.com/article/smarter-fertilizers-can-reduce-environmental-contamination (accessed on 2 May 2023).
  47. Brooks, P.D.; Lemon, M.M. Spatial variability in dissolved organic matter and inorganic nitrogen concentrations in a semiarid stream, San Pedro River, Arizona. J. Geophys. Res. 2007, 112, G03S05. [Google Scholar] [CrossRef]
  48. Tu, J. Combined impact of climate and land use changes on streamflow and water quality in eastern Massachusetts, USA. J. Hydrol. 2009, 379, 268–283. [Google Scholar] [CrossRef]
  49. Gervasio, M.P.; Soana, E.S.; Granata, T.; Colombo, D.; Castaldelli, G. An unexpected negative feedback between climate change and eutrophication: Higher temperatures increase denitrification and buffer nitrogen loads in the Po River (Northern Italy). Environ. Res. Lett. 2022, 17, 084031. [Google Scholar] [CrossRef]
  50. Sertel, E.; Imamoglu, M.Z.; Cuceloglu, G.; Erturk, A. Impacts of land cover/use changes on hydrological processes in a rapidly urbanizing mid-latitude water supply catchment. Water 2019, 11, 1075. [Google Scholar] [CrossRef] [Green Version]
  51. Zeiger, S.; Owe, M.R.; Pavlowsk, R.T. Simulating nonpoint source pollutant loading in a karst basin: A swat modeling application. Sci. Total Environ. 2021, 785, 147295. [Google Scholar] [CrossRef]
  52. Abdullah, S.S. Study in the Shatt Al-Arab River Load in the City of Basrah. Master’s Thesis, Marine Science Centre, University of Basrah, Basrah, Iraq, 1990. [Google Scholar]
  53. UN-ESCWA and BGR (United Nations Economic and Social Commission for Western Asia; Bundesanstalt für Geowissenschaften und Rohstoffe). Inventory of Shared Water Resources in Western Asia. Beirut. 2013. Available online: https://waterinventory.org/sites/waterinventory.org/files/chapters/Chapter-05-Shatt-al-Arab-Karkheh-and-Karun-Rivers-web_0.pdf (accessed on 21 May 2023).
  54. Moyel, M. Assessment of water quality of the Shatt al-Arab River, using multivariate statistical technique. Mesop. Environ. J. 2014, 1, 39–46. [Google Scholar]
  55. Rahi, K. Salinity Management in the Shatt Al-Arab River. Int. J. Eng. Technol. 2018, 7, 128–133. [Google Scholar] [CrossRef]
  56. Hussain, N.A.; Karim, H.H.; Al-Saad, H.T.; Yousif, O.H.; Al-Saboonchi, A.A. Shatt Al-Arab Fundamental Scientific; University of Basrah, Marine Science Centre: Basra, Iraq, 1990; p. 391. [Google Scholar]
  57. Yaacoub, R.R. The Meteorology in Arabian Gulf: Arabian Gulf-Selected Scientific Studies; Marine Science Center, Dar Al-Hekma Publishing House, University of Basrah: Basra, Iraq, 1986. [Google Scholar]
  58. Country Data Info. Available online: https://www.laenderdaten.info/ (accessed on 6 December 2020).
  59. Allafta, H.; Opp, C. GIS–based Multi–Criteria Analysis for Flood Prone Areas Mapping in the Trans–boundary Shatt Al-Arab Basin, Iraq–Iran. Geomat. Nat. Hazards Risk 2021, 12, 2087–2116. [Google Scholar] [CrossRef]
  60. Earthdata Search. Available online: https://search.earthdata.nasa.gov/search (accessed on 2 May 2023).
  61. Food and Agriculture Organization (FAO). Available online: http://www.fao.org/geonetwork/srv/en/metadata.show%3Fid=14116 (accessed on 2 May 2023).
  62. SWAT Soil Data. Available online: http://www.indiaremotesensing.com/p/s.html (accessed on 2 May 2023).
  63. Earth Explorer’s Land Cover Data. Available online: https://earthexplorer.usgs.gov/ (accessed on 2 May 2023).
  64. Enderle, D.; Weih, R. Integrating supervised and unsupervised classification methods to develop a more accurate land cover classification. J. Ark. Acad. Sci. 2005, 59, 65–73. Available online: http://scholarworks.uark.edu/jaas/vol59/iss1/10 (accessed on 27 May 2023).
  65. POWER, Data Access Viewer. Available online: https://power.larc.nasa.gov/data-access-viewer/ (accessed on 2 May 2023).
  66. Arnold, J.G.; Srinivasan, R.; Muttiah, R.S.; Williams, J.R. Large area hydrologic modeling and assessment part I: Model development. J. Am. Water Res. Assoc. 1998, 34, 73–89. [Google Scholar] [CrossRef]
  67. Sisay, E.; Halefom, A.; Khare, D.; Singh, L.; Worku, T. Hydrologicalmodelling of ungauged urban watershed using SWAT model. Model. Earth Syst. Environ. 2017, 3, 693–702. [Google Scholar] [CrossRef]
  68. Jaynes, D.B.; Colvin, T.S.; Karlen, D.L.; Cambardella, C.A.; Meek, D.W. Nitrate Loss in Subsurface Drainage as Affected by Nitrogen Fertilizer Rate. J. Environ. Qual. 2001, 30, 1305–1314. [Google Scholar] [CrossRef] [PubMed]
  69. Xu, Z.; Zhang, X.; Xie, J.; Yuan, G.; Tang, X.; Sun, X.; Yu, G. Total Nitrogen Concentrations in Surface Water of Typical Agro- and Forest Ecosystems in China, 2004–2009. PLoS ONE 2014, 9, e92850. [Google Scholar] [CrossRef] [PubMed]
  70. Smith, V.H.; Tilman, G.D.; Nekola, J.C. Eutrophication: Impacts of excess nutrient inputs on freshwater, marine, and terrestrial ecosystems. Environ. Pollut. 1999, 100, 179–196. [Google Scholar] [CrossRef]
  71. Chichester, F.W.; Richardson, C.W. Sediment and nutrient loss from clay soils as affected by tillage. J. Environ. Qual. 1992, 21, 587–590. [Google Scholar] [CrossRef]
  72. Franklin, D.H.; Truman, C.C.; Potter, T.L.; Bosch, D.D.; Strickland, T.C.; Jenkins, M.B.; Nuti, R.C. Nutrient losses in runoff from conventional and no-till pearlmillet on pre-wetted Ultisols fertilized with broiler litter. Agric. Water Manag. 2012, 113, 38–44. [Google Scholar] [CrossRef]
  73. Issaka, F.; Zhang, Z.; Zhao, Z.Q.; Asenso, E.; Li, J.H.; Li, Y.T.; Wang, J.J. Sustainable conservation tillage improves soil nutrients and reduces nitrogen and phosphorous losses in maize farmland in southern China. Sustainability 2019, 11, 2397. [Google Scholar] [CrossRef] [Green Version]
  74. Sharpley, A.N.; Smith, S.J. Wheat tillage and water quality in the Southern Plains. Soil Tillage Res. 1994, 30, 33–48. [Google Scholar] [CrossRef]
  75. Pulighe, G.; Bonati, G.; Colangeli, M.; Traverso, L.; Lupia, F.; Altobelli, F.; Marta, A.D.; Napoli, M. Predicting Streamflow and Nutrient Loadings in a Semi-Arid Mediterranean Watershed with Ephemeral Streams Using the SWAT Model. Agronomy 2020, 10, 2. [Google Scholar] [CrossRef] [Green Version]
  76. Ator, S.W.; Brakebill, J.W.; Blomquist, J.D. Sources, Fate, and Transport of Nitrogen and Phosphorus in the Chesapeake Bay Watershed: An Empirical Model; USGS: Reston, VA, USA, 2011. [Google Scholar] [CrossRef] [Green Version]
  77. Valiela, I.; Bowen, J.L. Nitrogen sources to watersheds and estuaries: Role of land cover mosaics and losses within watersheds. Environ. Pollut. 2002, 118, 239–248. [Google Scholar] [CrossRef]
  78. Groffman, P.M.; Gold, A.J.; Simmons, R.C. Nitrate dynamics in riparian forests: Microbial studies. J. Environ. Qual. 1992, 21, 666–671. [Google Scholar] [CrossRef] [Green Version]
  79. Lowrance, R. Groundwater nitrate and denitrification in a coastal plain riparian forest. J. Environ. Qual. 1992, 21, 401–405. [Google Scholar] [CrossRef]
  80. Groffman, P.M.; Holland, E.; Myrold, D.D.; Robertson, G.P.; Zou, X. Denitrification. In Standard Soil Methods for Long Term Ecological Research; Robertsonn, G.P., Bledsoe, C.S., Coleman, D.C., Sollins, P., Eds.; Oxford University Press: New York, NY, USA, 1999; pp. 272–288. [Google Scholar]
  81. McClain, M.E.; Richey, J.E.; Pimentel, T.P. Groundwater nitrogen dynamics at the terrestriallotic interface of a small catchment in the Central Amazon Basin. Biogeochemistry 1994, 27, 113–127. [Google Scholar] [CrossRef]
  82. Hedin, L.O.; von Fischer, J.C.; Ostrom, N.E.; Kennedy, B.P.; Brown MGRobertson, G.P. Thermodynamic constraints on nitrogen transformations and other biogeochemical processes at soil stream interfaces. Ecology 1998, 79, 684–703. [Google Scholar] [CrossRef] [Green Version]
  83. Hill, A.R.; Devito, K.J.; Campagnolo, S.; Sanmugadas, K. Subsurface denitrification in a forest riparian zone: Interactions between hydrology and supplies of nitrate and organic carbon. Biogeochemistry 2000, 51, 193–223. [Google Scholar] [CrossRef]
  84. Lewis, W.M., Jr.; Melack, J.M.; McDowell, W.H.; McClain, M.; Richey, J.E. Nitrogen yield from undisturbed watersheds in the Americas. Biogeochemistry 1999, 46, 149–162. [Google Scholar] [CrossRef]
  85. Lewis, W.M., Jr. Yield of nitrogen from minimally disturbed watersheds of the United States. Biogeochemistry 2002, 57/58, 375–385. [Google Scholar] [CrossRef]
  86. Lu, C.; Zhang, J.; Tian, H.; Crumpton, W.G.; Helmers, M.J.; Cai, W.J.; Hopkinson, C.S.; Lohrenz, S.E. Increased extreme precipitation challenges nitrogen load management to the Gulf of Mexico. Commun Earth Environ. 2020, 1, 21. [Google Scholar] [CrossRef]
  87. Allafta, H.; Opp, C.; Kolli, M. Combined impact of land cover, precipitation, and catchment area on discharge and phosphorus in the Mississippi basin’s subcatchments. J. Environ. Qual. 2021, 50, 198–214. [Google Scholar] [CrossRef]
  88. Allafta, H.; Opp, C. Understanding the Combined Effects of Land Cover, Precipitation and Catchment Size on Nitrogen and Discharge—A Case Study of the Mississippi River Basin. Water 2022, 14, 865. [Google Scholar] [CrossRef]
  89. Yates, A.G.; Brua, R.B.; Friesen, A.; Reedyk, S.; Benoy, G. Nutrient and suspended solid concentrations, loads, and yields in rivers across the Lake Winnipeg Basin: A twenty year trend assessment. J. Hydrol. Reg. Stud. 2022, 44, 101249. [Google Scholar] [CrossRef]
  90. Thompson, E. How land use affects nutrient pollution in a changing climate. EOS, 4 September 2019. [Google Scholar]
  91. Lane, L.J.; Hernandez, M.; Nichols, M. Processes controlling sediment yield from watersheds as function of spatial scale. Environ. Model. Softw. 1997, 12, 355–369. [Google Scholar] [CrossRef]
  92. Milliman, J.D.; Meade, R.H. World-wide delivery of river sediment to the oceans. J. Geol. 1983, 91, 1–21. [Google Scholar] [CrossRef]
  93. Milliman, J.D.; Syvitski, J.P. Geomorphic/tectonic control of sediment discharge to the ocean: The importance of small mountainous rivers. J. Geol. 1992, 100, 525–544. [Google Scholar] [CrossRef]
  94. de Vente, J.; Poesen, J. Predicting soil erosion and sediment yield at the basin scale: Scale issues and semi-quantitative models. Earth Sci. Rev. 2005, 71, 95–125. [Google Scholar] [CrossRef]
  95. de Vente, J.; Poesen, J.; Arabkhedri, M.; Verstraeten, G. The sediment delivery problem revisited. Prog. Phys. Geogr. 2007, 31, 155–178. [Google Scholar] [CrossRef] [Green Version]
  96. Osterkamp, W.R.; Toy, T.J. Geomorphic considerations for erosion prediction. Environ. Geol. 1997, 29, 152–157. [Google Scholar] [CrossRef]
  97. Mutema, M.; Chaplot, V.; Jewitt, G.; Chivenge, P.; Bloschl, G. Annual water, sediment, nutrient, and organic carbon fluxes in river basins: A global meta-analysis as a function of scale. Water Resour. Res. 2015, 51, 8949–8972. [Google Scholar] [CrossRef] [Green Version]
Figure 1. Study site. Note that the map was drawn based on “GIS-based Multi-Criteria Analysis for Flood-Prone Areas Mapping in the Trans-boundary Shatt Al-Arab Basin, Iraq-Iran” [59].
Applsci 13 08376 g001
Figure 2. (a) LULC; (b) DEM; (c) Soil types based on parent material; and (d) Slope of the Shatt Al-Arab river basin.
Applsci 13 08376 g002
Figure 3. Spatial distribution of the annual TN discharge load in the subbasins of the Shatt Al-Arab river basin.
Applsci 13 08376 g003
Figure 4. Spatial distribution of the annual TP discharge load in the subbasins of the Shatt Al-Arab river basin.
Applsci 13 08376 g004
Figure 5. (a) The relationship between the developed cover (urban and agricultural land covers) in 25 subbasins and the corresponding mean annual TN discharge load for 18 years (2004–2021). (b) The relationship between the developed cover (urban and agricultural land covers) in 25 subbasins and the corresponding mean annual TP discharge load for 18 years (2004–2021).
Applsci 13 08376 g005
Figure 6. The RDA analysis diagram displays the correlation between the LULC factors and the annual TN and TP discharge loads. The red arrows indicate the environmental factors (i.e., the ratio of the five land cover classes), and the blue arrows indicate the species (i.e., annual TN and TP discharge loads). A positive correlation is expected when the arrows of two variables point in the same direction, and a negative correlation exists when the arrows of two variables point in opposite directions.
Applsci 13 08376 g006
Figure 7. (a) The relationship between the annual flow volume and the annual TN discharge load for 25 subbasins for 18 years (2004–2021). (b) The relationship between the annual flow volume and the annual TP discharge load for 25 subbasins for 18 years (2004–2021).
Applsci 13 08376 g007
Figure 8. (a) The relationship between the subbasin area for 25 subbasins and the corresponding mean annual TN discharge load for 18 years (2004–2021). (b) The relationship between the subbasin area for 25 subbasins and the corresponding mean annual TP discharge load for 18 years (2004–2021).
Applsci 13 08376 g008
Table 1. Input data used for the Soil and Water Assessment Tool (SWAT) model.
Data TypeResolutionData DescriptionData Source
DEM30 m × 30 mElevation and slope[60]
Soil type250 m × 250 mSoil feature classification[61,62]
LULC30 m × 30 mLand use and land cover classifications[63]
Weather dataMonthly dataPrecipitation, relative humidity, temperature, solar radiation, and wind speed[65]
Table 2. Parameters and their ranges used for the Soil and Water Assessment Tool (SWAT) model.
Parameter Range
MinimumMaximum
A_GWQMN.gw Threshold depth of water in the shallow aquifer required for return flow to occur (mm). 01000
V-GW-REVAP.gw Groundwater “revap” coefficient has effects on the amount of water that recharges the capillary fringe after evaporation during dry periods. The capillary fringe is recharged by shallow aquiferz during dry periods. 0.020.2
A_RCHRG_DP.gwDeep aquifer percolation fraction.−0.050.05
A_GW_DELAY.gwGroundwater delay (days).100300
R_CN2.mgtSCS runoff curve number.−0.10.1
R_CH_W2.rteAverage width of the main channel at the top of the bank (m).−0.150.15
R_CH_S2.rteAverage slope of the main channel along the channel length (m/m).−0.150.15
V_CH_N2.rte Manning’s N value for the main channel. 0.010.2
V_CH_K2.rte Effective hydraulic conductivity (mm/h). 010
R_CH_L2.rteLength of the main channel (km).−0.090.012
V_ESCO.hru Soil evaporation compensation factor. 0.700.95
R_OV_N.hruManning’s N value for overland flow.−0.29−0.078
V_SURLAG.,bsnSurfac runoff lag coefficient.5.5414
R_MSK_CO1.bsnThe calibration coefficient is used to control the impact of the storage time constant (km) for normal flow (where normal flow is when the river is at bankfull depth) upon the Km value calculated for the reach.−0.0040.46
R_MSK_CO2.bsnThe calibration coefficient is used to control the impact of the storage time constant (km) for low flow (where low flow is when the river is at 0.1 bankfull depth) upon the Km value calculated for the reach.−0.63−0.01
R_SOL_BD.solMoist bulk density (g/cm3).−0.23−0.07
r-ALPHA_BF.gw Baseflow alpha factor (days). 0.050.13
r_SOL_KSaturated hydraulic conductivity (mm/h).−0.90.9
v_CANMXMaximum canopy storage (mm H2O). 010
r_SOL.AWC.solAvailable water capacity of the soil
layer (mm H2O/mm soil).
−0.30.3
r_SOL_Z.solDepth from the soil surface to the bottom of the layer (mm).−0.30.3
Table 3. Mean annual TN and TP discharge loads (kg km−2 yr−1) of different LULC types.
ParameterWater/WetlandShrub LandUrbanCroplandBarren
TN4343341156999702
TP12282261209159
Disclaimer/Publisher’s Note: The statements, opinions and data contained in all publications are solely those of the individual author(s) and contributor(s) and not of MDPI and/or the editor(s). MDPI and/or the editor(s) disclaim responsibility for any injury to people or property resulting from any ideas, methods, instructions or products referred to in the content.

