
Effects of Lime Content on Road Performance of Low Liquid Limit Clay

Abstract
:1. Introduction
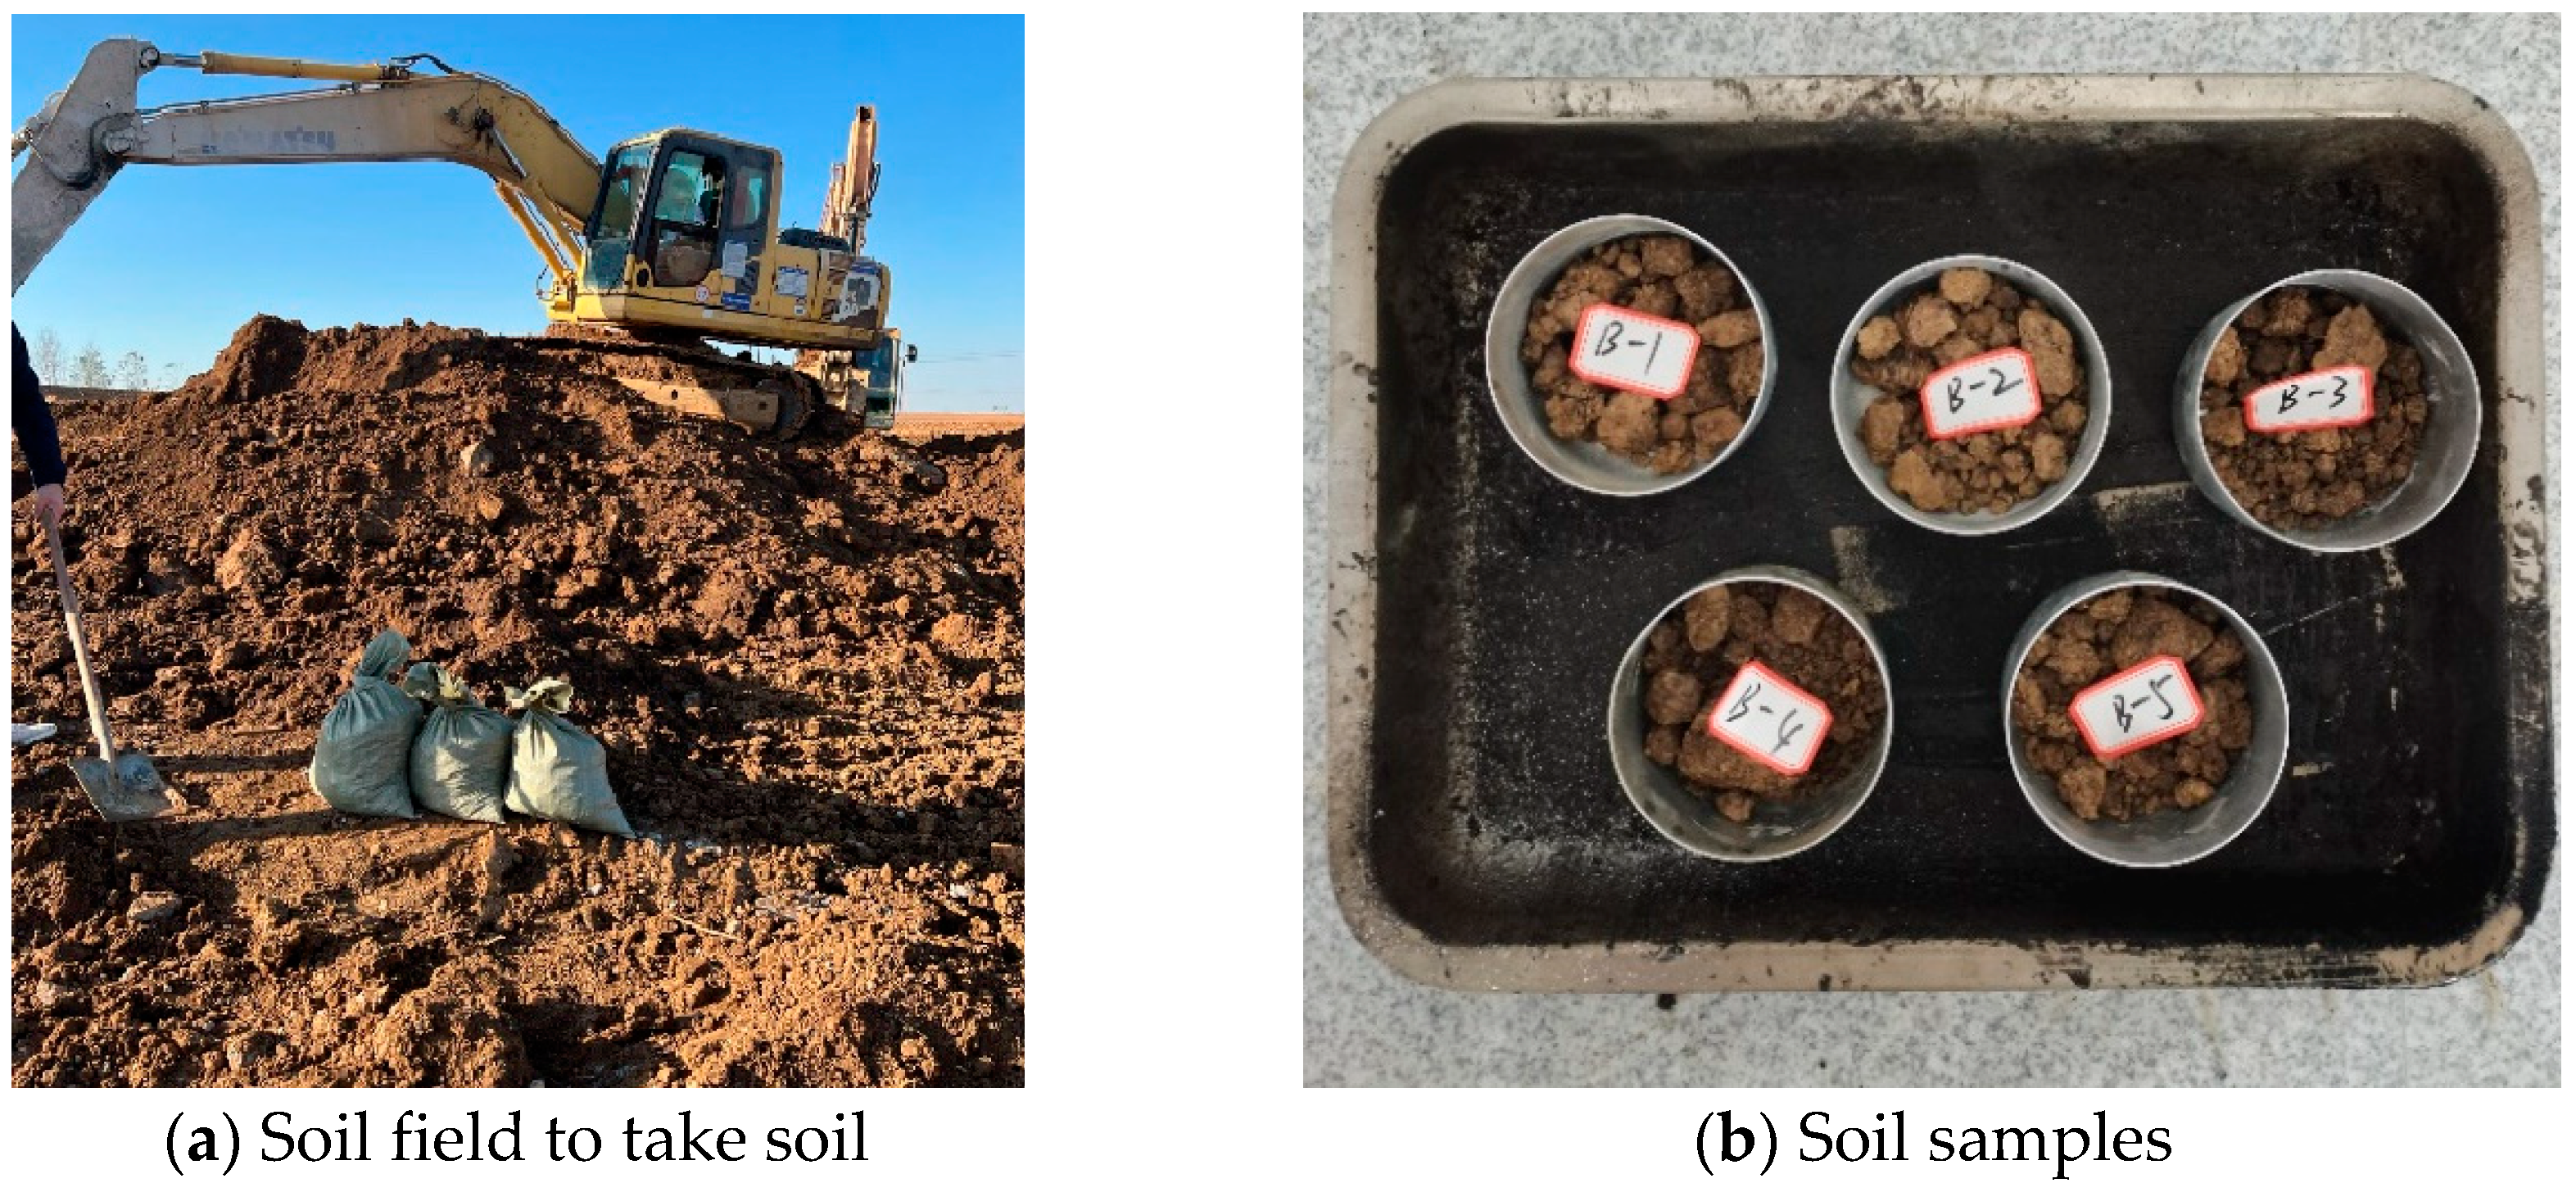
2. Testing Program
2.1. Basic Properties of Low Liquid Limit Clay
- (1)
- Natural moisture content
- (2)
- Particle grading
2.2. Preparation of Digestion Lime
2.3. Test Scheme
2.4. Test Method
3. Test Results and Analysis
3.1. Limit Moisture Content
3.2. Compaction Test
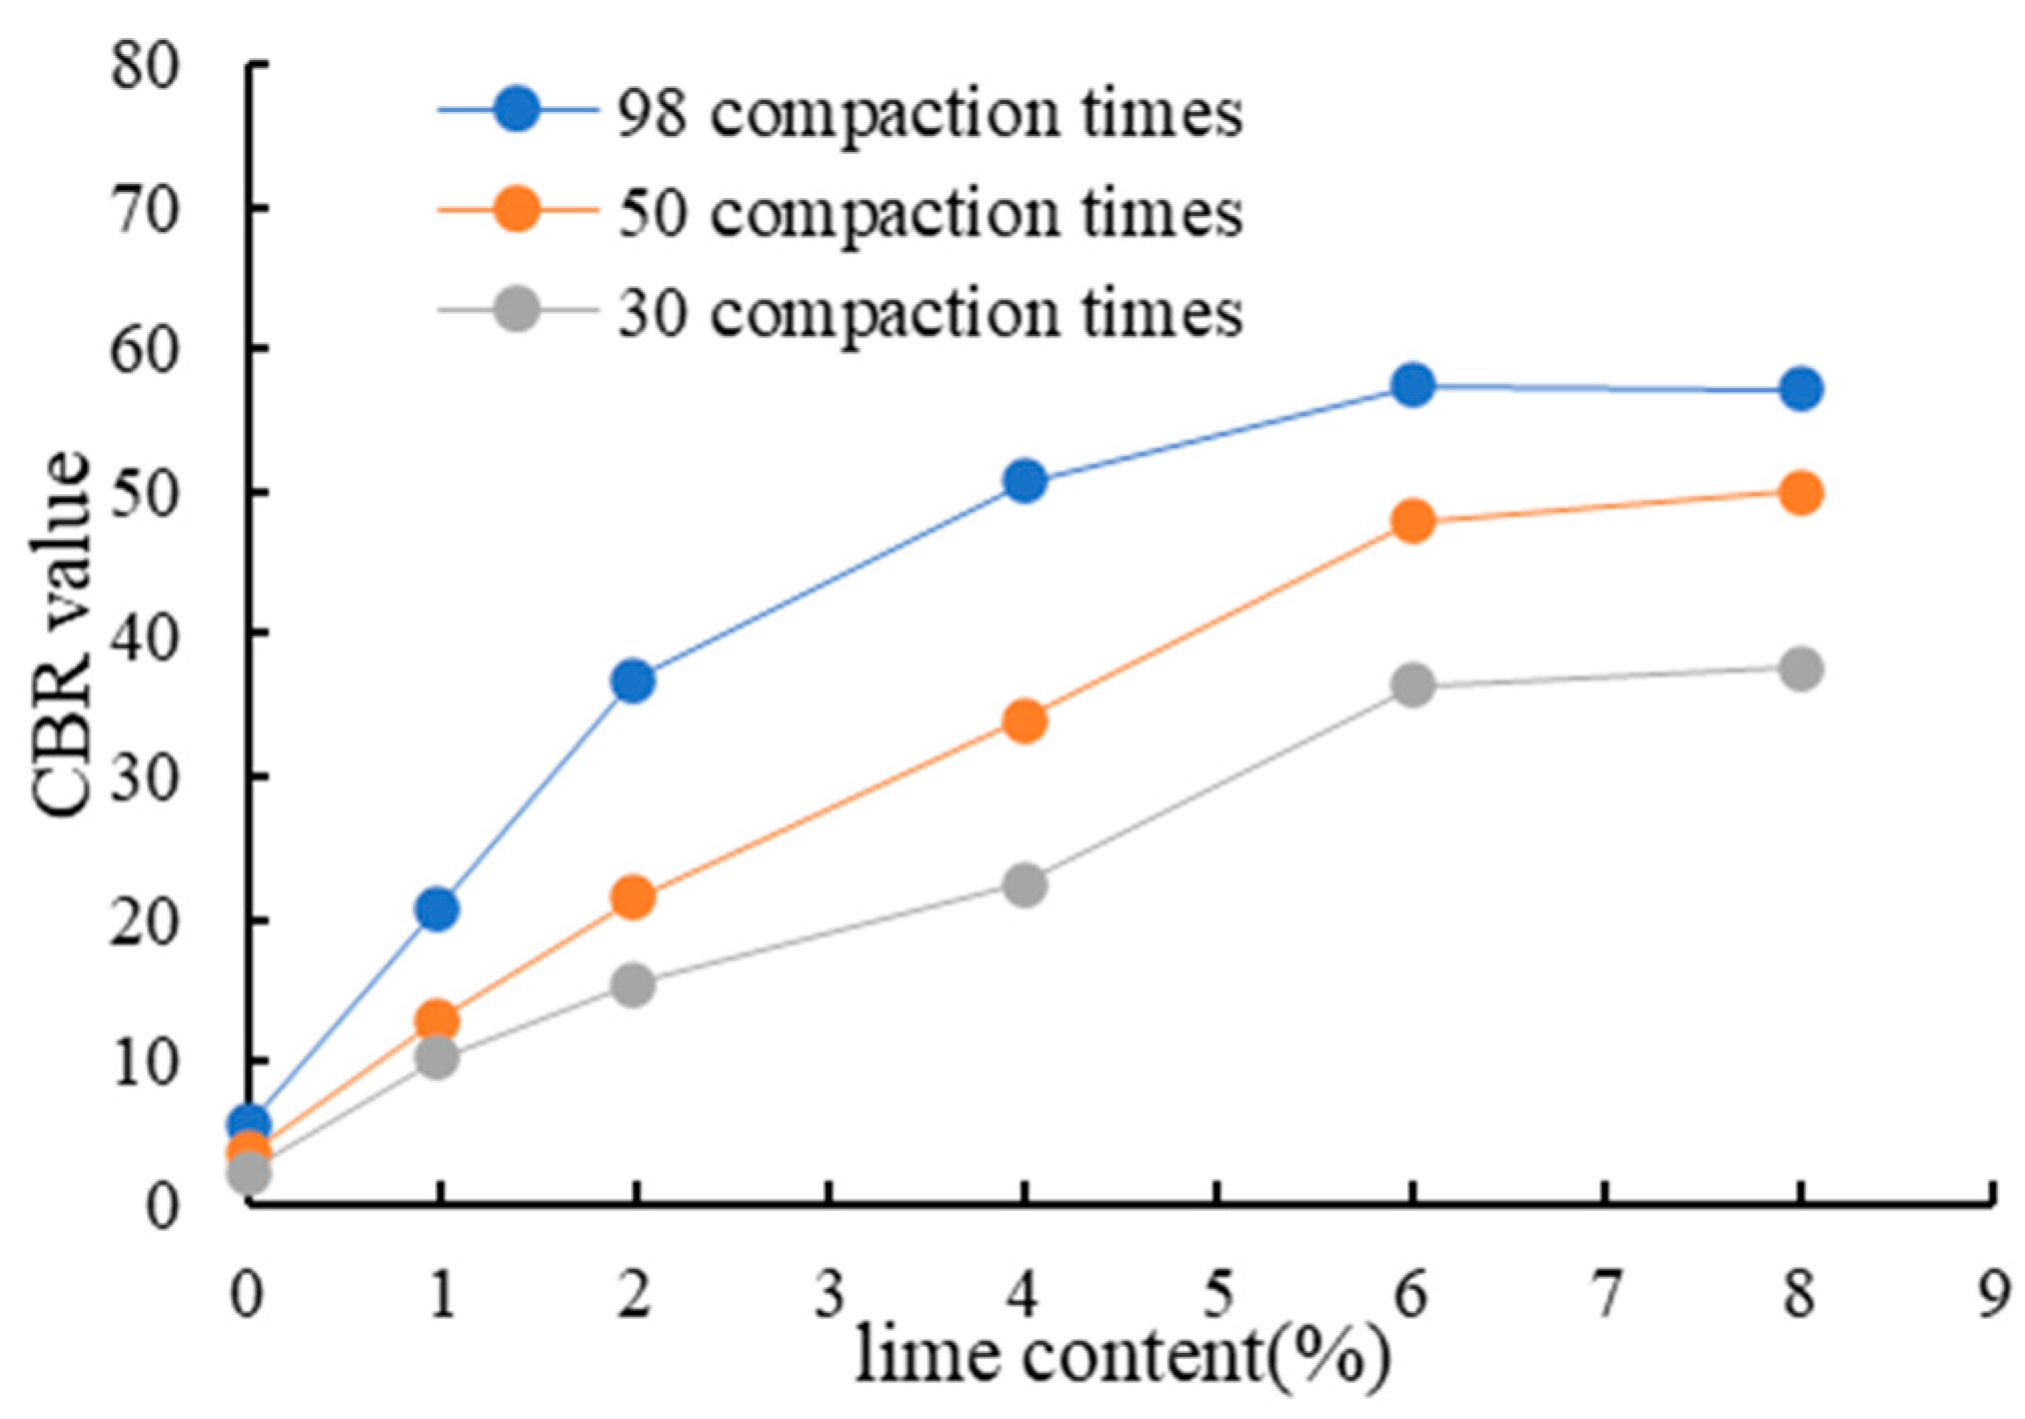
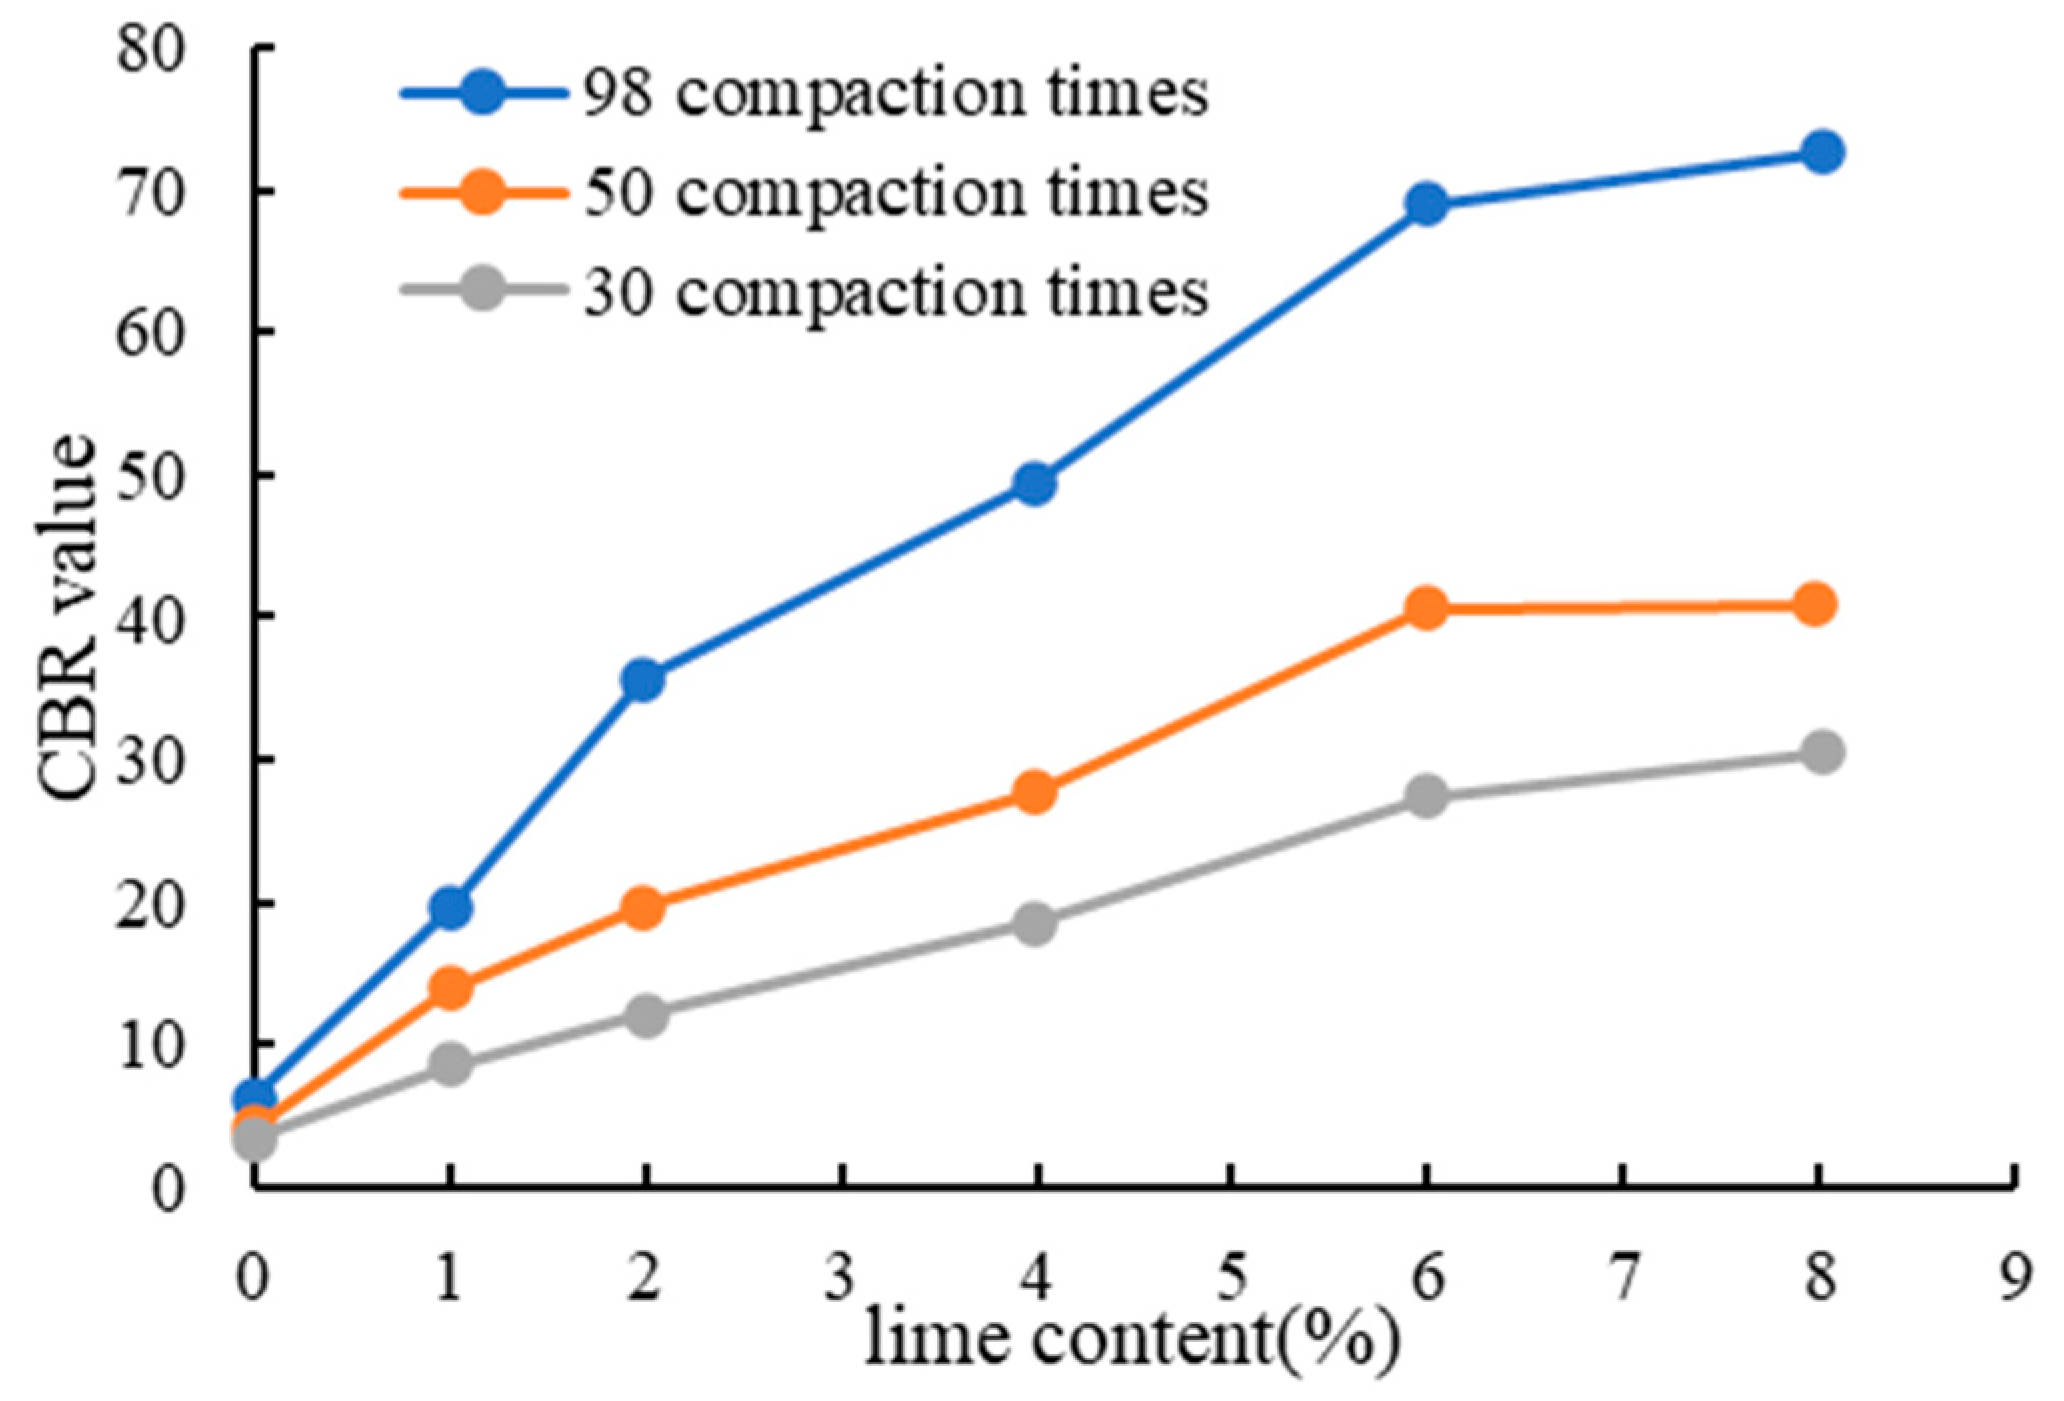
3.3. CBR
4. Discussions
5. Conclusions
- After lime digestion improves the initial low liquid limit clay, the liquid limit essentially stays the same, the plastic limit increases as the lime content rises, and the plastic index gradually declines. After lime is introduced to the soil, ions from the lime and the soil exchange, causing the clay particles to form a granular structure. The rise in the plastic limit often remains steady once the lime content reaches 6%. It is also shown that a low liquid limit clay mixture with lime has a reasonable ash concentration of about 6%. When the lime content is 6%, the maximum dry densities are 1.61 g/cm3, 1.65 g/cm3, and 1.73 g/cm3, respectively. The optimal water content was 16.7%, 17.2%, and 17.4%, respectively.
- The CBR value of the soil samples under various compaction durations considerably rose with an increase in ash content, showing that ash mixing had improved the water stability of low liquid limit clay containing sand. The acceptable ash content is 6% at the same time. When the lime content is 6% and the compaction times are 98, the CBR values are 57.4%, 54.2%, and 68.9%, respectively.
- The ideal water content and CBR value of the clay with low liquid limit are clearly impacted by the amount of dissolved lime added. The ideal water content falls as the incorporation amount increases, while the CBR value rises.
- Plain soil does not meet the filling requirements of subgrade in areas 93, 94, and 96 of expressways. The performance of the improved soil has been improved to varying degrees after the ash mixing improvement, and it can meet the filling requirements of subgrade in areas 93, 94, and 96. According to the test, the most reasonable ash mixing amount of the improved soil is determined to be 6%.
Author Contributions
Funding
Data Availability Statement
Conflicts of Interest
References
- Zhang, J.; Chen, Y.; Wu, H. Measurement of water content of red clays using X-ray CT. Intl. J. E Sci. Eng. 2015, 8, 31–35. [Google Scholar]
- Zhang, J.; Jiang, Q.; Zhang, Y.; Dai, L.; Zheng, J. Nondestructive measurement of water content and moisture migration of unsaturated red clays in South China. Adv. Mater. Sci. Eng. 2015, 2015, 542538. [Google Scholar] [CrossRef] [Green Version]
- Zhang, J.; Li, F.; Zeng, L.; Peng, J.; Li, J. Numerical simulation of the moisture migration of unsaturated clay embankments in southern China considering stress state. Bull. Eng. Geol. Environ. 2020, 80, 11–24. [Google Scholar] [CrossRef]
- Zhang, J.; Peng, J.; Zheng, J.; Yao, Y. Predicting moisture-dependent resilient modulus for compacted clays in south China. In Proceedings of the Transportation Research Board 97th Annual Meeting, Washington, DC, USA, 7–11 January 2018. [Google Scholar]
- Shimobe, S.; Karakan, E.; Sezer, A. Improved dataset for establishing novel relationships between compaction characteristics and physical properties of soils. Bull. Eng. Geol. Environ. 2021, 80, 8633–8663. [Google Scholar] [CrossRef]
- Karakan, E.; Demir, S. Effect of fines content and plasticity on undrained shear strength of quartz-clay mixtures. Arab. J. Geosci. 2018, 11, 743. [Google Scholar] [CrossRef]
- Di Sante, M.; Evelina, F.; Francesco, M.; Virginia, B. Influence of delayed compaction on the compressibility and hydraulic conductivity of soil-lime mixtures. Eng. Geol. 2015, 185, 131–138. [Google Scholar] [CrossRef]
- Li, J.; Zhang, J.; Yang, X. Monte Carlo simulations of deformation behaviour of unbound granular materials based on a real aggregate library. Int. J. Pavement Eng. 2023, 24, 2165650. [Google Scholar] [CrossRef]
- Peng, J.; Hu, H.; Zhang, J. Rapid testing and prediction of soil-water characteristic curve of subgrade soils considering stress state and degree of compaction. J. Rock Mech. Geotech. Eng. 2023. [Google Scholar] [CrossRef]
- Gao, Y.; Qian, H.; Li, X.; Chen, J.; Jia, H. Effects of lime treatment on the hydraulic conductivity and microstructure of loess. Environ. Earth Sci. 2018, 77, 529. [Google Scholar] [CrossRef]
- Al-Mukhtar, M.; Khattab, S.; Jean-Francois, A. Microstructure and geotechnical properties of lime-treated expansive clayey soil. Eng. Geol. 2012, 139–140, 17–27. [Google Scholar] [CrossRef]
- Bao, W.; Wang, H.; Lai, H.; Chen, R. Experimental study on strength characteristics and internal mineral changes of Lime-stabilized loess under High-Temperature. Constr. Build. Mater. 2022, 351, 128945. [Google Scholar] [CrossRef]
- Eades, J.L.; Grim, R.E. Reaction of Hydrated Lime with Pure Clay Minerals in Soil Stabilization; Highway Research Board Bulletin: Washington, DC, USA, 1960. [Google Scholar]
- Ali, H.; Mohamed, M. The effects of compaction delay and environmental temperature on the mechanical and hydraulic properties of lime-stabilized extremely high plastic clays. Appl. Clay Sci. 2017, 150, 333–341. [Google Scholar] [CrossRef]
- Al-Mukhtar, M.; Abdelmadjid, L.; Alcover, J.-F. Lime consumption of different clayey soils. Appl. Clay Sci. 2014, 95, 133–145. [Google Scholar] [CrossRef]
- Malkanthi, S.N.; Balthazaar, N.; Perera, A.A.D.A.J. Lime stabilization for compressed stabilized earth blocks with reduced clay and silt. Case Stud. Constr. Mater. 2019, 12, e00326. [Google Scholar] [CrossRef]
- Noorzad, R.; Motevalian, S. Improvement of Clayey soil with lime and industrial sludge. Geotech. Geol. Eng. 2018, 36, 2957–2966. [Google Scholar] [CrossRef]
- Cao, P.; Wang, F.; Yan, L. Experimental study on CBR value of Lime-improved clay. Chin. J. Rock Mech. Eng. 2011, 33, 305–308. [Google Scholar]
- Ingles, O.; Metcalf, J. Soil Stabilization: Principles and Practice; Butterworths: Sidney, Australia, 1972. [Google Scholar]
- Little, D.N. Fundamentals of the Stabilization of Soil with Lime; National Lime Association: Arlington, VA, USA, 1996; Volume 332, pp. 1–20. [Google Scholar]
- Boardman, D.; Glendinning, S.; Rogers, C.D.F. Development of stabilisation and solidification in lime–clay mixes. Geotechnique 2001, 51, 533–543. [Google Scholar] [CrossRef]
- Rao, S.M.; Shivananda, P. Role of curing temperature in progress of lime-soil reactions. Geotech. Geol. Eng. 2005, 23, 79–85. [Google Scholar] [CrossRef]
- Amer, A.; Mattheus, F. Expansive Soils: Recent Advances in Characterization and Treatment; Taylor & Francis Group/Balkema: London, UK, 2006. [Google Scholar]
- Muzahim, A.; Abdelmadjid, L.; Alcover, J.-F. Behaviour and mineralogy changes in lime-treated expansive soil at 20 °C. Appl. Clay Sci. 2010, 50, 191–198. [Google Scholar]
- Olivier, C.; Jean-Claude, A.; Tangi-Le, B.; Dimitri, D. Microstructure and hydraulic conductivity of a compacted lime-treated soil. Eng. Geol. 2011, 123, 187–193. [Google Scholar]
- Wang, Y.; Cao, D. Experimental study on CBR value of modified expansive soil. Chin. J. Rock Mech. Eng. 2004, S1, 4396–4399. [Google Scholar]
- Raheem, A.A.; Bello, O.A.; Makinde, O.A. A comparative study of cement and lime stabilized lateritic interlocking blocks. Pac. J. Sci. Technol. 2010, 11, 27–34. [Google Scholar]
- Rafael, A.; Pedro, M.; Jacobo, M.; Delia, C.-A.; Yadira, G.-P. The use of sugarcane bagasse ash and lime to improve the durability and mechanical properties of compacted soil blocks. Constr. Build. Mater. 2012, 34, 296–305. [Google Scholar]
- Guettala, A.; Houari, H.; Mezghiche, B.; Chebili, R. Durability of lime stabilized earth blocks. Courrier du Savoir 2002, 2, 61–66. [Google Scholar]
- Ngowi, A.B. Improving the traditional earth construction: A case study of Botswana. Constr. Build. Mater. 1997, 11, 1–7. [Google Scholar] [CrossRef]
- Akpokodje, E.G. The stabilization of some arid zone soils with cement and lime. Q. J. Eng. Geol. Hydrogeol. 1985, 18, 173–180. [Google Scholar] [CrossRef]
- Bogas, J.A.; Silva, M.; Gomes, M.D.G. Unstabilized and stabilized compressed earth. blocks with partial Incorporation of recycled aggregates. Int. J. Archit. Herit. 2018, 13, 569–584. [Google Scholar] [CrossRef]


| Application | Optimum Content | |
|---|---|---|
| Literature [28] | CSEB | 28% |
| Literature [29] | Sand and clay | 8% |
| Literature [30] | CSEB | 15% |
| Literature [31] | Clay and silt | 6–12% |
| Literature [32] | 6–12% |
| Sample | Sample Moisture Content (%) | |||||
|---|---|---|---|---|---|---|
| 1 | 2 | 3 | 4 | 5 | Average | |
| A | 24.8 | 23.3 | 25.2 | 28.1 | 29.1 | 26.1 |
| B | 25.7 | 25.4 | 25.5 | 22.7 | 24.2 | 24.7 |
| C | 20.6 | 21.9 | 20.2 | 20.3 | 24.0 | 21.4 |
| Lime Content of Soil Sample A | Lime Content of Soil Sample B | Lime Content of Soil Sample C | |
|---|---|---|---|
| Water ratio limit test | 0%, 1%, 2%, 4%, 6%, 8% | 0%, 1%, 2%, 4%, 6%, 8% | 0%, 1%, 2%, 4%, 6%, 8% |
| compaction test | 0%, 1%, 2%, 4%, 6%, 8% | 0%, 1%, 2%, 4%, 6%, 8% | 0%, 1%, 2%, 4%, 6%, 8% |
| CBR | 0%, 1%, 2%, 4%, 6%, 8% | 0%, 1%, 2%, 4%, 6%, 8% | 0%, 1%, 2%, 4%, 6%, 8% |
Disclaimer/Publisher’s Note: The statements, opinions and data contained in all publications are solely those of the individual author(s) and contributor(s) and not of MDPI and/or the editor(s). MDPI and/or the editor(s) disclaim responsibility for any injury to people or property resulting from any ideas, methods, instructions or products referred to in the content. |
© 2023 by the authors. Licensee MDPI, Basel, Switzerland. This article is an open access article distributed under the terms and conditions of the Creative Commons Attribution (CC BY) license (https://creativecommons.org/licenses/by/4.0/).
Share and Cite
Zhang, J.; Li, H.; Peng, J.; Zhang, Z. Effects of Lime Content on Road Performance of Low Liquid Limit Clay. Appl. Sci. 2023, 13, 8377. https://doi.org/10.3390/app13148377
Zhang J, Li H, Peng J, Zhang Z. Effects of Lime Content on Road Performance of Low Liquid Limit Clay. Applied Sciences. 2023; 13(14):8377. https://doi.org/10.3390/app13148377
Chicago/Turabian StyleZhang, Jinli, Hai Li, Junhui Peng, and Zhe Zhang. 2023. "Effects of Lime Content on Road Performance of Low Liquid Limit Clay" Applied Sciences 13, no. 14: 8377. https://doi.org/10.3390/app13148377