
Fibre-Microbial Curing Tests and Slope Stability Analysis
Abstract
:1. Introduction
2. Materials and Methods
2.1. Test Soil
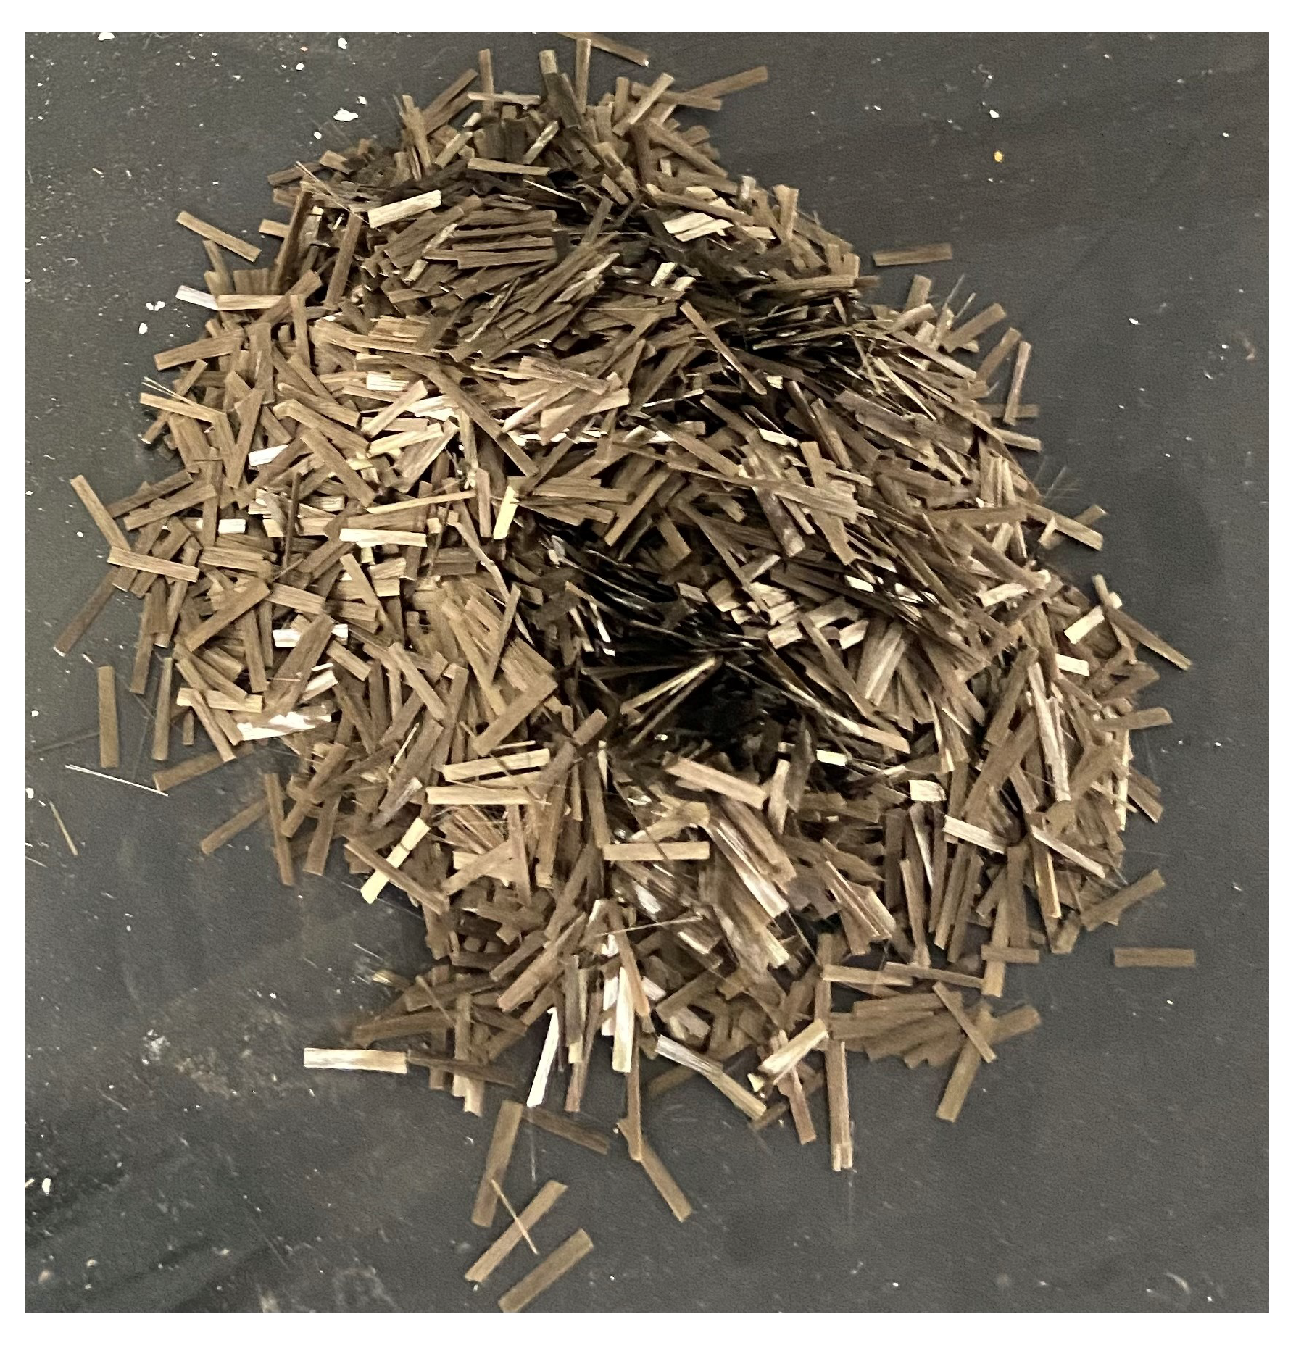
2.2. Test Fibres
2.3. Bacterial Solution for Test
- (1)
- The strain is added to sterile water, gently shaken to dissolve, and inoculated on slant medium. After inoculation is complete, it is placed in an incubator for incubation, with the incubator temperature set at 30 °C and time set at 24 h, and finally placed in a refrigerator at 4 °C for backup.
- (2)
- The ingredients were weighed into triangular flasks according to the medium recipe, the agar was heated and melted, and the pH of the medium was adjusted to 7.0 using a solution of sodium hydroxide at a concentration of 1 mol/L. The triangular flask is added with a plunger and wrapped and placed in an autoclave for sterilisation, the sterilisation temperature is set at 120 °C, and the sterilisation time is set at 30 min.
- (3)
- After autoclaving, the triangular flasks were placed on a sterile operating table to cool. The cultured colonies were inoculated into the agar-free culture medium by aseptic operation and incubated for 36–48 h in an intelligent shaker set at an ambient temperature of 30 °C and a shaker speed of 150 r/min.
2.4. Test Cementing Solution
2.5. Specimen Preparation Steps
- (1)
- The lower bedding block of the test mould was placed into the lower part of the test mould but exposed by approximately 2 cm.
- (2)
- According to the sample preparation standards, four equal portions of soil and basalt short-cut fibre were weighed, and the two were mixed and stirred, layered into the mould, and lightly compacted with a tamping rod to a predetermined height (20 mm per layer). After the sample was completed, the upper mat with the test mould was placed into the test mould, and the upper mat was exposed to approximately 2 cm.
- (3)
- A peristaltic pump was used to inject 50 mL of bacterial solution at a rate of 5 mL/min, and after standing for 4 h, the same volume of cementing solution was injected at a rate of 10 mL/min and allowed to stand for 6–8 h to ensure that the microorganisms reacted fully within the specimen.
- (4)
- A peristaltic pump was used to inject 50 mL of cementing solution into the specimen at a rate of 10 mL/min at an interval of 12 h. The injection was stopped after reaching a predetermined number of treatments, and water was continuously and slowly injected from the top of the specimen to clean the inside of the specimen to terminate the microbial curing process.
2.6. Test Method
2.6.1. Compressive Strength Test without Lateral Limit
2.6.2. Calcium Carbonate Content Determination Test
2.6.3. Direct Shear Test
3. Results and Discussion
3.1. Stress–Strain Curve
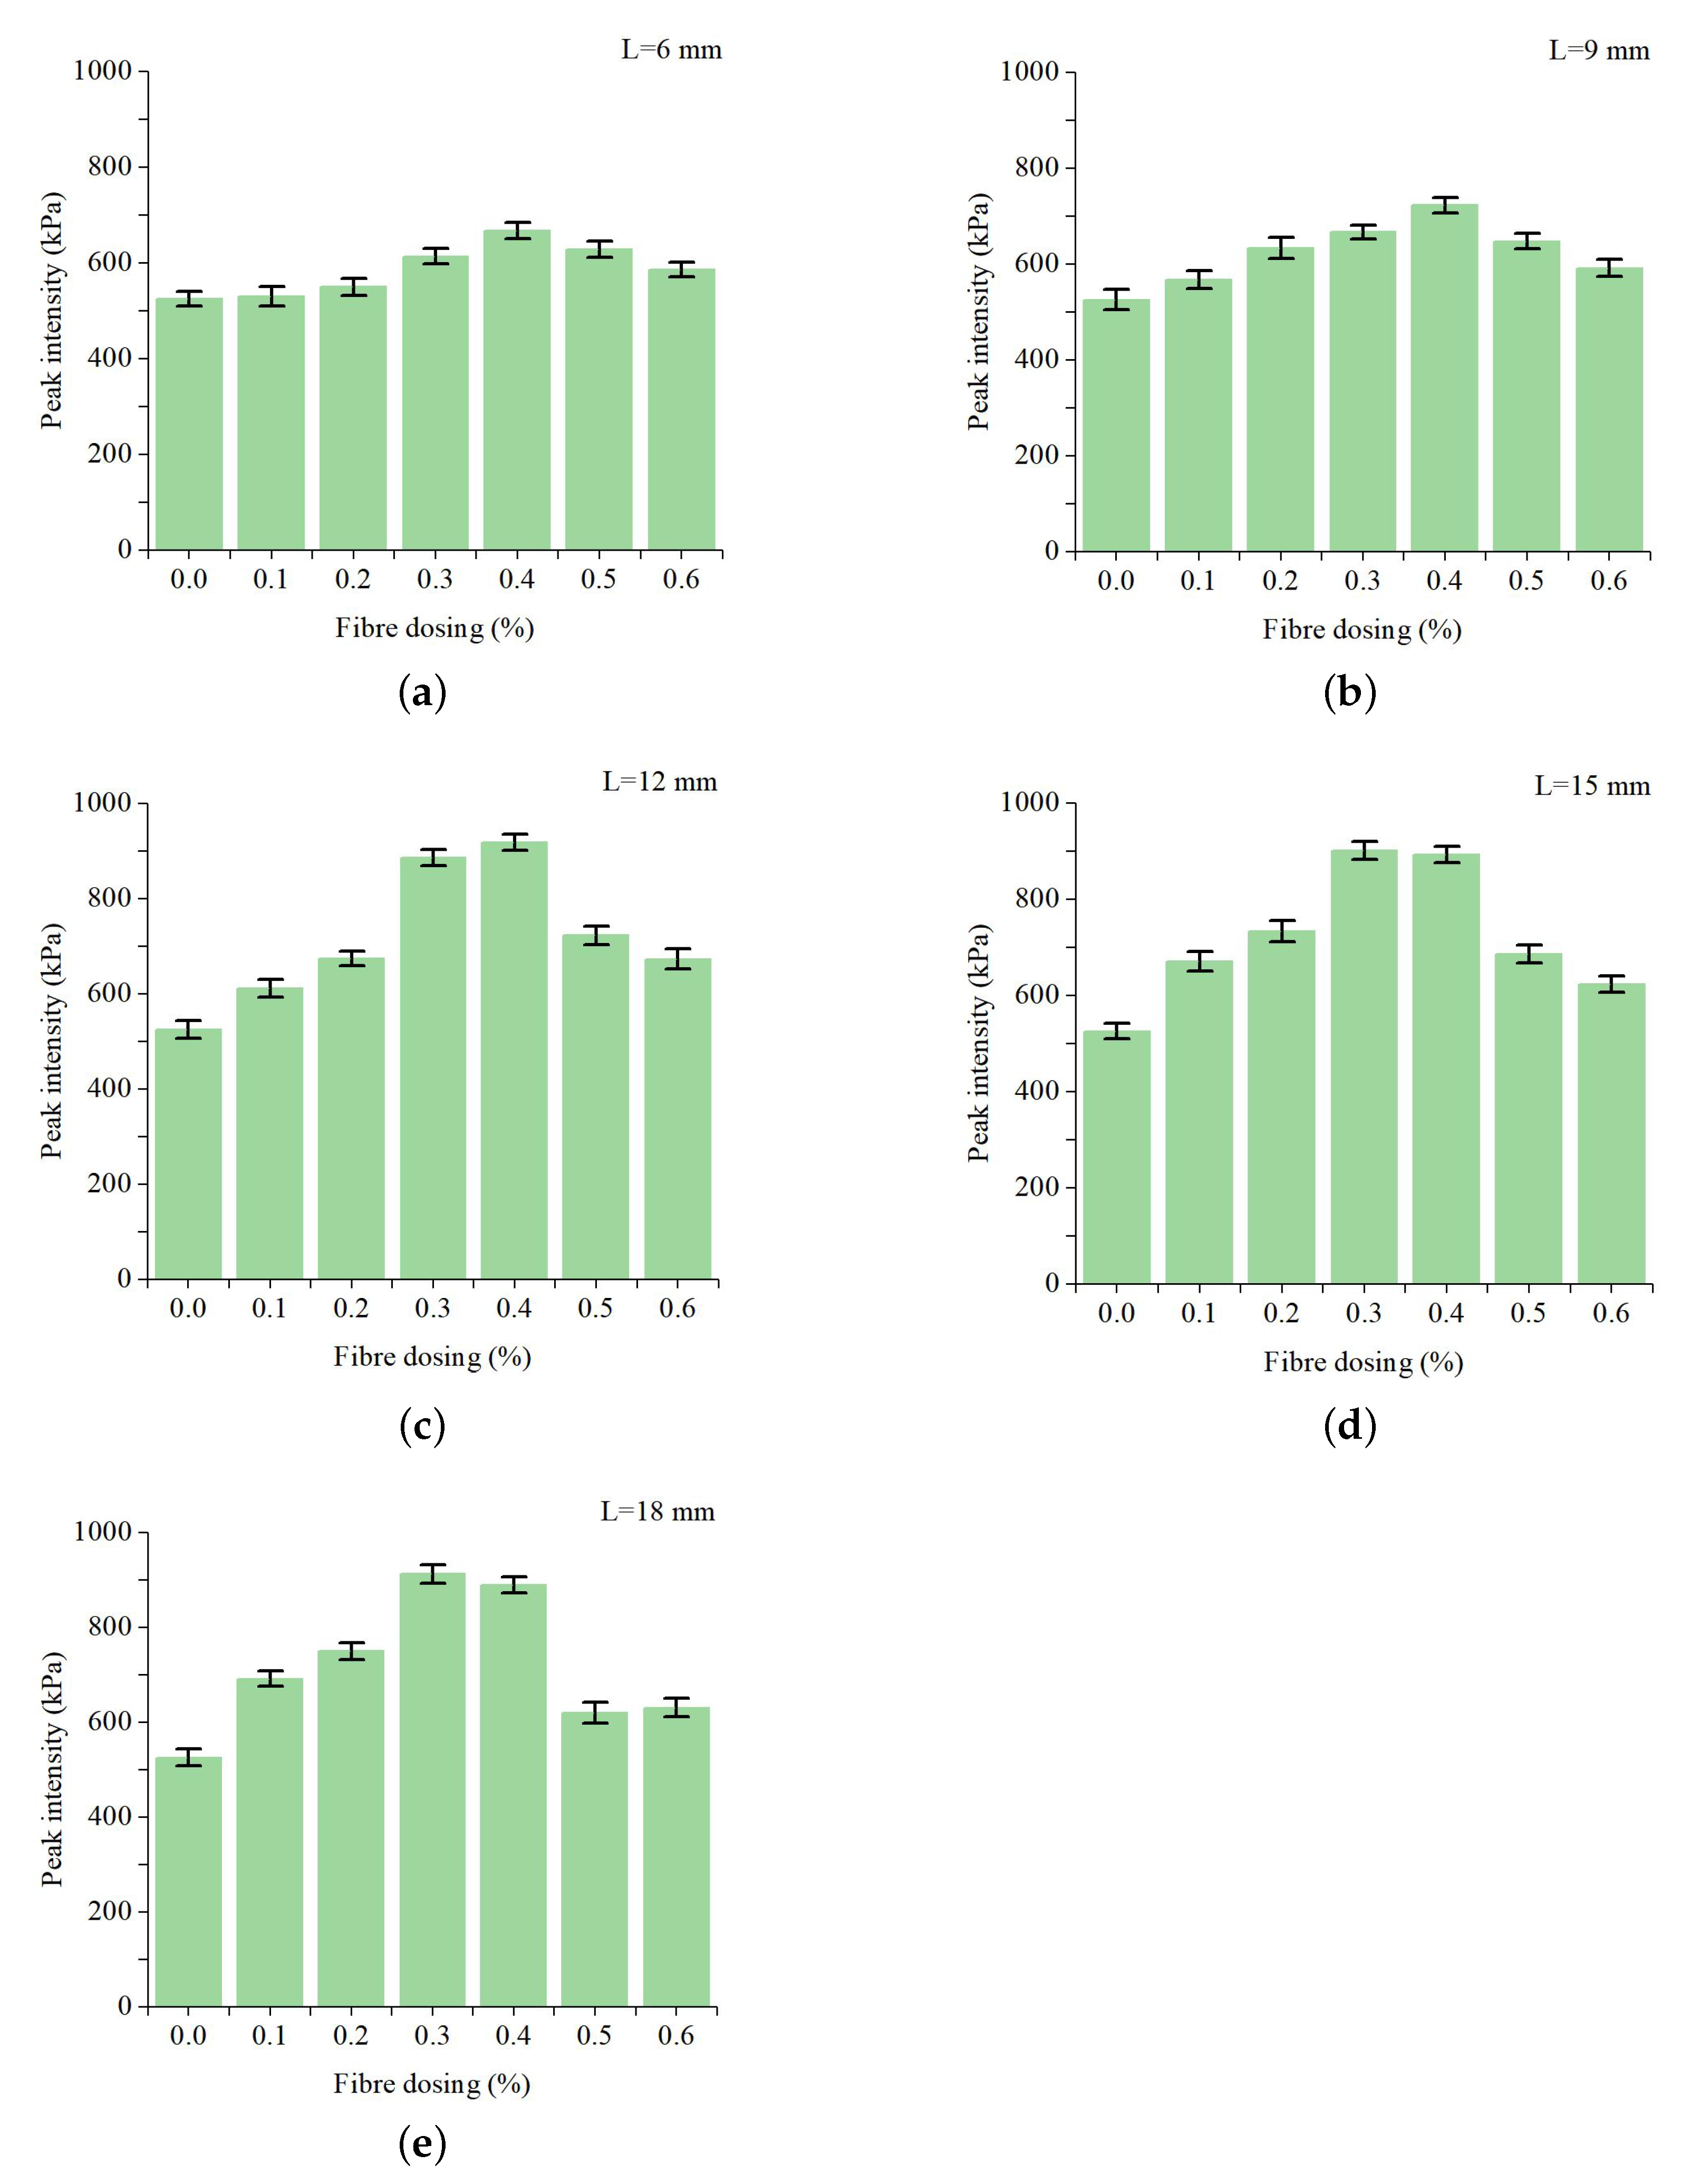
3.2. Effect of Fibre Admixture on Strength of Specimens
3.3. Effect of Fibre Length on Strength of Specimens
3.4. Calcium Carbonate Content
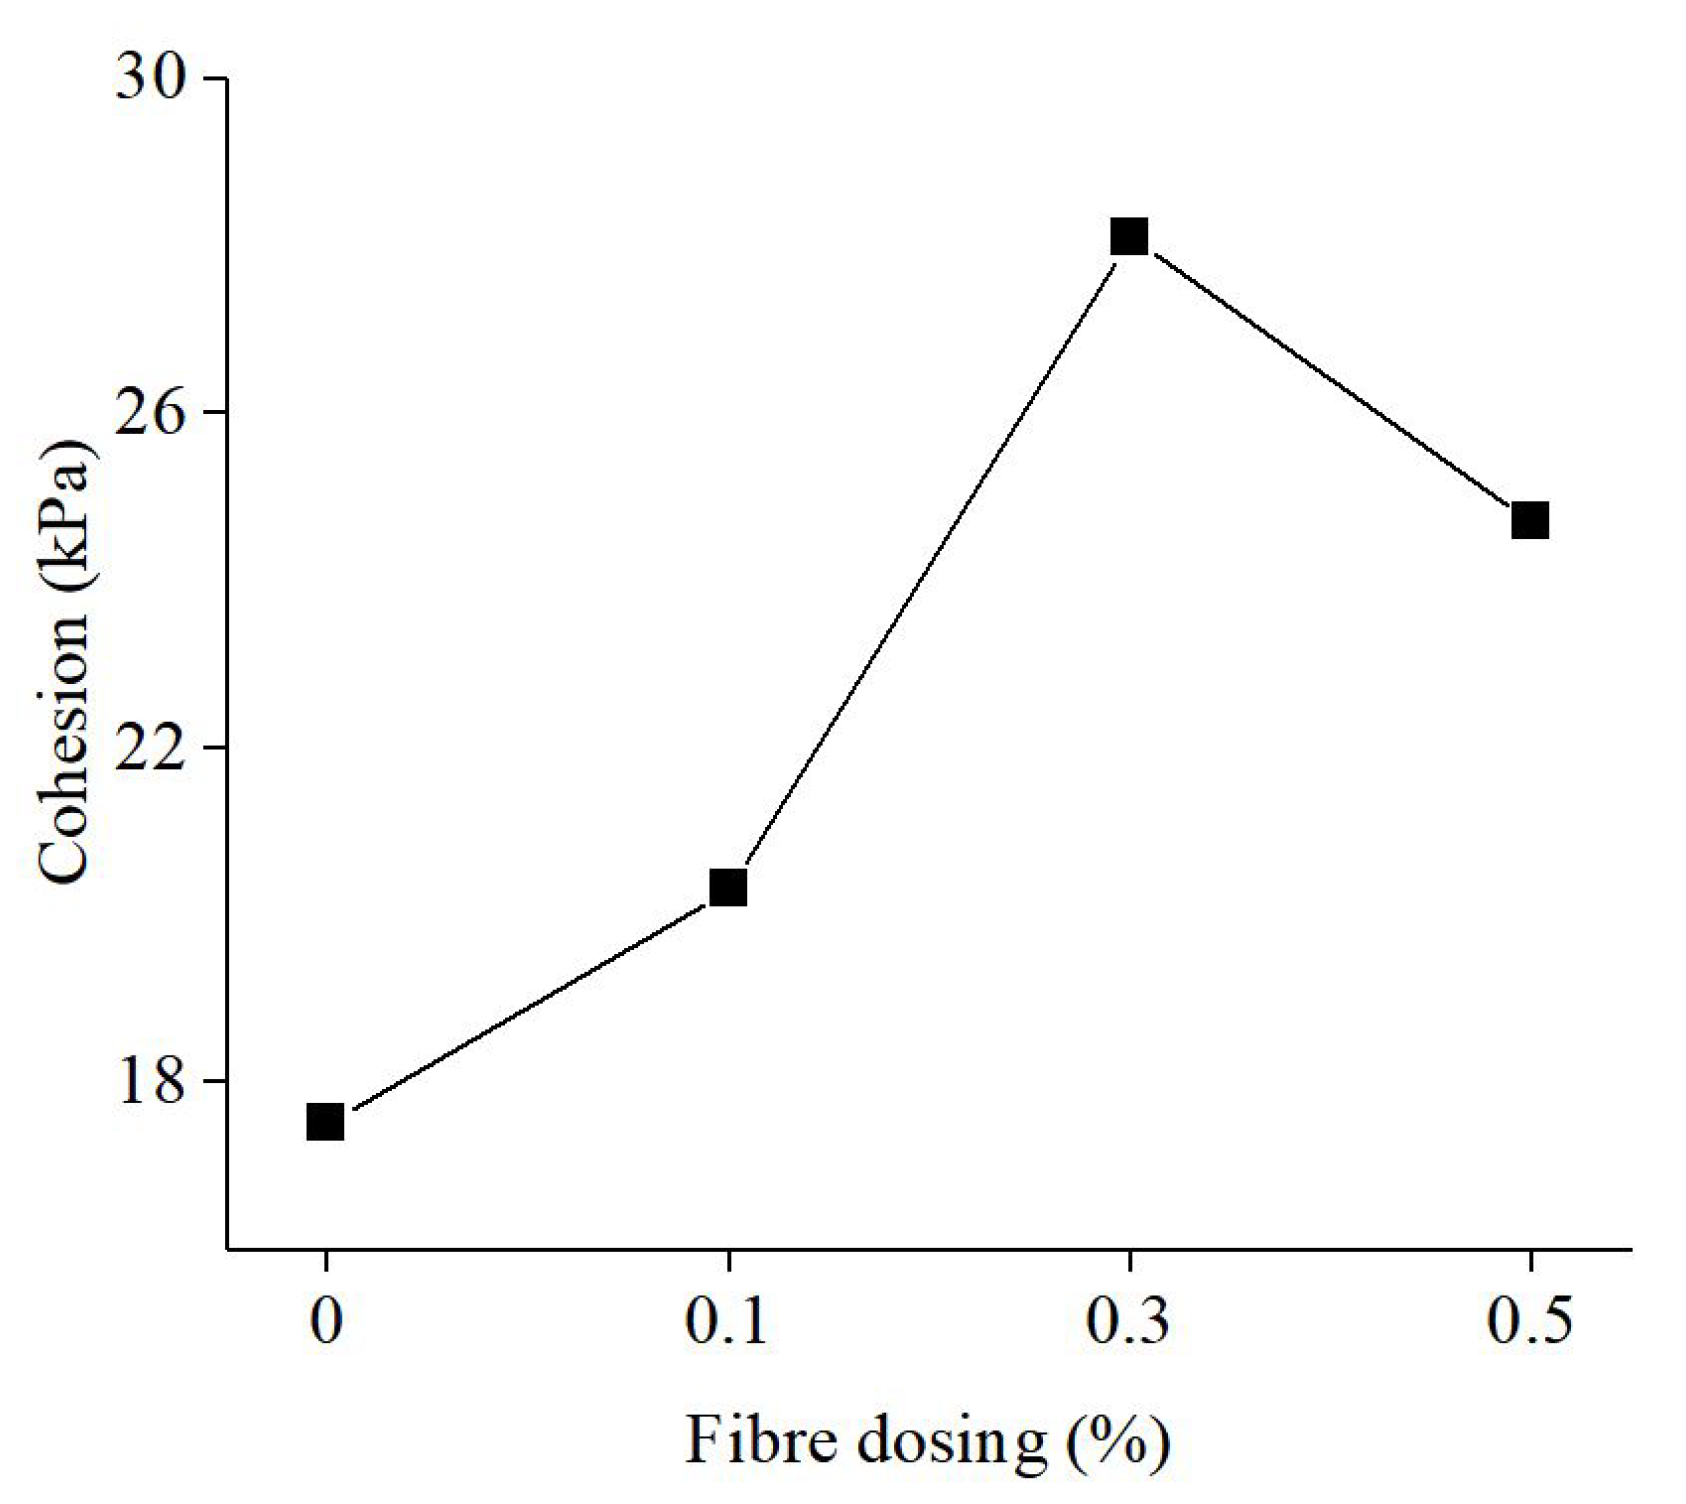
3.5. Shear Strength
4. Numerical Simulation
4.1. Finite Element Basic Principle of Strength Reduction Method
4.2. Model Construction
4.3. Stability Analysis
4.3.1. Plastic Zone Analysis
4.3.2. Displacement Cloud Analysis
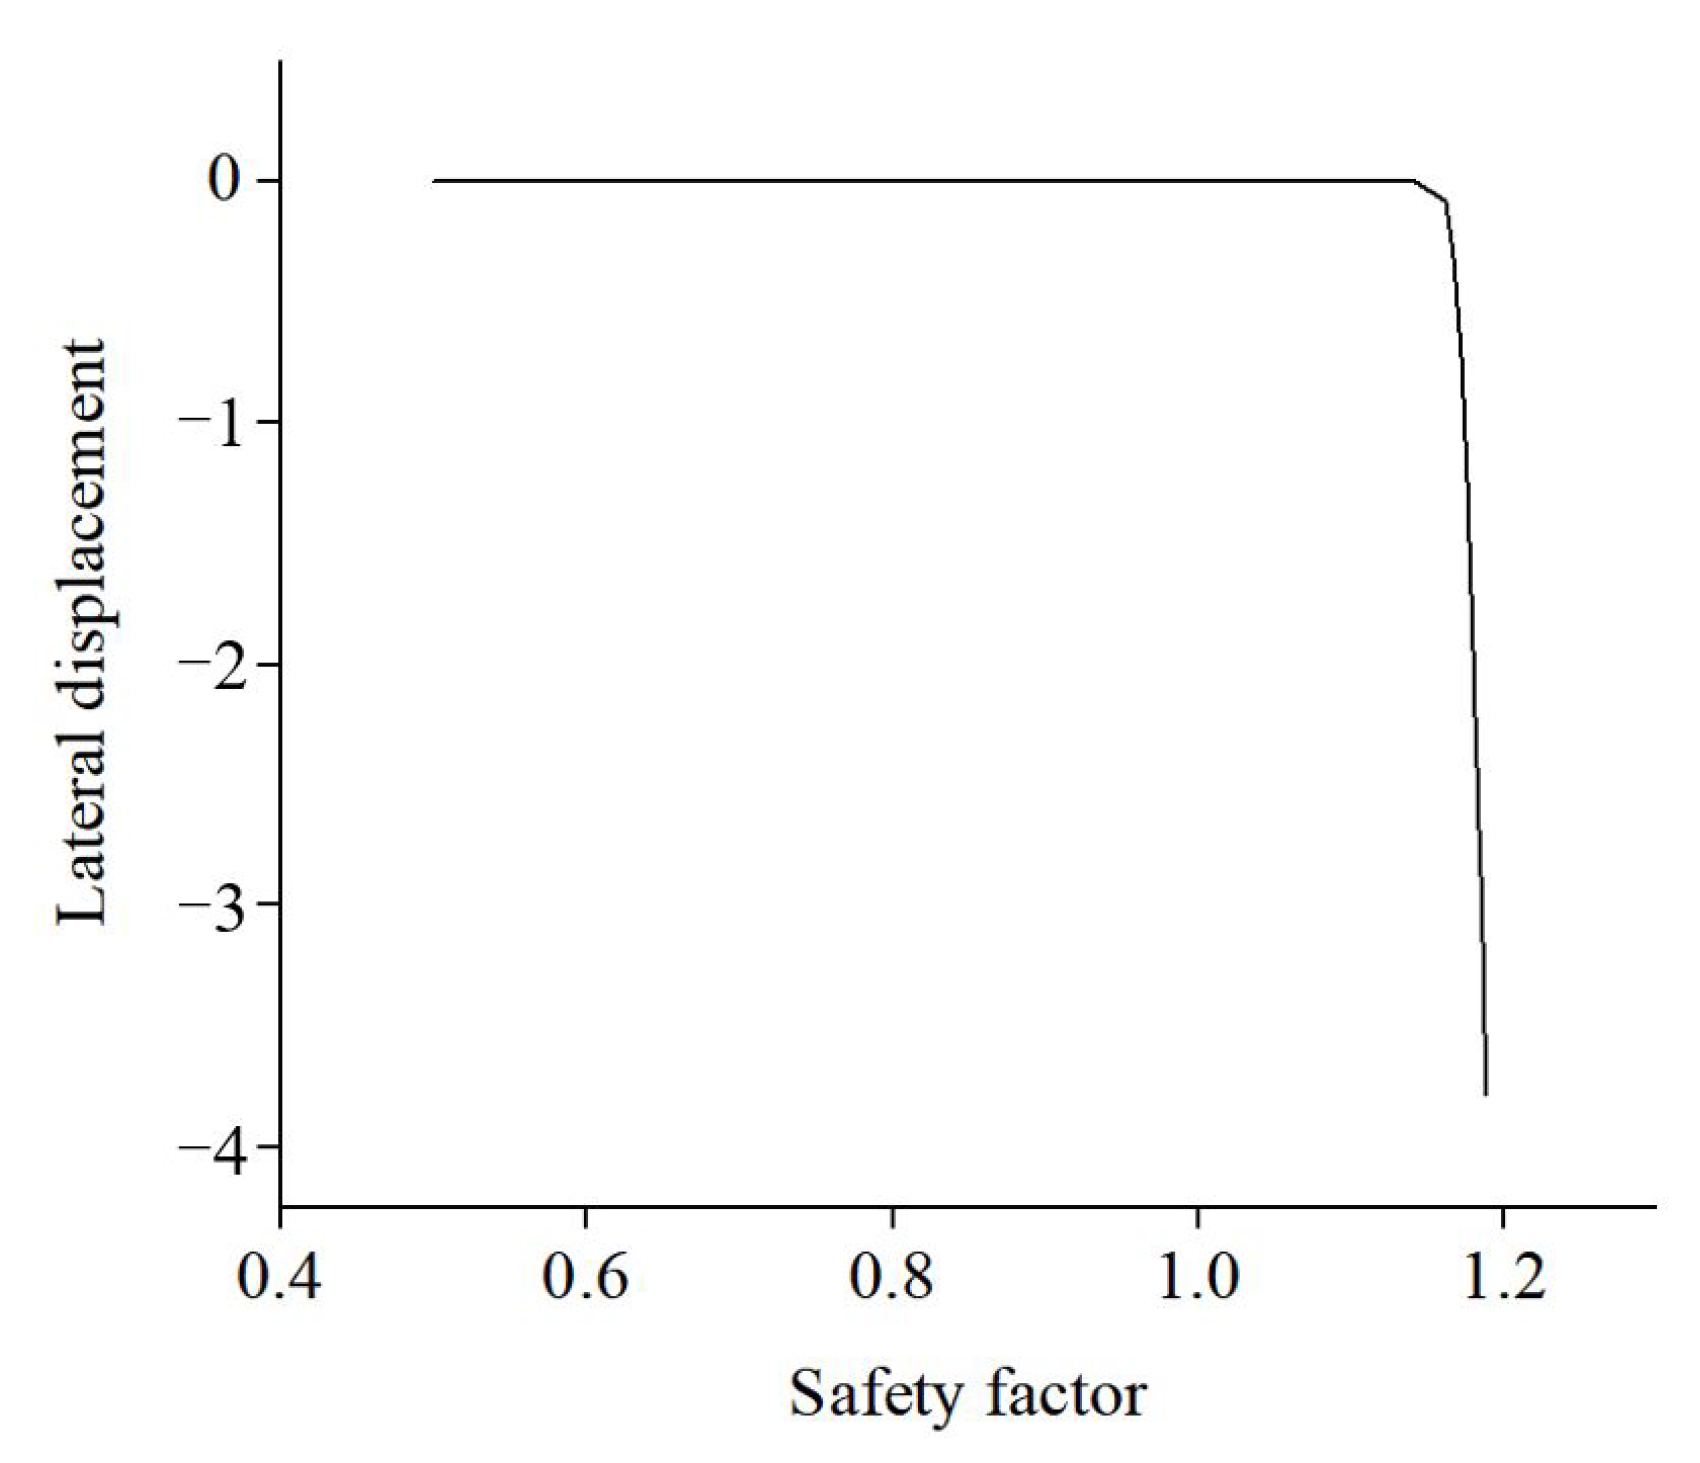
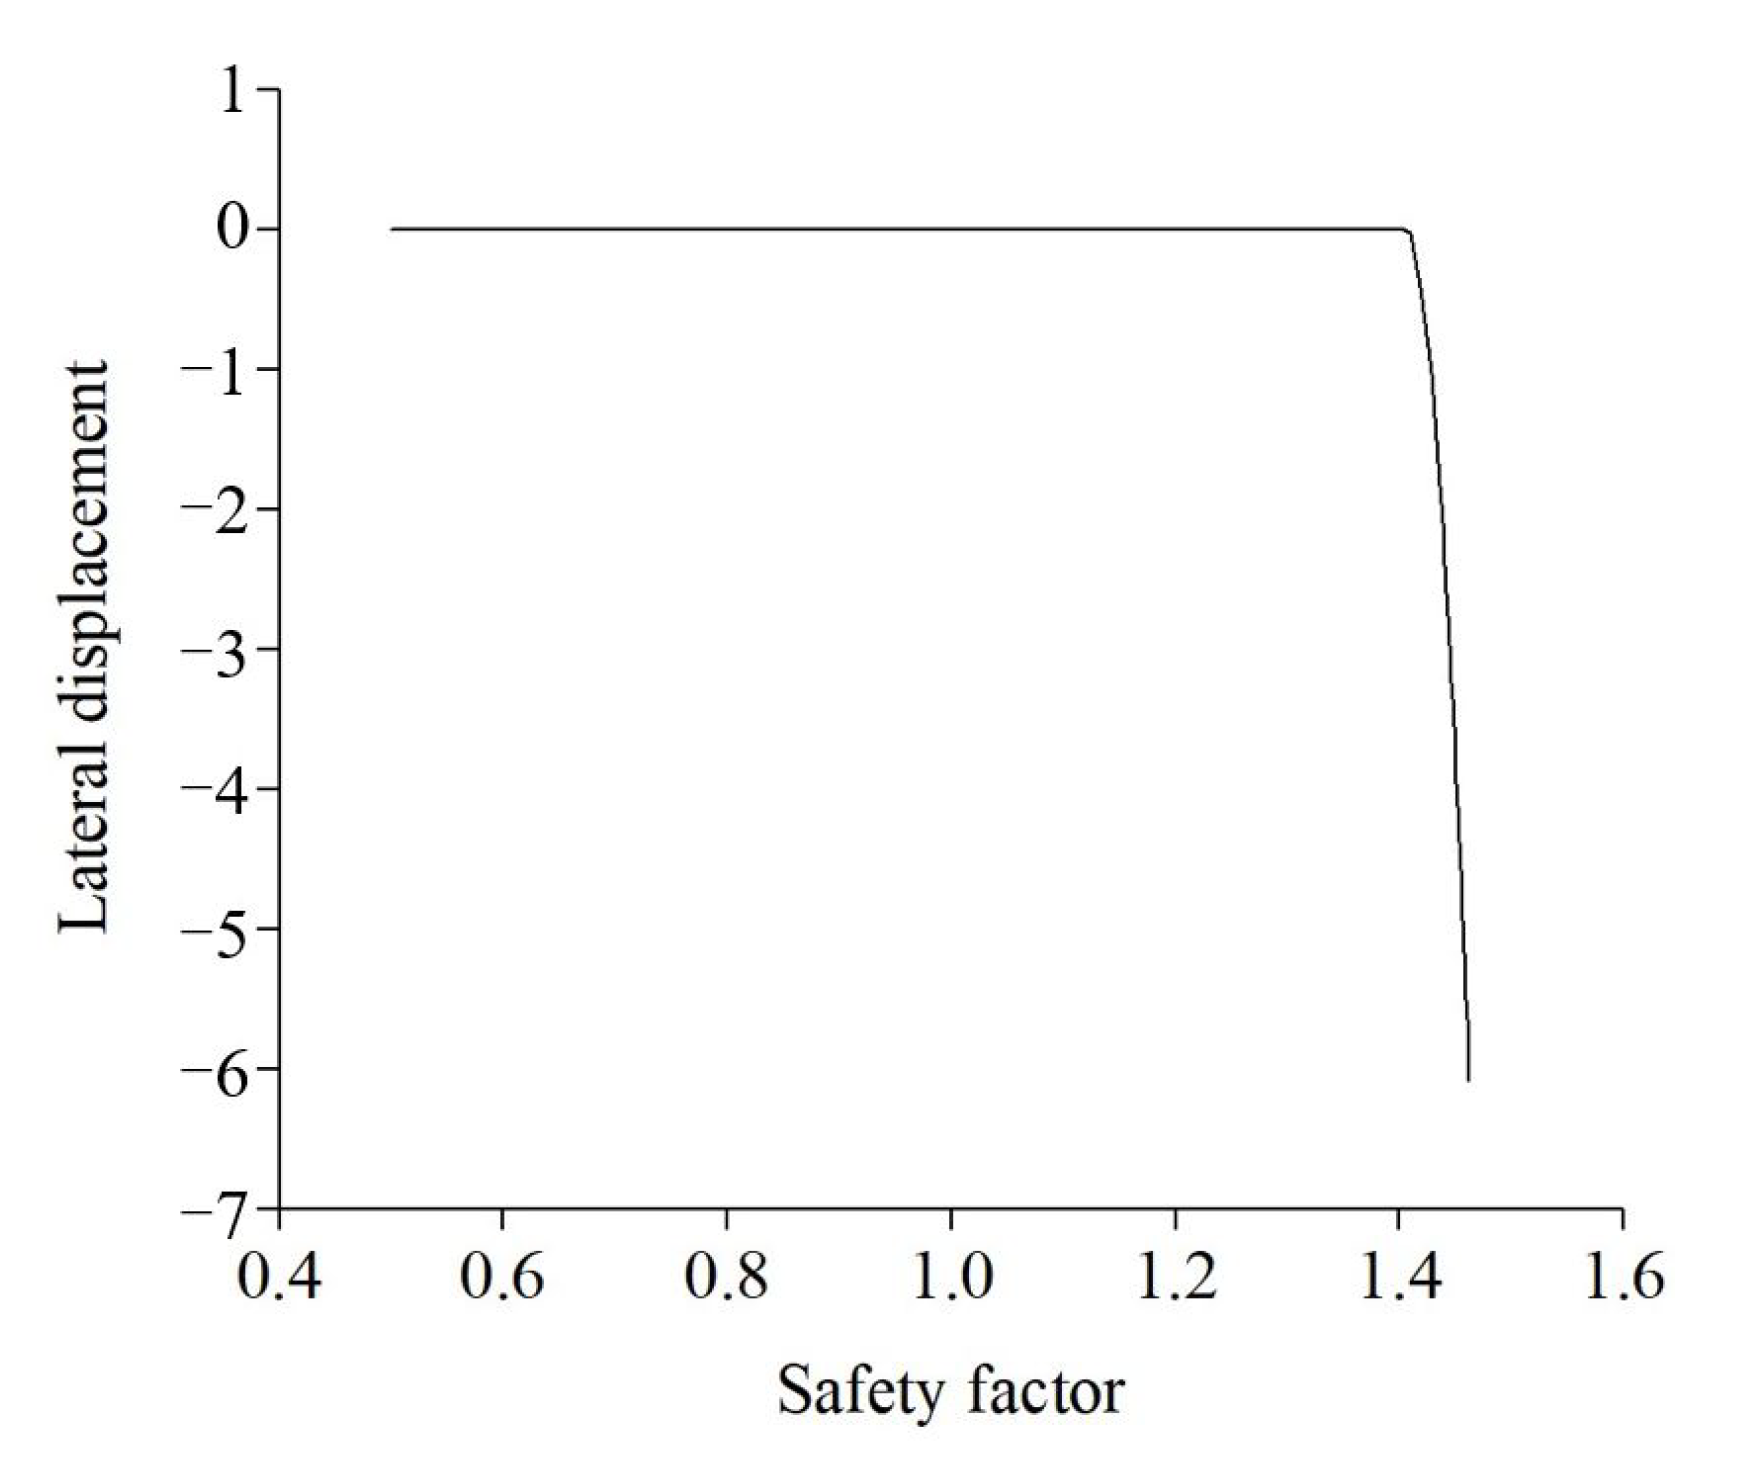
4.3.3. Calculation of Safety Coefficient
5. Conclusions
- (1)
- The combination of fibre reinforcement technology and MICP technology can significantly improve the compressive and shear strength of the soil and improve the characteristics of brittle soil after microbial curing.
- (2)
- The incorporation of basalt fibres has an important influence on the mechanical properties of denitrifying bacterial consolidated soil. When the fibre admixture is low, the unconfined compressive strength of the soil increases with increasing fibre length, and when the fibre admixture is high, the strength tends to increase and then decrease with increasing fibre length. The optimal fibre admixture is between 0.3 and 0.4, and the best fibre length is 12 mm.
- (3)
- The effect of increasing basalt fibre incorporation on the calcium carbonate content of the soil after microbial curing tends to increase and then decrease. This is because after the fibre is added to the soil, the area where calcium carbonate can be colonised increases, and when the fibre is increasingly added, the internal void of the soil is gradually occupied by the fibre, and the growth of microorganisms is restricted. This has a negative impact on the generation of calcium carbonate.
- (4)
- The development of the plastic zone of the slope before and after microbial reinforcement is generally similar, but the scope of the plastic zone after reinforcement is reduced as a whole, especially in the reinforced area of the slope, and the maximum equivalent plastic stress is decreased by 65 kPa.
- (5)
- The safety coefficient of the slope before microbial reinforcement was 1.16, and the safety coefficient after reinforcement was 1.41. The stability of the slope was obviously strengthened.
Author Contributions
Funding
Institutional Review Board Statement
Informed Consent Statement
Data Availability Statement
Conflicts of Interest
References
- Whiffin, V.S. Microbial CaCO3 Precipitation for the Production of Biocement. Ph.D. Thesis, Murdoch University, Perth, Australia, 2004. [Google Scholar]
- DeJong, J.T.; Fritzges, M.B.; Nüsslein, K. Microbially induced cementation to control sand response to undrained shear. J. Geotech. Geoenviron. Eng. 2006, 132, 1381–1392. [Google Scholar] [CrossRef]
- Yang, Z.; Cheng, X.; Li, M. Engineering properties of MICP-bonded sandstones used for historical masonry building restoration. In Proceedings of the Geo-Frontiers 2011: Advances in Geotechnical Engineering, Dallas, TX, USA, 13–16 March 2011. [Google Scholar] [CrossRef]
- Li, M.; Cheng, X.H.; Guo, H.X. Heavy metal removal by biomineralization of urease producing bacteria isolated from soil. Int. Biodeterior. Biodegrad. 2013, 76, 81–85. [Google Scholar] [CrossRef]
- Shanahan, C.; Montoya, B.M. Erosion reduction of coastal sands using microbial induced calcite precipitation. In Proceedings of the Geo-Chicago, Chicago, IL, USA, 14–18 August 2016. [Google Scholar] [CrossRef]
- Shanahan, C.; Montoya, B.M. Strengthening coastal sand dunes using microbial-induced calcite precipitation. In Proceedings of the Geo-Congress 2014: Geo-Characterization and Modeling for Sustainability, Atlanta, GA, USA, 23–26 February 2014. [Google Scholar] [CrossRef]
- Zhao, Q.; Li, L.; Li, C.; Li, M.; Amini, F.; Zhang, H. Factors affecting improvement in engineering properties of geomaterials by microbial-induced calcite precipitation. Geotechnics 2019, 40, 2525–2546. [Google Scholar]
- Qian, C.X.; Wang, A.H.; Wang, X. Advances of soil improvement with bio-grouting. Geotech. Mech. 2015, 36, 1537–1548. [Google Scholar] [CrossRef]
- He, J.; Chu, J.; Gao, Y.; Liu, H. Research advances in biogeotechnologies. Chin. J. Geotech. Eng. 2016, 38, 643–653. [Google Scholar] [CrossRef] [Green Version]
- Li, M.; Li, L.I.N.; Zhang, Z.D.; Li, C. Review, outlook and application technology design on soil improvement by microbial induced calcium carbonate precipitation. China Civ. Eng. J. 2016, 2016, 80–87. [Google Scholar]
- Martinez, B.C.; DeJong, J.T.; Ginn, T.R.; Montoya, B.M.; Barkouki, T.H.; Hunt, C.; Tanyu, B.; Major, D. Experimental optimization of microbial-induced carbonate precipitation for soil improvement. J. Geotech. Geoenviron. Eng. 2013, 139, 587–598. [Google Scholar] [CrossRef]
- Al Qabany, A.; Soga, K.; Santamarina, C. Factors affecting efficiency of microbially induced calcite precipitation. J. Geotech. Geoenviron. Eng. 2012, 138, 992–1001. [Google Scholar] [CrossRef]
- Montoya, B.M.; DeJong, J.T.; Boulanger, R.W.; Wilson, D.W.; Gerhard, R.; Ganchenko, A.; Chou, J.C. Liquefaction mitigation using microbial induced calcite precipitation. In Proceedings of the GeoCongress 2012, Oakland, CA, USA, 25–29 March 2012. [Google Scholar] [CrossRef]
- He, J.; Chu, J.; Ivanov, V. Mitigation of liquefaction of saturated sand using biogas. Géotechnique 2013, 63, 267–275. [Google Scholar] [CrossRef]
- Bao, R.; Li, J.; Li, L.; Cutright, T.J.; Chen, L.; Zhu, J.; Tao, J. Effect of microbial induced calcite precipitation on surface erosion of granular soils: Proof of concept. In Proceedings of the TRB Annual Meeting, Washington, DC, USA, 7–11 January 2017. [Google Scholar] [CrossRef]
- Zhang, X.; Chen, Y.; Liu, H.; Zhang, Z.; Ding, X. Performance evaluation of a micp-treated calcareous sandy foundation using shake table tests. Soil Dyn. Earthq. Eng. 2020, 129, 105959. [Google Scholar] [CrossRef]
- Xiao, P.; Liu, H.; Xiao, Y.; Stuedlein, A.W.; Evans, T.M. Liquefaction resistance of bio-cemented calcareous sand. Soil Dyn. Earthq. Eng. 2018, 107, 9–19. [Google Scholar] [CrossRef]
- Xiao, P.; Liu, H.; Stuedlein, A.W.; Evans, T.M.; Xiao, Y. Effect of relative density and bio-cementation on the cyclic response of calcareous sand. Can. Geotech. J. 2019, 56, 1849–1862. [Google Scholar] [CrossRef] [Green Version]
- Chu, J.; Ivanov, V.; Stabnikov, V.; Li, B. Microbial method for construction of aquaculture pond in sand. Géotechnique 2013, 63, 871–875. [Google Scholar] [CrossRef]
- Liu, L.; Shen, Y.; Liu, H.L.; Chu, J. Application of bio-cement in erosion control of levees. Rock Soil Mech. 2016, 37, 3410–3416. [Google Scholar] [CrossRef]
- Li, C.; Tian, L.; Dong, C.; Zhang, Y.; Wang, Y. Experimental study on zinc-lead composite contaminated soil solidified/stabilized by MICP technology combined with porous silicon adsorption materials. Geotechnics 2022, 43, 307–316. [Google Scholar] [CrossRef]
- Liu, X.; Gao, X.; Pan, C.V. Experimental study on shear strength of cracks in MICP solidified soil sites. J. Civ. Eng. 2022, 55, 88–94. [Google Scholar]
- Cui, M.J.; Zheng, J.J.; Zhang, R.J.; Lai, H.J.; Zhang, J. Influence of cementation level on the strength behaviour of bio-cemented sand. Acta Geotech. 2017, 12, 971–986. [Google Scholar] [CrossRef]
- Tang, C.; Shi, B.; Gao, W. Study on the effect of polypropylene fiber and cement on the strength of cohesive soil and the mechanism. J. Eng. Geol. 2007, 15, 108–113. [Google Scholar]
- Yetimoglu, T.; Salbas, O. A study on shear strength of sands reinforced with randomly distributed discrete fibers. Geotext. Geomembranes 2003, 21, 103–110. [Google Scholar] [CrossRef]
- Shao, W.; Cetin, B.; Li, Y.; Li, J.; Li, L. Experimental investigation of mechanical properties of sands reinforced with discrete randomly distributed fiber. J. Geotech. Geoenviron. Eng. 2014, 32, 901–910. [Google Scholar] [CrossRef]
- Wei, L.; Chai, S.X.; Cai, H.Z.; Li, M. Triaxial shear strength and deviatoric stress-strain of saline soils reinforced with wheat straws. J. Civ. Eng. 2012, 45, 109–114. [Google Scholar]
- Abd Al-kaream, K.W.; Fattah, M.Y.; Hameedi, M.K. Compressibility and Strength Development of Soft Soil by Polypropylene Fiber. Int. J. Geomate 2022, 22, 91–97. [Google Scholar] [CrossRef]
- Liu, H.; Xiao, P.; Xiao, Y.; Chu, J. State-of-the-artreview of biogeotechnology and its engineering applications. J. Civ. Environ. Eng. 2019, 41, 1–14. [Google Scholar] [CrossRef]
- Transport and Communications Department. Test Methods of Soils for Highway Engineering; People’s Transport Publications Society: Beijing, China, 2020. [Google Scholar]


| Optimum Moisture Content/% | Maximum Dry Density/g·cm | Liquid Limit/% | Plasticity Index |
|---|---|---|---|
| 16.8 | 1.68 | 35 | 18.6 |
| Physical and Mechanical Indicators | Monofilament Diameter/µm | Specific Gravity/g·cm | Modulus of Elasticity/GPa | Tensile Strength/MPa |
|---|---|---|---|---|
| Parameters | 7∼15 | 2.63∼2.65 | 91∼110 | 3000∼4800 |
Disclaimer/Publisher’s Note: The statements, opinions and data contained in all publications are solely those of the individual author(s) and contributor(s) and not of MDPI and/or the editor(s). MDPI and/or the editor(s) disclaim responsibility for any injury to people or property resulting from any ideas, methods, instructions or products referred to in the content. |
© 2023 by the authors. Licensee MDPI, Basel, Switzerland. This article is an open access article distributed under the terms and conditions of the Creative Commons Attribution (CC BY) license (https://creativecommons.org/licenses/by/4.0/).
Share and Cite
Jiang, W.; Yi, W.; Zhou, L. Fibre-Microbial Curing Tests and Slope Stability Analysis. Appl. Sci. 2023, 13, 7051. https://doi.org/10.3390/app13127051
Jiang W, Yi W, Zhou L. Fibre-Microbial Curing Tests and Slope Stability Analysis. Applied Sciences. 2023; 13(12):7051. https://doi.org/10.3390/app13127051
Chicago/Turabian StyleJiang, Weijian, Wen Yi, and Lei Zhou. 2023. "Fibre-Microbial Curing Tests and Slope Stability Analysis" Applied Sciences 13, no. 12: 7051. https://doi.org/10.3390/app13127051