Article

Preliminary Analysis of the Water Quality Status in an Urban Mediterranean River

by
Christina Papadaki
*,
Sergios Lagogiannis
and
Elias Dimitriou
Hellenic Centre for Marine Research, Institute of Marine Biological Resources and Inland Waters, 46.7 km of Athens-Sounio Ave., 19013 Athens, Greece
*
Author to whom correspondence should be addressed.
Appl. Sci. 2023, 13(11), 6698; https://doi.org/10.3390/app13116698
Submission received: 7 May 2023 / Revised: 24 May 2023 / Accepted: 29 May 2023 / Published: 31 May 2023

Abstract

:
Recreational use of urban rivers is becoming popular since rivers may act as amenity corridors with the potential for exhibition, recreation, leisure, relaxation and retreat. However, several point and non-point pollution sources contribute to the degradation of urban rivers’ water quality, thereby impeding their beneficial uses and amenities. The physicochemical and microbiological quality of a Greek urban river (Kifisos–Athens) was analyzed over a period of 12 months. A sampling campaign was implemented, collecting monthly data from five sites. Spearman’s analysis showed significant correlation of the Hellenic Water Quality Index with specific nutrients. The total physicochemical status of all sampling stations was characterized as poor or bad. The annual average concentration of Escherichia coli (E. coli) was extremely high in four sites out of five, ranging from 16,822 to 26,780 cfu/100 mL. Bacteriological quality was unacceptable, as the study demonstrated the widespread occurrence of E. coli and low-quality physiochemical conditions. The spatiotemporal distribution of pollution levels revealed hotspots to be monitored further via automatic monitoring stations. A series of management and restoration measures, including tracing the exact pollution routes, should be initiated to minimize pollution pressures and establish the good ecological status of an important Mediterranean river.

1. Introduction

Urban rivers are important ecosystems that promote health, prosperity and wellbeing in cities, regarding both public welfare and community livelihood. Rivers offer places to walk next to river banks, boat or paddle, fish, or just sit and relax, refresh, and renew. It is therefore crucial that people are able to safely access and interact with these spaces. Nevertheless, several pollution sources driven by human activity contribute to urban river pollution, including direct discharge from industrial facilities and sewage treatment systems, agricultural runoff, recreational activities themselves and illegal actions [1]. Urban diffuse pollution from cities and transport carries pollutants from roads and urban surfaces into storm drains and out into watercourses at many locations along the river. Moreover, the atmospheric deposition, storm water and urban runoff from urban surfaces may carry various contaminants [2] including toxic metals, organic pollutants, pathogenic organisms and pharmaceuticals such as antibiotics, which create extensive environmental and human health concerns [3]. Additionally, many urban rivers have been channeled, buried or otherwise confined with the impacts of hydro-morphological alterations, enhancing the risk of further degradation in both water quality and quantity [4,5].
Water quality conditions are commonly assessed by indicators including physicochemical parameters [6], faecal indicator bacteria [7,8] and polycyclic aromatic hydrocarbons (PAHs) [9]. The latter pose a serious risk to humans, and are linked with infection or illness from waterborne pathogens during contact-recreation [10]. Guideline values for fresh water recreational water were first presented at the World Health Organization (WHO, 2003), based on a tolerable impact of <1–5% gastrointestinal disease for voluntary recreational activities, and many countries use Escherichia coli (E. coli) bacteria as an indicator in fresh water with a 100 cfu/100 mL threshold of risk, based on findings of [11]. The bacterial concentration in rivers is determined by faecal pollution from point and diffuse sources [12]. E. coli bacteria replaced faecal coliforms as a more purposeful index of faecal pollution because E. coli specifically indicate the presence of faeces from warm-blooded animals. It is considered an indicator of recent faecal pollution due to its higher decay rate than intestinal Enterococci in water [12]. In 2012, the Environmental Protection Agency (EPA) updated the water quality criteria recommendations for recreational waters, including both Escherichia coli and Enterococci as indicators for faecal contamination. The new criteria are designed to protect primary contact recreational uses (e.g., swimming, bathing, surfing, water skiing, water play by children etc.) in which a high degree of bodily contact with water, immersion and ingestion are likely. These recommendations depend on the latest research and science that show a link between gastrointestinal and respiratory illnesses and faecal contamination in recreational waters. E. coli guidelines for recreational water quality criteria have been developed by New Zealand (MfE, 2003), EU (Directive 2006/7/EC), the World Health Organization (WHO, 2021), Australia (NHMRC, 2008), the United States Environmental Protection Agency (USEPA, 2012) and Canada (HC, 2012). MfE, 2003 sets the recommended standard of E. coli (maximum concentration) in recreational water at 550 cfu/100 mL based upon a statistical threshold value of the 95th percentile, while EU sets 900 cfu/100 mL based upon a 90th percentile evaluation. Additionally, WHO and NHMRC set the standard at 500 cfu/100 mL based upon a statistical threshold value of the 95th percentile. These are draft recommended concentrations to safeguard people from primary contact during recreational use.
The presence of polycyclic aromatic hydrocarbons (PAHs) is also examined within the context of this paper. PAHs are included in the list of priority substances of the Water Framework Directive (WFD) 2000/60/EC, established in the No 2455/2001/EC amendment. PAHs are hazardous organic compounds released into the environment by natural and anthropogenic combustion processes alike. Considerable attention has been paid to PAHs due to their documented carcinogenicity [13] and their persistent nature. Natural sources include volcanic eruptions and forest fires, while incomplete combustion of transportation fuel, industrial waste, agricultural fires and waste incineration constitute examples of anthropogenic sources [9,14].
The purpose of this preliminary study is to investigate the impacts of urbanization on river pollution and the implications for recreational use. The main objective is to assess the physicochemical and microbial quality of the Kifisos river in Attica Greece, which comprises a typical example of an urban river prone to environmental degradation mainly due to its proximity to several pollution sources. We should point out that the Kifisos river is the main urban river of the capital city of Greece (Athens), which nevertheless is not monitored adequately regarding water pollution, and therefore, relevant information is scarce. Thus, this effort is likely the first attempt to present a recent spatiotemporal analysis of the water quality status of the river by using several variables and attempting to identify pollution hotspots along its course. To our knowledge, there is a lack of research on the relationships between physicochemical parameters, nutrients, and E. coli concentrations in the Hellenic Water Quality Index (HWQI), and this fact emphasizes the necessity of this study. Descriptive statistics, box plots and correlation matrixes are employed. We analyze the following groups of pollutants: nutrients, pathogens and physicochemical parameters using monthly water surface samples from May 2021 to April 2022 from five sampling sites. Measurements of total polycyclic aromatic hydrocarbons (TPAHs) and total hydrocarbons (THs) were also collected in two of the campaigns in May 2021 and September 2022. Additionally, E. coli monitoring results are corelated with the Hellenic Water Quality Index (HWQI) [15,16,17,18,19] according to the demands of the WFD 2000/60 EC to investigate potential relationships. This is a first attempt to investigate correlations between E. coli and HWQI in an urban river, which is crucial for future water quality assessments. The data presented here can be used to provide valuable insights and contribute to the development of comprehensive and inclusive management and restoration plans to tackle the degradation of urban water bodies and their in-stream habitats.

2. Materials and Methods

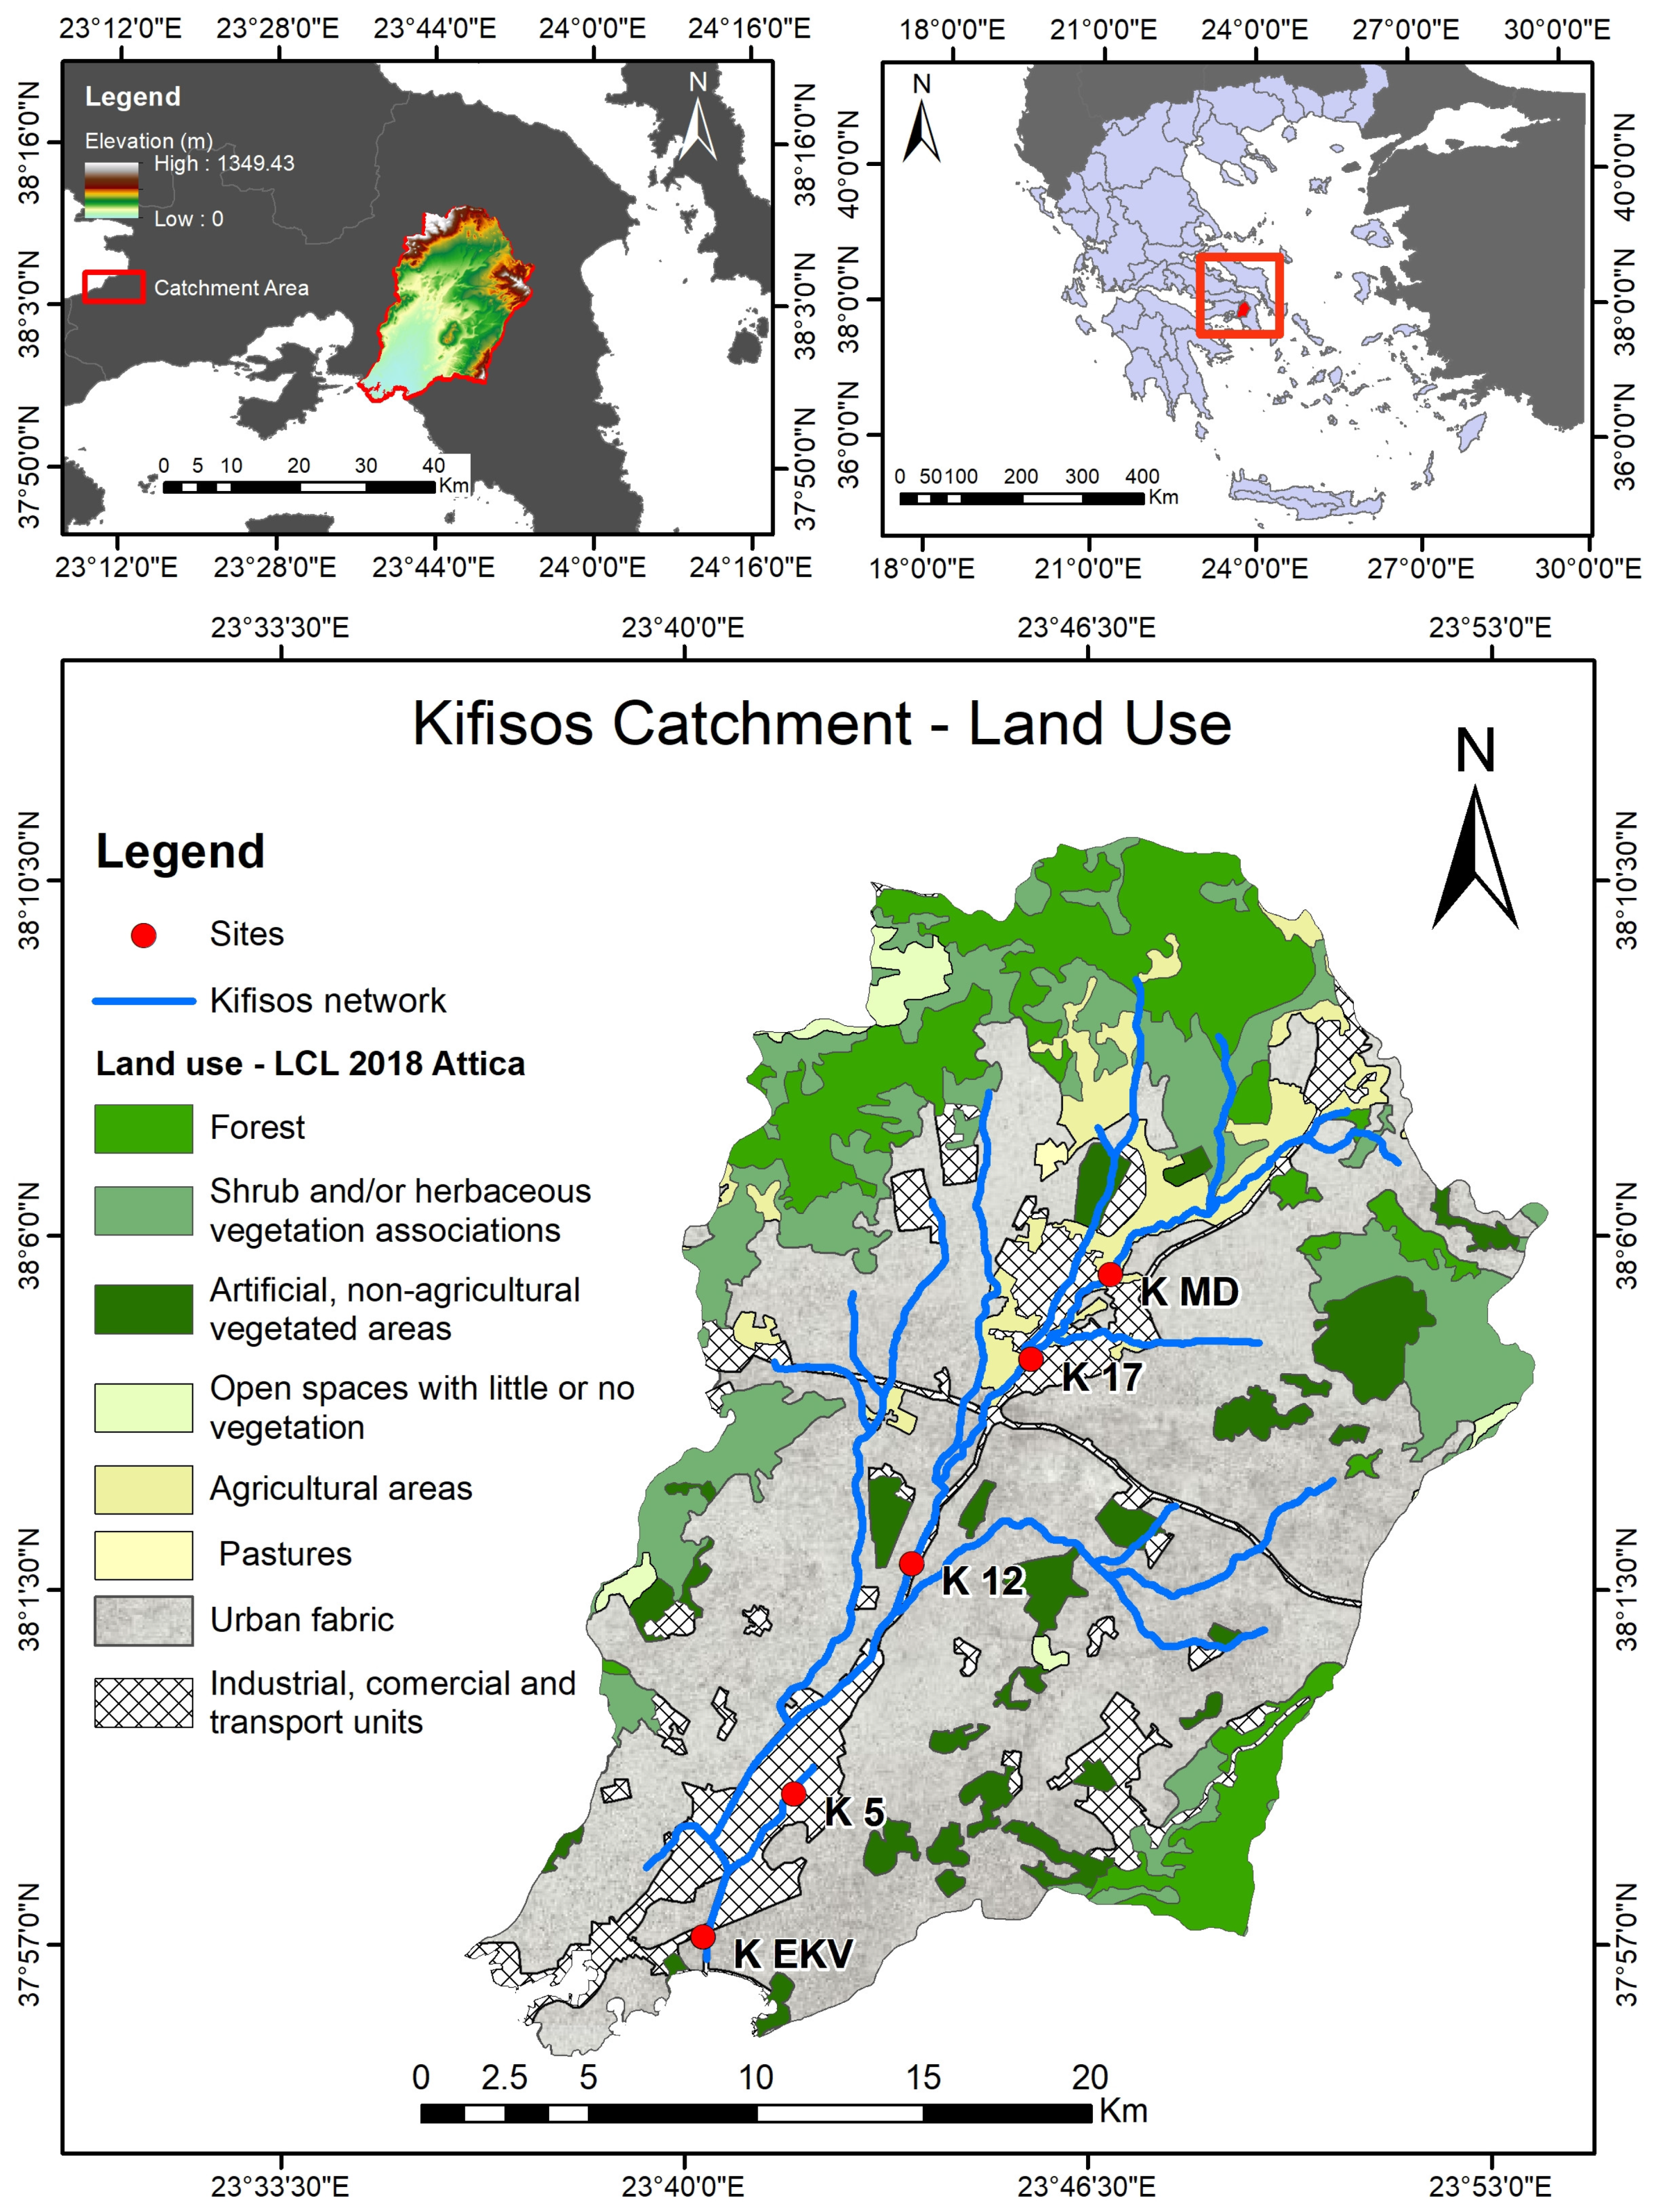
2.1. Study Area and Sample Collection

Kifisos river, including various spellings of the name (Kifissos, Cephissus, Kephisos), flows through Athens city and reaches the Saronic Gulf in the western part of Athens metropolitan area (~3.8 million inhabitants). It operates as major drainage channel for a large part of Athens. Its catchment area extends ~420 km2 with the river main route length being approximately 29 km. Most of the year, water discharge is low (~3.2 m3 s−1), but during flood events, the water fluxes may reach up to 1400 m3 s−1 [20]. According to a previous study [21], certain sections of the Kifisos drainage network, particularly in the central and north-western parts, are vulnerable to flood phenomena. Surface elevation differs between upland and low-land areas, ranging from 1350 m to sea level elevation in its estuary, while the mean elevation of the catchment area is 284.9 m. According to previous studies, approximately 65% of the geological formations are alpine, and the rest are meta-alpine formations [22].
Concerning land use, Kifisos catchment is characterized by multiple anthropogenic pressures, mainly industry, agricultural and residential use. The built-up areas (houses, roads, industries) cover most of the downstream parts of the catchment, and are estimated to exceed 70% while they are still increasing [23]. At two distinct parts along the Kifisos route, industries and manufacturing businesses have been operating on both sides of the river, functioning as unplanned and informal industrial zones. In the upstream areas, forests and shrubland are dominant, but have been significantly impacted by 2007 and 2019 wildfires. This is also where land used for agricultural and livestock use is located. Kifisos has undergone extensive river engineering in the last 13 km of its route, addressing issues of flood control, drainage system management and the road network; Kifisos river is canalized, alternating from fully boxed to open cross-section embankment. As a result, its riparian zone for this stretch was practically eliminated. Moreover, Kifisos Avenue a high-traffic-density road, and the central axis of Athens highway network was constructed over the canalized river. Five sampling locations were selected that are distributed along the drainage catchment from its upstream part, where limited pollution sources exist, to the river mouth (Figure 1).
Monthly water surface collection was conducted in between 10:00 a.m. and 1:00 p.m. from May 2021 to April 2022 at five sampling sites (K Ekv, K 5, K 12, K 17, K MD). Physicochemical parameters such as dissolved oxygen (DO) (mg/L), electrical conductivity (EC) (μS/cm), temperature (T) (°C), pH and salinity (ppt) were measured on-site by a portable water quality multiparameter instrument (YSI ProDSS). Surface water samples were collected in sterile bottles, preserved by the addition of HgCl2, stored in a cooler box and subsequently transferred to the Hellenic Centre for Marine Research (HCMR) laboratories to further analyze concentrations of NO3-N (mg/L), NO2-N (mg/L), DIN (mg/L), TN (mg/L) and TP (mg/L). Additionally, the output of the analyses was used to estimate the Hellenic Water Quality Index (HWQI) according to a Nutrient Classification System (NCS) initially developed by [18] and modified to include dissolved oxygen concentrations. Based on the values of five nutrient species along with dissolved oxygen levels, HWQI classifies water samples into five water quality categories: bad, poor, moderate, good and high, according to the requirements of the WFD (2000/60/EC).
For microbiological analysis, water samples were collected separately in 1 L sterile containers for the quantification of E. coli according to the International Organization for Standardization (ISO) method/protocol (ISO 9308-1:2014), which specifies the method for the enumeration of Escherichia coli (E. coli). Two additional water samples were collected in May 2021 and in September 2022 with precleaned glass bottles for TPAHs and THs analysis.

2.2. Statistical Analysis

First, the Shapiro–Wilk’s test was performed to assess for normality of distribution of the river water quality parameters due to the small sample size. Then, the Spearman’s non-parametric correlation test was employed to reveal the relationships among the water quality parameters. We analyze the following groups of pollutants: nutrients (nitrate-nitrogen as NO3-N (mg/L), nitrite-nitrogen as NO2-N (mg/L), ammonium−nitrogen as NH4+-N (mg/L), dissolved inorganic nitrogen as DIN (mg/L), total nitrogen as TN (mg/L), orthophosphate as PO4–P (mg/L), total phosphorus as TP (mg/L), pathogens (such as E. coli), and physicochemical parameters (dissolved oxygen as DO (mg/L), electrical conductivity as EC (μS/cm), pH, salinity (ppt) and temperature as T (°C) using monthly water surface samples collected from May 2021 to April 2022 from five sampling sites. The data obtained were subjected to statistical analysis using Statistical Package for Social Sciences (SPSS), version 28 software.
Box and whisker plots per sampling site were developed for nutrients, electrical conductivity (EC) and temperature (T) using an open-source application, (BoxPlotR, http://boxplot.tyerslab.com/, accessed on 08 March 2023), to examine the distribution of the measured concentrations. Information about sample sizes was represented by the width of each box, where the widths are proportional to the square roots of the number of observations. Box and whiskers plots present the min-max and median in addition to the first and third quartiles of each variable and site for the entire sampling period.
Due to the large variability in the E. coli concentrations, the visualization of this pathogen was made via beanplots to provide a clear view of the central tendency and variability of the data. In the beanplots, the individual observations are presented as small white lines. Results were compared with EU recommendations (Directive 2006/7/EC; Annex 1 for inland waters). Comparisons were made based on the Hazen method according to the addendum of the World Health Organization (2009).
Quality classes were assigned to the sampling sites according to the Hellenic Water Quality Index (HWQI). Finally, Spearman’s correlation was applied between the study variables to check for covariances. Correlations were used to identify monotonic relationships between two quantitative parameters simultaneously using the 1-tailed Spearman’s rank correlation. The criterion used to check the reliability was the correlation coefficient (ρ).

3. Results

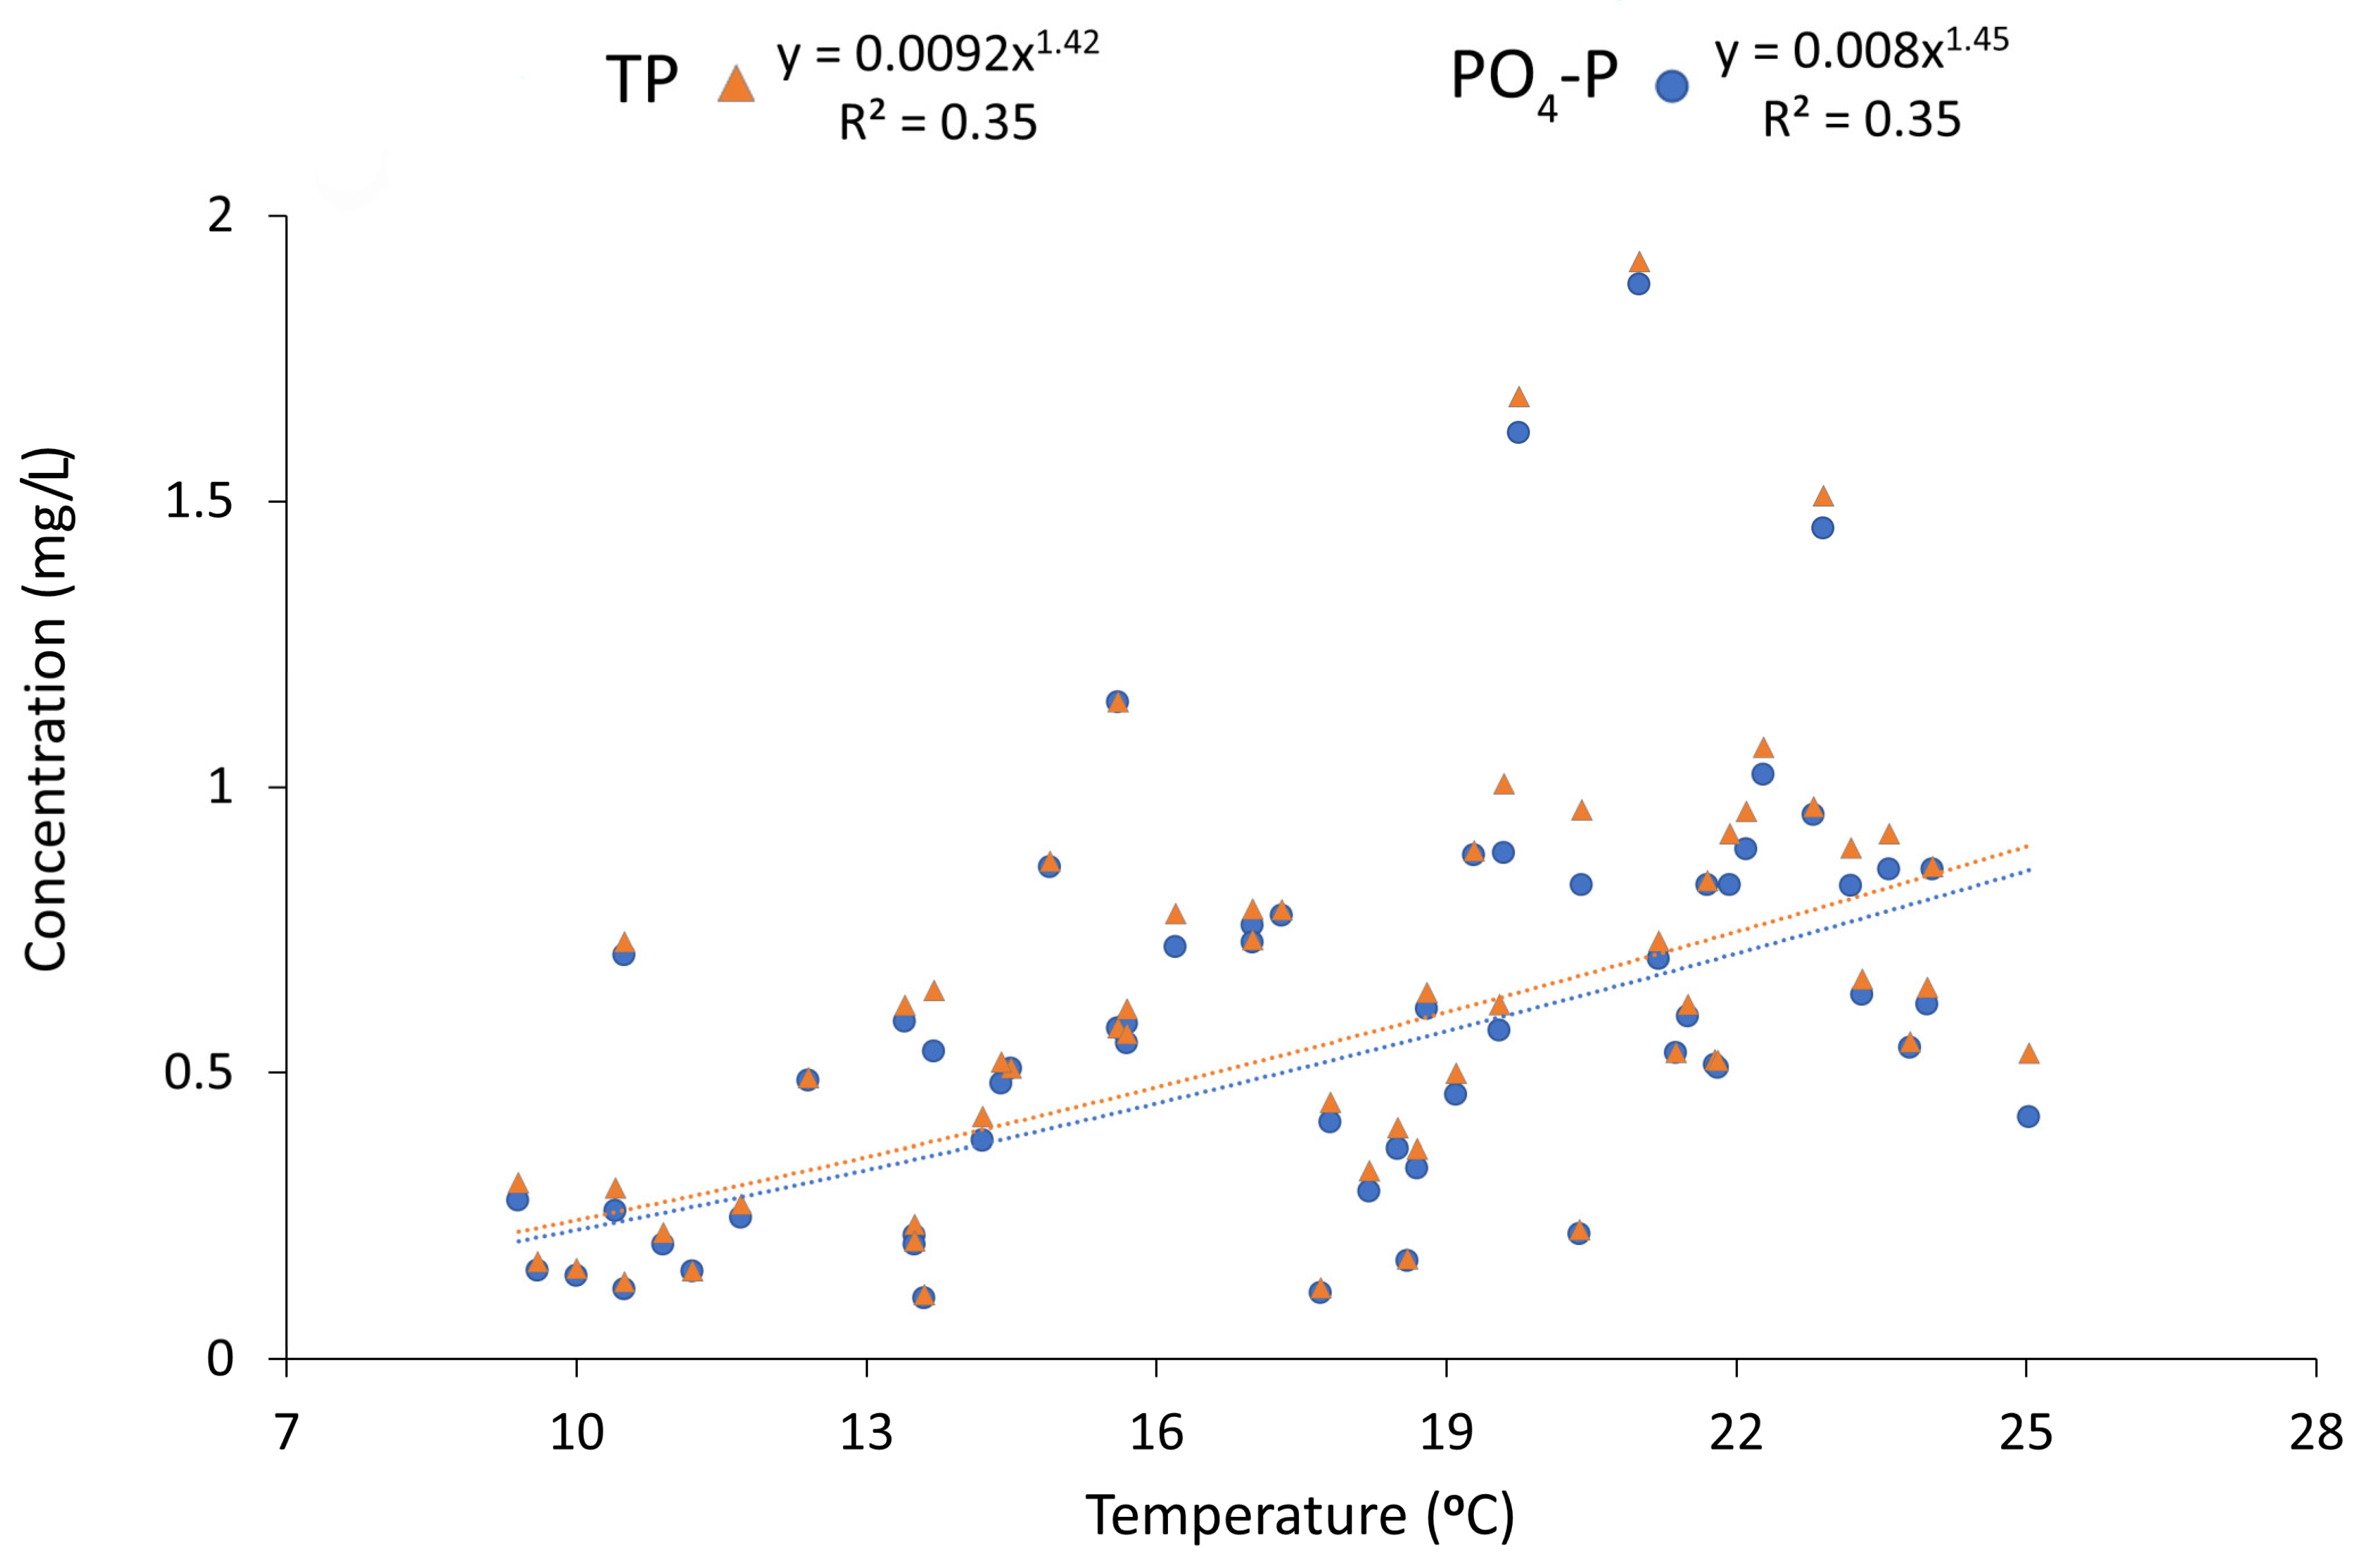
3.1. Correlations between the Examined Water Quality Parameters along Kifisos River

Due to of the small size of the sample data, we used the Shapiro—Wilk test to test for normality of distributions of the following water quality parameters (Table 1). The p values were considered statistically significant at a 95% confidence interval. According to the results of the Shapiro–Wilk test for normal distribution, most of the examined water quality parameters are not normally distributed.
As the majority of the data did not fit a normal distribution, Spearman’s correlation analysis was then applied to check for covariances. Spearman’s correlation analysis showed that temperature has significant (p < 0.05) correlations with nutrients, particularly with phosphorus (Table 2). Regression analysis for orthophosphates and total phosphorous as function of temperature yielded values (R2) 0.347 and 0.346, respectively. Figure 2 also indicates a strong seasonal trend among temperature and high nutrient values, especially in the summer season (upward-sloping power curve; June–July–August).
HWQI and temperature are also strongly correlated, confirming that during warm periods, the physicochemical quality gets worse. The DO concentration is also strongly correlated with all nutrients, HWQI and E. coli, which implies that when these substances’ levels increase, dissolved oxygen is decreased. This is expected since organic pollution, which also consumes dissolved oxygen due to intense microbial activity, is the main factor affecting these parameters. HWQI and E. coli are more strongly correlated with NO2-N and NH4+-N than with the rest of nutrients, likely implying the frequent presence of human sewage in the river. Nevertheless, there are other sources of nutrients as well since the correlation between E. coli, NO3-N and HWQI is not very strong. The very high correlations between dissolved inorganic nitrogen (DIN) and total nitrogen (TN) as well as between total phosphorus (TP) and PO4-P indicates anthropogenic pollution as the dominant source of nutrients in the river (Table 2). In Table 2 green–yellow–red color scale was applied to visually represent data values based on their relative magnitude compared to the rest of the values. The lowest values were colored with red shades, the middle values with yellow shades, and the highest values with green shades.

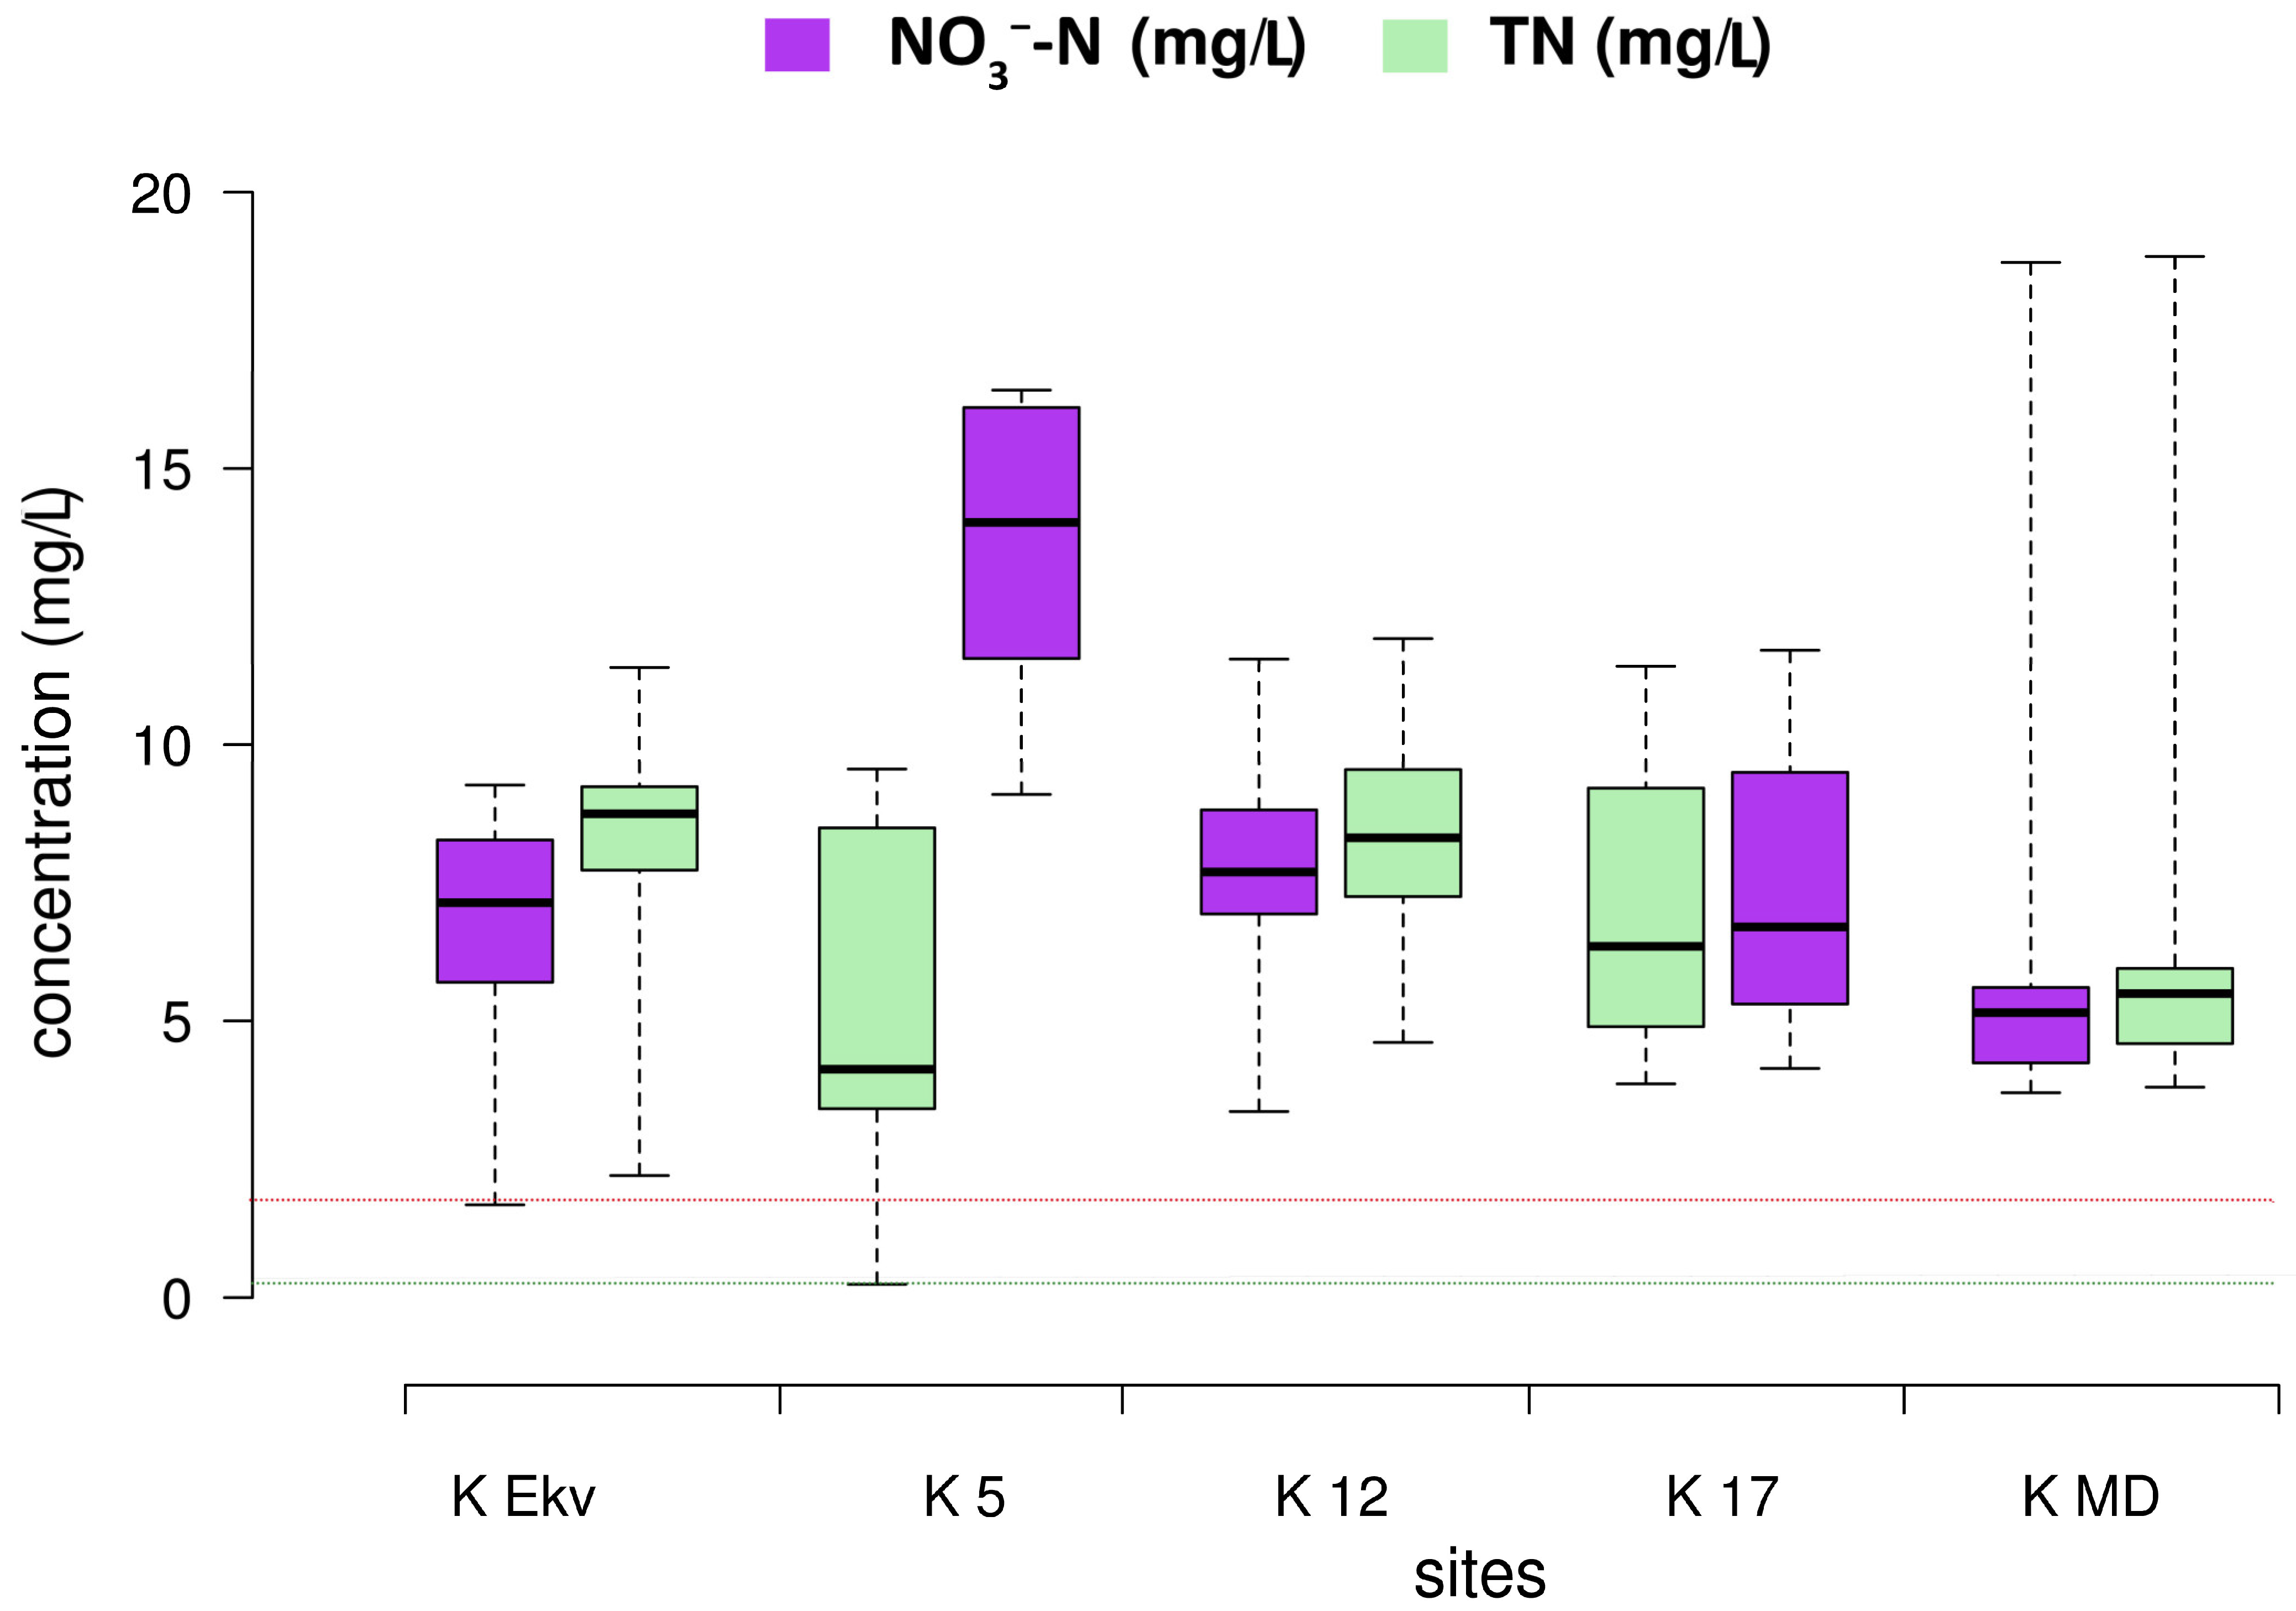
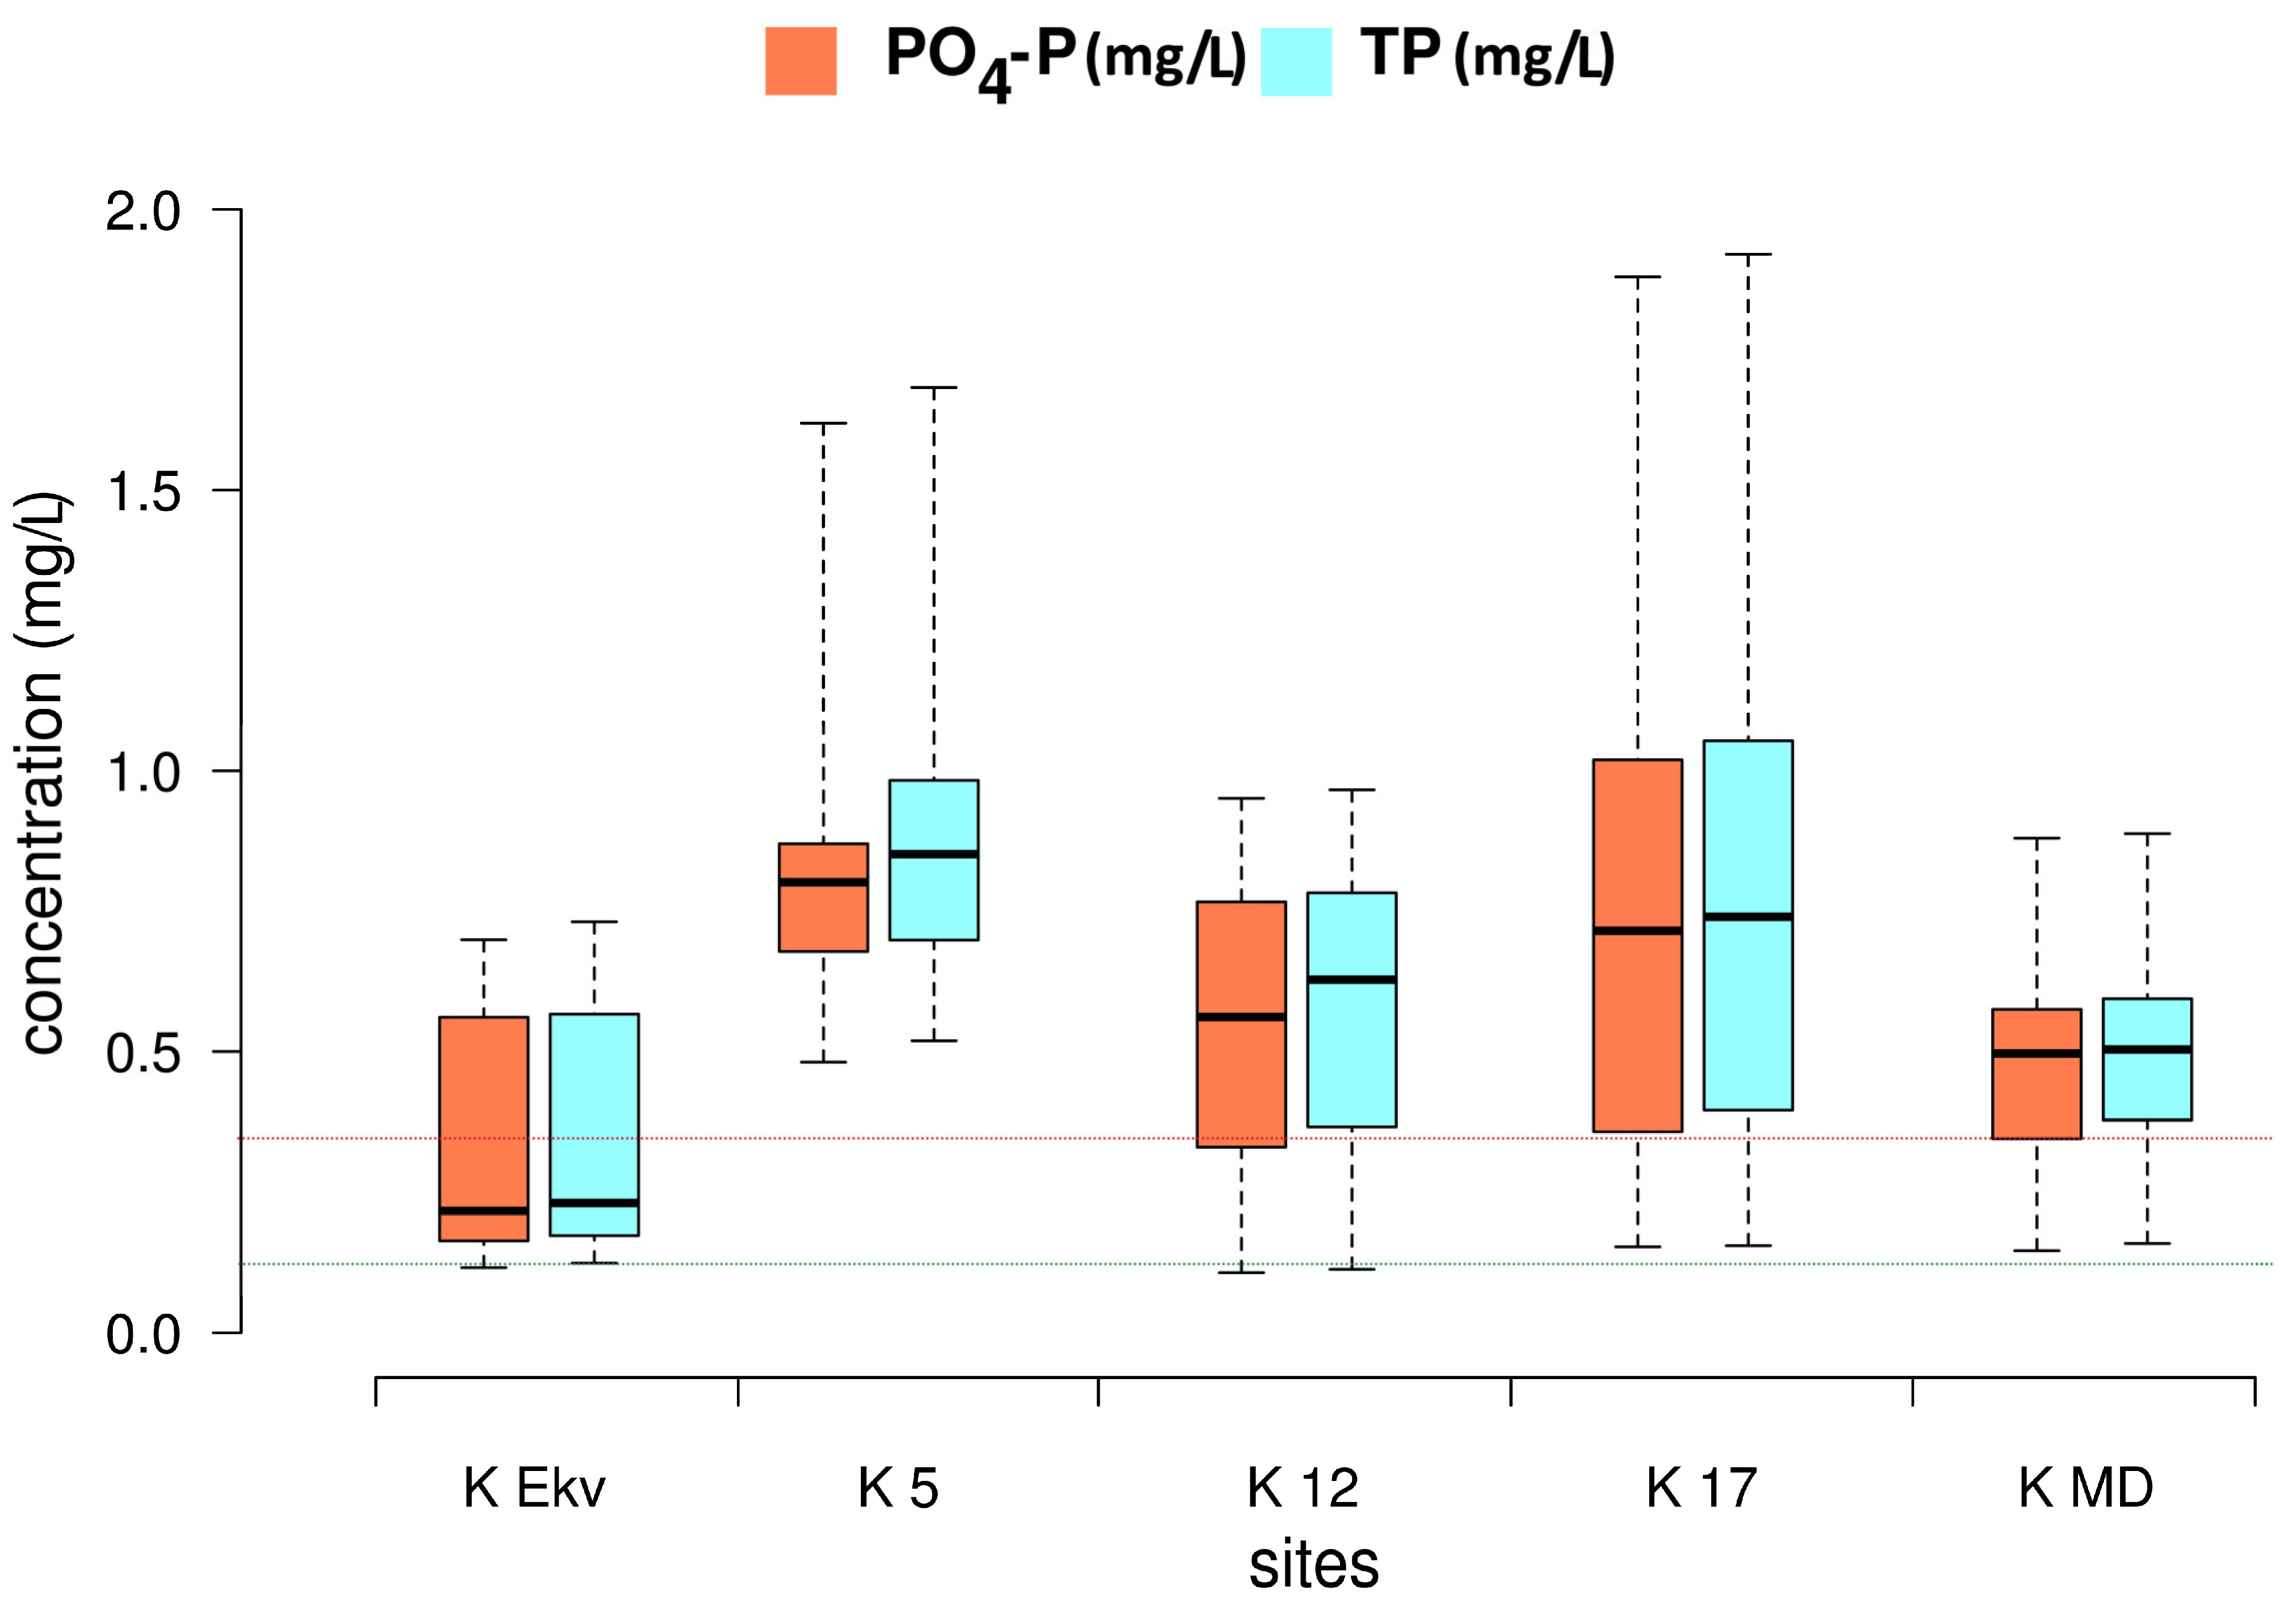
3.2. Nutrients’ Statistics per Site

Nitrogen-nitrate in almost all samples was very high, with values ranging from close to 0 up to 20 mg/L (Figure 3). More than 90% of the total samples fell in the category of “bad quality” for NO3-N, and the sites having more than 50% of their samples with very high concentrations (more than 7 mg/L) are K 12 (approx. in the middle of the catchment) and K Ekv (close to the river mouth). K MD, which is in the upstream area, had the lowest NO3-N values, but those values were still high enough to be classified as “bad quality.” Total nitrogen (TN) values were very similar to NO3-N values in most cases, which means that most of the nitrogen-related pollution is inorganic and in the form of nitrates, while a significant difference is observed at the K 5 site since TN values are generally much higher than NO3-N concentrations (Figure 3). This is due to the fact that NH4+-N values are also very high at the specific site, which could be related to domestic or industrial sewage in close vicinity to the sampling area.
Similarly, for phosphorus, most of the samples indicated high concentrations and therefore poor and bad quality. Only the river mouth area (K Ekv) presented a slightly better picture, with more than 50% of the samples to fluctuate between the moderate and poor classifications (Figure 4). This is likely due to the effect of the sea, which generally has significantly lower P concentrations, and therefore, the mixing processes that occur at K Ekv improve slightly the quality of the site. The sites that present the highest PO4-P and TP concentrations are K 17 (close to the industrial area of Metamorphosis) and K 5 (in another industrial area close to Athens city center) that also had very high NH4+-N levels. Nevertheless, even in the upstream part of the catchment (K MD), more than 75% of the samples were classified as of bad quality.
According to the HWQI, the sampling sites K Ekv, K 12 and K 17 could be characterized as of bad or poor physicochemical status in the majority of the measurements. Approximately 50% of the samples in K MD (upstream) and 25% of the samples in K Ekv and K 12 indicated moderate physicochemical quality (Figure 5). The worst results in terms of WFD quality class were recorded in K 5, with more than 50% of the samples classified as of bad quality and all the rest as of poor quality. K 17 follows, with almost 80% of the samples classified as of poor physicochemical quality.

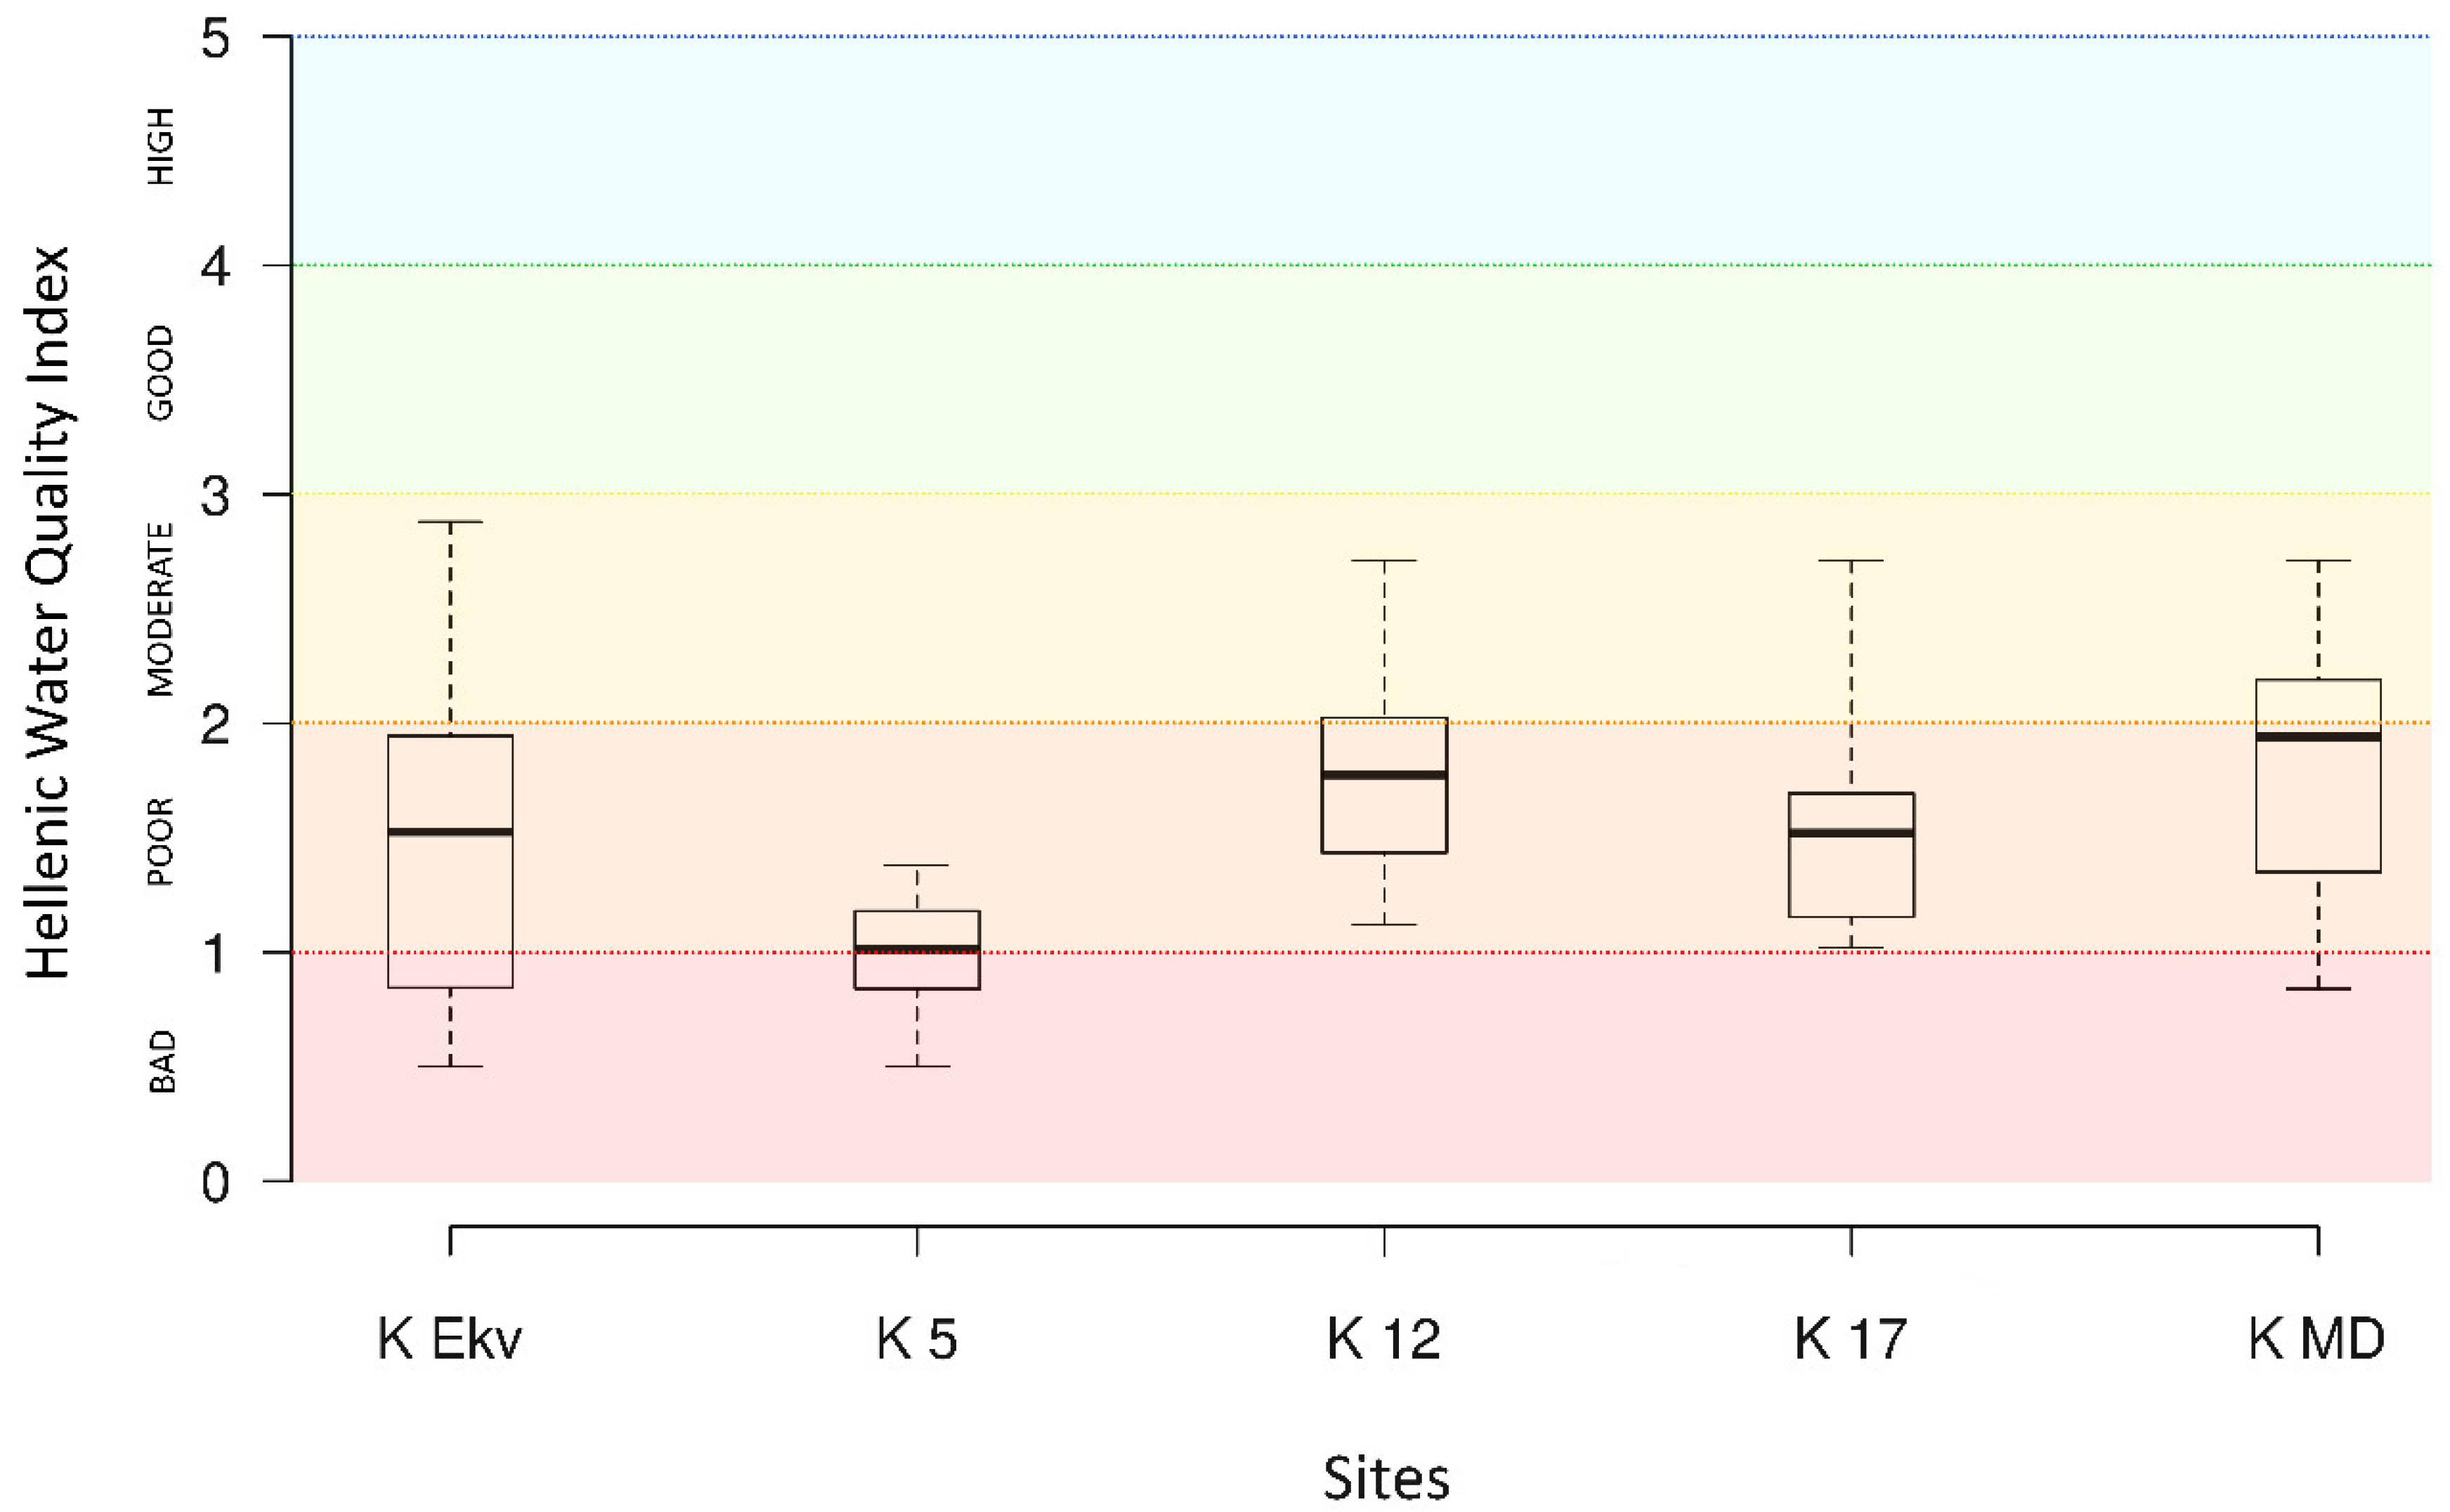
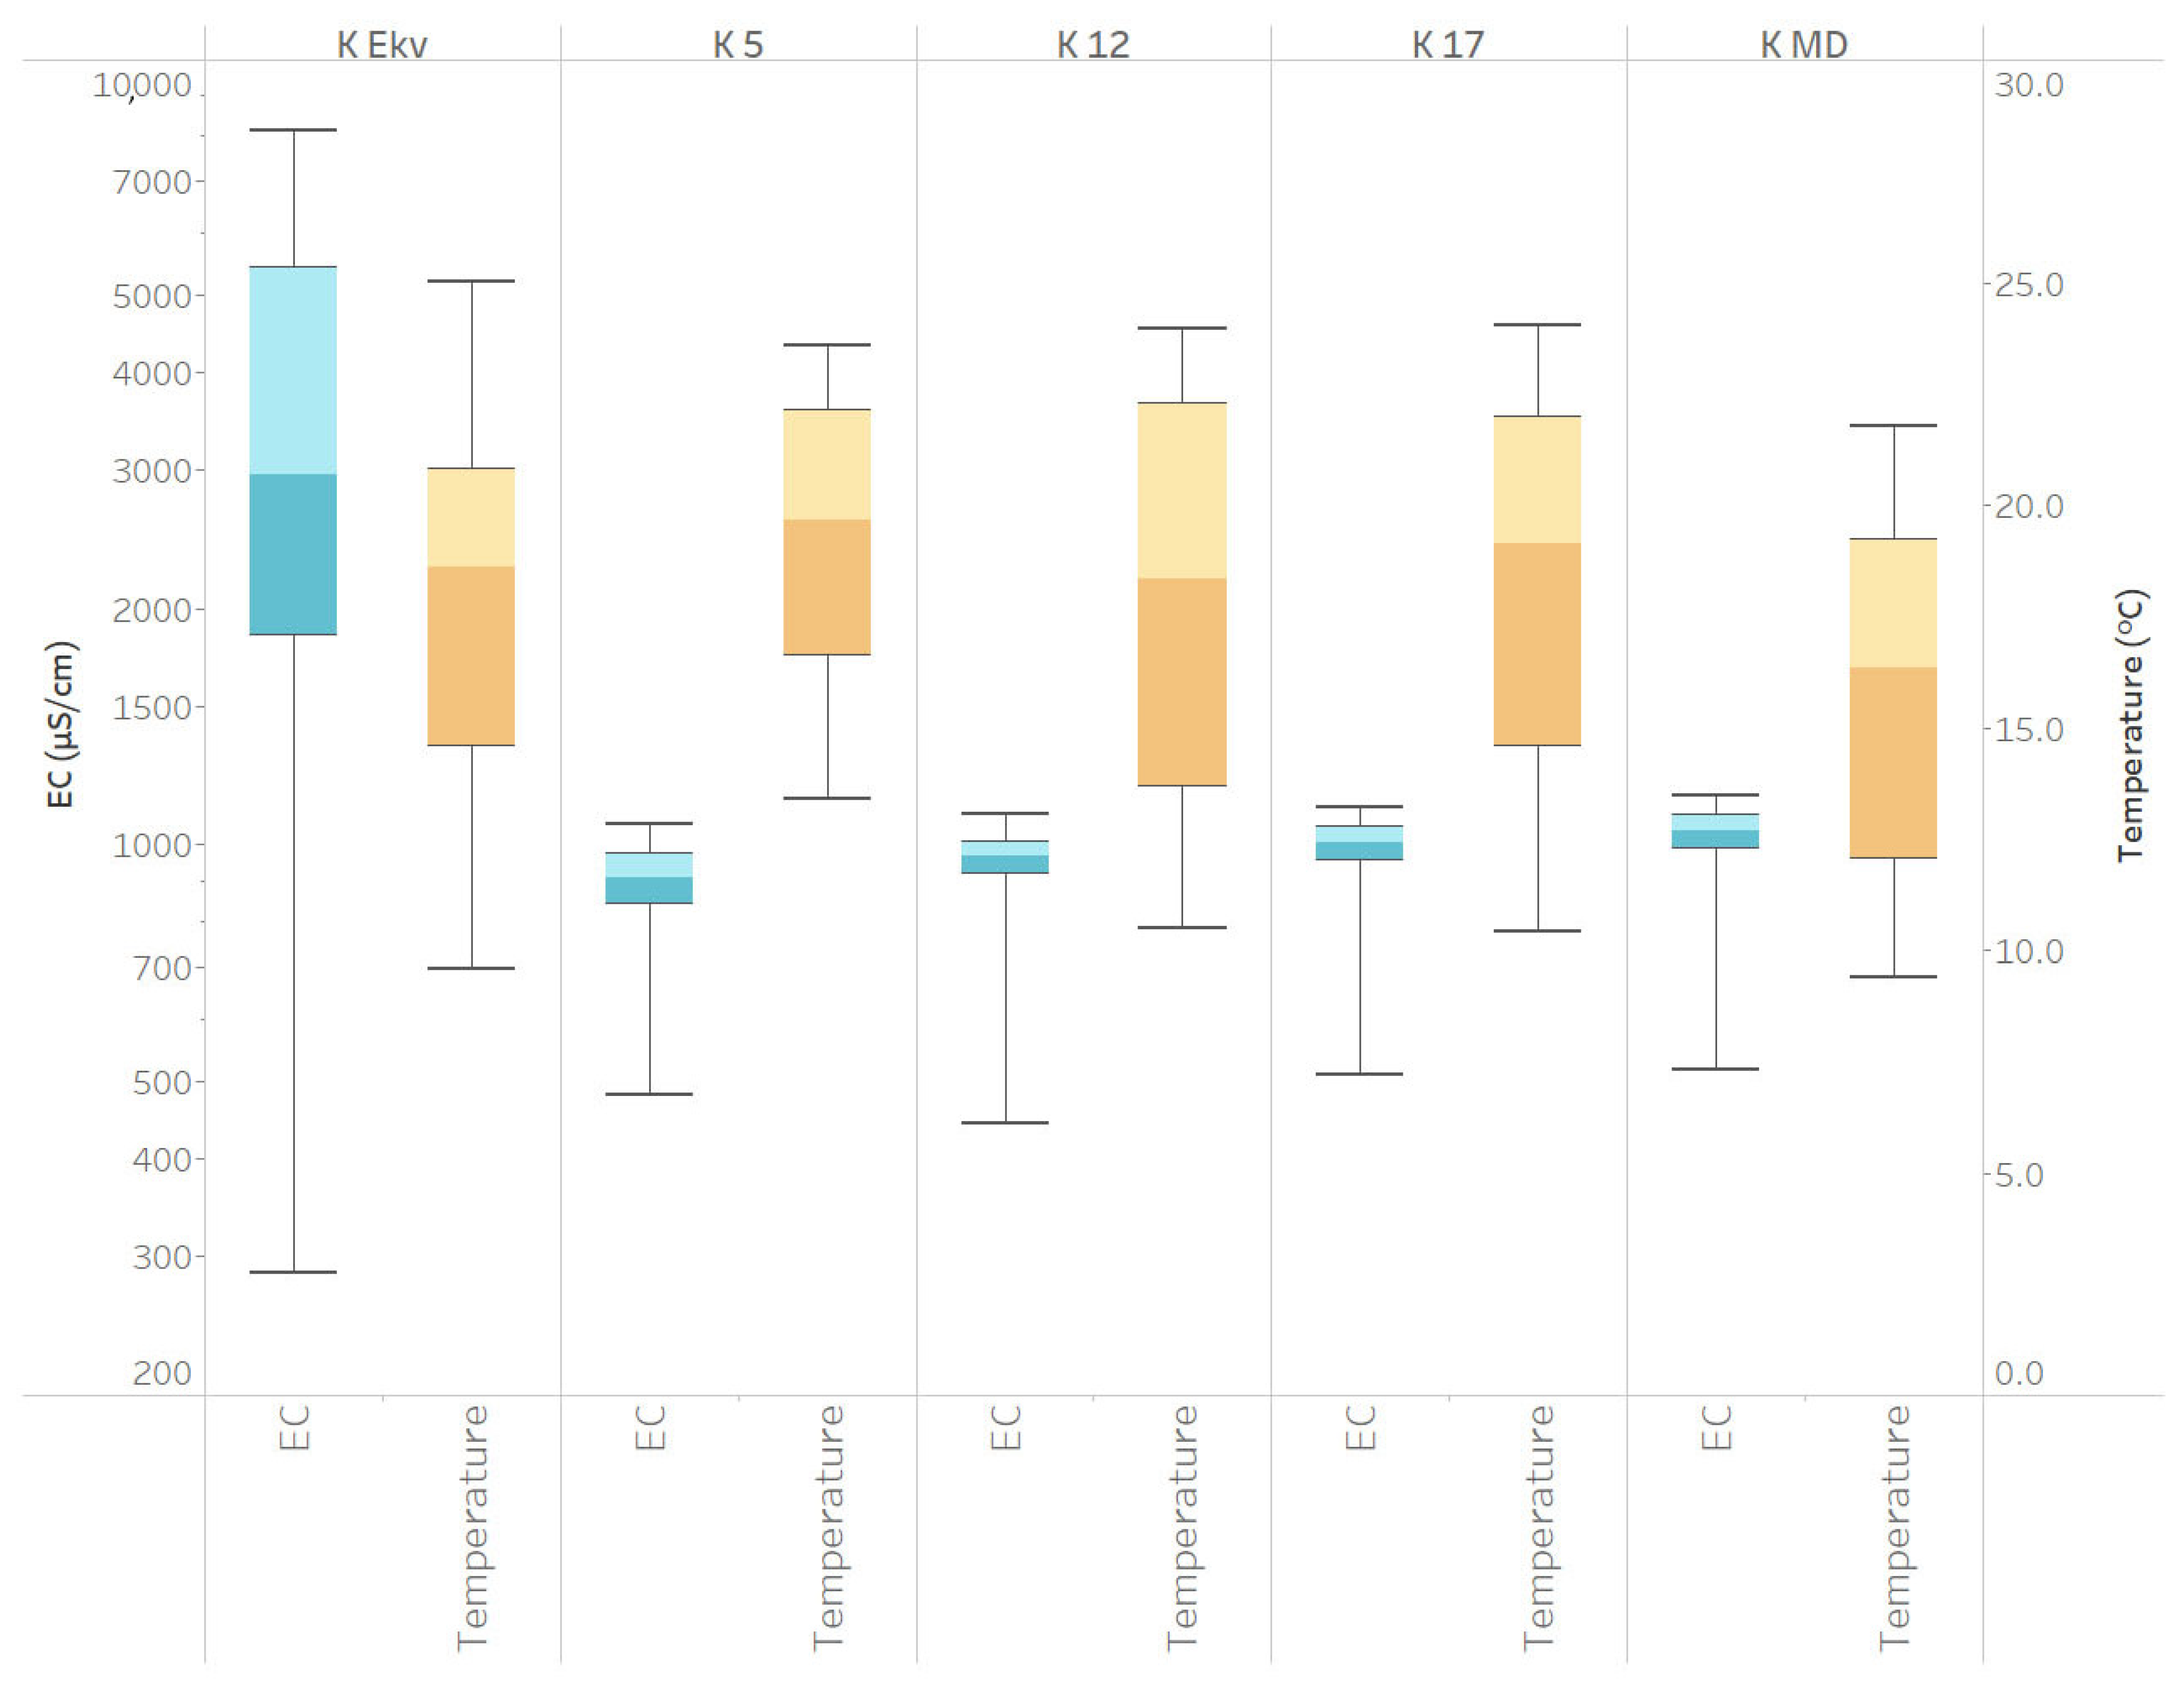
3.3. Physicochemical Fluctuations Analysis per Site

Figure 6 represents electrical conductivity (EC) (left axis) and temperature (T) (right axis) observations per sampling site. It was observed that the EC concentrations ranged from 286.3 μS/cm to 8146 μS/cm in water obtained from K Ekv. The wide variation at this sampling site, which is considerably different from the rest, is mainly due to seawater influence. The highest EC values in most all other cases were close to 1000 μS/cm. Such a value is within the expected range for fresh water in an urban river. K 17 and K MD had proximity in the EC minimum values (K 17: 513 μS/cm and K MD: 519 μS/cm), median (K 17: 1012 μS/cm and K MD: 1043.5 μS/cm) and maximum values (K 17: 1117 μS/cm and K MD: 1160 μS/cm). Water temperatures ranged from 9.4 to 25 (°C), which would pose no adverse effects on living organisms. K 12 and K 17 have proximity in their values, while K MD maximum, median and minimum values are lower compared to the other four sites.

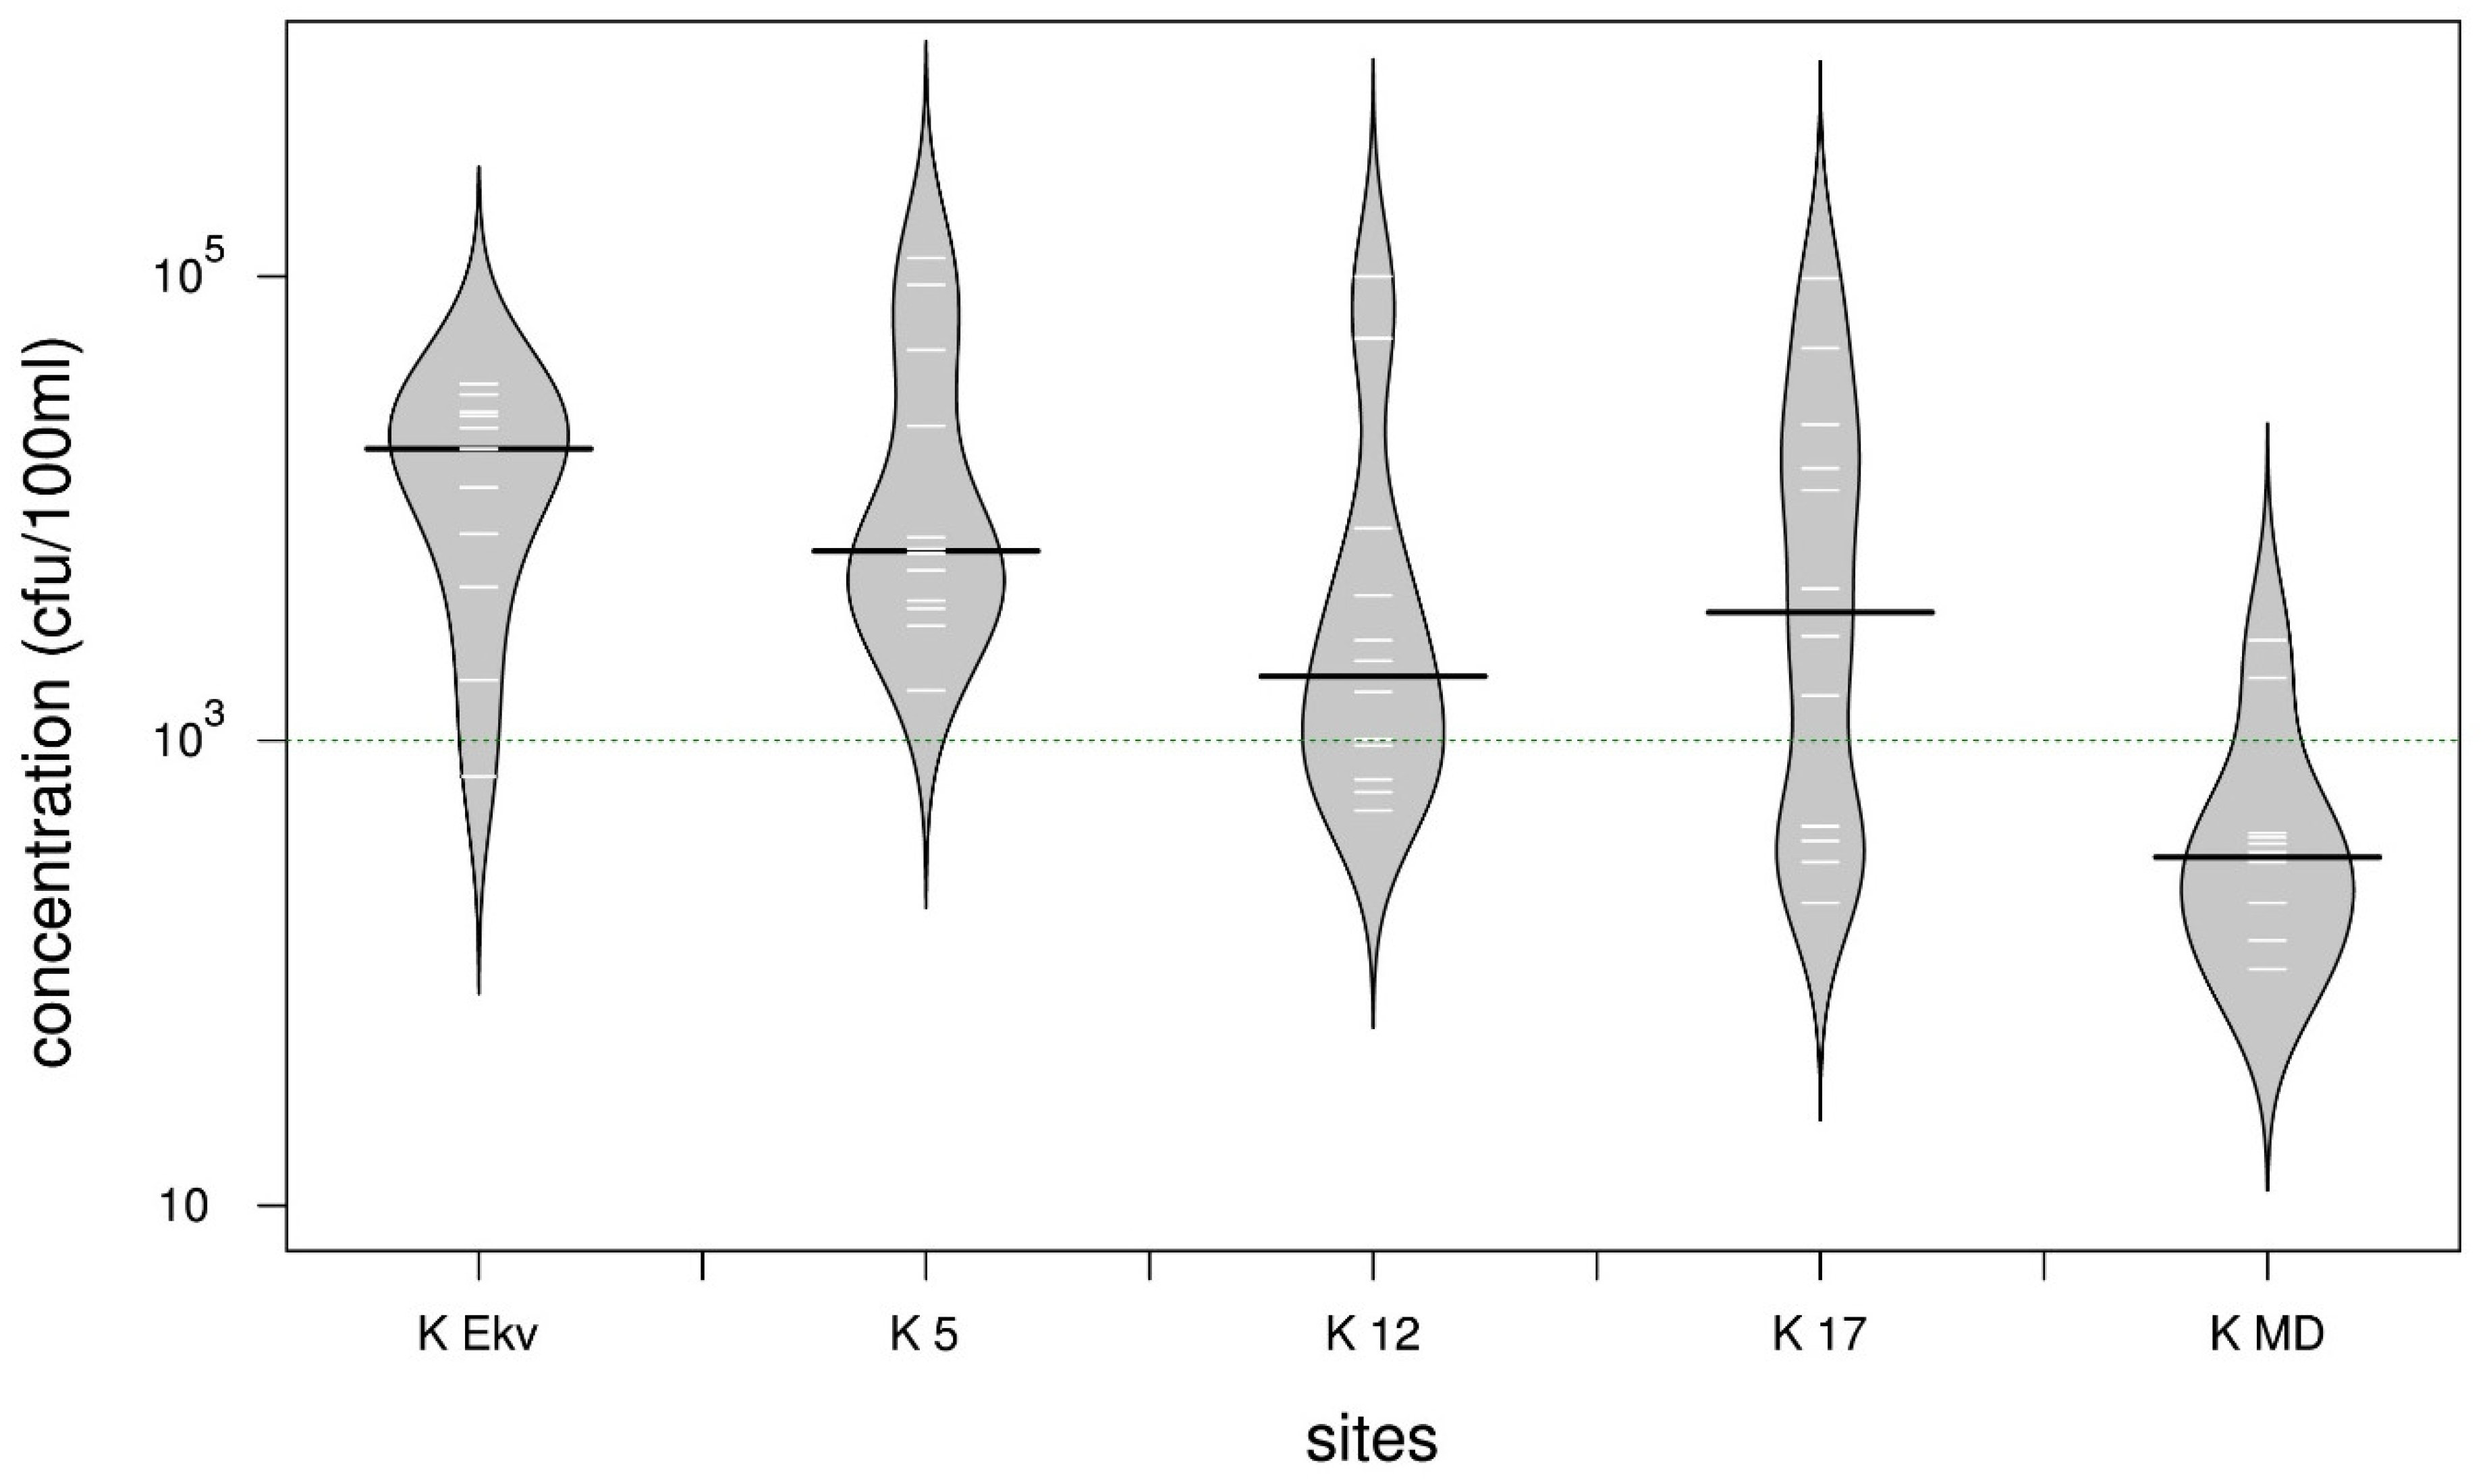
3.4. Variations of E. coli Concentrations per Site

Sampling sites of the Kifisos river had a large variation in E. coli concentrations during the examined period (Figure 7). A comparative assessment was made using the Hazen method, as recommended by WHO 2009, and results are presented in Table 3. The maximum admissible number as set by the EU Directive 2006/7/EC indicative of good quality conditions was exceeded on all occasions, with the highest value found being 117,200 (cfu/100 mL) at the K5 site.
Extremely high values were also found at the K 12 and K 17 sites (100,000 cfu/100 mL), while the lowest median value of E. coli was observed at K MD (Figure 7). These results are in accordance with the nutrient findings mentioned above since there is a tendency for pollution levels to increase from the upstream to the downstream part of the river, with the exception of K 5, which is a small branch of the river that is inside an industrial area and is heavily polluted.
Moreover, the Pearson correlation coefficient (r) per site was calculated (Table 4) to examine the patterns between E. coli and the physicochemical parameters (T, EC, pH and DO). A strong negative correlation was estimated between EC and E. coli for two (K 12 and K MD) out of five sites. For these two sites, EC and E. coli concentration linear regression models were developed. These models resulted in a coefficient of determination R-squared (R2) of 0.63 for the K MD site and an R2 of 0.15 for K 12.
TPAHs concentrations also indicated the existence of heavy pollution, and ranged from 17.2 (K MD) to 4541 ng/L (K 5), with a mean value of 764.3 ng/L. Additionally, TPAHs concentrations ranged from 8.1 (K MD) to 1050 μg/L (K 5), with a mean value of 313.8 μg/L (Table 5).

4. Discussion

As demonstrated by other researchers [3,8], the quality of recreational water must be of prescribed standards for both physicochemical and microbial quality. According to similar studies for urban rivers, Kifisos is not bathing water. However, it is used for recreational and commercial activities, where users can get in direct contact with the water via several activities (rowing, boating, kayaking, fishing and activities on the banks), making the Water Framework (2000/60/EC) as well as the bathing water (2006/7/EC) directives appropriate reference for risk assessment [7,24]. Additionally, the physicochemical water quality status of all five study locations during the sampling period was always below good threshold according to the WFD standards. Similar water quality conditions were estimated in previous studies for the Kifisos river [15].
Analysis with Spearman’s correlation demonstrated that the physicochemical water quality index (HWQI) was significantly correlated with NO2-N and NH4+-N and to a lesser degree PO4-P, which implies the substantial presence of human sewage in the river system. This is attributed to the very high levels of E. coli, for which the maximum admissible E. coli concentration, as set by the EU directives, was exceeded on all occasions. EC can indirectly influence the presence and behavior of E. coli since it is often associated with the concentration of dissolved ions in water, including nutrients like phosphates and nitrates, which may support the growth and survival of E. coli bacteria. These contaminants could originate from various sources, such as industrial discharges or agricultural runoff, and can affect the viability of E. coli populations. However, EC is not a direct measure of E. coli presence or concentration. A coefficient of determination R-squared (R2) of 0.63 for the K MD site indicated that the two variables are likely related to each other. However, more data are necessary for decisive validation of the relationships illuminated in this study.
Pollution of the Kifisos river with human sewage likely occurs when the sewer system gets overloaded during heavy rainfall events, during illegal disposal of industrial and domestic waste, livestock farming effluents and other illegal point pollution sources. Other studies [25,26] found similar causes that led to water quality deterioration in urban rivers. Citizen engagement is important to monitor and improve river water quality effectively and achieve the goal of a progressive reduction in discharges from the point and non-point pollution sources, coupled with knowledge on factors that are related to urban riverscapes and recreational uses [27].
We conducted this preliminary study examining the Kifisos river to analyze its water quality status, including physicochemical parameters, nutrients, E. coli and polycyclic aromatic hydrocarbons concentrations. The results indicated the significant water quality degradation of the river, particularly at downstream stations, between the stations K 17 and K Ekv, probably triggered by urban runoff, illegal sewage and industrial waste disposal. K 17 and K 5 are the stations with the worse quality status, which was expected due to their close proximity to industrial areas. Even the upstream station (K MD) illustrated a poor or bad physicochemical water quality status in more than 50% of the sampling efforts. An existing study [28] for the Kifisos river revealed similar influence by anthropogenic activities regarding major elements (nitrate and phosphate concentrations). Another study [29] revealed that the Kifisos river is highly polluted and ranked the river’s quality as very poor regarding species diversity. In the current study, the average E. coli concentration was significantly high at all stations, characterizing the water as bad quality, while the total polycyclic aromatic hydrocarbons (TPAHs) results indicated the existence of significant pollution. More specifically, the TPAHs and TH concentrations detected along the river (particularly in K 5 site) indicated the presence of pollutants originating from petroleum sources. Our results regarding the levels of the ΤPAHs and THs are similar to other studies in urban areas [16,30]. High TPAHs and THs values should most likely be attributed to road runoff from heavy traffic highways adjacent to the river. Point source pollution from industries located along the route of the river should also be examined. Moreover, other manmade chemicals, such as heavy metals and pesticides, can also impact water quality and aquatic ecosystems. Therefore, monitoring should be done in conjunction with other water quality assessments to provide a comprehensive evaluation of river health. All of the above indicate the necessity of continuous environmental monitoring at certain points of the river and legal investigations to identify the specific polluters in order to undertake the necessary restoration actions.
In the future, a multi-pollutant modelling approach would help to better understand and manage water quality issues, since monthly sampling is unlikely to offer the necessary information for classifying the water quality status accurately [31]. These issues can be addressed by field-deployable water quality analyzers designed to continuously measure concentrations of pollutants in freshwater [32]. Switching to sustainable uses of freshwater resources is critical for minimizing land degradation and biodiversity loss [33].
From a water quality management perspective, it is evident that continuous environmental monitoring at certain points of the rivers is essential to reduce uncertainty in the results. High frequency samplings with the adoption of modern sensors can provide high frequency data [34] and substantially larger datasets to reduce uncertainty of pollution load estimates, particularly in urban rivers with multiple stressors, such as the Kifisos river [35].

5. Conclusions

This study is a scientific attempt to understand the dominant pollution pressures and their spatiotemporal patterns in the Kifisos river in the context of the EU Water Framework Directive. Bacteriological quality of the water in the Kifisos river was unacceptable, as the study demonstrated the widespread occurrence of E. coli and low-quality physiochemical conditions. There is no clear cut-off value at which health effects are excluded. However, the increased microbial numbers can cause recreational water quality deterioration, and it is a major problem for urban rivers such as the Kifisos river. In order to avoid further degradation and continuous decline of the ecological status of the Kifisos river, several protection and restoration measures should be undertaken within the framework of the existing EU and national policies. Additionally, we recommend legal investigations to identify polluters and undertake the necessary legal and environmental restoration actions. Surface runoff should be also included in future studies to investigate the accuracy and description of pollutant transfer processes during rainfall events and their effect on the total pollutant load of urban rivers.

Supplementary Materials

The following supporting information can be downloaded at: https://www.mdpi.com/article/10.3390/app13116698/s1, Table S1: Physicochemical data of Temperature (T), Electrical Conductivity (EC), Salinity, pH, Dissolved Oxygen (DO) and nitrate-nitrogen as NO3-N, nitrite-nitrogen as NO2-N, Ammonium-Nitrogen as NH4+-N, Dissolved Inorganic Nitrogen as DIN, Total Nitrogen as TN, Orthophosphate as PO4-P, Total Phosphorus as TP, Escherichia Coli as E. coli and Hellenic Water Quality Index as HWQI.

Author Contributions

Conceptualization, C.P. and E.D.; Investigation, S.L.; Resources, E.D.; Data curation, C.P. and E.D.; Writing—original draft, C.P.; Writing—review & editing, S.L. and E.D.; Visualization, C.P. All authors have read and agreed to the published version of the manuscript.

Funding

This research received no external funding.

Institutional Review Board Statement

Not applicable.

Data Availability Statement

Data is contained within the Supplementary Materials Table S1.

Conflicts of Interest

The authors declare no conflict of interest.

References

  1. Dimitriou, E.; Markogianni, V.; Mentzafou, A.; Karaouzas, I.; Zogaris, S. Ecological status assessment of Pikrodafni stream (Attica, Greece), restoration and management measures. Desalin. Water Treat. 2015, 56, 1248–1255. [Google Scholar] [CrossRef]
  2. Yang, L.; Li, J.; Zhou, K.; Feng, P.; Dong, L. The effects of surface pollution on urban river water quality under rainfall events in Wuqing district, Tianjin, China. J. Clean. Prod. 2021, 293, 126136. [Google Scholar] [CrossRef]
  3. McGrane, S.J. Impacts of urbanisation on hydrological and water quality dynamics, and urban water management: A review. Hydrol. Sci. J. 2016, 61, 2295–2311. [Google Scholar] [CrossRef]
  4. Papadaki, C.; Dimitriou, E. River Flow Alterations Caused by Intense Anthropogenic Uses and Future Climate Variability Implications in the Balkans. Hydrology 2021, 8, 7. [Google Scholar] [CrossRef]
  5. Tomczyk, P.; Wiatkowski, M.; Kuriqi, A. Small Hydropower Plants’ Impacts on the Ecological Status Indicators of Urban Rivers. Appl. Sci. 2022, 12, 12882. [Google Scholar] [CrossRef]
  6. Patil, P.N. Physico-Chemical Parameters for Testing of Water-A Review IPA-Under Creative Commons License 3.0 Physico-chemical Parameters for Testing of Water—A Review. 2012. Available online: https://www.chemijournal.com/vol3Issue4/pdf/3-3-8.1.pdf (accessed on 27 April 2023).
  7. Davis, L.J.; Milligan, R.; Stauber, C.E.; Jelks, N.O.; Casanova, L.; Ledford, S.H. Environmental injustice and Escherichia coli in urban streams: Potential for community-led response. Wiley Interdiscip. Rev. Water 2022, 9, e1583. [Google Scholar] [CrossRef]
  8. Fewtrell, L.; Kay, D. Recreational Water and Infection: A Review of Recent Findings. Curr. Environ. Health Rep. 2015, 2, 85–94. [Google Scholar] [CrossRef]
  9. Manoli, E.; Samara, C. Polycyclic aromatic hydrocarbons in natural waters: Sources, occurrence and analysis. TrAC Trends Anal. Chem. 1999, 18, 417–428. [Google Scholar] [CrossRef]
  10. Whitehead, A.; Fraser, C.; Snelder, T.; Walter, K.; Woodward, S.; Zammit, C. Water Quality State and Trends in New Zealand Rivers: Analyses of National Data Ending in 2020; 2021296CH; National Institute of Water & Atmospheric Research Ltd.: Auckland, New Zealand, 2022. Available online: https://environment.govt.nz/publications/water-quality-state-and-trends-in-new-zealand-rivers-analyses-of-national-data-ending-in-2020/ (accessed on 17 March 2023).
  11. Wiedenmann, A.; Krüger, P.; Dietz, K.; López-Pila, J.M.; Szewzyk, R.; Botzenhart, K. A Randomized Controlled Trial Assessing Infectious Disease Risks from Bathing in Fresh Recreational Waters in Relation to the Concentration of Escherichia coli, Intestinal Enterococci, Clostridium perfringens, and Somatic Coliphages. Environ. Health Perspect. 2006, 114, 228–236. Available online: http://www.jstor.org/stable/3436514 (accessed on 30 May 2023). [CrossRef]
  12. Bartram, J.; Rees, G. (Eds.) Monitoring Bathing Waters: A Practical Guide to the Design and Implementation of Assessments and Monitoring Programmes, 1st ed.; CRC Press: Boca Raton, FL, USA, 1999. [Google Scholar] [CrossRef]
  13. Mojiri, A.; Zhou, J.L.; Ohashi, A.; Ozaki, N.; Kindaichi, T. Comprehensive review of polycyclic aromatic hydrocarbons in water sources, their effects and treatments. Sci. Total Environ. 2019, 696, 133971. [Google Scholar] [CrossRef]
  14. Zhang, Y.; Tao, S. Global atmospheric emission inventory of polycyclic aromatic hydrocarbons (PAHs) for 2004. Atmospheric Environ. 2009, 43, 812–819. [Google Scholar] [CrossRef]
  15. Panagopoulos, Y.; Alexakis, D.E.; Skoulikidis, N.T.; Laschou, S.; Papadopoulos, A.; Dimitriou, E. Implementing the CCME Water Quality Index for the Evaluation of the Physicochemical Quality of Greek Rivers. Water 2022, 14, 2738. [Google Scholar] [CrossRef]
  16. Markogianni, V.; Anastasopoulou, E.; Tsoupras, A.; Dimitriou, E. Identification of Pollution Patterns and Sources in a Semi-Arid Urban Stream. J. Ecol. Eng. 2018, 19, 99–113. [Google Scholar] [CrossRef]
  17. Mentzafou, A.; Panagopoulos, Y.; Dimitriou, E. Designing the National Network for Automatic Monitoring of Water Quality Parameters in Greece. Water 2019, 11, 1310. [Google Scholar] [CrossRef]
  18. Skoulikidis, N.; Amaxidis, Y.; Bertahas, I.; Laschou, S.; Gritzalis, K. Analysis of factors driving stream water composition and synthesis of management tools—A case study on small/medium Greek catchments. Sci. Total Environ. 2006, 362, 205–241. [Google Scholar] [CrossRef]
  19. Skoulikidis, N.T. Defining chemical status of a temporary Mediterranean River. J. Environ. Monit. 2008, 10, 842–852. [Google Scholar] [CrossRef]
  20. Zeri, C.; Adamopoulou, A.; Koi, A.; Koutsikos, N.; Lytras, E.; Dimitriou, E. Rivers and Wastewater-Treatment Plants as Microplastic Pathways to Eastern Mediterranean Waters: First Records for the Aegean Sea, Greece. Sustainability 2021, 13, 5328. [Google Scholar] [CrossRef]
  21. Diakakis, M. An inventory of flood events in Athens, Greece, during the last 130 years. Seasonality and spatial distribution. J. Flood Risk Manag. 2013, 7, 332–343. [Google Scholar] [CrossRef]
  22. Panagiotopoulos, I.; Kapsimalis, V.; Hatzianestis, I.; Kanellopoulos, T.D.; Kyriakidou, C. Environmental status of the metropolitan river (Kifissos) of Athens, Greece. Environ. Earth Sci. 2010, 61, 983–993. [Google Scholar] [CrossRef]
  23. Koutsoyiannis, D.; Markonis, Y.; Koukouvinos, A.; Papalexiou, S.M.; Mamassis, N.; Dimitriadis, P. Hydrological study of severe rainfall in the Kephisos basin, Greece. In Study of the Management of Kephisos, Commissioner: General Secretariat of Public Works–Ministry of Environment, Planning and Public Works, Contractors; Bensasson, E.N., Karavokiris, D.G., Eds.; Kallipos Open Academic: Athens, Greece, 2010; 154p, Available online: https://www.itia.ntua.gr/en/docinfo/970/ (accessed on 27 April 2023).
  24. Amirat, L.; Wildeboer, D.; Abuknesha, R.A.; Price, R.G. Escherichia coli contamination of the river Thames. Water Environ. J. 2012, 26, 482–489. [Google Scholar] [CrossRef]
  25. Mackowiak, M.; Leifels, M.; Hamza, I.; Jurzik, L.; Wingender, J. Distribution of Escherichia coli, coliphages and enteric viruses in water, epilithic biofilms and sediments of an urban river in Germany. Sci. Total Environ. 2018, 626, 650–659. [Google Scholar] [CrossRef] [PubMed]
  26. Yang, X.; Liu, Q.; Luo, X.; Zheng, Z. Spatial Regression and Prediction of Water Quality in a Watershed with Complex Pollution Sources. Sci. Rep. 2017, 7, 8318. [Google Scholar] [CrossRef] [PubMed]
  27. Grzyb, T.; Kulczyk, S. How do ephemeral factors shape recreation along the urban river? A social media perspective. Landsc. Urban Plan. 2023, 230, 104638. [Google Scholar] [CrossRef]
  28. Argyraki, A.; Paraskos, F.; Marmara, M.; Papadopoulou, K.; Maglaropoulou, A. Comparative geochemistry of three urban streams in Athens: Kifissos-Podoniftis-Pikrodafni. In Proceedings of the 13th International Congress of the Geological Society of Greece, Chania, Greece, 5–8 September 2013; Available online: http://geolib.geo.auth.gr/digeo/index.php/bgsg/article/view/10693 (accessed on 27 April 2023).
  29. Koutsomitrou, D.; Detsis, V.; Efthimiou, G.; Economou-Amilli, A. Water quality and condition of riverbanks of Kifisos River, Attica, Greece. J. Int. Sci. Publ. Ecol. Saf. 2014, 8, 249–258. Available online: https://www.scientific-publications.net/en/article/1000095/ (accessed on 30 May 2023).
  30. Adeniji, A.O.; Okoh, O.O.; Okoh, A.I. Levels of Polycyclic Aromatic Hydrocarbons in the Water and Sediment of Buffalo River Estuary, South Africa and Their Health Risk Assessment. Arch. Environ. Contam. Toxicol. 2019, 76, 657–669. [Google Scholar] [CrossRef]
  31. Piniewski, M.; Marcinkowski, P.; Koskiaho, J.; Tattari, S. The effect of sampling frequency and strategy on water quality modelling driven by high-frequency monitoring data in a boreal catchment. J. Hydrol. 2019, 579, 124186. [Google Scholar] [CrossRef]
  32. Panagopoulos, Y.; Papadopoulos, A.; Poulis, G.; Nikiforakis, E.; Dimitriou, E. Assessment of an Ultrasonic Water Stage Monitoring Sensor Operating in an Urban Stream. Sensors 2021, 21, 4689. [Google Scholar] [CrossRef]
  33. Papadaki, C. Chapter 7-Sustainable use of mountain water resources. In Environmental Water Requirements in Mountainous Areas; Dimitriou, E., Papadaki, C., Eds.; Elsevier: Amsterdam, The Netherlands, 2021; pp. 281–292. [Google Scholar] [CrossRef]
  34. Dimitriou, E. Chapter 8-Technological innovations for the estimation of environmental water requirements. In Environmental Water Requirements in Mountainous Areas; Dimitriou, E., Papadaki, C., Eds.; Elsevier: Amsterdam, The Netherlands, 2021; pp. 293–307. [Google Scholar] [CrossRef]
  35. Coraggio, E.; Han, D.; Gronow, C.; Tryfonas, T. Water Quality Sampling Frequency Analysis of Surface Freshwater: A Case Study on Bristol Floating Harbour. Front. Sustain. Cities 2022, 3, 791595. [Google Scholar] [CrossRef]
Figure 1. Kifisos catchment and location of the five sampling sites (K Ekv, K 5, K 12, K 17, K MD).
Applsci 13 06698 g001
Figure 2. Variation of temperature with orthophosphates (PO4-P) and total phosphorus (TP) in Kifisos river.
Applsci 13 06698 g002
Figure 3. Distribution of NO3-N and TN values at the sampling sites from upstream (K MD) to the river mouth (K Ekv). The dotted lines indicate good (green) and bad (red) thresholds for NO3-N according to the WFD provisions.
Applsci 13 06698 g003
Figure 4. Distribution of PO4-P and TP values in the sites from upstream (K MD) to the river mouth (K Ekv). The dotted lines indicate good (green) and bad (red) thresholds for PO4-P according to the WFD provisions.
Applsci 13 06698 g004
Figure 5. Box plots per sampling site for the visual representation of the HWQI (HWQI estimated with the use of six water parameters: five nutrient species and DO; colors that indicate the relative water quality conditions: red = bad, orange = poor, yellow = moderate, green = good and blue = high).
Applsci 13 06698 g005
Figure 6. Box plots per sampling site for electrical conductivity (blue grading plots) and temperature (yellow grading plots). Light colors represent values above the median and dark colors represent values below the median; box limits indicate the 25th and 75th percentiles; whiskers extend to minimum and maximum values.
Applsci 13 06698 g006
Figure 7. Black lines show the medians; white lines represent individual data points, while the gray area shows the distributions. Green line indicates the good quality threshold according to the EU Directive 2006/7/EC.
Applsci 13 06698 g007
Table 1. Test of normality (Shapiro–Wilk).
NoParameter (Unit)Statisticp Value *
1pH0.9720.182
2DO (mg/L)0.9710.160
3DIN (mg/L)0.9610.054
4Salinity (ppt)0.524<0.001
5TN (mg/L)0.9530.027
6TP (mg/L)0.917<0.001
7T (°C)0.9520.019
8EC (μS/cm)0.539<0.001
9NO3-N (mg/L)0.9440.006
10NO2-N (mg/L)0.508<0.001
11NH4+-N (mg/L)0.551<0.001
12PO4-P (mg/L)0.460<0.001
13E. coli (cfu/100 mL)0.604<0.001
* p values in bold were considered statistically significant at a 95% confidence interval.
Table 2. Spearman’s correlation among the examined parameters (bold numbers are statistically significant with p < 0.05) *.
pHDODINSalinityTNTPTECNO3-NNO2-NNH4+-NPO4-PE coliHWQI
pH1.00
DO0.611.00
DIN−0.06−0.311.00
Salinity−0.42−0.310.071.00
TN−0.04−0.29−0.010.031.00
TP−0.07−0.310.49−0.120.49−0.23
T−0.25−0.490.270.090.280.541.00
EC−0.39−0.300.060.960.03−0.070.141.00
NO3-N0.030.010.560.380.540.110.040.401.00
NO2-N−0.17−0.430.590.100.600.330.270.100.061.00
NH4+-N−0.12−0.320.40−0.100.420.200.10−0.11−0.230.811.00
PO4-P−0.08−0.320.46−0.100.460.990.53−0.050.110.300.181.00
E coli0.00−0.350.16−0.180.19−0.030.16−0.19−0.170.450.48−0.061.00
HWQI0.050.57−0.52−0.01−0.54−0.57−0.44−0.07−0.09−0.76−0.69−0.55−0.291.00
* The data supporting the findings of this study are described in Supplementary File Table S1 (Supplementary Materials).
Table 3. Hazen method results for E. coli values (cfu/100 mL) for each site of Kifisos river.
SiteK EKVK 5K 12K 17K MD
Percentile9595959595
Data minimum7001640500200100
Data maximum34,400120,000100,00098,0002700
Hazen result34,060117,20095,40093,1002616
Table 4. Pearson correlation coefficient (r) per site between E. coli and the physicochemical parameters (bold values are statistically significant with p < 0.01).
Site/rT
(°C)
EC
(μS/cm)
pHDO (mg/L)
K Ekv0.10.10.20.0
K 5−0.2−0.20.1−0.2
K 12−0.3−0.80.0−0.1
K 17−0.3−0.10.10.2
K MD−0.1−0.8−0.30.0
Table 5. Total polycyclic aromatic hydrocarbons (ΤPAHs) and total hydrocarbons (THs) concentrations.
TPAHs (ng/L)THs (μg/L)
SiteSeptember
2021
February
2022
September
2021
February
2022
K Εkv1272.0112.7382.820.4
K 54541.6402.8105084.2
K 12147.5168.991.254.1
K 17106.8728.0924468.0
K MD145.717.255.28.1
Disclaimer/Publisher’s Note: The statements, opinions and data contained in all publications are solely those of the individual author(s) and contributor(s) and not of MDPI and/or the editor(s). MDPI and/or the editor(s) disclaim responsibility for any injury to people or property resulting from any ideas, methods, instructions or products referred to in the content.

