

Predicting Rutting Development of Pavement with Flexible Overlay Using Artificial Neural Network

Abstract
:1. Introduction
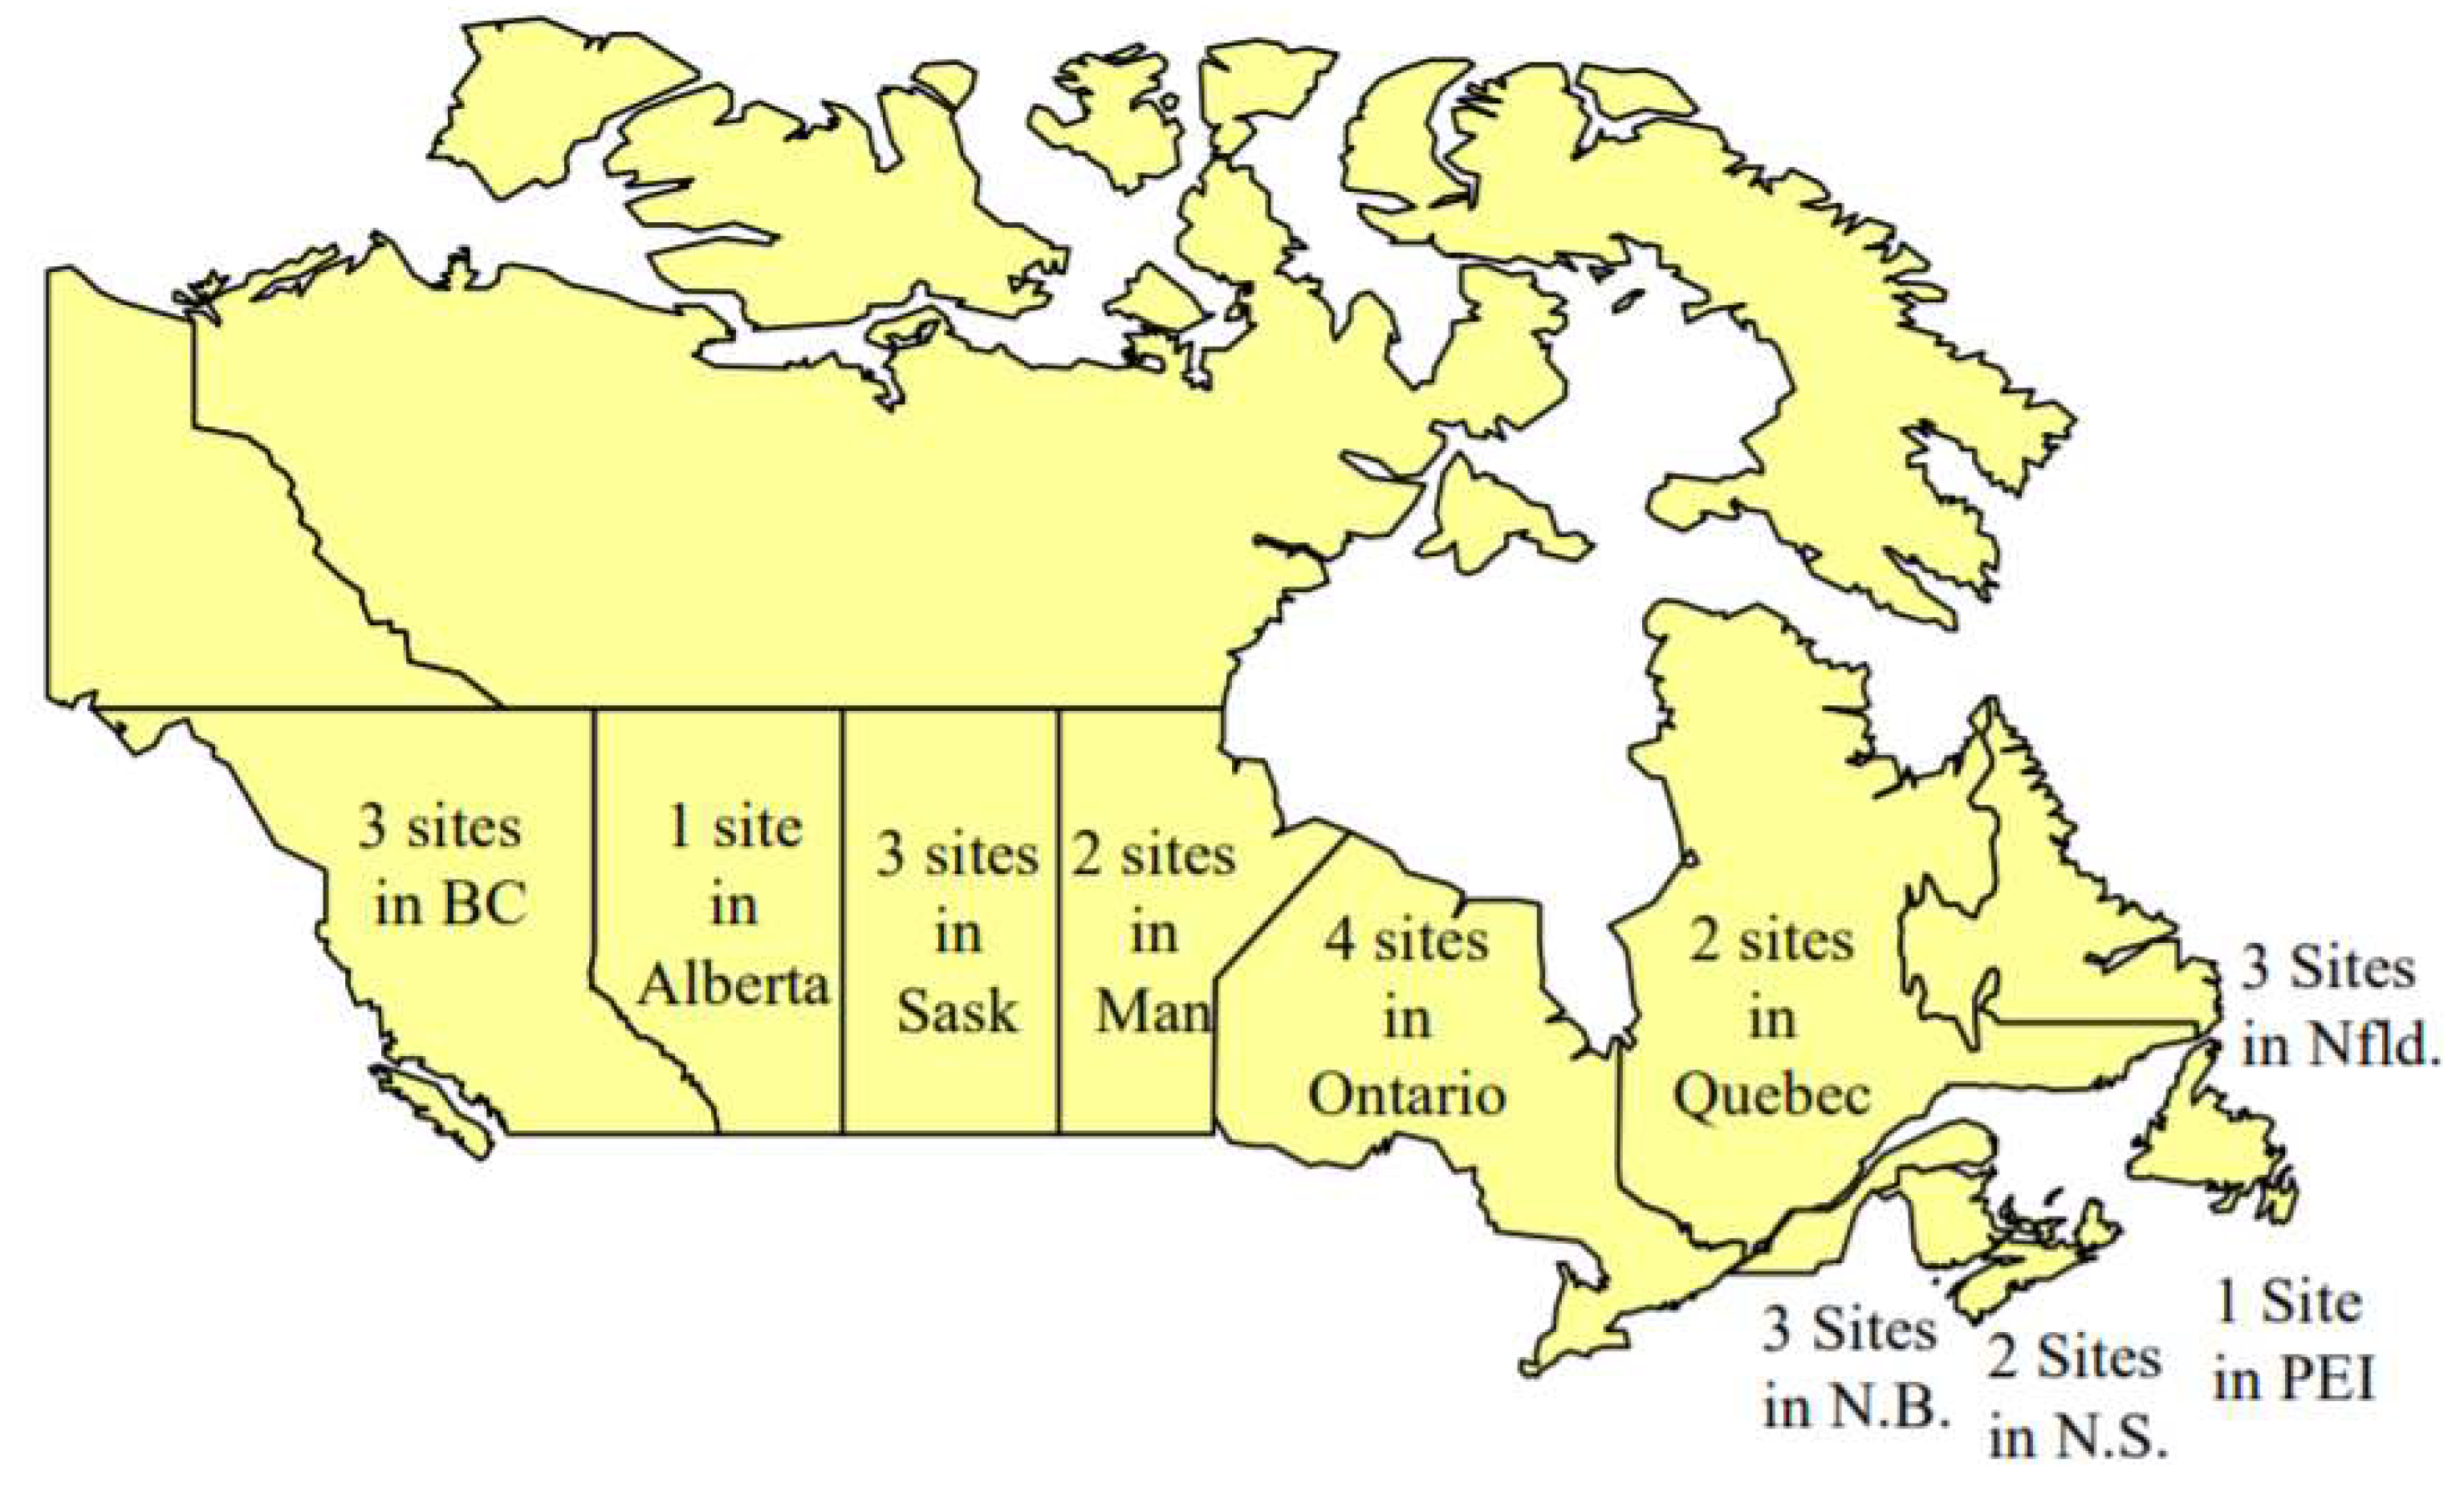
2. Data Preparation
3. Rutting Prediction
3.1. Data Processing
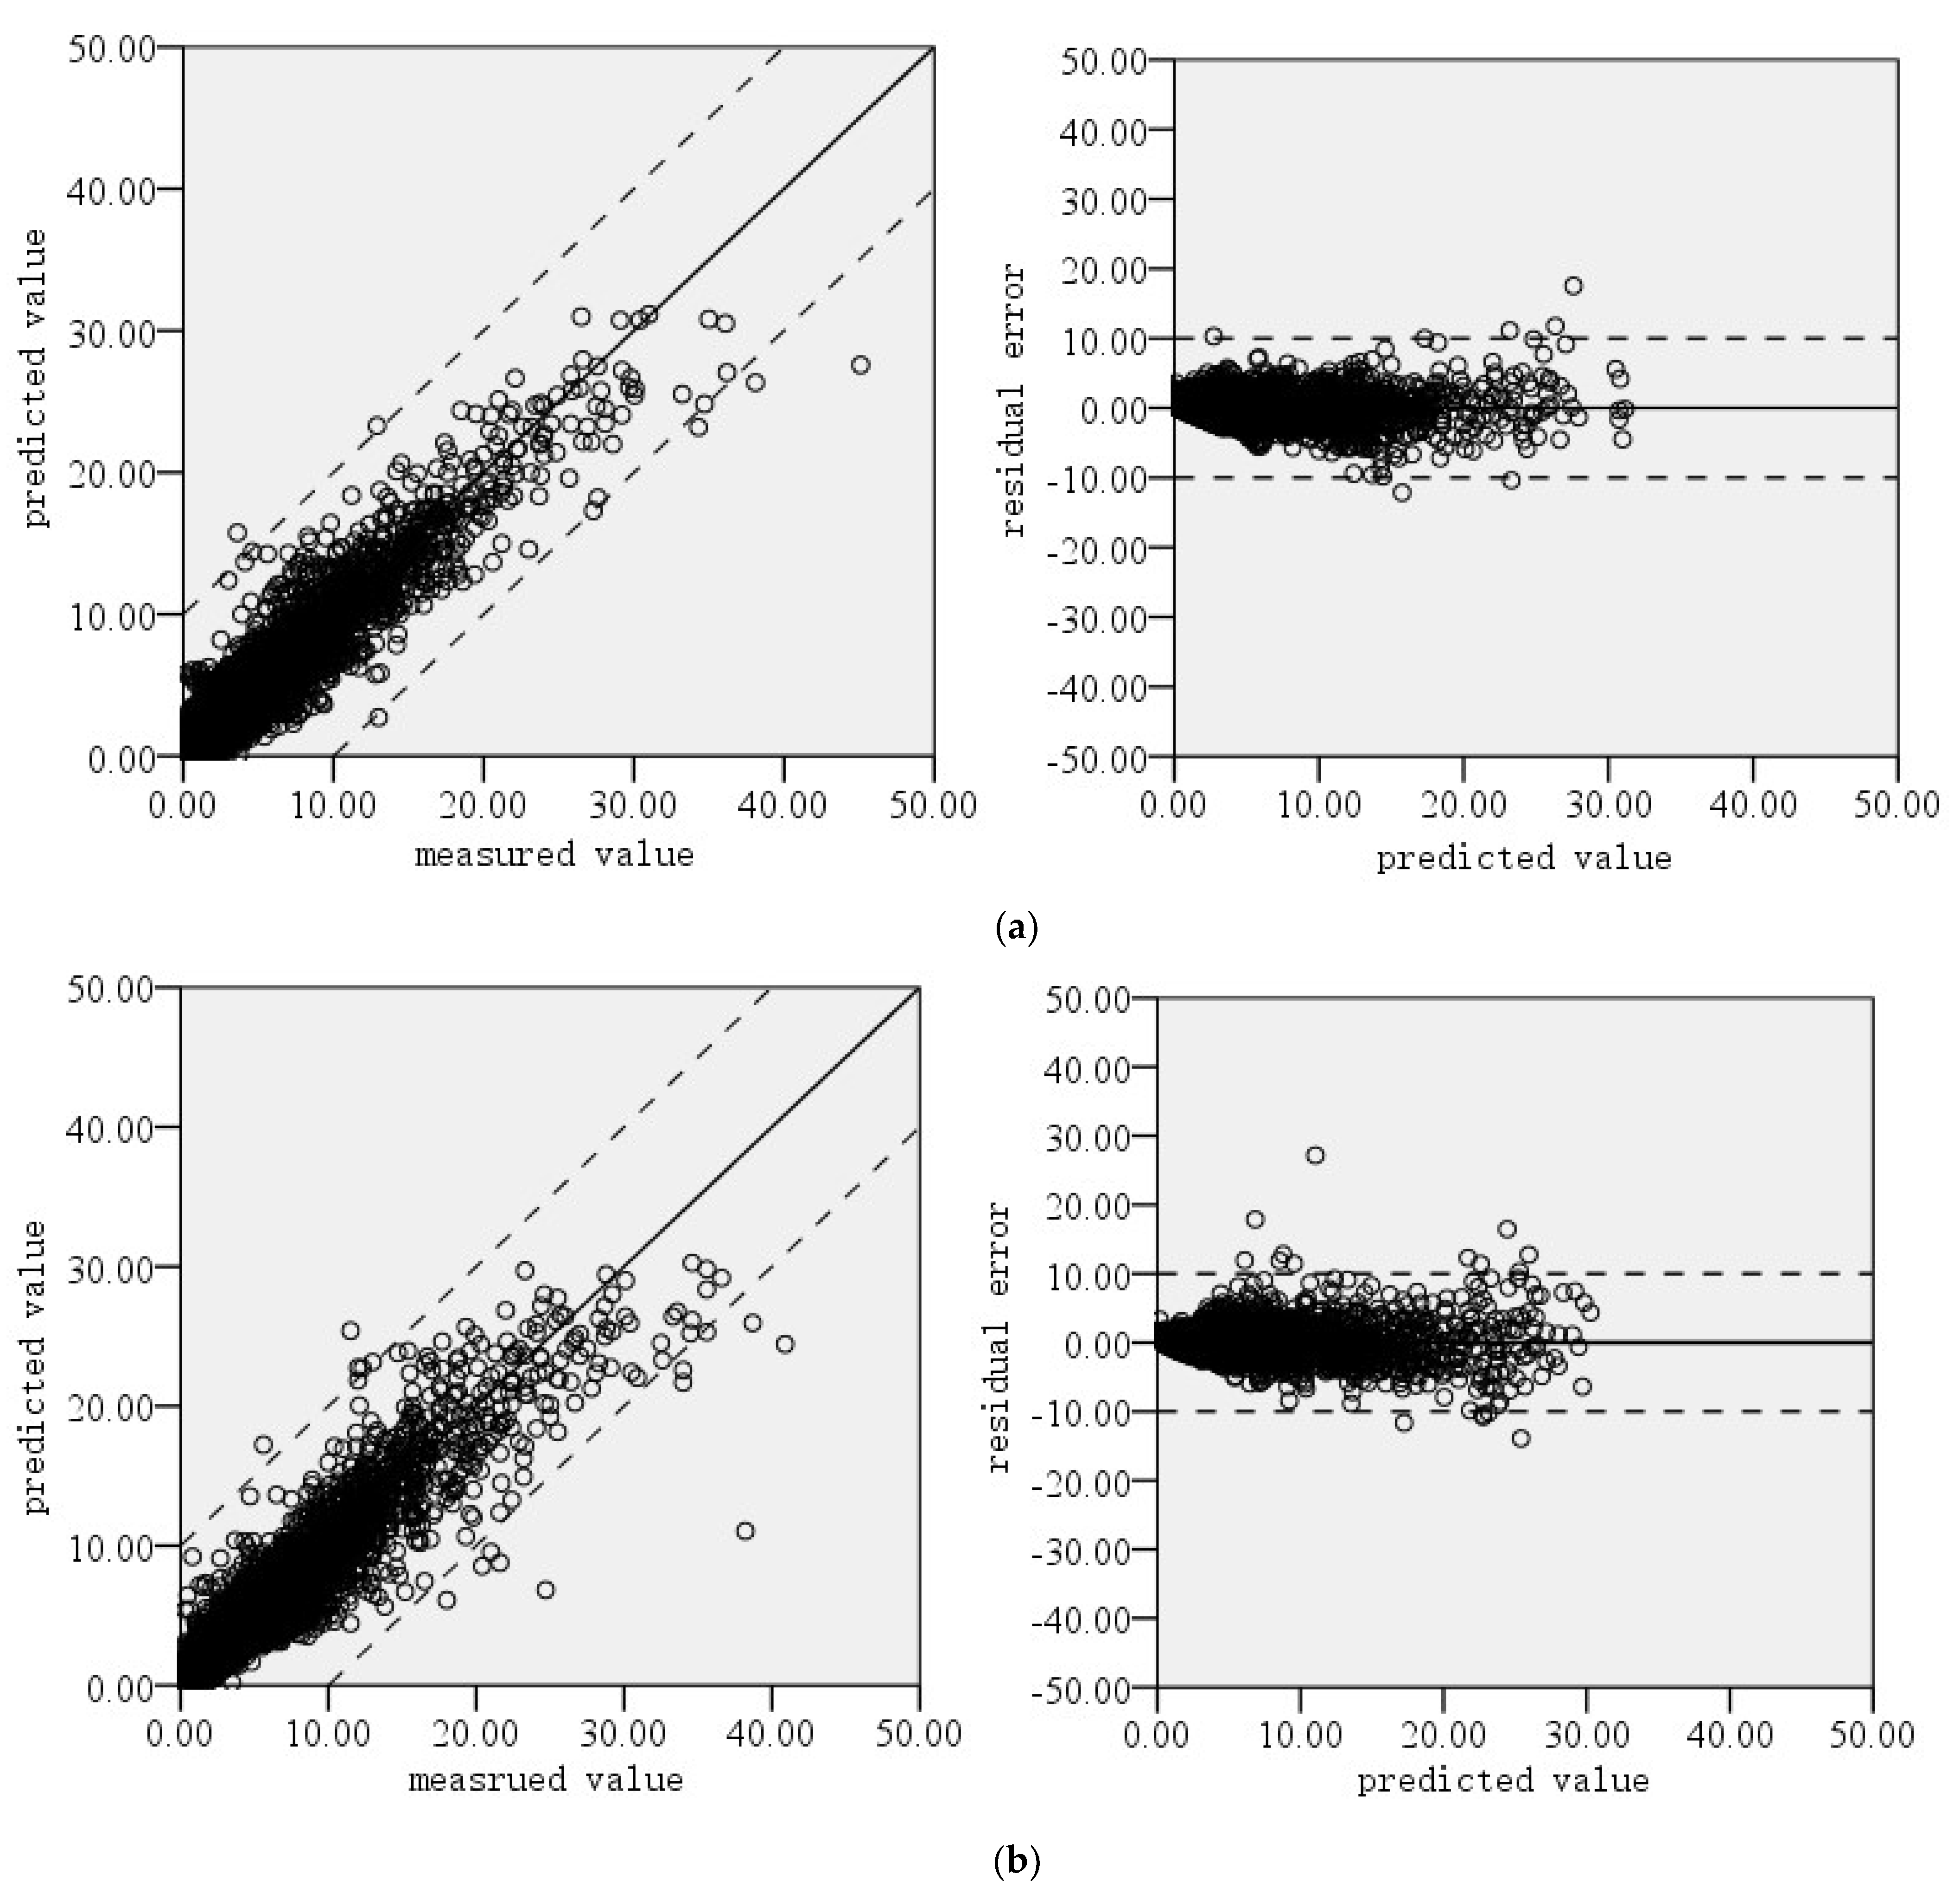
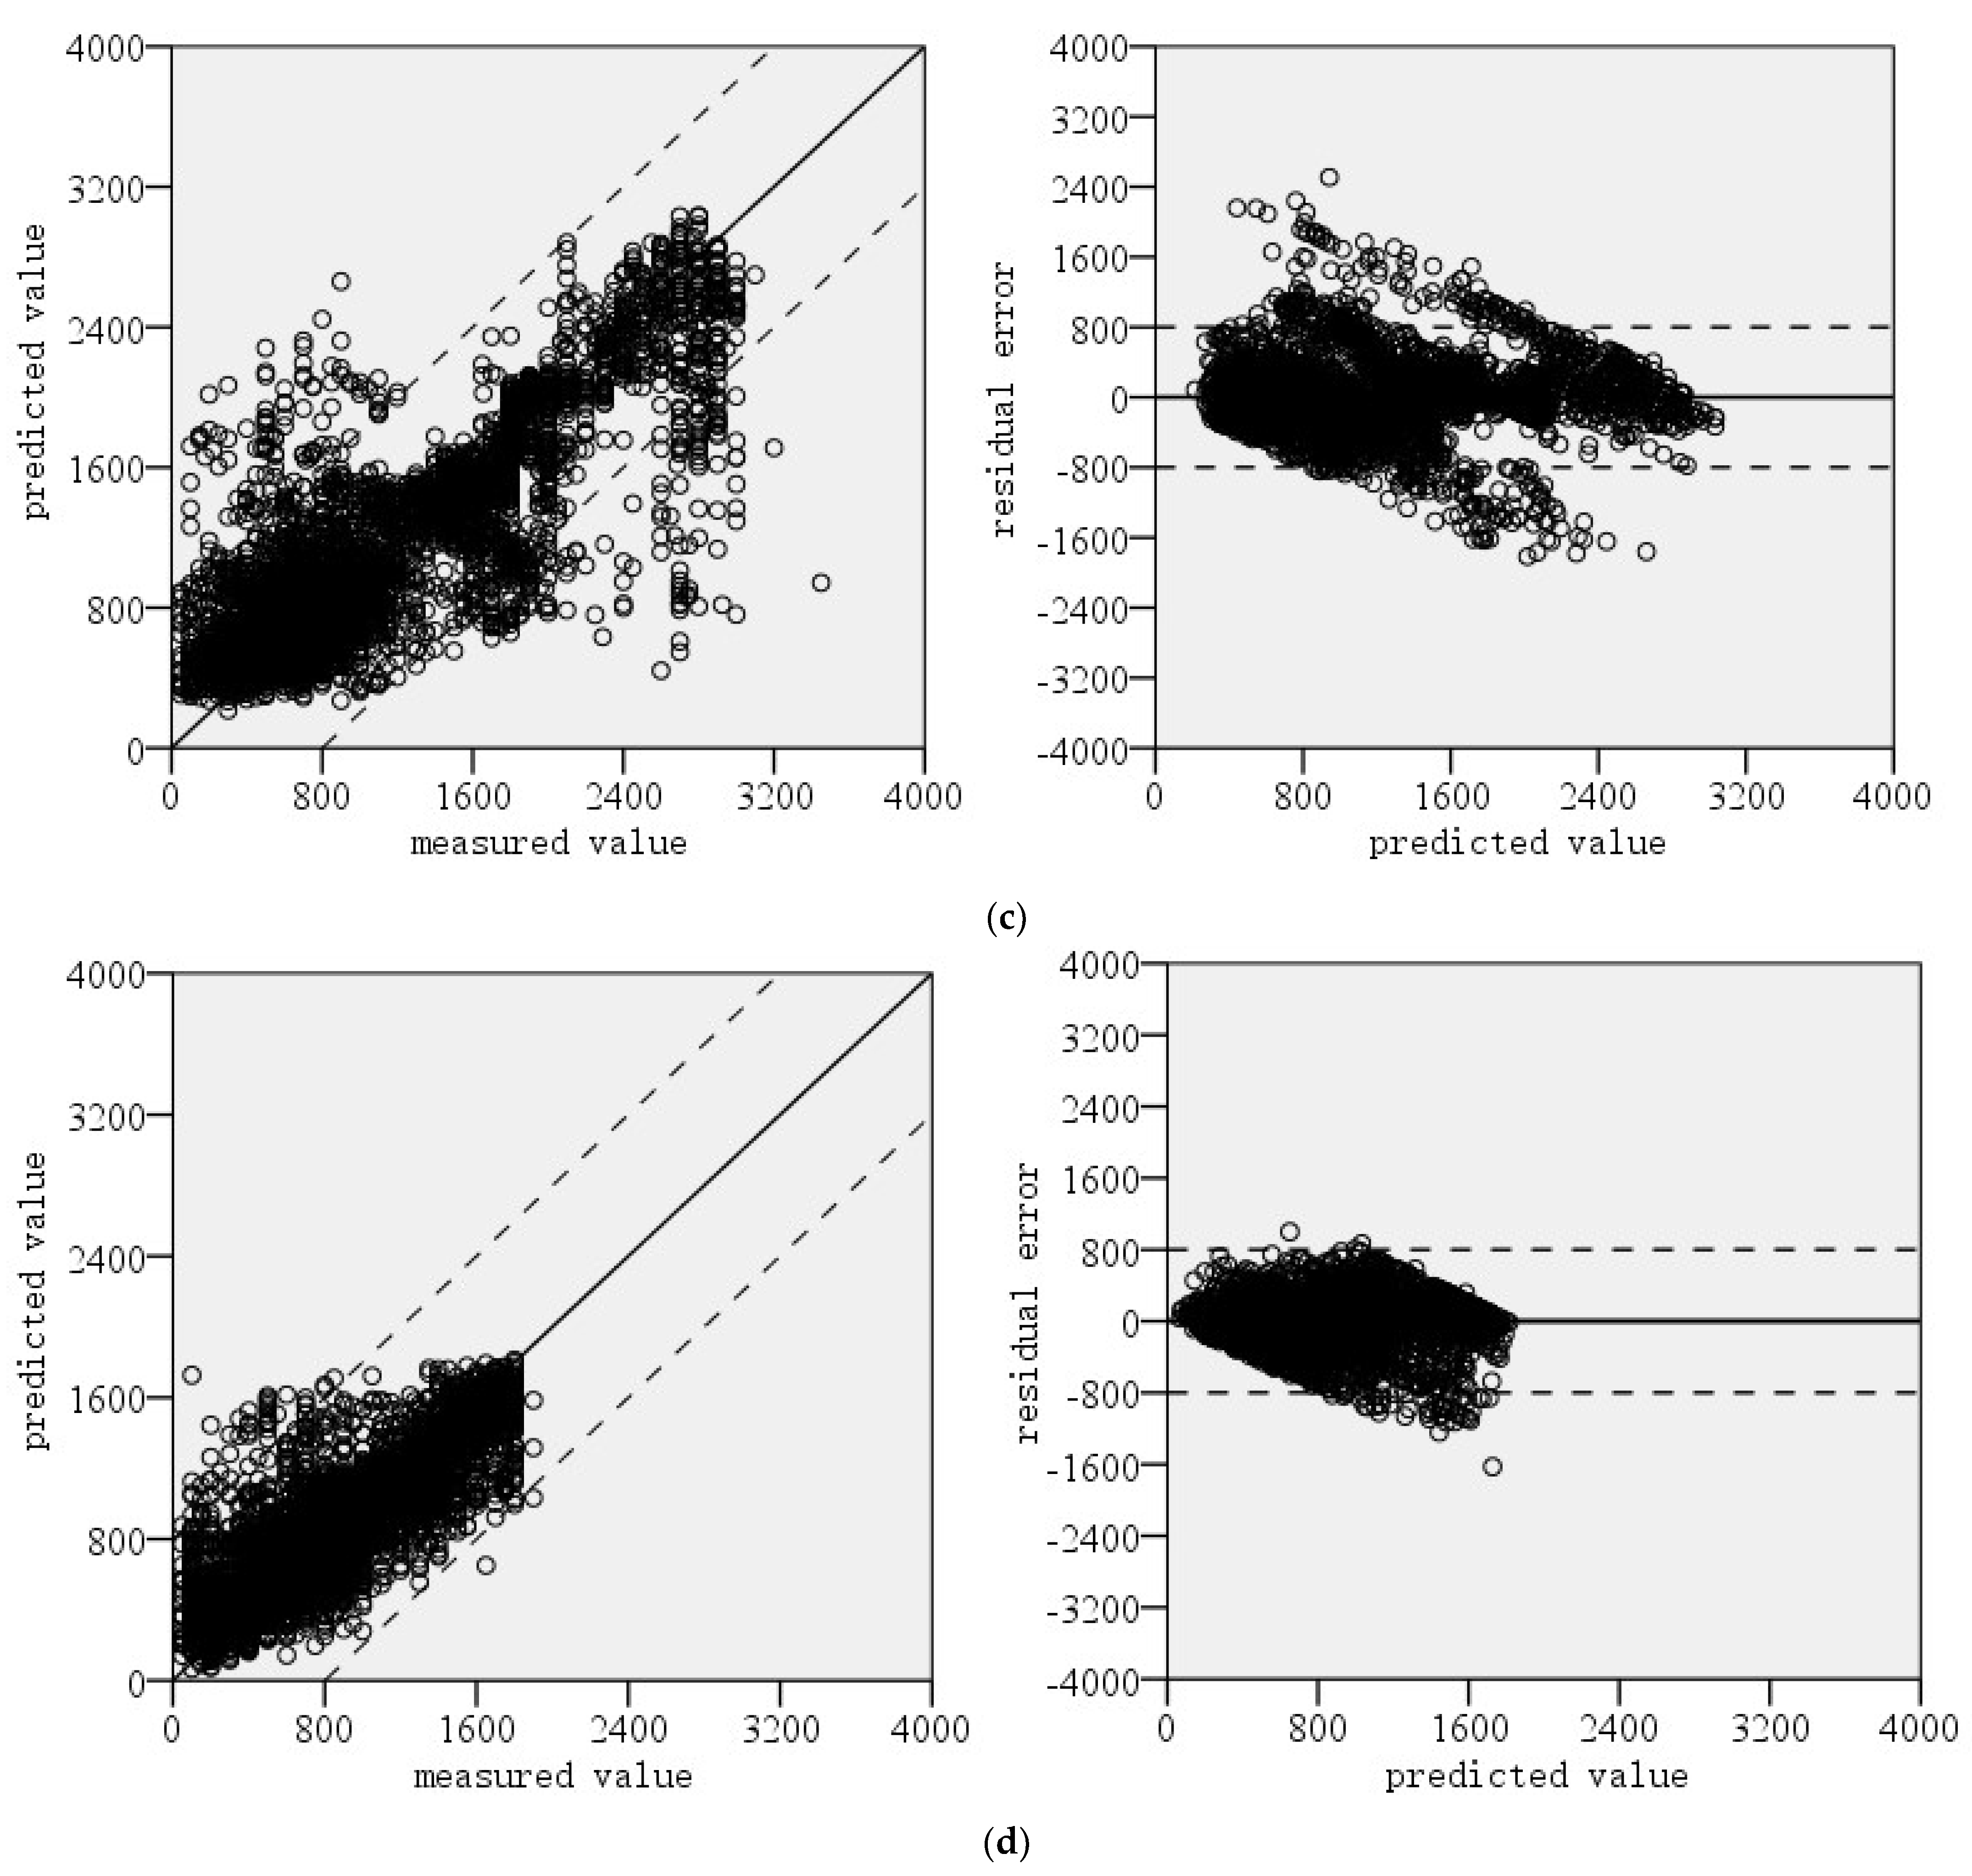
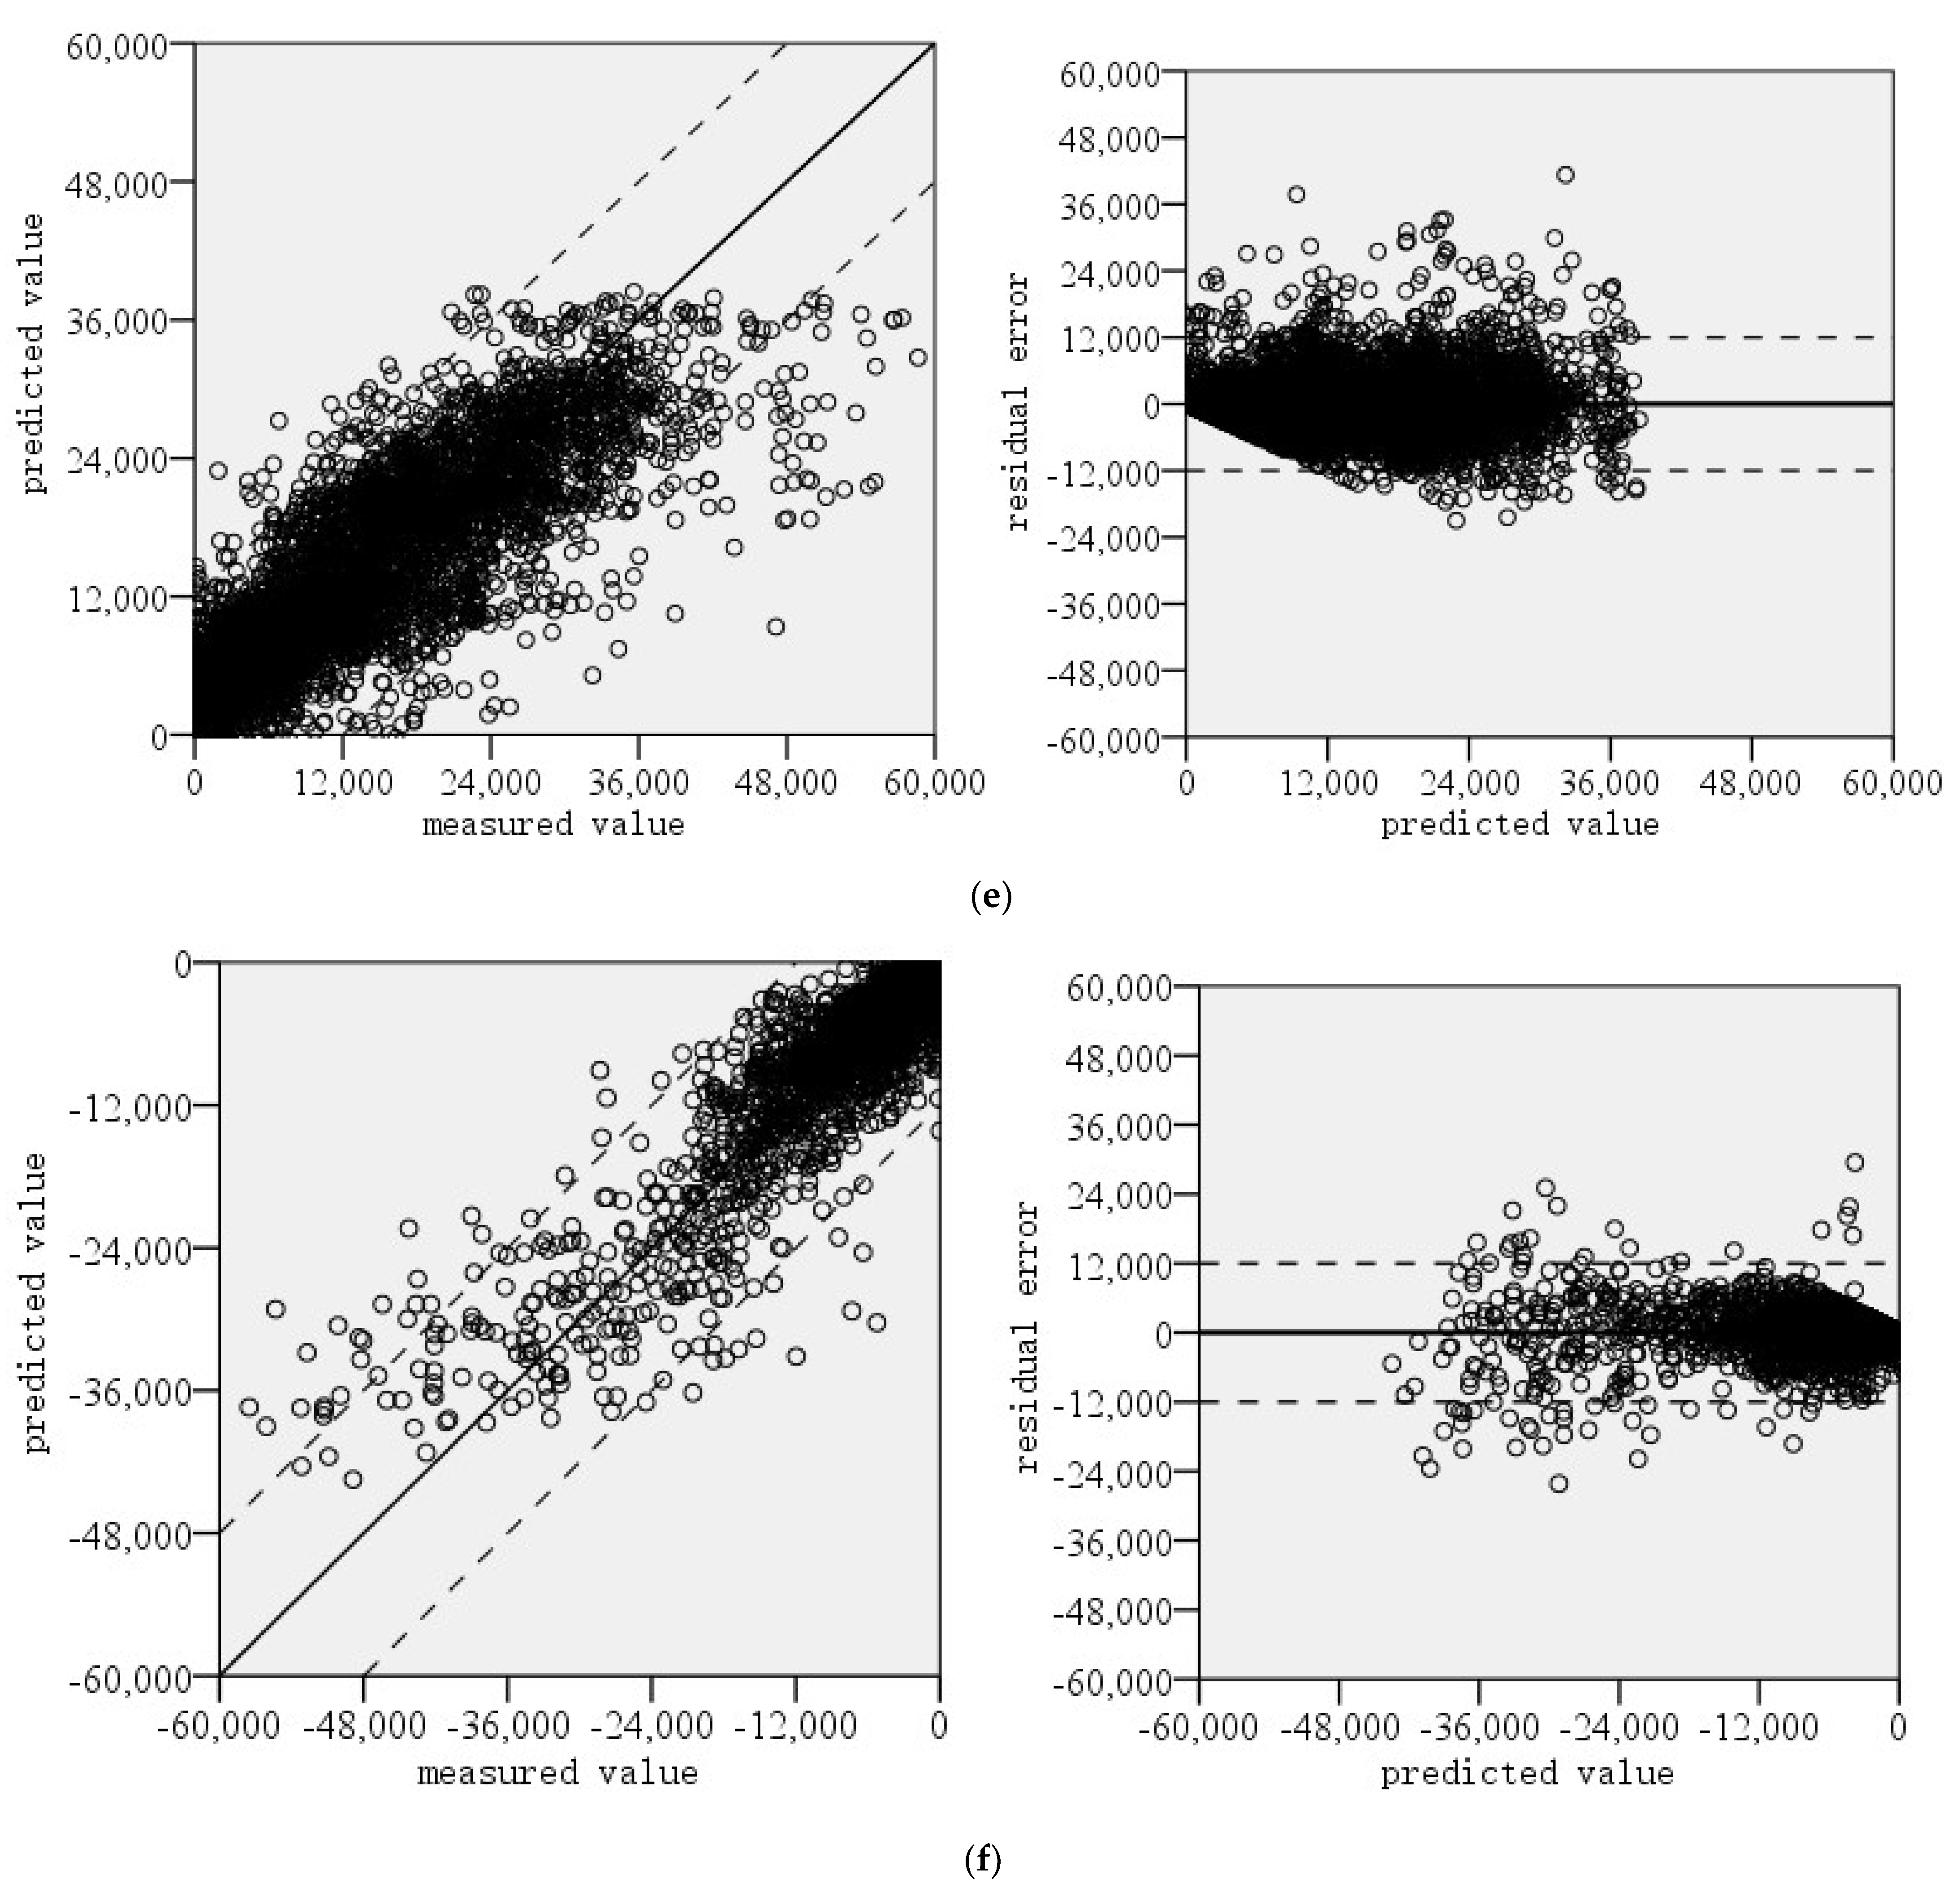
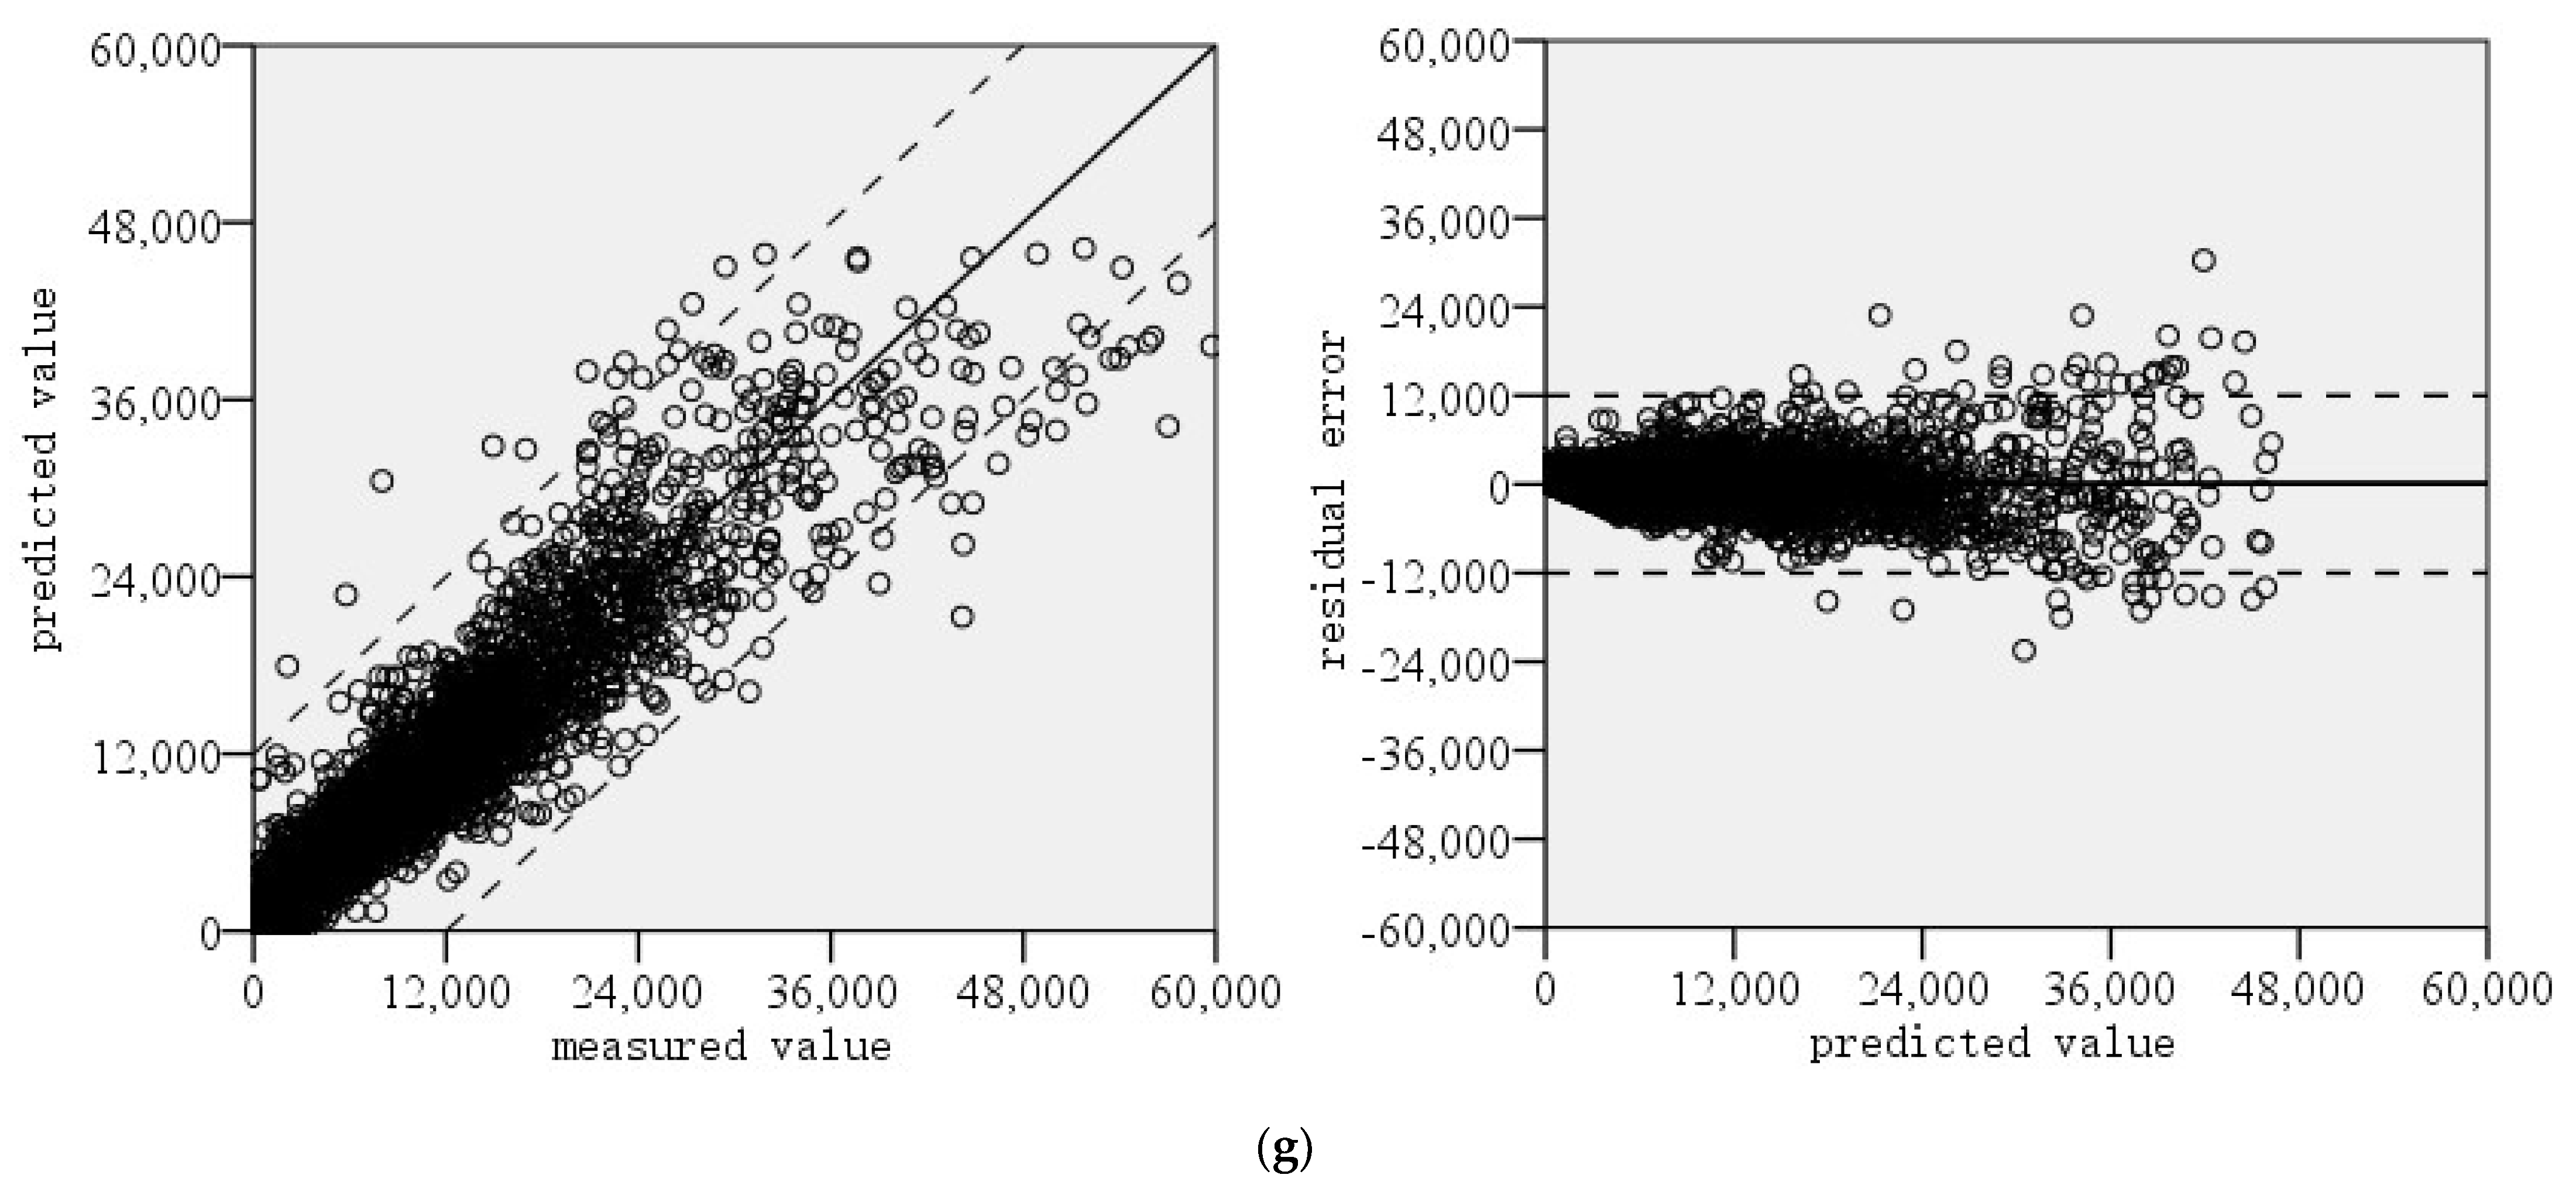
3.2. Reliability Analysis of the Model
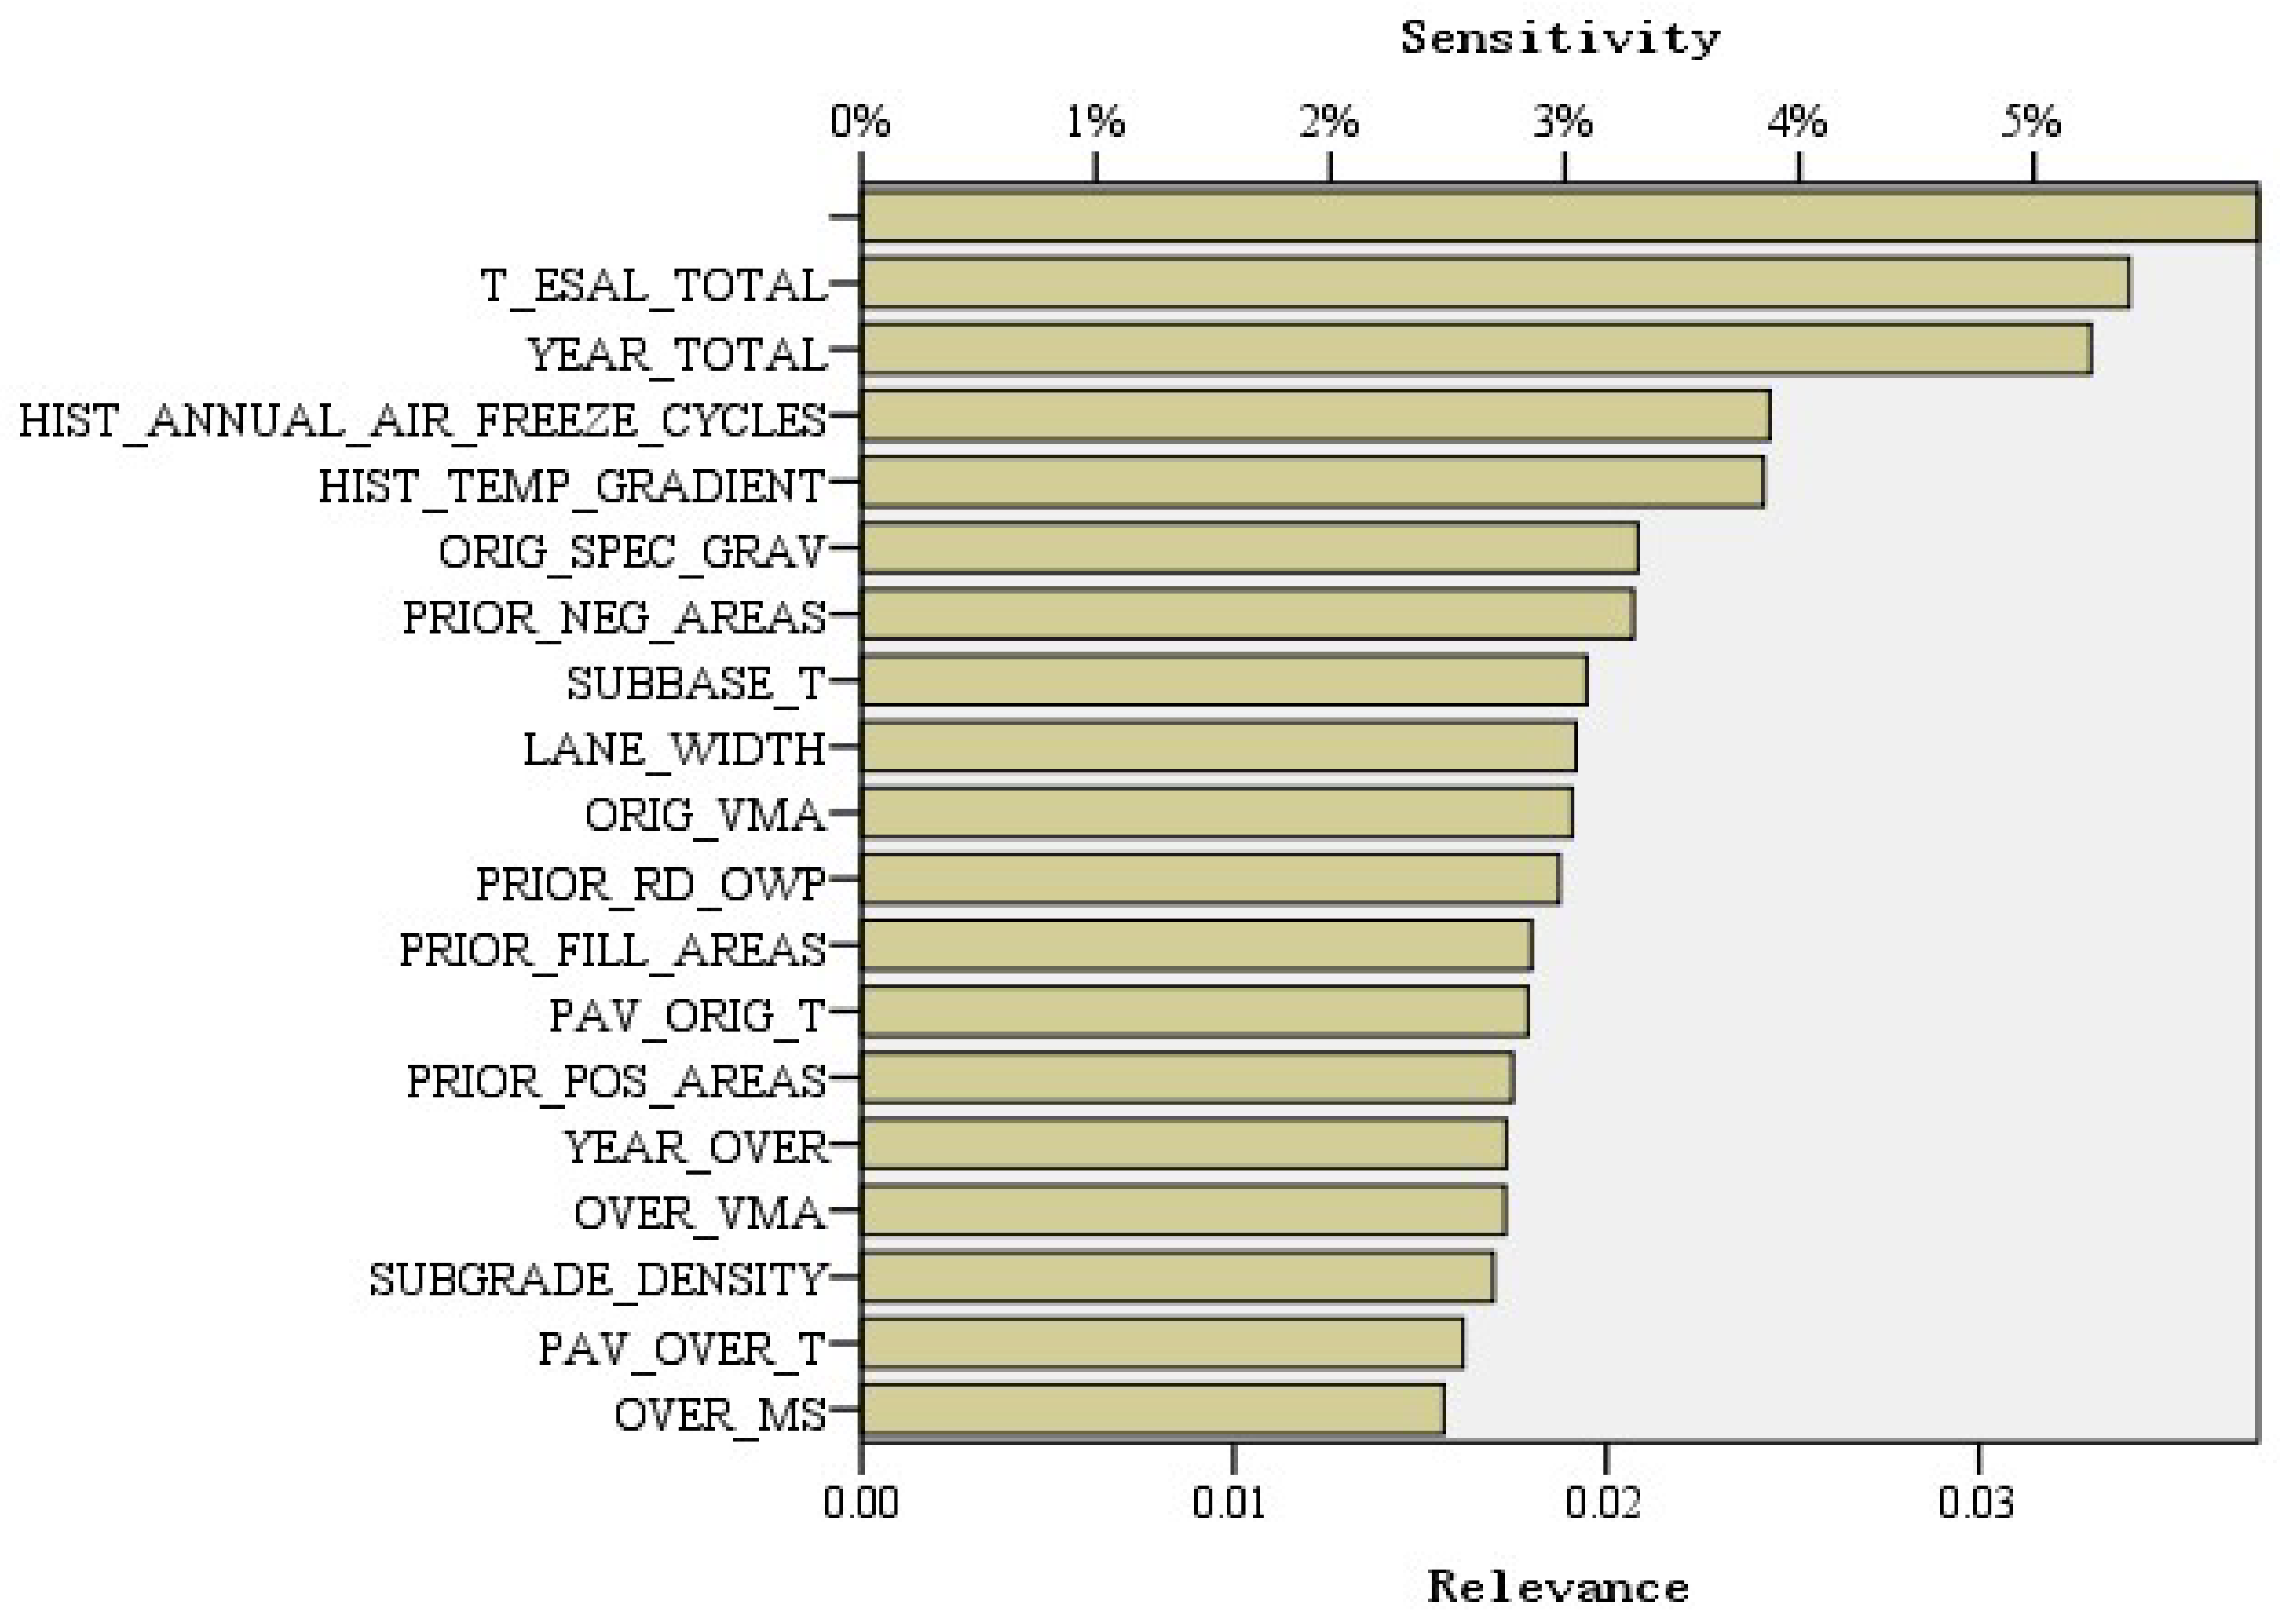
3.3. Sensitivity Analysis of Parameters
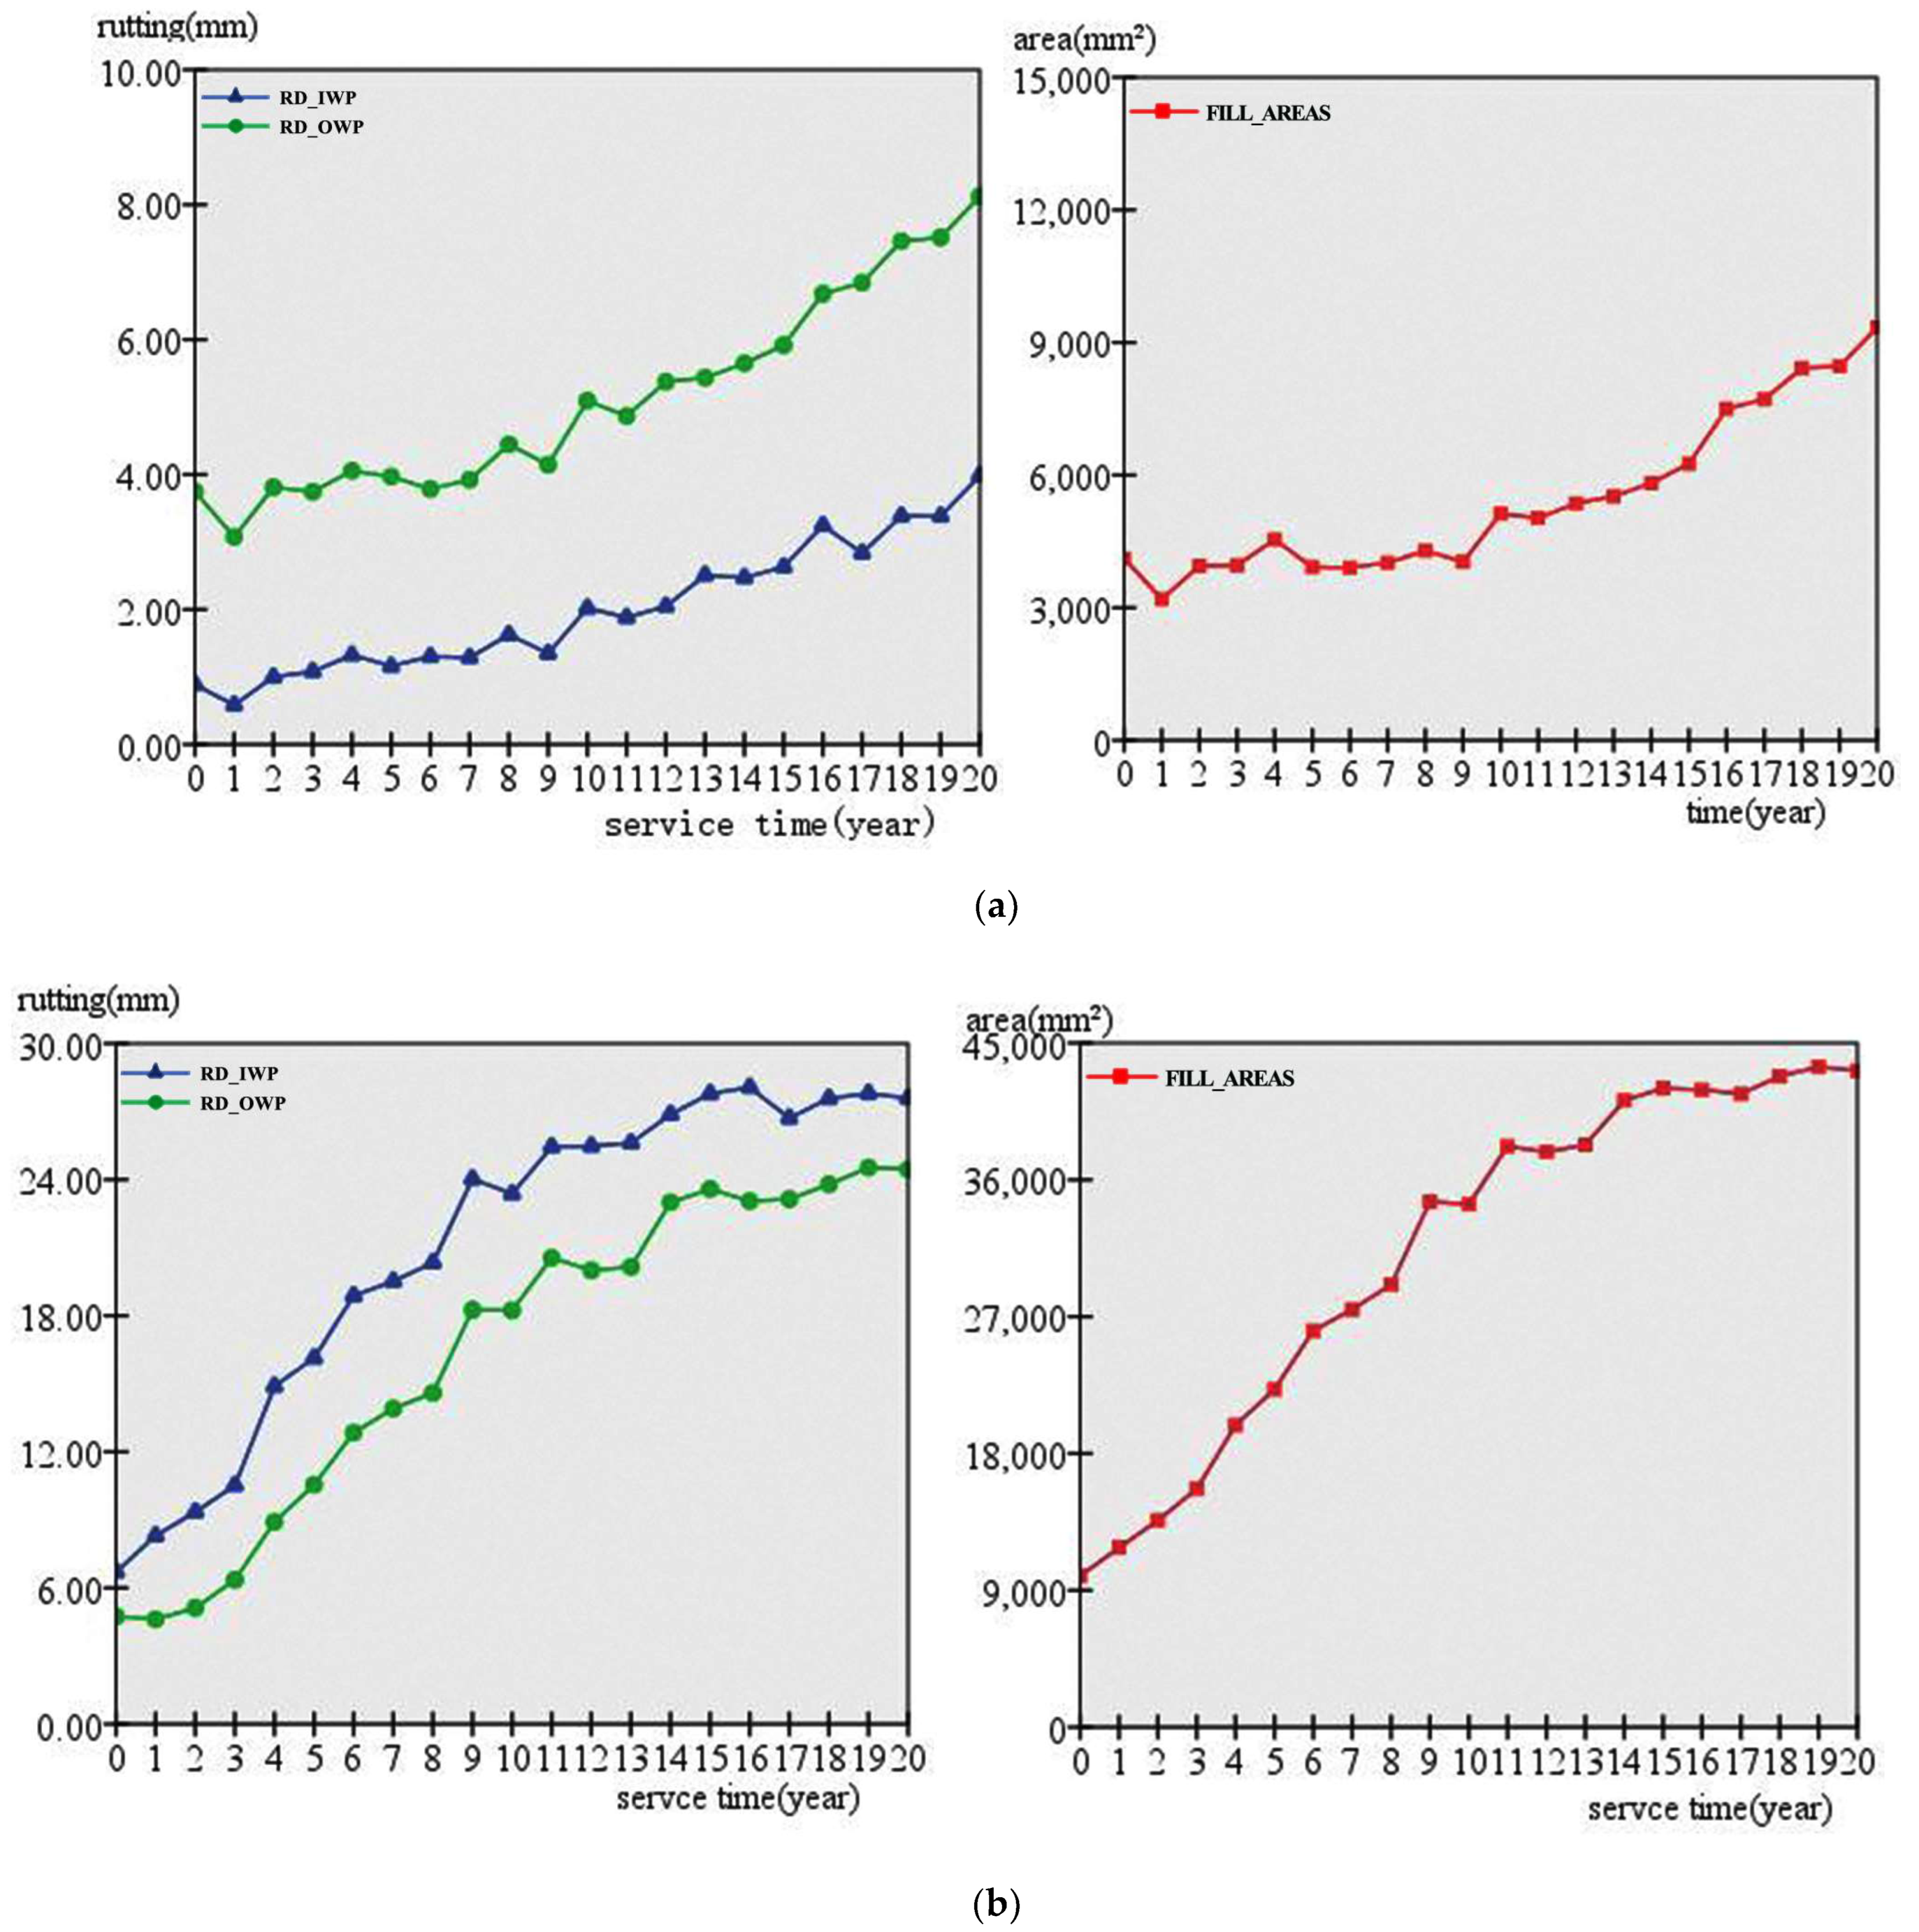
3.4. Analysis of Predicted Results
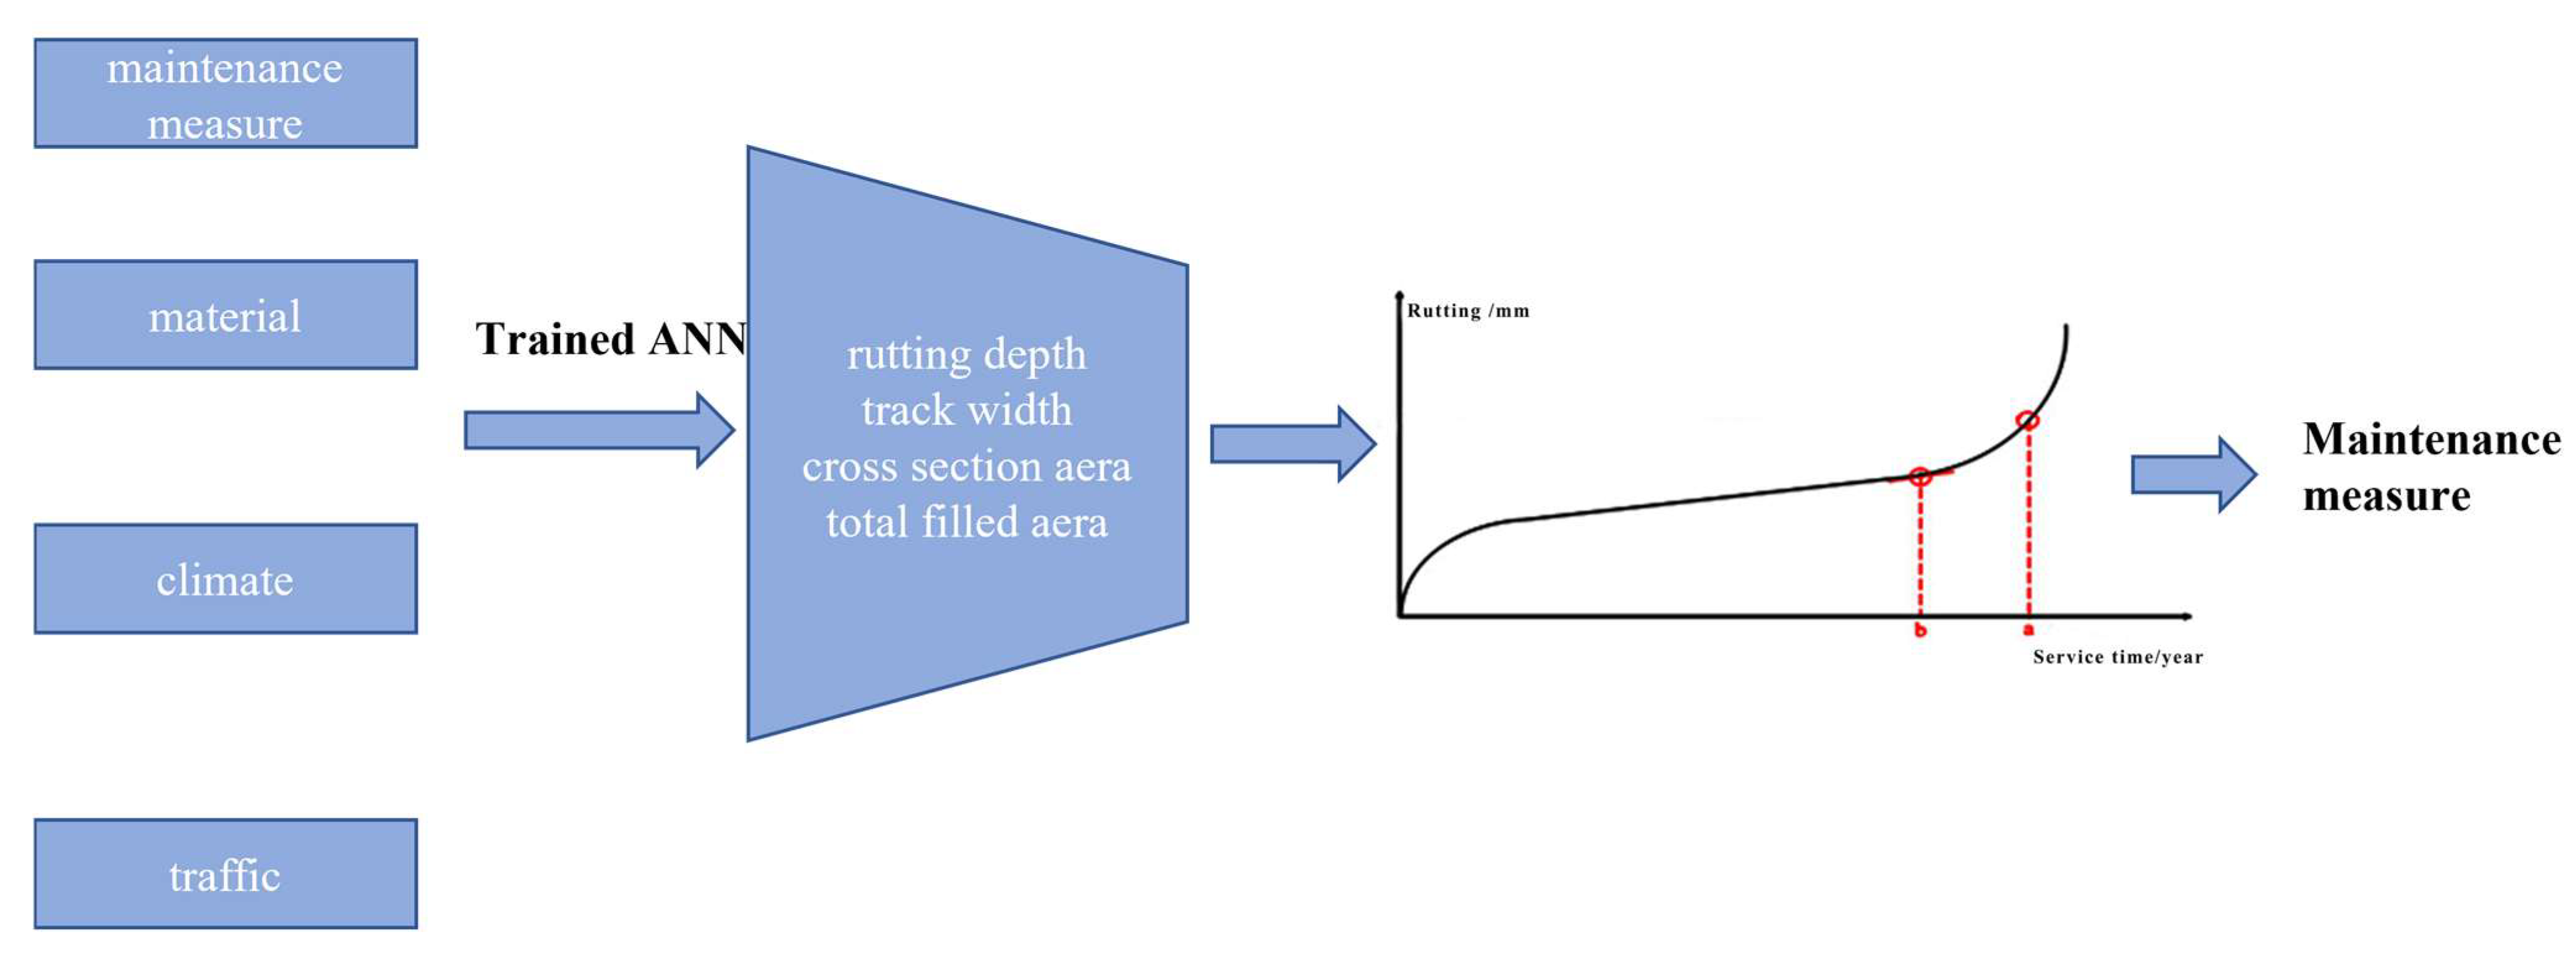
4. Evaluation Index and Maintenance Management Based on Rutting
5. Conclusions
Author Contributions
Funding
Institutional Review Board Statement
Informed Consent Statement
Data Availability Statement
Conflicts of Interest
References
- Wang, C.; Xu, S.; Liu, J.; Yang, J.; Liu, C. Building an improved artificial neural network model based on deeply optimizing the input variables to enhance rutting prediction. Constr. Build. Mater. 2022, 348, 128658. [Google Scholar] [CrossRef]
- Chen, L.; Liu, G.; Qian, Z.; Zhang, X. Determination of allowable rutting depth based on driving safety analysis. J. Transp. Eng. 2020, 146, 04020023. [Google Scholar] [CrossRef]
- Liu, J.; Liu, F.; Zheng, C.; Wang, L. Optimizing asphalt mix design through predicting effective asphalt content and absorbed asphalt content using machine learning. Constr. Build. Mater. 2022, 325, 126607–126622. [Google Scholar] [CrossRef]
- Hussan, S.; Kamal, M.; Hafeez, I.; Ahmad, N.; Khanzada, S.; Ahmed, S. Modelling asphaltpavement analyzer rut depth using different statistical techniques. Road Mater. Pavement Des. 2020, 21, 117–142. [Google Scholar] [CrossRef]
- Hui, B. Failure Pattern Recognition, Multi-Dimensional Indicators Evaluation and Prediction of Rutting in Asphalt Pavement. Ph.D. Thesis, Chang’an University, Chang’an, China, 2013. [Google Scholar]
- Sun, Y.; Choand, N. Development of a rutting performance model for asphalt concrete pavement based on test road and accelerated pavement test data. KSCE J. Civ. Eng. 2014, 18, 165–171. [Google Scholar]
- Ji, X.; Zheng, N.; Niu, S.; Meng, S.; Xu, Q. Development of a rutting prediction model for asphalt pavements with the use of an accelerated loading facility. Road Mater. Pavement Des. 2016, 17, 15–31. [Google Scholar] [CrossRef]
- Wu, T.; Cao, J.; Ma, T.; Huang, W.; Zhou, Z.; Chen, B. Development of rutting forecasting models for distinct asphalt pavement structures in RIOH testing track using different approaches. Constr. Build. Mater. 2023, 368, 130483. [Google Scholar] [CrossRef]
- Liu, G.; Chen, L.; Qian, Z.; Zhang, Y.; Ren, H. Rutting prediction models for asphalt pavement with different base types based on RIOHTrack full-scale track. Constr. Build. Mater. 2021, 305, 124793. [Google Scholar] [CrossRef]
- KAbaza, A.; Ashur, S.A.; Ai-Khatib, I. Integrated Pavement Management System with a Markovian Prediction Model. J. Transp. Eng. 2004, 130, 24–33. [Google Scholar]
- Jiménez, L.; Mrawira, D. Bayesian regression in pavement deterioration modeling: Revisiting the AASHO road test rut depth model. Infraestruct. Vial 2012, 14, 28–35. [Google Scholar]
- Hong, F.; Prozzi, J.A. Estimation of pavement performance deterioration using Bayesian approach. J. Infrastruct. Syst. 2006, 12, 77–86. [Google Scholar] [CrossRef]
- Canadian Strategic Highway Research Program. Canadian Long-Term Pavement Performance (C-LTPP): Database User’s Guide, 2nd ed.; Transportation Research Board: Washington, DC, USA, 1997. [Google Scholar]
- Liu, F.; Ding, W.; Qiao, Y.; Wang, L. An artificial neural network model on tensile behaviorof hybrid steel-PVA fiber reinforced concrete containing fly ash and slag power. Front. Struct. Civ. Eng. 2020, 14, 1299–13155. [Google Scholar] [CrossRef]
- Gong, H.; Sun, Y.; Mei, Z.; Huang, B. Improving accuracy of rutting prediction for mechanistic-empirical pavement design guide with deep neural networks. Constr. Build. Mater. 2018, 190, 710–718. [Google Scholar] [CrossRef]
- Alharbi, F.; Smadi, O. Predicting pavement performance utilizing artificial neural network (ANN). Int. J. Adv. Eng. Manag. Sci. 2019, 5, 504–508. [Google Scholar] [CrossRef]
- Okuda, T.; Suzuki, K.; Kohtake, N. Proposal and evaluation of prediction of pavement rutting depth by recurrent neural network. In Proceedings of the 2017 6th IIAI International Congress on Advanced Applied Informatics (IIAI-AAI), Hamamatsu, Japan, 9–13 July 2017; pp. 1053–1054. [Google Scholar]
- Schlotjes, M.; Burrow, M.; Evdorides, H.; Henning, T. Using support vector machines to predict the probability of pavement failure. In Proceedings of the Institution of Civil Engineers-Transport; University of Birmingham: Birmingham, UK, 2015; Volume 168, pp. 212–222. [Google Scholar]
- Haddad, A.; Chehab, G.; Saad, G. The use of deep neural networks for developing generic pavement rutting predictive models. Int. J. Pavement Eng. 2021, 23, 4260–4276. [Google Scholar] [CrossRef]
- Karballaeezadeh, N.; Mohammadzadeh, S.D.; Shamshirband, S.; Hajikhodaverdikhan, P.; Mosavi, A.; Chau, K.-W. Prediction of remaining service life of pavement using an optimized support vector machine (case study of Semnan–Firuzkuh road). Eng. Appl. Comput. Fluid Mech. 2019, 13, 188–198. [Google Scholar] [CrossRef] [Green Version]
- Choi, S.; Do, M. Development of the road pavement deterioration model based on the deep learning method. Electronics 2019, 9, 3. [Google Scholar] [CrossRef] [Green Version]
- Lee, Y.; Sun, J.; Lee, M. Development of deep learning based deterioration prediction modelfor the maintenance planning of highway pavement. Korean J. Constr. Eng. Manag. 2019, 20, 34–43. [Google Scholar]
- Thube, D.T. Artificial neural network (ANN) based pavement deterioration models for low volume roads in India. Int. J. Pavement Res. Technol. 2012, 5, 115. [Google Scholar]
- Abo-Hashema, M. Artificial neural network approach for overlay design of flexible pavements. Int. Arab J. Inf. Technol. (IAJIT) 2009, 6, 204–212. [Google Scholar]
- Abiola, O.S.; Owolabi, A.O.; Sadiq, O.M. Application of dynamic artificial neural network for modelling ruts depth for lagos-ibadan expressway, Nigeria. ARPN J. Eng. Appl. Sci. 2012, 7, 987–991. [Google Scholar]
- Hall, K.T.; Correa, C.E.; Simpson, A.L. Simpson. Performance of flexible pavement maintenance treatments in the long-term pavement performance SPS-3 experiment. Transp. Res. Rec. 2003, 1823, 47–54. [Google Scholar] [CrossRef]
- Ahmed, A.; Labi, S.; Li, Z.; Shields, T. Aggregate and disaggregate statistical evaluation of the performance-based effectiveness of long-term pavement performance specific pavement study-5 (LTPP SPS-5) flexible pavement rehabilitation treatments. Struct. Infrastruct. Eng. 2013, 9, 172–187. [Google Scholar] [CrossRef]
- Dong, Q.; Huang, B. Evaluation of effectiveness and cost-effectiveness of asphalt pavement rehabilitations utilizing LTPP data. J. Transp. Eng. 2012, 138, 681–689. [Google Scholar] [CrossRef]
- Elinks, G.E.; Schmalzer, P.N.; Travis, T.; Amy, S. Long-Term Pavement Performance Information Management System: Pavement Performance Database User Reference Guide; U.S. Department of Transportation Federal Highway Administration Research, Development, and Technology Turner-Fairbank Highway Research Center: McLean, VA, USA, 2003. [Google Scholar]
- Jain, A.K.; Mao, J.; Mohiuddin, K.M. Artificial neural networks: A tutorial. Computer 1996, 29, 31–44. [Google Scholar] [CrossRef] [Green Version]
- Anzai, Y. Pattern Recognition and Machine Learning; Elsevier: Amsterdam, The Netherlands, 2012. [Google Scholar]
- Huang, Y. Advances in artificial neural networks–methodological development and application. Algorithms 2009, 2, 973–1007. [Google Scholar] [CrossRef] [Green Version]
- Liu, J.; Liu, F.; Gong, H.; Fanijo, E.O.; Wang, L. Improving asphalt mix design by predicting alligator cracking and longitudinal cracking based on machine learning and dimensionality reduction techniques. Constr. Build. Mater. 2022, 354, 129162. [Google Scholar] [CrossRef]
- Alavi, A.H.; Ameri, M.; Gandomi, A.H.; Mirzahosseini, M.R. Formulation of flow number of asphalt mixes using a hybrid computational method. Constr. Build. Mater. 2011, 25, 1338–1355. [Google Scholar] [CrossRef]
- Latecki, L.J.; Lazarevic, A.; Pokrajac, D. Outlier Detection with Kernel Density Functions, International Workshop on Machine Learning and Data Mining in Pattern Recognition; Springer: Cham, Switzerland, 2007; pp. 61–75. [Google Scholar]
- Probst, P.; Boulesteix, A.-L.; Bischl, B. Tunability: Importance of hyperparameters of machine learning algorithms. J. Mach. Learn. Res. 2019, 20, 1934–1965. [Google Scholar]
- Bergstra, J.; Bengio, Y. Random search for hyper-parameter optimization. J. Mach. Learn. Res. 2012, 13, 281–305. [Google Scholar]
- Zhang, D.L. Asphalt Mavement; China Communications Press: Beijing, China, 1999; pp. 23–38. [Google Scholar]


| Statistic Name | Training Set | Test Set |
|---|---|---|
| Sample distribution (4829) | 3394 | 1435 |
| Distribution of sample proportion | 0.703 | 0.297 |
| Relative error of left rut depth (RUT_RD_IWP) | 0.116 | 0.132 |
| Relative error of right rut depth (RUT_RD_OWP) | 0.141 | 0.139 |
| Relative error of left wheel track band width (RUT_RW_IWP) | 0.296 | 0.291 |
| Relative error of right wheel track band width (RUT_RW_OWP) | 0.289 | 0.298 |
| Relative error of cross-section positive area (RUT_POS_AREAS) | 0.274 | 0.279 |
| Relative error of cross-section negative area (RUT_NEG_AREAS) | 0.159 | 0.182 |
| Relative error of cross-section fill area (RUT_FILL_AREAS) | 0.125 | 0.139 |
| Average overall relative error | 0.201 | 0.218 |
| () | 2392.743 | 1139.270 |
| Variable | Description |
|---|---|
| T_ESAL_TOTAL | Equivalent uniaxial loads after repair |
| YEAR_TOTAL | Service year after repair |
| HIST_ANNUAL_AIR_FREEZE_CYCLES | Annual freeze–thaw cycles |
| HIST_TEMP_GRADIENT | Average daily temperature difference |
| ORIG_SPEC_GRAV | Specific gravity of original surface mixture |
| PRIOR_NEG_AREAS | Area characteristics of original pavement cross-section |
| PRIOR_FILL_AREAS | Filling area of original pavement cross-section |
| SUBBASE_T | Base thickness |
| LANE_WIDTH | Lane width |
| ORIG_VMA | VMA of original surface mixture |
| PRIOR_RD_OWP | Rutting of raw pavement right wheel track |
| YEAR_OVER | Repair year |
| OVER_VMA | Overlay VMA |
| SUBBASE_DENSITY | Compaction density of subbase |
| PAV_OVER_T | Overlay thickness |
| OVER_MS | Marshall stability overlay |
| CSHRP_ID | SECTION | Reference Base | Milling Thickness (mm) | Overlay Thickness (mm) | Overlay Type | Accumulated Axle Load (Times) | Rutting (mm) | Maintenance Time (Years) |
|---|---|---|---|---|---|---|---|---|
| 810404 | 1 | good | 50 | 61 | HMAC | 2,532,366 | 8.94 | — |
| 810404 | 2 | good | 50 | 103 | HMAC | 2,631,917 | 8.01 | — |
| 810404 | 3 | b | 50 | 94 | RAP | 1,380,378 | 7.35 | 16 |
| 810404 | 4 | b | 50 | 55 | RAP | 1,381,466 | 6.57 | 16 |
| 820205 | 1 | b | 0 | 42 | HMAC | 2,104,314 | 5.92 | 15 |
| 820205 | 2 | b | 0 | 83 | HMAC | 2,103,617 | 5.81 | 15 |
| 820502 | 1 | b | 50 | 104 | RAP + HMAC | 6,365,175 | 12.59 | 15 |
| 820502 | 2 | b | 50 | 118 | RAP + HMAC | 6,368,591 | 10.13 | 15 |
| 820605 | 1 | b | 0 | 50 | HMAC | 6,368,835 | 12.42 | 15 |
| 820605 | 2 | b | 0 | 73 | HMAC | 6,366,421 | 11.34 | 15 |
| 830403 | 1 | b | 0 | 100 | HMAC | 4,486,938 | 8.27 | 18 |
| 830403 | 2 | good | 0 | 113 | HMAC | 5,115,783 | 7.80 | — |
| 830403 | 3 | good | 0 | 148 | HMAC | 5,107,734 | 5.26 | — |
| 830801 | 1 | b | 40 | 185 | RAP + HMAC | 4,872,064 | 14.58 | 17 |
| 830801 | 2 | b | 40 | 103 | RAP + HMAC | 4,245,853 | 10.62 | 15 |
| 830801 | 3 | b | 40 | 126 | HMAC | 4,553,495 | 9.95 | 16 |
| 830801 | 4 | good | 40 | 170 | HMAC | 5,808,643 | 13.69 | — |
| 840101 | 1 | a | 75 | 174 | RAP + HMAC | 2,416,447 | — | 11 |
| 840101 | 2 | a | 75 | 179 | HMAC | 2,416,754 | — | 11 |
| 840101 | 3 | b | 0 | 87 | HMAC | 2,418,144 | 13.29 | 11 |
| 840204 | 1 | b | 0 | 114 | HMAC | 1,367,601 | 8.37 | 13 |
| 840204 | 2 | b | 0 | 88 | HMAC | 1,052,479 | 6.51 | 12 |
| 840604 | 1 | b | 52 | 107 | RAP + HMAC | 1,738,430 | 10.28 | 9 |
| 840604 | 2 | b | 52 | 90 | HMAC | 2,305,743 | 8.03 | 10 |
| 840604 | 3 | b | 0 | 30 | HMAC | 1,991,770 | 9.46 | 9 |
| 840604 | 4 | b | 0 | 35 | HMAC | 1,991,770 | 10.92 | 9 |
| 850201 | 1 | a | 0 | 117 | HMAC | 2,572,694 | — | 17 |
| 850201 | 2 | a | 0 | 73 | HMAC | 2,259,910 | — | 16 |
| 850206 | 1 | b | 0 | 106 | HMAC | 1,662,265 | 7.75 | 14 |
| 850206 | 2 | b | 0 | 63 | HMAC | 1,347,723 | 4.67 | 13 |
| 850601 | 1 | b | 0 | 122 | HMAC | 652,790 | 12.37 | 7 |
| 850601 | 2 | b | 0 | 74 | HMAC | 652,955 | 9.11 | 7 |
| 860501 | 1 | a | 0 | 55 | HMAC | 2,217,900 | — | 4 |
| 860501 | 2 | a | 0 | 85 | HMAC | 9,196,966 | — | 16 |
| 860501 | 3 | a | 0 | 41 | HMAC | 8,882,336 | — | 14 |
| 860603 | 1 | a | 0 | 86 | HMAC | 1,263,160 | — | 9 |
| 860603 | 2 | a | 0 | 80 | HMAC | 1,184,480 | — | 8 |
| 860603 | 3 | a | 0 | 34 | HMAC | 955,390 | — | 7 |
| 870102 | 1 | b | 35 | 95 | HMAC | 1,465,926 | 8.18 | 12 |
| 870102 | 2 | b | 35 | 46 | HMAC | 2,716,113 | 10.07 | 16 |
| 870504 | 1 | a | 0 | 31 | HMAC | 3,834,689 | — | 15 |
| 870504 | 2 | good | 0 | 61 | HMAC | 5,402,945 | 13.59 | — |
| 870505 | 1 | b | 0 | 75 | HMAC | 3,698,354 | 9.97 | 15 |
| 870505 | 2 | b | 0 | 73 | HMAC | 3,070,334 | 6.69 | 13 |
| 870505 | 3 | b | 0 | 105 | HMAC | 4,007,384 | 8.12 | 16 |
| 870505 | 4 | b | 0 | 106 | RAP + HMAC | 4,000,944 | 7.73 | 16 |
| 870701 | 1 | good | 0 | 43 | HMAC | 5,343,413 | 6.48 | — |
| 870701 | 2 | good | 0 | 106 | HMAC | 5,332,037 | 5.93 | — |
| 880203 | 1 | b | 50 | 51 | HMAC | 654,446 | 9.12 | 9 |
| 880203 | 2 | b | 50 | 109 | HMAC | 654,475 | 9.54 | 9 |
| 880203 | 3 | b | 0 | 51 | HMAC | 654,911 | 5.89 | 9 |
| 880203 | 4 | b | 0 | 99 | HMAC | 654,368 | 6.28 | 9 |
| 890503 | 1 | a | 0 | 40 | HMAC | 5,314,742 | — | 10 |
| 890503 | 2 | a | 0 | 51 | HMAC | 5,316,527 | — | 11 |
| 890503 | 3 | a | 0 | 106 | HMAC | 6,509,635 | — | 12 |
| 890503 | 4 | a | 0 | 83 | HMAC | 5,881,676 | — | 11 |
| 890702 | 1 | b | 0 | 44 | HMAC | 3,774,491 | 8.34 | 9 |
| 890702 | 2 | b | 0 | 85 | HMAC | 3,943,572 | 6.98 | 10 |
| 900402 | 1 | b | 40 | 86 | HMAC | 1,234,220 | 6.96 | 15 |
| 900402 | 2 | b | 40 | 126 | HMAC | 1,234,220 | 7.57 | 15 |
| 900802 | 1 | b | 60 | 55 | HMAC | 1,453,340 | 11.22 | 16 |
| 900802 | 2 | b | 60 | 67 | HMAC | 1,453,340 | 10.48 | 16 |
| 900802 | 3 | b | 60 | 104 | HMAC | 1,453,340 | 5.60 | 16 |
| 900803 | 1 | b | 60 | 158 | HMAC | 8,526,390 | 5.76 | 16 |
| 900803 | 2 | b | 60 | 108 | HMAC | 8,526,390 | 6.56 | 16 |
Disclaimer/Publisher’s Note: The statements, opinions and data contained in all publications are solely those of the individual author(s) and contributor(s) and not of MDPI and/or the editor(s). MDPI and/or the editor(s) disclaim responsibility for any injury to people or property resulting from any ideas, methods, instructions or products referred to in the content. |
© 2023 by the authors. Licensee MDPI, Basel, Switzerland. This article is an open access article distributed under the terms and conditions of the Creative Commons Attribution (CC BY) license (https://creativecommons.org/licenses/by/4.0/).
Share and Cite
Cheng, C.; Ye, C.; Yang, H.; Wang, L. Predicting Rutting Development of Pavement with Flexible Overlay Using Artificial Neural Network. Appl. Sci. 2023, 13, 7064. https://doi.org/10.3390/app13127064
Cheng C, Ye C, Yang H, Wang L. Predicting Rutting Development of Pavement with Flexible Overlay Using Artificial Neural Network. Applied Sciences. 2023; 13(12):7064. https://doi.org/10.3390/app13127064
Chicago/Turabian StyleCheng, Chunru, Chen Ye, Hailu Yang, and Linbing Wang. 2023. "Predicting Rutting Development of Pavement with Flexible Overlay Using Artificial Neural Network" Applied Sciences 13, no. 12: 7064. https://doi.org/10.3390/app13127064