
On the Torsional Behavior of the Longitudinal Bridge Girders Used in the LT-Bridge Construction Method
Abstract
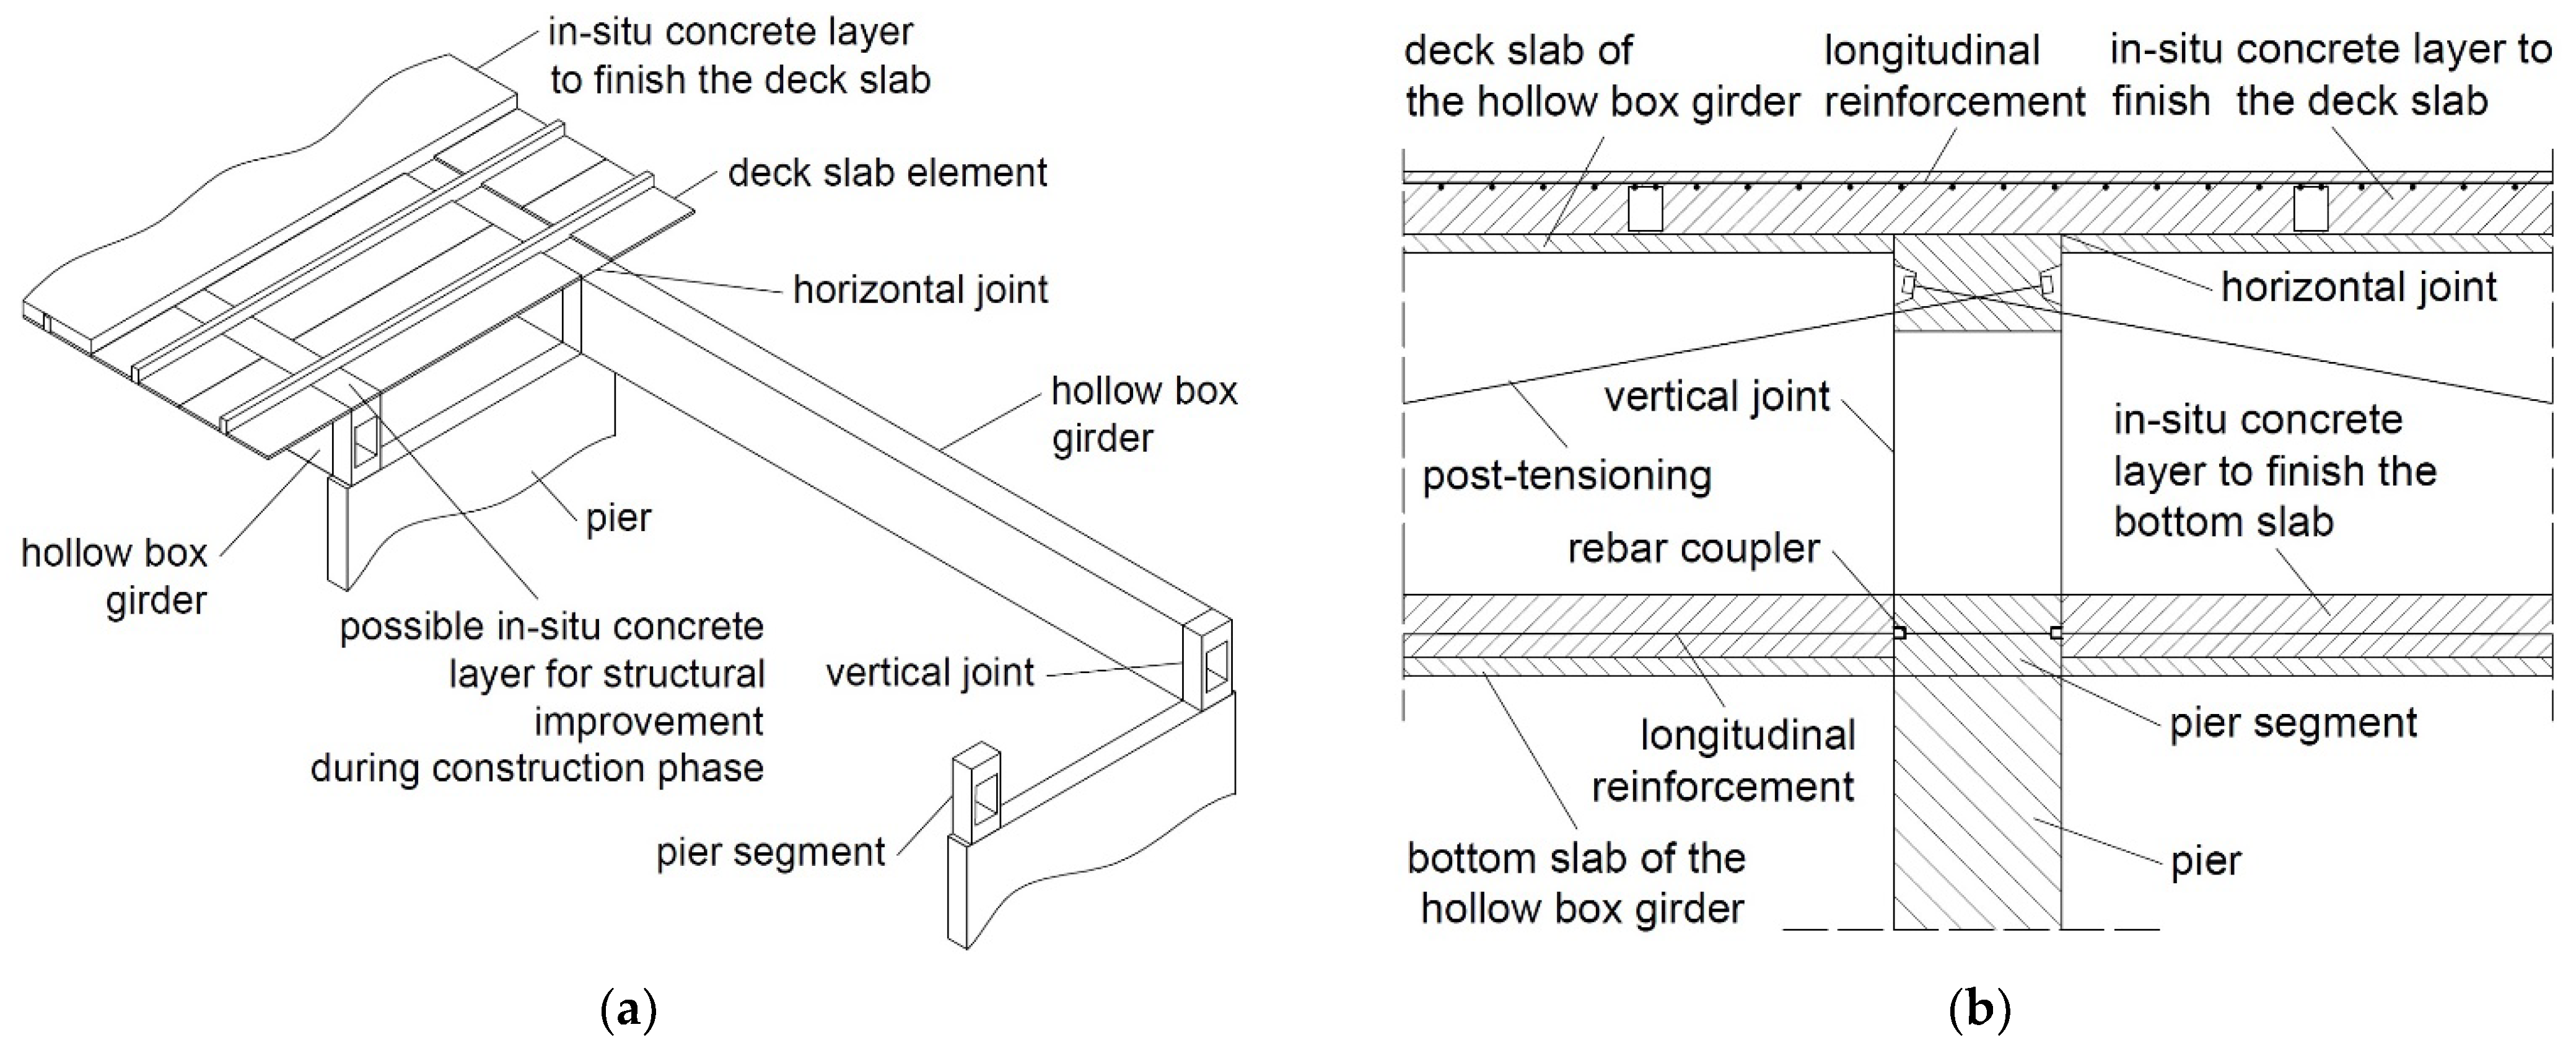
:1. Introduction

2. Experimental Investigations on the Torsional Behavior of Hollow Box Girders with Joints in the Webs
2.1. Basic Concept of the Experimental Program
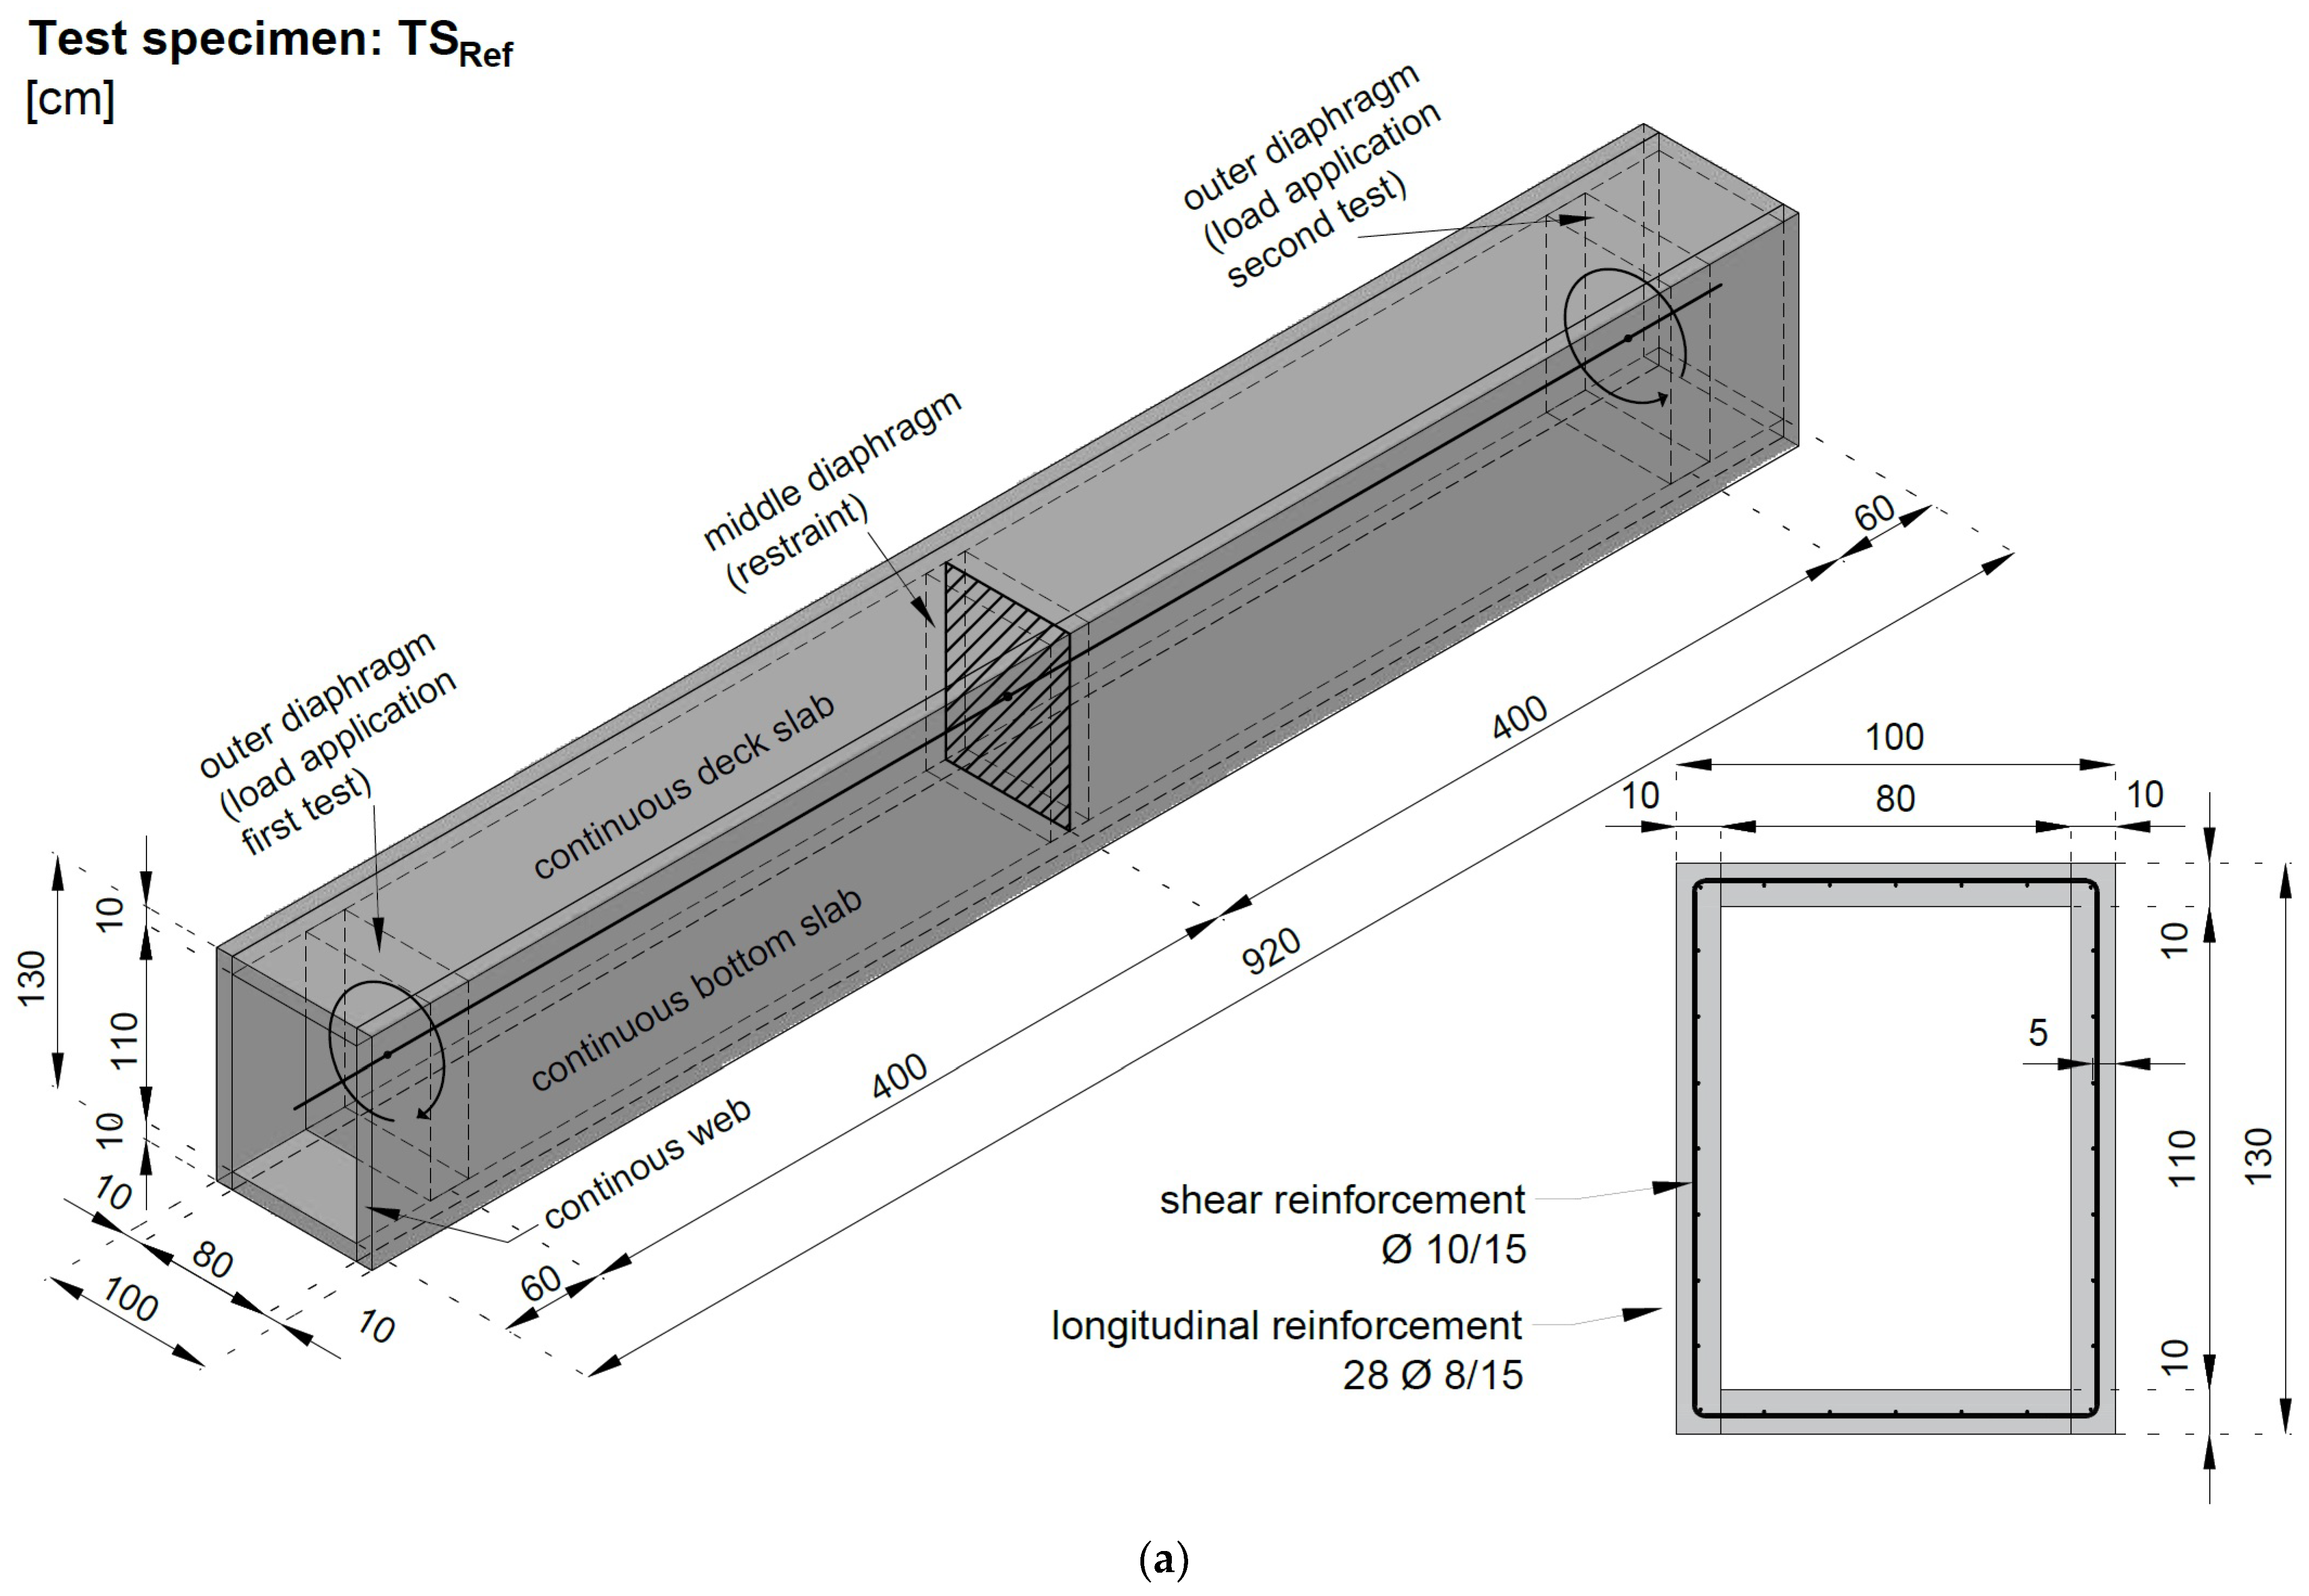
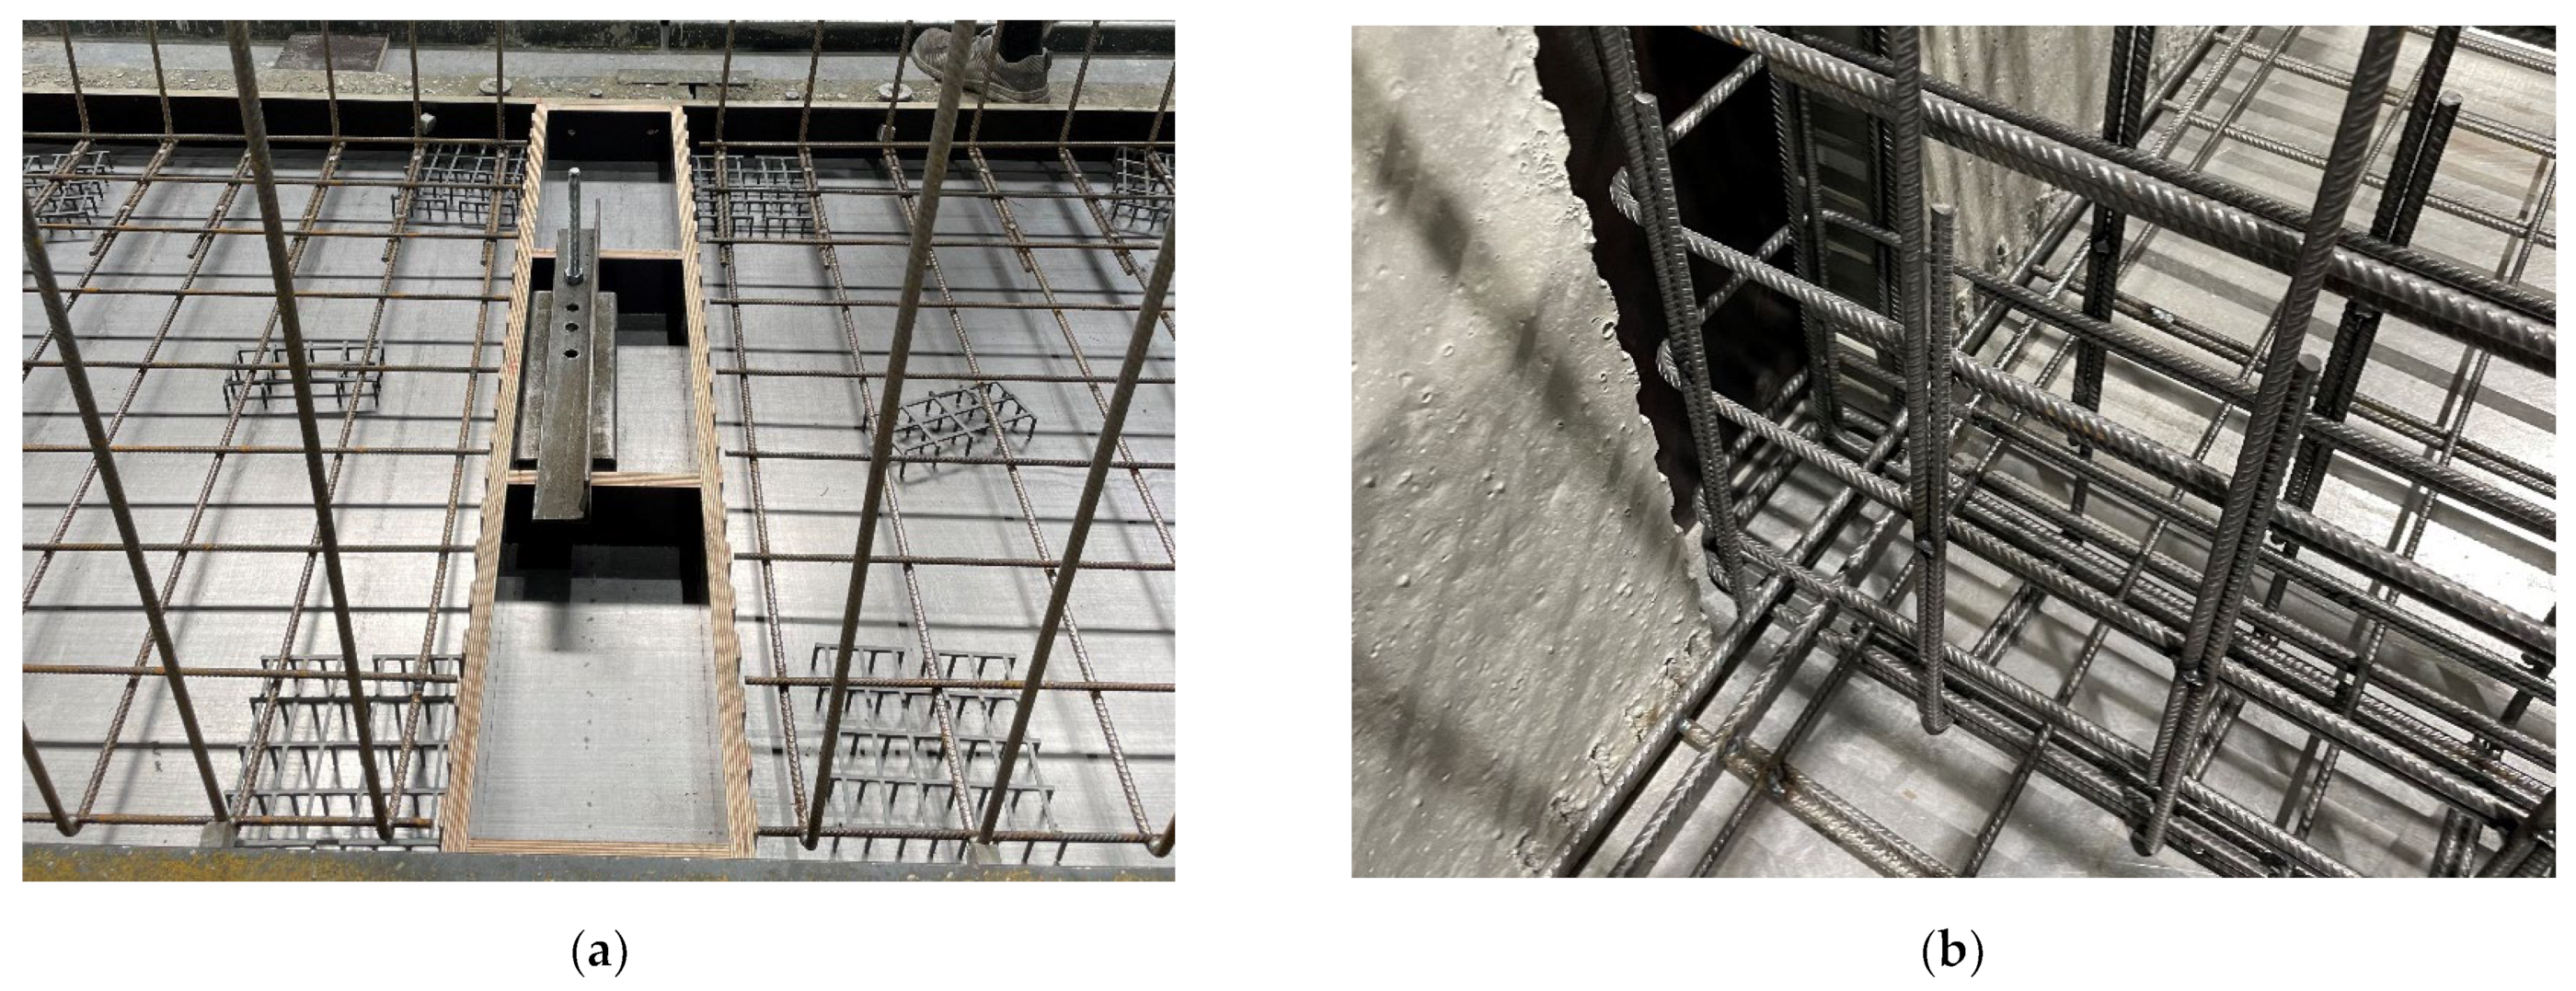
2.1.1. Test Specimen without Joints in the Webs (TSRef)
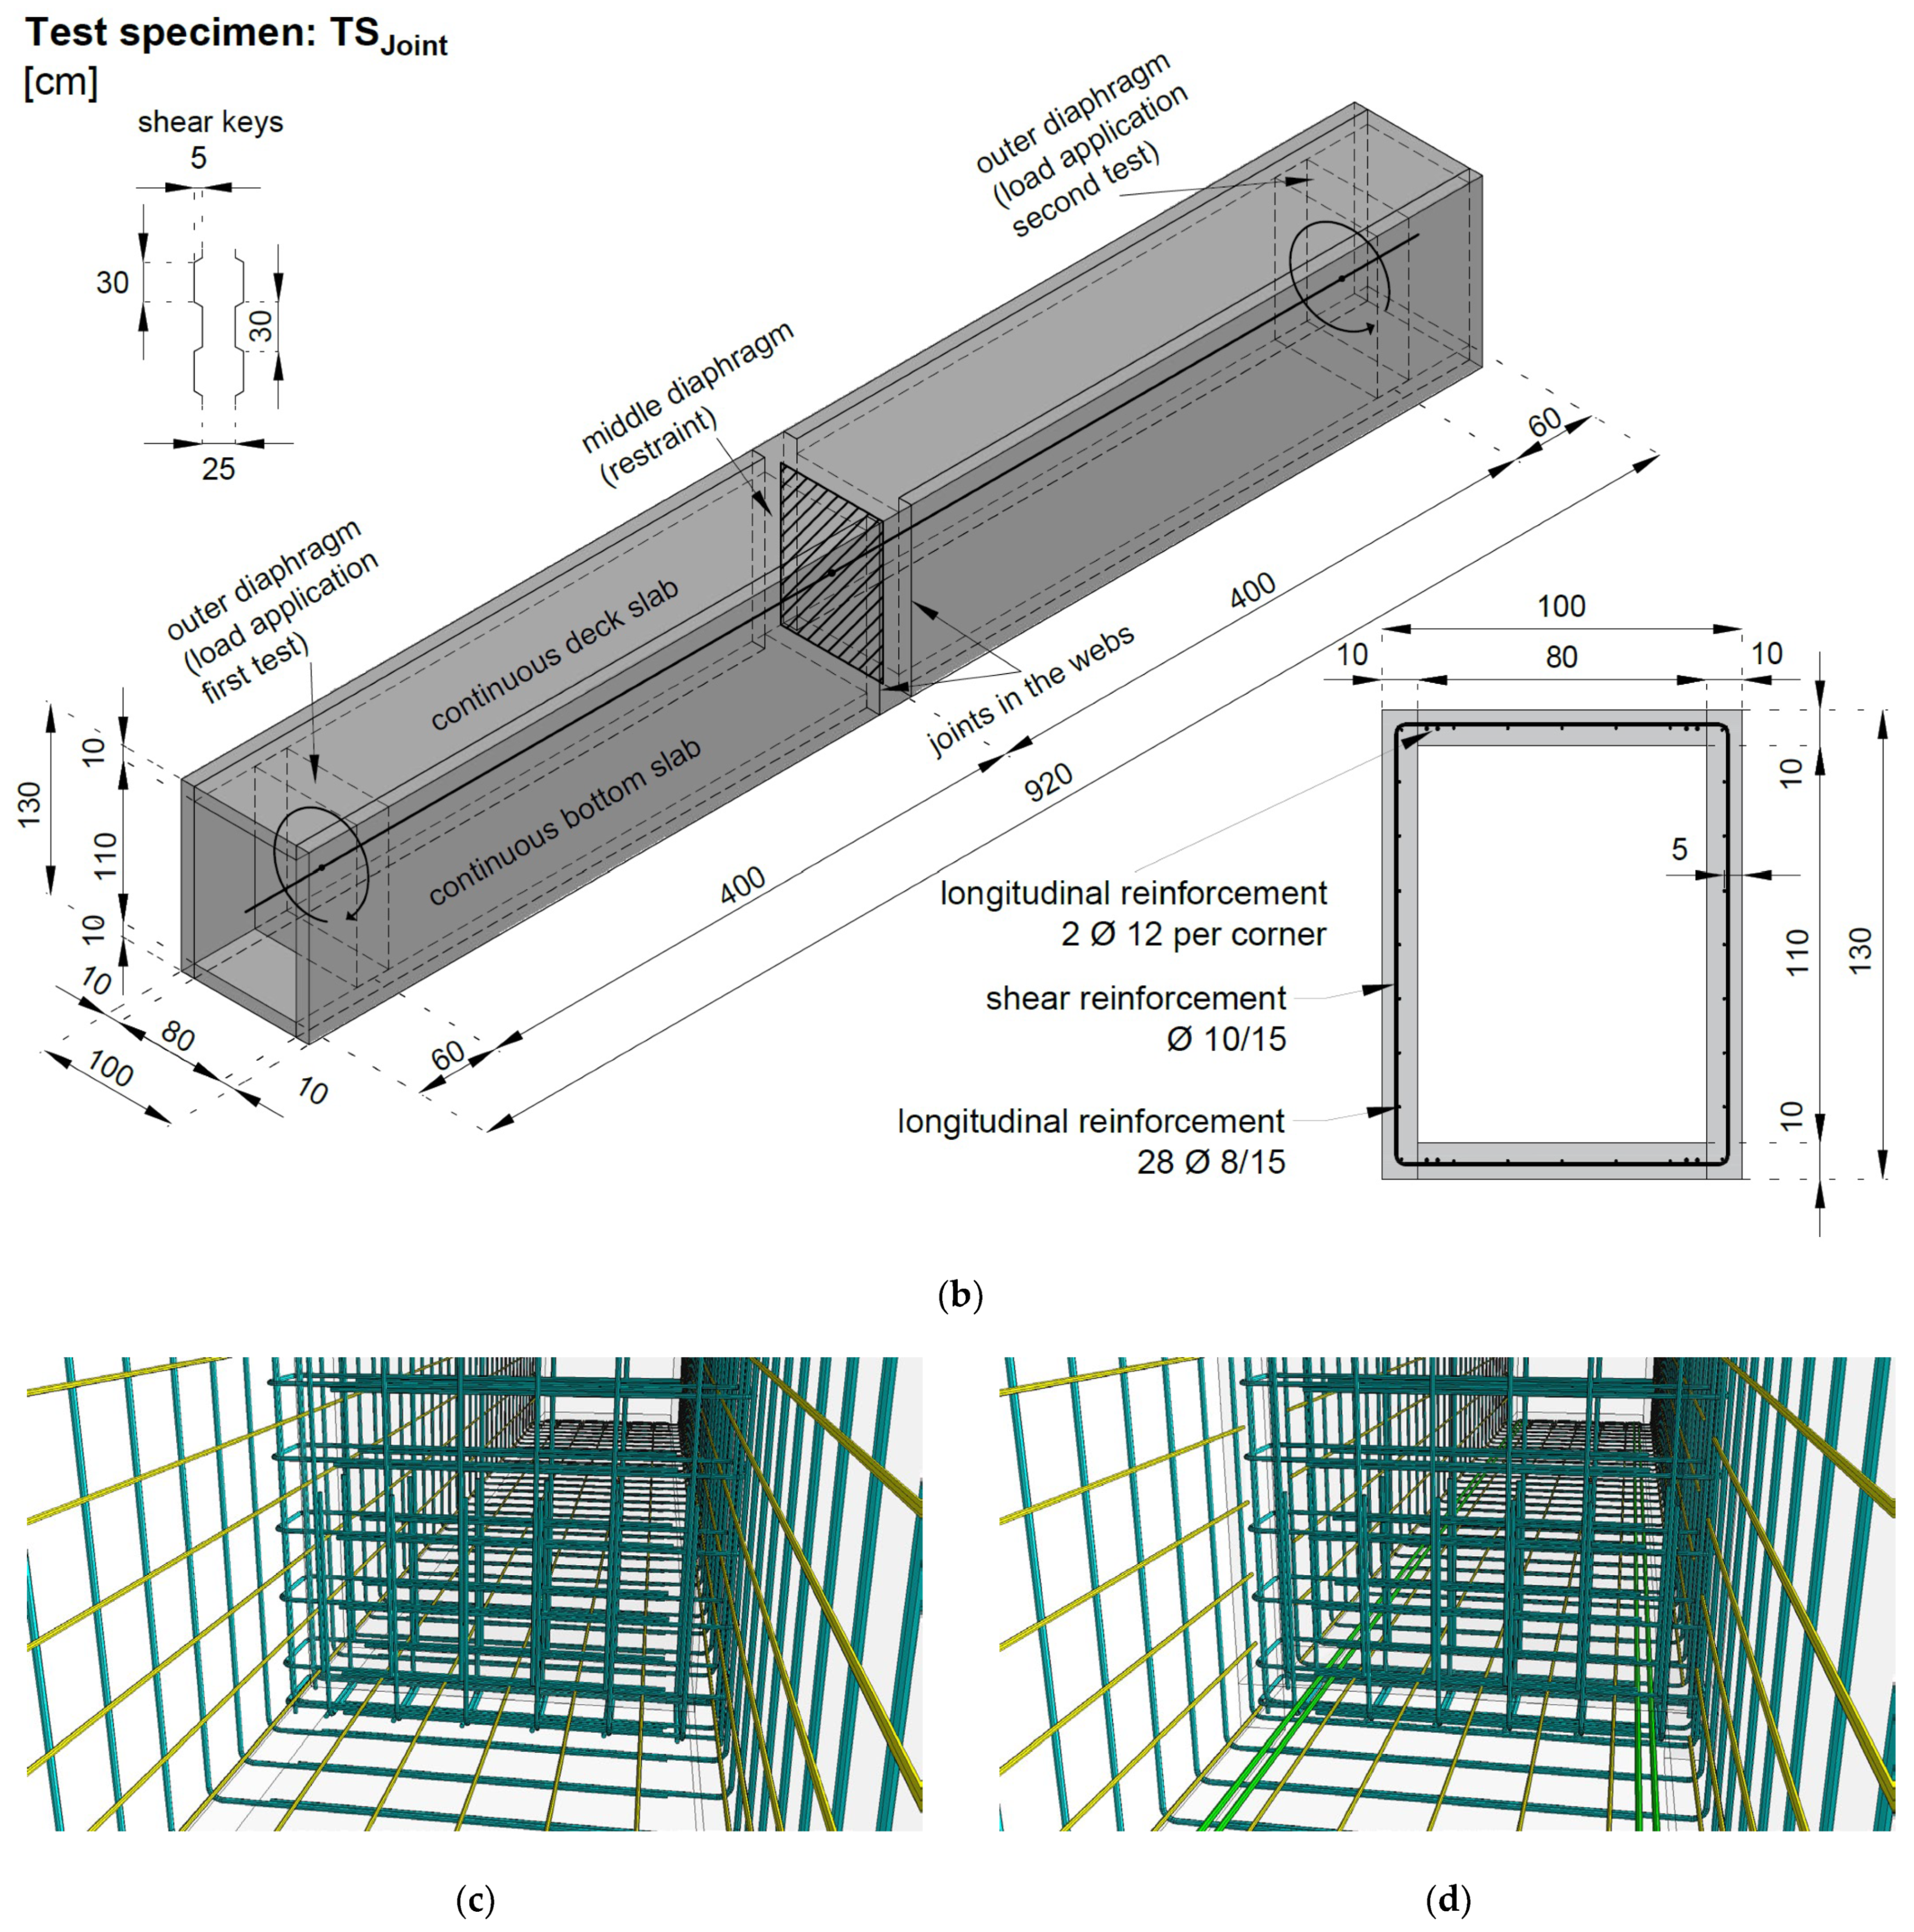
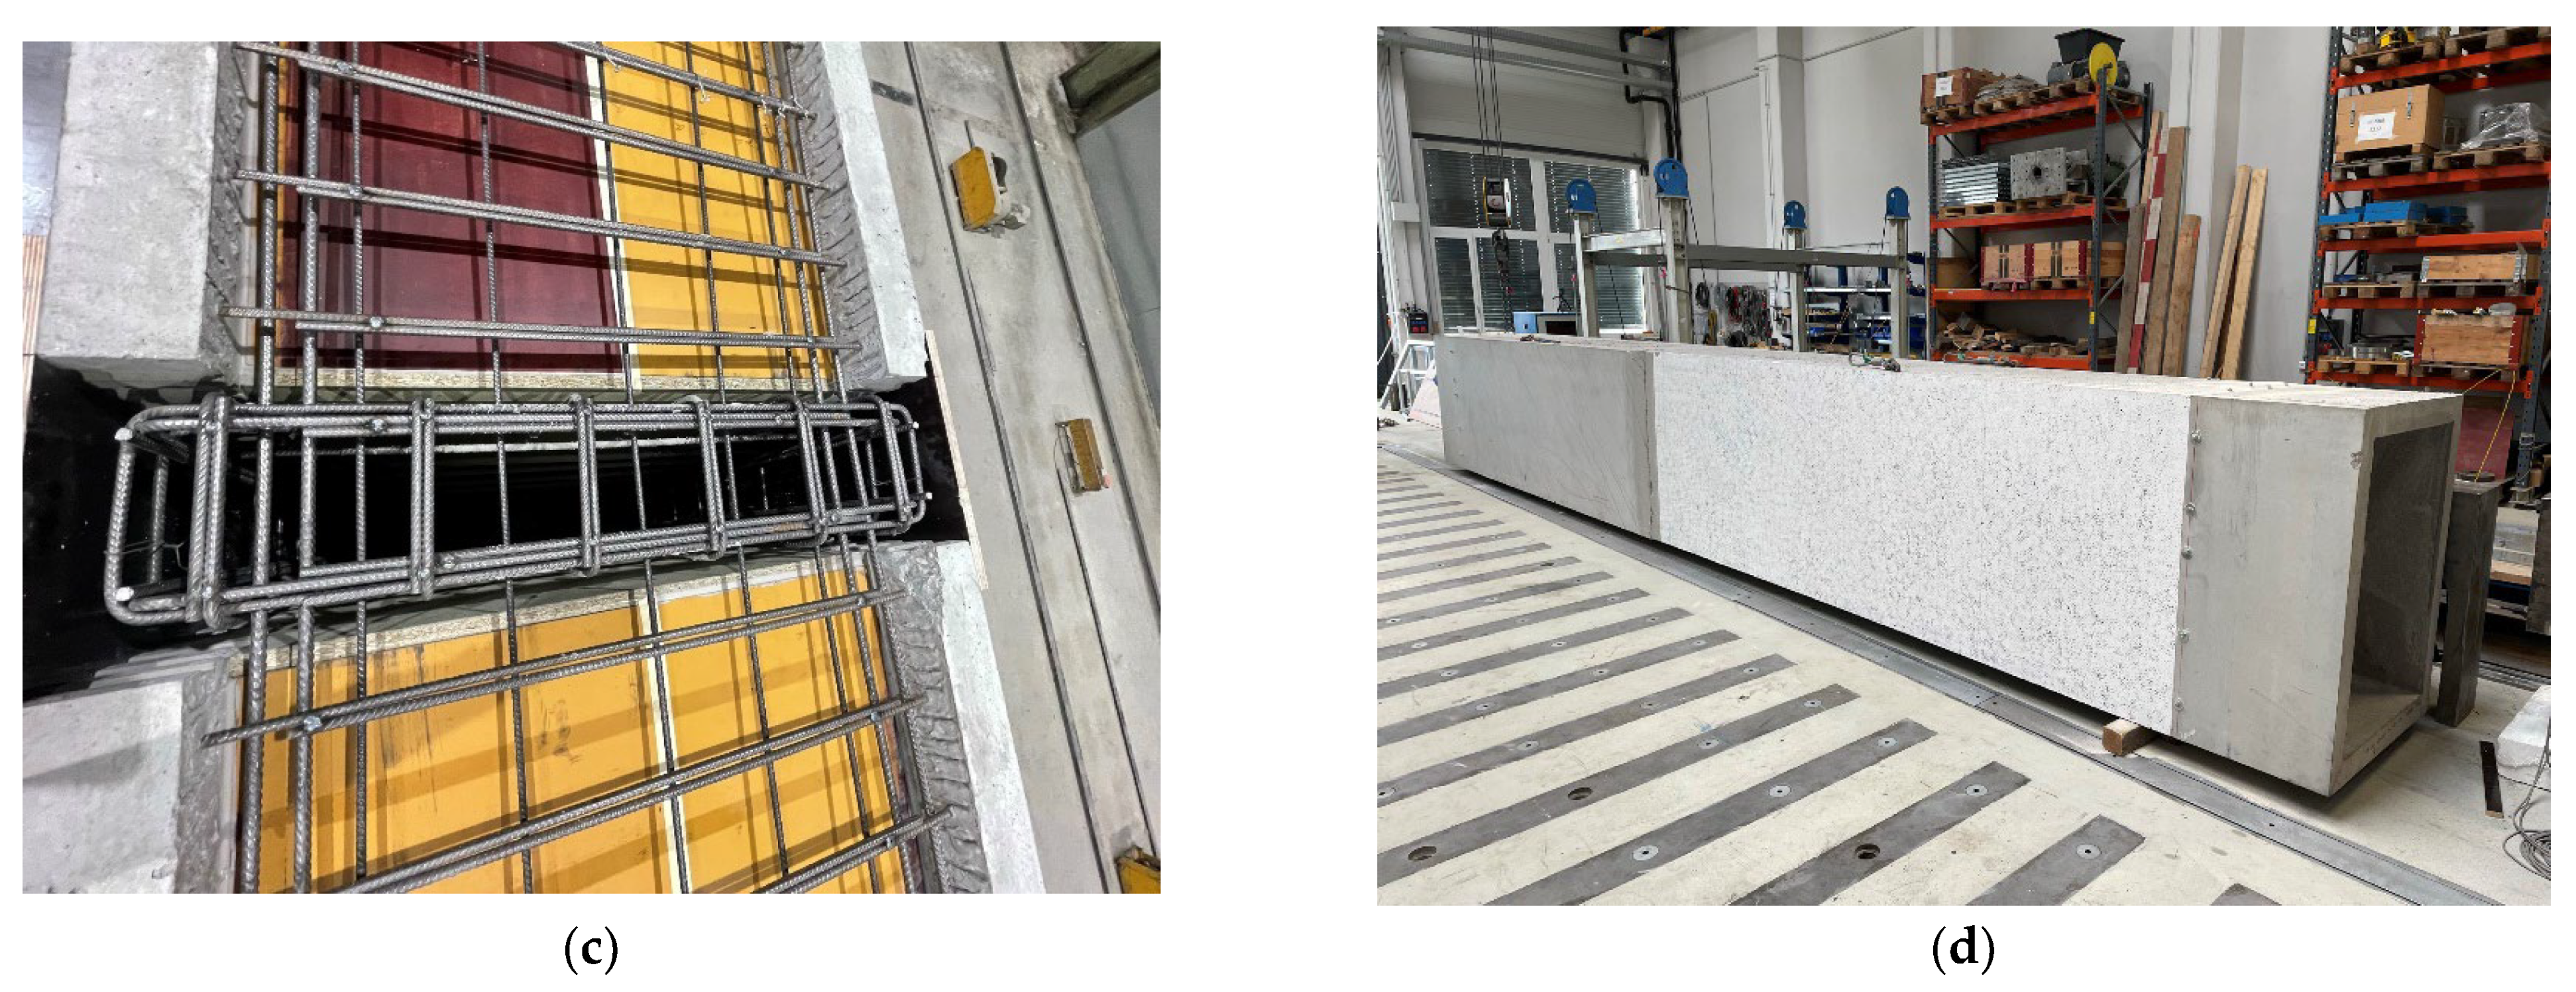
2.1.2. Test Specimen with Unreinforced Joints in the Webs (TSJoint)
2.1.3. Materials
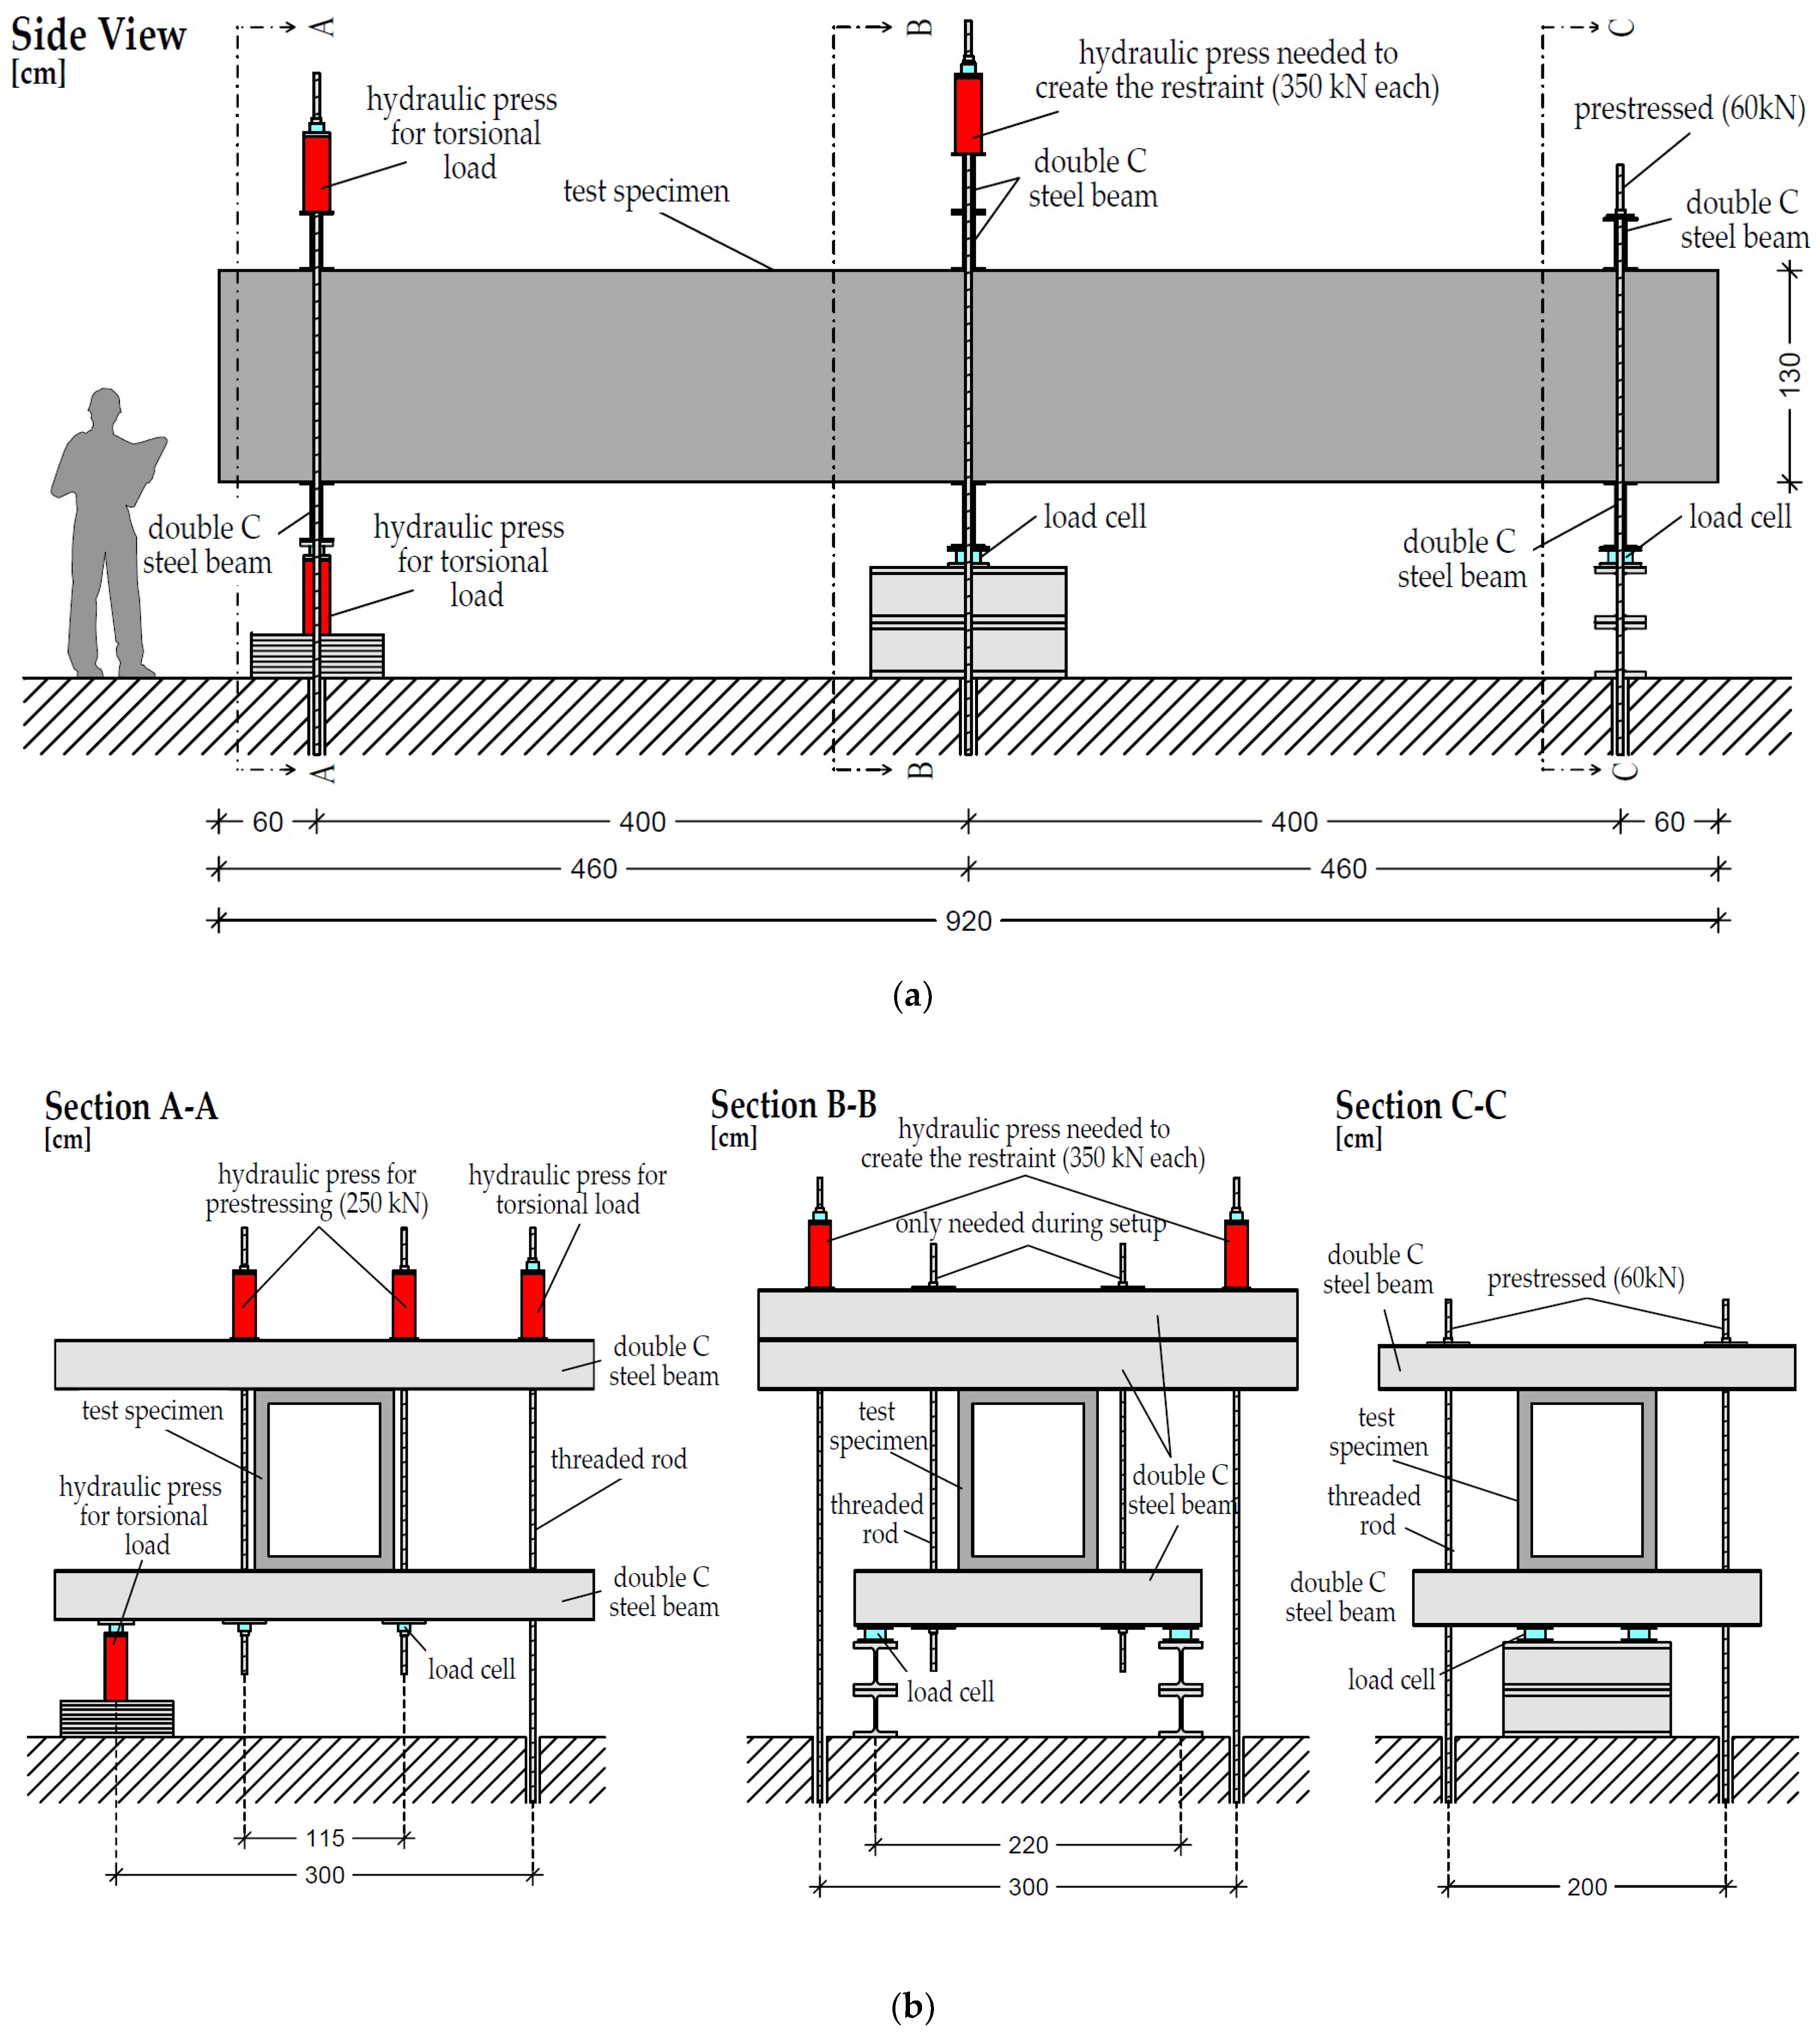
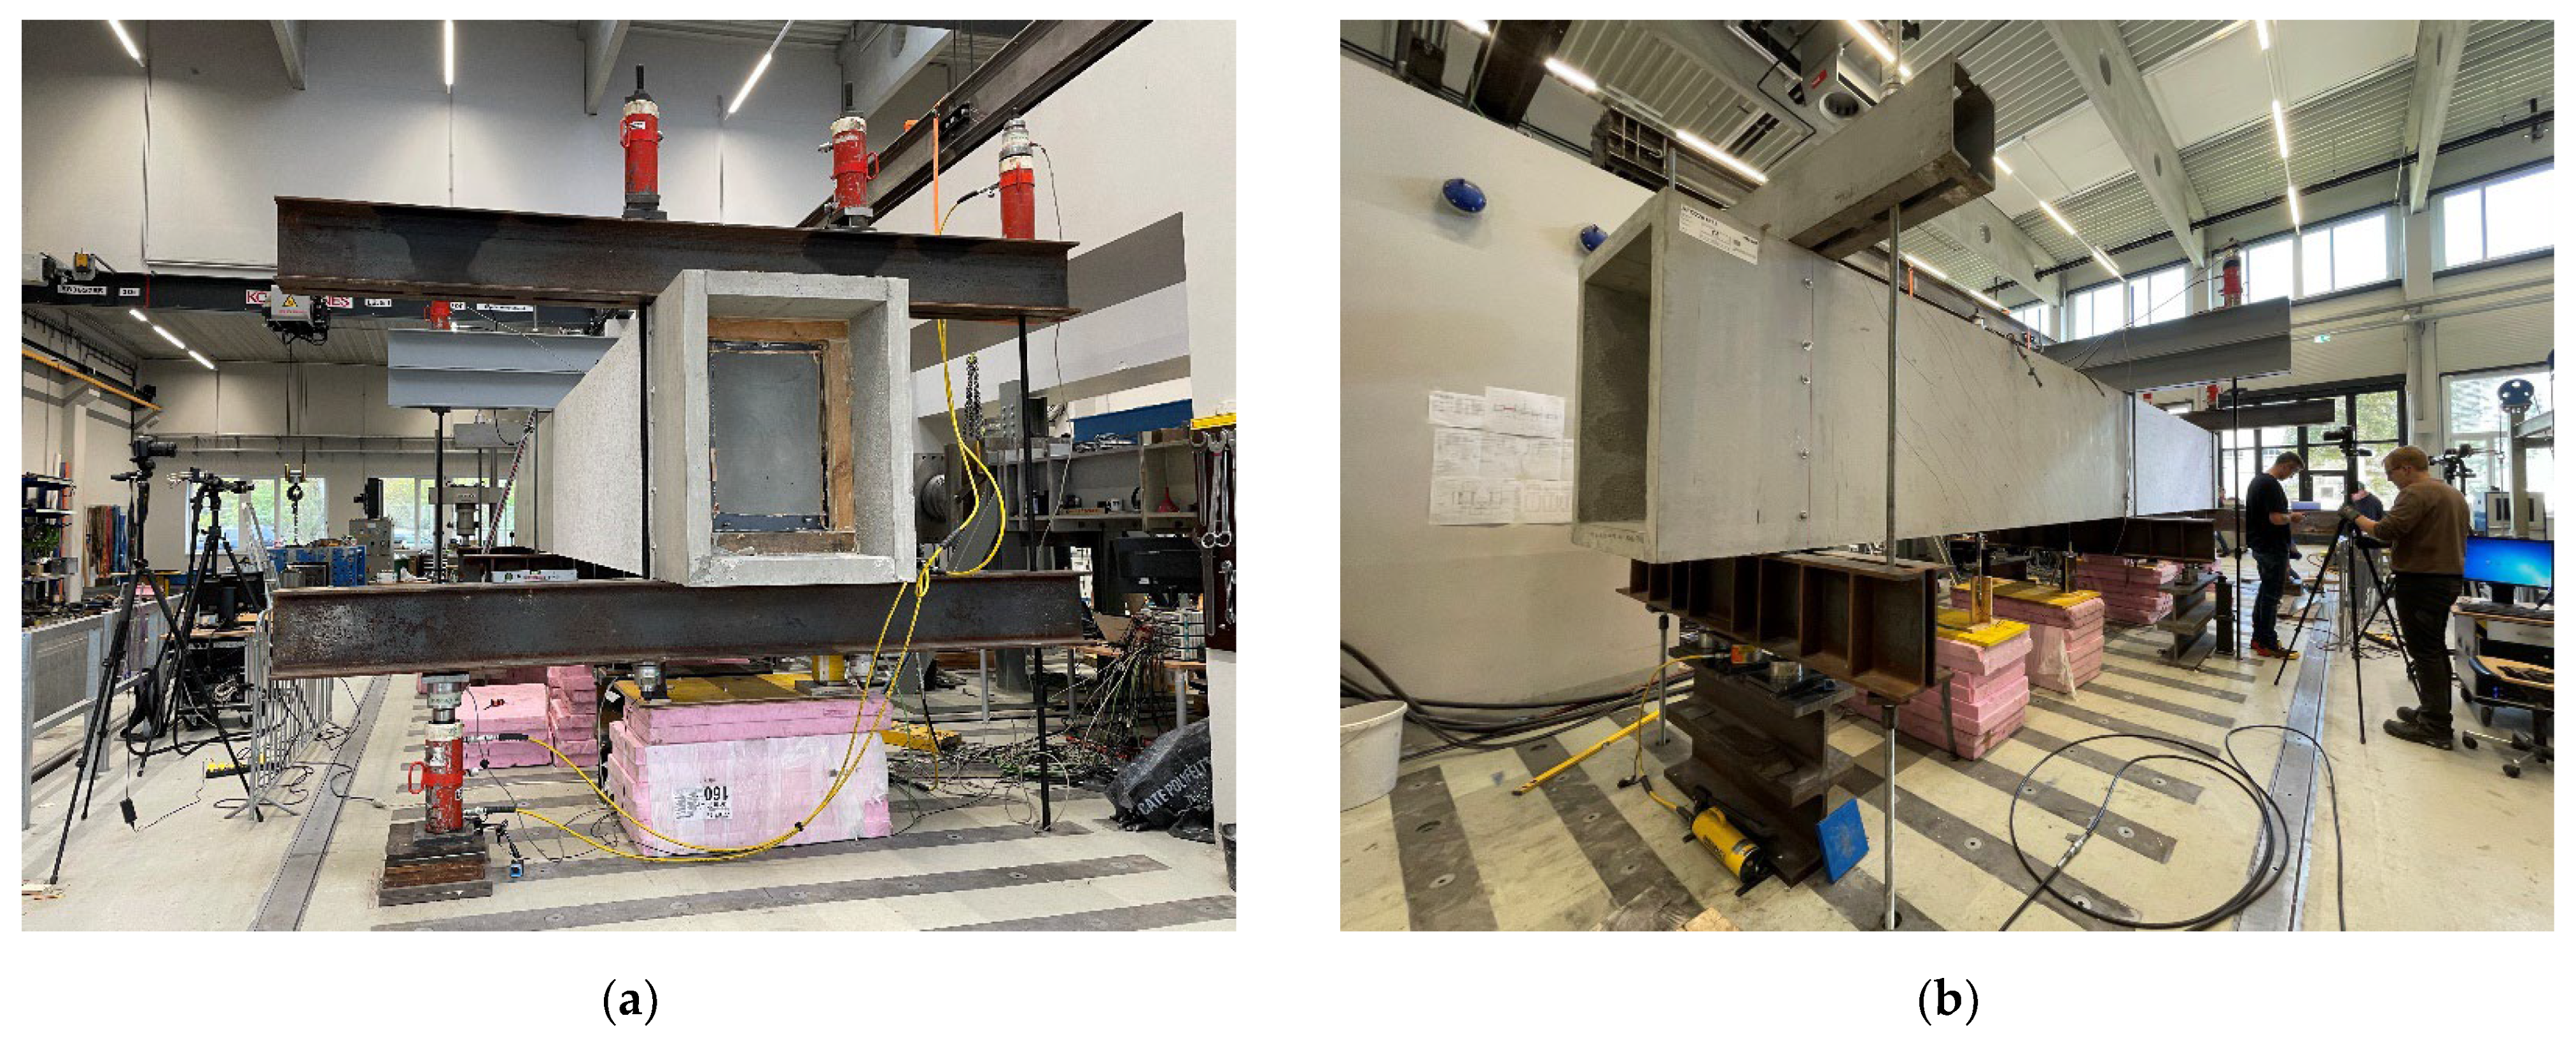
2.2. Methodology: Test Setup, Load Application, and Measurement Setup
2.3. Results
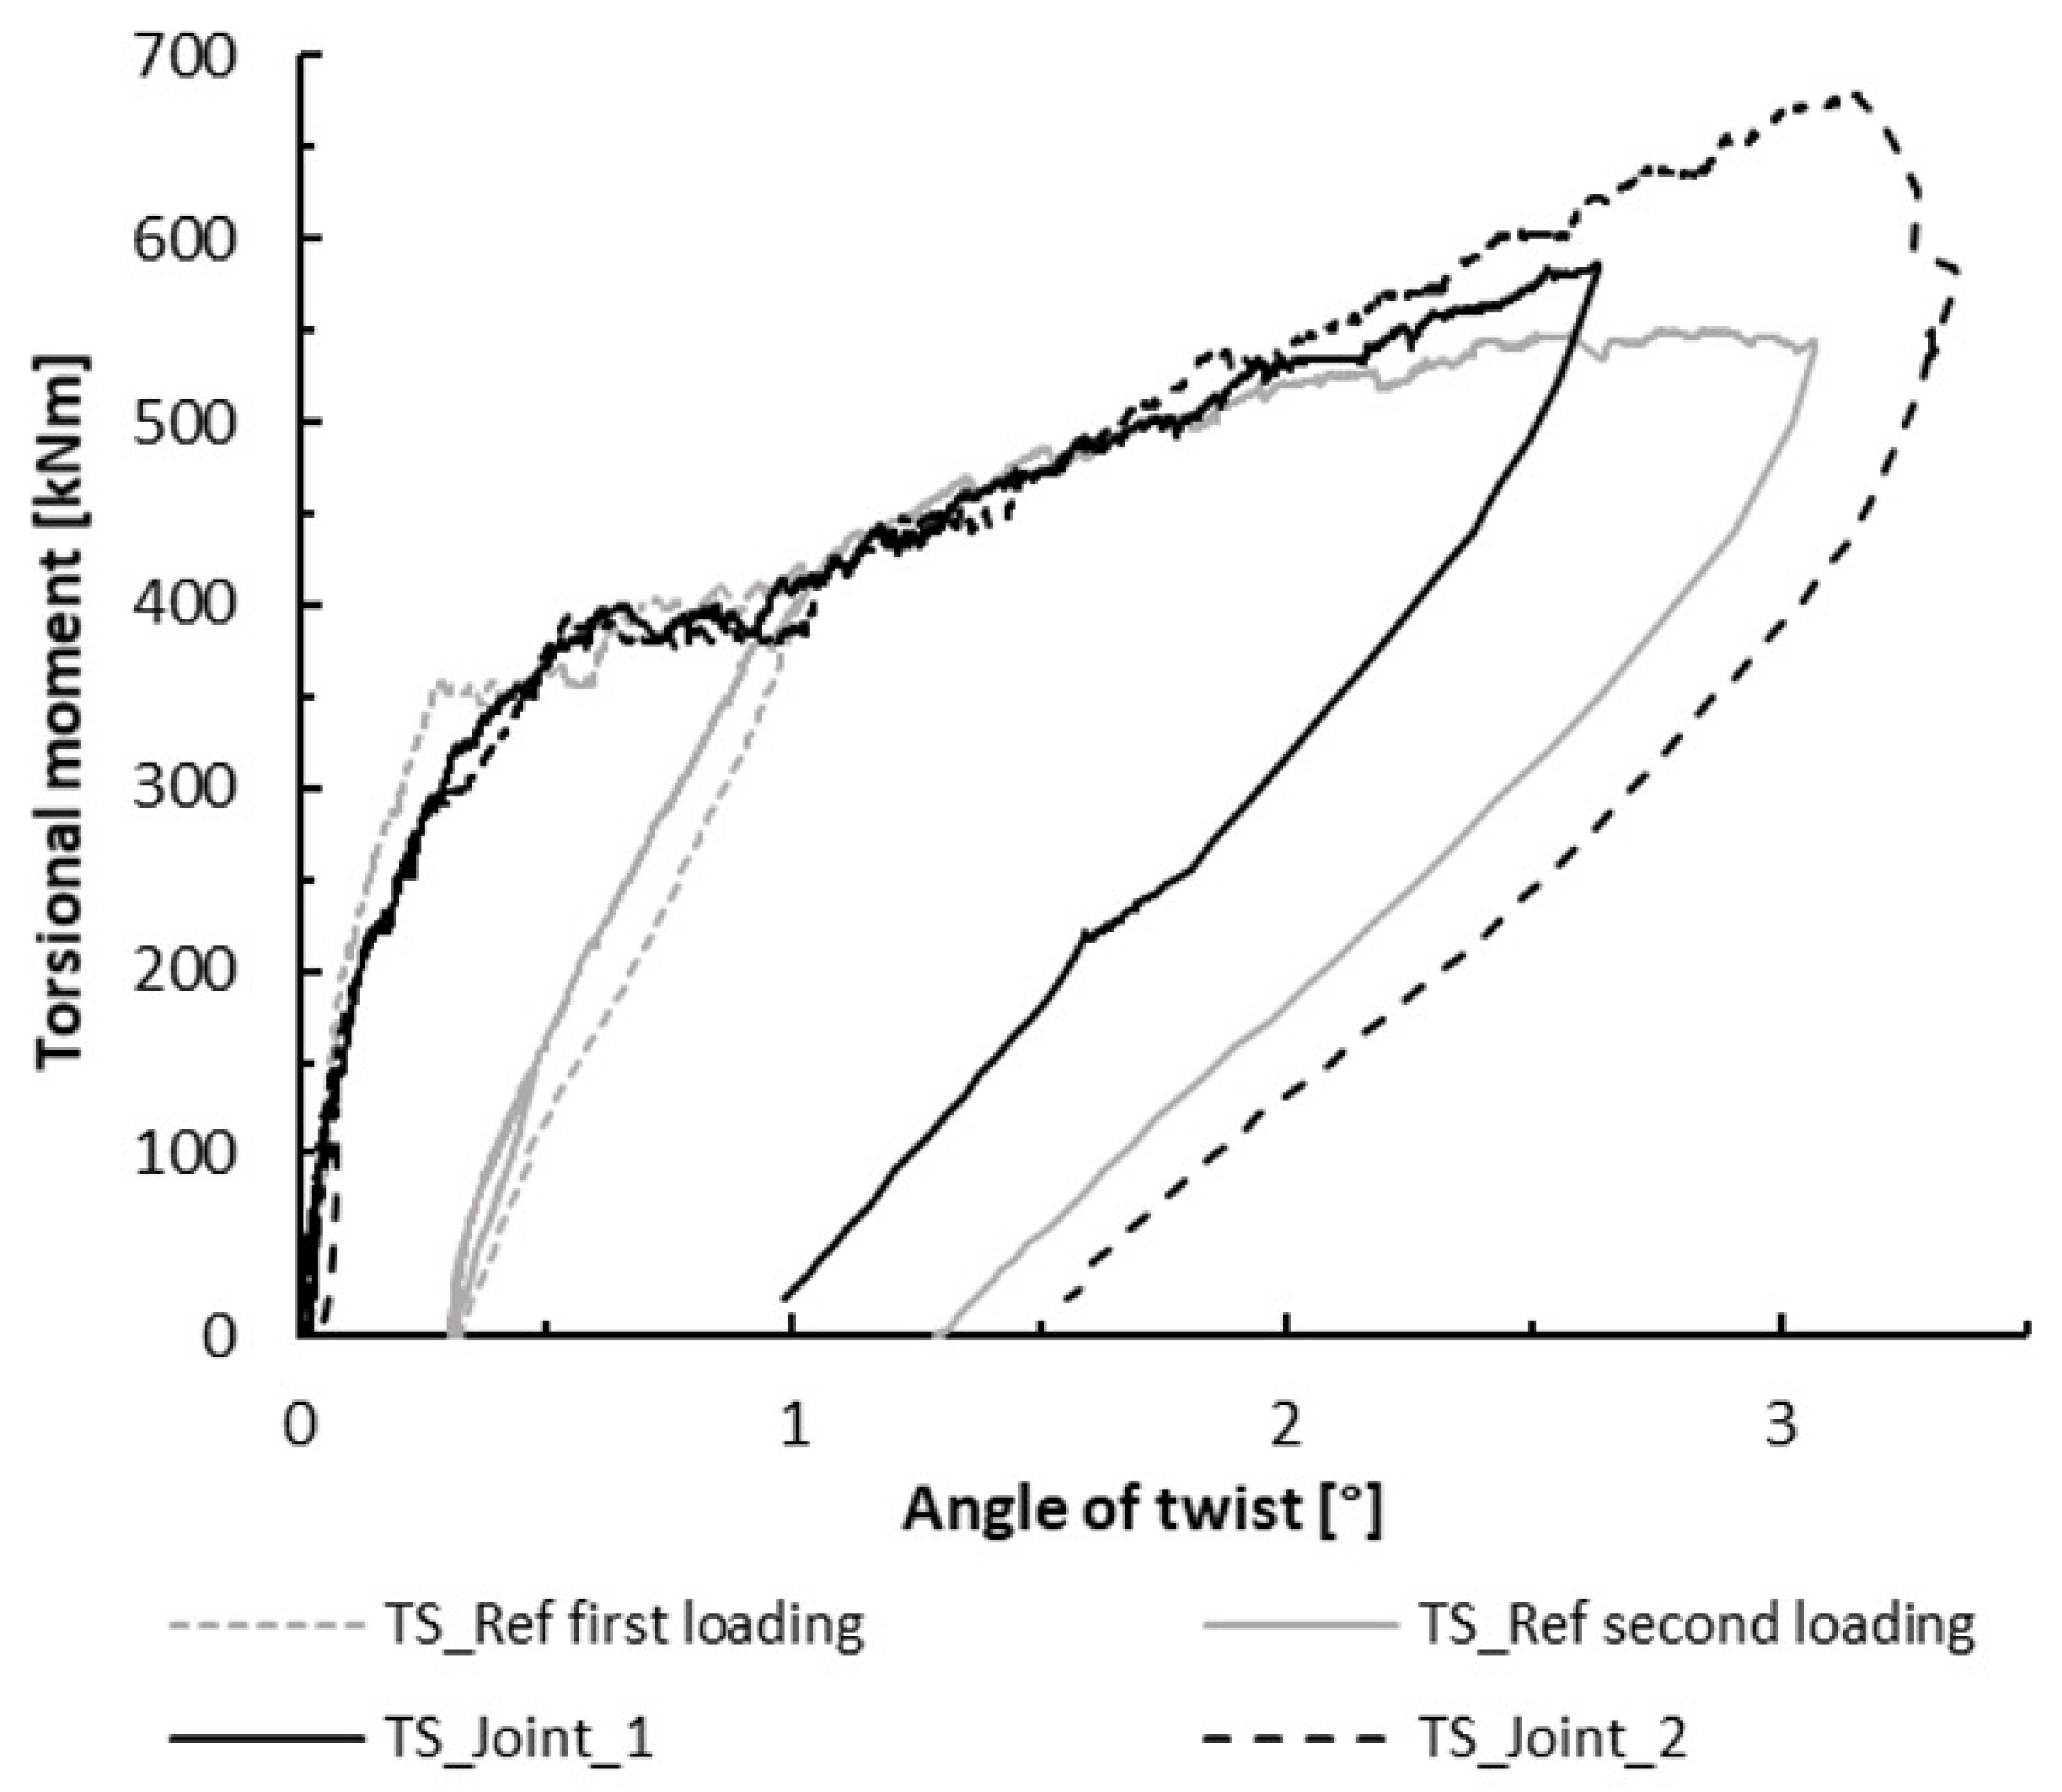
2.3.1. Course of Experiments and Maximal Torsional Moments
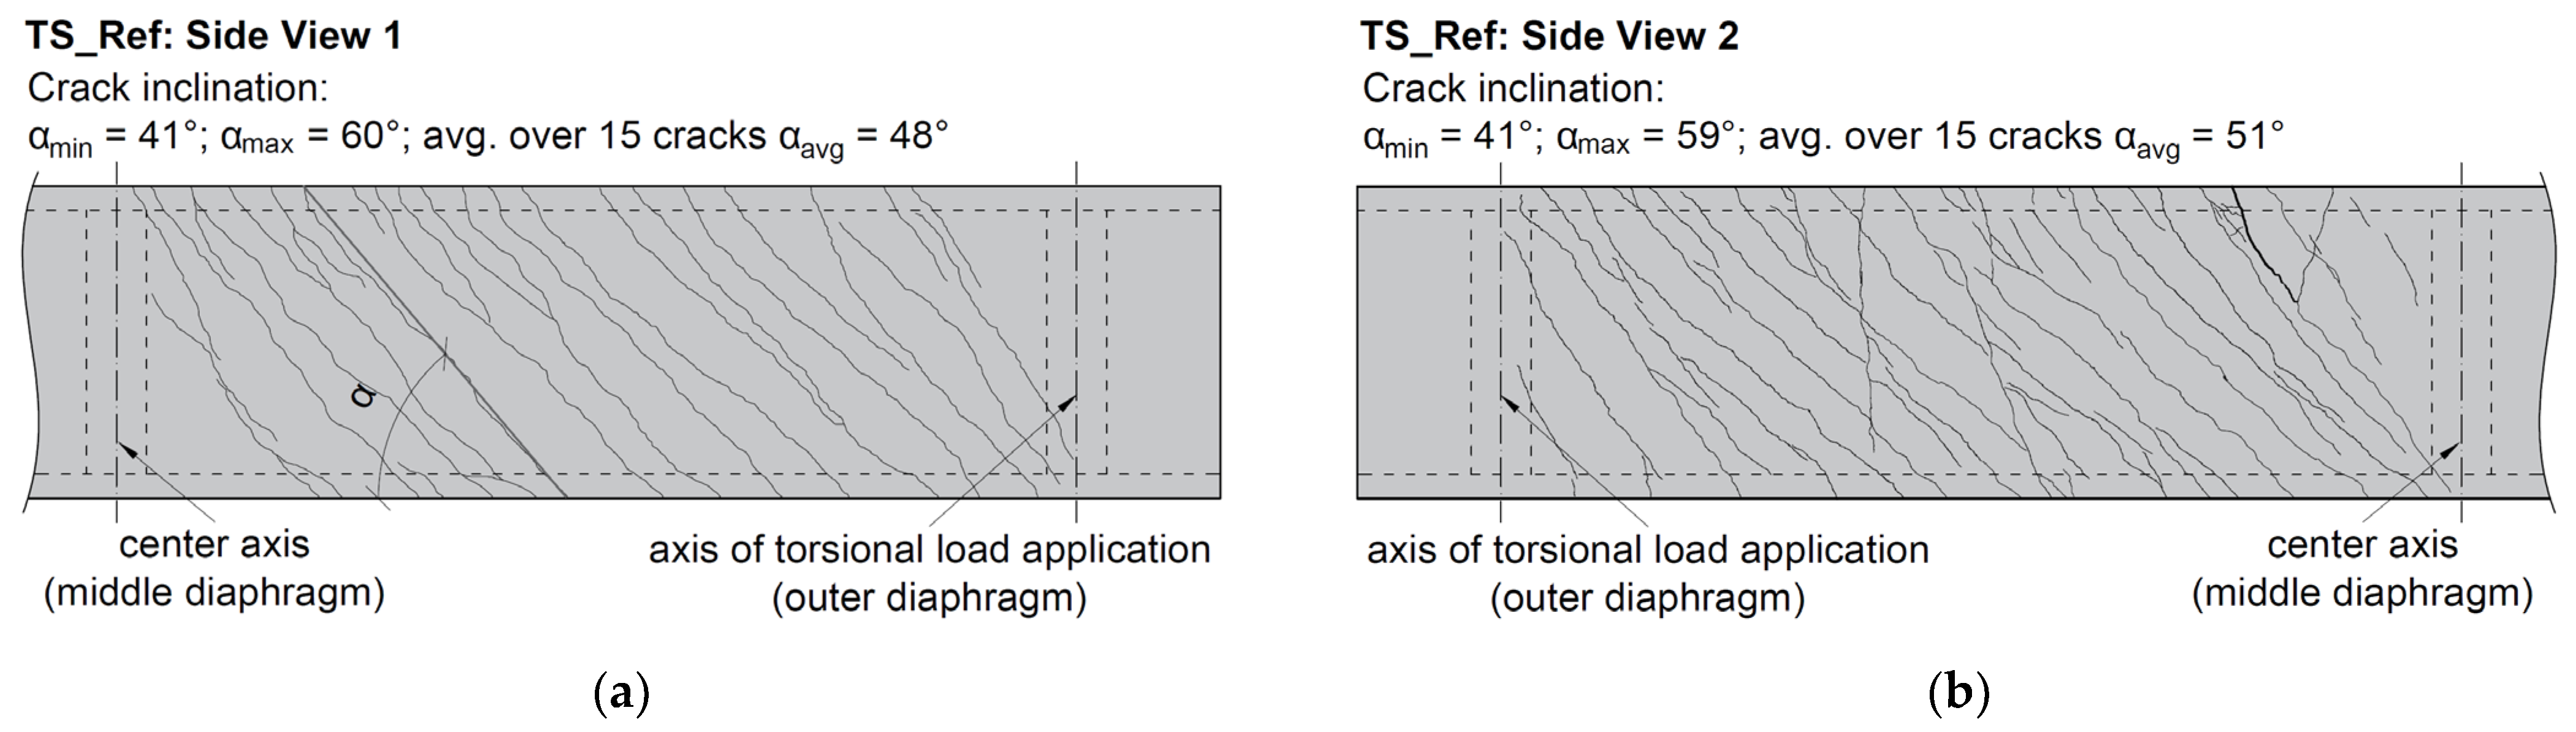
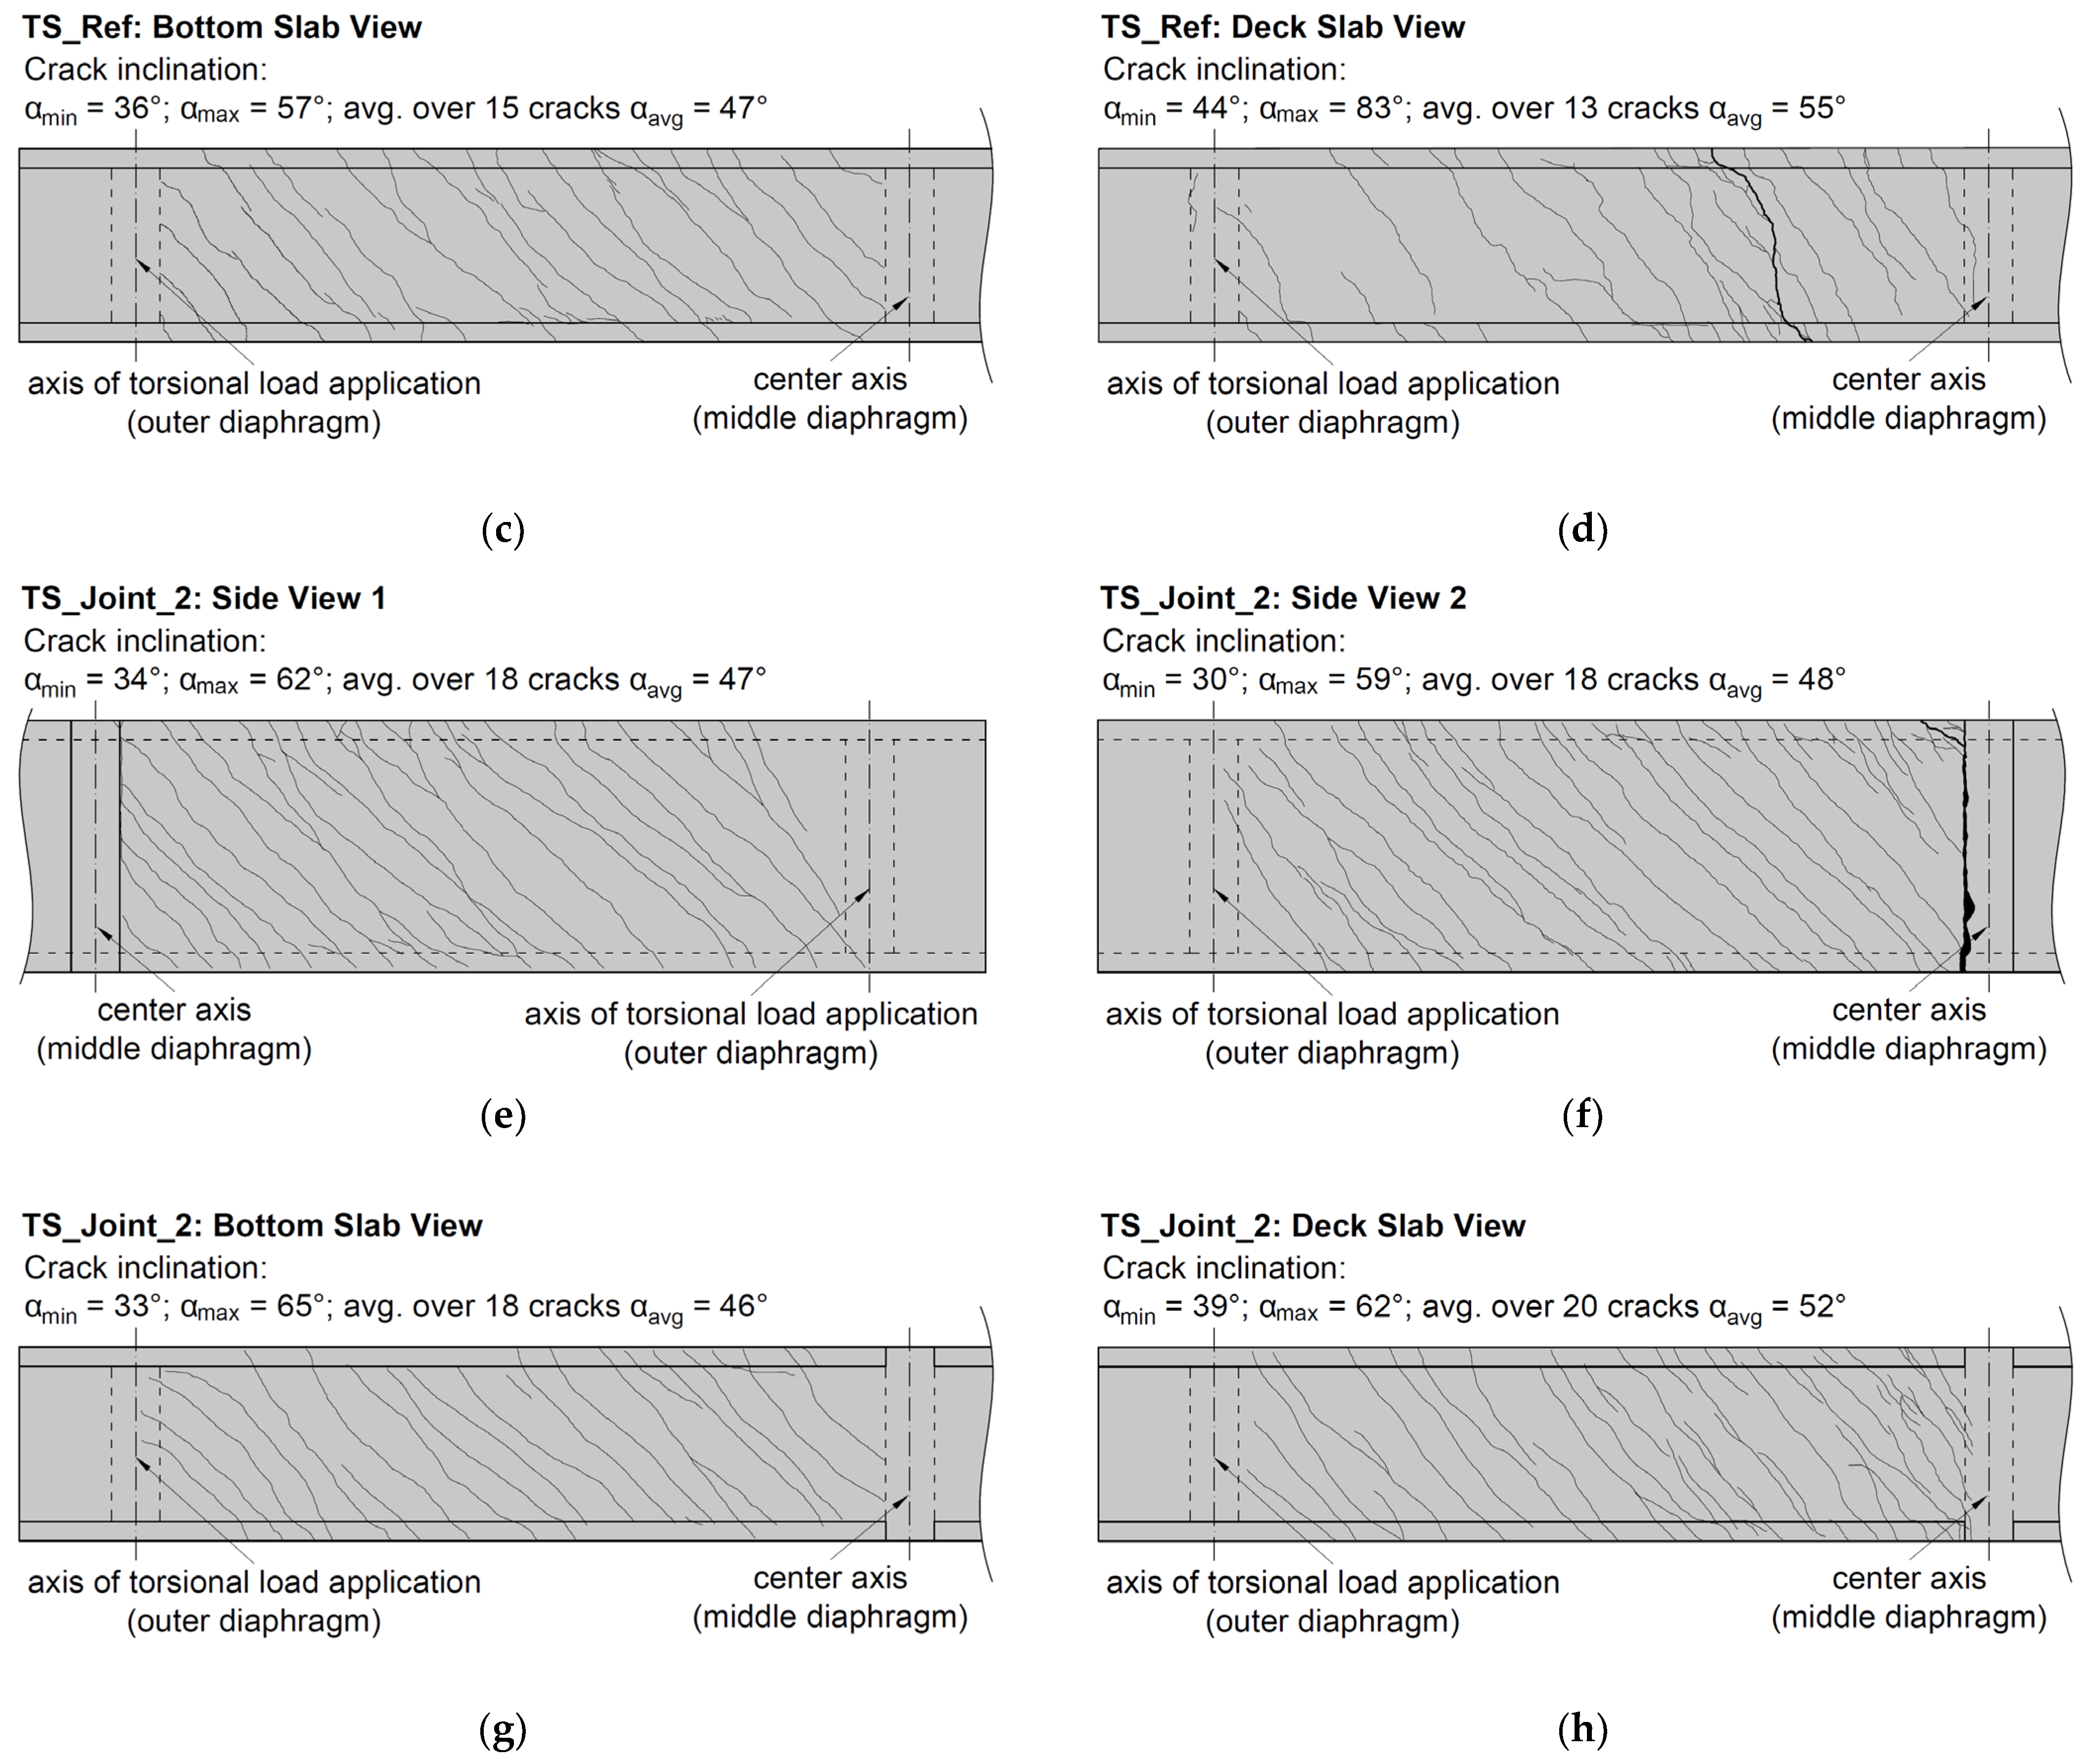
2.3.2. Crack Patterns
3. Comparison of the Experiments with Analytical Models and Discussion of the Results
3.1. Calculation for Pure Torsion and Combination of Torsion and Bending
3.2. Discussion and Interpretation of the Results
4. Conclusions
- The reference test specimen TSRef failed at a torsional moment of 551 kNm and an associated bending moment of 96 kNm, with the decisive crack occurring at a distance of 1.20 m from the restraint. The computational analysis presented almost exact agreement with the experimental investigations. However, it was observed that the girder did not fail at the restraint, where the associated bending moment was significantly higher (i.e., 161 kNm). It can be assumed that the vertical compressive stresses in the web—resulting on the one hand from the simulated deflection force of the prestressing and, on the other hand, from the reaction forces resulting from the compression struts from the webs on the restraint—increase the torsional load-bearing capacity.
- The test specimen TSJoint, which represents the bridge superstructure of the new bridge construction method, was able to withstand higher torsional loads (i.e., up to 681 kNm) than the reference girder. This was only due to the adapted reinforcement layout with additional bars in the corner areas of the deck and bottom slabs. The fact that no premature failure occurred, despite the unreinforced joints at the connection to the restraint, can again be attributed to the vertical compressive stresses in the joints and webs which, on the one hand, hinder crack opening due to torsion and, on the other hand, ensure a shorter anchorage length of the longitudinal reinforcement abutting the joint.
- Further investigations will focus on the influence of the vertical compressive stresses. Thus, for the next test series, it is planned to move the joint into the span section.
- Another important point to be analyzed in future experimental studies is the influence of post-tensioning on the torsional behavior of girders according to the LT-bridge construction method. Since this investigation is beyond the scope of this paper, the analysis of the effects of post-tensioning was excluded for the time being. However, experiments with longitudinal post-tensioning will be carried out in the near future.
Author Contributions
Funding
Institutional Review Board Statement
Informed Consent Statement
Data Availability Statement
Acknowledgments
Conflicts of Interest
Abbreviations
| αavg | Average crack angle (°) |
| αmax | Steepest crack angle (°) |
| αmin | Flattest crack angle (°) |
| Ak | Area inside the centerlines of the equivalent box girder (cm2) |
| As,corner | Area of the longitudinal reinforcement in the corner (cm2) |
| As,corner,red | Area of the longitudinal reinforcement available for torsion in the corner (cm2) |
| Asl | Total area of longitudinal reinforcement installed in the beam (cm2) |
| Asl,red | Total area of longitudinal reinforcement available for torsion (cm2) |
| Asw | Diameter of the stirrup (cm2) |
| bweb | Width of the web (m) |
| fyl | Yield stress of the longitudinal reinforcement (N/mm2) |
| fys | Yield stress of the stirrup (N/mm2) |
| hweb | Height of the web (m) |
| Mexperiment | Bending moment occurring in the experimental investigations (kNm) |
| sw | Distance between the stirrups in longitudinal direction of the beam (cm) |
| Tmax,calculated | Maximum torsional moment according to the calculations (kNm) |
| Tmax,experiment | Maximum torsional moment assessed within the experimental investigations (kNm) |
| τweb | Shear stress in the webs (N/mm2) |
| θ | Inclination of the compression strut (°) |
| uk | Circumference of the centerline of the equivalent box girder (cm) |
| Vexperiment | Shear force occurring in the experimental investigations (kN) |
| Vmax,experiment | Maximum shear force occurring in the experimental investigations (kN) |
References
- Reichenbach, S. Areas of Application of Thin-Walled Precast Concrete Elements: From Integral Bridges with Short and Medium Spans to Multi-Span Bridges. Ph.D. Thesis, TU Wien, Vienna, Austria, 2019. [Google Scholar]
- Wimmer, D. Entwicklung Eines Neuen Brückenbauverfahrens Durch Die Kombination von Dünnwandigen Betonfertigteilen und Vorspannung. Ph.D. Thesis, TU Wien, Vienna, Austria, 2016. [Google Scholar]
- Kollegger, J.; Foremniak, S.; Suza, D.; Wimmer, D.; Gmainer, S. Building bridges using the balanced lift method. Struct. Concr. 2014, 15, 281–291. [Google Scholar] [CrossRef]
- Kollegger, J.; Suza, D.; Proksch-Weilguni, C.; Träger, W. Entwicklung und erste Anwendung des Brückenklappverfahrens. Beton Stahlbetonbau 2020, 115, 484–494. [Google Scholar] [CrossRef]
- Kollegger, J.; Proksch-Weilguni, C.; Träger, W.; Fasching, S.; Rath, M.; Untermarzoner, F. Balanced Lift and Balanced Lowering Methods for Cost and Material Efficient Concrete Bridges. In Proceedings of the 6th Fib International Congress—Concrete Innovation for Sustainability, Oslo, Norway, 12–16 June 2022; pp. 2468–2477. [Google Scholar]
- Fasching, S.; Huber, T.; Rath, M.; Kollegger, J. Semi-precast segmental bridges: Development of a new construction method using thin-walled prefabricated concrete elements. Struct. Concr. 2021, 22, 1561–1573. [Google Scholar] [CrossRef]
- Fasching, S.; Huber, T.; Rath, M.; Kollegger, J. Semi-Precast Segmental Bridge Construction Method: Experimental Investigation on the Shear Transfer in Longitudinal and Transverse Direction. Appl. Sci. 2021, 11, 5502. [Google Scholar] [CrossRef]
- Fasching, S.; Suza, D.; Stoiber, M.; Rath, M.; Kollegger, J. Zur Ortbeton-Ergänzung einschaliger Halbfertigteilwände. Beton Stahlbetonbau 2021, 116, 958–968. [Google Scholar] [CrossRef]
- Untermarzoner, F.; Rath, M.; Kollegger, J. Thin-Walled Concrete Bridges—A New Construction Method for Sustainable Bridge Structures. In Proceedings of the 6th Fib International Congress—Concrete Innovation for Sustainability, Oslo, Norway, 12–16 June 2022; pp. 926–934. [Google Scholar]
- Untermarzoner, F.; Rath, M.; Kollegger, J. Thin-Walled Concrete Bridges—Fast Erection of Deck Slabs for Steel-Concrete-Composite Bridges. In Proceedings of the 6th Fib International Congress—Concrete Innovation for Sustainability, Oslo, Norway, 12–16 June 2022; pp. 920–925. [Google Scholar]
- Huang, H.; Huang, S.S.; Pilakoutas, K. Modeling for Assessment of Long-Term Behavior of Prestressed Concrete Box-Girder Bridges. J. Bridge Eng. 2018, 23. [Google Scholar] [CrossRef]
- Kollegger, J.; Untermarzoner, F.; Rath, M. Verfahren zur Herstellung einer Brücke aus Pfeilersegmenten, Längsträgern und Fahrbahnplattenelementen. Austrian Patent Application A225-2022, 2 December 2022. [Google Scholar]
- Mitchell, D.; Collins, M.P. Detailing for Torsion. J. Proc. 1976, 73, 506–511. [Google Scholar]
- Collins, M.P.; Mitchell, D. Shear and torsion design of prestressed and non prestressed concrete beams. PCI J. 1980, 25, 32–100. [Google Scholar] [CrossRef]
- EN 1992-1-1:2015; Eurocode 2: Bemessung und Konstruktion von Stahlbeton- und Spannbetontragwerken—Teil 1-1 Allgemeine Bemessungsregeln und Regeln für den Hochbau (Konsolidierte Fassung). Austrian Standards International: Vienna, Austria, 2015.
- Lampert, P.; Thürlimann, B. Torsionsversuche an Stahlbetonbalken; Institut für Baustatik, ETH Zürich: Zürich, Switzerland, 1968; Volume 6506. [Google Scholar] [CrossRef]
- Lampert, P.; Thürlimann, B. Torsions-Biege-Versuche an Stahlbetonbalken; ETH Zürich: Zürich, Switzerland, 1969; Volume 6506. [Google Scholar] [CrossRef]
- Lampert, P. Bruchwiderstand von Stahlbetonbalken unter Torsion und Biegung. Ph.D. Thesis, ETH Zürich, Zürich, Switzerland, 1970. [Google Scholar]
- Lampert, P.; Thürlimann, B.; Lüchinger, P. Torsionsversuche an Stahl- und Spannbetonbalken; Institut für Baustatik, ETH Zürich: Zürich, Switzerland, 1971; Volume 6506-4. [Google Scholar] [CrossRef]
- Lampert, P. Torsion und Biegung von Stahlbetonbalken: Vortrag. Schweizerische Bauzeitung, Band 88, Heft 5, Verlags-AG der Akademischen Technischen Vereine. 1970. Available online: https://www.e-periodica.ch/digbib/view?pid=sbz-002:1970:88::100 (accessed on 10 January 2023).
- Kromoser, B. Brückenbau mit dünnwandigen Fertigteilen: Großversuch zur Herstellung und zum Torsionswirkungsverhalten. Bridge Building with Thin Walled Concrete Parts—Large Scale Experiment about the Production and about the Torsional Characteristics. Master’s Thesis, TU Wien, Wien, Austria, 2011. [Google Scholar]
- Humer, A. Zum Tragverhalten von Stahlbetonbauteilen unter Torsionsbeanspruchung. Master’s Thesis, TU Wien, Wien, Austria, 2015. [Google Scholar]
- Bernardo, L.F.; Lopes, S.M. Torsion in High-Strength Concrete Hollow Beams: Strength and Ductility Analysis. Struct. J. 2009, 106, 39–48. [Google Scholar] [CrossRef]
- Jeng, C.-H.; Peng, S.; Chiu, H.-J.; Hsiao, C.-K. New Torsion Experiment on Large-Sized Hollow Reinforced Concrete Beams. ACI Struct. J. 2014, 111, 1469. [Google Scholar] [CrossRef]
- Specker, A. Der Einfluss der Fugen auf die Querkraft- und Torsionstragfähigkeit Extern Vorgespannter Segmentbrücken. Ph.D. Thesis, Technische Universität Hamburg, Hamburg, Germany, 2001. [Google Scholar]


| Concrete Mixture | Concrete Age (Days) | fcm,cube (N/mm2) | fcm,cyl (N/mm2) | fctm (N/mm2) | Associated Components |
|---|---|---|---|---|---|
| 1 | 41 | 61.2 (±1.0%) | 49.5 (±1.5%) | 3.32 (±8.1%) | TSRef: webs |
| 2 | 30 | 60.8 (±2.7%) | 50.2 (±4.7%) | 2.91 (±10.6%) | TSRef: bottom slab |
| 3 | 28 | 74.5 (±3.7%) | 64.3 (±5.3%) | 3.19 (±8.4%) | TSRef: deck slab |
| 4 | 44 | 62.5 (±1.8%) | 52.3 (±2.0%) | 3.23 (±9.6%) | TSJoint: webs |
| 5 | 40 | 65.8 (±0.2%) | 55.1 (±2.7%) | 3.59 (±5.8%) | TSJoint: bottom slab |
| 6 | 38 | 80.9 (±6.7%) | 64.7 (±3.2%) | 3.59 (±7.9%) | TSJoint: deck slab |
| Test Specimen | Asw (cm2) | sw (cm) | Asl (cm2) | uk (cm) | Ak (cm2) | fy,s (N/mm2) | fy,l (N/mm2) |
|---|---|---|---|---|---|---|---|
| TSRef | 0.79 | 15.0 | 14.07 | 420.0 | 1080.0 | 680 | 652 |
| TSJoint w/o web-reinf. | 0.79 | 15.0 | 14.07 | 420.0 | 1080.0 | 680 | 652 |
| TSJoint w/web-reinf. | 0.79 | 15.0 | 23.12 | 420.0 | 1080.0 | 680 | 652 |
| Test Specimen | Mexperiment (kNm) | As,corner (cm2) | As,corner,red (cm2) | Asl,red = 4 · Asl,corner,red (cm2) |
|---|---|---|---|---|
| TSRef | 96 | 3.52 | 2.91 | 11.62 |
| TSJoint w/o web-reinf. | 161 | 3.52 | 2.49 | 9.96 |
| TSJoint w/web-reinf. | 161 | 5.78 | 4.75 | 19.01 |
| Test Specimen | Tmax,experiment (kNm) | Mexperiment (kNm) | Vmax,experiment (kN) | Θ (°) | Tmax,calculated (kNm) | Tmax,experiment/Tmax,calculated | τweb (N/mm2) |
|---|---|---|---|---|---|---|---|
| TSRef | 551 | 96 | 61 | 54.6 | 548 | 1.01 | 2.80 |
| TSJoint w/o web-reinf. | 678 | 161 | 61 | 56.6 | 507 | 1.34 | 3.39 |
| TSJoint w/web-reinf. | 678 | 161 | 61 | 47.7 | 700 | 0.97 | 3.39 |
Disclaimer/Publisher’s Note: The statements, opinions and data contained in all publications are solely those of the individual author(s) and contributor(s) and not of MDPI and/or the editor(s). MDPI and/or the editor(s) disclaim responsibility for any injury to people or property resulting from any ideas, methods, instructions or products referred to in the content. |
© 2023 by the authors. Licensee MDPI, Basel, Switzerland. This article is an open access article distributed under the terms and conditions of the Creative Commons Attribution (CC BY) license (https://creativecommons.org/licenses/by/4.0/).
Share and Cite
Rath, M.; Untermarzoner, F.; Kollegger, J. On the Torsional Behavior of the Longitudinal Bridge Girders Used in the LT-Bridge Construction Method. Appl. Sci. 2023, 13, 6657. https://doi.org/10.3390/app13116657
Rath M, Untermarzoner F, Kollegger J. On the Torsional Behavior of the Longitudinal Bridge Girders Used in the LT-Bridge Construction Method. Applied Sciences. 2023; 13(11):6657. https://doi.org/10.3390/app13116657
Chicago/Turabian StyleRath, Michael, Franz Untermarzoner, and Johann Kollegger. 2023. "On the Torsional Behavior of the Longitudinal Bridge Girders Used in the LT-Bridge Construction Method" Applied Sciences 13, no. 11: 6657. https://doi.org/10.3390/app13116657