Article

Studying the Cable Loss Effect on the Seismic Behavior of Cable-Stayed Bridge

Department of Civil & Environmental Engineering, Dankook University, Yongin-si 16890, Republic of Korea
*
Author to whom correspondence should be addressed.
Appl. Sci. 2023, 13(9), 5636; https://doi.org/10.3390/app13095636
Submission received: 30 March 2023 / Revised: 27 April 2023 / Accepted: 30 April 2023 / Published: 3 May 2023
(This article belongs to the Special Issue Advances on Structural Engineering, Volume III)

Abstract

:
As the demand and construction of cable-stayed bridges have increased, research on the safety of cable-stayed bridges in the event of natural disasters such as fires and explosions is actively being conducted. If a cable-stayed bridge is damaged by an unexpected natural disaster or accident, it can cause serious traffic congestion and huge economic losses. This study evaluates the usability of the cable-stayed bridge in the event of cable damage. Additionally, seismic performance and the impact of the damage are evaluated by numerical analysis. To achieve this goal, the cable-stayed bridge is modeled using 3D BEAM elements and two-node cable elements. Then, the impact of the damage was evaluated by gradually damaging the cable. The deflection, axial force of the girder, and cable stress changes under far-field ground motion (El-Centro earthquake) were reviewed. A representative dynamic analysis program LS-DYNA was utilized for the numerical analyses. The results show that the loss of a small number of cables does not affect the usability of the bridge. However, if five or more cables are continuously lost, or if an earthquake occurs when cables are already lost, excessive deflections and changes in the girders’ axial forces can cause usability problems.

1. Introduction

The most suitable bridge type is determined by considering various conditions, such as the environmental requirements of the location where the bridge is proposed, economic analysis, and harmony with the surrounding landscape. In modern times, with the development of high-strength new materials and advanced nonlinear structural analysis techniques, various bridge types can be selected, leading to an increase in the demand for suspension bridges and cable-stayed bridges. As the demand and traffic volume for long-span bridges increases, various incidents that cause damage to bridges, such as cable fires, ship collisions, and bridge-surrounding explosions, as shown in Figure 1a–c, are also increasing. Therefore, safety and usability evaluations and effective simulation methods for long-span cable-stayed bridges are being actively researched [1,2,3,4].
In 2015, the cable loss of the Seohae Grand Bridge was caused by a fire, and the cable of the Jirau Bridge in Taiwan was cut due to an earthquake [5]. Both bridges did not collapse due to cable loss, but since the cable is one of the most important structural parts of the cable-stayed bridge, the design specifications regulate that the safety of bridges with cable loss must be reviewed. In general, research and technical trends on cable loss in cable-stayed bridges (suspension bridges and cable-stayed bridges) include research on the collapse risk of cable-stayed bridges due to cable collapse, fire and explosions, earthquakes, and collisions.
Yukari Aoki [6], who studied the dynamic response of a steel cable-stayed bridge under harsh conditions such as cable loss, explosion loads, and earthquakes using 2D bridge models, mentions that using DAF (dynamic amplification factor) of 2.0 is not suitable in many cases, and recommends performing dynamic analyses for each bridge rather than using the DAF value determined by PTI [7] uniformly. Additionally, it is suggested that additional research is needed for concrete bridges, as this study was conducted on relatively flexible steel bridges rather than concrete bridges.
Kao et al. [8] studied the change in stress, displacement, and structural behavior when a single cable is lost by analyzing the static response according to the position of the lost cable, considering the nonlinear characteristics of the cable-stayed bridge. On the other hand, Kim et al. [9] sequentially performed the initial shape analysis, cable loss analysis, and nonlinear analysis under live load to analyze the effect on the structural behavior of the cable-stayed bridge under extreme load conditions.
Kim et al. [10] proposed a relative reliability index for sequential cable cutting of a two-sided cable using the limit state response for the Incheon Bridge and presented a structural reliability evaluation method using earthquake vulnerability for cable cutting scenarios. Additionally, KBRC [11,12] reviewed the deflection of girders, displacement of the tower, and cable stress under fire and explosion loads through numerical analysis for various fire and explosion scenarios and conducted a reliability-based performance evaluation of the cable-supported bridges currently in use.
Omran and Karani stated that cable losses cause very high levels of acceleration in bridges, and certain cables can even cause progressive collapse when damaged [13]. Additionally, Wolff and Starossek recommended dynamic time history analysis for critical cable losses, as cable loss can cause significant dynamic amplification effects [14].
Therefore, the purpose of this study is to evaluate the usability of cable-stayed bridges by investigating their structural behavior when cables are lost. To achieve this, the structural impact caused by the continuous loss of multiple cables, as well as the impact of seismic loads in extreme situations while cables are already lost, are evaluated. The deflection of the bridge, cable tension, and axial forces of the girders were analyzed.
The first step is to understand the changes in the initial equilibrium state according to the position and quantity of the lost cable, and the second step is to investigate how the bridge structure behaves when an earthquake load applies after the cable is lost. This study analyzed the structural behavior of a cable-stayed bridge by comparing it to the current cable bridge design guidelines, considering the dynamic amplification effect of sequential loss of multiple cables by giving time intervals between cable losses.

2. Three-Dimensional FE Model of the Cable-Stayed Bridge

2.1. Objective Bridge

In order to conduct this study, the cable-stayed bridge part of the Seohae Grand Bridge, which was completed in 2000 in Korea, was selected as the target bridge. The bridge is a 3-span cable-stayed bridge with a total length of 990.0 m (60.0 + 200.0 + 470.0 + 200.0 + 60.0) and a main span of 470.0 m. The superstructure consists of a steel –concrete composite section with a width of 34 m, and the bridge has two H-shaped pylons measuring 182 m in height. The cable arrangement was a semi-harp type, with 32 cables on one side of the tower and 72 cables on the left and right sides, leading to a total of 144 cables as shown in the Figure 2.

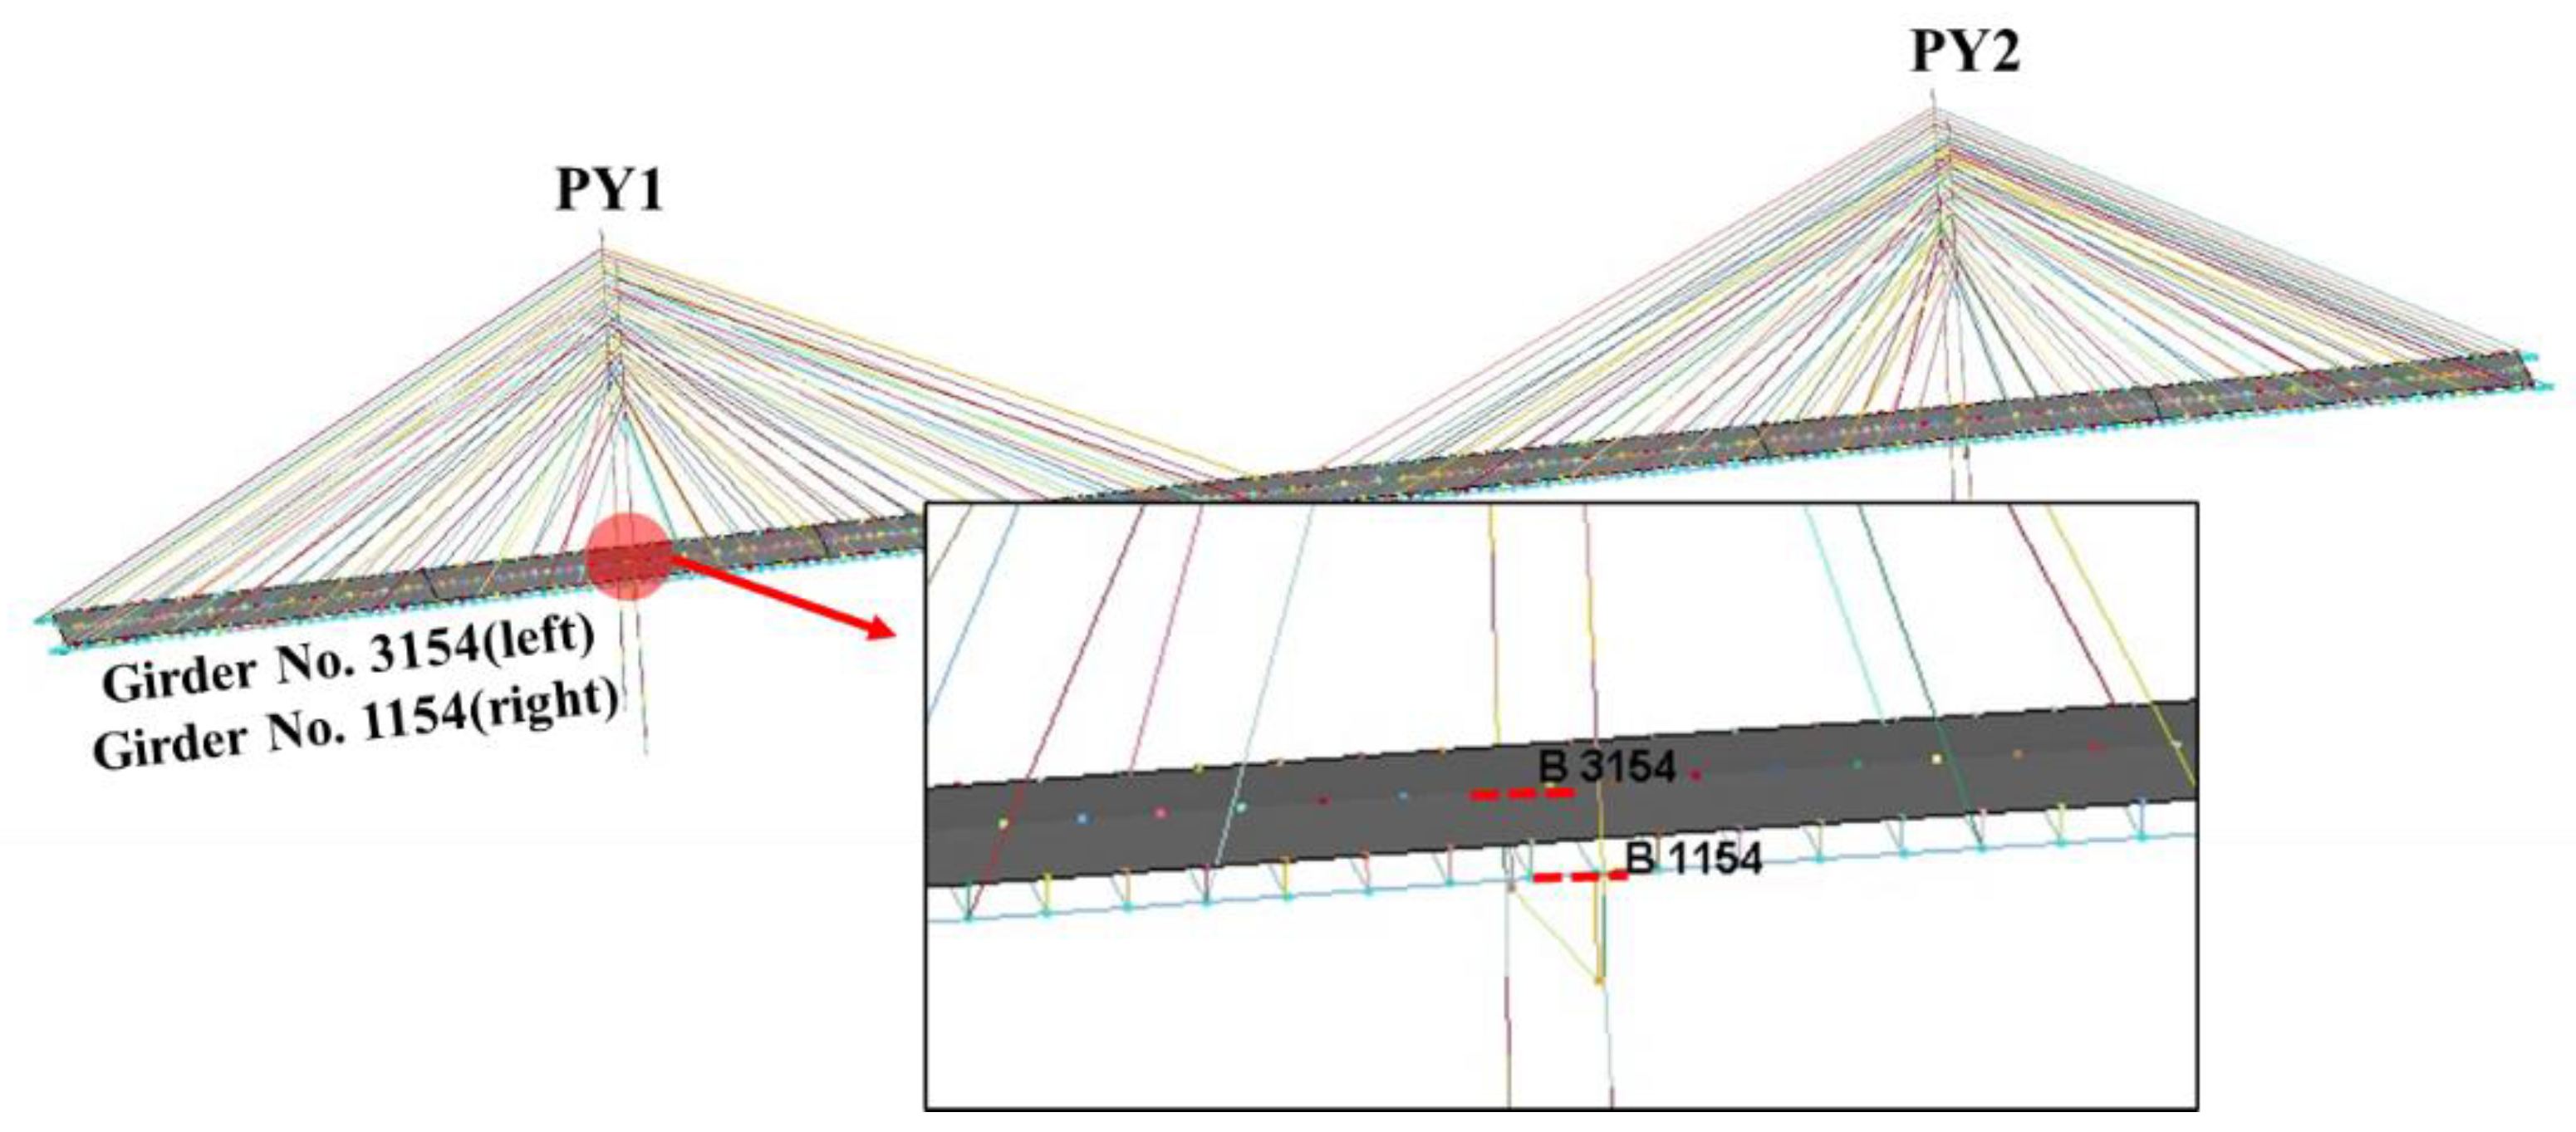
2.2. FE Model of Objective Bridge

The Seohae Bridge is composed of two H-shaped pylons (PY1 and PY2), two steel main girders, stringers, floor beams, and a slab, which are connected by cables arranged on two sides. The pylons (PY1, PY2), main girders, stringers, and floor beams were modeled using 2-node beam elements, the cables were modeled using 2-node cable elements, and the slab was modeled using 4-node shell elements. The FE model was created using the general-purpose finite element program LS-DYNA [15]. The overall shape of the model is shown in Figure 3.
The boundary conditions of the FE model were set as follows: The connection between the cross beam of a pylon and the main girder and the connection between the main girder and the concrete slab were modeled with a rigid link using the *CONSTRAINED_NODAL_RIGID_BODY command, and the bases of the two pylons were constrained in all six degrees of freedom. In addition, at both ends of the main girders, the translational displacement was constrained, but the rotation was not constrained (Figure 4).

2.3. Material Properties and Cable Pre-Tension of FE Model

The pylons (PY1, PY2), main girder, stringer, floor beam, and concrete slab were modeled using the elastic material model *MAT_ELASTIC offered in LS-DYNA, and the cables were modeled using the *MAT_CABLE_DISCRETE_BEAM material model which allows for direct input of cable pre-tension. The properties applied to the material model are shown in Table 1, and the pre-tension forces introduced into the cables are shown in Table 2.
The cables applied to the target bridge are composed of multi-strand cables with a bundle of 15.7 mm strands. Each 15.7 mm strand has a cross-sectional area of 150 mm2, with an ultimate stress of 1760 MPa and a yield stress of 1570 MPa. Material property and cable strand data were applied to the FE model by referencing the design report [16].

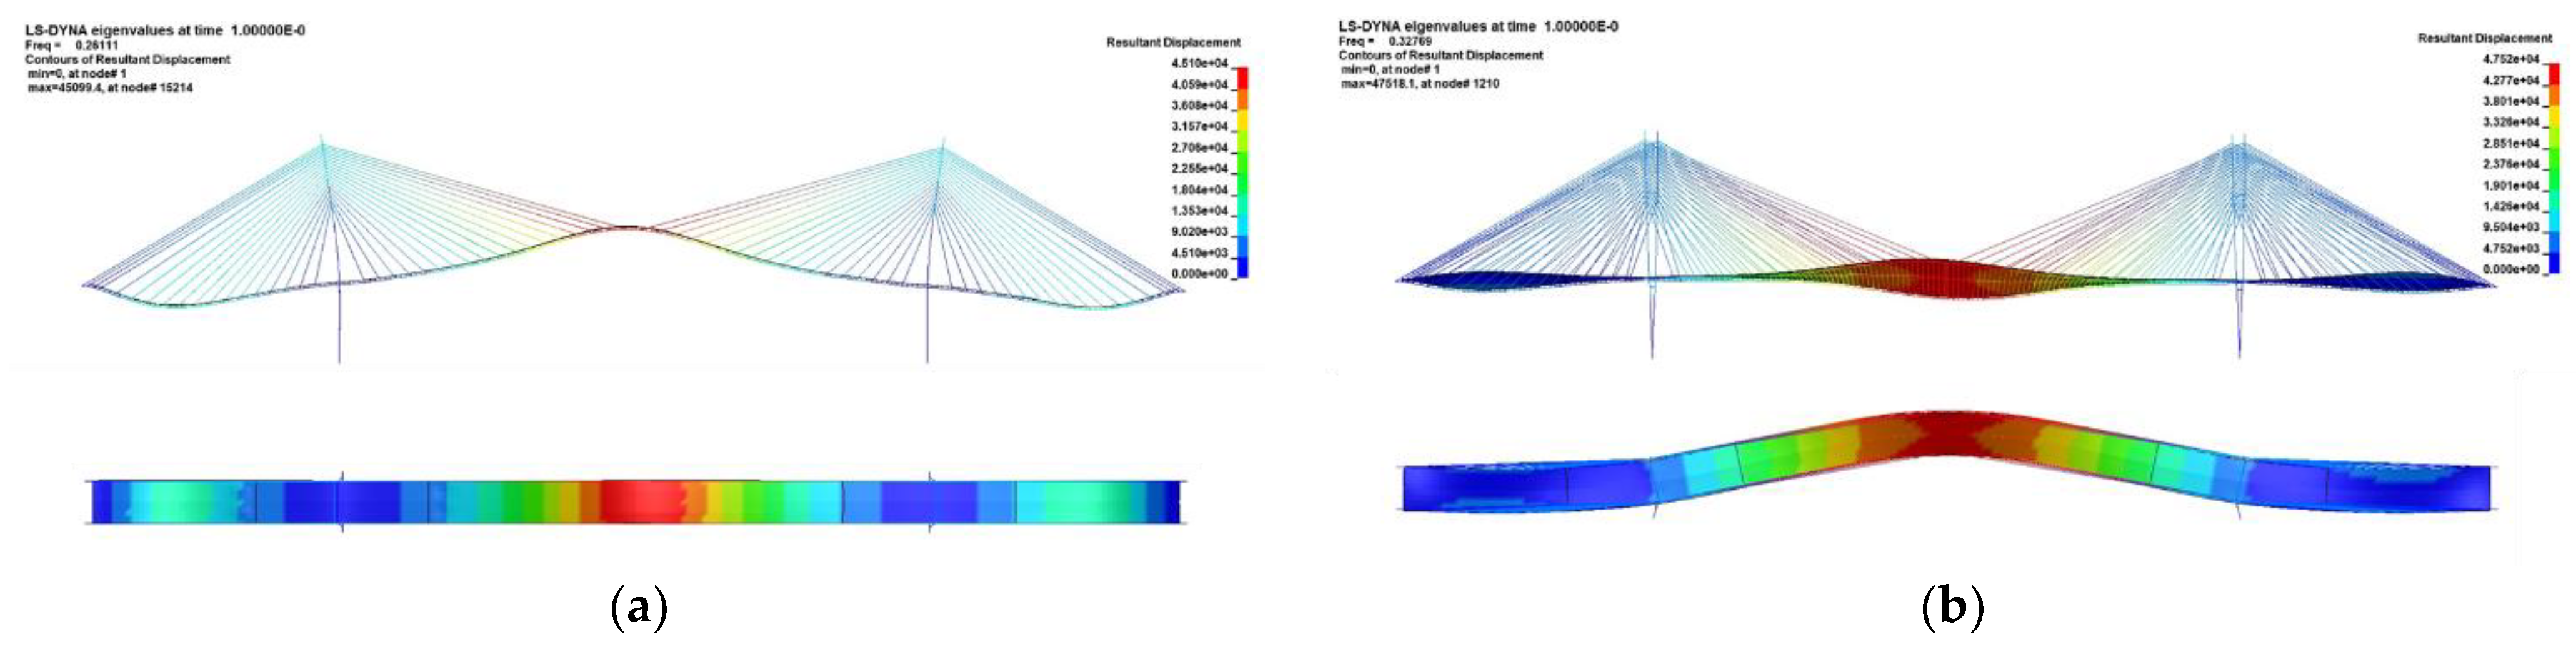
2.4. Verification of Dynamic Characteristics of Numerical Model

In order to evaluate the dynamic characteristics of the FE model developed, an eigenvalue analysis was conducted, and the results were compared with the measured natural frequencies of the same bridge obtained from previous research [17]. The results of the eigenvalue analysis for the major modes are shown in Figure 5, and the comparison results are listed in Table 3. The differences in the vertical modes are within 2%, while those in the horizontal modes are 13.67%, which is relatively large. Although there were relatively large differences in the horizontal mode and torsional mode, it was deemed sufficient for investigating the impact of cable loss on the structural system, and no further model calibrations were made.

3. The Effect of Incremental Cable Loss on the Seismic Behavior

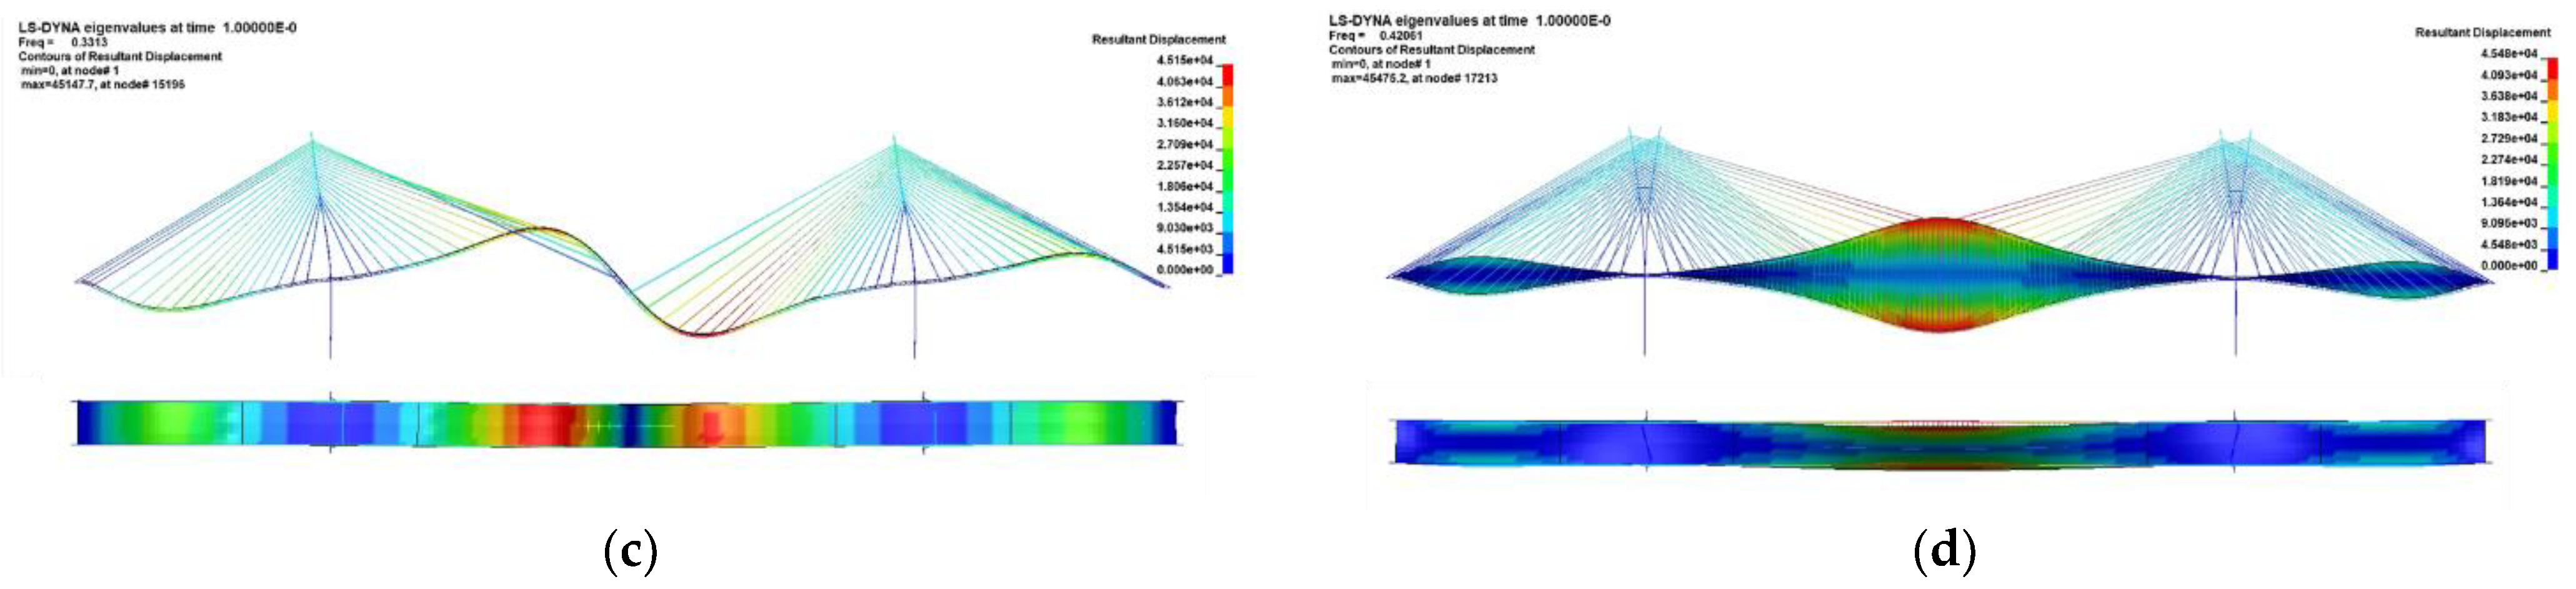
3.1. Cable Loss Scenario

The structure behaves differently depending on the location of the lost cable. Additionally, the loss of the cable that is furthest from the pylon to the center-span direction, the longest cable, has the greatest impact on the behavior of the bridge structure. Therefore, the cable loss scenario was classified into three categories as follows.
CASE1 is a scenario where the cable is gradually lost from the longest cable of the center span to the Pylon 1 direction; CASE2 is a scenario where cable loss is spread from the longest cable of the center span to both the Pylon 1 and 2 directions; and CASE3 is a scenario where the cable is gradually lost from the longest cable of the side-span to the Pylon 2 direction. For comparison, CASE0 is set as a state where the cable is not lost. Additionally, in the event of cable loss on the target bridge, it is more likely that only one side of the cable will be lost rather than both sides being damaged simultaneously. Therefore, the damage scenario was set up so that only the left-side cable was lost.
The cables were set to be lost in sequence, up to a maximum of six, using the *CONTROL_STAGED_CONSTRUCTION function. The time interval between cable failures was set to 2 s so that the next cable is lost 2 s after the previous one, considering the dynamic effects due to successive cable losses. The damage scenario is shown in Figure 6 and Table 4.
So that the cable breakage occurs after the bridge reaches its initial equilibrium state, the first cable was intentionally severed 20 s after the dead load and cable pre-tension forces were applied. In order to evaluate the structural performance after cable loss, the resulting deflection and cable tension were compared. The limit value for deflection was determined based on the Korean cable-stayed bridge design standards [18,19], and the cable tension was based on the yield strength.
In the Korean highway bridge design code (LSD)—Cable Bridge Edition, deflection due to continuous loading is limited to 1/250 of the span length (L). Therefore, in the case of the Seohae Grand Bridge with a central span length of 470 m and side span length of 200 m, the deflection of the central and side spans is limited to 1.88 m (=470 m/250) and 0.80 m (=200 m/250), respectively.

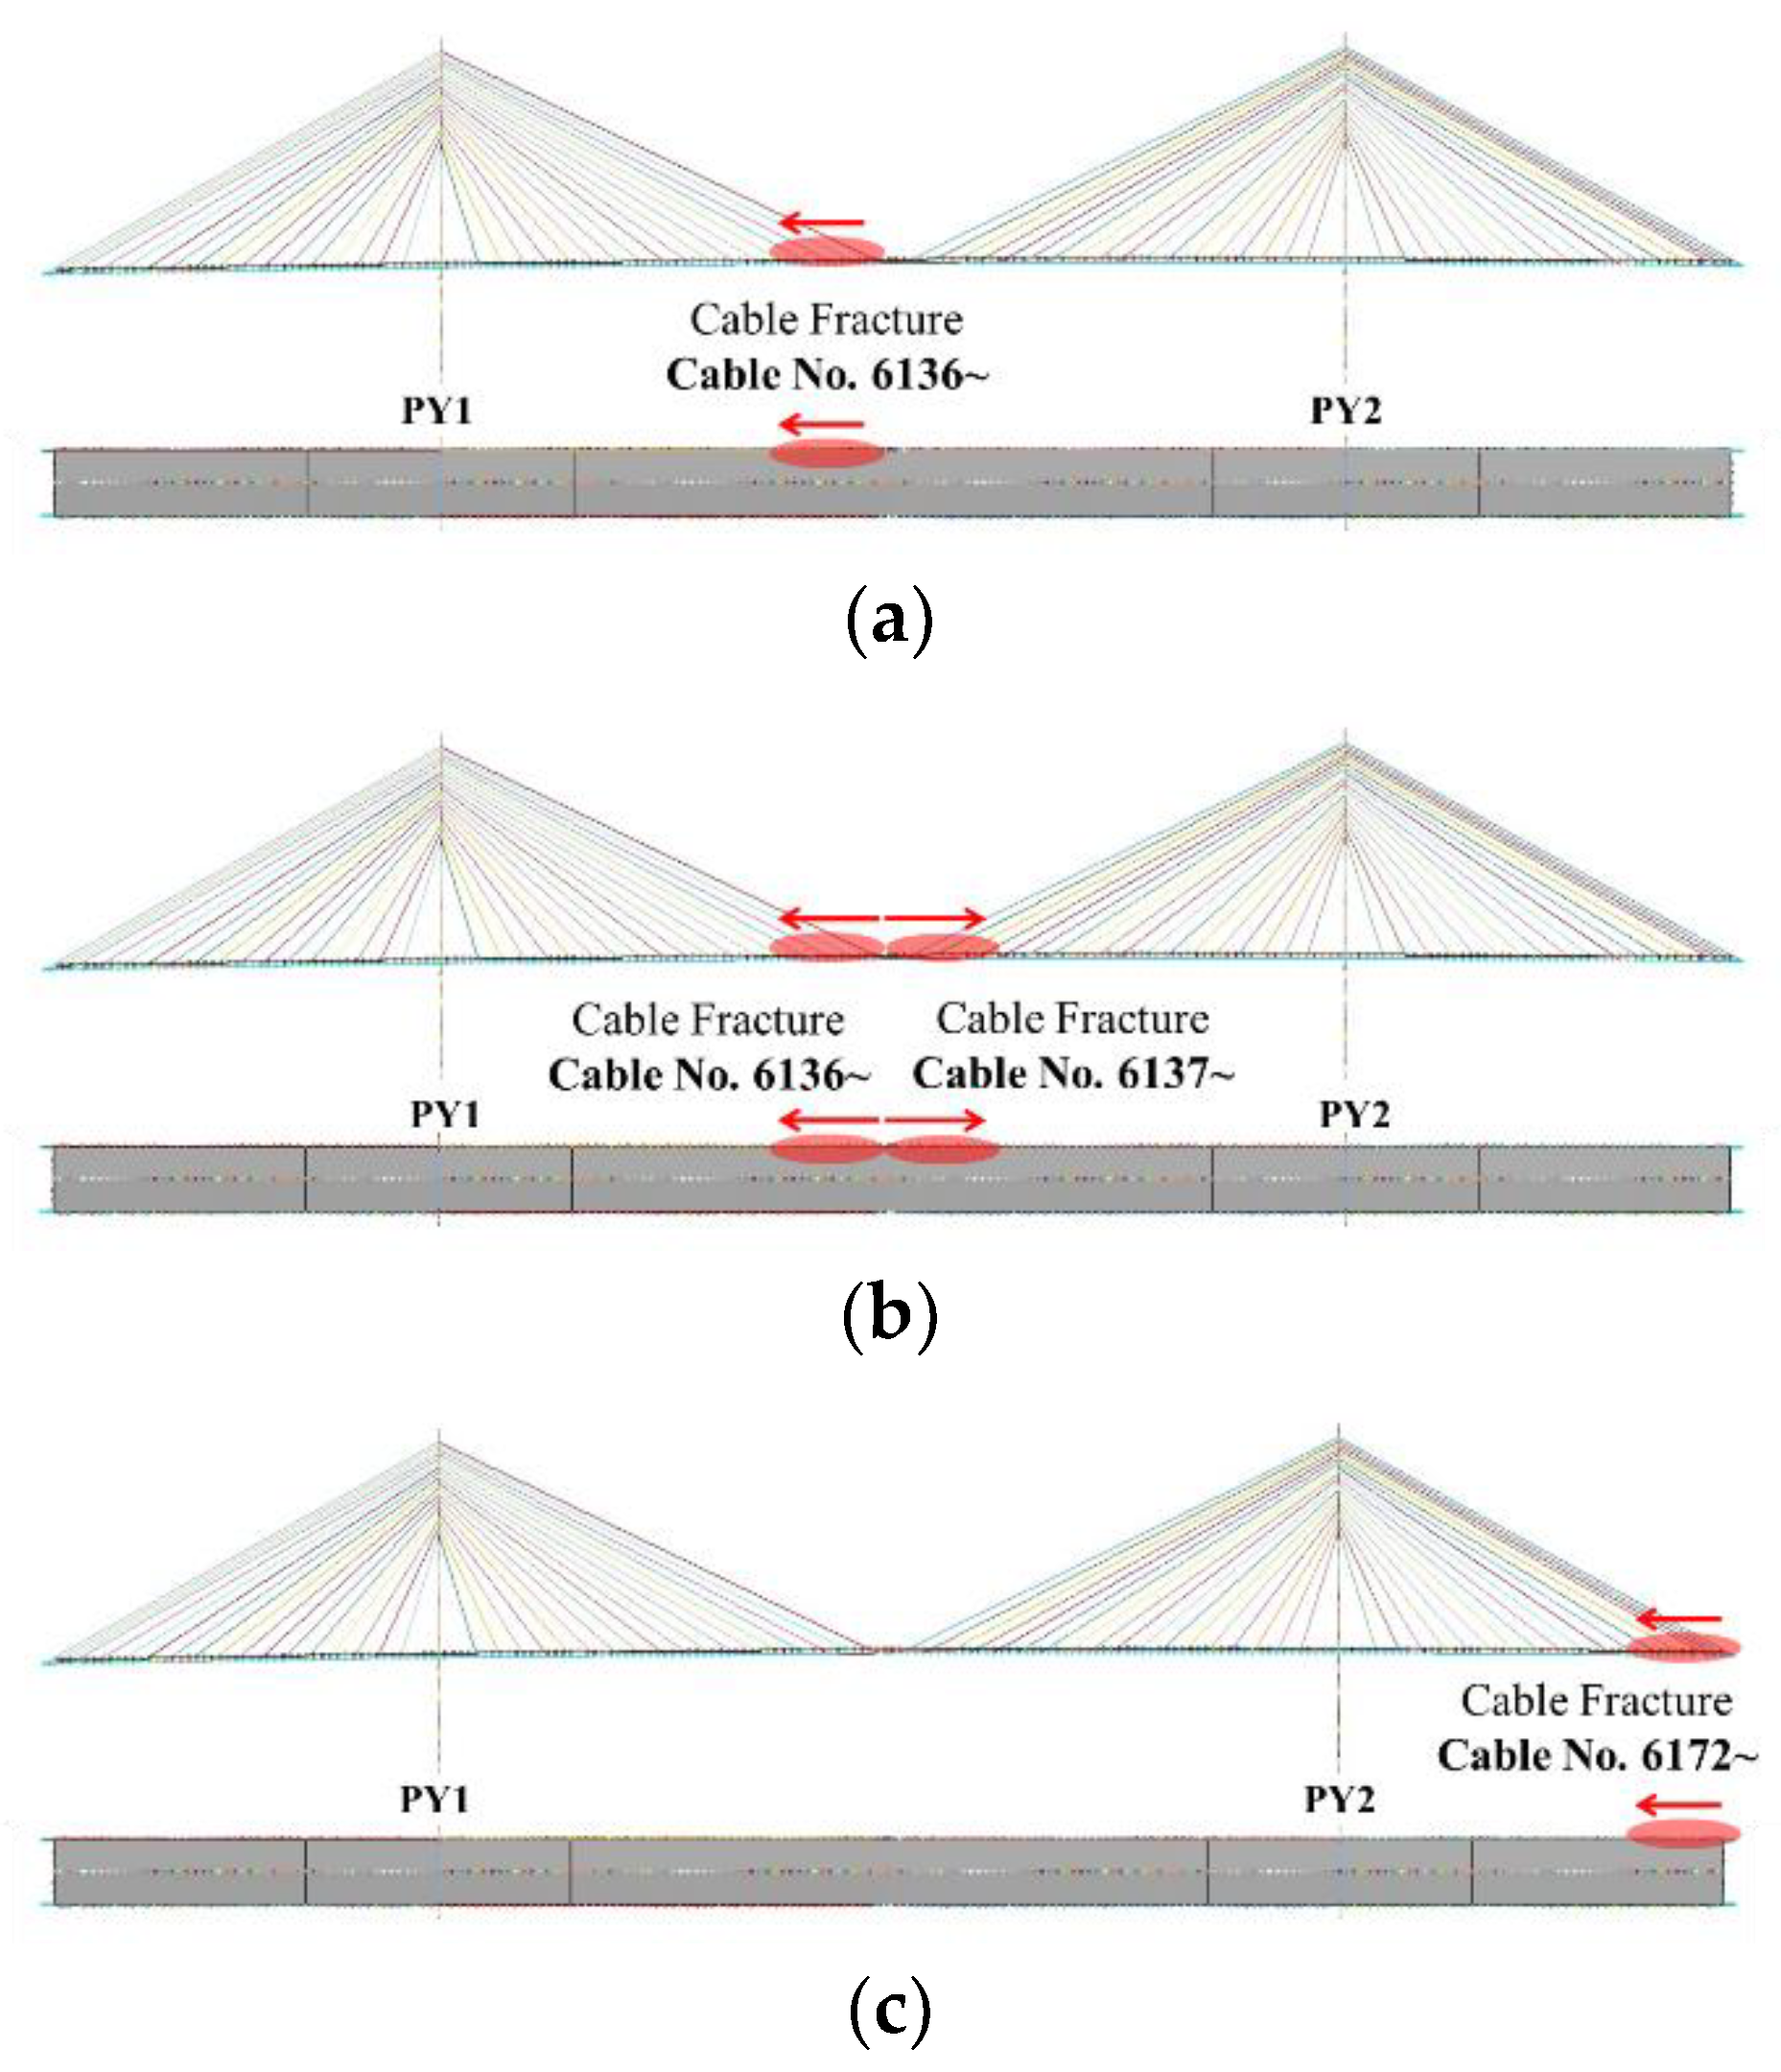
3.2. Earthquake Loading

In order to evaluate the effect of seismic load on the target bridge, the El-Centro earthquake, widely used in many studies, was used to conduct seismic analysis [20,21]. The ground acceleration of the El-Centro earthquake was integrated to convert it into ground displacement, and then applied as loading to the supports of the numerical analysis model in both the longitudinal and transverse directions (as shown in Figure 7). For massive structures such as bridges, accurate analysis requires SSI (Soil–Structure Interaction) analysis that takes into account the characteristics of the soil or rock under the structure during seismic analysis [22,23]. However, the effect of the foundation was not considered in this study since the effect of the foundation is not significant in evaluating the impact of cable loss under seismic conditions.
The seismic load was applied after the cable’s loss behavior stabilized (after 40 s of the last cable breakage), and the cable loss scenario was set as presented in Table 4. The effect of the earthquake on the bridge was evaluated using changes in the compressive force of the girders generated by the earthquake and changes in cable tension.

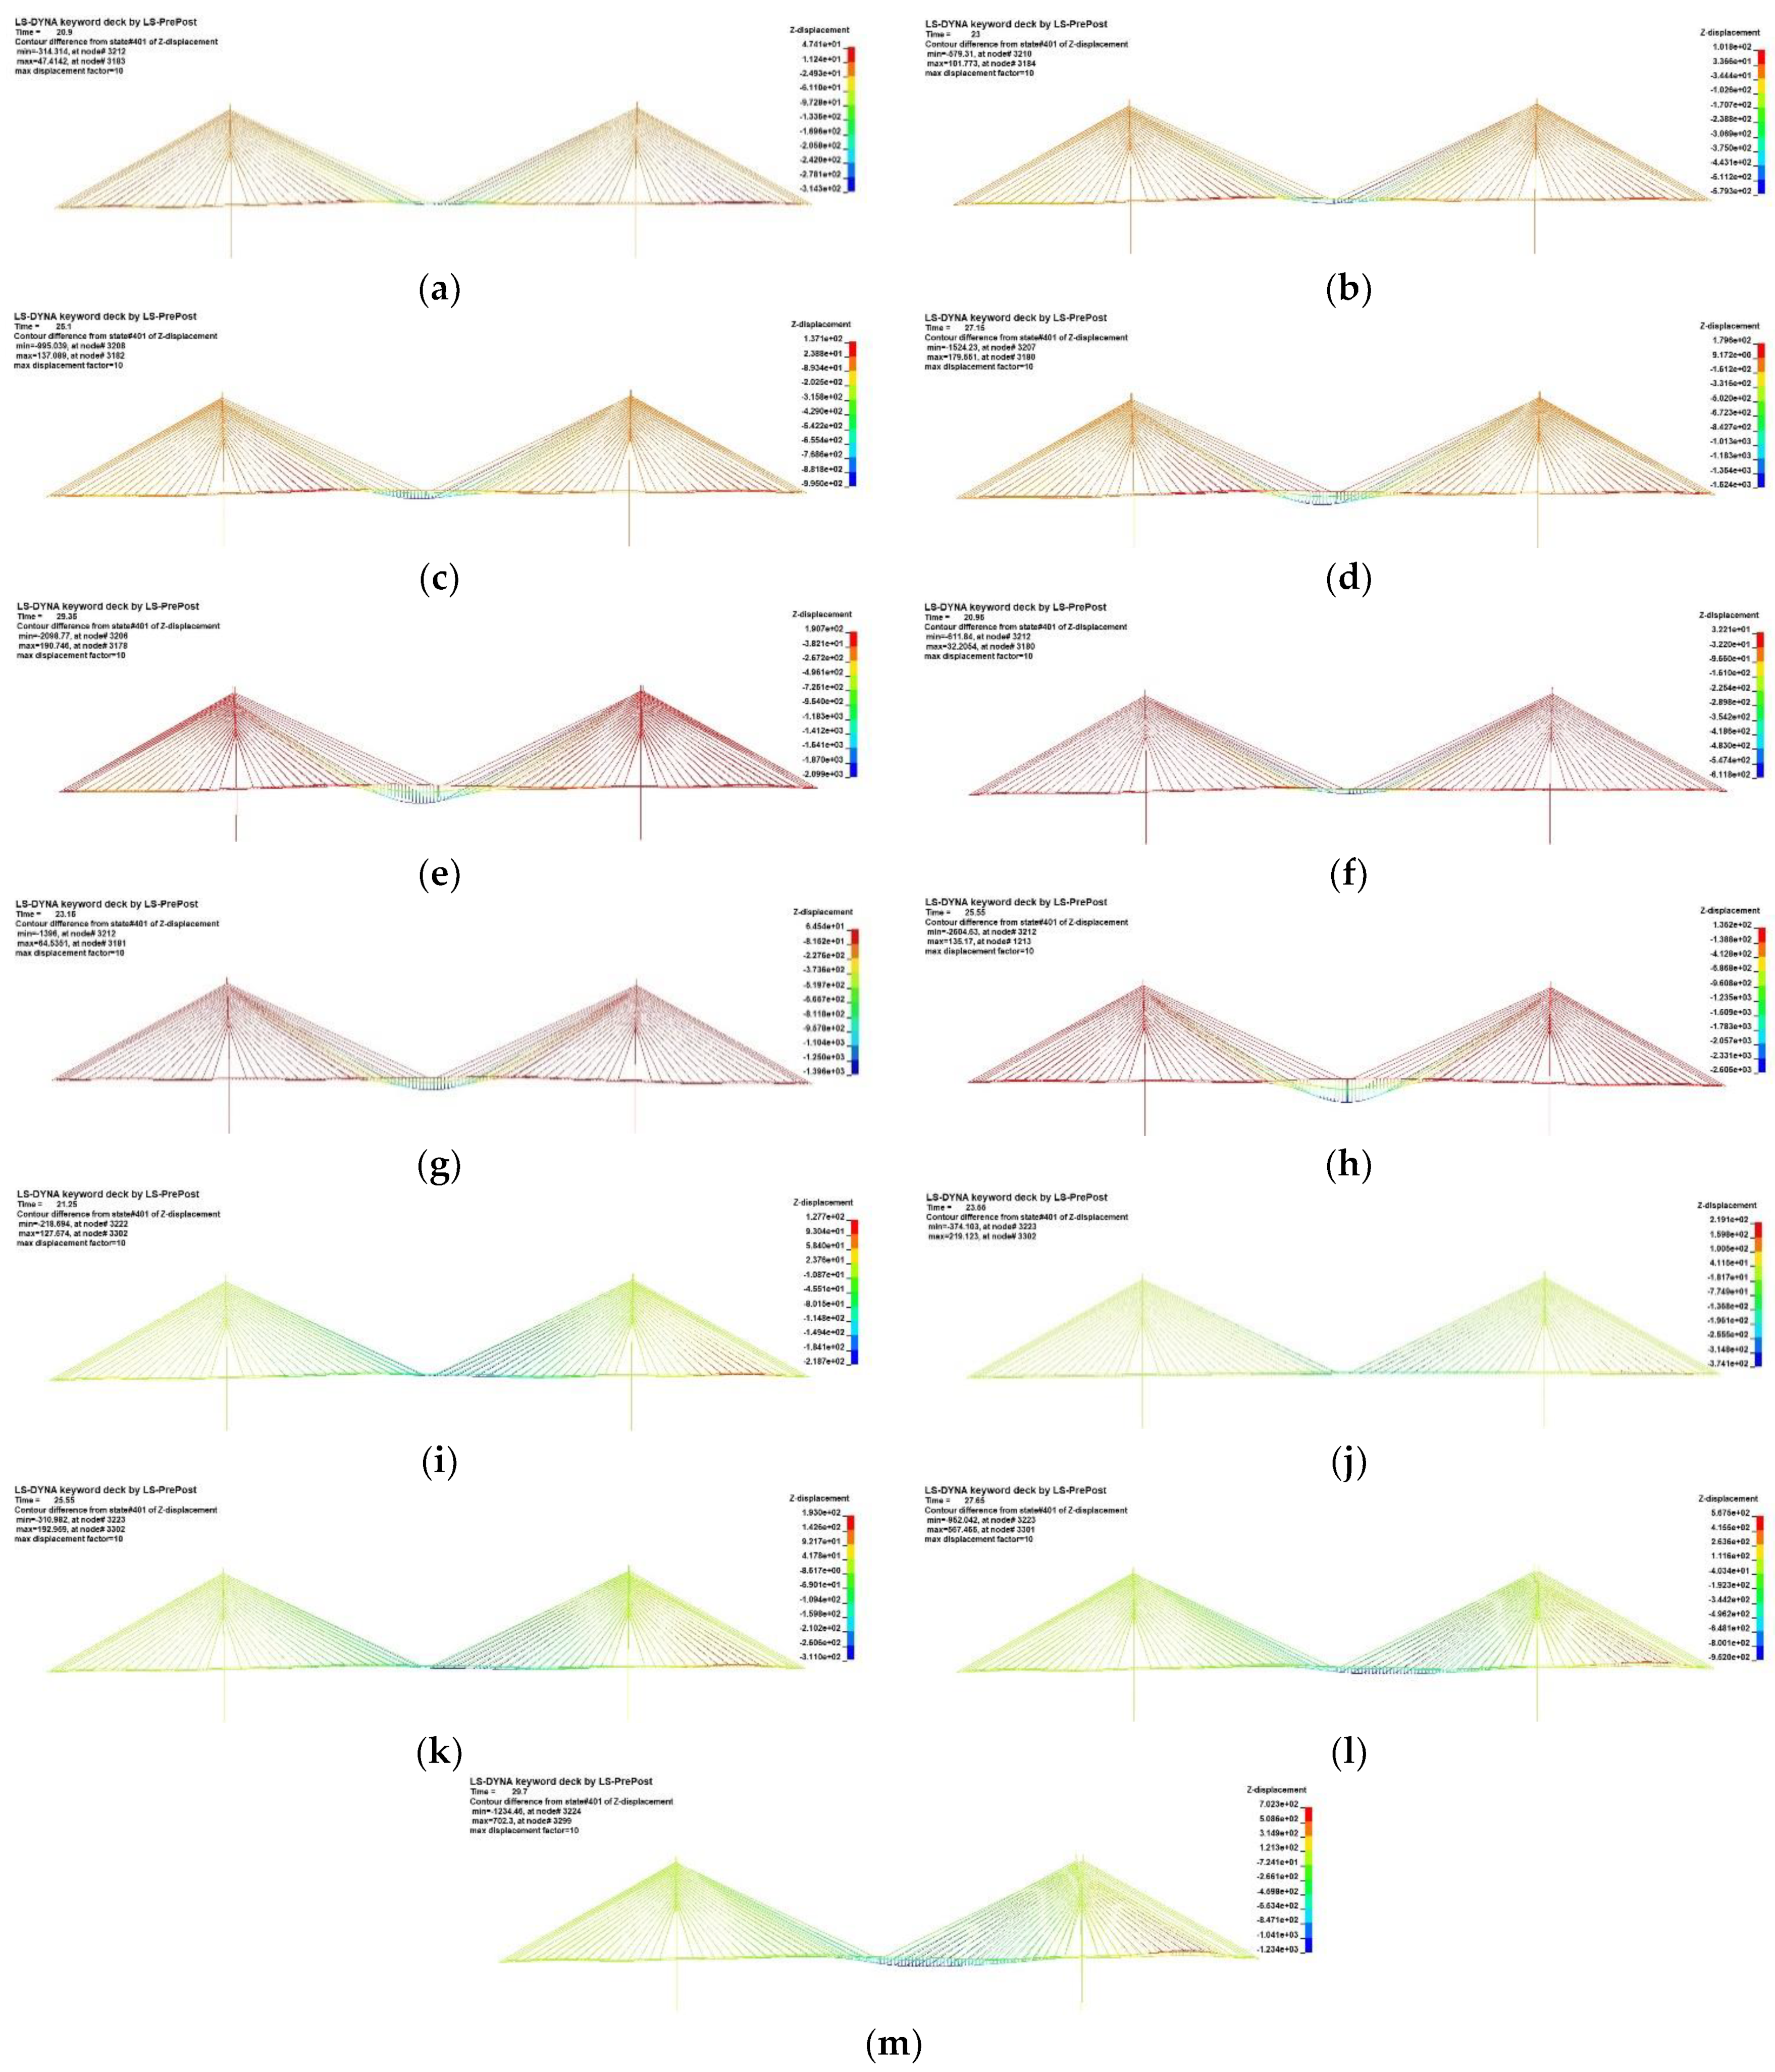
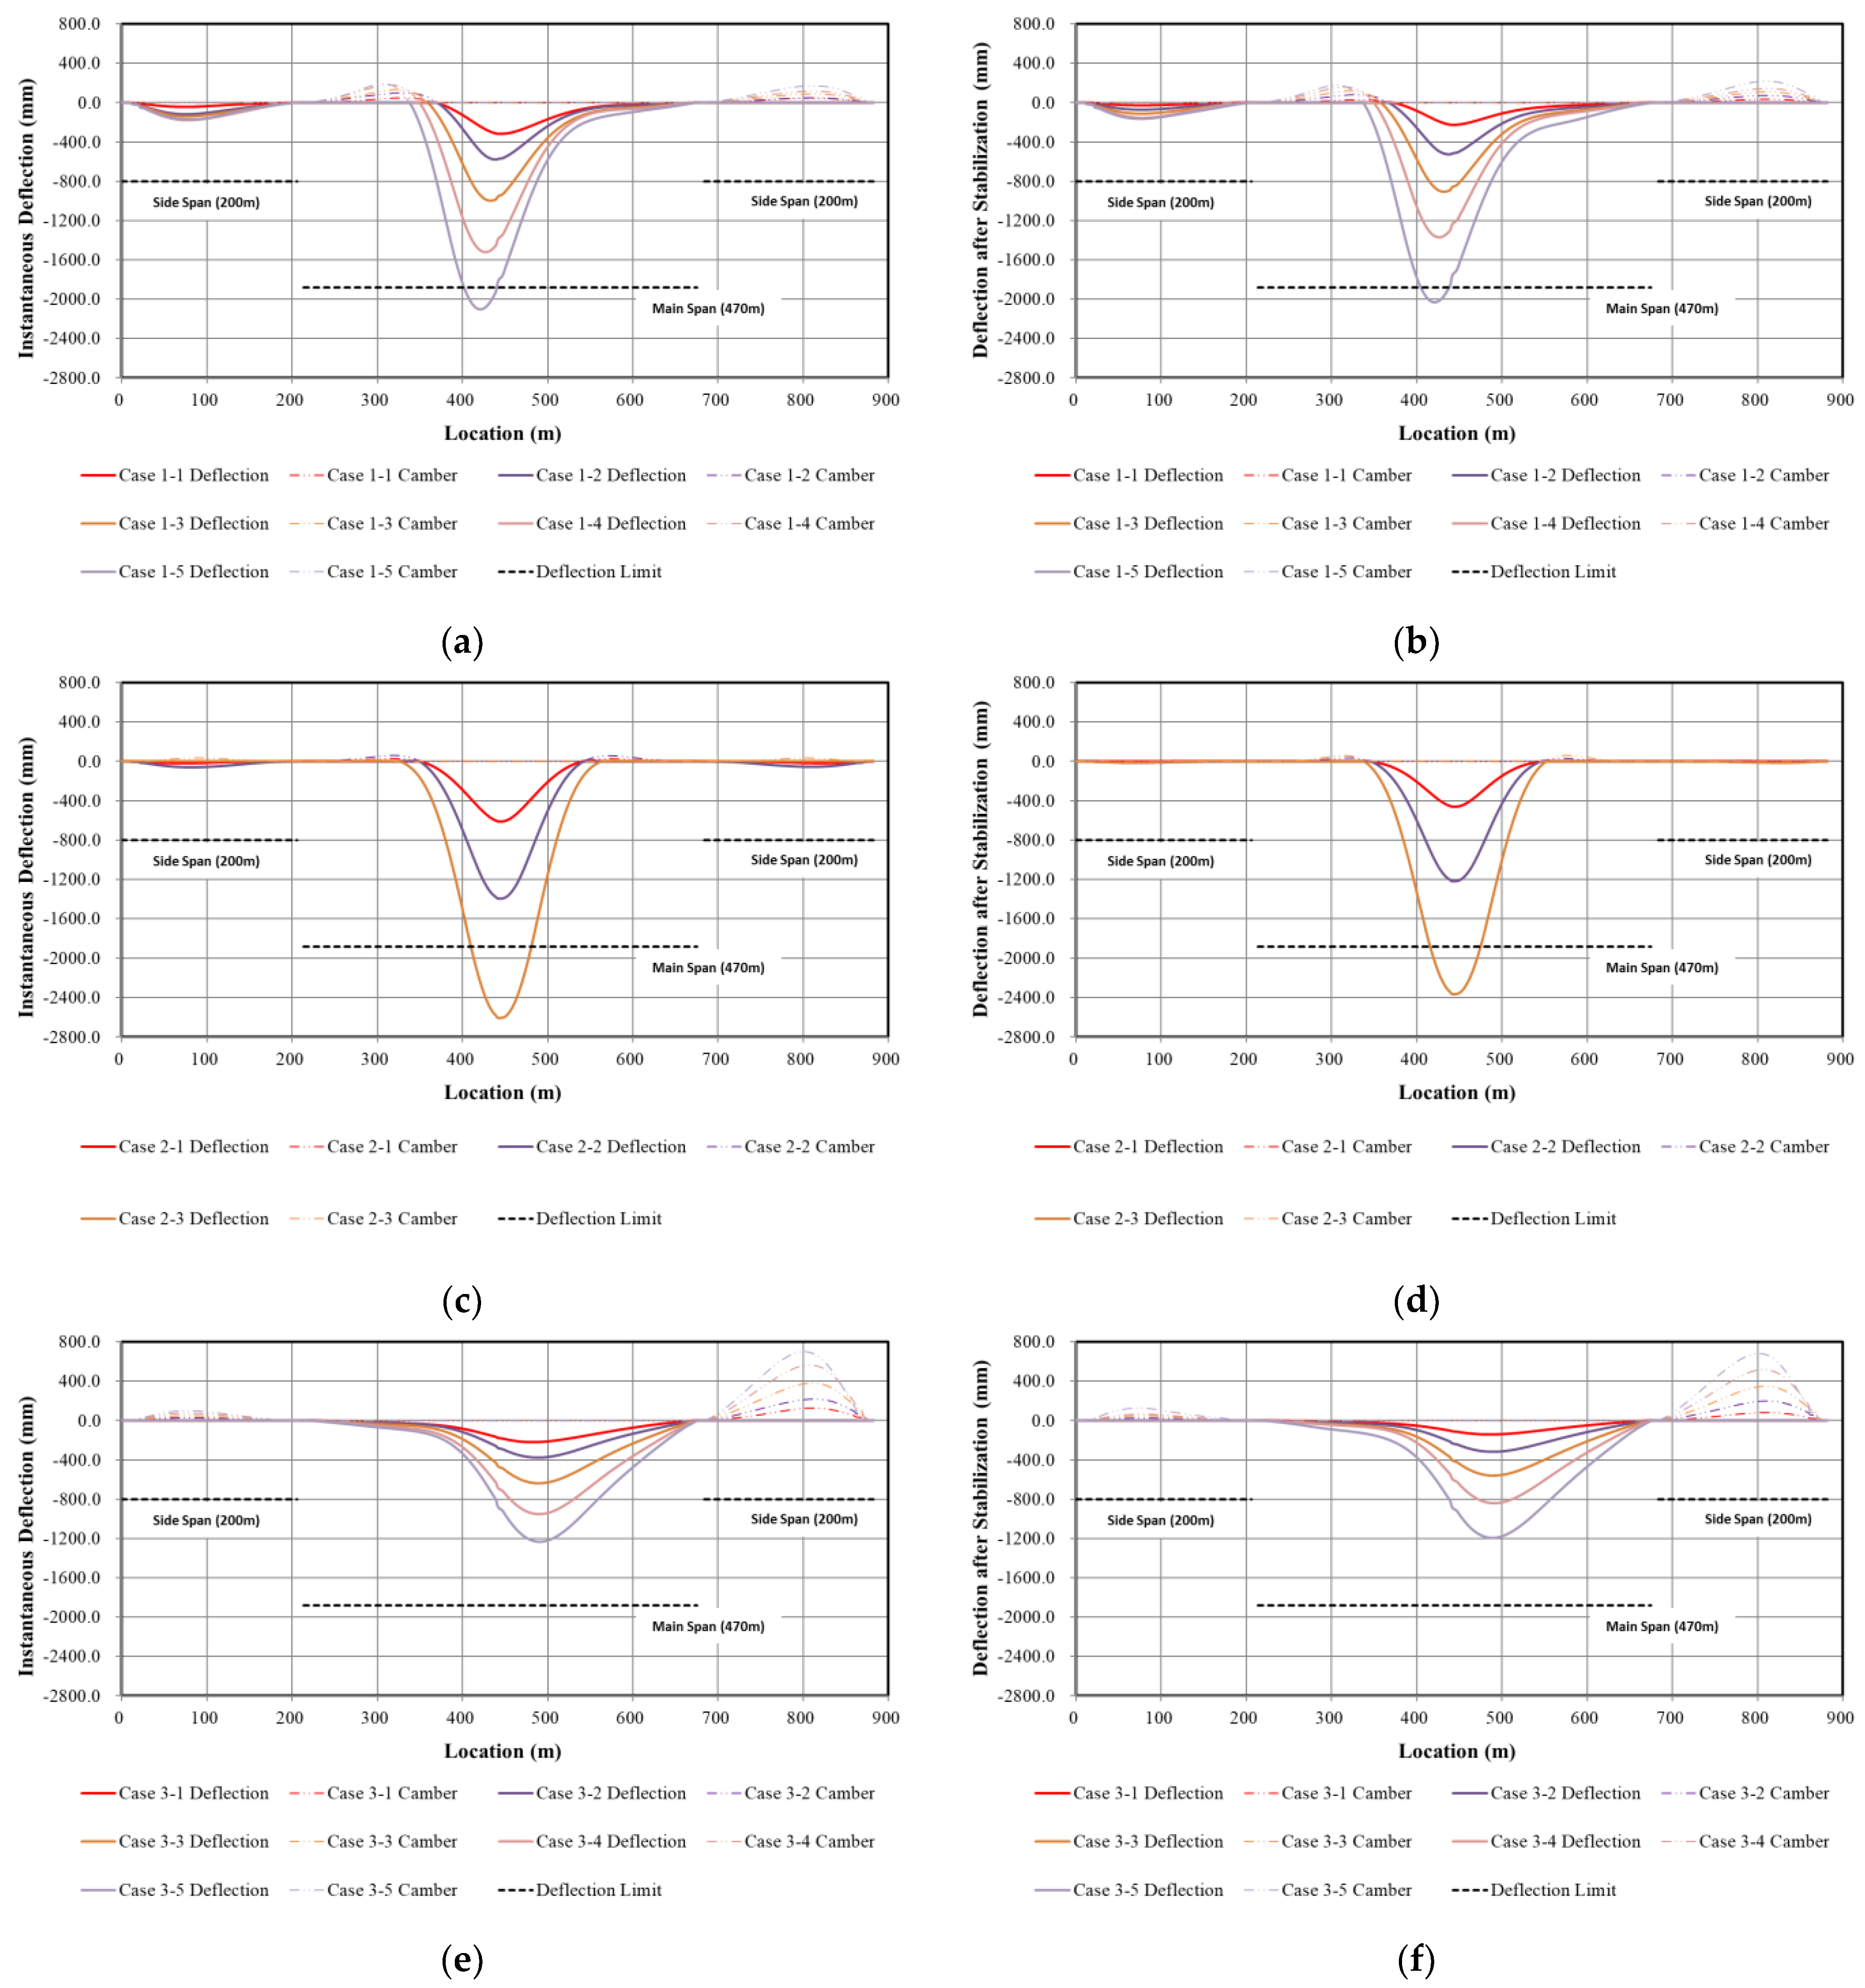
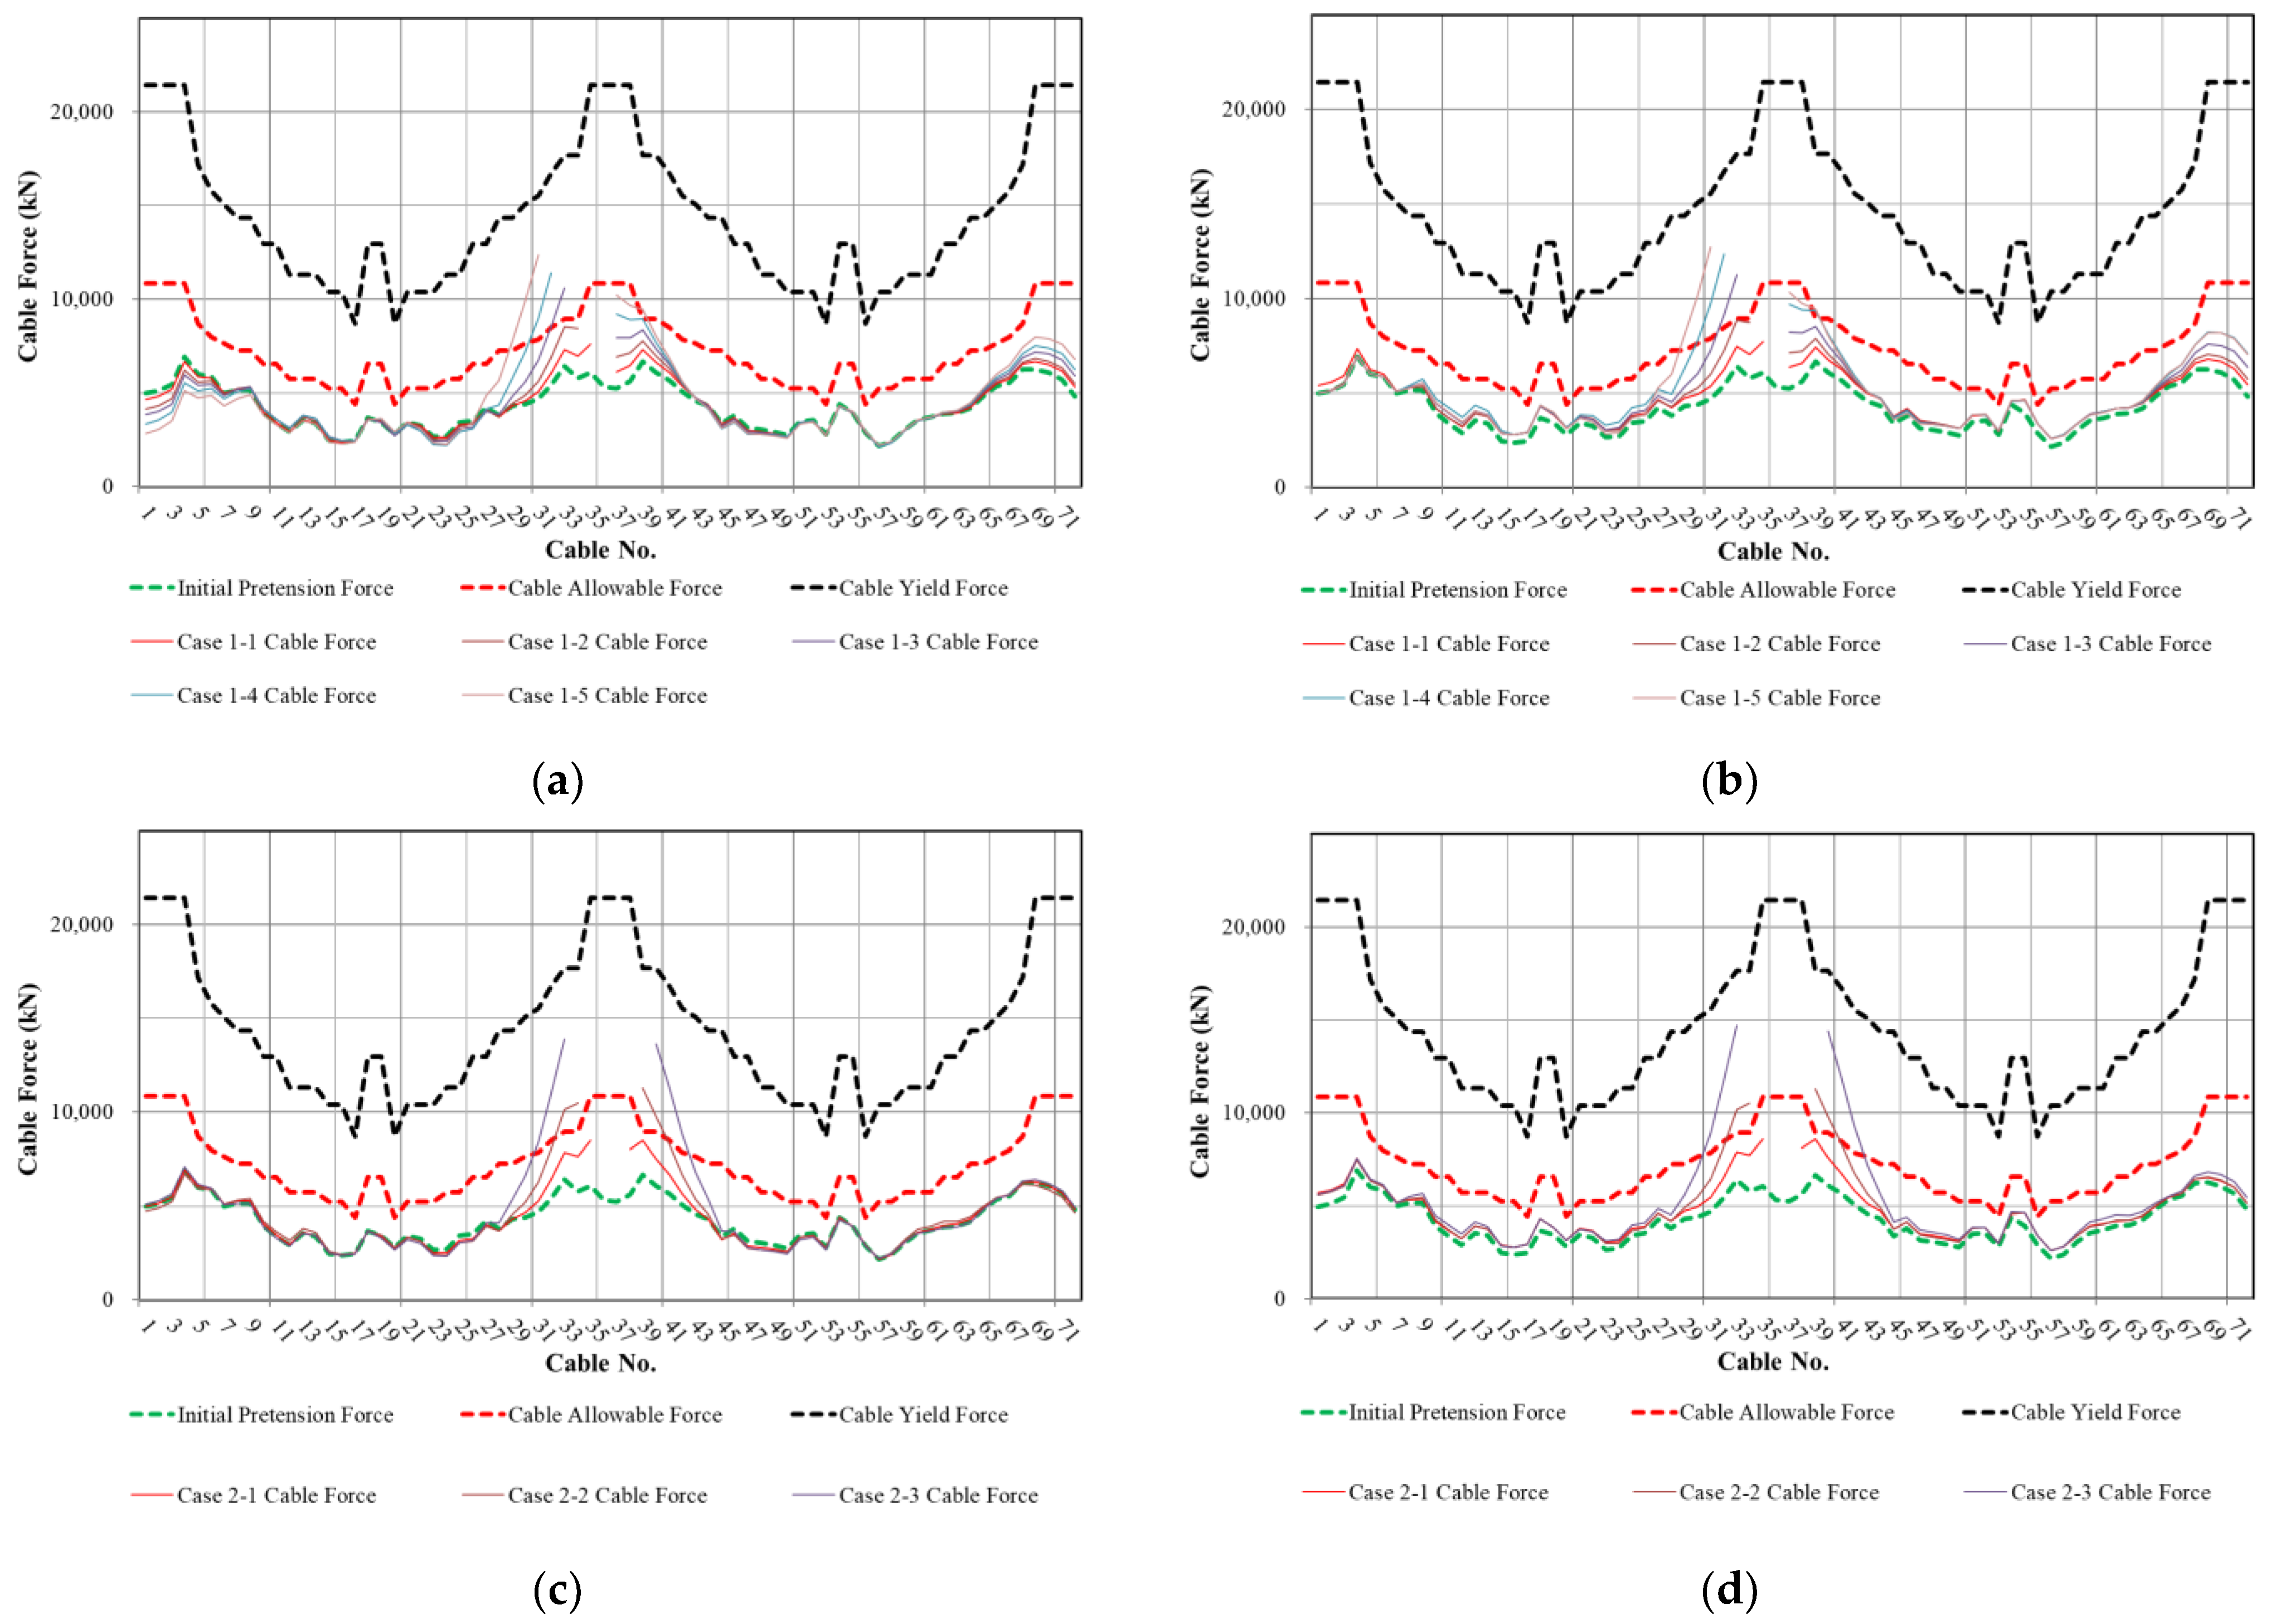
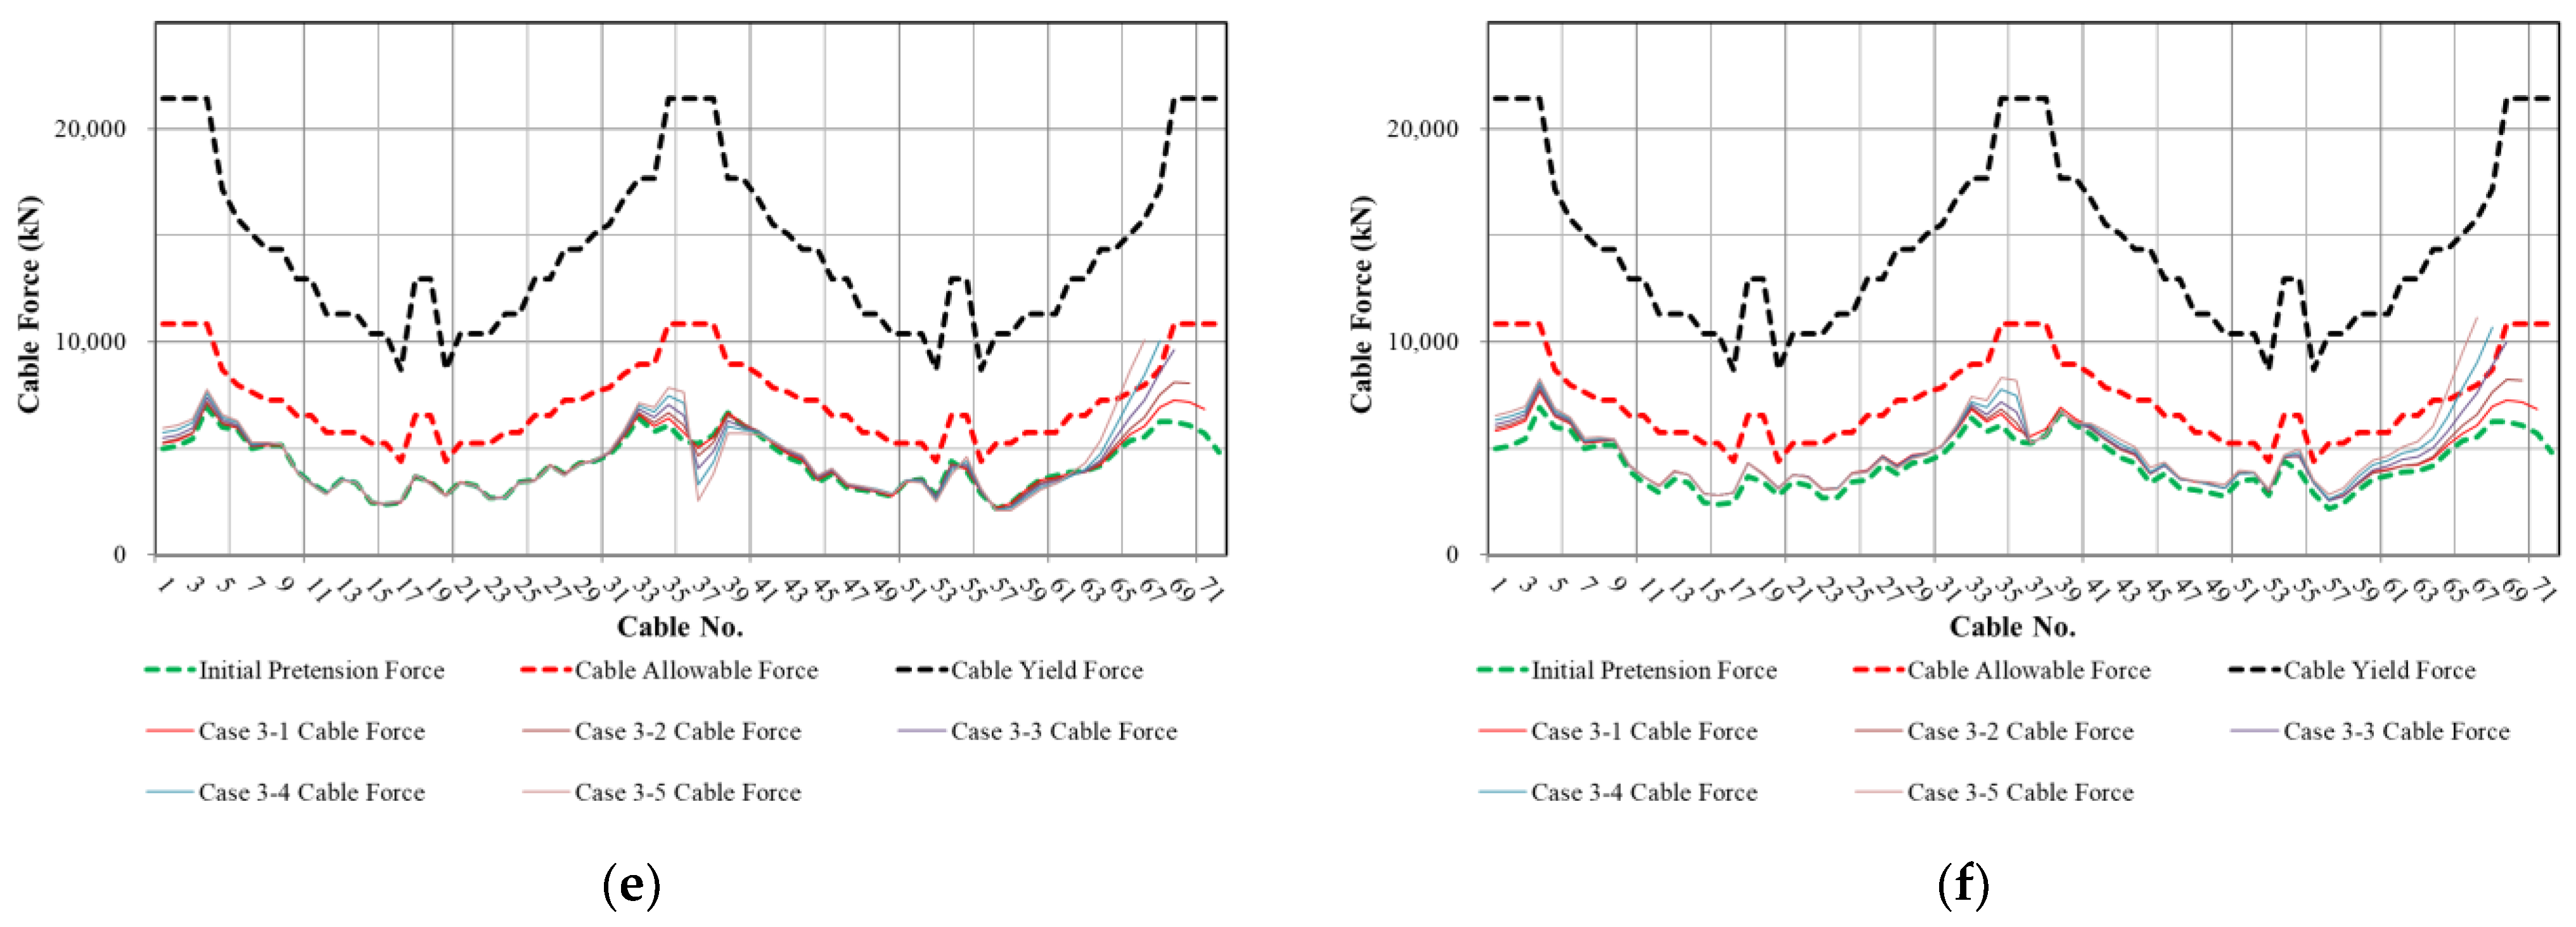
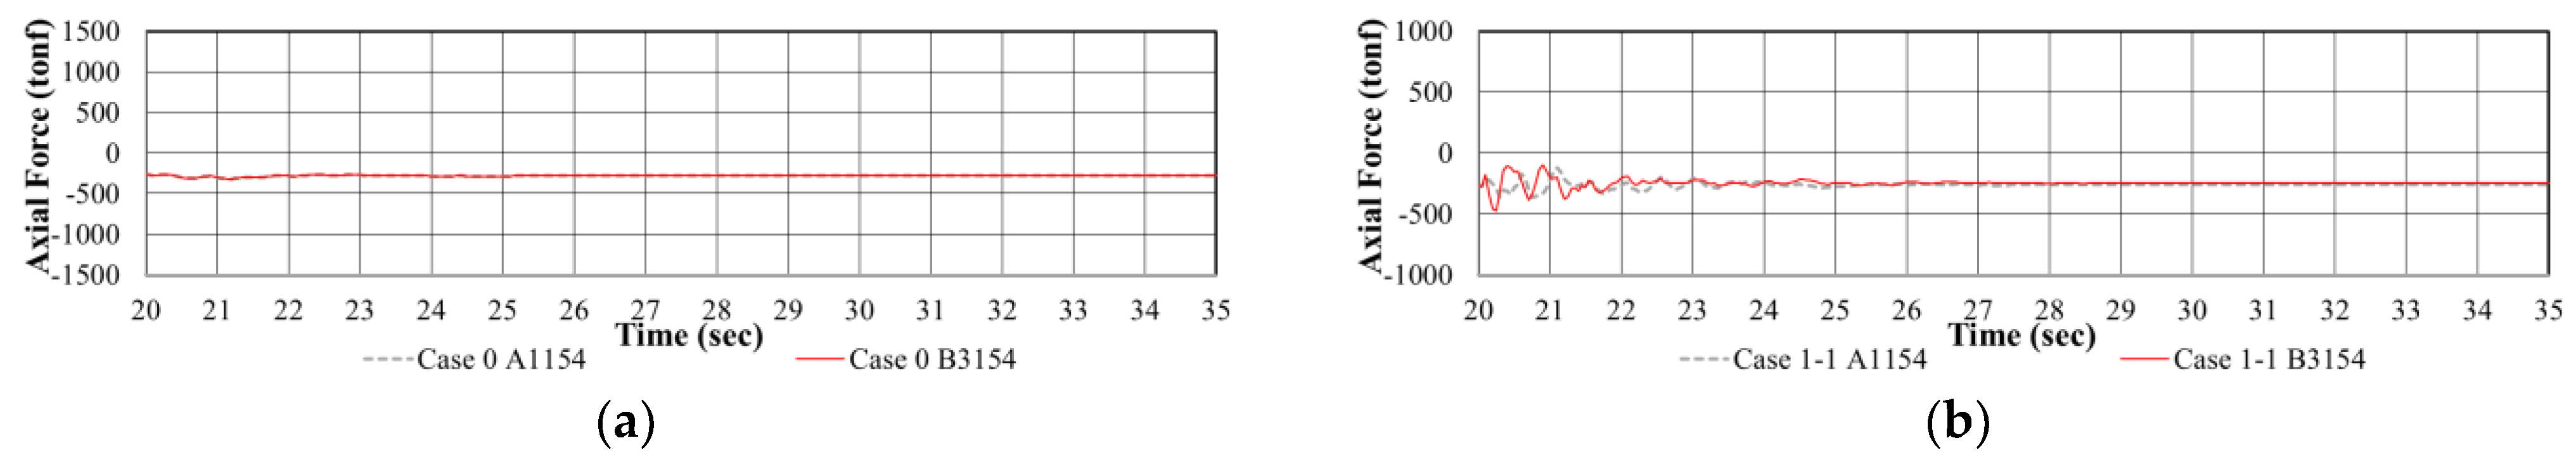
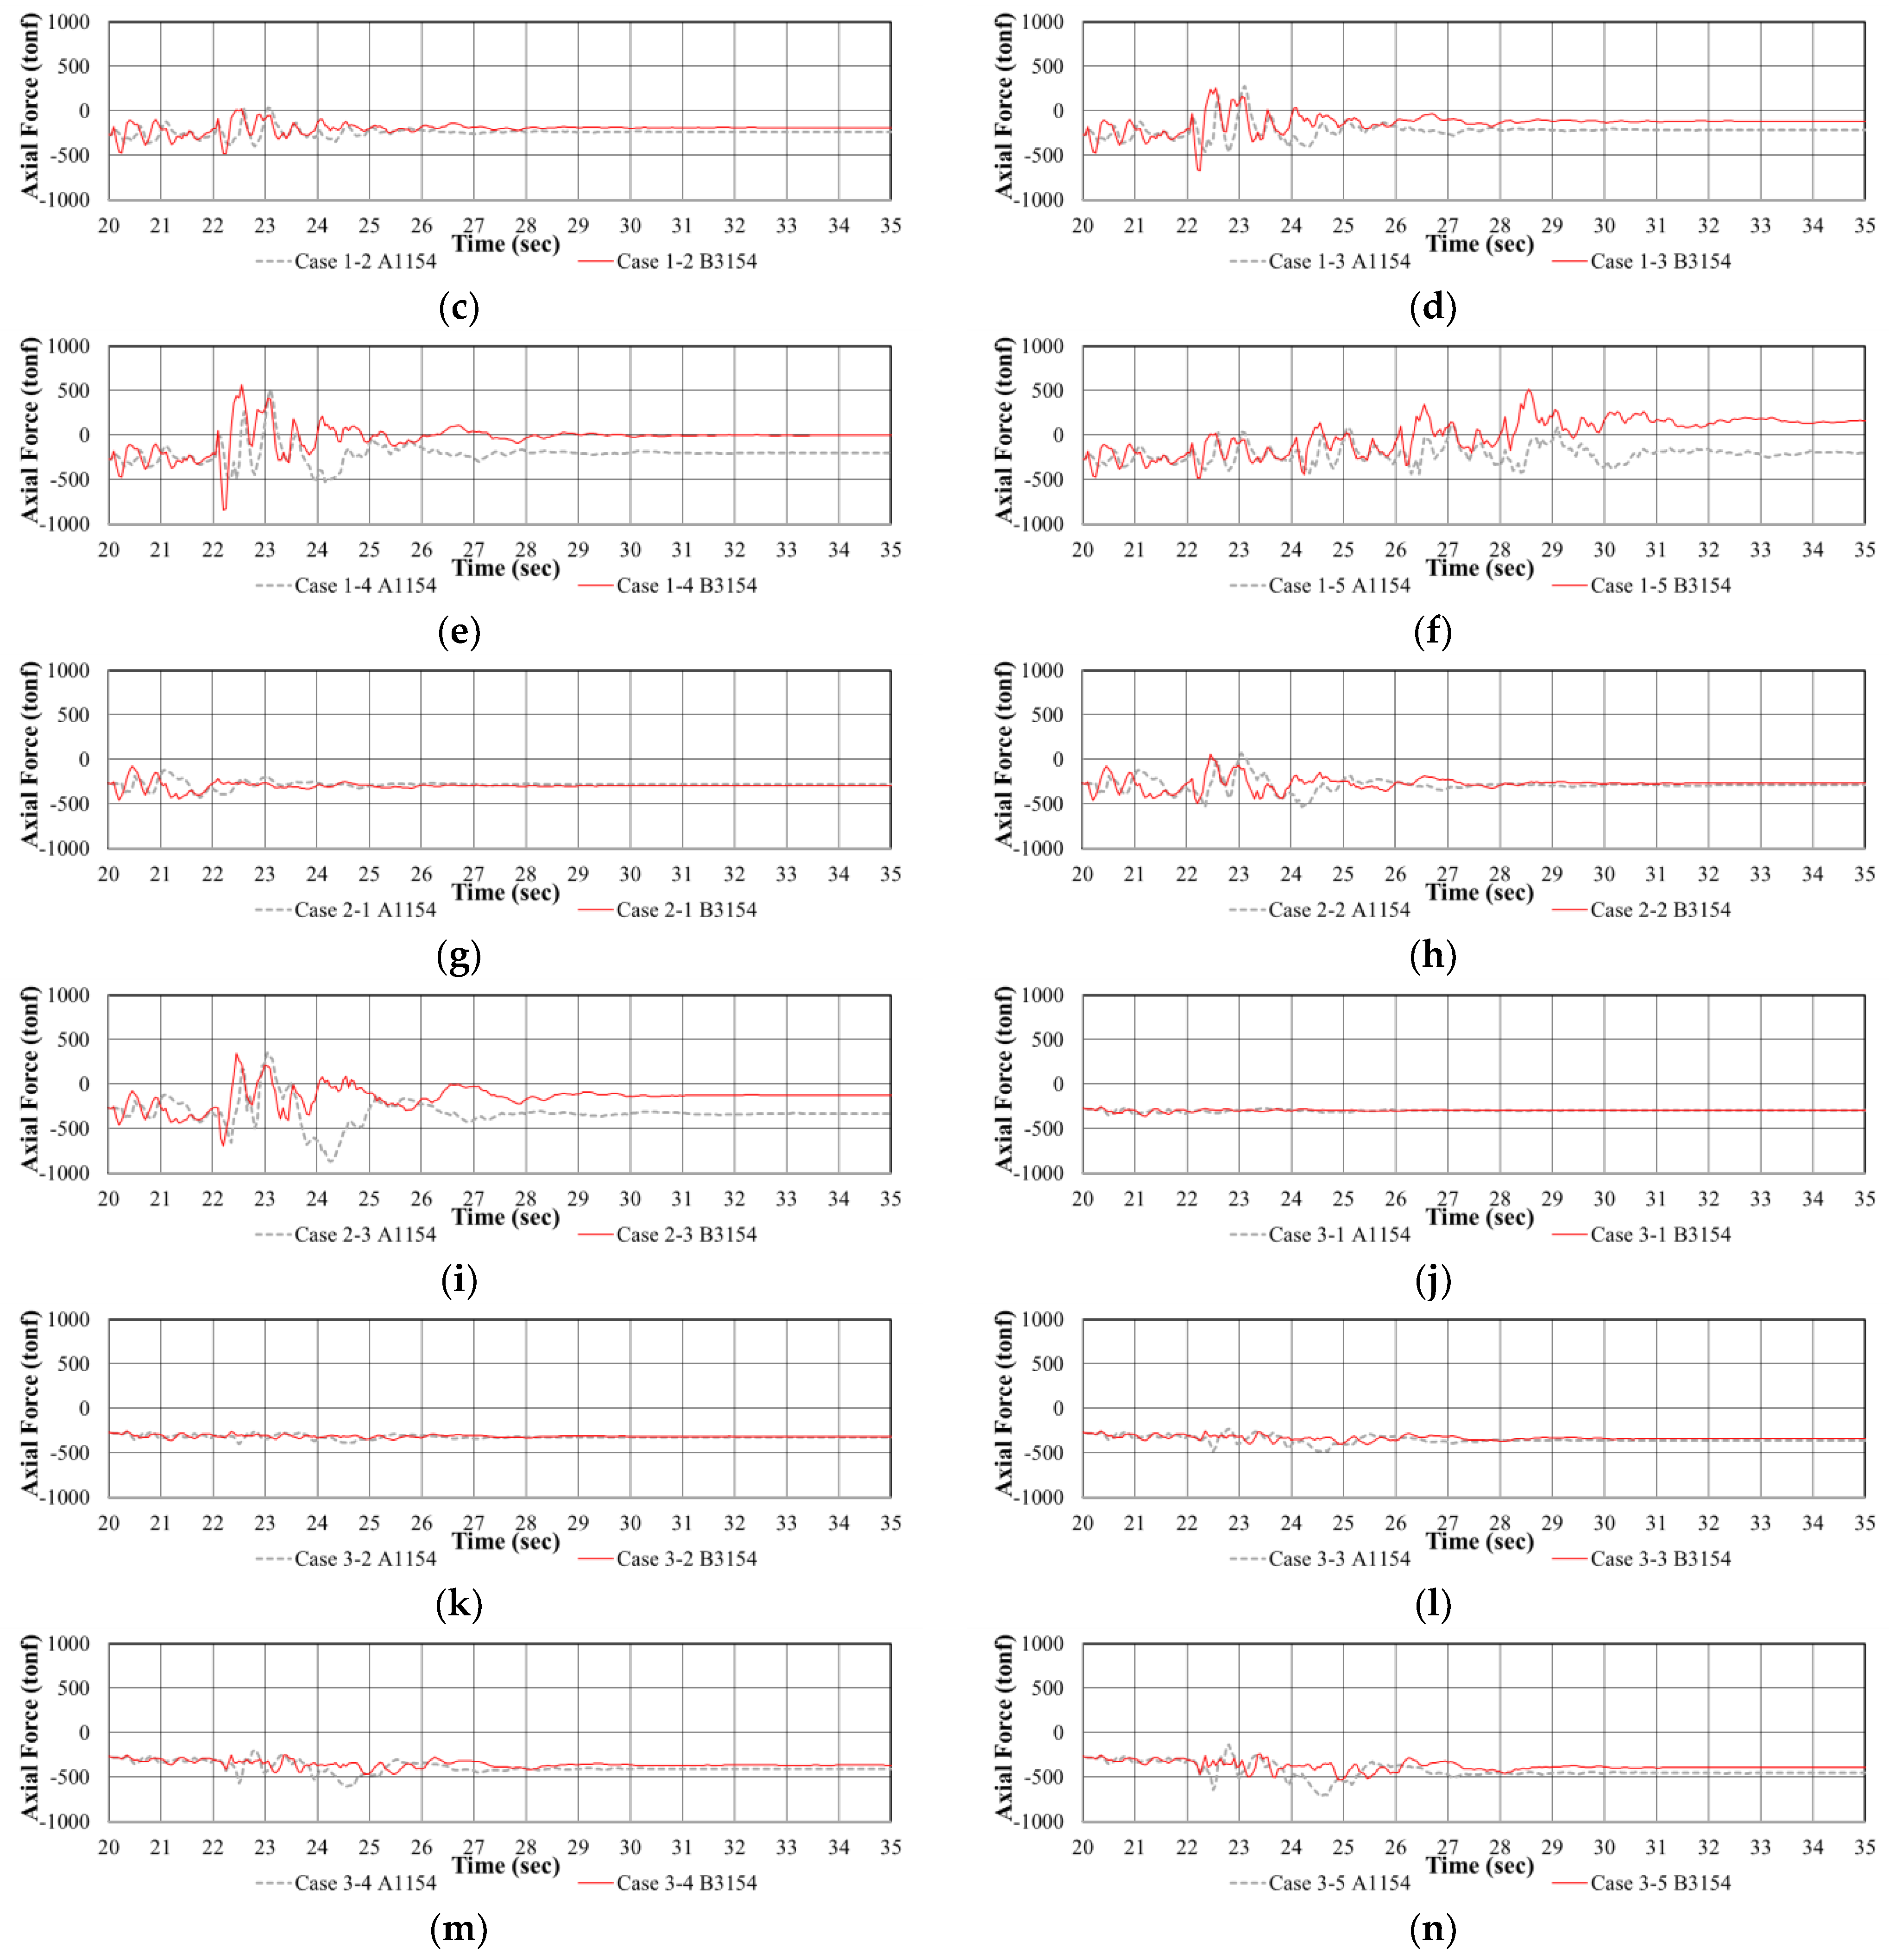
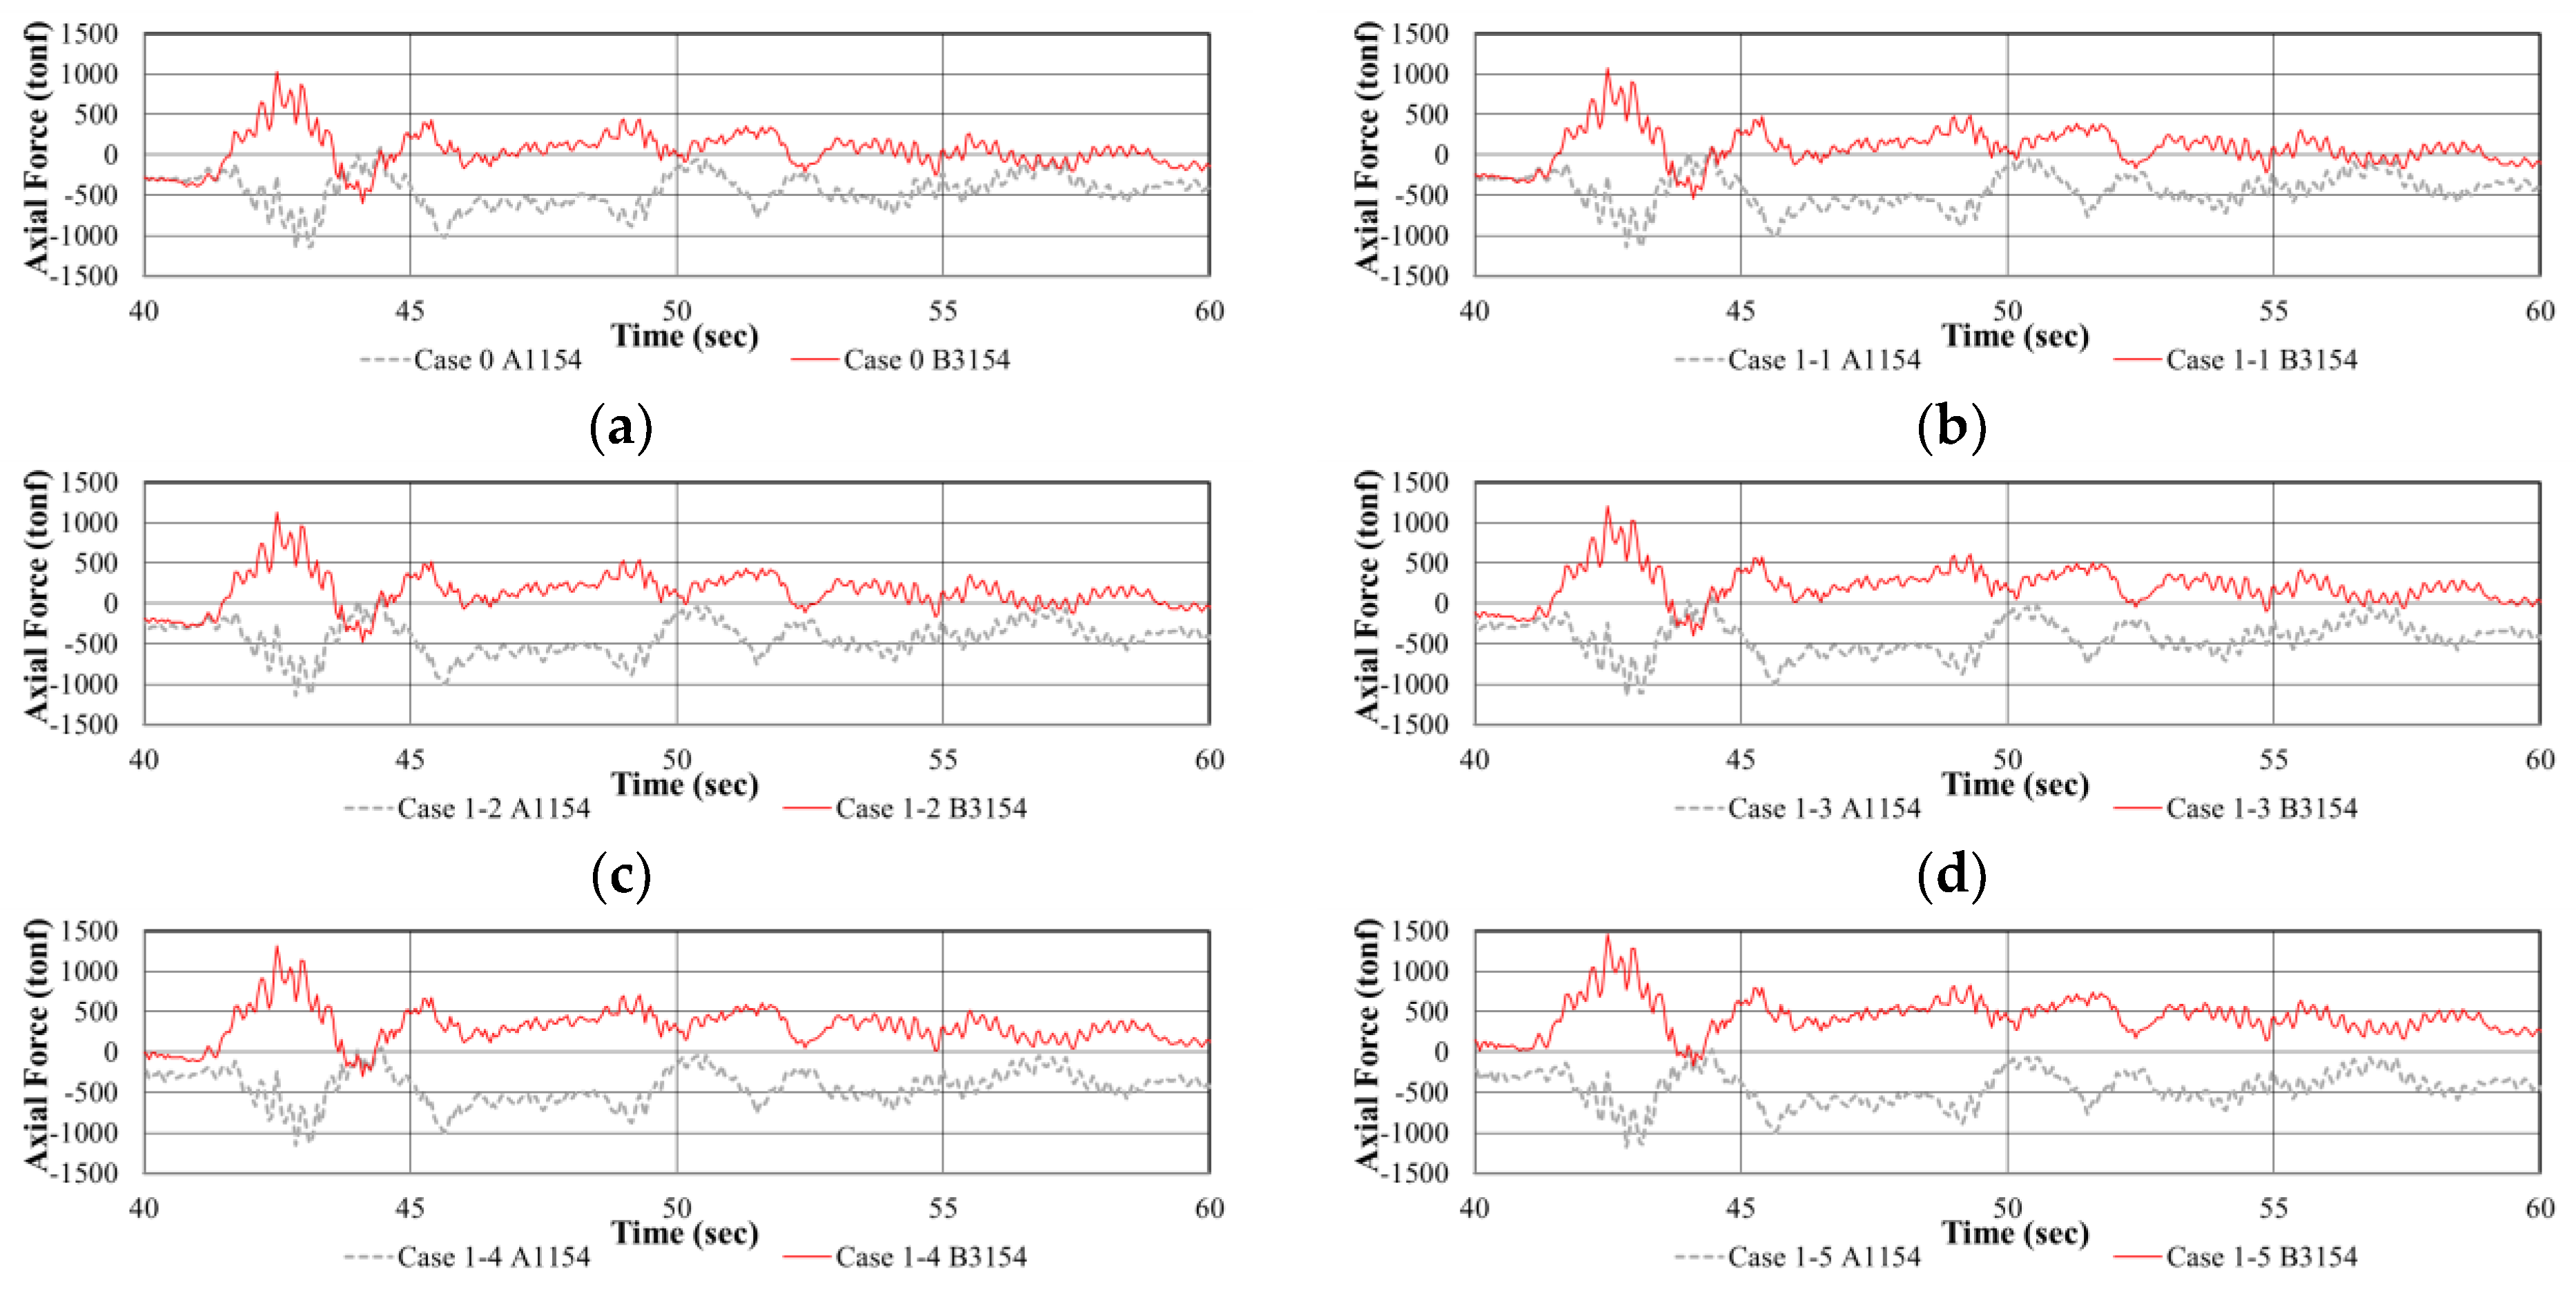
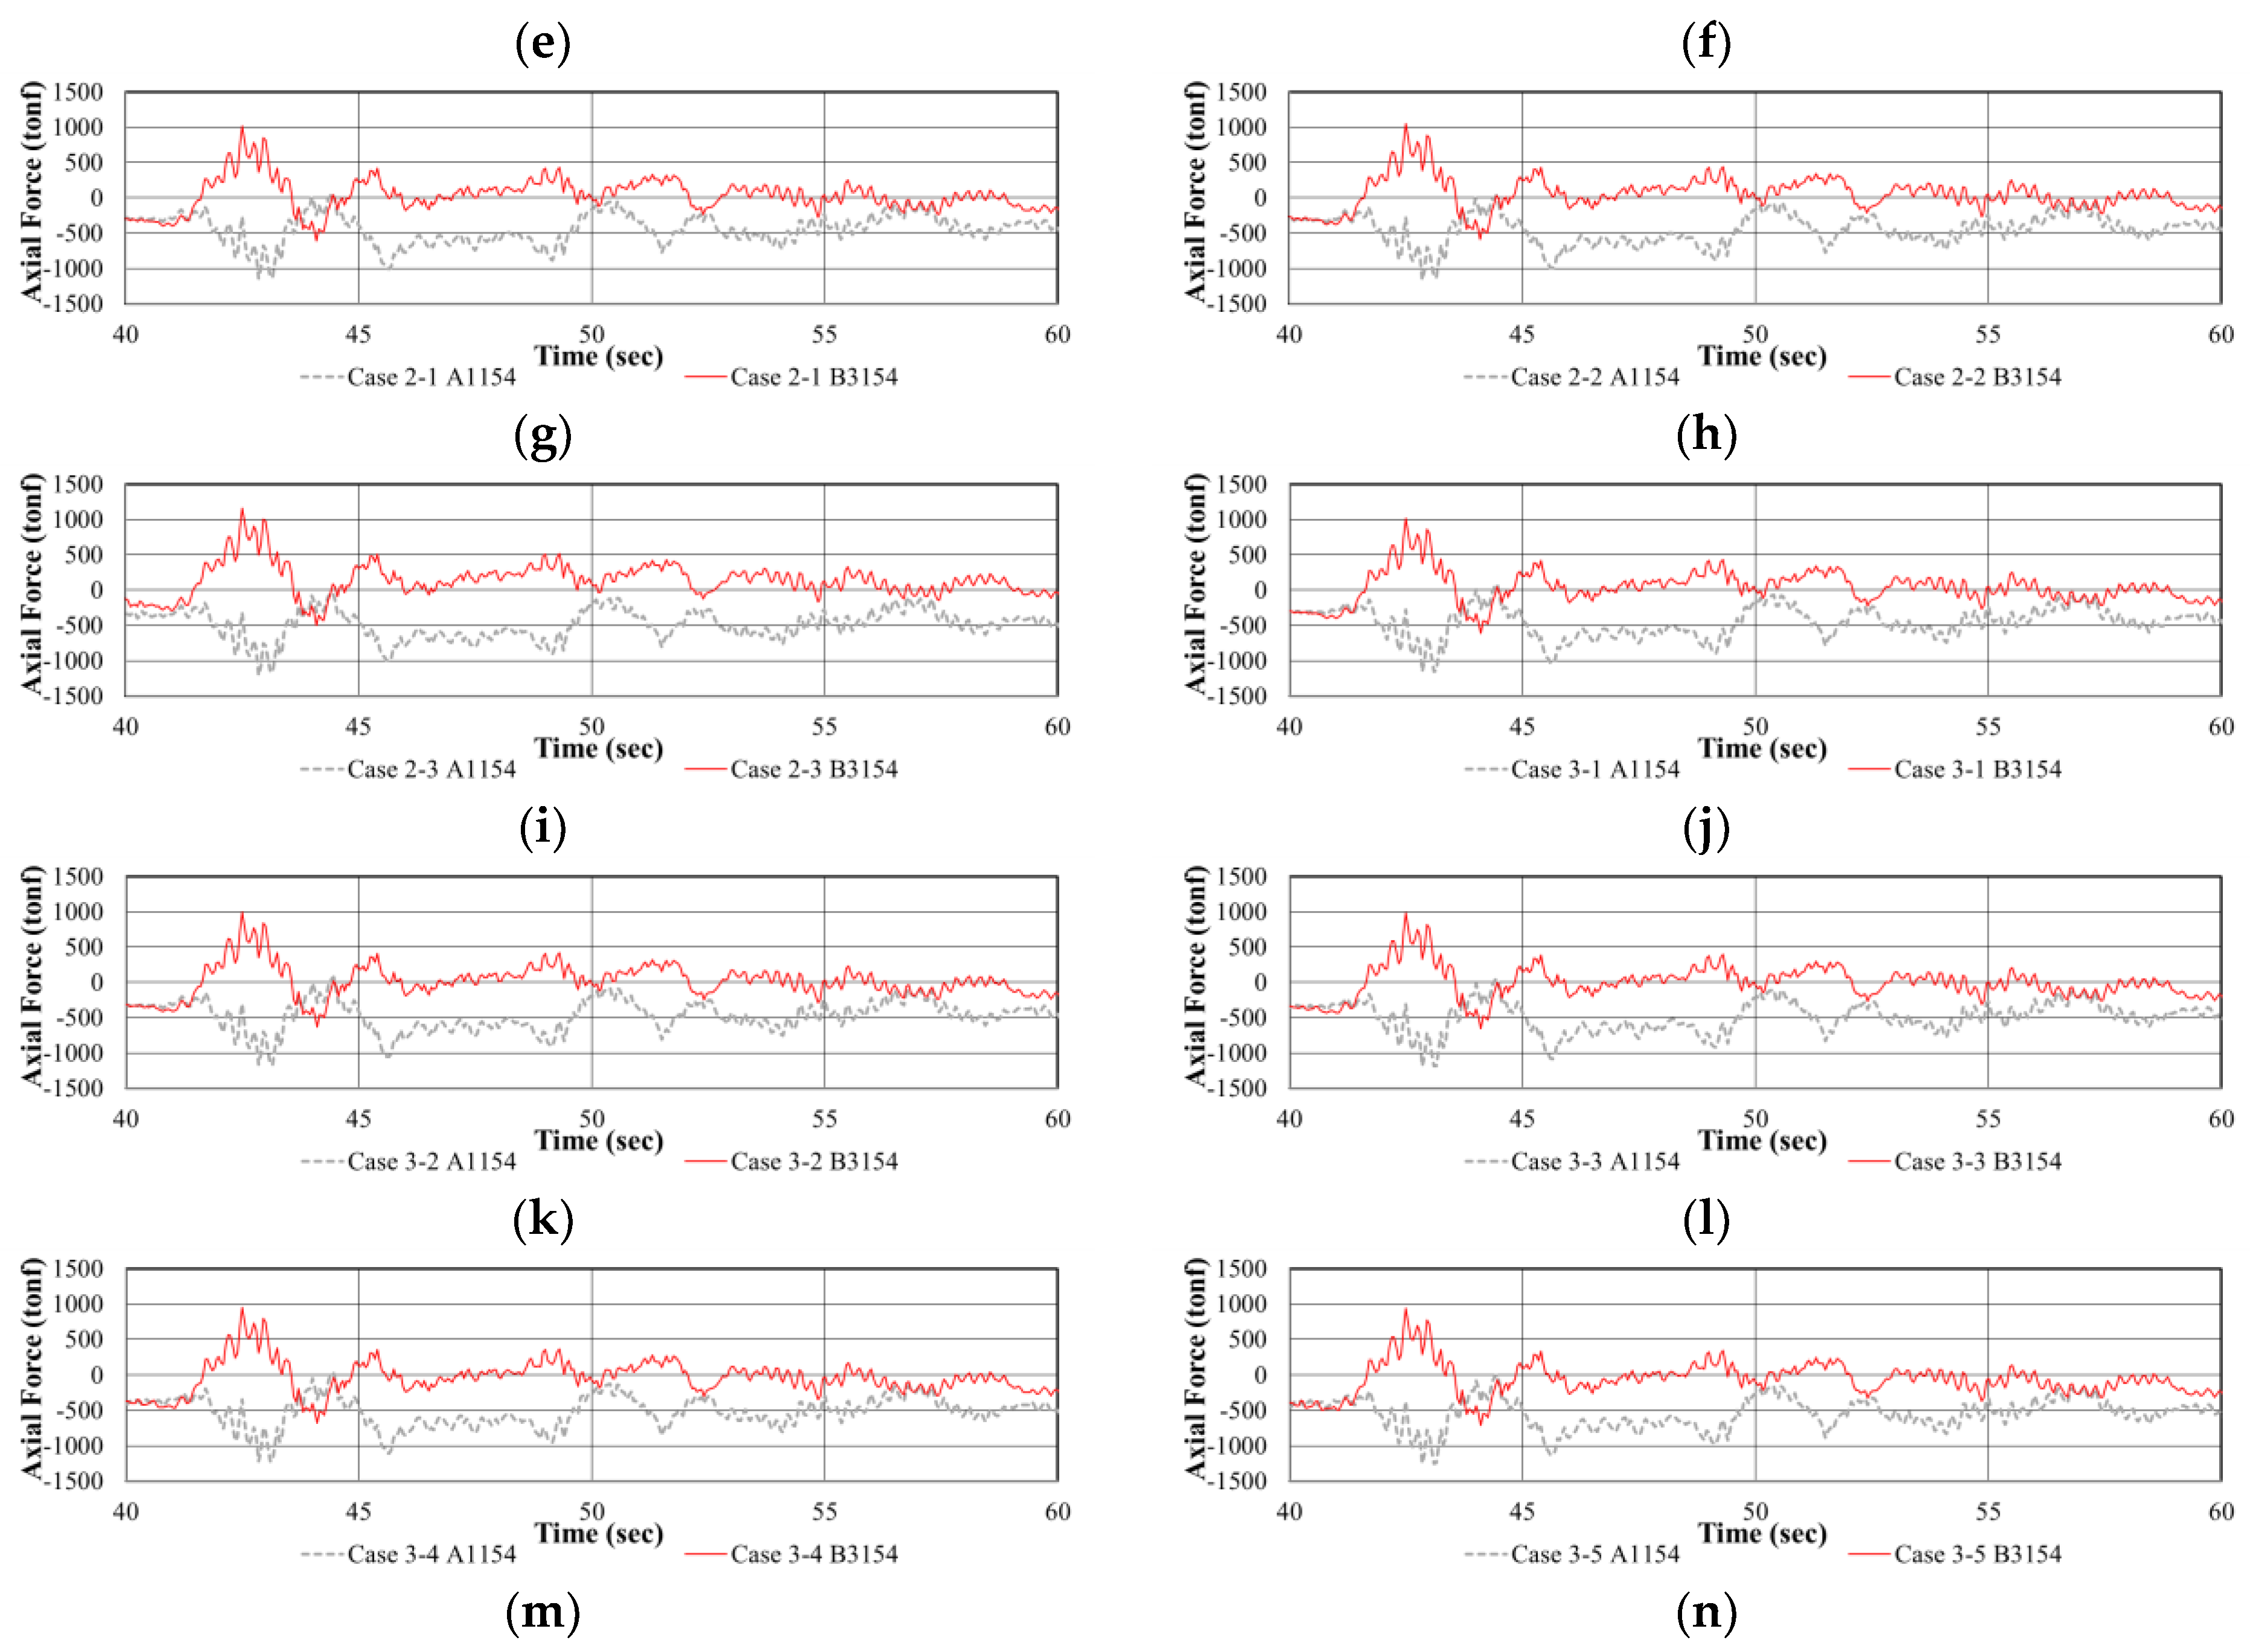
3.3. Analysis Results

The deflection of the bridge was analyzed based on the initial equilibrium state prior to the occurrence of cable loss. Subsequently, the maximum downward and upward deflections of the girder immediately after cable loss, as well as after the stabilization of the vibration due to the cable loss, were examined. The shape of the instantaneous maximum deflection is illustrated in Figure 8, and a graph comparing the deflection of each case with the deflection limit specified in the design criteria is shown in Figure 9. Table 5 provides the values of the downward and upward deflections for each case.
As a result of analyzing the effect of cable loss on deflection, it was found that, in all cases, the deflection of the girder increases geometrically rather than linearly as the number of lost cables increases. The maximum downward deflection occurs at the center span, and the maximum upward deflection occurs at the side span, regardless of the location of the lost cables. Furthermore, it was shown that if more than five cables are lost in the center span, the design limit is exceeded.
The change in cable force due to cable loss and earthquakes was also shown in Figure 10 according to the position of the lost cable. In all cases, the cable force shows a large change in the cable closest to the lost cable, but it was below the yield stress. However, in Case 1, the stress exceeded allowable stress when more than three cables were lost, and in Cases 2 and 3, the stress exceeded allowable stress when more than four cables were lost.
In addition to the changes in shape (upward or downward deflection) and cable tension caused by cable loss on the bridge, the changes in the axial forces of the girders were also numerically evaluated. The variation in girder axial force was examined at the location where the girder crosses the pylon, where the axial force is maximum. The position of the corresponding beam element of the FE model is shown in Figure 11.
Figure 12 and Table 6 show the variation in the girder axial force due to gradual cable loss, while Figure 13 represents the axial force change due to seismic loads acting after cable loss. The results of CASE 0 are also included so that the results before and after cable damage can be compared. In the case of CASE 0, the left and right girders are subjected to −282.75 tonf of axial force, showing that the compressive effect on the girder caused by the cable tension is properly reflected.
The analysis of the variation in the girder axial force due to cable loss revealed that as the number of lost cables increases, the amount of variation in the girder axial force increases, and the difference in the axial force acting on the left and right girders increases. For example, comparing CASE 1-1 and CASE 1-5, when one cable is lost, the girder axial force undergoes significant changes but still remains within the compression range. However, when five cables are lost, the girder undergoes alternating tension and compression (Figure 12b,f). It is believed that such phenomena can induce fatigue on the girder due to the alternating stresses (CASE 1-3, 1-4, 1-5, 2-2, and 2-3). In addition, after the vibration due to cable loss stabilizes, the compressive force acting on the girder on the left side of the bridge (3154), where the cable was lost, decreases significantly according to the amount of cable loss. This consequently creates a difference in axial force between the left (3154) and right (1154) girders because the decrease in the compressive force acting on the left girder is greater than that on the right girder (Table 6, (C) − (C′)).
The results of the analysis of the axial force on the girders caused by seismic loads acting after cable loss are presented in Figure 13 and Table 7. If an earthquake occurs after the cable loss and vibration have stabilized, the maximum compressive force (right girder) and maximum tensile force (left girder) generated in the girders increase compared to Case 0, where only earthquake loads act without cable damage. The amount of increase in axial force was proportional to the number of lost cables. Comparing the changes in axial forces in the girders due to cable loss and those due to seismic loads, it can be observed that the difference in axial forces due to cable loss (Table 6, (C) − (D)) shows a similar trend to the changes in axial forces due to seismic loads after cable loss (Table 7, (A) − (B)).
Based on the initial equilibrium state where the compression force on the girders was 282.75 tonf, the range of axial forces (−1140.25~1022.55 tonf) induced on the girders by the earthquake load appears to be at a level that can impair the stability of the bridge. However, since this is a result of linear elastic analysis, further analysis considering material nonlinearity is necessary to more precisely analyze the seismic response. In addition, in the case of cable breakage, it was found that the axial force in the girder caused by seismic loads can increase up to an additional 42%, and from the perspective of the axial force in the girder, cable loss can significantly reduce the resistance to earthquakes.

4. Conclusions

To evaluate the degradation in usability resulting from cable loss in a long-span cable-stayed bridge, two-stage dynamic time-history analyses were conducted. In the first stage, the dynamic behavior was analyzed by progressively removing the cable, and in the second stage, the usability was evaluated by applying far-field ground motion to the bridge with lost cables. The major results obtained from this are as follows:
  • In all cases, the stress in the cables was found to be lower than the yield stress. However, as cables were gradually lost, significant changes in tension occurred in adjacent cables, and in some cases, the stress exceeded the allowable stress. Considering that the cable design tension for the target bridge was 41% to 71% of the allowable stress, indicating a considerable margin of safety, it is evident that cable loss has a non-negligible impact on the surrounding cables. However, even in cases where several cables were lost, the stress in the adjacent cables did not exceed the yield stress, and therefore, the possibility of cable failure occurring in a cascading manner is deemed to be low;
  • In the case of cable breakage, it was found that the axial force in the girder caused by seismic loads can increase up to an additional 42%. From the perspective of axial force in the girder, cable failure was found to significantly reduce the bridge’s resistance to earthquakes.
Through this study, it was confirmed that the safety and serviceability of the bridge are not seriously compromised even if a few cables are lost. However, if more than five cables are lost at once, it is expected that excessive deflection and an increase in axial force in the girder will occur, and safety and/or serviceability problems may be caused.
Additionally, due to the impact of cable loss on adjacent cables, additional reinforcement is needed for the nearest cables when a stay cable is lost, the use of the bridge should be restricted, and the deflection of the central span should be continuously monitored until the repair work is completed. The target bridge in this study was the two-sided semi-harp type, which is one of the most common cable arrangements for cable-stayed bridges; therefore, further research is needed to investigate the structural behavior according to the cable arrangement and the shape of the pylon.

Author Contributions

Conceptualization, J.P. and C.P.; methodology, C.P.; software, J.Y. and C.P.; supervision, J.P. and J.L.; writing—original draft, J.Y.; writing—review and editing, J.P. and J.L. All authors have read and agreed to the published version of the manuscript.

Funding

This research was supported by the Basic Science Research Program through the National Research Foundation of Korea [NRF2018R1A6A1A07025819].

Institutional Review Board Statement

Not Applicable.

Informed Consent Statement

Not Applicable.

Data Availability Statement

Data sharing is not applicable to this article.

Conflicts of Interest

The authors declare no conflict of interest.

References

  1. Choi, K.; Lee, J.; Chung, C.H.; An, D.; Yoon, J. Structural Behavior Evaluation of a Cable-Stayed Bridge Subjected to Aircraft Impact: A Numerical Study. J. Comput. Struct. Eng. Inst. Korea 2021, 34, 137–149. [Google Scholar] [CrossRef]
  2. Huang, D.; Wang, T.L. Impact analysis of cable-stayed bridges. Comput. Struct. 1992, 43, 897–908. [Google Scholar] [CrossRef]
  3. Son, J.; Lee, H.J. Performance of cable-stayed bridge pylons subjected to blast loading. Eng. Struct. 2011, 33, 1133–1148. [Google Scholar] [CrossRef]
  4. Rezaiee-Pajand, M.; Mokhtari, M.; Masoodi, A.R. A novel cable element for nonlinear thermo-elastic analysis. Eng. Struct. 2018, 167, 431–444. [Google Scholar] [CrossRef]
  5. Lee, G.C.; Loh, C.H. Chi-Chi Taiwan, Earthquake of September 21, 1999: Reconnaissance Report; Technical Report MCEER-00-0003; University at Buffalo: Buffalo, NY, USA, 2000. [Google Scholar]
  6. Aoki, Y. Analysis of the Performance of Cable-Stayed Bridges under Extreme Events. Ph.D. Thesis, University of Technology Sydney, Ultimo, Australia, 2014. [Google Scholar]
  7. PTI. Recommendations for Stay Cable Design, Testing and Installation; Post Tensioning Institute: Farmington Hills, MI, USA, 2007. [Google Scholar]
  8. Kao, C.S.; Kou, C.H. The influence of broken cables on the structural behavior of long span cable stayed bridges. J. Mar. Sci. Technol. 2010, 18, 395–404. [Google Scholar] [CrossRef]
  9. Kim, S.; Kang, Y.J. Structural behavior of cable-stayed bridges after cable failure. Struct. Eng. Mech. 2016, 59, 1095–1120. [Google Scholar] [CrossRef]
  10. Kim, E.S. Structural Redundancy Evaluation of the Incheon Bridge Considering Cable Fracture Scenarios and Earthquake Loadings. Master’s Thesis, Hongikk University, Seoul, Republic of Korea, 2022. [Google Scholar]
  11. Chung, C.H.; Lee, J.; Choi, K.; Yoon, J. Evaluation of Cable Supported Bridge System for Extreme Loads; KBRC (Korea Bridge Design & engineering Research Center): Seoul, Republic of Korea, 2021. [Google Scholar]
  12. Lee, Y.J.; Kim, M.S.; Lee, J.B. Reliability-Based Methodology of Performance Assessment and Earthquake Response for Cable Bridges in Use; KBRC (Korea Bridge Design & Engineering Research Center): Seoul, Republic of Korea, 2021. [Google Scholar]
  13. Omran, M.E.; Karani, A.H. Cable loss performance investigation of cable-stayed bridge equipped with Roll-N-Cage isolator. Structures 2022, 41, 1329–1344. [Google Scholar] [CrossRef]
  14. Maren, W.; Starossek, U. Cable loss and progressive collapse in cable-stayed bridges. Bridge Struct. 2009, 5, 17–28. [Google Scholar] [CrossRef]
  15. LSTC (Livermore Software Technology Corporation). LS-DYNA Keyword User’s Manual; Livermore Software Technology Corporation: Livermore, CA, USA, 2020. [Google Scholar]
  16. Korea Road and Transportation Association. SEOHAEAN Expressway SEO-HAE Bridge Cable-Stayed Bridge Superstructure Complementary Design General Report; Korea Road and Transportation Association: Seoul, Republic of Korea, 1998. [Google Scholar]
  17. Korea Expressway Corporation Research Institute. Final Report on Development of Long-Term Behavior Analysis Method of Cable Bridge Using Measurement Data; Korea Expressway Corporation Research Institute: Seoul, Republic of Korea, 2007. [Google Scholar]
  18. Korea Road and Transportation Association. Korean Highway Bridge Design Code (Limit States Design Method); Ministry of Land, Infrastructure and Transport: Seoul, Republic of Korea, 2016.
  19. Korea Road and Transportation Association. Korean Highway Bridge Design Code for Cable Bridges(Limit States Design Method); Ministry of Land, Infrastructure and Transport: Seoul, Republic of Korea, 2015.
  20. Fleming, J.F.; Egeseli, E.A. Dynamic behaviour of a cable-stayed bridge. Earthq. Eng. Struct. Dyn. 1980, 8, 1–16. [Google Scholar] [CrossRef]
  21. Kim, H.; Adeli, H. Wavelet-hybrid feedback linear mean squared algorithm for robust control of cable-stayed bridges. J. Bridge Eng. 2005, 10, 116–123. [Google Scholar] [CrossRef]
  22. Soneji, B.B.; Jangid, R.S. Influence of soil–structure interaction on the response of seismically isolated cable-stayed bridge. Soil Dyn. Earthq. Eng. 2008, 28, 245–257. [Google Scholar] [CrossRef]
  23. Soyluk, K.; Sicacik, E.A. Soil–structure interaction analysis of cable-stayed bridges for spatially varying ground motion components. Soil Dyn. Earthq. Eng. 2012, 35, 80–90. [Google Scholar] [CrossRef]
Figure 1. Recent natural and man-made disasters on cable-supported bridges: (a) Seohae Bridge (Korea, 2015); (b) Gwangan Bridge (Korea, 2019); and (c) Ulsan Bridge (Korea, 2019).
Applsci 13 05636 g001
Figure 2. General drawing of Seohae Bridge.
Applsci 13 05636 g002
Figure 3. FE model of Seohae Bridge.
Applsci 13 05636 g003
Figure 4. Rigid link and boundary condition of Seohae Bridge FE model.
Applsci 13 05636 g004
Figure 5. Eigenvalue analysis results: (a) Mode 1; (b) Mode 2; (c) Mode 3; and (d) Mode 4.
Applsci 13 05636 g005aApplsci 13 05636 g005b
Figure 6. Cable loss damage scenario: (a) CASE1; (b) CASE2; and (c) CASE3. (Red arrows indicate cable lost direction.)
Applsci 13 05636 g006
Figure 7. El-Centro earthquake ground motion: (a) longitudinal acceleration; (b) longitudinal displacement; (c) lateral acceleration; and (d) lateral displacement.
Applsci 13 05636 g007
Figure 8. Instantaneous maximum deflection shape: (a) Case 1-1; (b) Case 1-2; (c) Case 1-3; (d) Case 1-4; (e) Case 1-5; (f) Case 2-1; (g) Case 2-2; (h) Case 2-3; (i) Case 3-1; (j) Case 3-2; (k) Case 3-3; (l) Case 3-4; and (m) Case 3-5.
Applsci 13 05636 g008
Figure 9. Deflection after cable loss: (a) Case 1 instantaneous deflection; (b) Case 1 deflection after stabilization; (c) Case 2 instantaneous deflection; (d) Case 2 deflection after stabilization; (e) Case 3 instantaneous deflection; and (f) Case 3 deflection after stabilization.
Applsci 13 05636 g009
Figure 10. Cable forces after cable loss: (a) Case 1 instantaneous cable force; (b) Case 1 cable force after earthquake; (c) Case 2 instantaneous cable force; (d) Case 2 cable force after earthquake; (e) Case 3 instantaneous cable force; and (f) Case 3 cable force after earthquake.
Applsci 13 05636 g010aApplsci 13 05636 g010b
Figure 11. Location of evaluation girder for seismic load. (Red dotted lines indicate the output elements).
Applsci 13 05636 g011
Figure 12. Time–girder axial force diagram under cable loss: (a) Case 0; (b) Case 1-1; (c) Case 1-2; (d) Case 1-3; (e) Case 1-4; (f) Case 1-5; (g) Case 2-1; (h) Case 2-2; (i) Case 2-3; (j) Case 3-1; (k) Case 3-2; (l) Case 3-3; (m) Case 3-4; and (n) Case 3-5.
Applsci 13 05636 g012aApplsci 13 05636 g012b
Figure 13. Time–girder axial force diagram under earthquake after cable loss: (a) Case 0; (b) Case 1-1; (c) Case 1-2; (d) Case 1-3; (e) Case 1-4; (f) Case 1-5; (g) Case 2-1; (h) Case 2-2; (i) Case 2-3; (j) Case 3-1; (k) Case 3-2; (l) Case 3-3; (m) Case 3-4; and (n) Case 3-5.
Applsci 13 05636 g013aApplsci 13 05636 g013b
Table 1. Material properties of FE model.
PartElastic
Modulus
(MPa)
Yield
Stress
(MPa)
Density
(ton/m3)
Poisson’s Ratio
Pylon33.76-2.500.167
Main Girder210-7.850.300
Stringer210-7.850.300
Floor Beam210-7.850.300
Deck Slab33.76-2.50.167
Cable2001569.67.870.300
Table 2. Seohae Bridge cable list.
Element
No
Strand
(EA)
Fracture
Strength
(kN)
Yield
Strength
(kN)
Pre-tension
Load
(kN)
Element
No
Strand
(EA)
Fracture
Strength
(kN)
Yield
Strength
(kN)
Pre-tension
Load
(kN)
B61019124,10321,4254963B61379124,10321,4255252
B61029124,10321,4255117B61389124,10321,4255630
B61039124,10321,4255466B61397519,86517,6586652
B61049124,10321,4256917B61407519,86517,6586080
B61057319,33617,1876013B61417118,80616,7165673
B61066717,74615,7745853B61426617,48115,5395083
B61076416,95215,0684999B61436416,95215,0684571
B61086116,15714,3625153B61446116,15714,3624301
B61096116,15714,3625164B61456116,15714,3623379
B61105514,56812,9493931B61465514,56812,9493786
B61115514,56812,9493366B61475514,56812,9493134
B61124812,71411,3012895B61484812,71411,3013045
B61134812,71411,3013549B61494812,71411,3012934
B61144812,71411,3013395B61504411,65410,3592754
B61154411,65410,3592469B61514411,65410,3593472
B61164411,65410,3592365B61524411,65410,3593535
B611737980087112460B615337980087112794
B61185514,56812,9493662B61545514,56812,9494390
B61195514,56812,9493433B61555514,56812,9493912
B612037980087112807B615637980087112884
B61214411,65410,3593438B61574411,65410,3592148
B61224411,65410,3593265B61584411,65410,3592392
B61234411,65410,3592650B61594812,71411,3013047
B61244812,71411,3012702B61604812,71411,3013549
B61254812,71411,3013413B61614812,71411,3013697
B61265514,56812,9493515B61625514,56812,9493895
B61275514,56812,9494238B61635514,56812,9493939
B61286116,15714,3623803B61646116,15714,3624197
B61296116,15714,3624300B61656116,15714,3624816
B61306416,95215,0684394B61666416,95215,0685344
B61316617,48115,5394700B61676717,74615,7745530
B61327118,80616,7165422B61687319,33617,1876226
B61337519,86517,6586404B61699124,10321,4256250
B61347519,86517,6585777B61709124,10321,4256061
B61359124,10321,4256063B61719124,10321,4255678
B61369124,10321,4255312B61729124,10321,4254828
Table 3. Eigenvalue comparison.
Mode ShapeReference
Eigenvalue [14]
(Hz)
FE Model
Eigenvalue
(Hz)
Error
(%)
1st Vertical0.25570.26112.07
2nd Vertical0.32560.33131.72
1st Horizontal0.37250.3227−13.67
1st Torsional0.45550.4206−8.29
Table 4. Quantity of cable loss per case.
CaseElement No. of Lost CablesQuantity
(EA)
0-0
11-161361
1-26136, 61352
1-36136, 6135, 61343
1-46136, 6135, 6134, 61324
1-56136, 6135, 6134, 6132, 61315
22-16136, 61372
2-26136, 6137, 6135, 61384
2-36136, 6137, 6135, 6138, 6134, 61396
33-161721
3-26172, 6171,2
3-36172, 6171, 6170,3
3-46172, 6171, 6170, 61694
3-56172, 6171, 6170, 6169, 61685
Table 5. Deflections due to cable loss.
CaseInstantaneousAfter StabilizationNote
Downward
(mm)
Upward
(mm)
Downward
(mm)
Upward
(mm)
00000-
11-1314.347.4223.835.8OK
1-2579.3101.8522.978.8OK
1-3995.0137.1904.0119.7OK
1-41524.2179.61371.5162.9OK
1-52098.8190.72029.8219.8NG
22-1611.832.2458.37.3OK
2-2139664.51216.436.5OK
2-32604.638.2236260.0NG
33-1218.7127.7142.383.6OK
3-2374.1219.1223.8197.3OK
3-3635.9379.8559.4348.5OK
3-4952.0567.5840.8517.5OK
3-51234.5702.31196.6680.0OK
Table 6. Cable loss analysis result by case.
CaseGirder Axial Force After Cable Loss (tonf)(C) − (C′)
Left Girder (3154)Right Girder (1154)
Max
(A)
Min
(B)
After
Stabilization
(C)
(C) − (D)Max
(A′)
Min
(B′)
After
Stabilization
(C′)
(C′) − (D′)
0--−282.75 (D)---−282.75 (D′)-0
11-1−95.54−471.53−244.8837.87−117.38−359.97−261.3421.4016.47
1-219.90−484.56−191.5091.2432.04−403.60−236.3746.3844.86
1-3256.04−672.07−119.27163.47274.39−470.36−215.2867.4694.06
1-4564.76−841.39−4.60278.14511.04−528.62−201.4581.30196.85
1-5512.38−484.58156.18438.92114.82−437.78−206.8675.88363.04
22-1−78.25−457.59−297.69−14.95−117.71−426.39−282.660.09−15.03
2-260.18−499.57−269.1613.5971.96−536.34−291.66−8.9222.51
2-3342.75−691.91−127.59155.15349.29−872.09−334.53−51.78206.93
33-1−254.50−363.77−296.49−13.75−265.04−358.58−300.03−17.283.53
3-2−254.50−363.77−316.54−33.80−262.17−402.19−326.37−43.629.83
3-3−254.09−408.45−340.26−57.51−227.51−486.95−361.87−79.1321.62
3-4−251.12−469.68−367.48−84.74−192.71−603.70−407.90−125.1640.42
3-5−239.12−535.82−393.57−110.83−135.95−719.89−453.66−170.9260.09
Table 7. Seismic analysis result by case.
CaseGirder Maximum Axial Force
under Earthquake
(tonf)
(A) − (A′)
Left (3154)Right (1154)
Max (A)(A) − (B)Min (A′)(A´) − (B′)
01022.55 (B)-−1140.25 (B′)-2162.80
11-11068.5445.99−1141.02−0.772209.56
1-21129.92107.37−1141.78−1.532271.70
1-31204.24181.69−1143.80−3.552348.04
1-41312.74290.19−1151.77−11.522464.51
1-51455.08432.53−1171.37−31.122626.45
22-11017.19−5.36−1143.29−3.042160.48
2-21049.4826.93−1159.24−18.992208.72
2-31163.16140.61−1205.47−65.222368.63
33-11011.50−11.05−1151.12−10.872162.62
3-2995.36−27.19−1168.33−28.082163.69
3-3975.57−46.98−1191.10−50.852166.67
3-4952.68−69.87−1220.65−80.402173.33
3-5931.67−90.88−1251.19−110.942182.86
Disclaimer/Publisher’s Note: The statements, opinions and data contained in all publications are solely those of the individual author(s) and contributor(s) and not of MDPI and/or the editor(s). MDPI and/or the editor(s) disclaim responsibility for any injury to people or property resulting from any ideas, methods, instructions or products referred to in the content.

