Article

Experimental Evaluation of Rigidity Center

Department of Civil Engineering, Van Yuzuncu Yil University, Van 65090, Turkey
*
Author to whom correspondence should be addressed.
Appl. Sci. 2023, 13(13), 7452; https://doi.org/10.3390/app13137452
Submission received: 31 May 2023 / Revised: 15 June 2023 / Accepted: 20 June 2023 / Published: 23 June 2023
(This article belongs to the Special Issue Advances on Structural Engineering, Volume III)

Abstract

:
It is known that when a reinforced concrete building exposed to a horizontal load is subjected to torsional moments around its center of rigidity, additional shear stresses occur in the vertical load-carrying elements, such as the columns and shear walls. Therefore, in order to estimate the additional stresses caused by the torsion, the rigidity center should be calculated precisely. It is known that there are several analytical approaches to calculating the rigidity center location. These approaches do not calculate the rigidity centers close to each other in asymmetric buildings. As significant differences were observed in the calculation of the rigidity center using analytical methods, it was decided to seek verification by conducting an experimental study. In order to calculate and verify the location of the rigidity center, an extensive experimental study was planned. A total of 20 scaled and revised buildings were built, and they were tested in the specially designed test setup. The tested buildings had square, rectangular and irregular floor plans. In addition, vertical load-carrying members were either symmetrically placed on the floor plan or kept asymmetrical to see the effect of their location on the rigidity center. All the buildings were tested under their self-weight, and the corresponding displacements were recorded. Additionally, all the buildings were modeled using ETABS to verify the theoretical background of the rigidity center. From the test results, it was found that the resultant shear force can be calculated by multiplying the displacements of each member of a given story found from the tests on its bending stiffness, and this will give the location of the rigidity center. The rigidity center was found to be identical to the results obtained from the 3D model analysis using ETABS, although it uses a different procedure. As the results from the experiment and 3D model are close to each other, it can be said that the rigidity center of reinforced concrete buildings can be found from simple tests using any material that has almost uniform mechanical properties.

1. Introduction

Loss of life and property was experienced in the recent earthquakes in Turkey due to buildings that were not designed and constructed in accordance with the rules specified in the seismic regulations [1,2,3]. Although the damage was mostly caused by the material quality and design deficiencies, it has been determined that the incorrect placement of the vertical structural system elements is also a factor that increased the damage [4].
As the direction of an earthquake and the angle of the impact on buildings are uncertain, it is desirable for buildings to have sufficient earthquake performance in both the main axes. For this purpose, vertical structural system elements are placed in buildings in a way that adds strength, rigidity and ductility on both the main axes [5]. However, sometimes vertical load-carrying members can be placed asymmetrically due to architectural and economic reasons. If the layout is not well adjusted, then the rigidity center of the building moves away from the mass center. Thus, seismic force acting on the center of mass tries to rotate the building around the center of rigidity; therefore, torsion occurs in the floor [6,7,8]. This torsion is transferred to the vertical load-carrying members as an additional shear force. In order to determine the torsional effect realistically, the positions of the mass and rigidity center must be determined accurately [9].
When designing a building, the positions and dimensions of the columns and shear walls are decided during the architectural design, while the final dimensions of the vertical load-carrying elements are determined during the static design. The column and shear wall positions are generally not changed during the static design as it may affect the architectural plan [10,11,12].
While the rigidity center of reinforced concrete buildings can be determined separately for each floor, a single rigidity center can also be calculated for the building [6,13,14,15,16,17,18]. The following methods are generally recommended to calculate the rigidity center location:
  • Buildings are handled independently in x and y directions, and the size and location of the vertical structural elements are taken into account [5,15,19];
  • Dependent and independent analyses in x and y directions are made by creating story stiffness matrices, and the distribution of the shear forces acting on the structural system elements is taken into account [20,21,22];
  • The distribution of rotations under unit loading is taken into account by forming a global stiffness matrix for the building [23]. In the methods where the rigidity center is calculated by establishing stiffness matrices, the floors are generally considered rigid diaphragms [24].
It has been determined by various studies that shear walls are important in influencing the position of the rigidity center due to their large moments of inertia in the in-plane direction. For this reason, the effect of the shear wall placement on the system behavior was also investigated [25,26]. It has been observed that drifts increase in the structures where the rigidity center and mass center move away from each other. The symmetrical placement of the shear walls on the outer axes increased the torsional rigidity and reduced the shear forces. It is recommended that the shear walls be placed symmetrically so that they do not create torsion [25,26].
Although several analytical studies related to rigidity center locations and their effects on buildings are available, there are a limited number of experimental studies dealing with rigidity center calculations [27,28,29,30,31,32,33]. Half-scale single-story buildings with two spans in both directions were experimentally tested considering the torsional irregularities created by slab openings. From the test results, it was stated that the diaphragm rotation calculated from the rigidity center was found to be more reliable compared to the Turkish Building Code (TBC2018). They also concluded that an adjusted rigidity center close to the mass center was not sufficient to prevent torsional irregularity; in addition, slabs were one of the important elements to reduce torsional irregularity [34].
A 17-story reinforced concrete building in half scale was tested on the shake table. In this test, it was stated that torsional effects were dominant in the asymmetrical building, and damage occurred in the so-called flexible part when there was no shear wall in the floor plan, [35]. According to the study findings, the story mass eccentricity is primarily to blame for the building’s torsion movement. On the other hand, the shaking table was found to have a considerable impact on the response of the building to twisting [36,37]. The rigidity center can also be calculated from the vibration records. This method is based on the criterion that the coherence of the translational motions with the rotational motions at the rigidity center is minimal [38,39].
It is known that there are several analytical approaches to calculating the rigidity center location. These approaches do not calculate the rigidity centers close to each other in asymmetric buildings. As significant differences were observed in the calculation of the center of stiffness with the analytical methods, it was decided to seek verification by conducting an experimental study. In this study, we tried to experimentally determine the rigidity center of buildings using a specially designed test setup. Five square-planned buildings with only four vertical members, six square-planned buildings with equally spaced columns and shear walls, four rectangular-planned buildings and five buildings revised from real buildings were manufactured using balsa wood.

2. Materials and Methods

2.1. Balsa Wood

Rigidity center of a building mainly depends on lateral stiffness of the vertical load-carrying members. Lateral stiffness of a member is affected by the material (as mechanical properties of materials are different), sectional properties (moment of inertia) and length of the member. If all of the vertical load-carrying members in a building are made of the same material (either concrete, steel or wood), i.e., keeping modulus of elasticity (E) the same, the only variable will be the moment of inertia and the location of the member in calculating the rigidity center. Therefore, considering the laboratory conditions (in terms of space, loading, measurement devices, data acquisition capability and the amount of the buildings), scaled versions of the buildings were constructed.
In order to see the exaggerated deformations (drifts) of the columns, a material with low modulus of elasticity was sought, and finally, balsa wood was selected. Balsa wood is one of the lightest and softest woods, and its modulus of elasticity is relatively low compared to other woods.
For the columns, 6 × 6 mm balsa sticks were used, and 3 mm thick balsa plates with varying lengths were utilized for shear walls. Before the tests, unit weight (W) of all the balsa wood and modulus of elasticity (E) of some of the selected balsa wood were calculated from the three-point bending test recorded (Figure 1 and Figure 2). Unit weights varied between 62 kg/m3 and 420 kg/m3 in balsa sticks, and they were between 195 kg/m3 and 372 kg/m3 in balsa plates. Modulus of elasticity measurements revealed that W was proportional to E. Therefore, as difference in modulus of elasticity affects the bending stiffness, balsa wood was grouped considering its unit weights in order to eliminate the effect of it in rigidity center calculations.
In addition, 8 mm thick medium-density fiberboard (MDF) plates, mostly 300 × 300 mm in dimension, were used as slabs, and 18 mm thick MDF plates with 500 × 500 mm dimension were utilized as the bases of the buildings. The unit weight of the MDFs was found to be 1000 kg/m3, whereas their modulus of elasticity was 4950 MPa. Although some insignificant differences exist, all the MDFs were assumed to have the same mechanical properties.

2.2. Constructing the Test Specimens

As previously noted, all the vertical load-carrying members were built from 6 × 6 mm balsa sticks (columns) and 3xLw mm (Lw defines the varying length of the plates) balsa plates, the slabs were made of 8 mm thick MDF plates, and foundation (or base) was built using 18 mm MDF plates. The construction process of the buildings is given below:
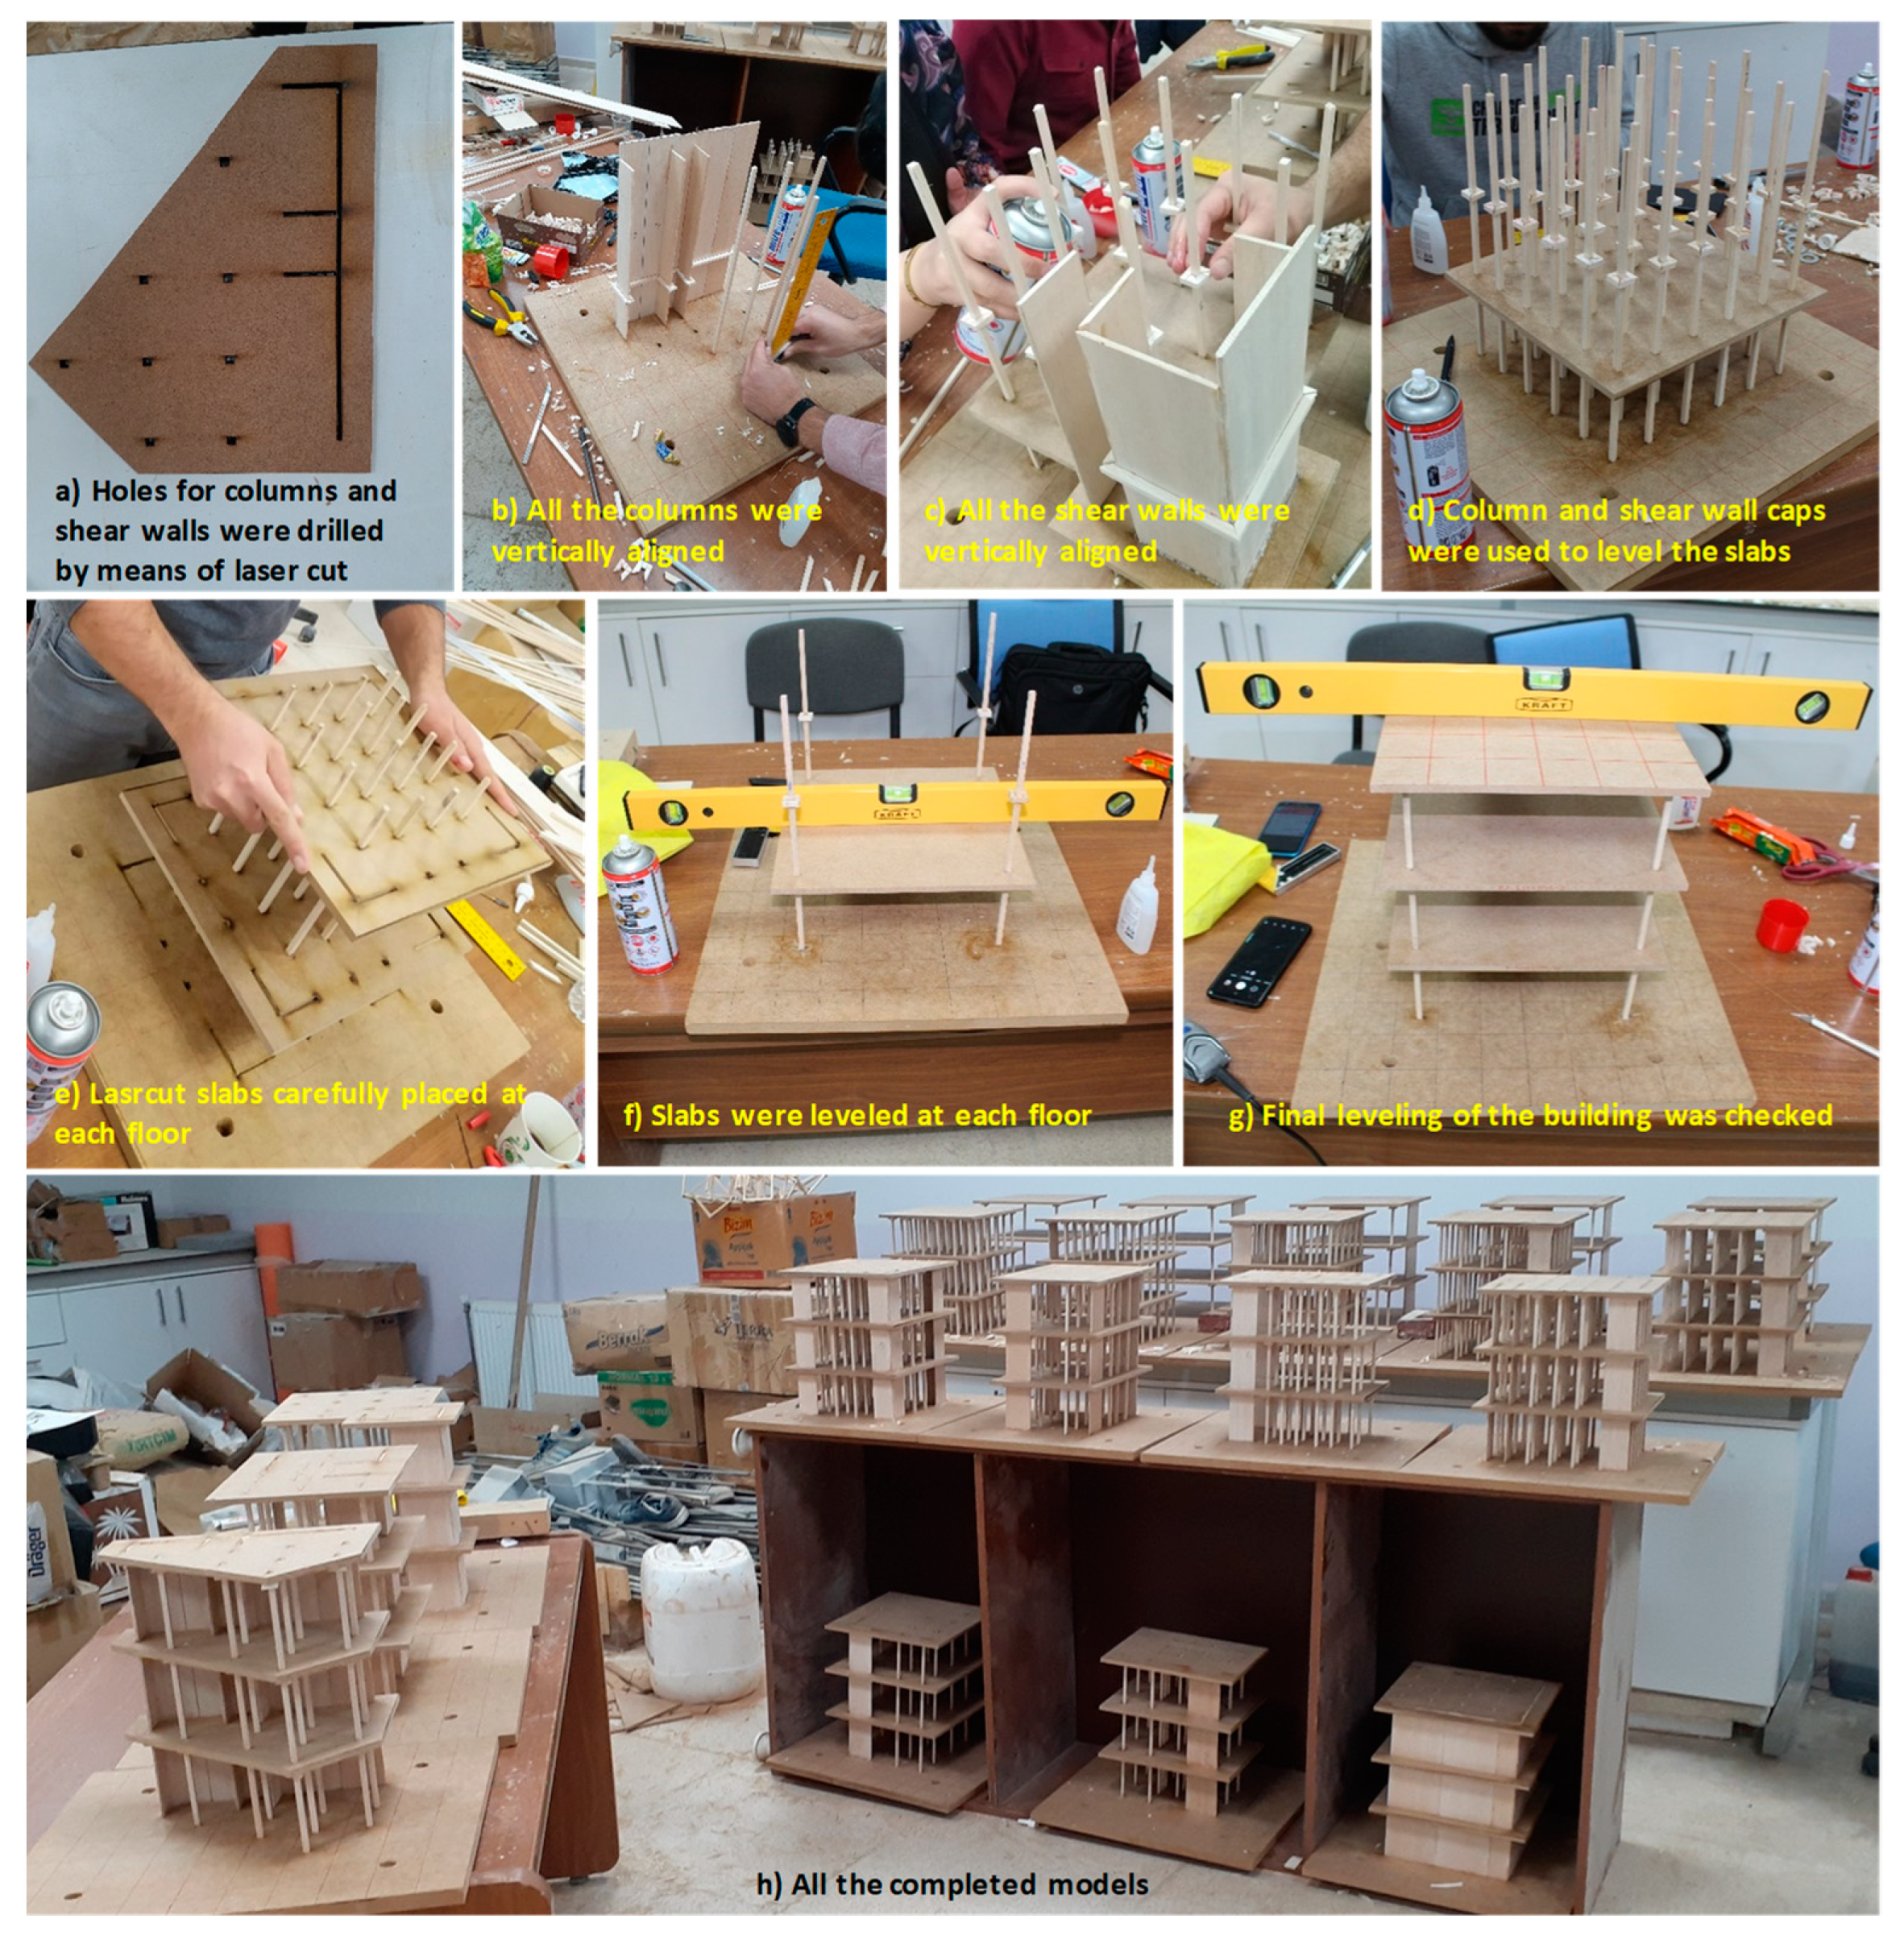
  • The column and shear wall locations were marked on the MDF plates, and they were drilled out in slabs using laser cutting. The same locations were carved in 5 mm using laser cutting in base to create a fixed base restraint (Figure 3a);
  • In order to not create an unintentional weakness at the column–slab and shear wall–slab connections, all the columns and shear walls were kept continuous from base to the top floor. Next, 305 mm long columns and shear walls were placed on the base, and their alignment was checked at each placement (Figure 3b,c);
  • As column and shear wall locations on the slabs were drilled out, in order to place slabs horizontally, column and shear wall caps were placed at each floor level as shown in Figure 3d (also Figure 3e);
  • All the slabs were leveled by means of water level (Figure 3f,g);
  • After completing the construction, final leveling of the slabs and alignment of the vertical members were checked, and completed buildings were stored (Figure 3g,h).

2.3. Building Properties
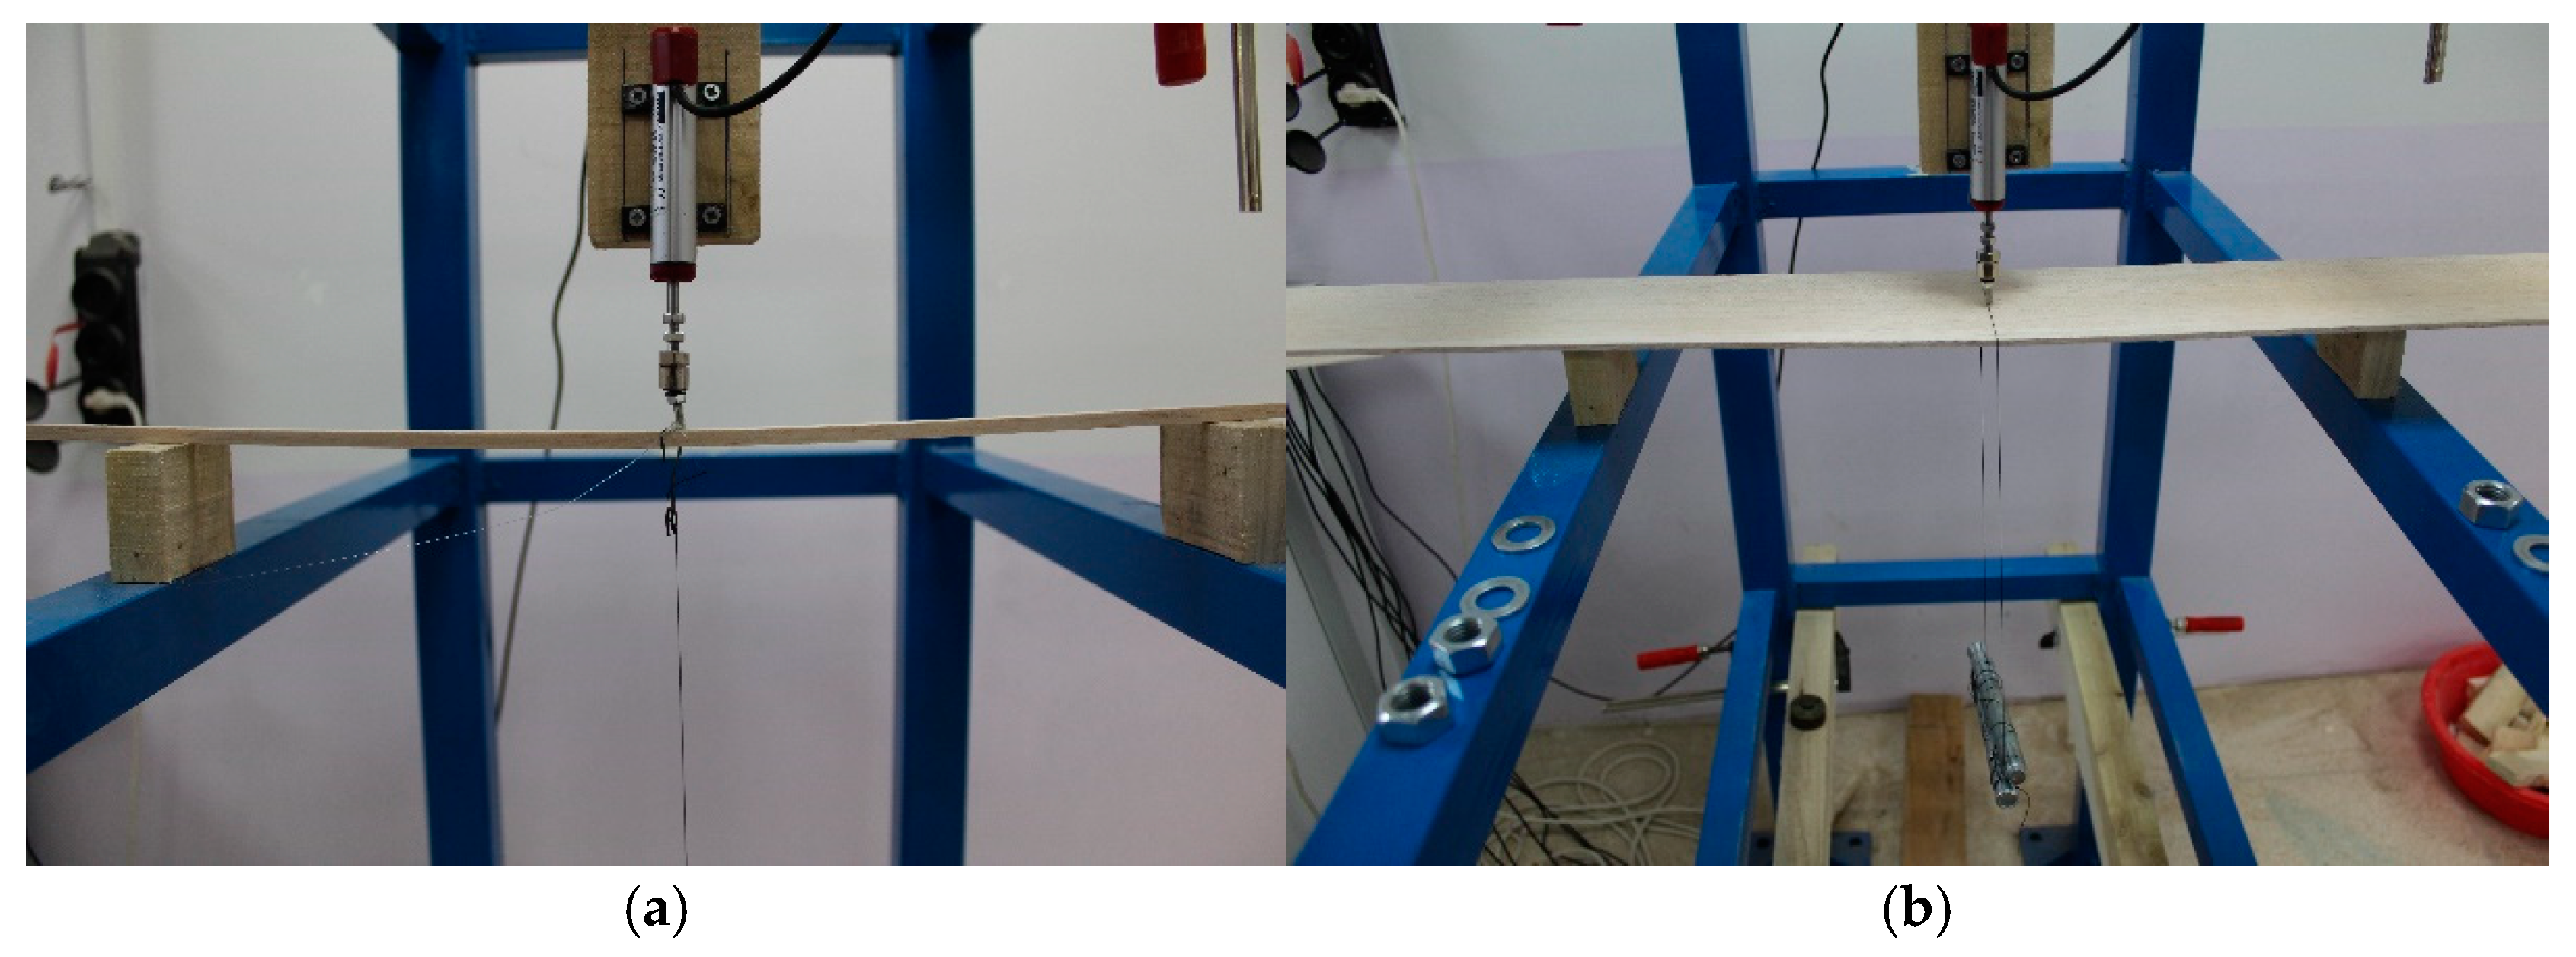
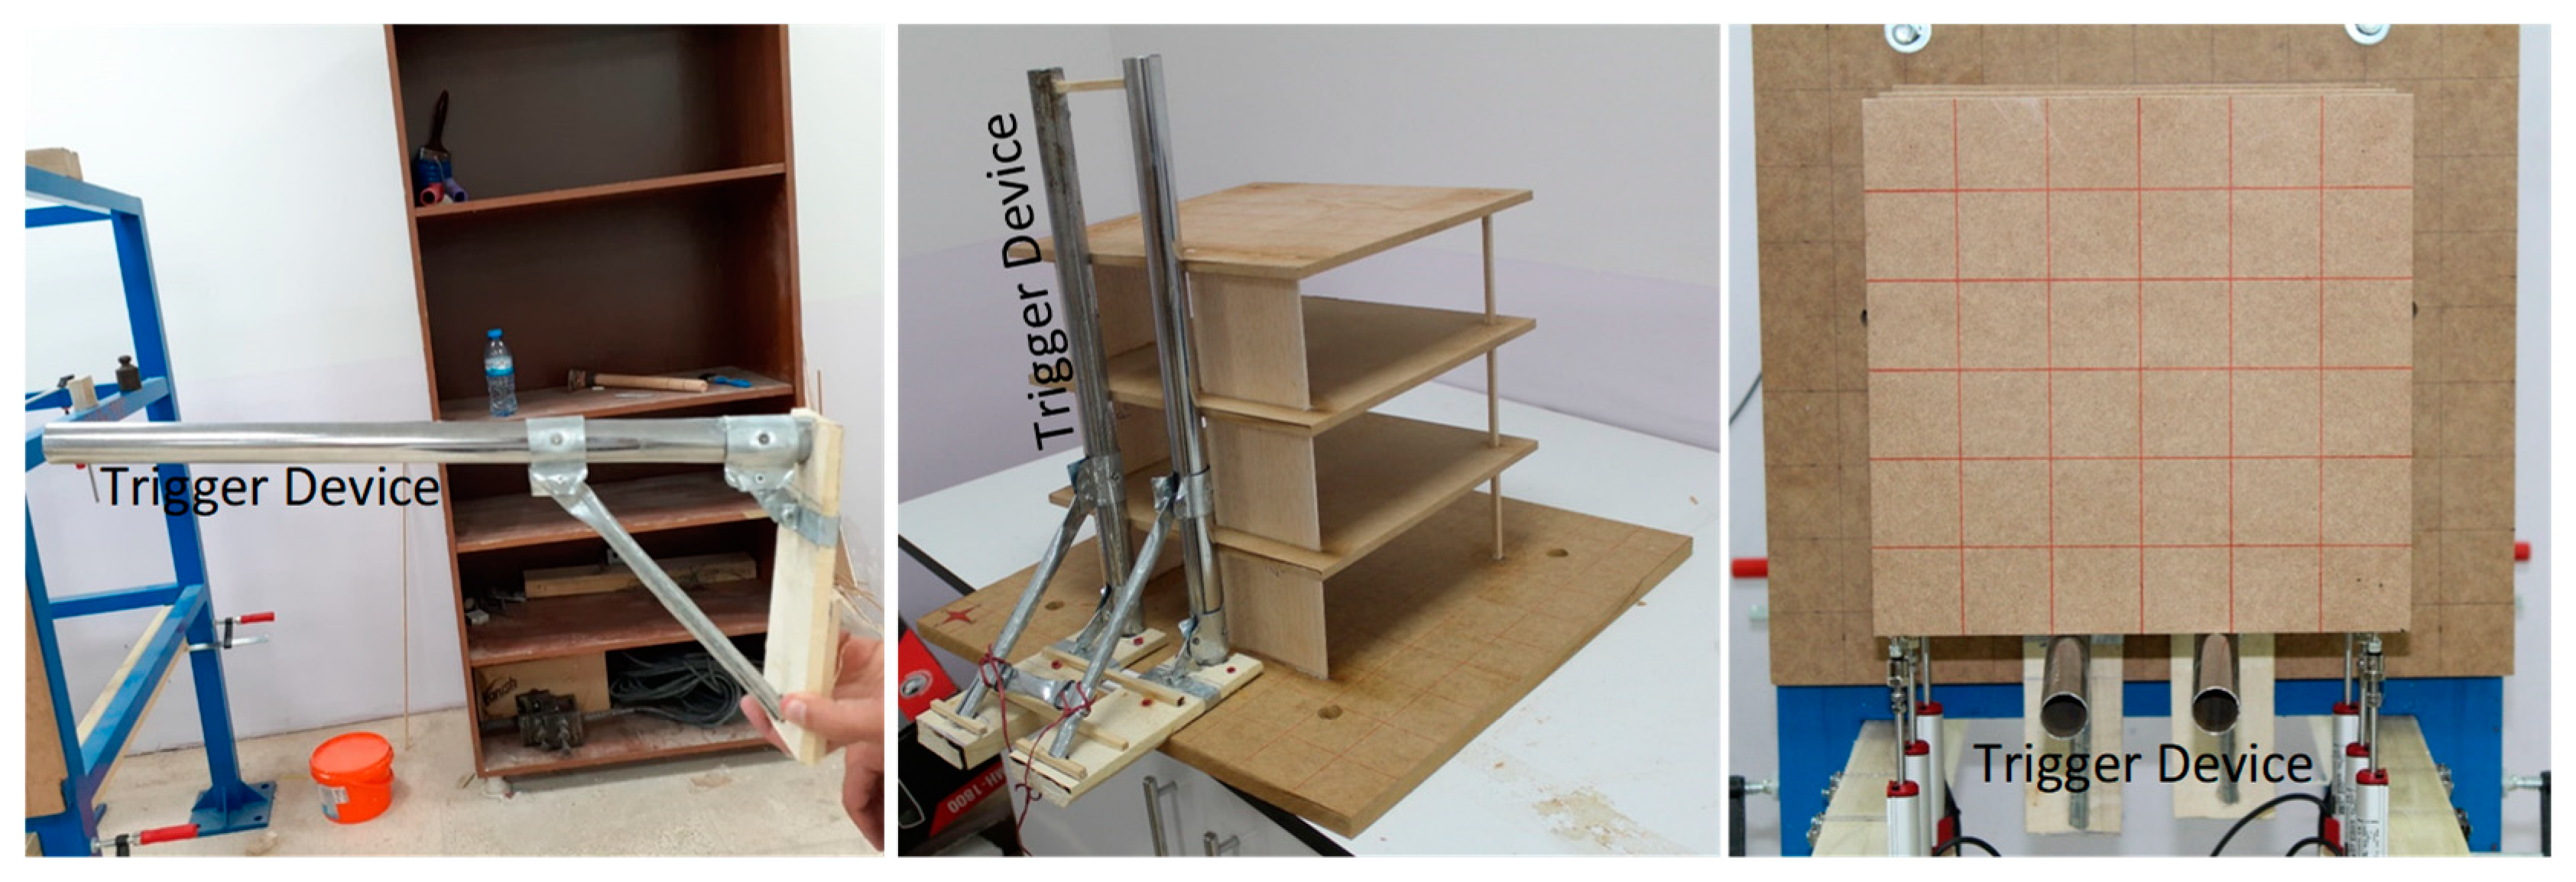
Story height of the buildings was one of the hard issues to determine because low height would result in small displacements in most of the buildings, and it may not be easy to see the clear difference between the displacements of the members to comment on. On the other hand, as balsa wood has low modulus of elasticity, displacements in the buildings with a reduced number of vertical members would be great when the story height was high, but vertical members might break under those displacement levels. From several tests and analyses, it was decided to keep story height as 100 mm in all buildings to have satisfactory displacement and easily interpret the results.
A total of 20 buildings in 4 groups were built from balsa wood and MDF plates to experimentally determine their rigidity center. In the following tables, A c , E W and A c , N S are the column areas in east–west and north–south directions, respectively; A w , E W and A w , N S are the shear wall areas in east–west and north–south directions, respectively; and finally, A f stands for the ground floor area. Having square sections, cross-sectional areas of the columns were counted both in E-W and N-S directions, but shear wall areas were counted only in the strong direction. In order to be compatible with the experimental results, south direction was placed in positive vertical direction.
Group A buildings had only four vertical load-carrying members (Figure 4). The aim of this group was first to reduce the number of vertical members and simplify the problem and then to see the displacement clearly and understand how rigidity center alters as asymmetry arouses. A1 had only four columns placed at the corner of the floor plan; A2 had one shear wall placed in N-S direction; A3 had two shear walls, one in E-W direction and the other one in N-S direction; A4 had three shear walls, two in E-W direction and one in N-S direction; and finally, in A5, all the columns were replaced by shear walls. Column and shear wall areas are presented in Table 1.
Group B buildings had 6 × 6 equally spaced axis, and at each conjunction, a vertical member was placed (Figure 5). Column and shear wall areas are presented in Table 2. This group was built to see the displacements in buildings with increased number of vertical members and understand the change in rigidity center with the introduction of shear walls. B1 having only the columns and B6 having both columns and shear wall were the symmetrical buildings. In B2, symmetry was ruined by introducing a shear wall at the south-east corner of the buildings. B3 was symmetrical in N-S direction, but in E-W direction, as shear wall was used only at the south side of the building, no symmetry existed in E-W direction. An additional shear wall was placed to ruin the symmetry in N-S direction of B3 to create B4. B5 was symmetrical in N-S and E-W directions separately, but from global point of view, the centroid of the shear walls was observed to be in N-W direction.
Group C buildings were rectangular in plan; they all had shear walls either placed symmetrically or not (Figure 6). Areas of the vertical members are presented in Table 3. C1 was a symmetrical building whose shear walls were all at the corners. C2 had symmetry in both directions, but globally shear walls were seen to be in the south direction. C3 had symmetry in E-W direction, and 2 shear walls in N-S direction were placed close to the south-west corner. C4 was the revised version of D4, and one shear wall in N-S direction and one in E-W direction were deleted to create asymmetry.
Buildings in Group D were inspired by real buildings, and their plans were revised considering the test setup (Figure 7 and Table 4). All the buildings in this group were said to have collapsed in a seismic event, and the reason was attributed to torsion. All the columns were revised to have square sections, as balsa sticks were square. Number of axes and distance between the axes and shear wall dimensions tried to be compatible with the real building, and 1/10 scaling was applied to the floor plan. The reason for this group of buildings was to understand if torsion governed the failures and if torsional behavior was predictable.

2.4. Test Setup

To prevent accidental torsions at the floor level, which have direct effect on the displacements, it was decided to load the buildings by their own weight, i.e., dead load. In order to achieve this, buildings must be rotated 90°. Figure 8 shows the test setup. A strong test frame was built to hold the building in place. Each building’s base plate was fixed to the test frame by means of four M16 bolts. Six linear variable differential transducers (LVDTs) were attached to the slabs close to the slab corner by means of hot silicone to measure the vertical displacement from the self-weight. Data were collected by means of a data acquisition system, which was connected to a computer to save and see the recorded data. A camera and a video camera were placed in front of the test specimen to record the vertical displacements of the slabs, and one video camera was located at the side to record the bending behavior of the columns (or shear walls).
It was known that, while rotating the buildings, floors would displace, and it might not be possible to measure additional displacement during the tests. In order to overcome the early displacements, a special trigger device was produced, as seen in Figure 9. This device was mounted on the base plate of the building and held the building in place. While rotating the building, this trigger device prevented early displacements and allowed the building to be attached to the test frame. After attaching the LVDTs to the slabs, the device was triggered by a rope and rotated 90°, which allowed the building to displace vertically by its self-weight (Figure 10). The vertical displacements of the slabs and the bending behavior of the columns can be clearly seen in Figure 10. There was no connection between the column caps and the slabs; slabs freely rotate due to the vertical displacements. No displacement or rotation was seen at the column base meaning that fixed support conditions were available during the tests. As no plastic deformations were recorded during the tests, buildings were tested in all directions (N-S, S-N, E-W and W-E) to measure a reliable rigidity center.

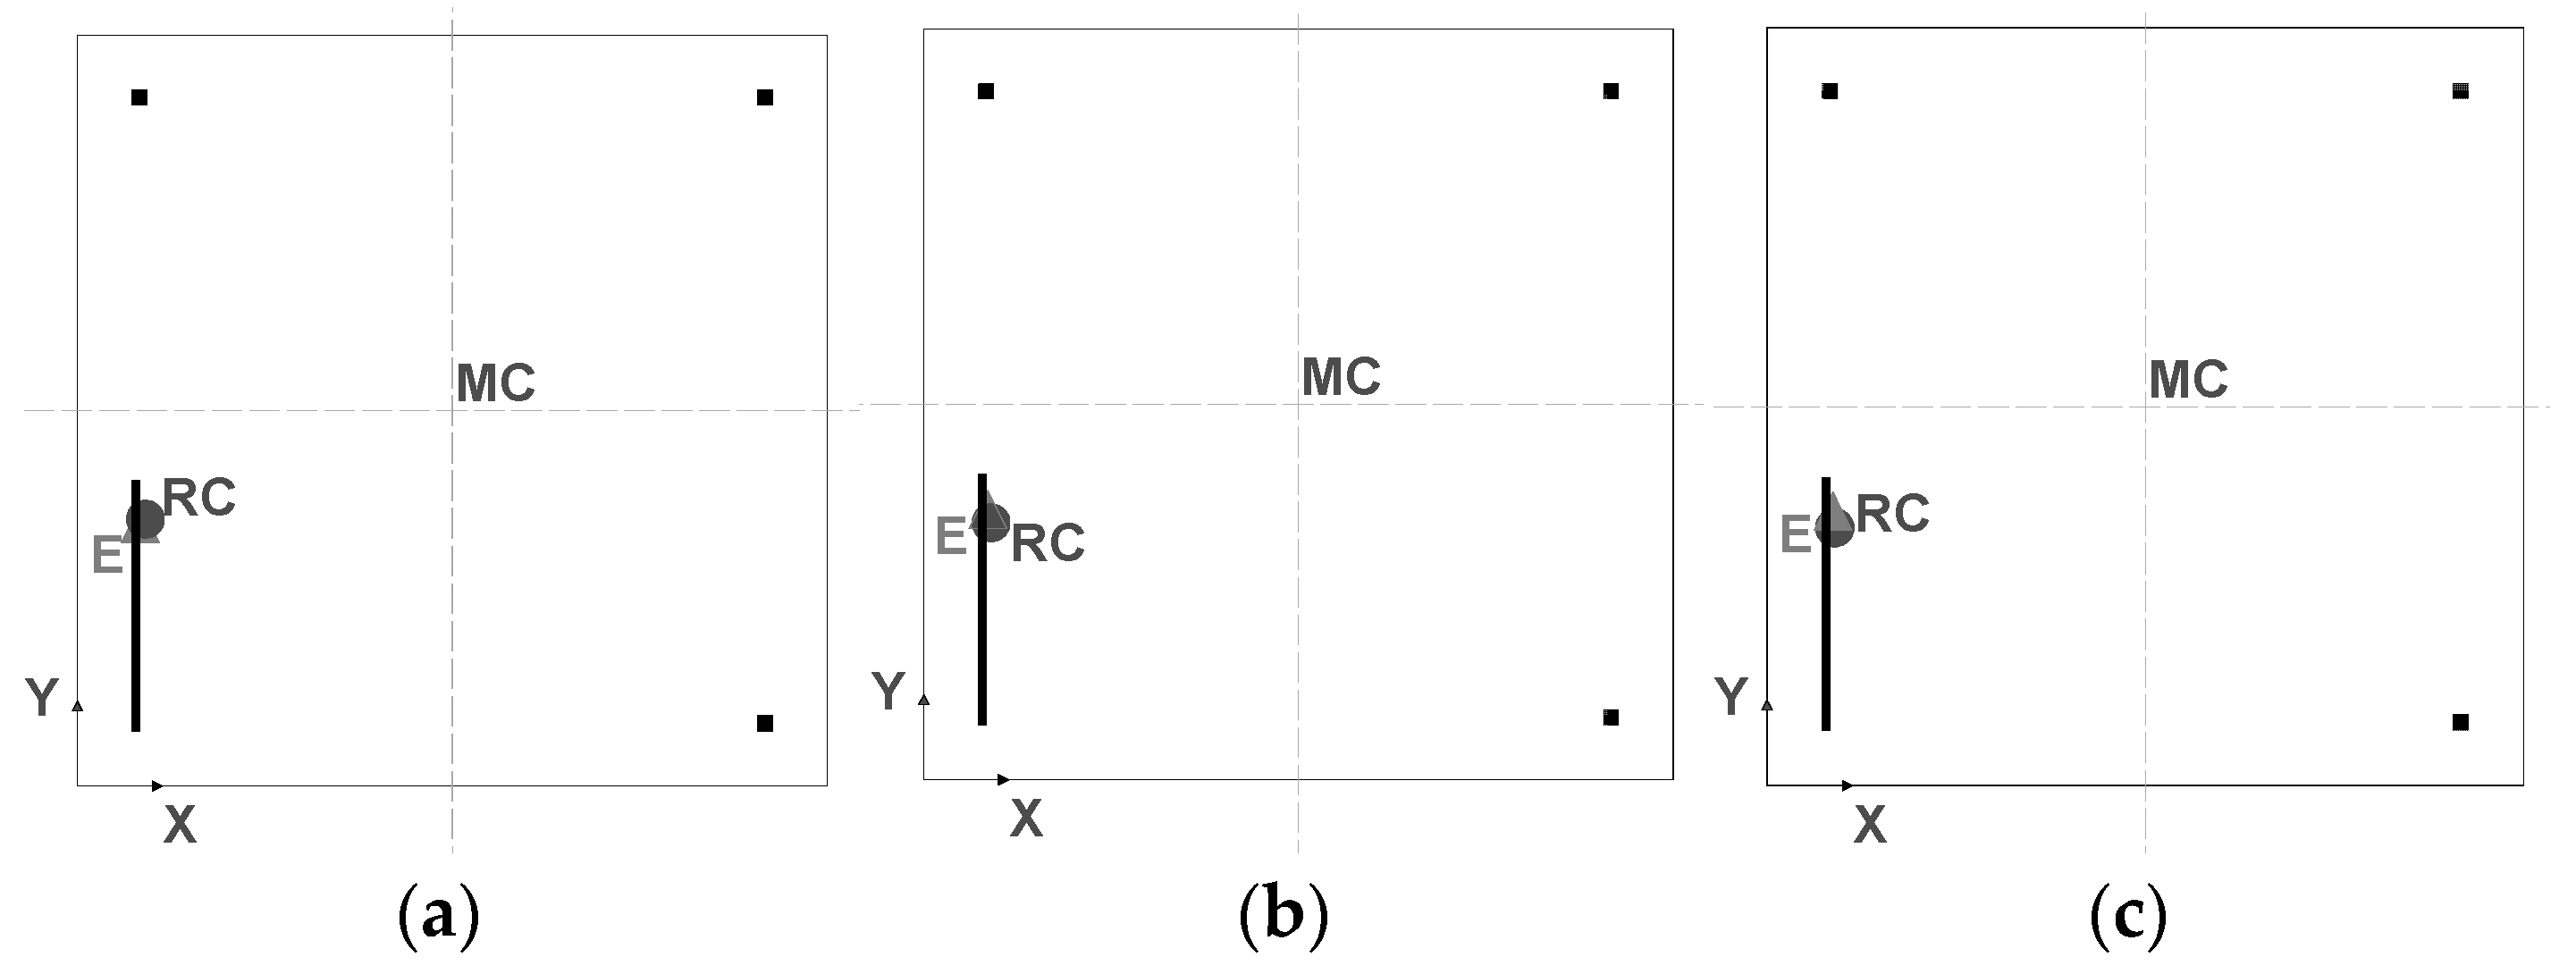
2.5. Rigidity Center Calculation

As previously mentioned, in-plane slab displacements (two displacement values at each floor level) were recorded during the tests. If both displacements of a slab were the same, then rigidity center was at the centroid. Otherwise, rigidity center should be calculated considering the unequal displacements.
The displacements of the columns and shear walls were calculated using the two displacement values obtained at the points close to the corners of each slab (Equation (1)) (Figure 11). As slabs were stiff and assumed to have a rigid diaphragm, linear equation was used. From the displacements obtained, the stiffnesses of the columns and shear walls (Equation (2)) were transformed into shear forces at the centers of the elements (Equation (3)). By taking the centroid of the shear forces, location of the rigidity center was calculated (Equation (4)). In these equations, d z i is the displacement magnitude at the relevant point of the relevant slab, x i is the distance of the relevant point from the reference axis, a and b are the constants, F i is the shear force, k i is the bending stiffness of the relevant element, E i is the modulus of elasticity of the relevant element, I i is the moment of inertia of the relevant element, and L I represents the net height of the relevant element [40].
d z i = a x i + b
k i = 12 E i I i L i 3
F i = k i d z i
R m = k i d z i x i k i d z i

3. Results and Discussion

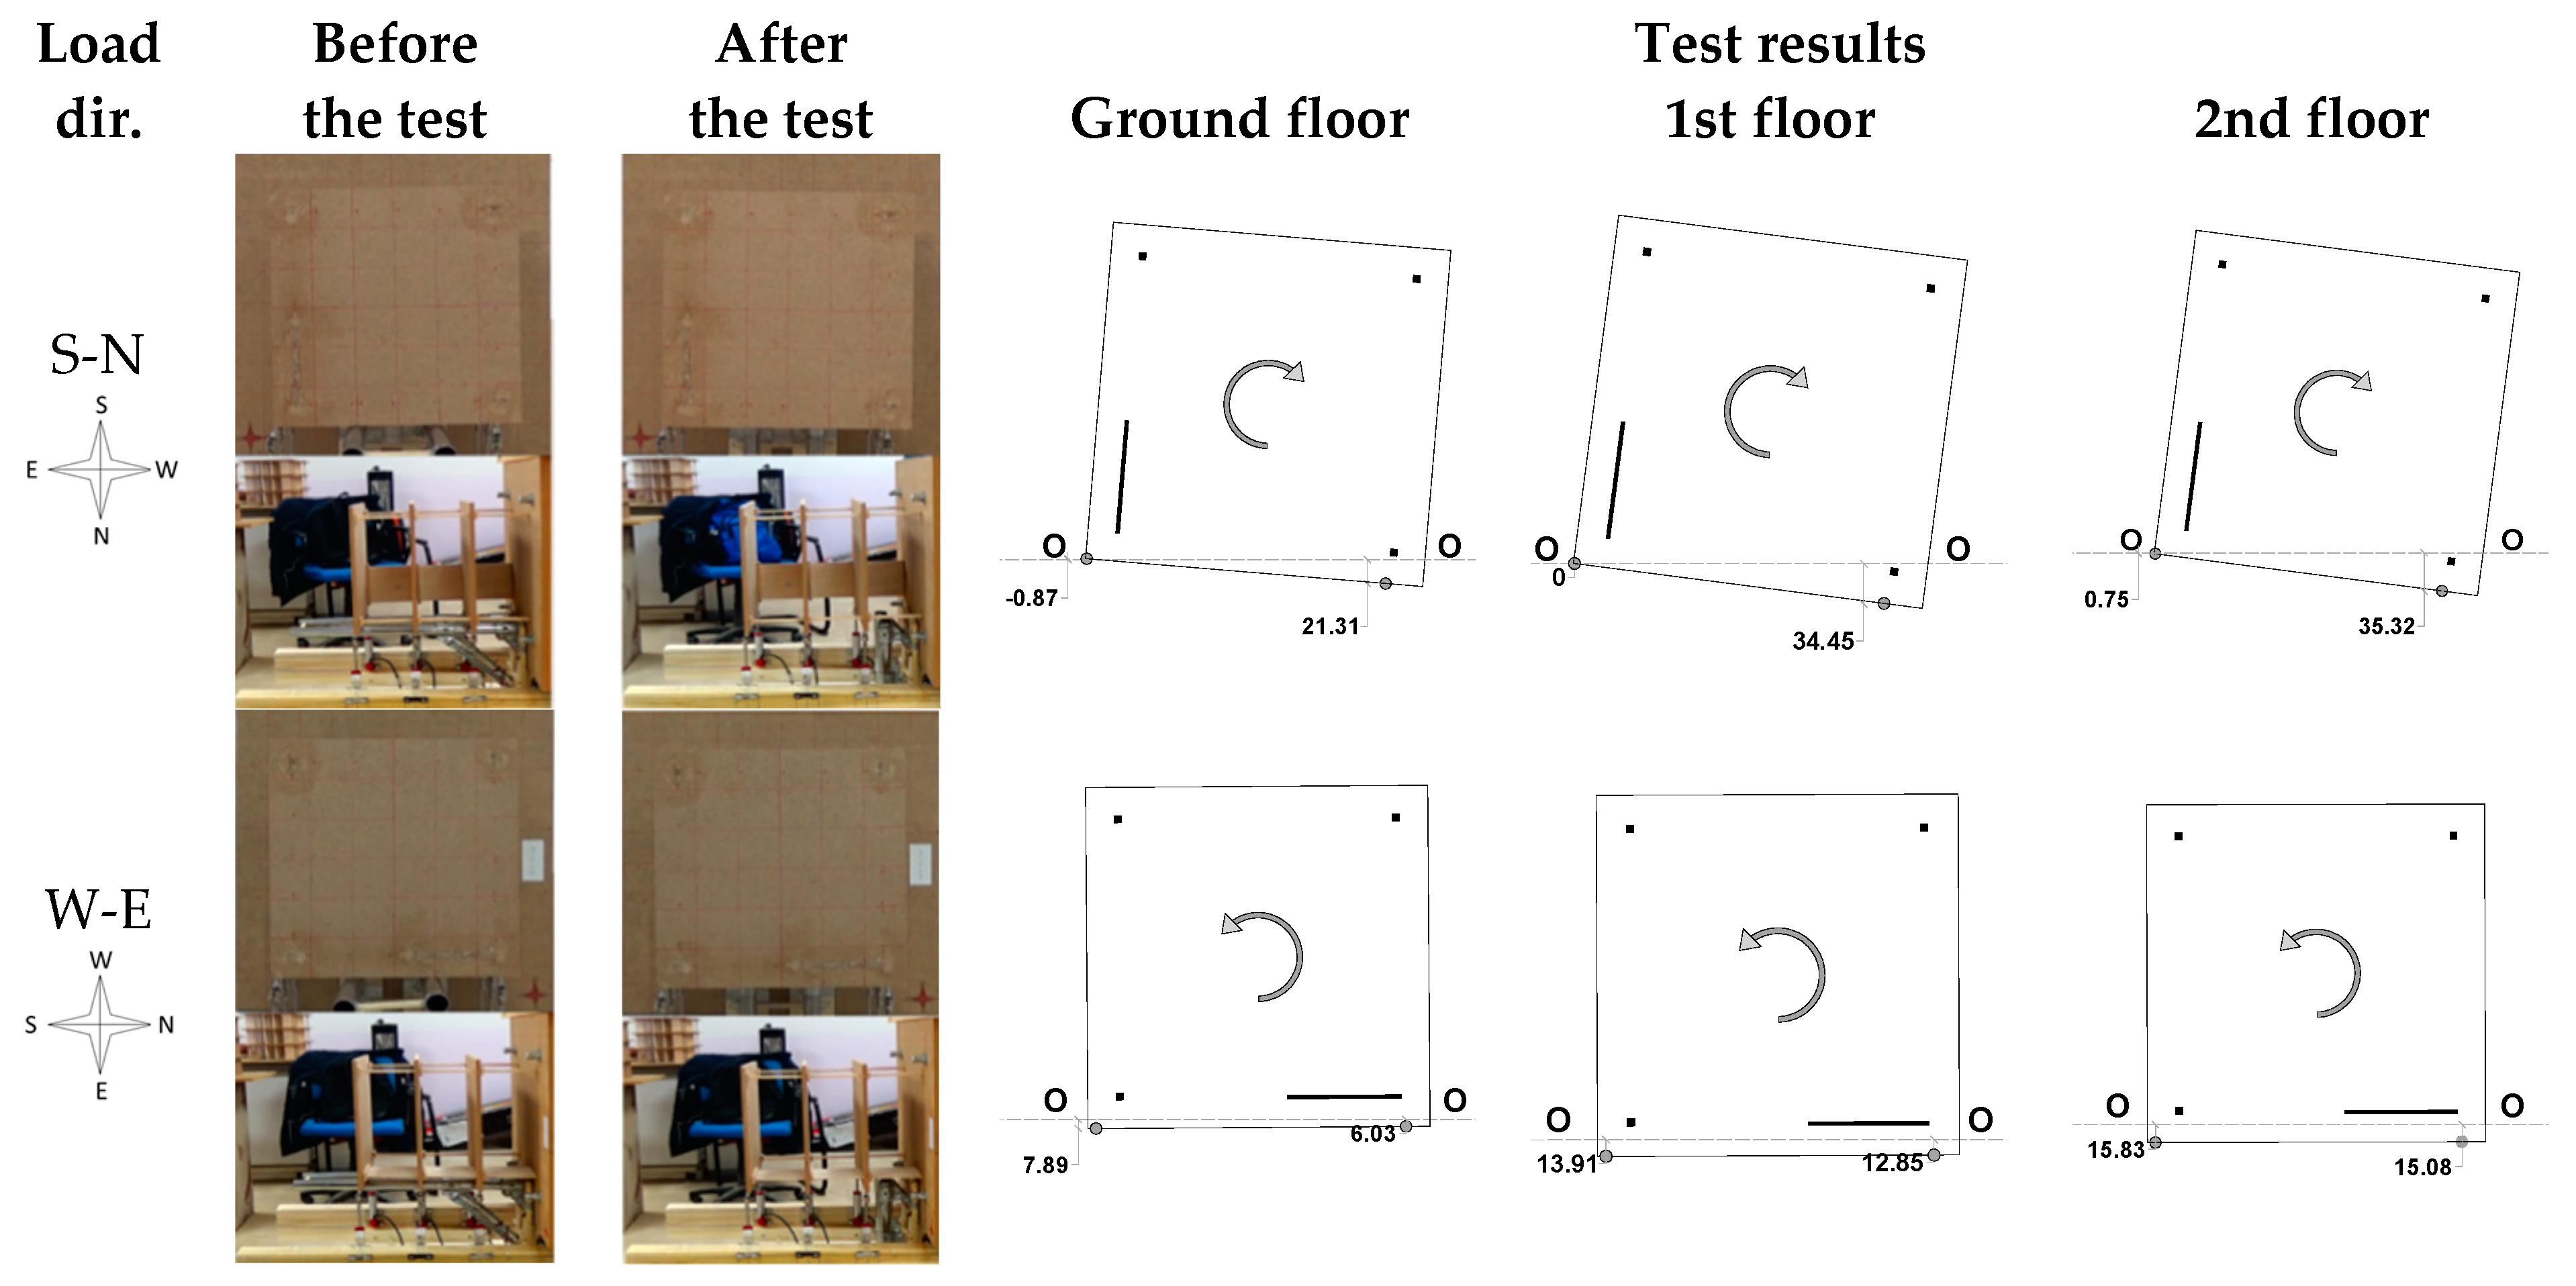
3.1. Interpreting the Results and Details of the Comparisons

Figure 12 shows an example regarding the interpretation of the test results. In the figure, the results for the A2 building are given. Tests were recorded using two video cameras, with one capturing the top floor behavior, while the other took pictures from the side view, as shown in the figure. As the building is rotated 90° and tests were performed considering only the self-weight of the building, all the loads were through the gravitational direction. Therefore, in the figure, S-N indicates the load from the south to the north. The displacements of each floor were recorded using LVDTs, and displacement profiles were drawn for each floor considering each loading direction separately. As seen in Figure 12, the building was loaded in S-N and E-W directions separately. In the S-N direction, as the shear wall at the N-E corner had great lateral stiffness in the in-plane direction, the slabs at each floor level were rotated clockwise, resulting in higher displacements at the N-W corner. However, upon the reduced lateral stiffness of the shear wall in the out-of-plane direction, its effectiveness reduced, and the displacement difference was observed to be small when the building was loaded in the W–E direction. The floor rotation was counterclockwise in this case. In the figures, the O-O line indicates the reference line before loading.
One example regarding the rigidity center calculation is given in Table 5 and details are given in Appendix A. In the table, the member name, including S-W, indicates the shear walls, and C stands for the columns. bx and by are the sectional dimensions of the member in x (horizontal in-plane view) and y (vertical in-plane view) directions. Ii is the moment of inertia corresponding to the loading direction, Ei is the modulus of elasticity of the member, and Li is the story height. The other terms are described above. Using Equations (1)–(4), the rigidity center (RC) of the ground floor considering the S-N direction was calculated as 27.24 mm from the east side of the slab, whereas it was 193.35 mm from the south side. Similar calculations were also performed for the first and second floors.
It is known that there are several analytical approaches to calculate the rigidity center location. Some of them are given below [4,19,21,22,23]:
  • The resultant shear force location of the vertical load-carrying elements in a specific floor can be calculated. Calculations are performed separately for each main axis of the building;
  • The resultant moment of inertia of the vertical load-carrying elements in a specific floor can be taken into account considering both the main axes separately;
  • A unit horizontal load in x and y directions and a unit moment in z direction are applied to any point on the floor level, and the rigidity center is calculated by proportioning the rotations obtained as a result of these loadings.
There is a moment of the inertia-based approach throughout the programs, and the load or displacement distributions are calculated using the stiffness matrices established for the system, and the rigidity center location is calculated as a result of the relationship between these forces and displacements. Although the logic behind the calculations is generally the same, the slightest assumption can affect the solution. Examples of these assumptions include:
  • The shear wall modeling (shell-type or single-frame element);
  • The joint locations of the frame elements (as frame elements are connected from their centers, the beams or columns may be longer in the model, which reduces their stiffness);
  • The modeling of the shear walls as a single-frame member for a quick solution, which further moves the joints away from the real joint locations;
  • The meshing information of the area elements (for fast solutions, sometimes shear walls are not meshed);
  • The missing slab information (for fast solutions, sometimes slabs are not used in the model; instead, their rigid diaphragm properties are only used).
Due to the abovementioned information, the approaches do not calculate the rigidity centers close to each other in asymmetric buildings. The global rigidity center in the floor plane will not be correct; instead, a plasmatic axis in 3D is usually recommended [41,42,43]. As significant differences exist, their reliability was questioned by the authors, and analytical studies were conducted to determine their reliability on full-scale buildings. The results indicated that the third approach given above may be the most reliable one [44].
After determining the rigidity center locations experimentally, all the buildings were 3D-modeled using ETABS. During the 3D modeling of the buildings using ETABS, all the columns were modeled using frame elements with the same size of balsa sticks, and the material properties were determined experimentally considering each column individually. A thin shell was used to model the shear walls, foundation and slabs with the same size and material properties used in the experiments. Uncracked sectional properties were utilized, and dynamic analysis was performed taking only self-weight into account.
The rigidity center locations were found using dynamic analysis to compare the test results with the analytical solutions. In ETABS, a unit horizontal load in x and y directions and a unit moment in z direction were applied to any point on the floor level (Figure 13), and the RC was calculated by proportioning the rotations obtained as a result of these loadings (Equation (5)). In the equation, x r and y r show the RC location in x and y directions, respectively, from the reference axis; and R z x , R z y and R z z are the rotations of the relevant node in x, y and z directions, respectively [23]:
x r = R z y R z z ,   y r = R z x R z z
The RCs calculated from the test results were marked on each floor, as shown in Figure 13, and they were compared to the ones obtained from the 3D modeling in ETABS (E). In addition to the RCs, the mass center (MC) was also marked on the floor plans. In Table 6, the x and y distances from the reference axes ( x r , y r ) were given comparatively, and the difference between the results was calculated according to Equation (6) [45]. It can be seen for A2 that E and RC are almost the same, and the maximum difference is 1.44%, meaning that E can predict the rigidity center accurately.
All of the other buildings are discussed accordingly in the sections below. Only the deformations found in the tests (as in Figure 12), the RCs found from the tests and ETABS (as in Figure 14) and their numerical comparison (as in Table 6) are provided below to shorten the paper.
x r = x r _ t e s t x r _ E T A B S L x 100 ,   y r = y r _ t e s t y r _ E T A B S L y 100

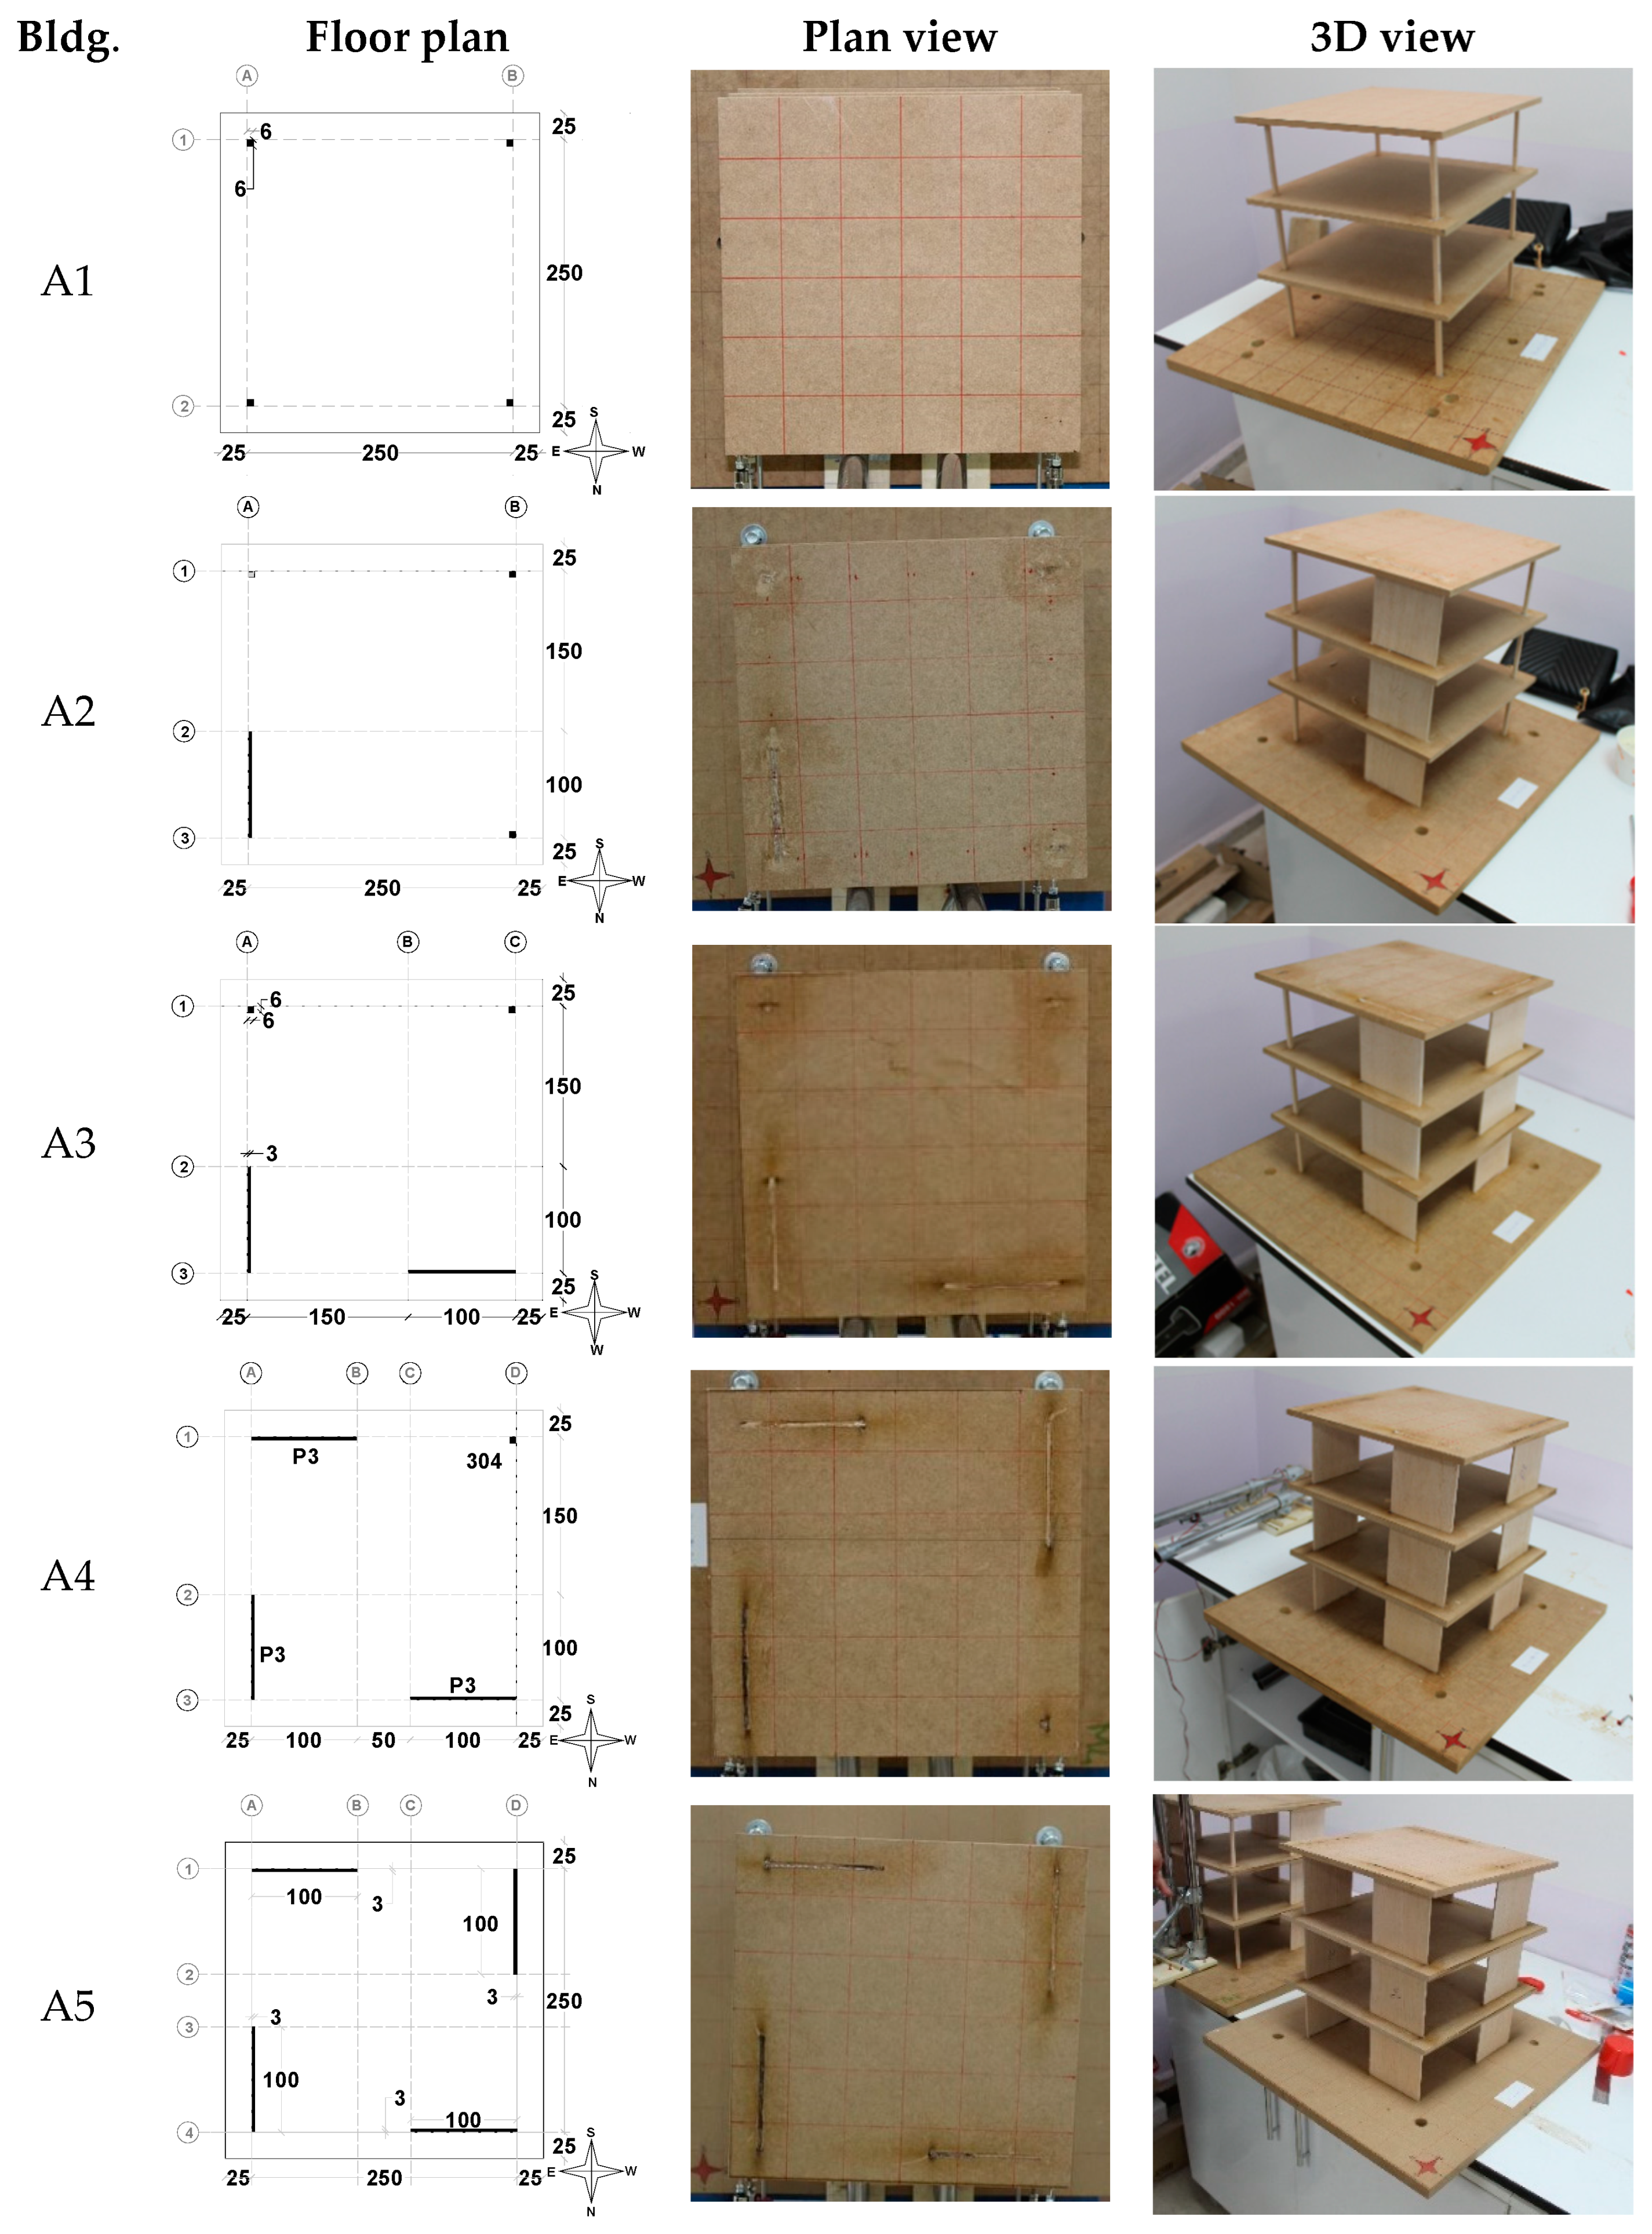
3.2. Results of Group A Buildings

As previously mentioned, Group A buildings had only four vertical load-carrying members placed at each corner of the square floors. Figure 15 reveals the displacement profiles recorded after the tests. Although A1 was a symmetrical building, significant torsion was unexpectedly seen when it was loaded in the S-N direction. The degree of torsion was found to reduce when the building was loaded in the W-E direction. The reason can be attributed to the difference in the mechanical properties of the balsa sticks and the manufacturing quality of the model, as this model was the first one to be tested. Balsa contains many voids, and its mechanical properties change due to temperature changes and time. Although the mechanical properties were recorded before the tests, some undetermined situations may exist. A2 had a shear wall at the north-east corner, and clear torsion was seen when it was loaded in the S-N direction. When the building was rotated 90° and loaded in the W-E direction, with the decrease in the lateral stiffness of the shear wall, the degree of torsion reduced. Building A3 rotated clockwise when the load was applied in the S-N direction and counterclockwise when loaded in the W-E direction, depending on the location of the shear walls on the load direction. Having three shear walls, A4 rotated clockwise because of the one shear wall aligned parallel to the load. When the building was rotated 90°, two strong shear walls resisted the load, and the deformations reduced significantly, and almost equal displacements were recorded on each floor. As for A1, A5 was also symmetrically planned, but torsion was observed when the building was loaded in either way. Therefore, it can be said that shear walls play an important role in reducing deformations and controlling torsion. If shear walls are planned reduce the torsion and to carry a significant amount of the lateral loads, they must be symmetrically placed in the plan or their load-carrying property balanced by another member in the same direction of loading. Otherwise, asymmetrical placement and differences in material properties and construction quality will affect the lateral behavior of buildings and may create serious torsion.
From the recorded values of displacement and using the technique given in Equations (1)–(4), the rigidity centers of the buildings (shown as RCs) were calculated and given comparatively considering the results of the ETABS models (shown as E) in Figure 15, and the numerical values for only the second floor are summarized in Table 7. In the figure, the mass center is also illustrated to understand the distance between the MC and RC.
As can be seen from the Figure 16 and Table 7, in all buildings except A5, the RCs calculated from the tests were almost compatible with the ones found from ETABS. In the symmetrical A1 building, the RC was found close to the MC as expected; in A2, the RC was on the single shear wall; and in A3, the RC was found at the conjunction of the shear wall axis. As A4 had two shear walls with equal distance to the MC, the RC was found to be between those shear walls close to the single shear wall aligned differently. In A5, although the building had two-way symmetry, test result was not compatible with the analytical result due to the change in the mechanical properties of the balsa plates and the unexpected problems in manufacturing. However, in general, it can be said that the test results were consistent with the results found from ETABS. The difference was almost 4% (except for A5).

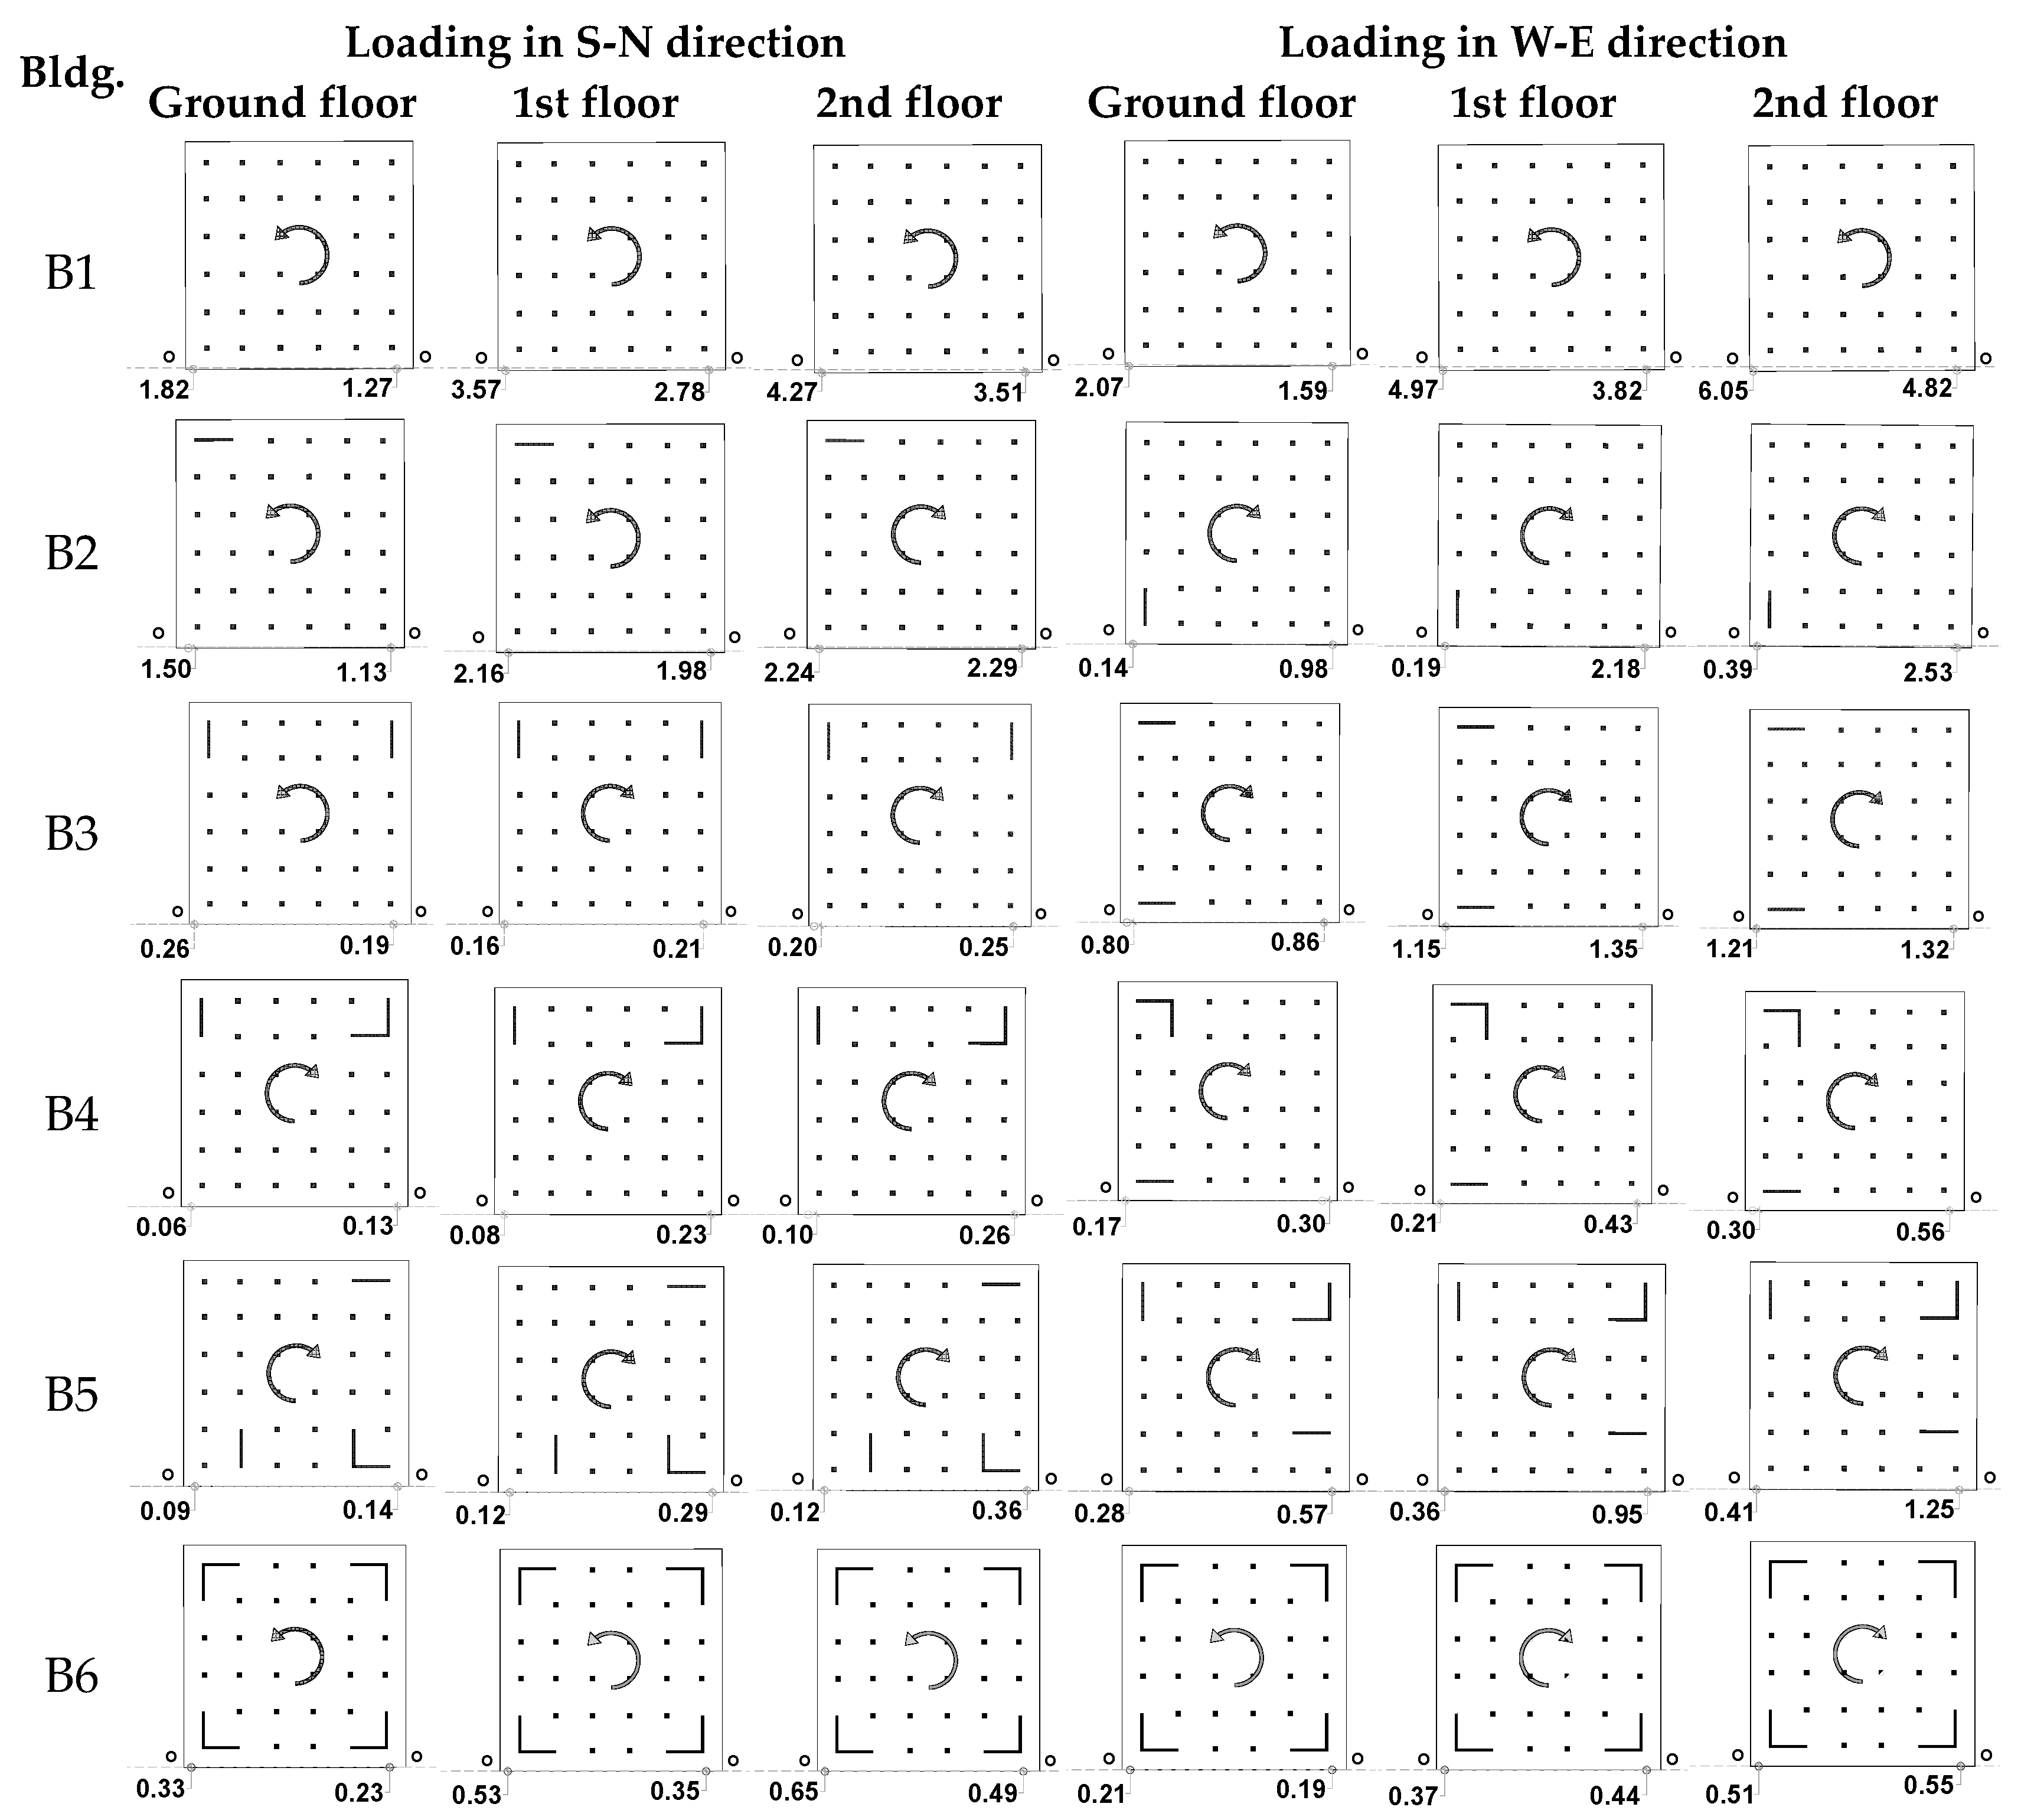
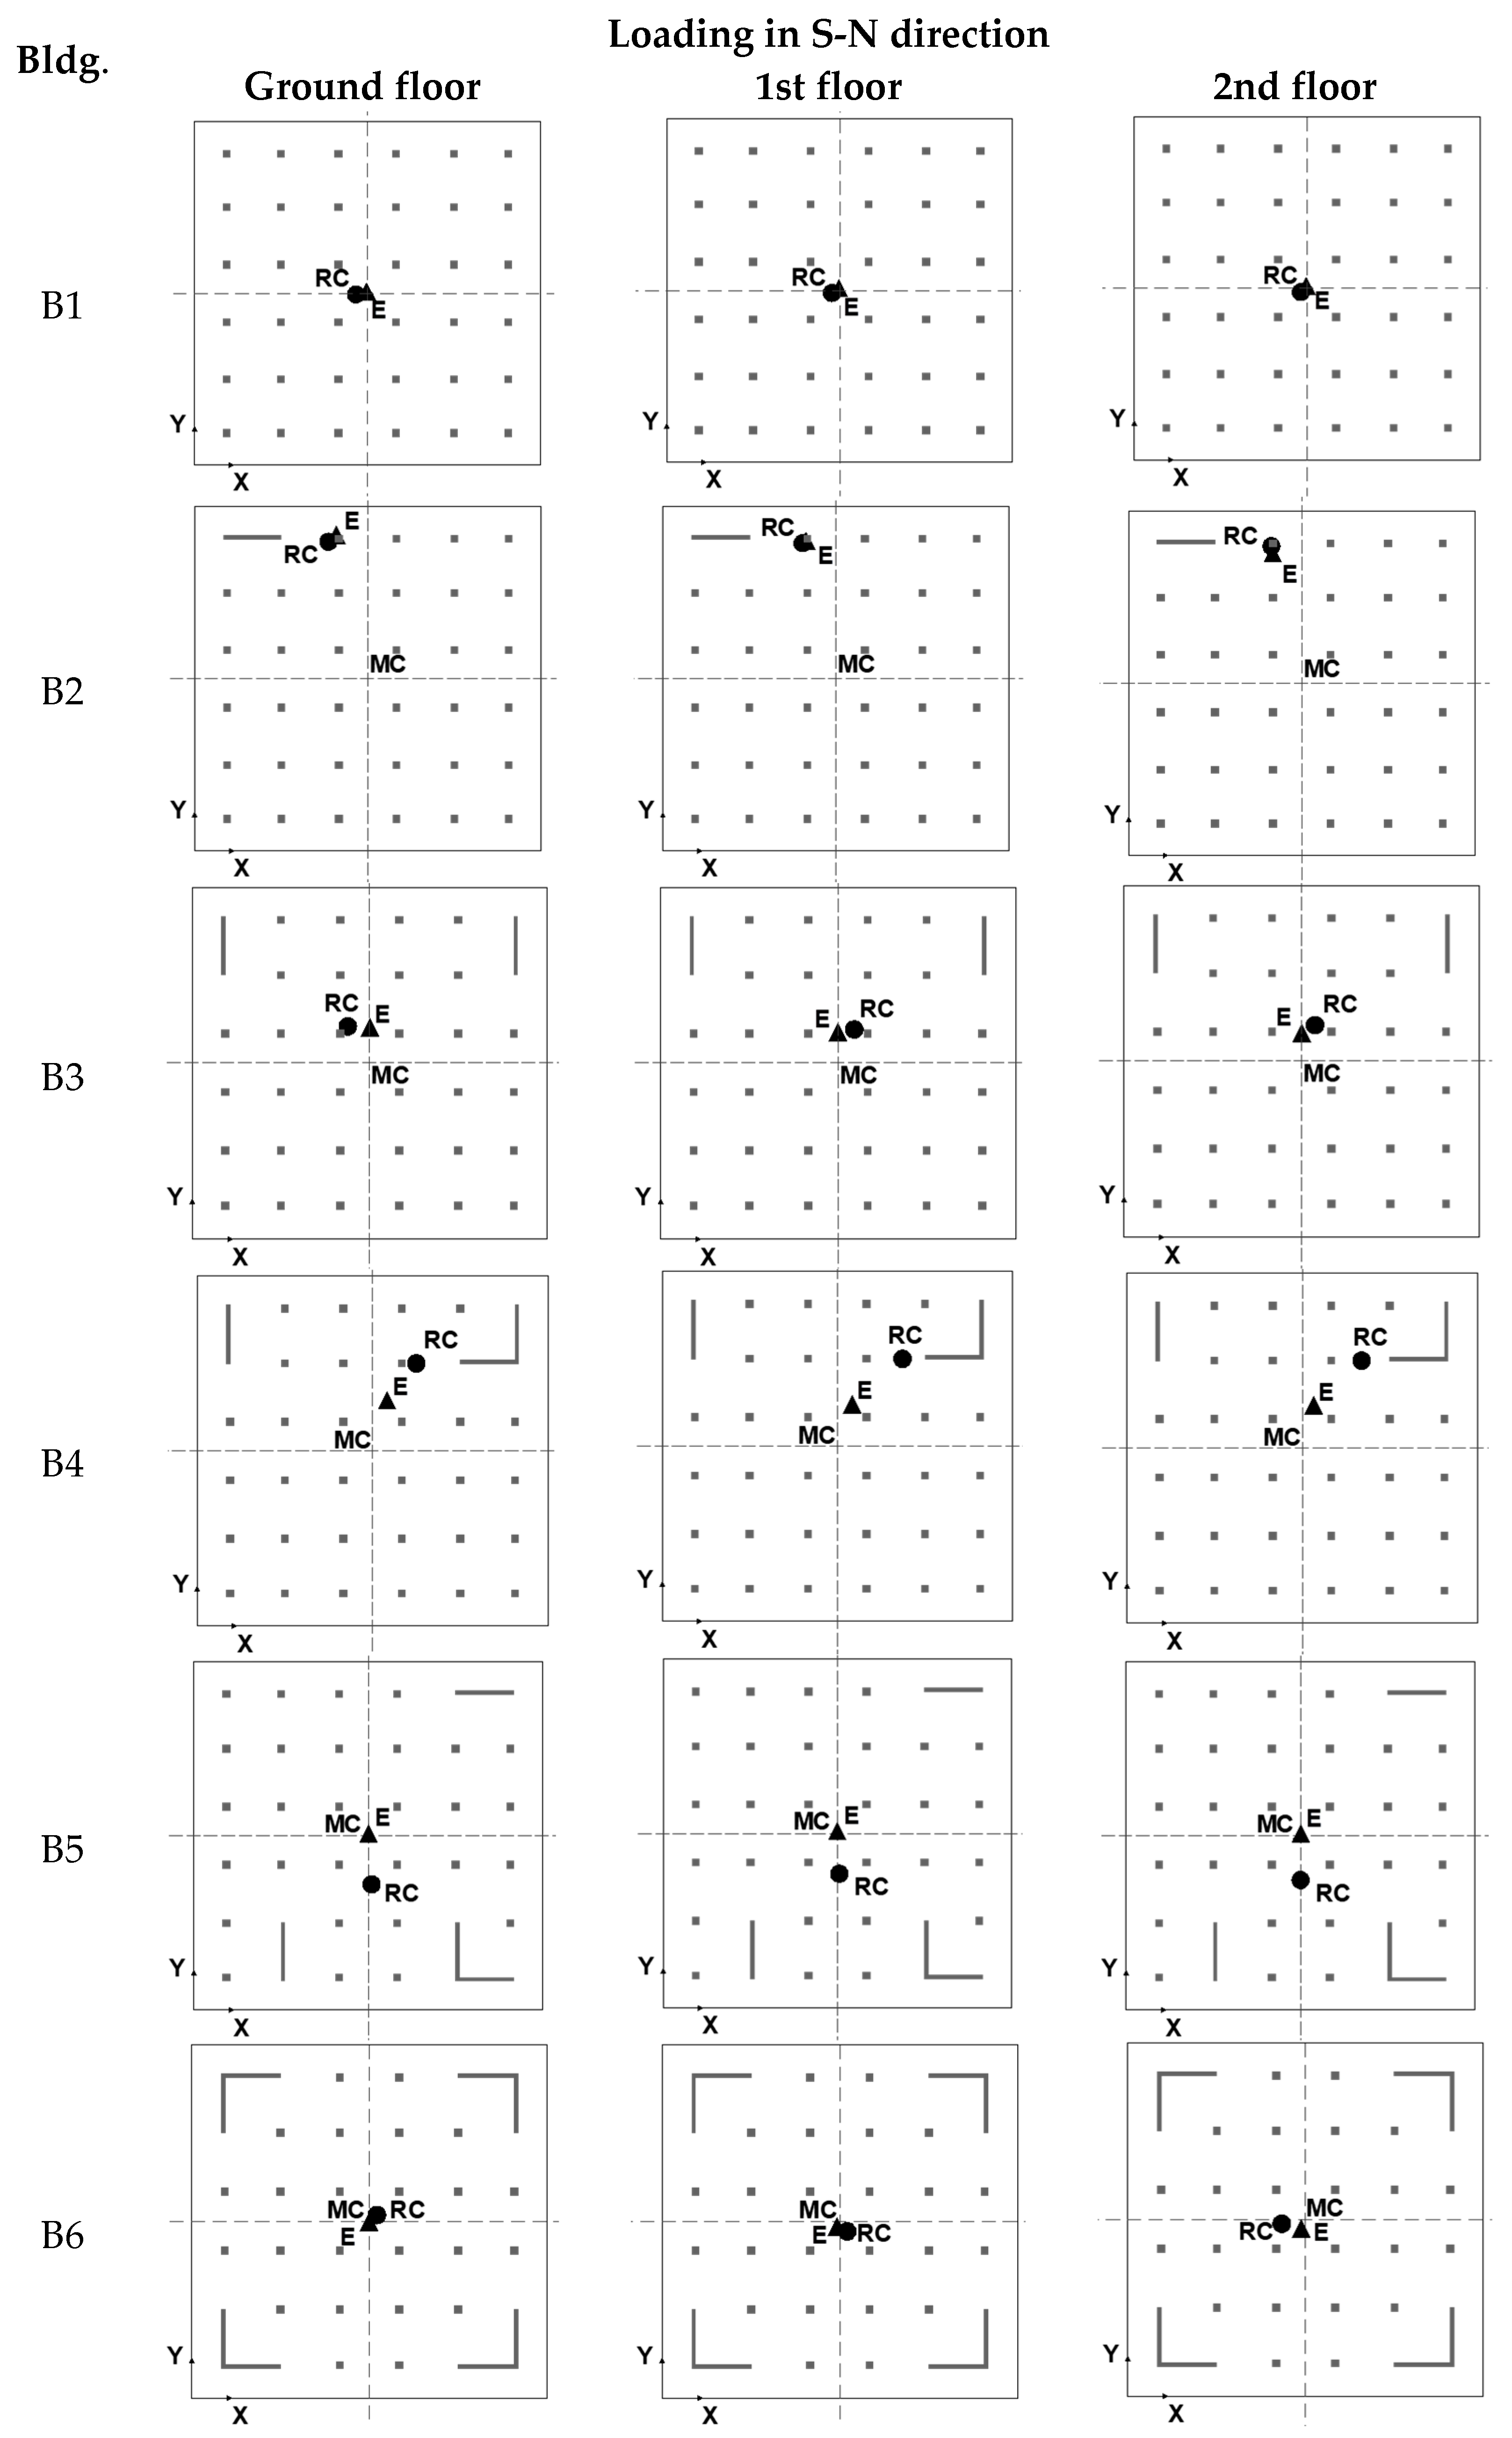
3.3. Results of Group B Buildings

Group B buildings had equally spaced columns and shear walls (Figure 17). Symmetrically planned B1 and B6 had torsion due to the reasons described above. A difference in the modulus of elasticity resulted in unintentional torsion. However, clear torsion was visible in the buildings with asymmetrically placed shear walls. In B2, B4 and B5, the torsion was significant, and the buildings rotated on the opposite side of the shear walls. In B3, as the building had a symmetrically placed shear wall in the N-S direction, no considerable torsion was visible when the building was loaded in the S-N direction. It was again seen that shear walls influenced the direction of the rotation and resulted in torsion in the buildings.
Figure 18 shows the rigidity center locations of Group B buildings comparatively. The rigidity center locations for the top story are summarized in Table 8. As seen from Figure 18, in the symmetrical B1 and B6 buildings, the rigidity centers from the tests (RCs) were almost identical to the ones found from ETABS (E). The difference in these buildings was at a maximum of 4%. As for B2, because of the asymmetrically placed shear wall, the RC was found far from the mass center, and it was close to the shear wall corner. In B3, as the shear walls had symmetry in the N-S direction, the RC was on the symmetry line but close to the shear walls. The difference between the RC and E were at a maximum of 4.87%. In B4 and B5, the RC and E differed too much compared to the others. It was at a maximum of 13.84% in B4 and 12.61 in B5. In B4, although the RC was found to be close to the corner of the shaped shear wall, E calculated it close to the mass center. However, in B5, although the rigidity center found from E was at the mass center, the test revealed that it was on the N-S symmetry axis but close to the north side. Therefore, it can be said that as the shear walls were placed symmetrically in either axis, E calculated the rigidity center on the symmetry line, considering the shear walls mainly in the strong axis without taking into account the global shear wall locations. However, in the tests, it was found that the global shear wall locations may also be important because a significant difference was seen in those buildings.

3.4. Results of Group C Buildings

Group C buildings had rectangular floor plans. C1 had symmetrical shear walls, and little torsion was seen. C2 had symmetrical shear walls in the N-S direction, and little or no torsion was observed in the N-S direction, but significant torsion in the W-E direction was visible. Maximum displacement was at the opposite side of the shear walls, resulting in clockwise rotation. In C3 and C4, torsion was seen depending on the strong axis of the shear walls (Figure 19).
Figure 20 indicates the rigidity center locations comparatively, and Table 9 summarizes the results of the second floor comparatively. In the symmetrical C1 building, the RC and E were close to each other, and the maximum difference was 2.55%. In C4, the maximum difference was 1.4%, indicating that the RC and E were almost the same. They were again close to each other in the other buildings, but the difference was at a maximum of 7.85% in C2 and 6.56% in C3. In C2, the RC was calculated at the symmetry line of the shear walls, whereas E found the rigidity center near the east corner of the shear wall located in the west. In C3, although the RC and E were close to each other on the ground and first floor, they differed in the second floor and difference was a bit higher when compared to other buildings.

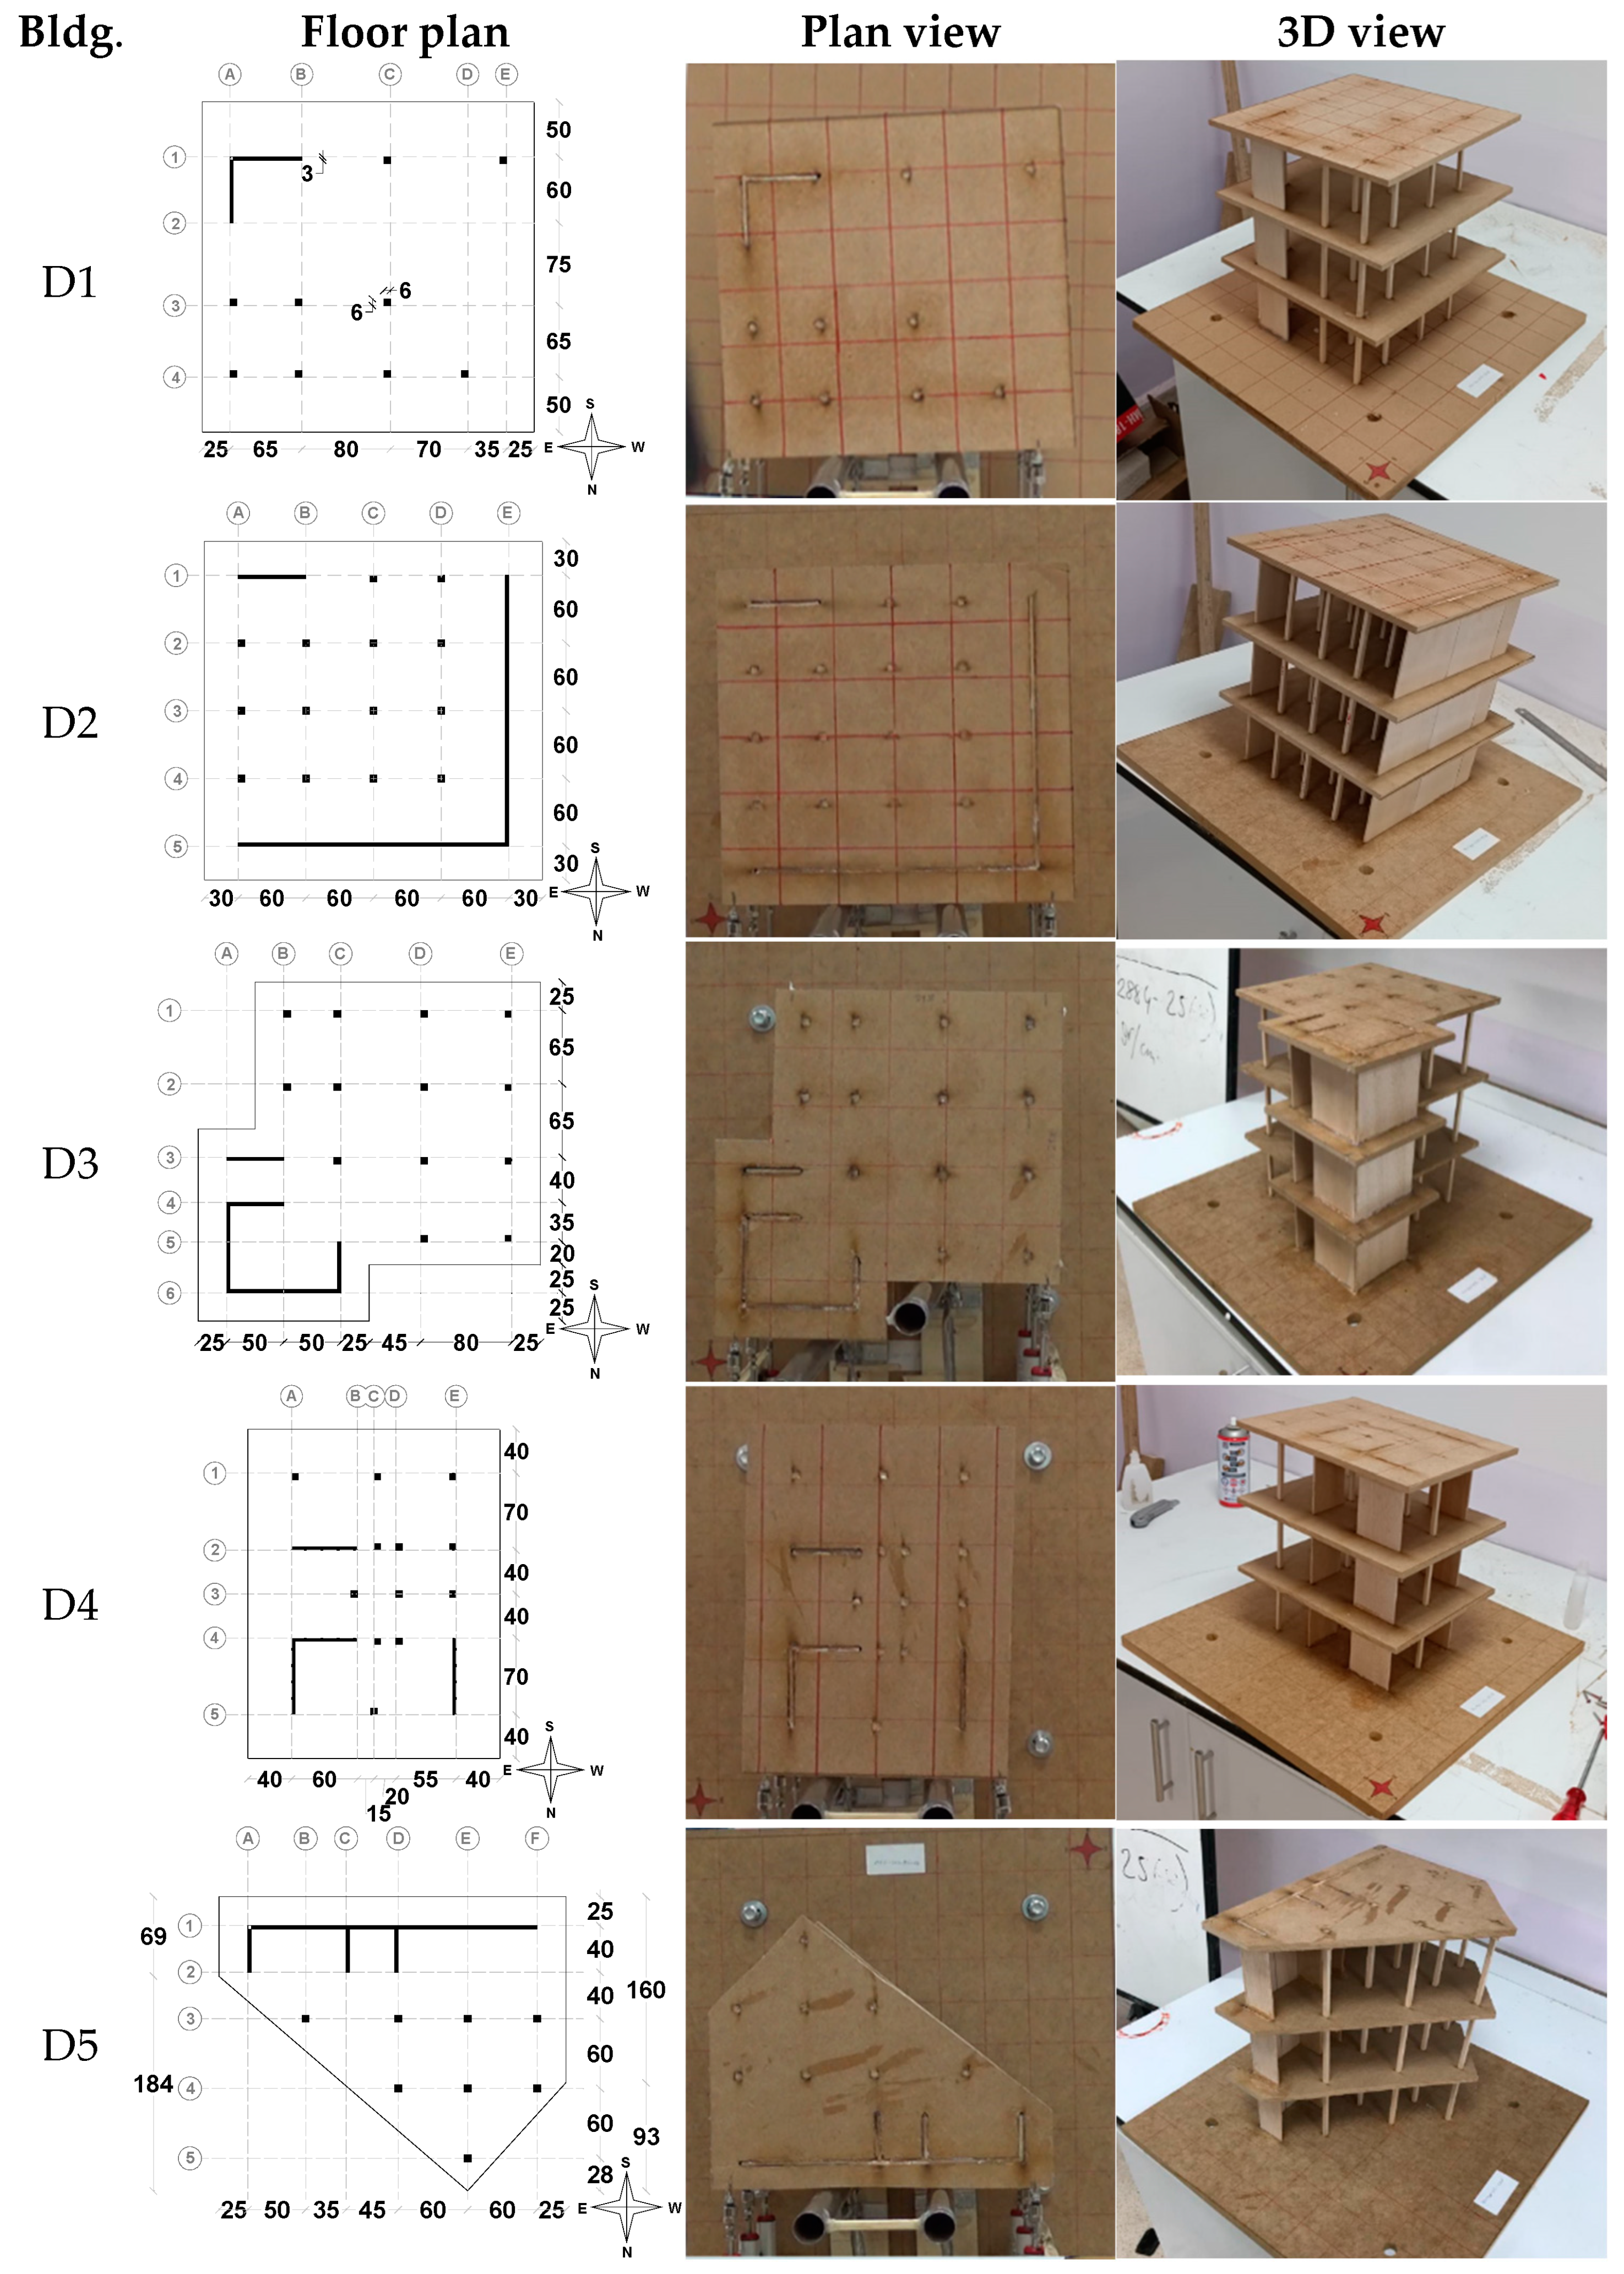
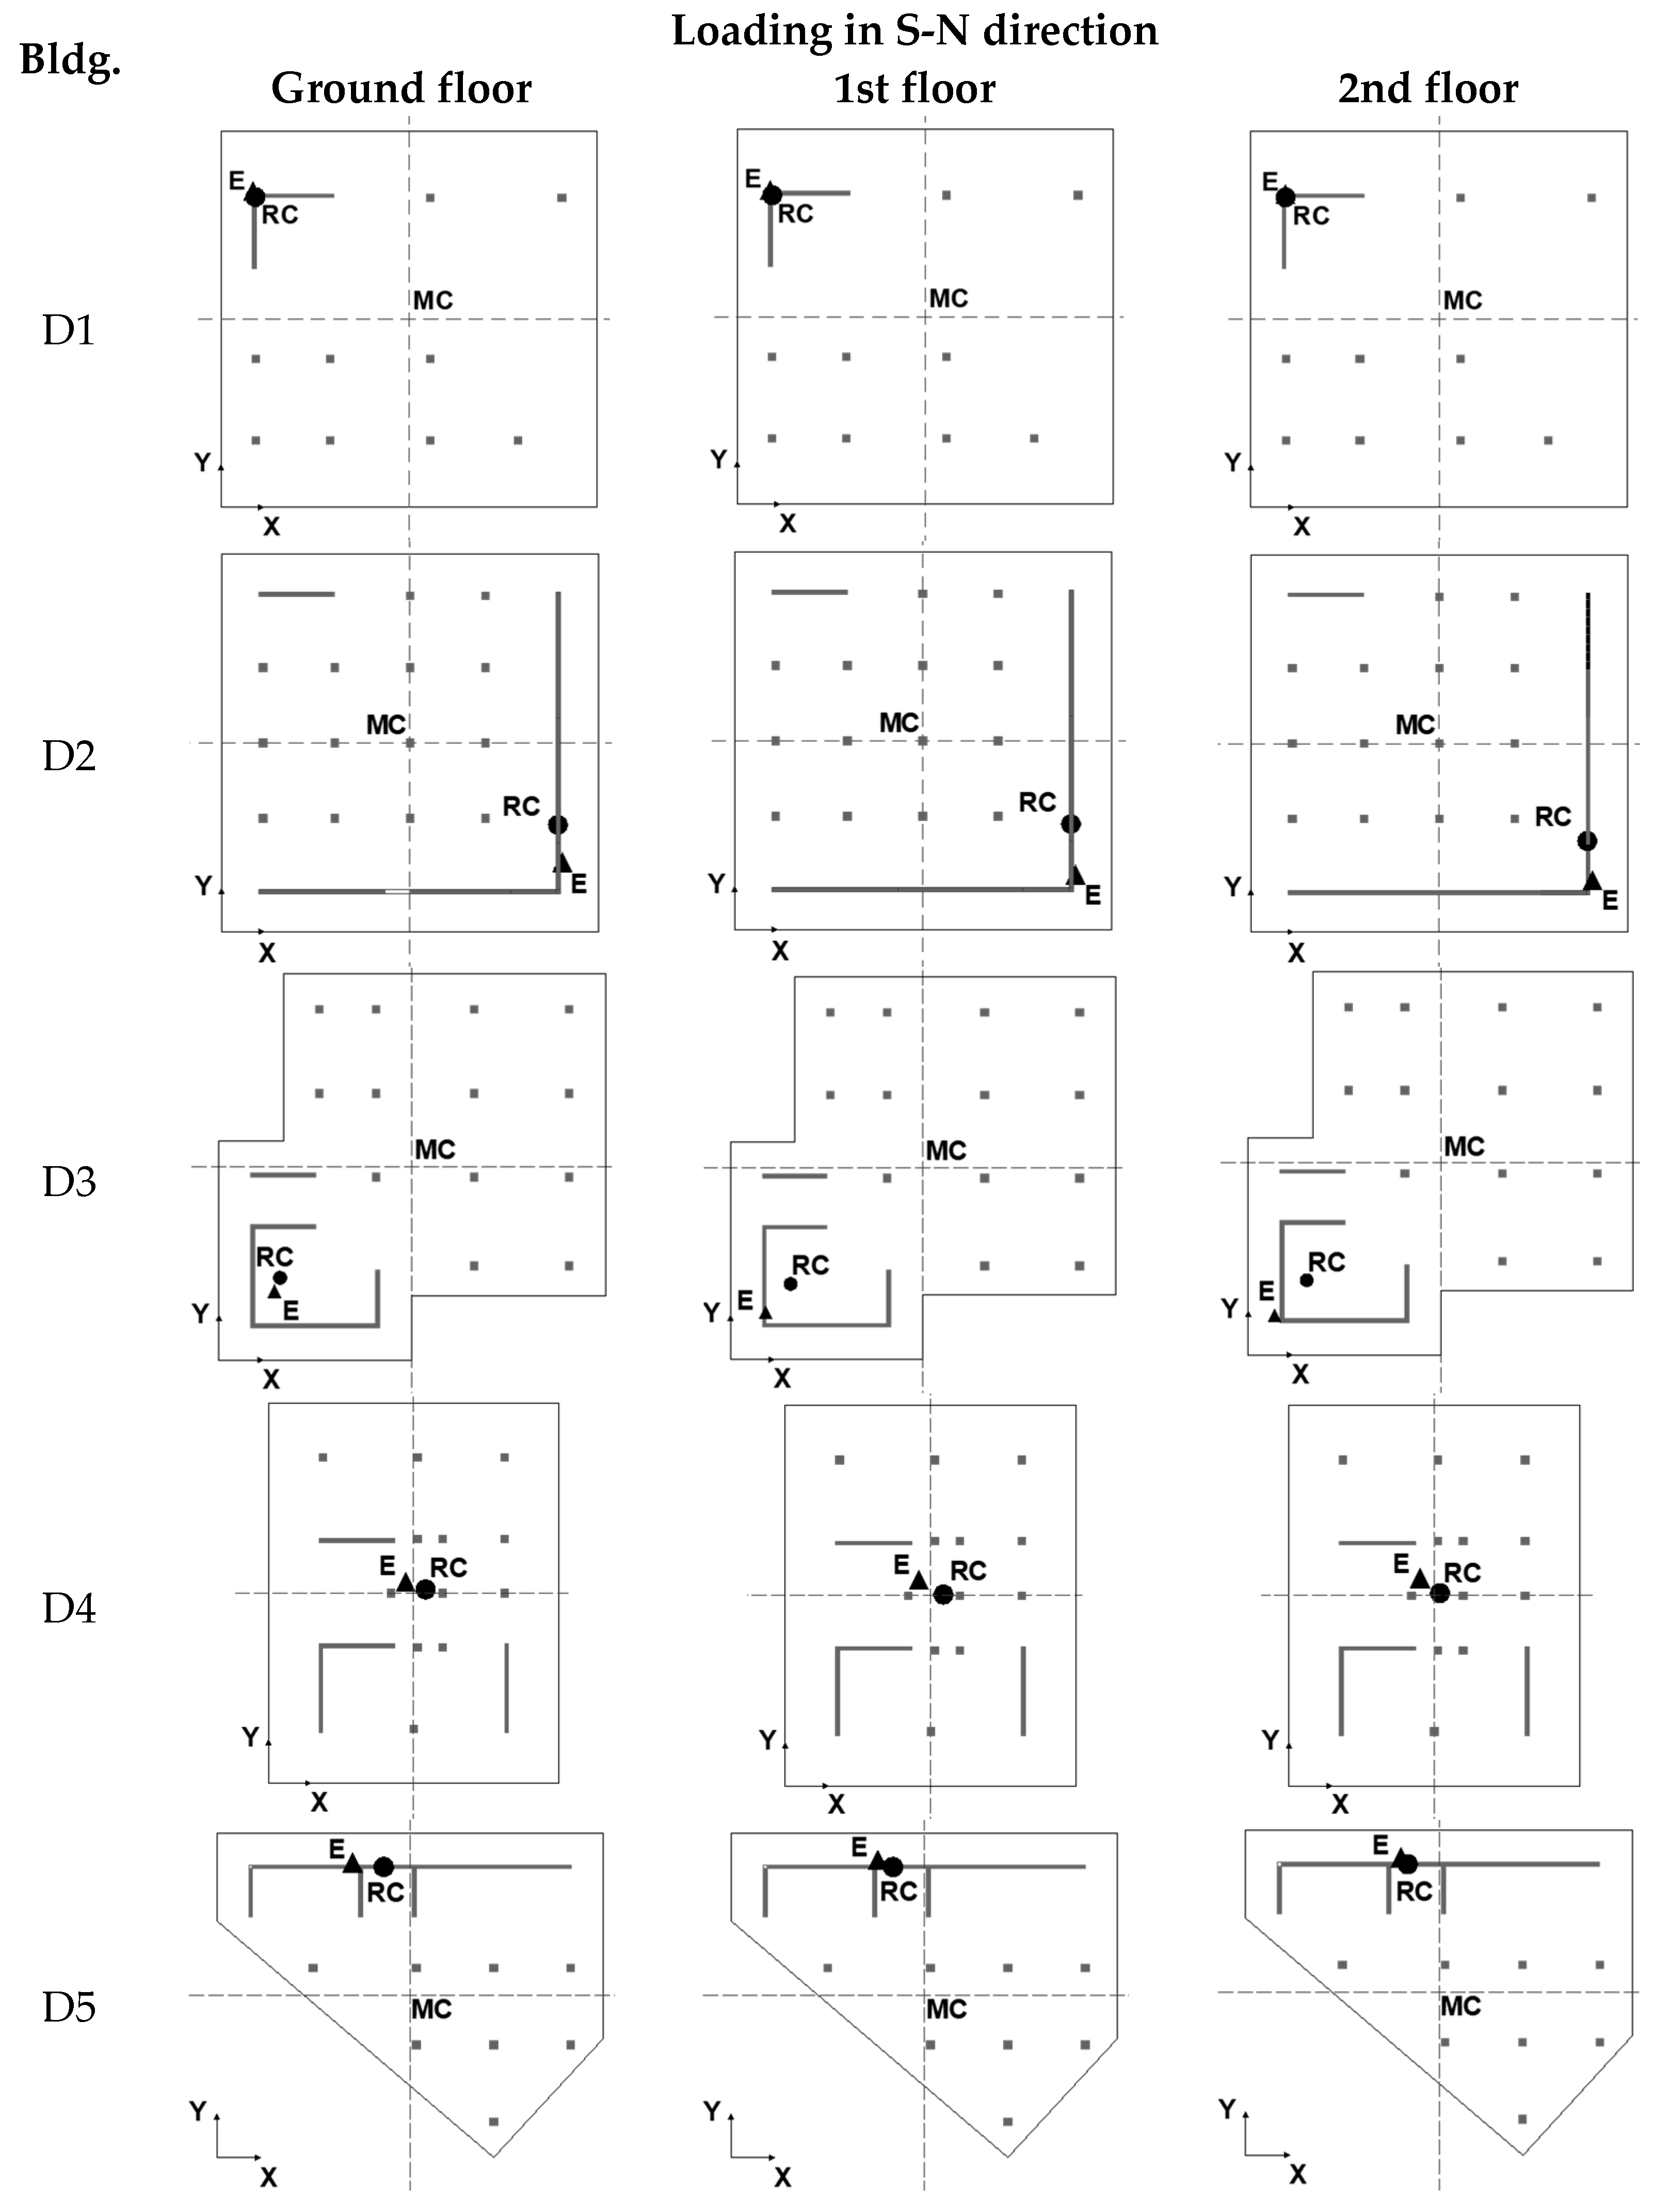
3.5. Results of Group D Buildings

Figure 21 shows the test results of the scaled and revised versions of real buildings. D1 with an L-shaped shear wall at the south-east corner resulted in significant torsion in a clockwise direction when loaded in S-N and W-E directions. D2 with a huge L-shaped shear wall again resulted in significant torsion, and the torsion was in a counterclockwise direction. D3 and D4 had both asymmetrically placed shear walls and floor plans, which ended up exhibiting considerable torsion in the opposite direction of the strong axis of the shear walls. Although D4 had shear walls located symmetrically in S-N and W-E directions separately, torsion was observed, and this was attributed to the global locations of the shear walls that were greater in number in the north-east part of the plan.
Figure 22 reveals the comparative results of the RC and E, and Table 10 summarizes the results for the second floor. As can be seen, in the square-planned D1 building and the trapezoidal-planned D5 building, the test results were almost equal to the results of ETABS. However, in D2, ETABS calculated the rigidity center at the junction of the huge L-shaped shear wall, but in the test results, the rigidity center was found again on the shear wall aligned parallel to the S-N axis; this again was shifted to the south because of the shear wall at the south-east corner. The same conclusion can be drawn in D3 because E was at the corner of the huge shear wall, whereas it shifted through to the south-east due to the additional shear walls in this direction. It is interesting that although the N-E part of D4 had more shear walls, both the test results and ETABS calculated rigidity close to the mass center, as the shear walls were symmetrical in a separate axis.

4. Conclusions

The location of the rigidity center in a reinforced concrete building should be calculated realistically as it directly affects the additional shear forces that will affect the vertical structural elements, such as columns and shears. In this study, a total of 20 scaled and revised buildings in 4 groups were constructed using balsa wood and tested under self-weight, and the rigidity center of each building was found from the displacement values recorded during the tests. The following conclusions can be drawn from the results of this study:
  • The rigidity centers of reinforced concrete buildings can be found from simple tests using any material that has almost uniform mechanical properties;
  • The only problem in the test was seen in the different mechanical properties of the vertical load-carrying members. As the stiffness of an individual member influences the rigidity center of a building, any change in the stiffness (in the case of this study, it was the modulus of elasticity of balsa wood) will affect the rigidity center location;
  • Balsa sticks and balsa plates, being light in weight, were found to be convenient materials for such a test as they allow large displacements due to their low modulus of elasticity. Large displacements were found to be beneficial during the tests to interpret the results clearly;
  • The rigidity center of a floor plan can be found from the displacements of the vertical load-carrying members caused from the related self-weight or any additional loading. These displacements should be multiplied by the stiffness of the member to add information on the modulus of elasticity and moment of inertia of the member;
  • The test results were compared with the results found from the 3D modeling performed in ETABS, which calculates the rigidity center considering the displacement demands related to the unit loading in the plan directions and the unit rotation in the z axis. Identical rigidity center locations were calculated, indicating that reliable results can be taken from the tests of frame buildings and frame–shear wall buildings;
  • Symmetrically planned buildings were observed to have some rotations upon loading, which may be attributed to the change in mechanical properties;
  • It has been observed that structural analysis programs calculate the rigidity center separately for the x and y directions of the building and can calculate the rigidity center in the middle of the floor plan in the case of a symmetrical layout on both axes. However, tests revealed that rigidity centers were close to the regions where there were more shear walls.
As the correct calculation of the rigidity center location is directly related to seismic performance, it has been determined that reinforced concrete building models should be created in a way that is close to reality, important assumptions should be avoided, the element nodal points should be located close to their real positions, and loadings must be applied to the elements correctly.

Author Contributions

Conceptualization: F.K. and B.E.; methodology, F.K. and B.E.; software, E.A.; validation, E.A., F.K. and B.E.; formal analysis, E.A.; investigation, E.A., F.K. and B.E.; resources, F.K., B.E. and E.A.; data curation, E.A., F.K. and B.E.; writing—original draft preparation, F.K. and B.E.; writing—review and editing, F.K. and B.E.; visualization, E.A. and B.E.; supervision, F.K.; project administration, F.K.; funding acquisition, F.K. All authors have read and agreed to the published version of the manuscript.

Funding

This research was funded by Van Yuzuncu Yil University Scientific Research Projects Department under Grant No. FYL-2022-9987.

Institutional Review Board Statement

Not applicable.

Informed Consent Statement

Not applicable.

Data Availability Statement

Not applicable.

Conflicts of Interest

The authors declare no conflict of interest.

Appendix A

An example of how the rigidity center is calculated from the experimental results is given below:
  • Displacements from the experiment are calculated (Figure A1);
  • Displacements of each column considering the linear interpolation of the displacements found from the experiment are calculated. In other words, as displacements measured at each end of the slab are recorded, displacements at the column locations should be calculated. To achieve this, owing to the rigid diaphragm of the slabs, a linear equation can be obtained using a line from one displacement to the other one, and from this linear equation, displacements of the columns are calculated (Columns 7 and 8 of Table A1, Equation (1));
  • The stiffness of each column is calculated. As each column has a different modulus of elasticity (Column 5 of Table A1), they have different stiffnesses (Column 9 of Table A1, Equation (2));
  • The shear forces of each column are calculated (Column 10 of Table A1, Equation (3));
  • The rigidity center of the building is calculated using Equation (4).
Figure A1. Displacements from the experiment.
Applsci 13 07452 g0a1
Table A1. Detailed calculation of the rigidity center.
ColumnSectionI,
mm4
E,
MPa
L,
mm
x i ,
mm
d z i ,
mm
(Equation (1))
k i ,
N/mm
(Equation (2))
F i
(Equation (3))
k i d z i x i RC,
mm
(Equation (4))
bx,
mm
by,
mm
16610828381002857.863.682135959162.3
266108283010027271.033.6726070,855
36610828381002857.863.682135959
466108283010027271.033.6726070,855

References

  1. Saatcioglu, M.; Mitchell, D.; Tinawi, R.; Gardner, N.J.; Gillies, A.G.; Ghobarah, A.; Anderson, D.L.; Lau, D. The August 17, 1999, Kocaeli (Turkey) earthquake damage to structures. Can. J. Civ. Eng. 2001, 28, 715–737. [Google Scholar] [CrossRef]
  2. Akansel, V.; Ameri, G.; Askan, A.; Caner, A.; Erdil, B.; Kale, Ö.; Okuyucu, D. The 23 October 2011 Mw 7.0 Van (Eastern Turkey) earthquake: Interpretations of recorded strong ground motions and post-earthquake conditions of nearby structures. Earthq. Spectra 2014, 30, 657–682. [Google Scholar] [CrossRef]
  3. Erdil, B.; Why, R.C. Buildings Failed in the 2011 Van, Turkey, Earthquakes: Construction versus Design Practices. J. Perform. Constr. Facil. 2016, 31, 04016110. [Google Scholar] [CrossRef]
  4. Aksoy, E. Binalarda Rijitlik Merkezinin Deneysel Olarak Belirlenmesi. Master’s Thesis, Van Yuzuncu Yil University, Van, Türkiye, 2023. (In Turkish). [Google Scholar]
  5. TBC2018; Turkish Building Code. Minister of Environment, Urbanisation and Climate Change: Ankara, Türkiye, 2018.
  6. Doudoumis, I.N.; Doudoumis, N.I. Centres of rigidity in multi-storey asymmetric diaphragm systems for general lateral static loading. Eng. Struct. 2017, 150, 39–51. [Google Scholar] [CrossRef]
  7. Sezer, E. Yapı Sistemlerinde Burulma Düzensizliğini Etkileyen Parametrelerin İncelenmesi. Master’s Thesis, Fen Bilimleri Enstitüsü, Zonguldak Karaelmas Üniversitesi, Zonguldak, Türkiye, 2006. (In Turkish). [Google Scholar]
  8. Yener Demirci, H. Asimetrik Betonarme Yapıların Deprem Davranışı. Master’s Thesis, Fen Bilimleri Enstitüsü, Atatürk Üniversitesi, Yakutiyem, Türkiye, 2016. (In Turkish). [Google Scholar]
  9. Mohsenian, V.; Nikkhoo, A.; Rostamkalaee, S.; Moghadam, A.S.; Hejazi, F. The seismic performance of tunnel-form buildings with a non-uniform in-plan mass distribution. Structures 2021, 29, 993–1004. [Google Scholar] [CrossRef]
  10. İdemen, A.E. Bina Ağırlık Merkezi-Rijitlik Merkezi İlişkisini Mimari Tasarım Aşamasında Kuran Bir Uzman Sistem. Doctoral Dissertation, Fen Bilimleri Enstitüsü, İTÜ, Zonguldak, Türkiye, 2003. (In Turkish). [Google Scholar]
  11. Autodesk Inc. AutoCAD, version 2024; Autodesk Inc.: San Francisco, CA, USA, 1982. [Google Scholar]
  12. Cheung, V.W.T.; Tso, W.K. Eccentricity in irregular multistory buildings. Can. J. Civ. Eng. 1986, 13, 46–52. [Google Scholar] [CrossRef]
  13. Hejal, R.; Chopra, A.K. Earthquake Response of Torsionally-Coupled Buildings; Report No. UCB/EERC-87/20; Earthquake Engineering Research Institute: Berkeley, JA, USA, 1987. [Google Scholar]
  14. Bosco, M.; Marino, E.M.; Rossi, P.P. An analytical method for the evaluation of the in-plan irregularity of non-regularly asymmetric buildings. Bull. Earthq. Eng. 2013, 11, 1423–1445. [Google Scholar] [CrossRef]
  15. Goel, R.K.; Chopra, A.K. Seismic code analysis of buildings without locating centers of rigidity. J. Struct. Eng. 1993, 119, 3039–3055. [Google Scholar] [CrossRef] [Green Version]
  16. Marino, E.M.; Rossi, P.P. Exact evaluation of the location of the optimum torsion axis. Struct. Des. Tall Spec. Build. 2004, 13, 277–290. [Google Scholar] [CrossRef]
  17. Athanatopoulou, A.M.; Doudoumis, I.N. Principal directions under lateral loading in multistorey asymmetric buildings. Struct. Des. Tall Spec. Build. 2008, 17, 773–794. [Google Scholar] [CrossRef]
  18. Georgoussis, G.K. Modal rigidity center: İt’s use for assessing elastic torsion in asymmetric buildings. Earthq. Struct. 2010, 1, 163–175. [Google Scholar] [CrossRef]
  19. Prota Yazılım. ProtaStructure, version 5.1.290; Prota Yazılım: Ankara, Türkiye, 2021. [Google Scholar]
  20. Basu, D.; Jain, S.K. Alternative method to locate centre of rigidity in asymmetric buildings. Earthq. Enginering Struct. Dyn. 2007, 36, 965–973. [Google Scholar] [CrossRef]
  21. Sta Bilgisayar Mühendislik Müşavirlik Ltd. Şt. Sta4CAD, version 14.1; Sta Bilgisayar Mühendislik Müşavirlik Ltd. Şt.: İstanbul, Türkiye, 2021. [Google Scholar]
  22. İde Yapı. ideCAD, version 10.20; İde Yapı: Bursa, Türkiye, 2021. [Google Scholar]
  23. Computers and Structures Inc. ETABS, version 19.1.0; Computers and Structures Inc.: Walnut Creek, California, USA, 2020. [Google Scholar]
  24. Acun, B. Yatay Yük Altında Bina Döşemeleri İçin Rijit Diyafram Modelinin Uygunluğunun İncelenmesi. Doctoral Dissertation, Fen Bilimleri Enstitüsü, İTÜ, İstanbul, Türkiye, 2002. (In Turkish). [Google Scholar]
  25. Kınık, K.E. Betonarme Binaların Taşıyıcı Sistem Seçiminde Perde Yerleşiminin Davranışa Etkisi. Doctoral Dissertation, Fen Bilimleri Enstitüsü. İTÜ, İstanbul, Türkiye, 2019. (In Turkish). [Google Scholar]
  26. Erdil, B.; Gündüz, Y. Betonarme Binalar için Perde Duvar Etkinliğinin Belirlenmesi. Bitlis Eren Üniversitesi Fen Bilim. Derg. 2021, 10, 655–669. (In Turkish) [Google Scholar] [CrossRef]
  27. Burgan, H.I. Numerical Modeling of Structural Irregularities on Unsymmetrical Buildings. Teh. Vjesn. 2021, 28, 856–861. [Google Scholar]
  28. De-la-Colina, J.; Valdés-González, J. New Proposal to Incorporate Seismic Accidental Torsion in the Design of Buildings. Int. J. Civ. Eng. 2021, 19, 1–16. [Google Scholar] [CrossRef]
  29. Alaa, K.M.; El-Kashif, K.F.; Salem, H.M. New definition for torsional irregularity based on floors rotations of reinforced concrete buildings. J. Eng. Appl. Sci. 2022, 69, 12. [Google Scholar] [CrossRef]
  30. Özmen, G.; Girgin, K.; Durgun, Y. Torsional irregularity in multi-story structures. Int. J. Adv. Struct. Eng. 2014, 6, 121–131. [Google Scholar] [CrossRef] [Green Version]
  31. Archana, A.R.; Akbar, M.A. A Critical Review of Displacement-Based Criteria for Torsional Irregularity of Buildings. J. Inst. Eng. Ser. A 2021, 102, 1169–1175. [Google Scholar] [CrossRef]
  32. Zeris, C.; Lalas, A.; Spacone, E. Performance of torsionally eccentric RC wall frame buildings designed to DDBD under bi-directional seismic excitation. Bull. Earthq. Eng. 2020, 18, 3137–3165. [Google Scholar] [CrossRef]
  33. Bozdogan, K.B.; Öztürk, D. An approximate method for lateral stability analysis of wall-frame buildings including shear deformations of walls. Sadhana 2010, 35, 241–253. [Google Scholar] [CrossRef] [Green Version]
  34. Özbayrak, A.; Altun, F. Torsional effect of relation between mass and stiffness center locations and diaphragm characteristics in RC structures. Bull. Earthq. Eng. 2020, 18, 1755–1775. [Google Scholar] [CrossRef]
  35. Ko, D.W.; Lee, H.S. Shaking table tests on a high-rise RC building model having torsional eccentricity in soft lower storeys. Earthq. Engıneerıng Struct. Dynamıcs 2006, 35, 1425–1451. [Google Scholar] [CrossRef]
  36. Nam, T.T. Seismic torsional behavior of a tested full-scale steel building. Technol. Soc. Stud. 2022, 41-45, 41–45. [Google Scholar] [CrossRef]
  37. Fujii, K.; Ikeda, T. Shaking table test of irregular buildings under horizontal excitation acting in an arbitrary direction. In Proceedings of the 15th World Conference on Earthquake Engineering, Paper (No. 0439), Lisbon, Portugal, 24–28 September 2012. [Google Scholar]
  38. Şafak, E.; Çelebi, M. Method to estimate center of rigidity using vibration recordings. J. Struct. Eng. 1990, 116, 85–97. [Google Scholar] [CrossRef]
  39. Çelebi, M.; Swensen, D. Response Study of a Tall San Diego, California Building Inferred from the M7. 1 July 5, 2019 Ridgecrest, California Earthquake Motions. Open Constr. Build. Technol. J. 2022, 16. [Google Scholar] [CrossRef]
  40. Chopra, A.K. Dynamics of Structures: Theory and Applications to Earthquake Engineering, 2nd ed.; Prentice Hall, Inc.: Upper Saddle River, NJ, USA, 2001. [Google Scholar]
  41. Triantafyllos, M.; Kyriakos, A. Real and fictitious elastic axis of multi-storey buildings: Theory. Struct. Des. Tall Build. 1998, 7, 33–55. [Google Scholar]
  42. Triantafyllos, M.; Kyriakos, A. Real and fictitious elastic axis of multi-storey buildings: Applications. Struct. Des. Tall Build. 1998, 7, 57–71. [Google Scholar]
  43. Kyriakos, A.; Asimina, A.-K.; Triantafyllos, M. Equivalent static eccentricities in the simplified methods of seismic analysis of buildings. Earthq. Spectra 1998, 1, 1–34. [Google Scholar]
  44. Aksoy, E.; Korkut, F.; Erdil, B. Betonarme binalarda rijitlik merkezi problemi. Dicle Üniversitesi Fen Bilim. Enstitüsü Derg. 2022, 11, 383–404. [Google Scholar] [CrossRef]
  45. Walpole, R.E.; Myers, R.H.; Myers, S.L.; Ye, K. Probability and Statistics for Engineers and Scientists; Macmillan: New York, NY, USA, 1993; Volume 5. [Google Scholar]
Figure 1. Weight measurements of balsa wood.
Applsci 13 07452 g001
Figure 2. Three-point bending of the balsa wood. (a) Balsa stick, (b) balsa plate.
Applsci 13 07452 g002
Figure 3. Construction process.
Applsci 13 07452 g003
Figure 4. Group A buildings.
Applsci 13 07452 g004
Figure 5. Group B buildings.
Applsci 13 07452 g005
Figure 6. Group C buildings.
Applsci 13 07452 g006
Figure 7. Group D buildings.
Applsci 13 07452 g007
Figure 8. Test setup.
Applsci 13 07452 g008
Figure 9. Special trigger device.
Applsci 13 07452 g009
Figure 10. The building after the test.
Applsci 13 07452 g010
Figure 11. Displacement calculations of the vertical members of a typical building.
Applsci 13 07452 g011
Figure 12. Test results of A2.
Applsci 13 07452 g012
Figure 13. Rigidity center procedure in ETABS.
Applsci 13 07452 g013
Figure 14. Rigidity center of A2. (a) Ground floor; (b) 1st floor; (c) 2nd floor.
Applsci 13 07452 g014
Figure 15. Test results of Group A.
Applsci 13 07452 g015
Figure 16. Rigidity centers of Group A.
Applsci 13 07452 g016
Figure 17. Test results of Group B.
Applsci 13 07452 g017
Figure 18. Rigidity centers of Group B.
Applsci 13 07452 g018
Figure 19. Test results of Group C.
Applsci 13 07452 g019
Figure 20. Rigidity centers of Group C.
Applsci 13 07452 g020
Figure 21. Test results of Group D.
Applsci 13 07452 g021
Figure 22. Rigidity centers of Group D.
Applsci 13 07452 g022
Table 1. Properties of Group A buildings.
Bldg. A c , E W (cm2) A c , N S (cm2) A w , E W (cm2) A w , N S (cm2) A f (cm2)
A11.441.4400900
A21.081.0803.0900
A30.720.723.03.0900
A40.360.366.03.0900
A5006.06.0900
Table 2. Properties of Group B buildings.
Bldg. A c , E W (cm2) A c , N S (cm2) A w , E W (cm2) A w , N S (cm2) A f (cm2)
B112.9612.9600900
B212.2412.241.50900
B311.5211.5203.0900
B411.1611.161.53.0900
B510.4410.443.03.0900
B68.648.646.06.0900
Table 3. Properties of Group C buildings.
Bldg. A c , E W (cm2) A c , N S (cm2) A w , E W (cm2) A w , N S (cm2) A f (cm2)
C15.765.763.63.6750
C26.486.481.53.0600
C310.0810.083.03.0750
C45.765.761.82.1690
Table 4. Properties of Group D buildings.
Bldg. A c , E W (cm2) A c , N S (cm2) A w , E W (cm2) A w , N S (cm2) A f (cm2)
D13.243.241.951.8900
D25.045.049.07.2900
D34.684.686.03.8760
D44.324.323.64.2690
D52.882.887.53.6509
Table 5. Rigidity center calculation of A2.
Load dir.Memberbx, mmby, mmIi, mm4Ei, MPaLi, mmxi, mmdzi, mmki, N/mmkidzi, Nkidzixi, N/mmRC, mm
S-N directionSW13100250,000946210026.51.2528,386.1235,543.68941,90827.24
(from east side)
C26466108191710027221.652.4853.7914,631
C264661081917100281.382.483.4296
C26466108191710027221.652.4853.7914,631
W-E directionSW1100322594621002256.4025.55163.5736,803193.35
(from south side)
C2646610819171002726.082.4815.114109
C264661081917100287.752.4819.25539
Table 6. Comparison between the test results and ETABS.
RC from ETABSRC from TestDifference, %
x r , mm y r , mm x r , mm y r , mm x r y r
2nd floor26.2106.326.9102.10.231.40
1st floor25.6105.327.0102.70.460.87
Ground floor25.2102.327.2106.70.681.44
Table 7. Rigidity center comparisons of Group A.
RC from ETABSRC from TestDifference, %
x r , mm y r , mm x r , mm y r , mm x r , mm y r
A1149.8150.0162.3141.24.152.94
A226.2106.326.9102.10.231.40
A328.928.537.927.73.000.26
A420.2146.326.9152.52.262.09
A5143.3145.4145.9177.30.8610.63
Table 8. Rigidity center comparisons of Group B.
RC from ETABSRC from TestDifference, %
x r , mm y r , mm x r , mm y r , mm x r y r
B1149.7149.5144.6155.31.720.93
B2125.1260.8123.8269.60.422.48
B3146.7169.8161.3180.74.873.65
B4159.7183.5200.8225.013.7013.84
B5150.1149.8150.1112.00.0112.61
B6146.2139.2134.1146.34.032.36
Table 9. Rigidity center comparisons of Group C.
RC from ETABSRC from TestDifference, %
x r , mm y r , mm x r , mm y r , mm x r y r
C1125.9159.3125.6166.90.102.55
C2115.1126.699.4136.97.853.45
C3233.0121.1252.6126.46.562.14
C442.9111.943.1108.60.101.40
Table 10. Rigidity center comparisons of Group D.
RC from ETABSRC from TestDifference, %
x r , mm y r , mm x r , mm y r , mm x r y r
D127.1247.827.5247.10.150.23
D2272.438.7267.772.41.5611.24
D320.728.745.456.98.259.40
D4104.0160.8119.6152.06.823.81
D5120.5229.8125.8226.41.791.15
Disclaimer/Publisher’s Note: The statements, opinions and data contained in all publications are solely those of the individual author(s) and contributor(s) and not of MDPI and/or the editor(s). MDPI and/or the editor(s) disclaim responsibility for any injury to people or property resulting from any ideas, methods, instructions or products referred to in the content.

