Article

Hydraulic Prototype Observation Tests on Reconstructed Energy Dissipation Facilities

1
Faculty of Electric Power Engineering, Kunming University of Science and Technology, Kunming 650500, China
2
Anhui Provincial International Joint Research Center of Data Diagnosis and Smart Maintenance on Bridge Structures, Chuzhou 239099, China
3
College of Water Conservancy and Hydropower Engineering, Hohai University, Nanjing 210098, China
*
Authors to whom correspondence should be addressed.
Appl. Sci. 2023, 13(10), 6216; https://doi.org/10.3390/app13106216
Submission received: 13 April 2023 / Revised: 8 May 2023 / Accepted: 17 May 2023 / Published: 19 May 2023
(This article belongs to the Special Issue Experimental Mechanics, Instrumentation and Metrology II)

Abstract

:

Featured Application

The tests provide insights into the effectiveness of energy dissipation facilities and offer suggestions for improving the flood discharge mode at hydropower stations to ensure safe operation during flood discharge.

Abstract

In order to assess the effectiveness of reconstructed energy dissipation facilities (EDFs) in open channels at hydropower stations, hydraulic prototype observation (HPO) tests are conducted to investigate the characteristics of discharge flow and the dynamic response of hydraulic structures during sluice opening periods. While hydraulic model tests (HMTs) are commonly utilized in laboratory settings to study these characteristics, experimental conditions cannot fully replicate the real-world operations of such structures. HPO tests are employed to examine flow patterns, free water surface fluctuations, and pulsating pressure changes in open channels under varying flood discharge conditions (FDCs). Flow patterns in open channels are recorded via video; free water surface fluctuations are measured using total-station and laser rangefinder instruments; and pulsating pressure is monitored with pressure sensors and data collection systems. Flow pattern observations concentrate on addressing adverse water flow phenomena, such as turbulence, surging, and backflow. The examination of free water surface fluctuations aims to verify whether the height of the guide wall along the open channel fulfills the necessary requirements and assess the effectiveness of energy dissipation of the EDF. To comprehend the variations in pulsating pressure within the continuous sill and the base slab, nine measurement points were established across three sections perpendicular to the continuous sill’s axis on three distinct elevation levels. Additionally, three measurement points were positioned on the reinforced base slab along the open channel’s axis. The findings indicate that the impact on the continuous sill caused by discharging water is more severe when the discharge rate of a single sluice gate reaches 500 m3/s than in other FDCs. To ensure the safe operation of open channels during flood discharge, the discharge rate for each sluice gate should be reduced to 250 m3/s. The dominant pulsation induced by discharge flow falls within the low-frequency range, resulting in minimal adverse effects on the stilling basin and guide wall. The flow pattern within the stilling basin remains stable under various FDCs, with no significant adverse hydraulic phenomena observed. Parameters, including free water surface fluctuations and pulsating pressure variations, lie within acceptable ranges. These observations suggest that the arrangement of the reconstructed energy dissipation facilities is generally effective following technical reconstruction.

1. Introduction

Energy dissipation facilities (EDFs) are structures designed to dissipate the energy of flowing water, commonly used in open channels at hydropower stations to reduce flood damage [1,2]. Energy dissipation downstream of large-scale dams is a critical concern, particularly in high dam projects or mega-projects. In addition to traditional primary methods of flood discharge and energy dissipation, such as ski-jump energy dissipators, underflow energy dissipators, and tunnel energy dissipators, several innovative energy dissipation techniques have been proposed. These include stepped and cascade spillways [3,4], slit-type energy dissipators [5], pendulum sills downstream of sluice gates [6], trapezoidal labyrinth weirs [7], and flaring gate pier schemes for chambers [8]. These novel approaches aim to achieve efficient energy dissipation under various flood discharge conditions. Evaluating the effectiveness of reconstructed EDFs is crucial to ensuring adequate protection [9]. Hydraulic model tests (HMTs) provide a more realistic assessment of EDF effectiveness by simulating water flow through a scaled-down hydraulic system, achieving geometric similarity with the prototype using dimensionless parameters, and maintaining constant fluid properties [10,11,12]. HMTs can analyze water flow behavior under various flow conditions, such as velocity distribution, flow resistance, and sediment transport [13]. However, HMTs have limitations in replicating the real characteristics of water flow and structural response imposed by dynamic water pressure at the prototype scale, such as the effects of turbulence, air entrainment, sediment transport, and various influencing factors, including forces, materials, cavitation, and geology [14,15,16,17,18]. For instance, turbulence and air entrainment can significantly affect flow characteristics, and sediment transport can affect hydraulic response. Structural response can be influenced by various factors, such as material properties, boundary conditions, and flow conditions. Replicating these effects in a laboratory environment can be challenging due to the limited size of the model and difficulty controlling flow conditions.
Another way to validate and improve the results obtained from HMTs is to conduct a corresponding hydraulic prototype observation (HPO), which involves measuring and analyzing the real water flow characteristics and structural response imposed by dynamic water pressure at the prototype scale [19,20,21]. Observing the hydraulic prototype can provide more accurate and reliable project design and operation data than the model test alone. Bai et al., discovered through a prototype study that significant scale effects are present in the physical investigation of hydraulic aerated flow, particularly with regard to bubble density, size, and frequency [22]. Several studies have highlighted the importance of HPO in hydraulic structure design and operation. For instance, Takahiro et al., conducted a HPO to investigate the performance of a hydraulic turbine under different operating conditions, finding it provided more accurate and reliable data than the model test alone. Similarly, Mokashi et al., conducted a HPO to validate the results obtained from a HMT and found that it provided valuable insights into the real water flow characteristics that were not captured by the HMT [10,12]. However, few researchers have investigated the hydraulic properties of an open channel under different discharge releases through direct observation and measurement of the real properties of discharge flow.
Overall, studying HPO tests on reconstructed EDFs is crucial for ensuring the safe and efficient operation of open channels at hydropower stations and for advancing our understanding of the complex hydraulic phenomena involved in energy dissipation. Therefore, the main objective of this study is to investigate the hydraulic properties of an open channel under different discharge releases through HPO tests, including the free water surface profile, hydraulic jump, dynamic response induced by discharge flow, and structural safety state. The main contributions are as follows:
  • The article presents the results of HPO tests conducted to assess the effectiveness of reconstructed EDFs in open channels at hydropower stations;
  • The article provides detailed information on the methodology used for conducting HPO tests, including observing and measuring flow patterns, free water surface fluctuations, and pulsating pressure changes in open channels under varying flood discharge conditions;
  • The article presents several suggestions for improving the flood discharge mode at hydropower stations based on the results of the HPO tests.
The remainder of this article is organized as follows: Section 2 describes the hydropower project, its various components, and the necessity for technical reconstruction of the EDFs in the stilling basin to ensure structural safety. Section 3 offers a comprehensive overview of the HPO test methodology, including the observation and measurement of flow patterns, free water surface fluctuations, and pulsating pressure changes in open channels under various flood discharge conditions. Section 4 presents the HPO test results, including assessments of water flow conditions, water surface changes, and pulsating pressures, and offers recommendations for enhancing flood discharge management at hydropower stations based on these findings. Section 5 provides additional suggestions for improving flood discharge management at hydropower stations, drawing from the HPO test results to ensure the safe operation of open channels during flood discharge events. Finally, Section 6 summarizes the key insights from the article.

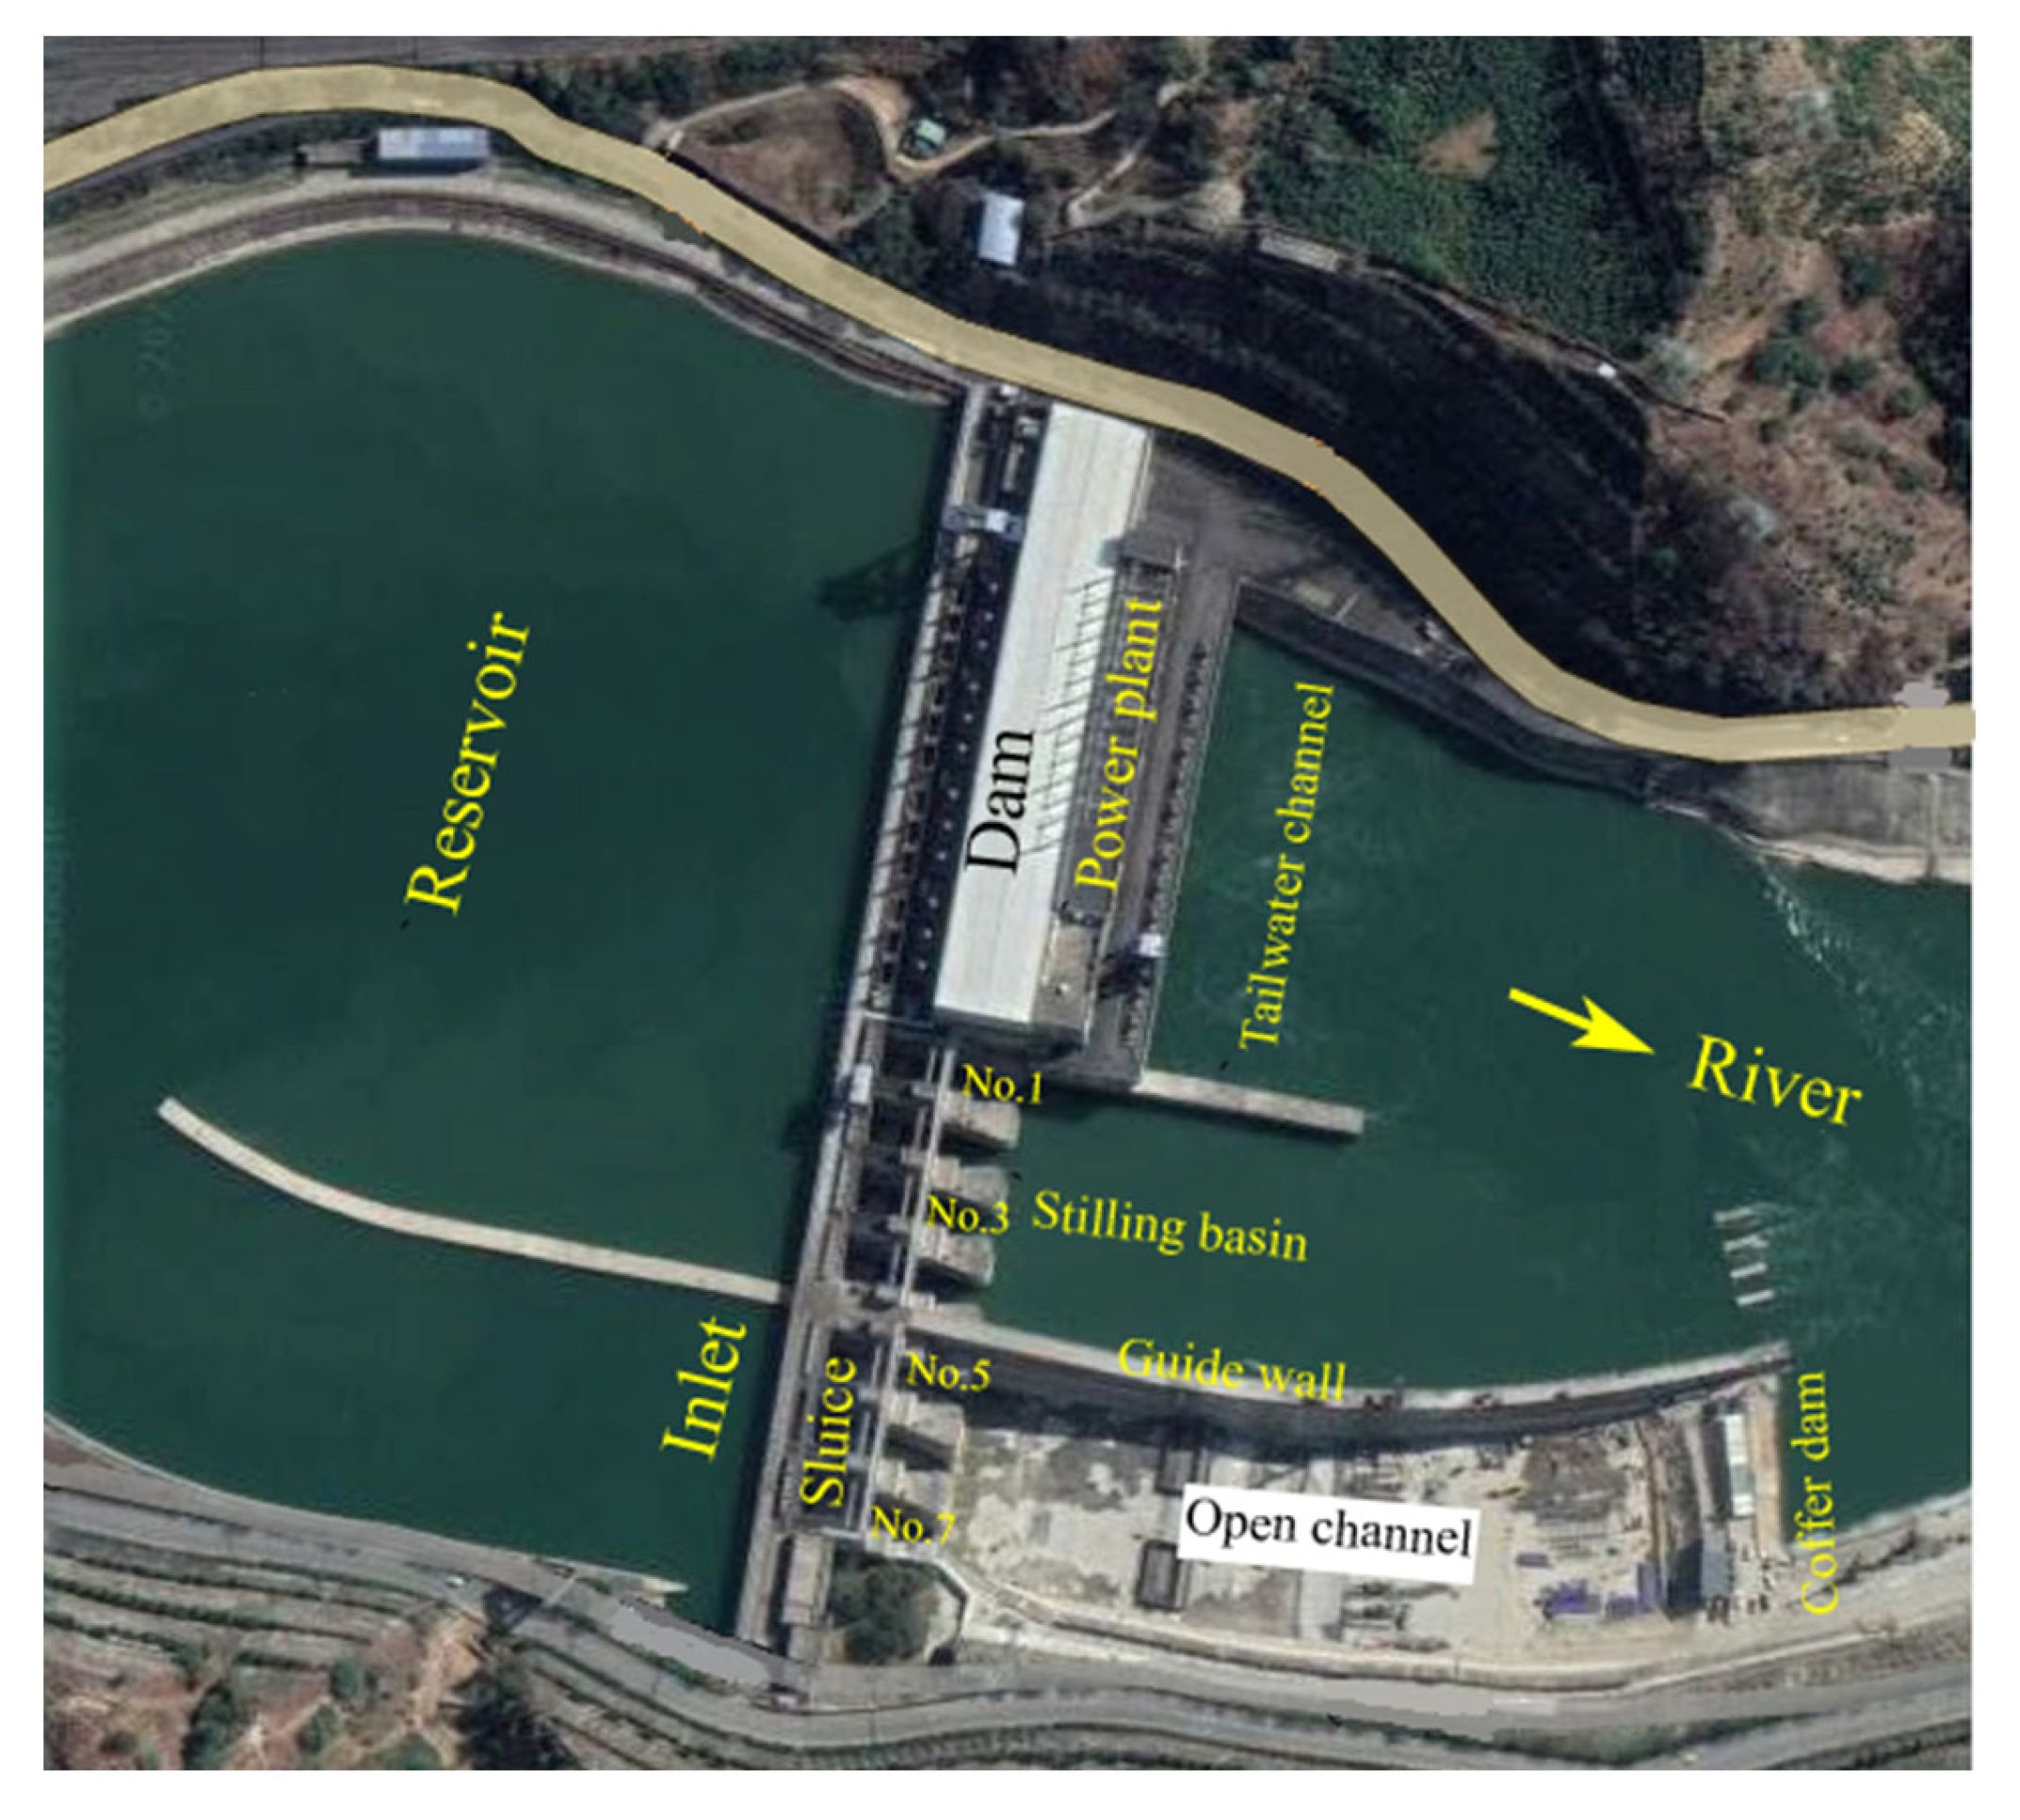
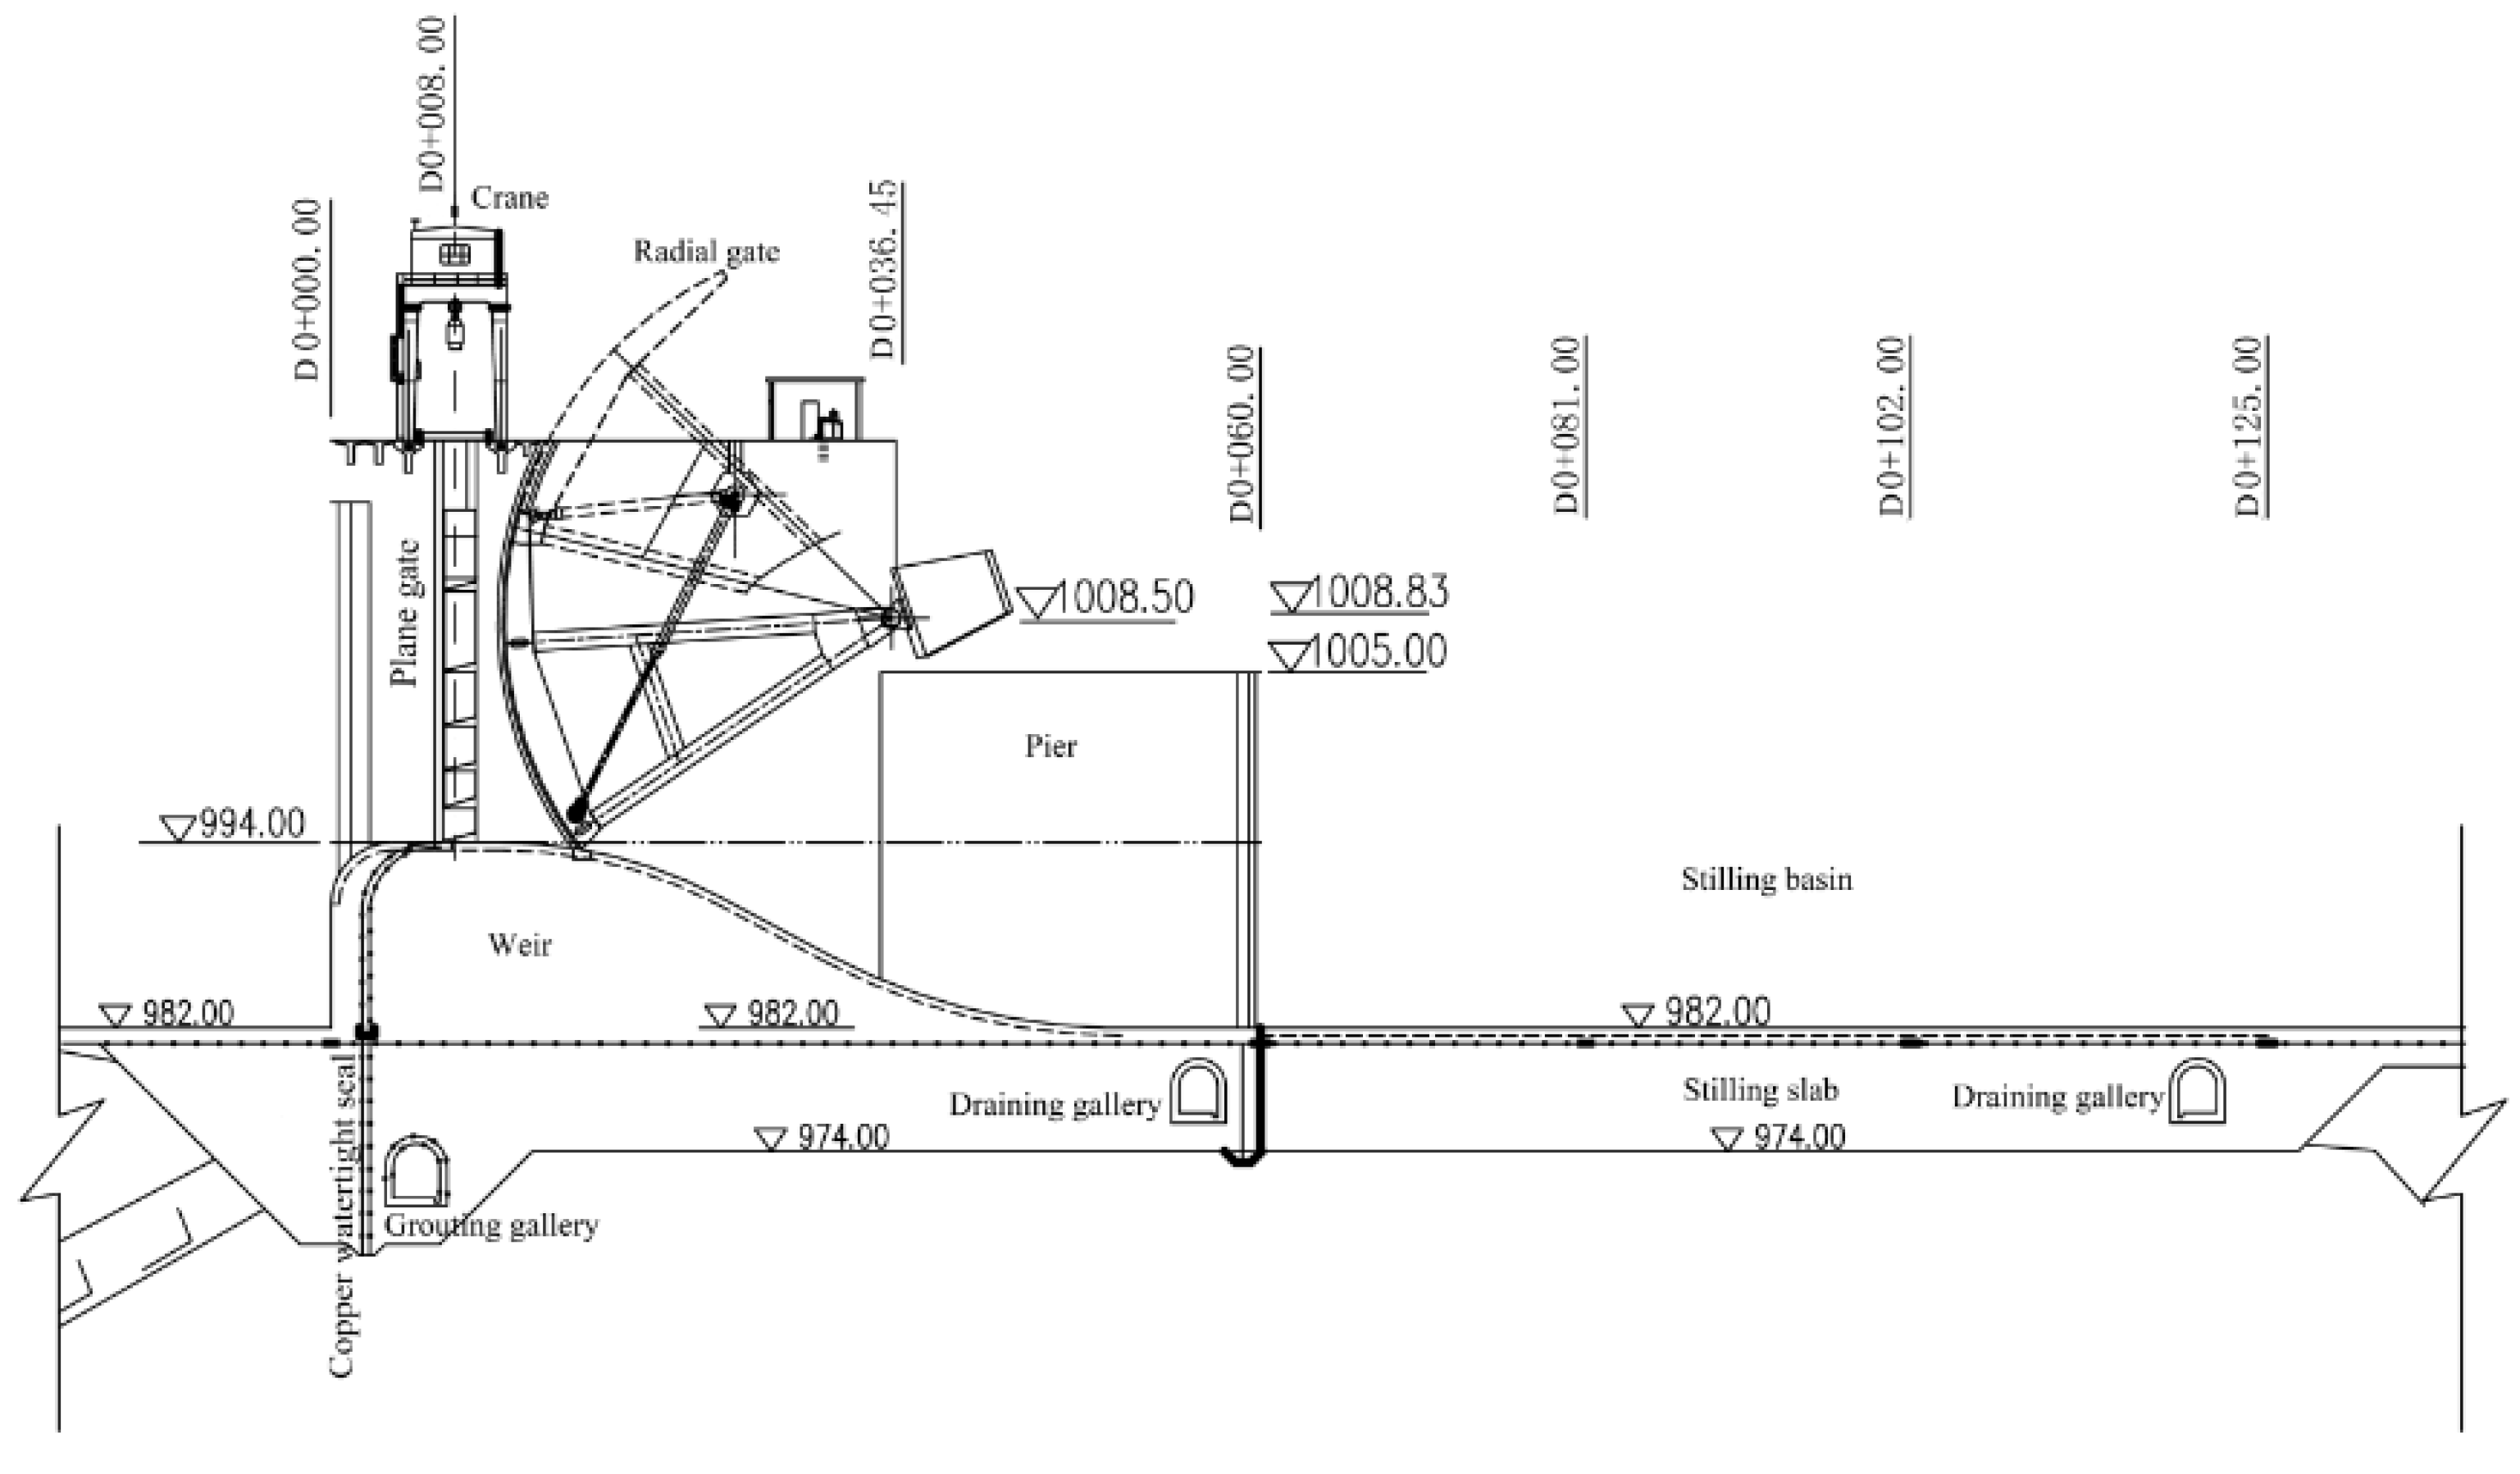
2. Project Background

The hydropower project encompasses a water impounding dam, a riverbed-type power plant, a power transmission and transformation project, and additional buildings designed primarily for power generation and meeting downstream comprehensive water consumption requirements. It is classified as a large (2)-type hydropower station, with permanent main buildings designed as grade 2 structures and secondary structures designed as grade 3. The hydropower station comprises left and right bank dam sections, a riverbed power plant, a flood discharge dam section with seven sluice gates, and other buildings. The flood discharge dam section includes four sluice gates in the riverbed and three sluice gates built across the diversion channel on the right bank, as illustrated in Figure 1. Energy dissipation and anti-scour structures downstream of sluice No.1#~7# are composed of a stilling basin, continuous sill, open channel apron, and its extension. Figure 2 shows a typical section of the sluice No.5#~7#, which is 74.6 m long along the dam axis and has a sluice chamber of 60.0 m in length in the flow direction. The maximum gate height is 58.0 m, and the weir crest elevation is 994.0 m. The sluice has a flat bulkhead and radial working gates, with a width of 16.0m and an orifice size of 21.0 m high. The pier is designed as a flared gate pier, commonly used for auxiliary energy dissipation in many Chinese projects [8]. The pier’s width gradually increases from around the post-median position to its end, leading to a gradual decrease in the chamber’s width, from 16.0 m to 9.0 m in the present case. Near the end of the gate chamber, the middle pier’s width is 12.6 m, and that of the side pier is 8.08 m. The upstream weir surface is an arc with a radius of 4.0 m, followed by a 7.0 m long top horizontal part. This is then followed by an arc with a radius of 3.0 m, connected to a flip bucket with a radius of 40.0 m via a sloping chute with a slope ratio of 1:2.08. The stilling basin is 65.0 m long, and its base slab elevation is 982.00 m, the same as the open channel base slab.
Sluice No.1#~4# commenced operations in November 2014, and sluice No.5#~7# began operating in October 2015. By the end of 2018, sluice No.1#~4# had operated for 12,437 h, and sluice No.5#~7# had operated for 2261 h, covering four complete flood seasons.
Initially, during low-flow flood discharge conditions without power generation, gradual erosion occurred in the energy dissipation zone, leading to an increase in the water head difference between the upstream and downstream water levels. Furthermore, due to a cut by fault F1 and discharging flow in the open channel, the foundation of sluice No.1#~4# was partially scoured and eroded under the left guide wall, posing a severe threat to structural stability. Thus, reinforcement work was necessary for the weak and eroded area of the guide wall foundation to ensure structural safety.
Additionally, to enhance safety, reliability, and flexibility of flood discharge at the power station and to meet the low-flow flood discharge demand of sluice No.5#~7#, technical reconstruction work for EDFs in the stilling basin at the downstream side of sluice No.5#~7# was carried out under the guidance of the Power Station Administration Office from 1 November 2019 to 30 May 2020. The reconstruction work involved installing anti-slide piles along the axis of the left guide wall through the guide wall into its foundation and constructing a continuous sill and reinforcement base slab along the open channel, as shown in Figure 3.
Following the technical reconstruction of sluice No.5#~7#, the discharge flow from the sluices is locally dammed under the continuous sill, creating conditions for a forced hydraulic jump in the stilling basin. This high-energy flow is violent, with solid turbulence and air entrapment due to both cavitation in high-speed flow and air entrapped in strong free surface deformation motions, causing severe impacts on local structures in the dissipation zone by the high-speed air-water mixture. To analyze and evaluate the safety of the dissipation zone downstream of sluice No.5#~7# after the reconstruction of the anti-slide piles and EDFs in the stilling basin and to obtain primary reference data for the gate opening mode during operation, the Power Station Administration Office conducted a HMT at a scale of 1:70.
Therefore, a corresponding HPO test was deemed necessary. In our tests, 12 sensors of pulsating pressure, 4 hole piezometers, 13 joint meters, and 13 bolt stress gauges were installed in the continuous sill and reinforcement base slab to meet structural safety requirements during the monitoring of the prototype test. The discharge flow characteristics mainly focused on adverse water flow phenomena, including water surface profile, turbulence, surging, backflow, etc.

3. Hydraulic Prototype Observation and Measuring Point Arrangement

3.1. Hydraulic Prototype Observation

The HPO tests comprise the following contents:
(1)
Observation of the water flow state in the open channel
This observation primarily focuses on adverse water flow phenomena, including turbulence, surging, and backflow.
(2)
Measurement of the free water surface elevation in the open channel
This task involves observing and measuring the free water surface elevation in the open channel during flood discharge. Flow connection patterns in different regions will be analyzed to determine the form of energy dissipation. The height of the guide wall along the open channel will be checked according to the highest water level elevation.
(3)
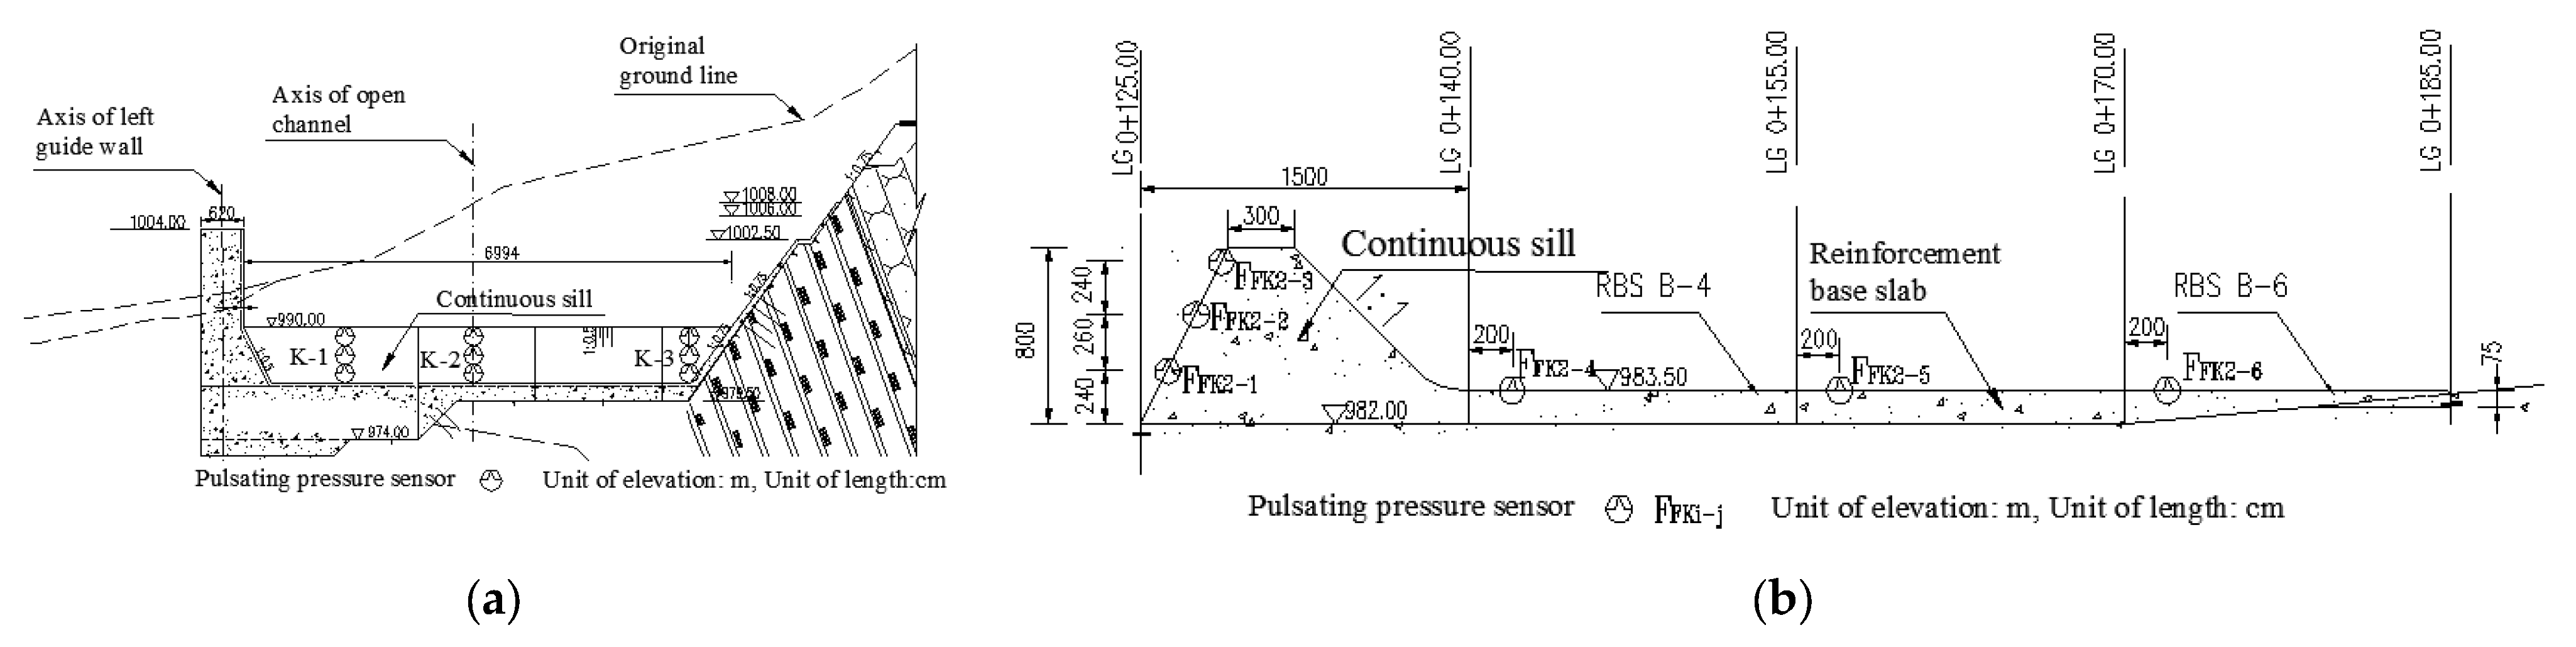
Measurement of the pulsating pressure within the continuous sill and reinforcement base slab in the open channel
The pulsating pressure and its time-average value within the continuous sill and stilling base slab will be recorded to gain insight into the working state of the EDFs during flood discharge. The energy dissipation effect will be evaluated, and it will provide reference data for the recheck of the structural stability of the continuous sill and reinforcement base slab.

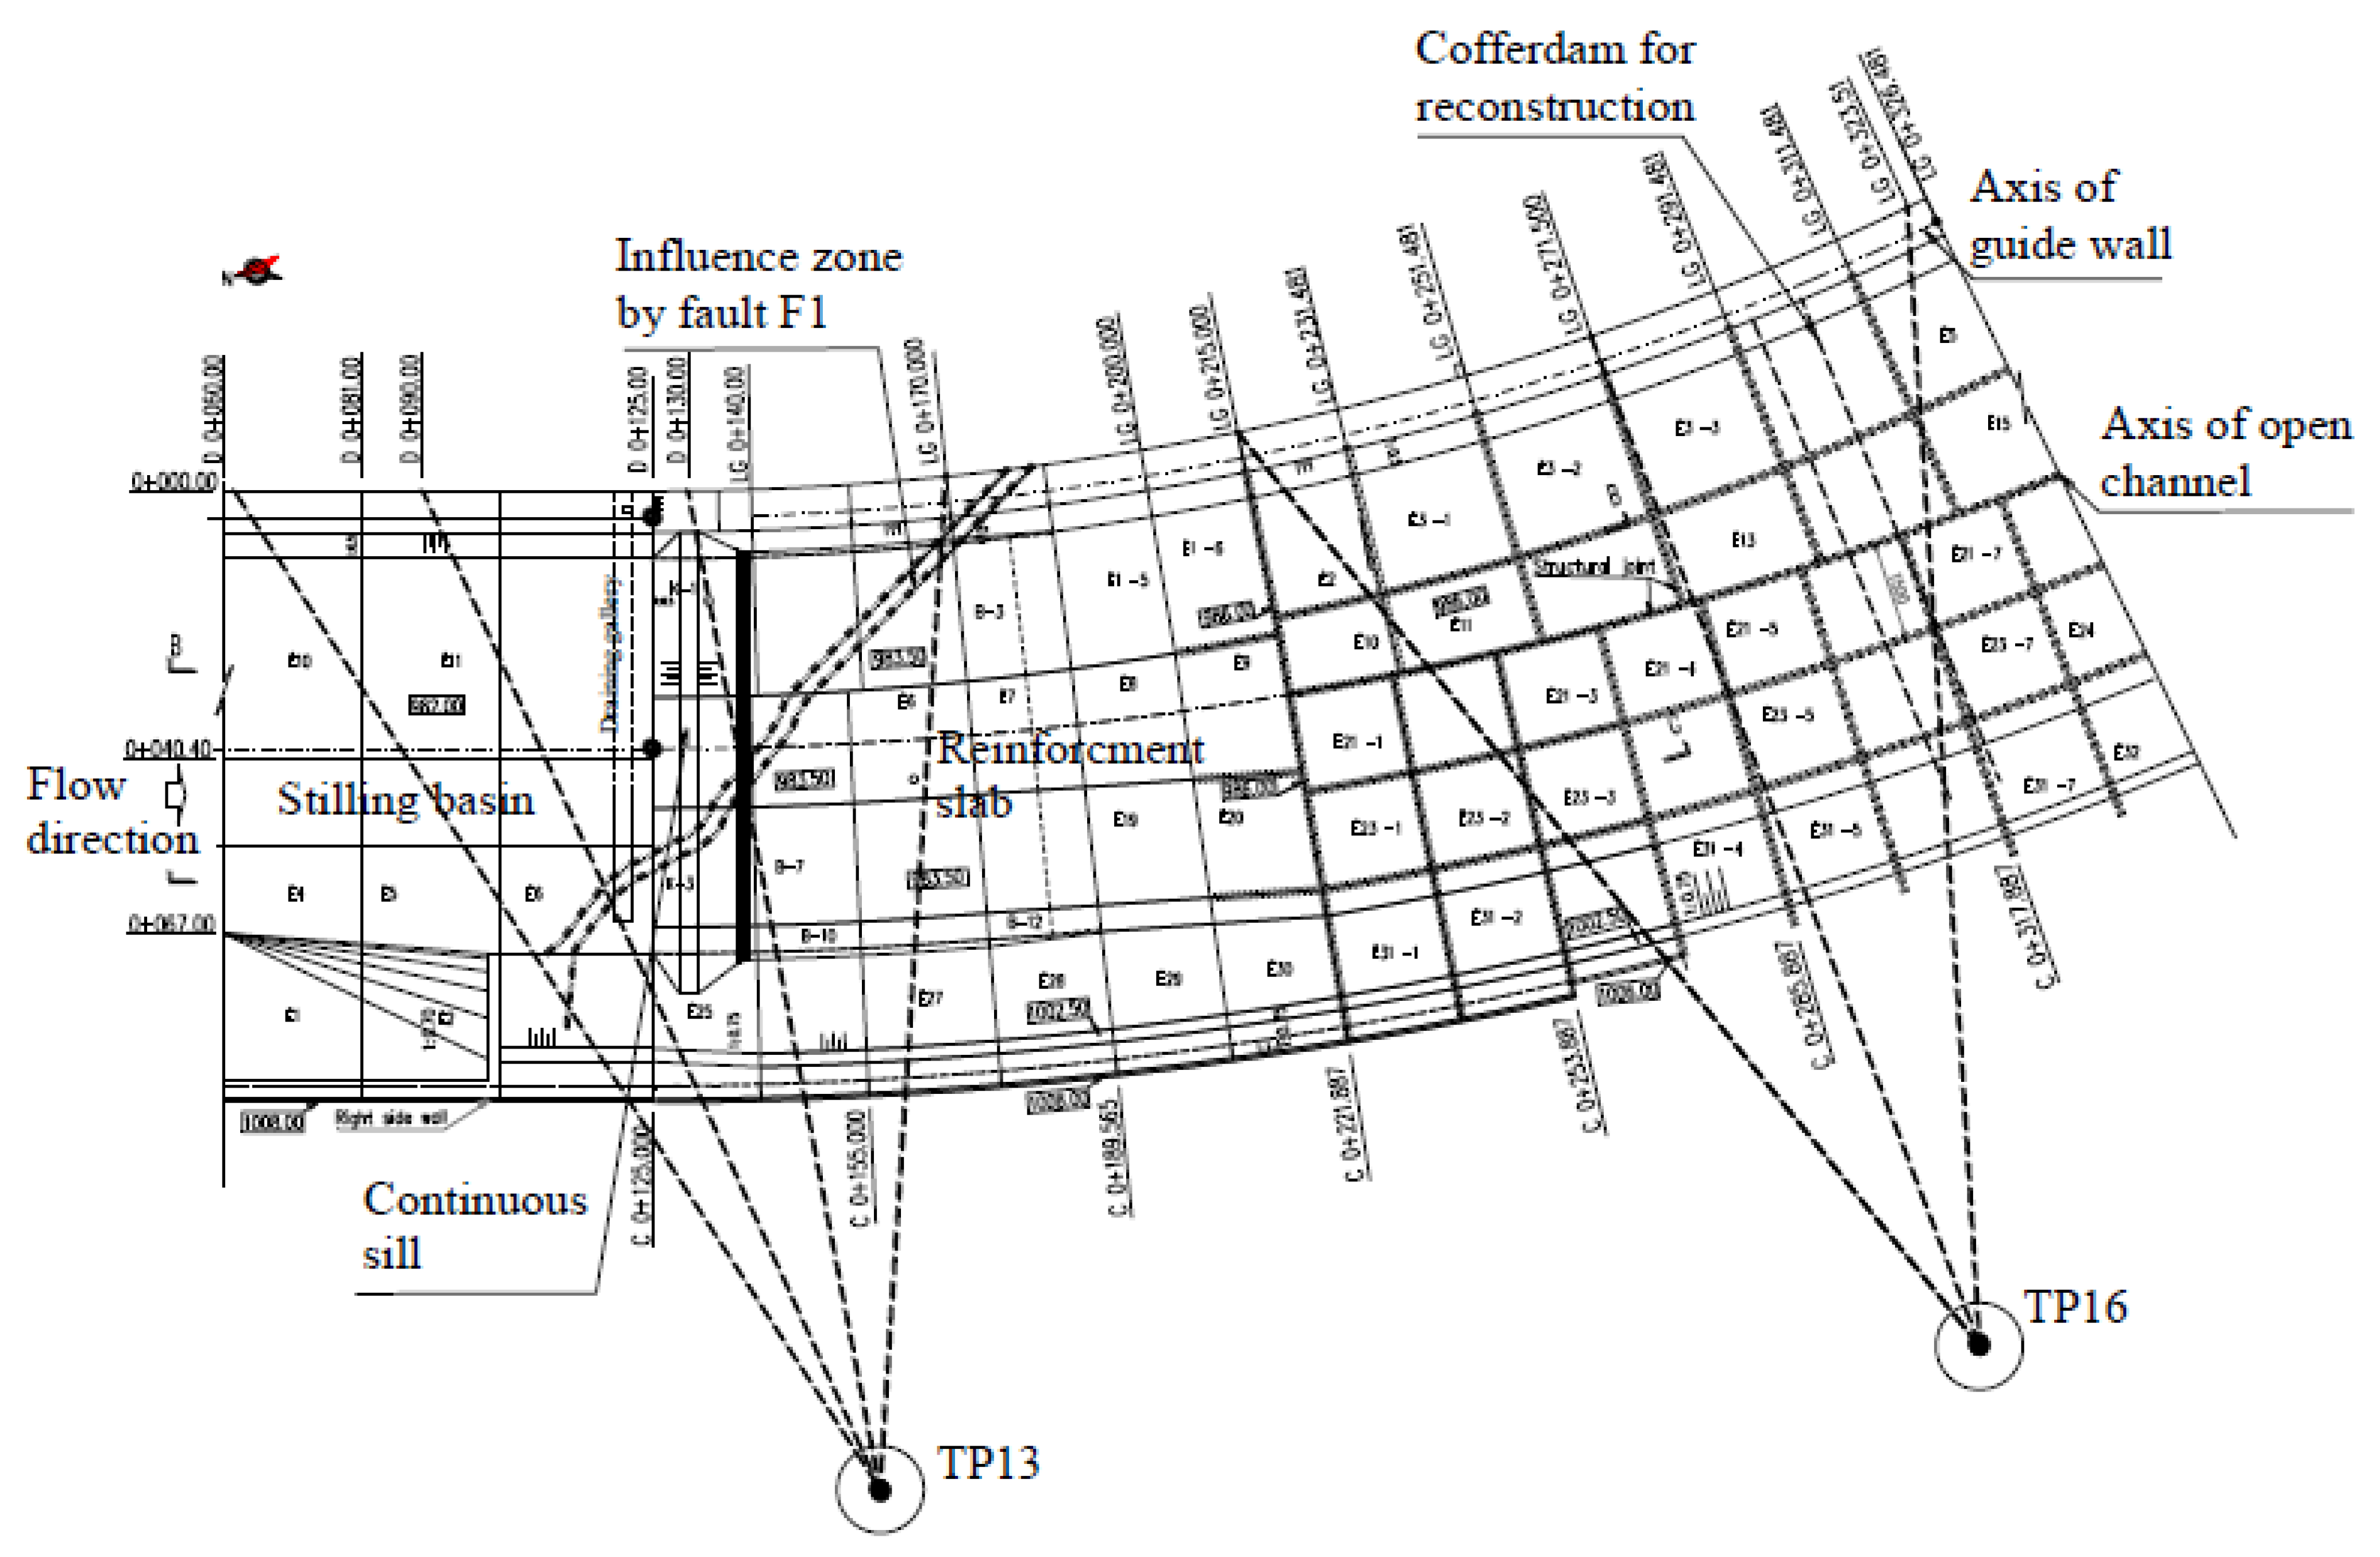
3.2. Observation Method and Measuring Point Arrangement

(1)
Flow state observation
The flow pattern in the open channel was observed using a digital camera and a video recorder, with a focus on adverse water flow phenomena, especially the occurrence of transverse backflow in the open channel.
(2)
Free water surface observation
For convenience, seven sections along the guide wall on the left side of the open channel were chosen as observation points: 0 + 060.0 m, 0 + 090.0 m, 0 + 130.0 m, 0 + 170.0 m, 0 + 215.0 m, 0 + 271.5 m, and 0 + 323.5 m, as shown in Figure 3. Total-station and laser rangefinder instruments were employed to measure the elevation of the free water surface during flood discharge. The final measurement data was taken as the average value from the two observations. The total station measurement device used was a ZPS-12R, manufactured by Hi-Target, with an angle accuracy of 2″ and a distance accuracy of 3 mm + 2D × 10−6 (D is the measured distance). The laser rangefinder was a Leica DISTO D2, with a measuring range of 100 m and a precision of ±1.5 mm. However, not all laser rangefinders can measure the free water surface position, and some may yield unfavorable results. In addition, the free water surface fluctuates violently during water discharge, and the measurement time is asynchronous in different observation methods, which can lead to a variance in the measurement results of the free water surface position. Therefore, when the state of the discharge flow becomes relatively stable, the position of the highest water level could be observed 3–5 times according to the fluctuation of water waves. The average value is then taken as the highest water surface elevation in that particular flood discharge condition.
(3)
Pulsating pressure observation
During the initial construction period, no facilities were buried at the base of sluice No.5#~7# for observation tests. In this HPO test, the pulsating pressure sensors were only embedded into the continuous sill and reinforcement base slab during the technical reconstruction to avoid damage to the original concrete of the sluice dam body. To understand the change in pulsating pressure within the continuous sill, nine measuring points were set up at three sections (i.e., K-1, K-2, and K-3) perpendicular to the axis of the continuous sill on three different elevation levels (i.e., 983.5 m, 986.0 m, and 988.5 m). These measuring points were numbered as FFK1.1–FFK1.3, FFK2.1–FFK2.3, and FFK4.1–FFK4.3, as shown in Figure 4. To observe the change in pulsating pressure in the base slab, three measuring points were set on the reinforcement base slabs of B-4, B-5, and B-6 along the axis of the open channel, at the same elevation level of 983.5 m. Their positions along the guide wall were 0 + 148.80 m, 0 + 158.60 m, and 0 + 168.40 m, respectively, numbered as FFK2.4–FFK2.6, as shown in Figure 4.
In this study, the pressure sensors and data collection system, XL3402, developed by ×XIELI Technologies Inc. (Wenzhou, China) were utilized to collect the pulsating pressure. It is essential to electrify the measuring system for 30 min before data collection to ensure the stability and reliability of the data collection system. The original value of all measuring points should be recorded at the beginning of the test. Then, the sluice gate should be opened slowly according to the opening regulation of the HPO test. Pressure data should not be collected until a stable state is achieved for each flood discharge condition, i.e., at least 5 min after the sluice gate opens to maintain stability. The data collection is made at a frequency of 200 Hz. Three data groups are collected for each working condition to obtain their average value. Furthermore, at the end of all flood discharge conditions, when the sluice gates are closed, and the water level in the open channel slowly recovers to its original state before the test, the final value of all measuring points should be re-recorded to calibrate the zero drift of the data collection system.

3.3. Flood Discharge Condition for Observation

After the technical reconstruction of sluice No.5#~7#, HPO tests were conducted twice for 16 different flood discharge conditions. The typical flood discharge conditions are shown in Table 1.

4. Observation Results

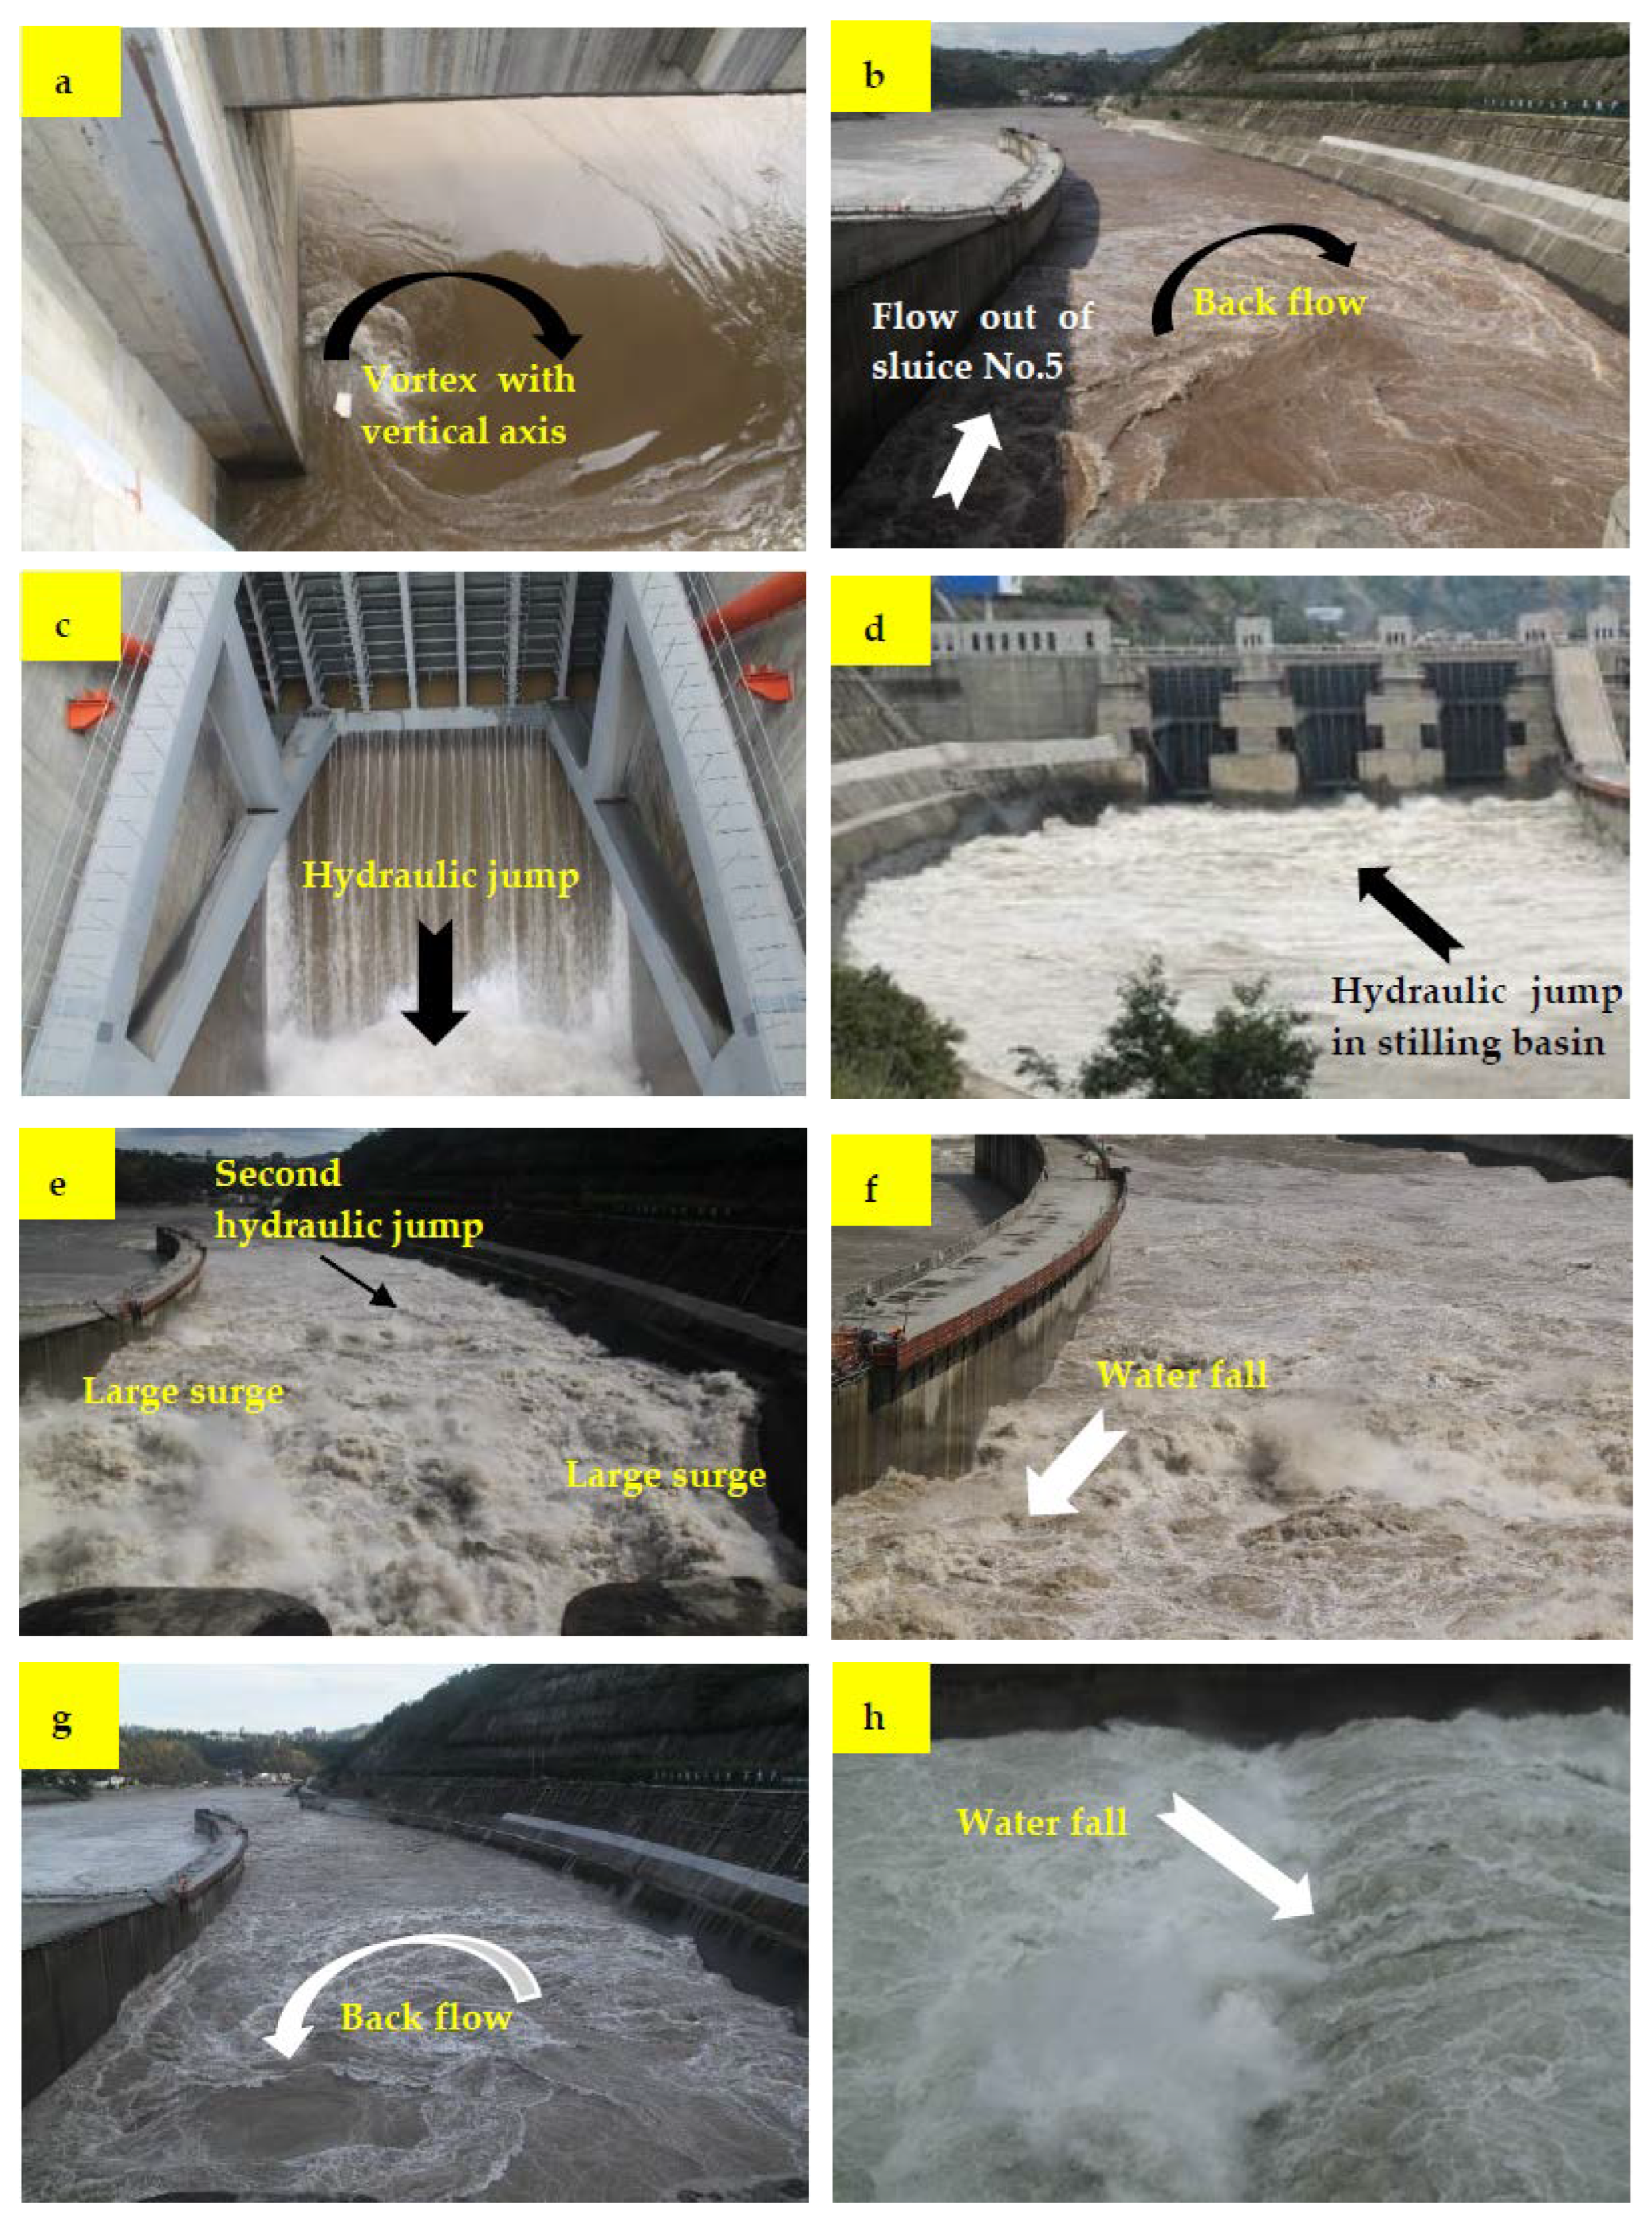
4.1. Water Flow State

Under various flood discharge conditions, the free water surface at the inlet of the open channel is generally stable, and there is no apparent adverse flow pattern. There are vertical axis vortices near both sides of the access gate groove of the sluice gate, as shown in Figure 5a. There is no noticeable vibration near the gate area. As the discharge of the open channel increases, a hydraulic jump will be made at a discrete distance behind the gate as water flows out of the sluice gate. The head of the hydraulic jump is mainly located between the gate piers, and the tumbling of water in this area gradually intensifies due to discharging water flowing into the bottom of the stilling basin and mixing with air during rapid flow. When the discharge rate in the open channel is low, the flow state in the stilling basin is stable, and the free water surface fluctuation appears in a local area but is generally stable. Backflow will be formed in some areas of the stilling basin, as shown in Figure 5b,g.
With an increase in the discharge rate in the open channel, for example, over 2000 m3/s, discharging water into the stilling basin starts to tumble violently. The turbulence of the flow intensifies, creating a more fully aerated, milky white fluid. The plane backflow phenomenon in the stilling basin disappears, with obvious surging waves formed, particularly on both sides of the stilling basin, as shown in Figure 5c–e. The spray of the highest surging wave may sometimes exceed the top of the left guide wall. As the discharge rate in the open channel increases, the free water surface near the continuous ridge begins to fall clearly, as can be seen in Figure 5f,h. Sometimes a second fall would form after the continuous ridge. The discharging water surface tends to become smooth and steady after a certain distance downstream of the open channel, meeting well with the natural flow of the riverbed downstream.

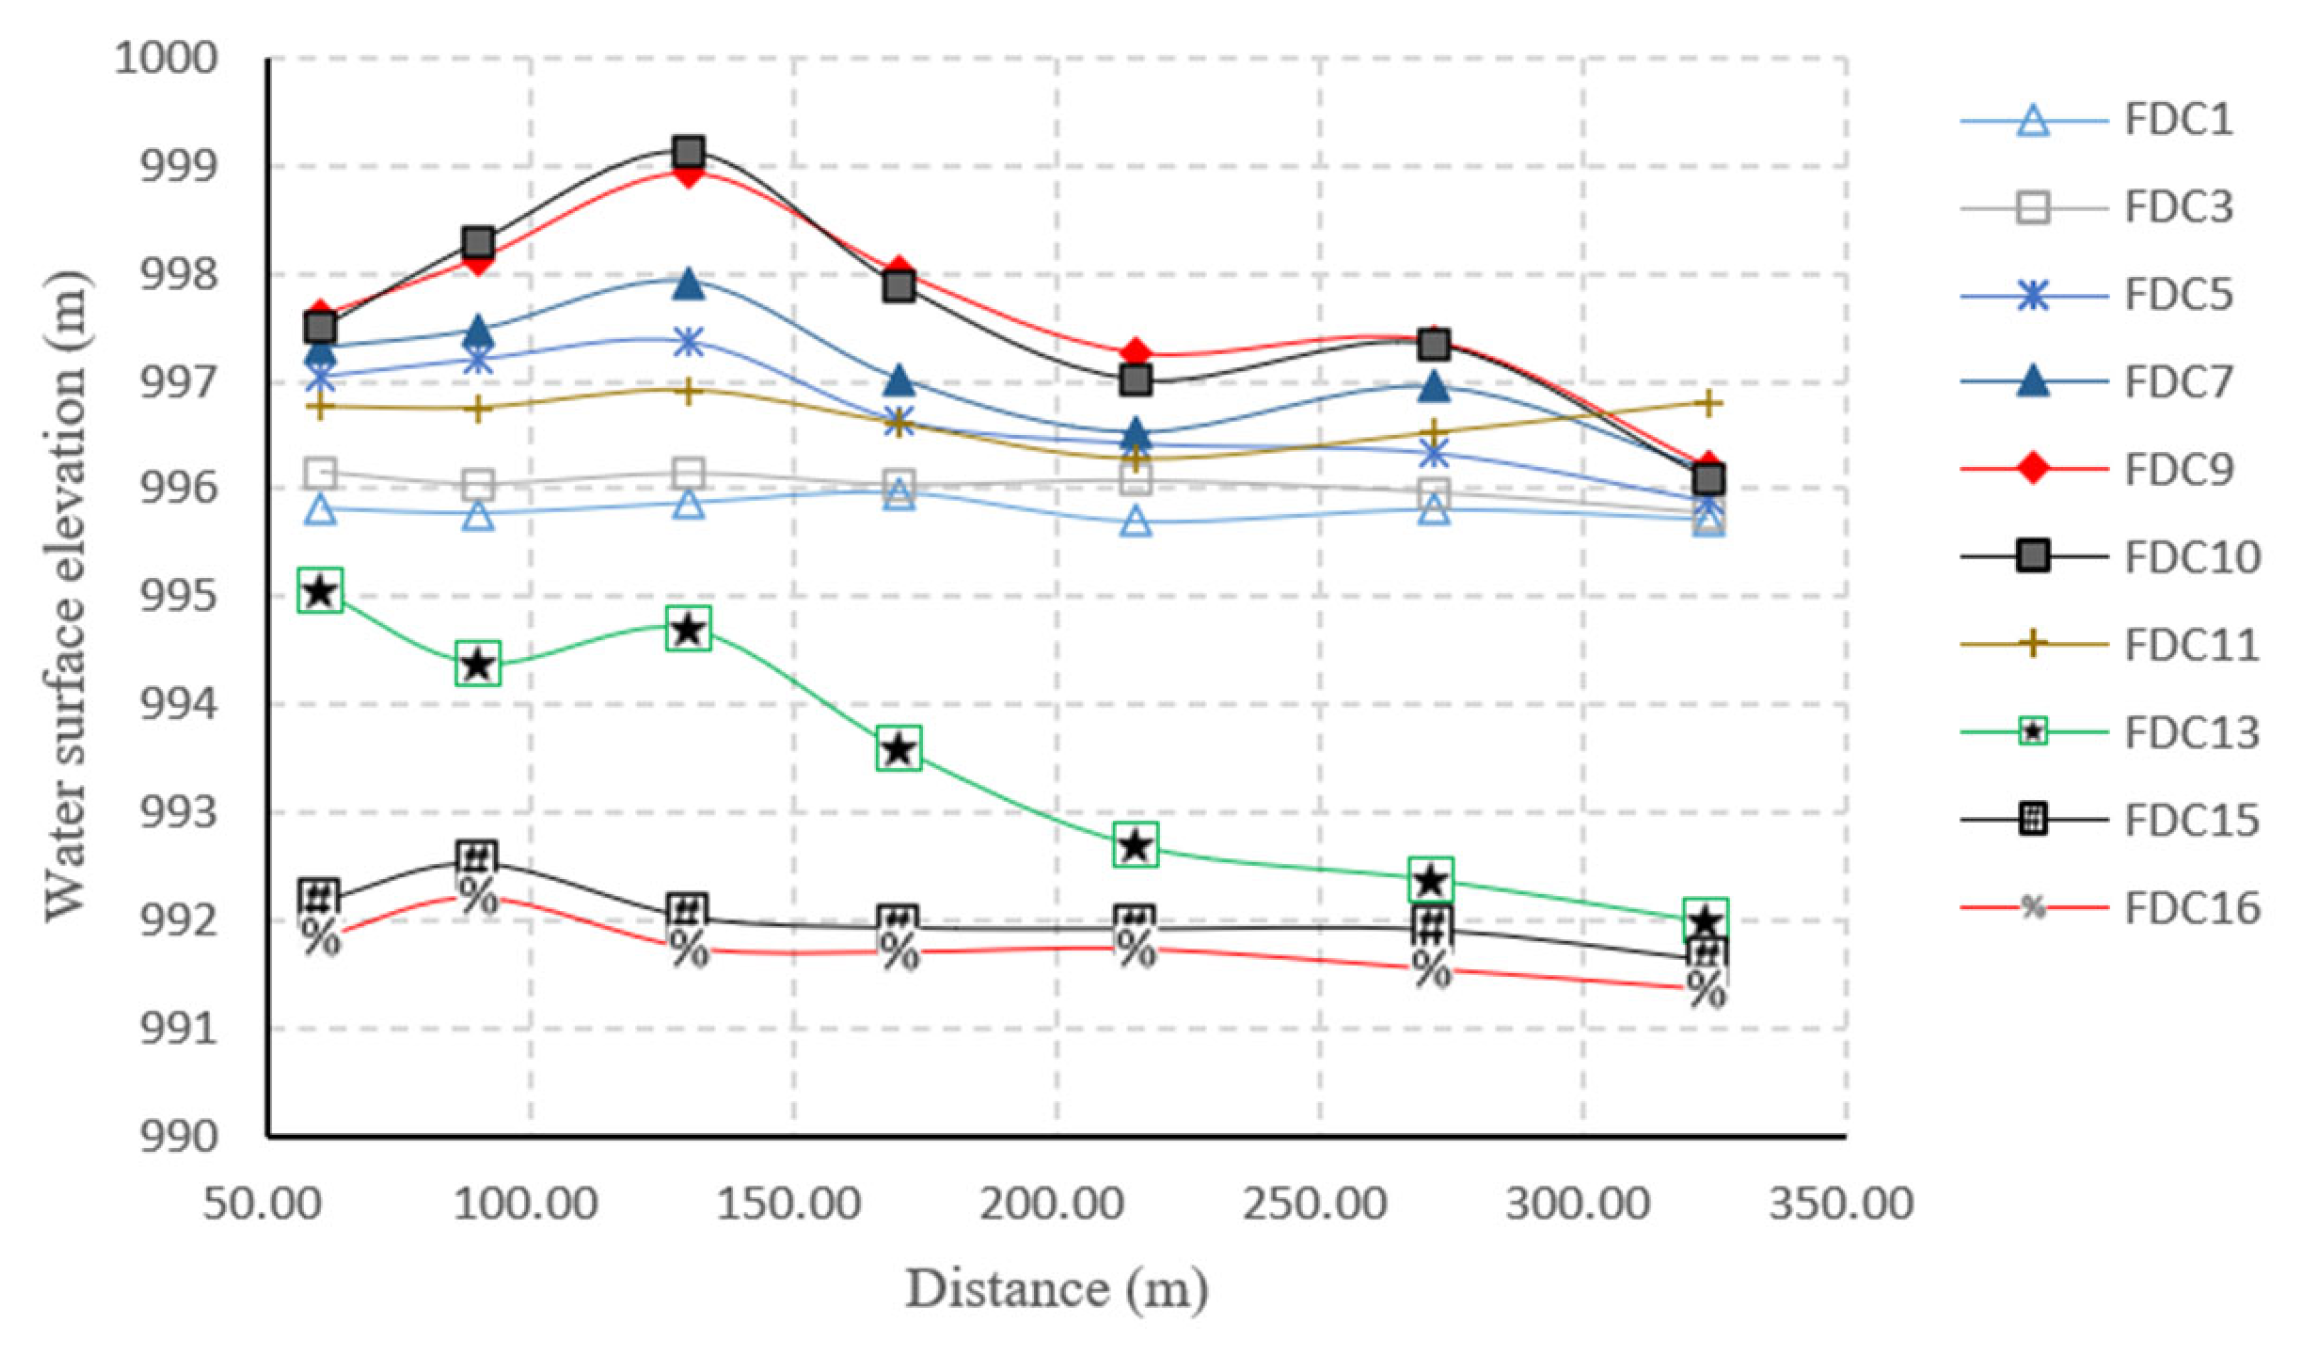
4.2. Water Surface Change

Based on the results of the HPO tests, the free water surface changes in the open channel under different FDCs are shown in Figure 6. The free water surface in the open channel continuously rises with an increase in flood discharge. Moreover, the greater the discharge flow, the more significant the hindrance effect of the continuous ridge, and the more obvious the forced hydraulic jump phenomenon would be. Three FDCs, i.e., FDC No. 1, No. 9, and No. 16, are selected to analyze the hydraulic jump phenomenon. In FDC No. 1 and No. 16, the hydraulic jump is formed only near the exit of the sluice chamber due to the low discharge rate. It is called a submerged hydraulic jump, which disappears very soon, and the free water surface levels off quickly. In FDC No. 9, a violent forced hydraulic jump is formed by the hindrance effect of the continuous ridge under significant discharge conditions. The waves roll violently, and an obvious waterfall is formed behind the continuous ridge, resulting in a second forced hydraulic jump in the stilling basin, as shown in Figure 5e,f.
The characteristics of a hydraulic jump in the stilling basin are highly complex and are influenced by various factors such as water head, sluice gate open mode, depth of the downstream river, the geometry of the stilling basin, the roughness of the base slab, etc. Therefore, analyzing a hydraulic jump using a theoretical approach is challenging, and current research has focused on experimental approaches and numerical methods. In our work, we briefly analyzed a hydraulic jump based on the results of the HPO tests. The schematic diagram of a hydraulic jump is shown in Figure 7. The average width of the stilling basin is 65.0 m, and the continuous ridge is 8.0 m high and 3.0 m wide on the top. The water depth in front of the hydraulic jump is represented as hc, with a flow velocity of vc. The water depth behind a hydraulic jump is represented as h2, with a flow velocity of v2. The hydraulic parameters of the three FDCs are given in Table 2. The flow velocity at the narrowest position of the sloping chute at the gate chamber exit is estimated according to its width, upstream water level, and the opening degree of the gate, which is around 20 m/s. Froude number (Frc) at the contracted section before the hydraulic jump can be calculated by F r c = v c g h c , and Reynolds number (Re) can be obtained by Re = v c h c ν , where ν is the kinematic viscosity of water, ν = 1.01 × 10⁻⁶ m2/s at 20 °C; vc is flow velocity before the hydraulic jump; hc is contracted water depth before the hydraulic jump. The Froude number (Fr) can be used to distinguish the type of hydraulic jump. The higher Fr is, the more obvious the hydraulic jump would be, and the better energy dissipation effect would be achieved for discharge flood. When Fr < 2.5, the energy dissipation efficiency is less than 20%; when Fr > 9.0, the efficiency of energy dissipation reaches up to 85% or even more. The Froude and Reynolds numbers in front of the hydraulic jump are about 2.5~6.0 and 2.0 × 10⁷~1.5 × 10⁸, respectively. In the current case, Fr rises with the decrease in flood discharge rate in the open channel, which means higher energy dissipation efficiency, and vice versa. Therefore, a low-flow flood discharge is more suitable for this working condition.
The judgment of the flow pattern across the continuous ridge could be made as below:
When h t c H 10 0.45 , the flow pattern across the continuous ridge is free overflow. On the contrary, when h t c H 10 > 0.45 , it is submerged flow, where ht is the downstream water depth, c is the height of the continuous ridge, H 10 = Q / ( 0.42 B 2 g ) 2 / 3 , Q is flow rate, B is the width of the continuous ridge, and g is the acceleration of gravity.
For example, in FDC No.1, H10 is 2.577 m according to the abovementioned formula, ht = 996.58−982.00 = 14.58 m, and c = 8.0 m. We then have h t c H 10 = 14.58 8 2.577 = 2.55 > 0.45 . Therefore, the flow pattern across the continuous ridge is a submerged flow. In the same way, it can be judged that flow patterns across the continuous ridge in FDC No.9 and No.16 are also submerged flows.
The contracted water depth (hc) before the hydraulic jump can be obtained [16,17]:
E 0 = h c + Q 2 2 g φ 2 b 2 h c 2
where E0 is the total upstream water head above the base level of the downstream riverbed; φ is the coefficient of flow velocity, here φ = 0.85; and b is the width of the single gate chamber, here b = 9.0 m.
There are three sluice gates at the head of the open channel, and not all of them need to be opened evenly when the flood discharge is low. In some cases, only a single gate is opened, and the water flow could then be diffused at the outlet of the gate chamber, forming a jet flow or transverse expansion flow. The jet flow becomes weaker as it moves farther away from the gate chamber exit. Therefore, it could be considered that the water depth after the hydraulic jump is approximately equal to the position of the continuous ridge.
Water depth (h2) after the hydraulic jump at the continuous ridge can be gained [23,24]:
b h c 2 + Q 2 g b h c = B h 2 2 + Q 2 g B h 2 + β v 2 2 S g
where B is the width of the open channel; S is the vertical area of the continuous ridge; and β is the momentum correction factor. In the current case, we have approximatively B = 65 m, S = 520 m2, and β = 1.0.
Flow velocity vc before the hydraulic jump can be written by v c = Q b h c .
The rate of energy dissipation (K) after the hydraulic jump at the continuous ridge can be written as [23,24]:
K = E 0 E 2 E 0
where E2 is the total water head above the base level of the downstream riverbed at the continuous ridge.
The hydraulic indexes for the three FDCs are provided in Table 2. From Table 2, it can be observed that the error of h2 is relatively large in FDC No.1 and No.16. At the same time, it is small in FDC No.9. The reason for this is that in FDC No.1 and No.16, only sluice gate No.6# is open. The effect of the jet flow from the outlet of the gate chamber is more pronounced than in FDC No.9. The rate of energy dissipation under the different FDCs is high—more than 60%—indicating that the REDFs’ effect is efficient. However, the energy dissipation effect worsens as the discharge flow rate increases.
Based on the prototype observation of the water surface at the left guide wall of the open channel, it was found that the flow pattern is relatively stable under various FDCs. The water surface near the continuous ridge changes relatively dramatically, while the free water surface variation in other areas is relatively small. The highest measured water level in the open channel is lower than the top of the left guide wall. Therefore, the height of the guide wall is within a reasonable range.
However, when the discharge rate of the power station is high (e.g., Qin > 6000 m3/s) along with a high water level in the downstream tailwaters (e.g., Hdown > 995.50 m), the water surface and surging waves in the stilling basin are relatively high when the flood is discharged into the open channel. Therefore, as long as the discharge rate in the open channel reaches 3000 m3/s, the spray stirred up in the stilling basin can occasionally overtop the guide wall at the left of the stilling basin. However, when the discharge rate of the power station is low, and the water level of downstream tailwater is low, the falling flow after a continuous ridge in the open channel can be clearly formed at a significant discharge rate in the stilling basin.

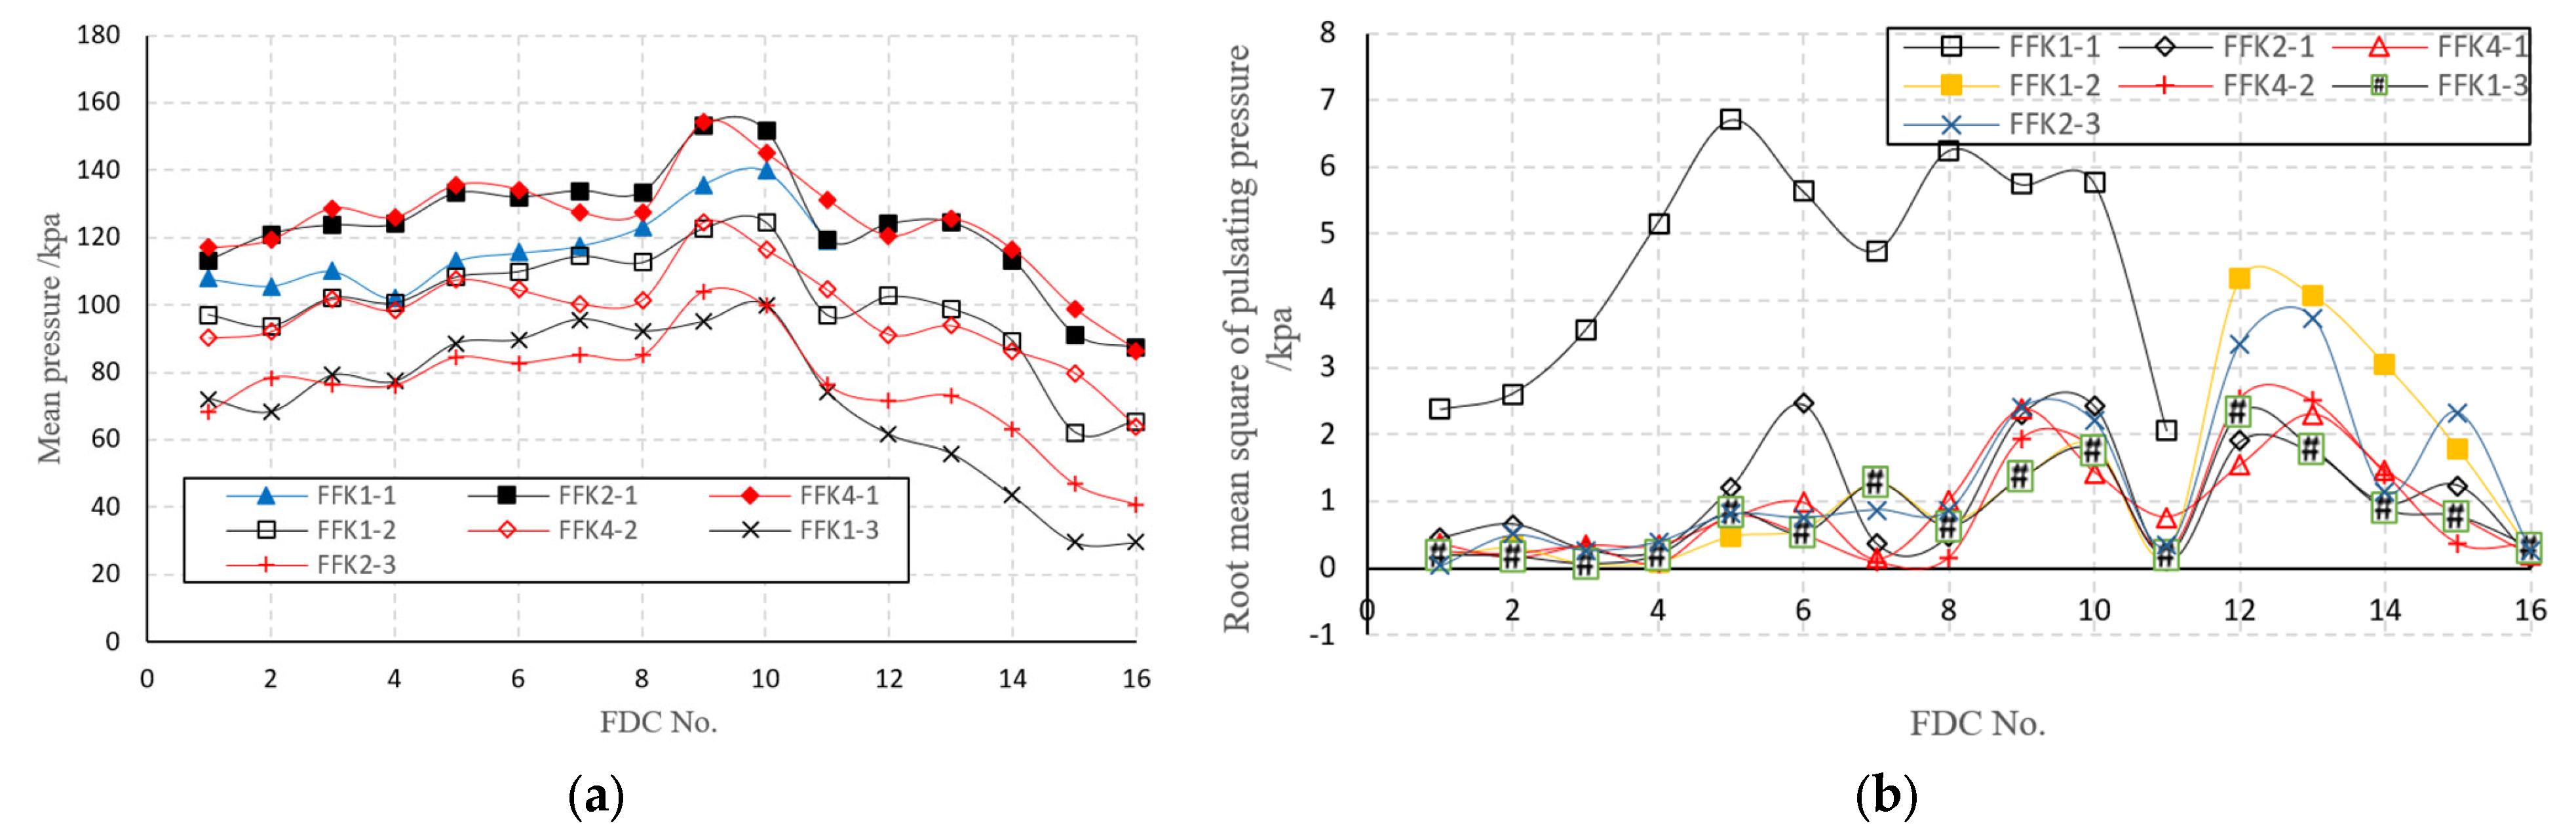
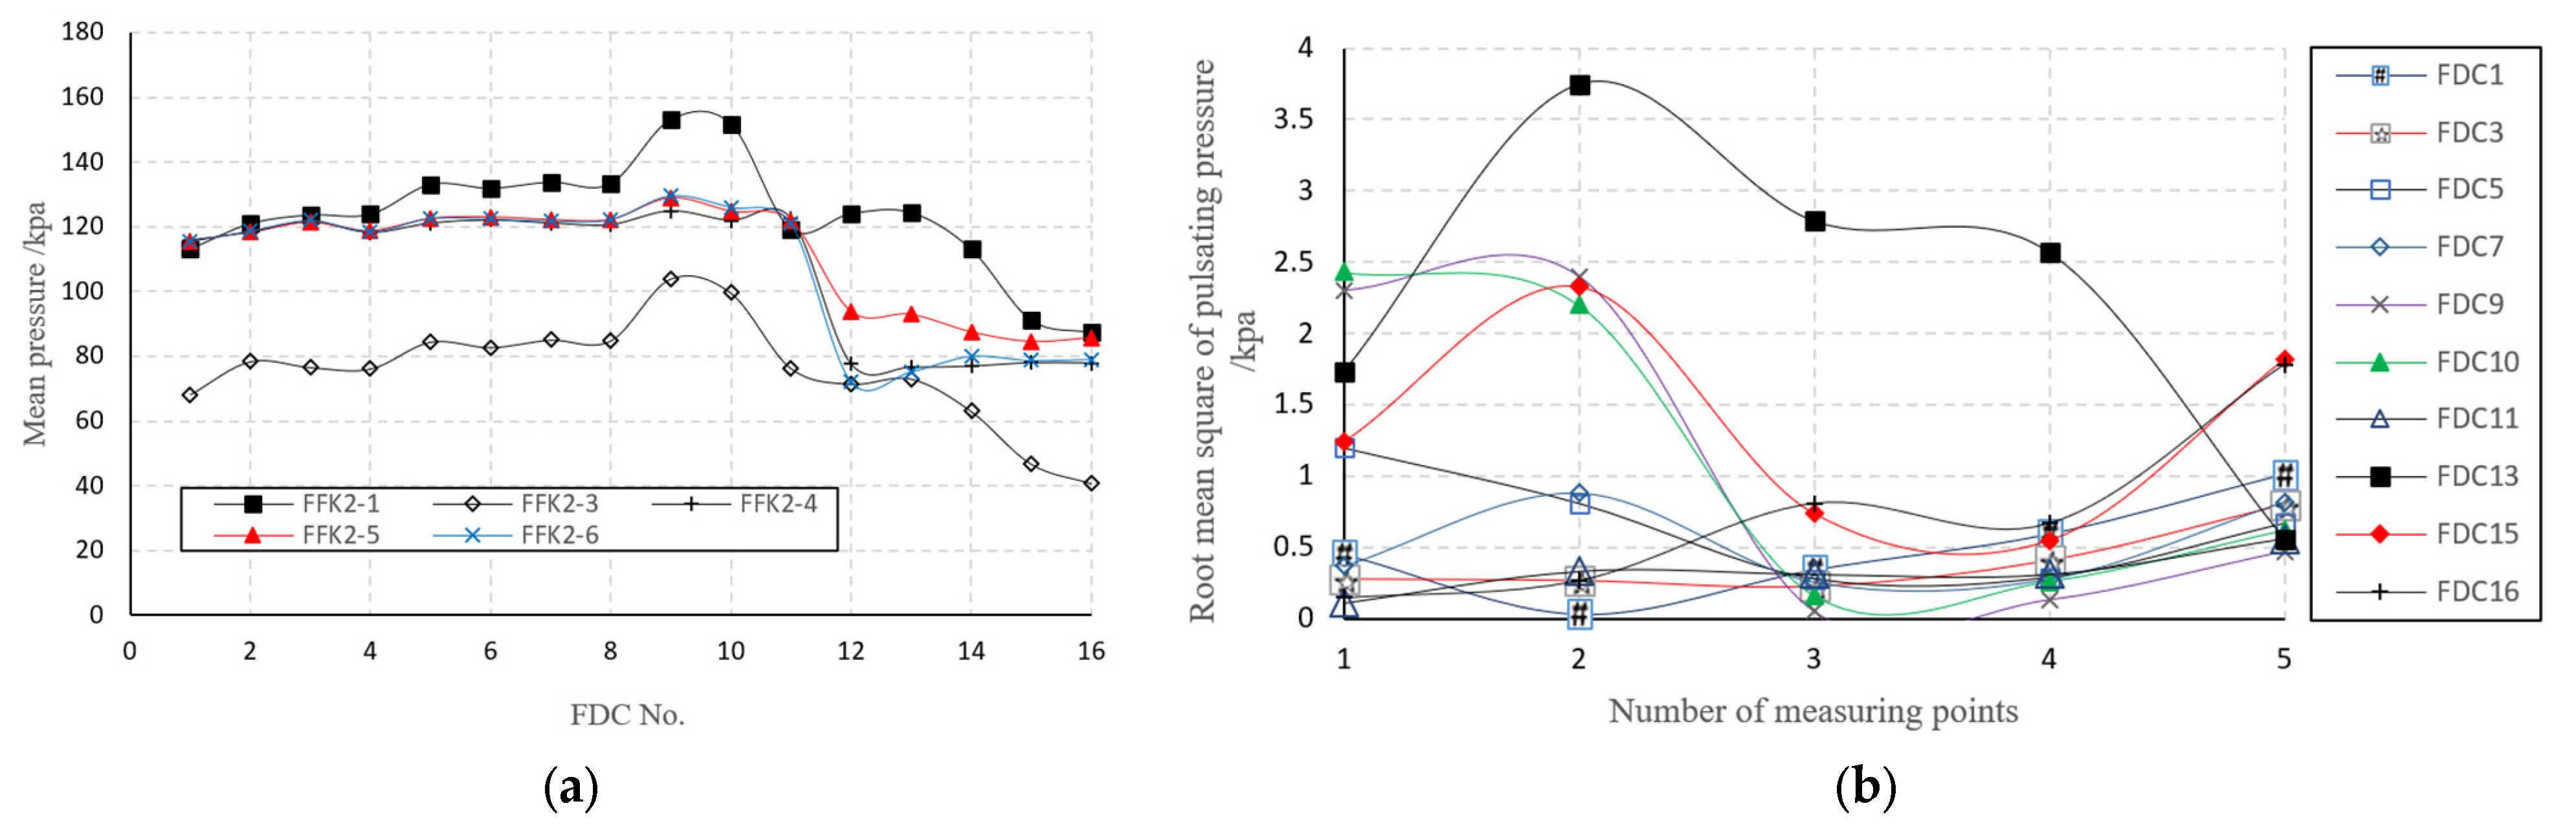
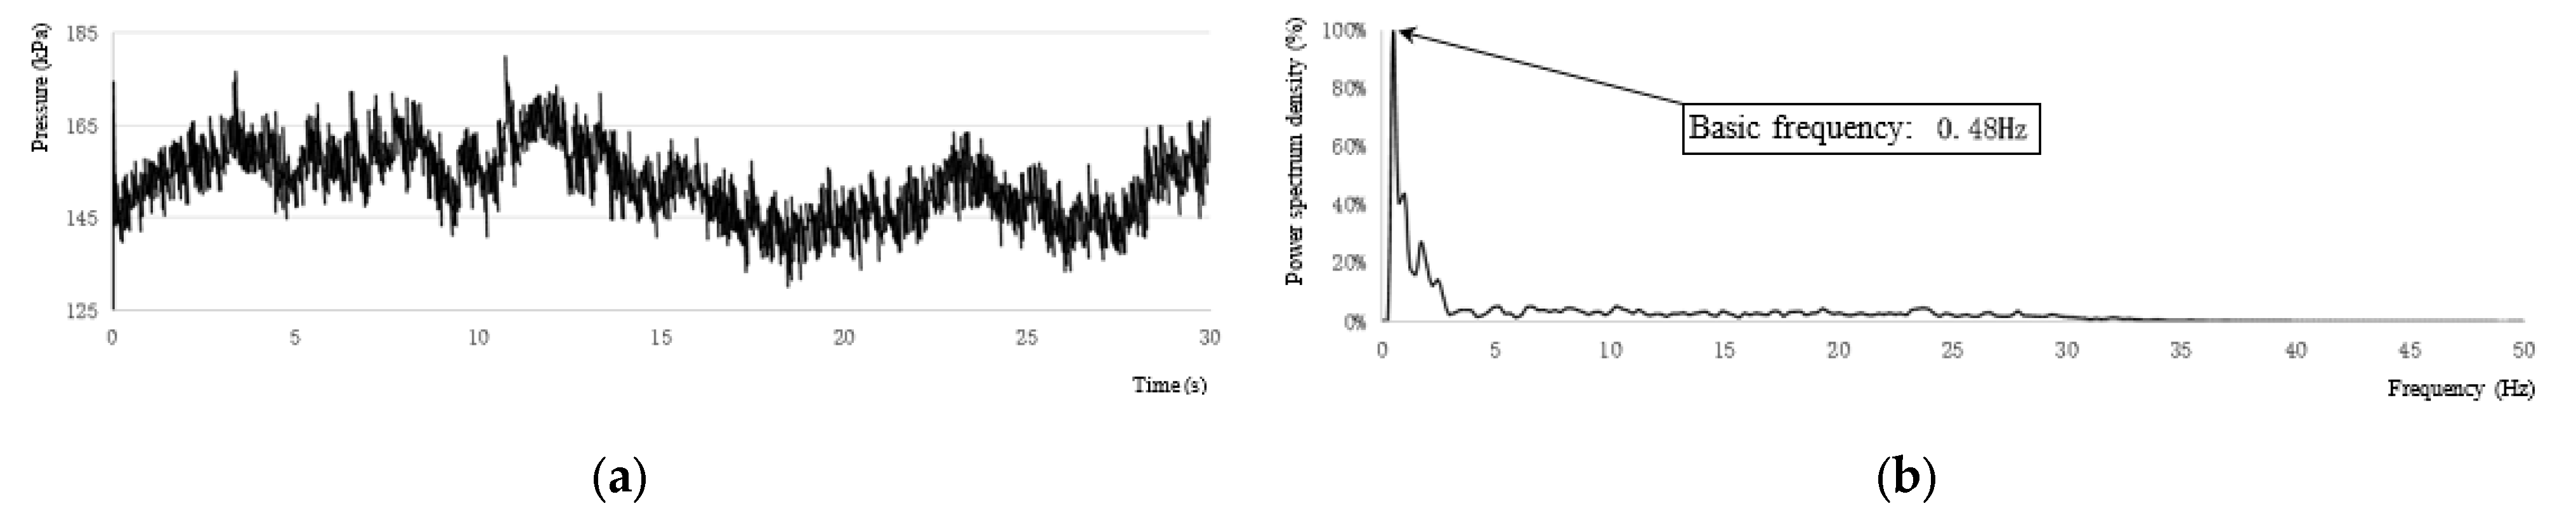
4.3. Pulsating Pressure

The properties of pulsating pressure are closely related to the state of water flow in the open channel. Therefore, it is crucial for design engineers to understand the characteristics of the pulsating pressure distribution within the continuous sill and base slab during flood discharge in the open channel for stability analysis of the guide wall [25,26,27].
Figure 8a,b shows the mean pressure and root mean square of the pulsating pressure at each measuring point under different FDCs, while Figure 9a,b shows the mean pressure and root mean square of the pulsating pressure along the centerline of the open channel. The time history change in the pulsating pressure and power spectrum density vs. frequency for measuring FFK2-1 in FDC 9 is shown in Figure 10a,b.
The results obtained from the HPO tests show that the mean pressure of different measuring points within the continuous sill and reinforcement base slab under different FDCs is positive, and the impact of dynamic pressure on them is insignificant. When the discharge rate in the open channel reaches 1500–3000 m3/s, the maximum mean pressure within the continuous sill and reinforcement base slab is 154.25 kPa, while the maximum dynamic pressure is about 20 kPa. It indicates that the EDFs in the stilling basin are working effectively, and the impact of discharging flow in the stilling basin on the continuous sill and reinforcement base slab is small. Under different FDCs, the root mean square of the pulsating pressure is small, not exceeding 6.71 kPa, and increases correspondingly with the increase in discharge rate in the open channel. When the discharge rate reaches 500–1000 m3/s, the maximum root mean square of the pulsating pressure within the continuous sill is up to 3.56 kPa, while in the reinforcement base slab it is 1.82 kPa. When the discharge rate is up to 1500–3000 m3/s, the maximum root mean square of the pulsating pressure within the continuous sill is 6.71 kPa, while in the reinforcement base slab it is 2.79 kPa. Throughout different FDCs, the dominant frequency of the pulsating pressure within the continuous sill and reinforcement base slab is less than 5 Hz, belonging to low-frequency pulsation.

5. Suggestions on Flood Discharge Mode and Discussion

To ensure the safety of discharging floods in the stilling basin, three key points must be met simultaneously: (i) a reasonable operation mode of the sluice gate; (ii) reliable energy dissipation and anti-scouring facilities in the stilling basin; and (iii) good stability of the continuous sill and reinforcement base slab. Based on hydraulic prototype observation results in various flood discharge conditions, the following suggestions for the flood discharge mode can be proposed:
(1)
From the results of the HPO test, it was found that the flow state in the open channel is closely related to the opening mode of the sluice gate and the discharge rate in the open channel. When the discharge rate of any single sluice gate reaches 500 m3/s, the impact on the continuous sill by the discharging water is more severe than in other FDCs. Therefore, the discharge rate of a single sluice gate should be reduced to 250 m3/s. On the contrary, when the discharge rate in the open channel exceeds 2000 m3/s, the discharge of water into the stilling basin starts to tumble violently, and the fluctuation of the free water surface at the end of the open channel is significantly intensified, leading to worse downstream river flow conditions. Consequently, a discharge rate in the open channel of more than 2000 m3/s should be avoided.
(2)
When the opening mode of sluice gates No.5#~7# is not symmetrical, an asymmetrical flow of discharging water in the open channel may occur, and the transverse backflow phenomenon may occur in some areas of the stilling basin. Therefore, if sluice gates No.5#~7# at the head of the open channel must be opened for flood release, it is strongly recommended that they be opened evenly and symmetrically.
During our PHO tests, the work conditions in the field were relatively tough. When the sluice gate is opened for discharging water, the hydraulic jump and turbulence in the open channel are violent, threatening the personal safety of staff for in situ measurement data. Consequently, collecting a multitude of data points is a challenging task. Many hydraulic properties are investigated to overcome a host of difficulties, but other parameters, such as flow velocity and water depth at the outlet of the gate chamber, the length of the hydraulic jump, air concentration in the discharge flow, and the dimension of the bubble in water, are challenging to measure. Meanwhile, the free water surface stagnation is challenging to identify by naked-eye observation of the turbulent free water surface fluctuation. Accordingly, some uncertainties are introduced when measuring the subsequent depth at the end of the hydraulic jump.
The mode of the sluice gate opening can influence the characteristics of the hydraulic jump produced in the stilling basin. When the gate structure consists of multiple side-by-side undershoot sluice gates, single sluice gates can probably be opened based on the operation requirement. If only one sluice gate is needed to be open, the discharge flow from the gate chamber can cause transverse expansion in the stilling basin when releasing. Under this condition, the hydraulic jump produced in the stilling basin is entirely different from that in the condition where all gates are open. Nevertheless, research on the effect of gate asymmetry and uneven opening on the hydraulic jump is lacking and challenging for researchers.

6. Conclusions

To assess the safety of EDFs in the stilling basin after technical reconstruction at the downstream side of the sluice, corresponding HPO tests were conducted to investigate the operational behavior and hydrodynamic characteristics during flood discharge in the open channel. Based on these tests, the following conclusions were drawn:
(1)
HPO tests provide a more accurate and reliable assessment of the effectiveness of reconstructed EDFs in open channels at hydropower stations;
(2)
The results of HPO tests can be used to improve the design and operation of EDFs by providing detailed information on the characteristics of discharge flow and the dynamic response of hydraulic structures during sluice opening periods;
(3)
Several suggestions are provided for improving the flood discharge mode at hydropower stations based on the results of the HPO tests to ensure safe operation of open channels during flood discharge;
(4)
The importance of studying HPO tests on reconstructed EDFs is highlighted to ensure their safe and efficient operation in open channels at hydropower stations and to advance our understanding of complex hydraulic phenomena.
This article offers insights into the effectiveness of reconstructed energy dissipation facilities in open channels at hydropower stations through HPO tests. However, there remains considerable scope for further research in this domain. Future investigations could concentrate on enhancing the HPO test methodology and devising more sophisticated techniques for measuring and analyzing flow patterns, free water surface fluctuations, air entrainment in air-water flows, and pulsating pressure changes in open channels under various flood discharge conditions. A thorough examination of scale effects between HPO and HMT is also warranted. The ultimate objective is to explore the complex characteristics of two-phase air-water fluid dynamics and substantial energy dissipation rates, ensuring the safe and efficient operation of open channels at hydropower stations while advancing our knowledge in this field.

Author Contributions

H.W., K.T., Y.L., B.S., M.W. and J.X. designed the analysis, developed the software, wrote the original and revised manuscript, and conducted data analysis and details of the work. J.X. and H.W. conceptualized and designed the research experiment, wrote the original/revised drafts, designed, re-designed, and verified image data analysis, and guided the direction of the work. All authors have read and agreed to the published version of the manuscript.

Funding

This research was financially supported by the Yunnan Natural Science Foundation of China (Grant No. KKZ3202004052), Anhui International Joint Research Center of Data Diagnosis and Smart Maintenance on Bridge Structures (Grant No. 2021AHGHZD02), and the Open Foundation for Key Laboratory of Yunnan University (Grant No. KKZ6202104005).

Institutional Review Board Statement

Not applicable.

Informed Consent Statement

Not applicable.

Data Availability Statement

The data presented in this study are available on request from the corresponding author.

Conflicts of Interest

The authors declare no conflict of interest. The funders had no role in the design of the study; in the collection, analyses, or interpretation of data; in the writing of the manuscript; or in the decision to publish the results.

Nomenclature

SymbolUnitsDefinition of the Symbols
BLWidth of the continuous sill
bLWidth of a single gate chamber
cLHeight of the continuous sill
E0LTotal upstream water head above the base level of the downstream riverbed
E2LTotal water head above the base level of the downstream riverbed at the continuous ridge
Frc-Froude number
gLT−2Acceleration of gravity
h2LWater depth behind the hydraulic jump
hcLWater depth in the front of the hydraulic jump
htLDownstream water depth
K Rate of energy dissipation
QL3T−1Flow rate
Re-Reynolds number
SL2Vertical area of the continuous sill
vcLT−1Flow velocity in the front of the hydraulic jump
v2LT−1Flow velocity behind the hydraulic jump

References

  1. Nouri, M.; Sihag, P.; Salmasi, F.; Kisi, O. Energy loss in skimming flow over cascade spillways: Comparison of artificial intelligence-based and regression methods. Appl. Sci. 2020, 10, 6903. [Google Scholar] [CrossRef]
  2. Chanson, H. Energy Dissipation in Hydraulic Structures; CRC Press: Boca Raton, FL, USA, 2015. [Google Scholar]
  3. Parsaiea, A.; Haghiabi, A.H. The hydraulic investigation of circular crested stepped spillway. Flow Meas. Instrum. 2019, 70, 101624. [Google Scholar] [CrossRef]
  4. AlTalib, A.N.; Mohammed, A.Y.; Hayawi, H.A. Hydraulic jump and energy dissipation downstream stepped weir. Flow Meas. Instrum. 2019, 69, 101616. [Google Scholar] [CrossRef]
  5. Wu, J.; Yao, L.; Ma, F. Hydraulics of a multiple slit-type energy dissipater. J. Hydrodyn. 2014, 26, 86–93. [Google Scholar] [CrossRef]
  6. Abdelmonem, Y.K.; Shabayek, S.; Khairy, A.O. Energy dissipation downstream sluice gate using a pendulum sill. Alex. Eng. J. 2018, 57, 3977–3983. [Google Scholar] [CrossRef]
  7. Idrees, A.K.; Al-Ameri, R. Investigation of flow characteristics and energy dissipation over new shape of the trapezoidal labyrinth weirs. Flow Meas. Instrum. 2023, 89, 102276. [Google Scholar] [CrossRef]
  8. Dong, Z.; Wang, J.; Vetsch, D.F.; Boes, R.M.; Tan, G. Numerical simulation of air–water two-phase flow on stepped spillways behind x-shaped flaring gate piers under very high unit discharge. Water 2019, 11, 1956. [Google Scholar] [CrossRef]
  9. James, C.S. Hydraulic Structures; Springer: Berlin/Heidelberg, Germany, 2020. [Google Scholar]
  10. Itoh, T.; Ikeda, A.; Nagayama, T.; Mizuyama, T. Hydraulic model tests for propagation of flow and sediment in floods due to breaking of a natural landslide dam during a mountainous torrent. Int. J. Sediment Res. 2018, 33, 107–116. [Google Scholar] [CrossRef]
  11. Džafo, H.; Metović, S.; Kasamović, E. Using Hydraulic Model Tests for Water Intake Structure Redesign of Hydro Power Plant. In Advanced Technologies, Systems, and Applications VI: Proceedings of the International Symposium on Innovative and Interdisciplinary Applications of Advanced Technologies (IAT) 2021, Sarajevo, Bosnia and Herzegovina, 23–26 June 2021; Springer: Berlin/Heidelberg, Germany, 2022; pp. 329–336. [Google Scholar]
  12. Mokashi, A.A.; Hirpurkar, P.S. Hydraulic scaling and similitude from model to prototype. Int. J. Recent Technol. Eng. 2019, 8, 390–392. [Google Scholar] [CrossRef]
  13. Zhou, Z.; Wang, J.; Zhu, D.Z. Energy dissipation in a deep tailwater stilling basin with partial flaring gate piers. Can. J. Civ. Eng. 2020, 47, 523–533. [Google Scholar] [CrossRef]
  14. Ren, H.; Zhang, D.; Gong, S.; Zhou, K.; Xi, C.; He, M.; Li, T. Dynamic impact experiment and response characteristics analysis for 1: 2 reduced-scale model of hydraulic support. Int. J. Min. Sci. Technol. 2021, 31, 347–356. [Google Scholar] [CrossRef]
  15. Espinosa-Paredes, G.; Alvarez-Ramirez, J. Scope and limitations of the structural and dynamic analysis of a thermal–hydraulic model. Ann. Nucl. Energy 2003, 30, 931–942. [Google Scholar] [CrossRef]
  16. Chanson, H. Hydraulic jumps: Turbulence and air bubble entrainment. Houille Blanche 2011, 97, 5–16. [Google Scholar] [CrossRef]
  17. Guo, T.; Wang, Q.; Li, D.; Zhuang, J.; Wu, L. Flow hydraulic characteristic effect on sediment and solute transport on slope erosion. CATENA 2013, 107, 145–153. [Google Scholar] [CrossRef]
  18. Escaler, X.; Dupont, P.; Avellan, F. Experimental investigation on forces due to vortex cavitation collapse for different materials. Wear 1999, 233, 65–74. [Google Scholar] [CrossRef]
  19. Liu, M.; Zeng, L.; Wu, L.; Chen, G.; Shen, L.; Abi, E. In-Situ Test Method for Hydrodynamic Characteristics of Water Flowing Around Piles. Front. Environ. Sci. 2022, 96, 855334. [Google Scholar] [CrossRef]
  20. Han, M.; Liu, Y.; Zheng, K.; Ding, Y.; Wu, D. Investigation on the modeling and dynamic characteristics of a fast-response and large-flow water hydraulic proportional cartridge valve. Proc. Inst. Mech. Eng. Part C J. Mech. Eng. Sci. 2020, 234, 4415–4432. [Google Scholar] [CrossRef]
  21. Wang, H.; Tang, R.; Bai, Z.; Liu, S.; Sang, W.; Bai, R. Prototype air–water flow measurements in D-type hydraulic jumps. J. Hydraul. Res. 2023, 61, 145–161. [Google Scholar] [CrossRef]
  22. Bai, Z.; Bai, R.; Tang, R.; Wang, H.; Liu, S. Case Study of Prototype Hydraulic Jump on Slope: Air Entrainment and Free-Surface Measurement. J. Hydraul. Eng. 2021, 149, 05021007. [Google Scholar] [CrossRef]
  23. Li, W. Hydraulic Calculation Manual; China Water Power Press: Beijing, China, 2006. [Google Scholar]
  24. Wu, C. Hydraulics; Higher Education Press: Beijing, China, 2008. [Google Scholar]
  25. Lian, J.; Cui, G.; Huang, J. Study on flow induced vibration of spillway guide wall. J. Hydraul. Eng. 1998, 11, 34–38. [Google Scholar]
  26. Peng, X.; Guo, H.; Zhang, R. Wavelet analysis on flow fluctuating pressure acting on plunge pool slope. J. Hydraul. Eng. 2003, 34, 26–31. [Google Scholar]
  27. Bellin, A.; Fiorotto, V. Direct dynamic force measurement on slabs in spillway stilling basins. J. Hydraul. Eng. 1995, 121, 686–693. [Google Scholar] [CrossRef]
Figure 1. Plane layout of the hydropower station.
Applsci 13 06216 g001
Figure 2. Typical cross-section of the stilling basin.
Applsci 13 06216 g002
Figure 3. Layout of the continuous sill, reinforcement slab, and observation points for water surface in the open channel.
Applsci 13 06216 g003
Figure 4. Monitoring section for pulsating pressure within the continuous sill and reinforcement base slab: (a) Transverse direction; (b) Longitudinal direction.
Applsci 13 06216 g004
Figure 5. Discharge flow state in the open channel under various flood discharge conditions: (a) FDC No.1; (b) FDC No.2; (c) FDC No.5; (d) FDC No.7; (e) and (f) FDC No.9; (g) FDC No.11; (h) FDC No.13.
Applsci 13 06216 g005
Figure 6. Water surface changes in the open channel under different FDCs.
Applsci 13 06216 g006
Figure 7. Schematic diagram for a hydraulic jump calculation.
Applsci 13 06216 g007
Figure 8. Mean pressure and root mean square root of pulsating pressure at each measuring point: (a) mean pressure; (b) root mean square.
Applsci 13 06216 g008
Figure 9. Mean pressure and root mean square of pulsating pressure along the center line of the open channel: (a) mean pressure; (b) root mean square.
Applsci 13 06216 g009
Figure 10. (a) Time history curve of pulsating pressure and power spectrum density; (b) frequency for measuring point FFK2-1 in FDC 9.
Applsci 13 06216 g010
Table 1. Typical flood discharge conditions.
FDC No.Total Water Discharge Rate
(m3/s)
Water Discharge Rate by the Open Channel
(m3/s)
Upstream Water Level
(m)
Downstream Water Level
(m)
Opening Mode of Sluice Gates at the Head of the Open Channel
5#6#7#
158105001012.35996.58ClosePartial open 2.3 mClose
3594010001012.67995.94Partial open 2.3 mClosePartial open 2.3 m
5600020001013.21995.55Partial open 3.2 mPartial open 3.2 mPartial open 3.2 m
9596030001013.27995.78Partial open 5.2 mPartial open 5.2 mPartial open 5.2 m
10596030001013.33995.35Partial open 5.7 mPartial open 5.2 mPartial open 4.7 m
1165805001013.65996.69CloseClosePartial open 2.3 m
12266020001013.86991.33Partial open 3.7 mPartial open 3.2 mPartial open 2.7 m
14258015001013.96991.15Partial open 2.3 mPartial open 2.3 mPartial open 2.3 m
1625402501014.04991.56ClosePartial open 1.1 mClose
Table 2. Hydraulic indexes for three FDCs.
FDC No.Q
(m3/s)
E0
(m)
vc
(m/s)
v2
(m/s)
b
(m)
hc
(m)
h2
(m)
FrcReh2 Error
(m)
K
(%)
150030.3519.751.299.02.8133.8783.765.5 × 107−1.9980.4
9300031.2718.975.099.05.8578.7522.501.1 × 108−0.1867.2
1625032.0420.852.169.01.3322.4485.772.75 × 1070.7093.8
Disclaimer/Publisher’s Note: The statements, opinions and data contained in all publications are solely those of the individual author(s) and contributor(s) and not of MDPI and/or the editor(s). MDPI and/or the editor(s) disclaim responsibility for any injury to people or property resulting from any ideas, methods, instructions or products referred to in the content.

