
ML-Based JIT1 Optimization for Throughput Maximization in Cluster Tool Automation


Abstract
:1. Introduction
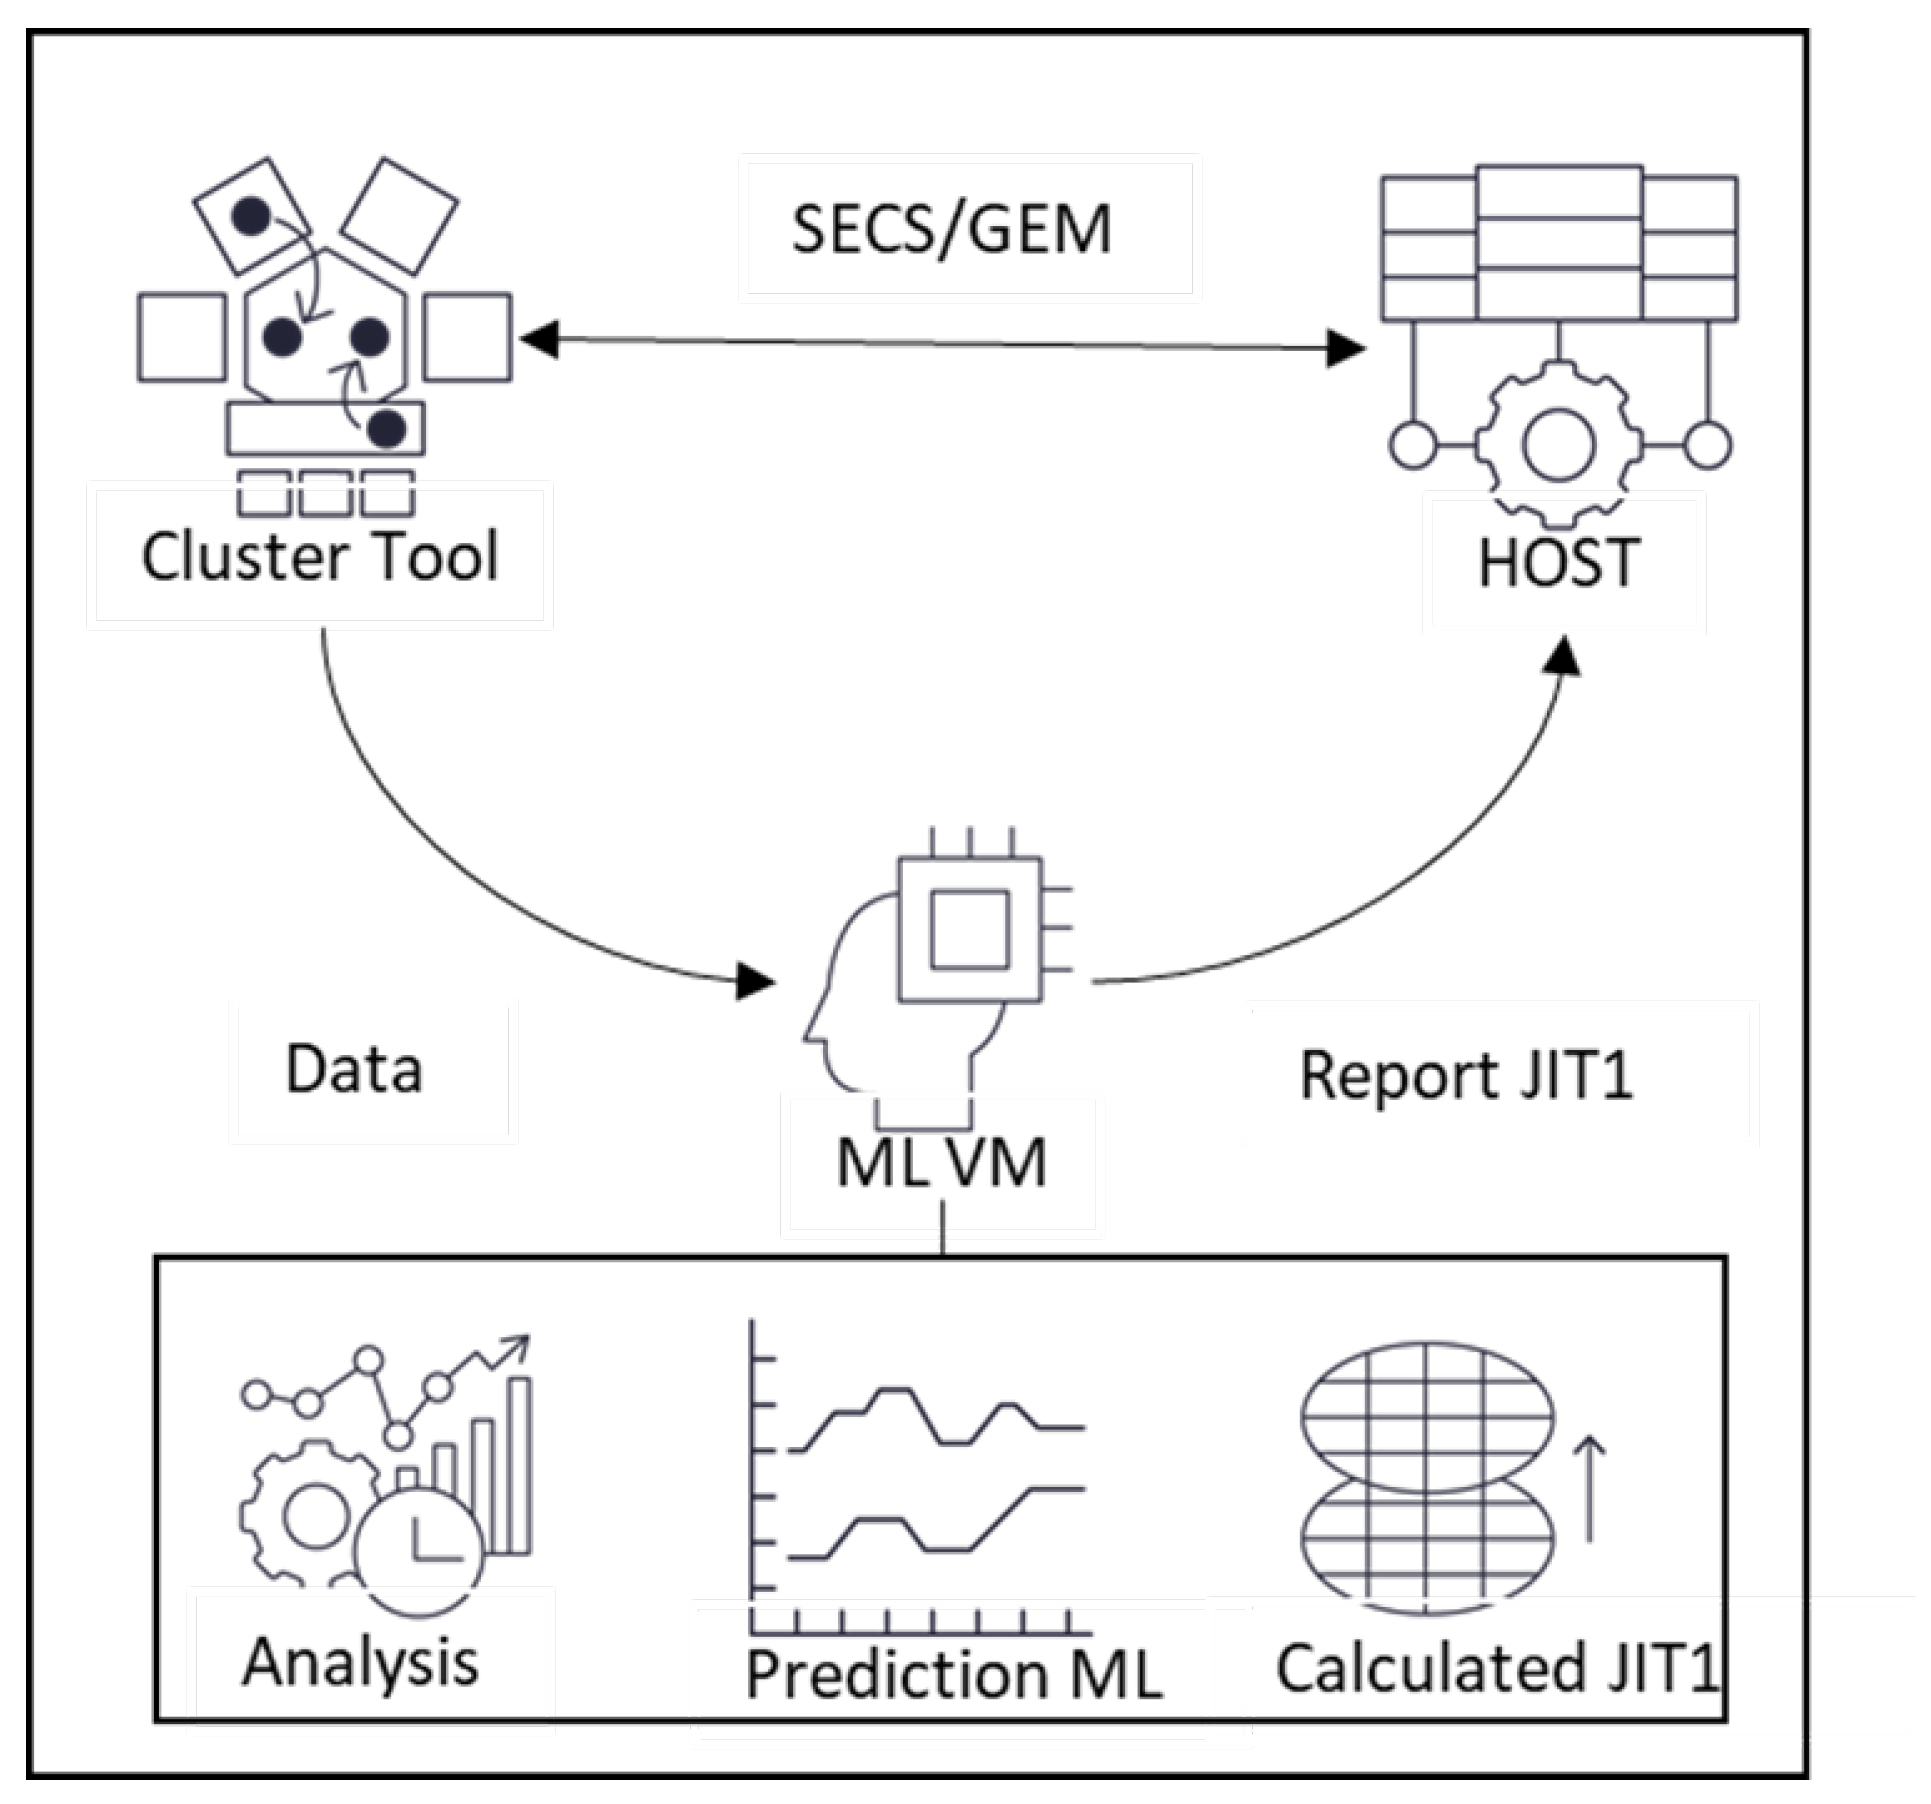
- To understand the structural characteristics of cluster tools, ML-based analysis of JIT1 is proposed to maximize throughput, and an automation system is used to predict and apply optimal JIT1 to facilities. Lam Research’s cluster facility simulation was used to obtain cluster facility data, and Lam Research’s host simulation was used for automation modeling. The simulation configuration cited the SECS/GEM procedure of semiconductor manufacturing fabs.
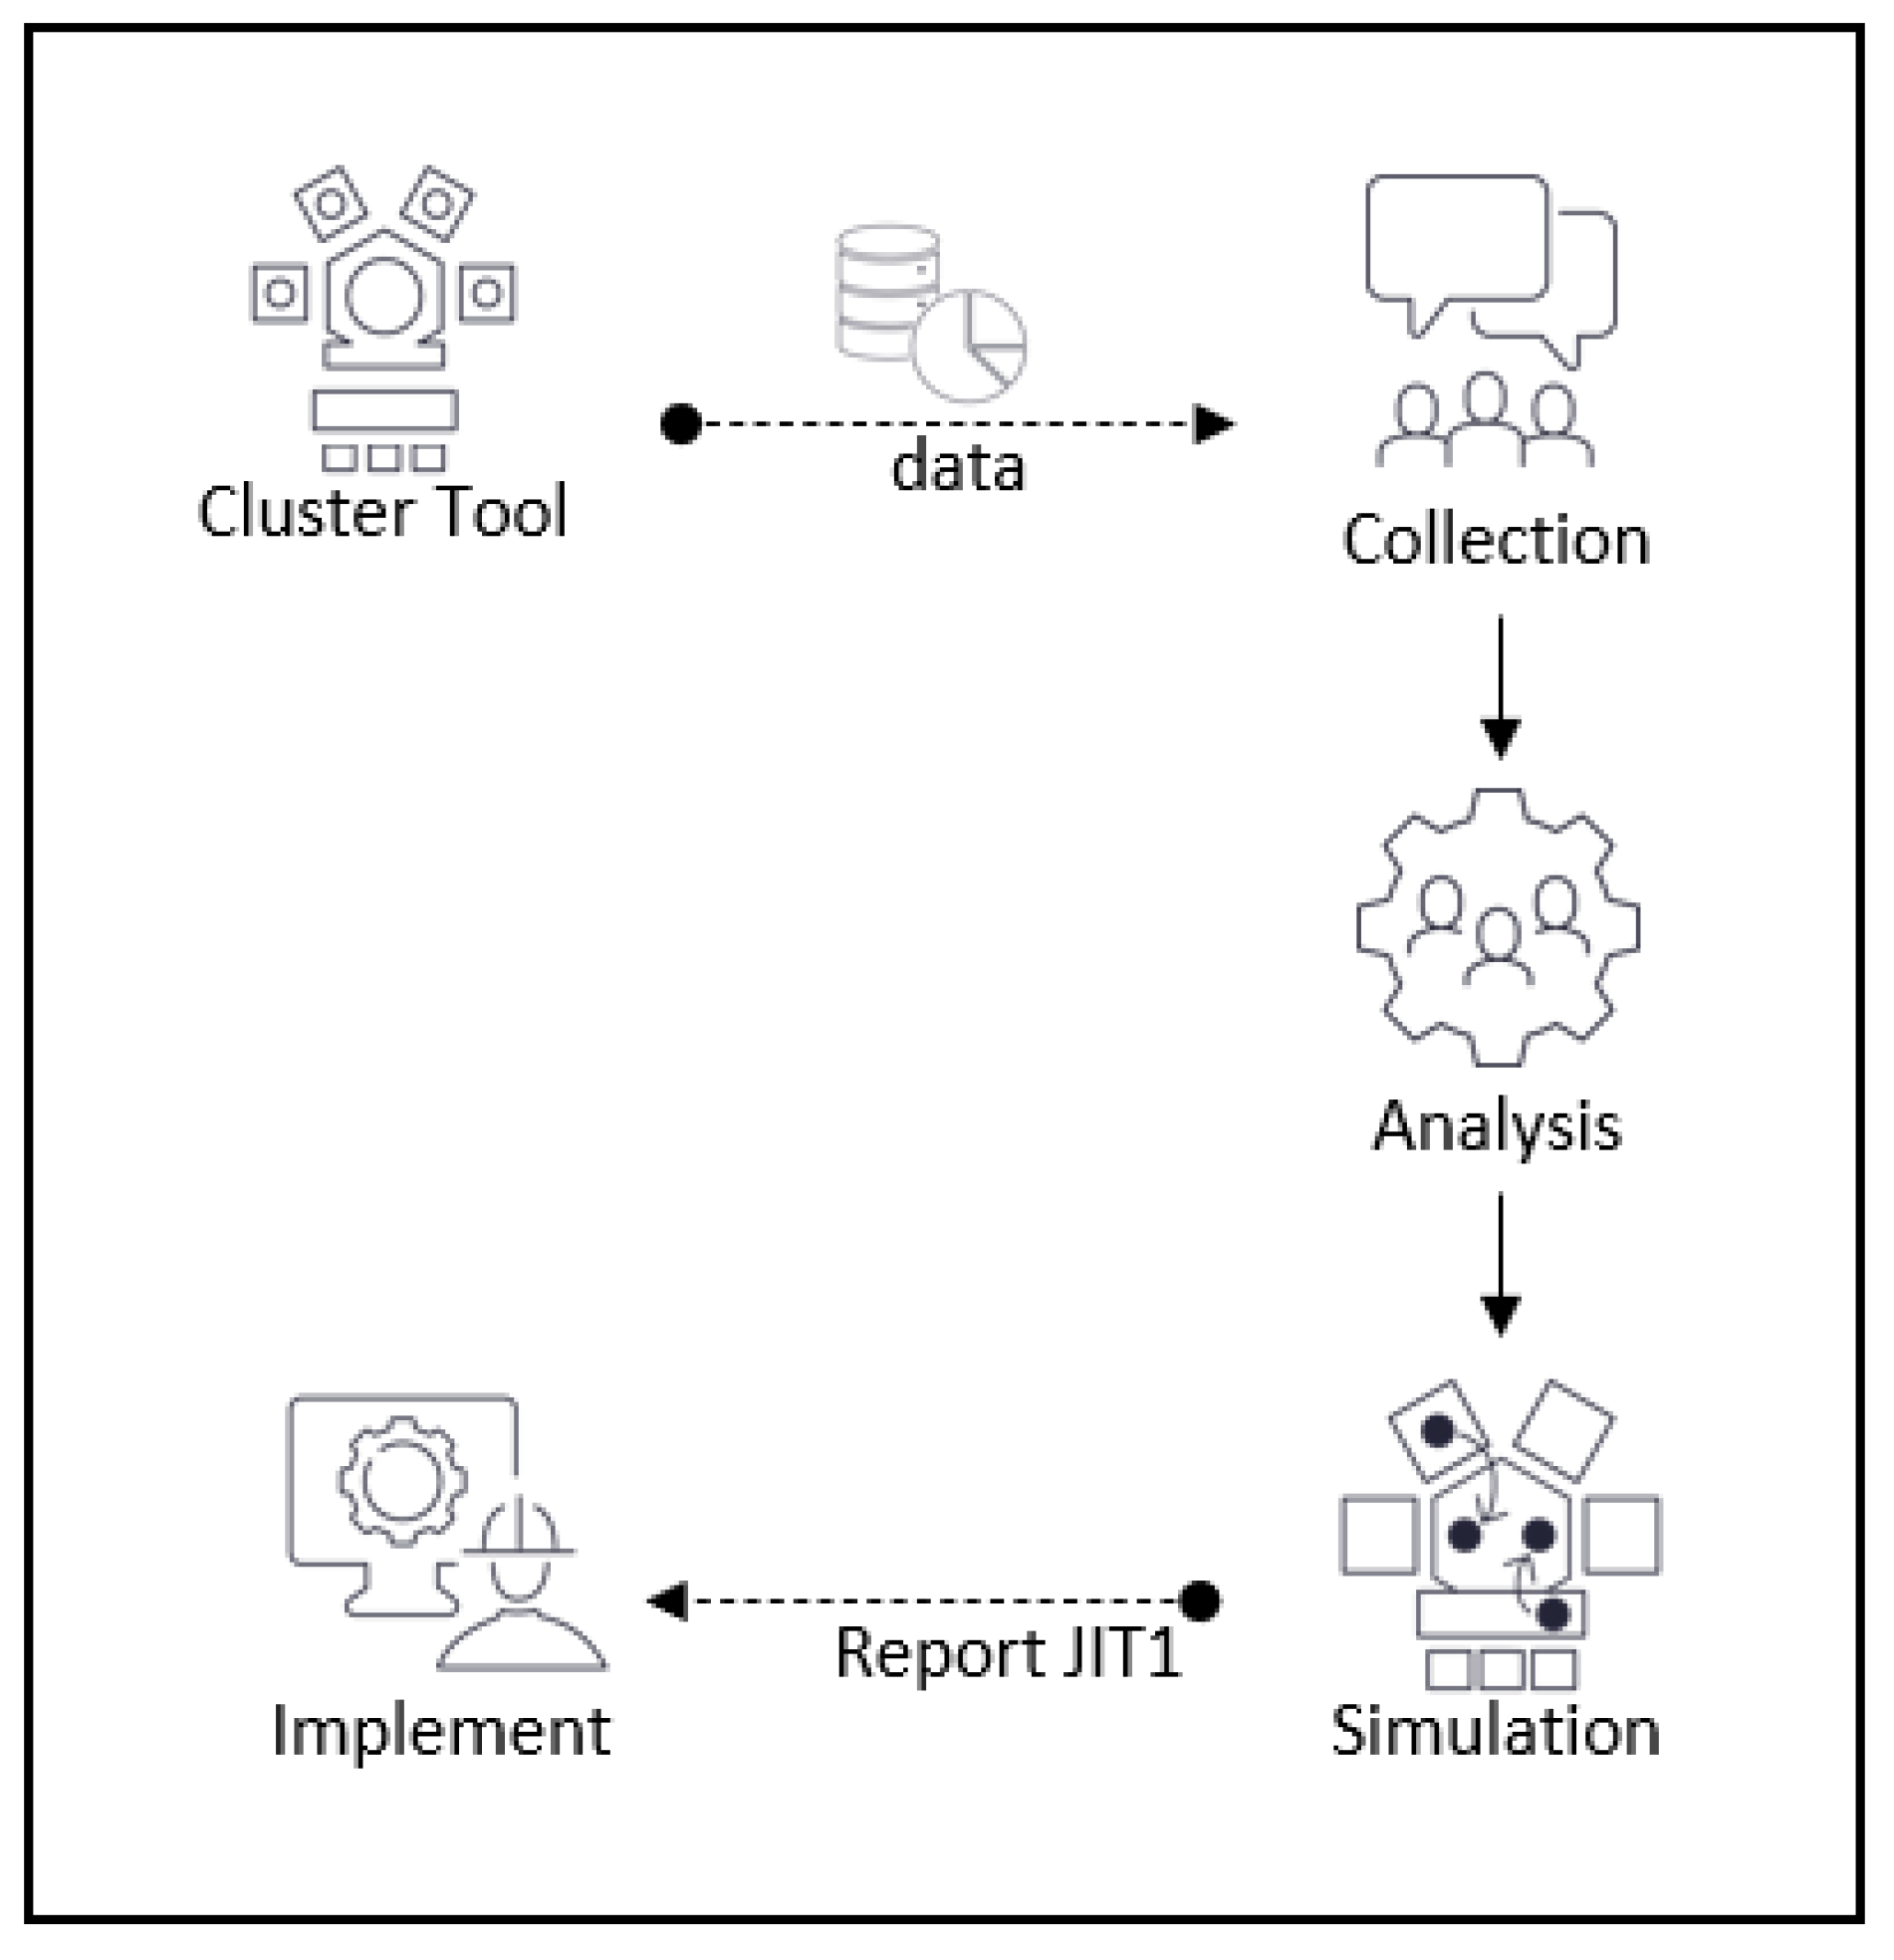
- Various data analyses were performed to maximize throughput in the semiconductor equipment field, but the efficiency was lowered because the analysis was not automated. In order to solve this problem, an automated technique was used to obtain the optimal JIT1 with an ML-based analysis method. This process shortened the time-consuming data analysis process and, at the same time, guaranteed maximum throughput while sensitively responding to changes in the production environment in real time by applying an automation system.
2. Related Work
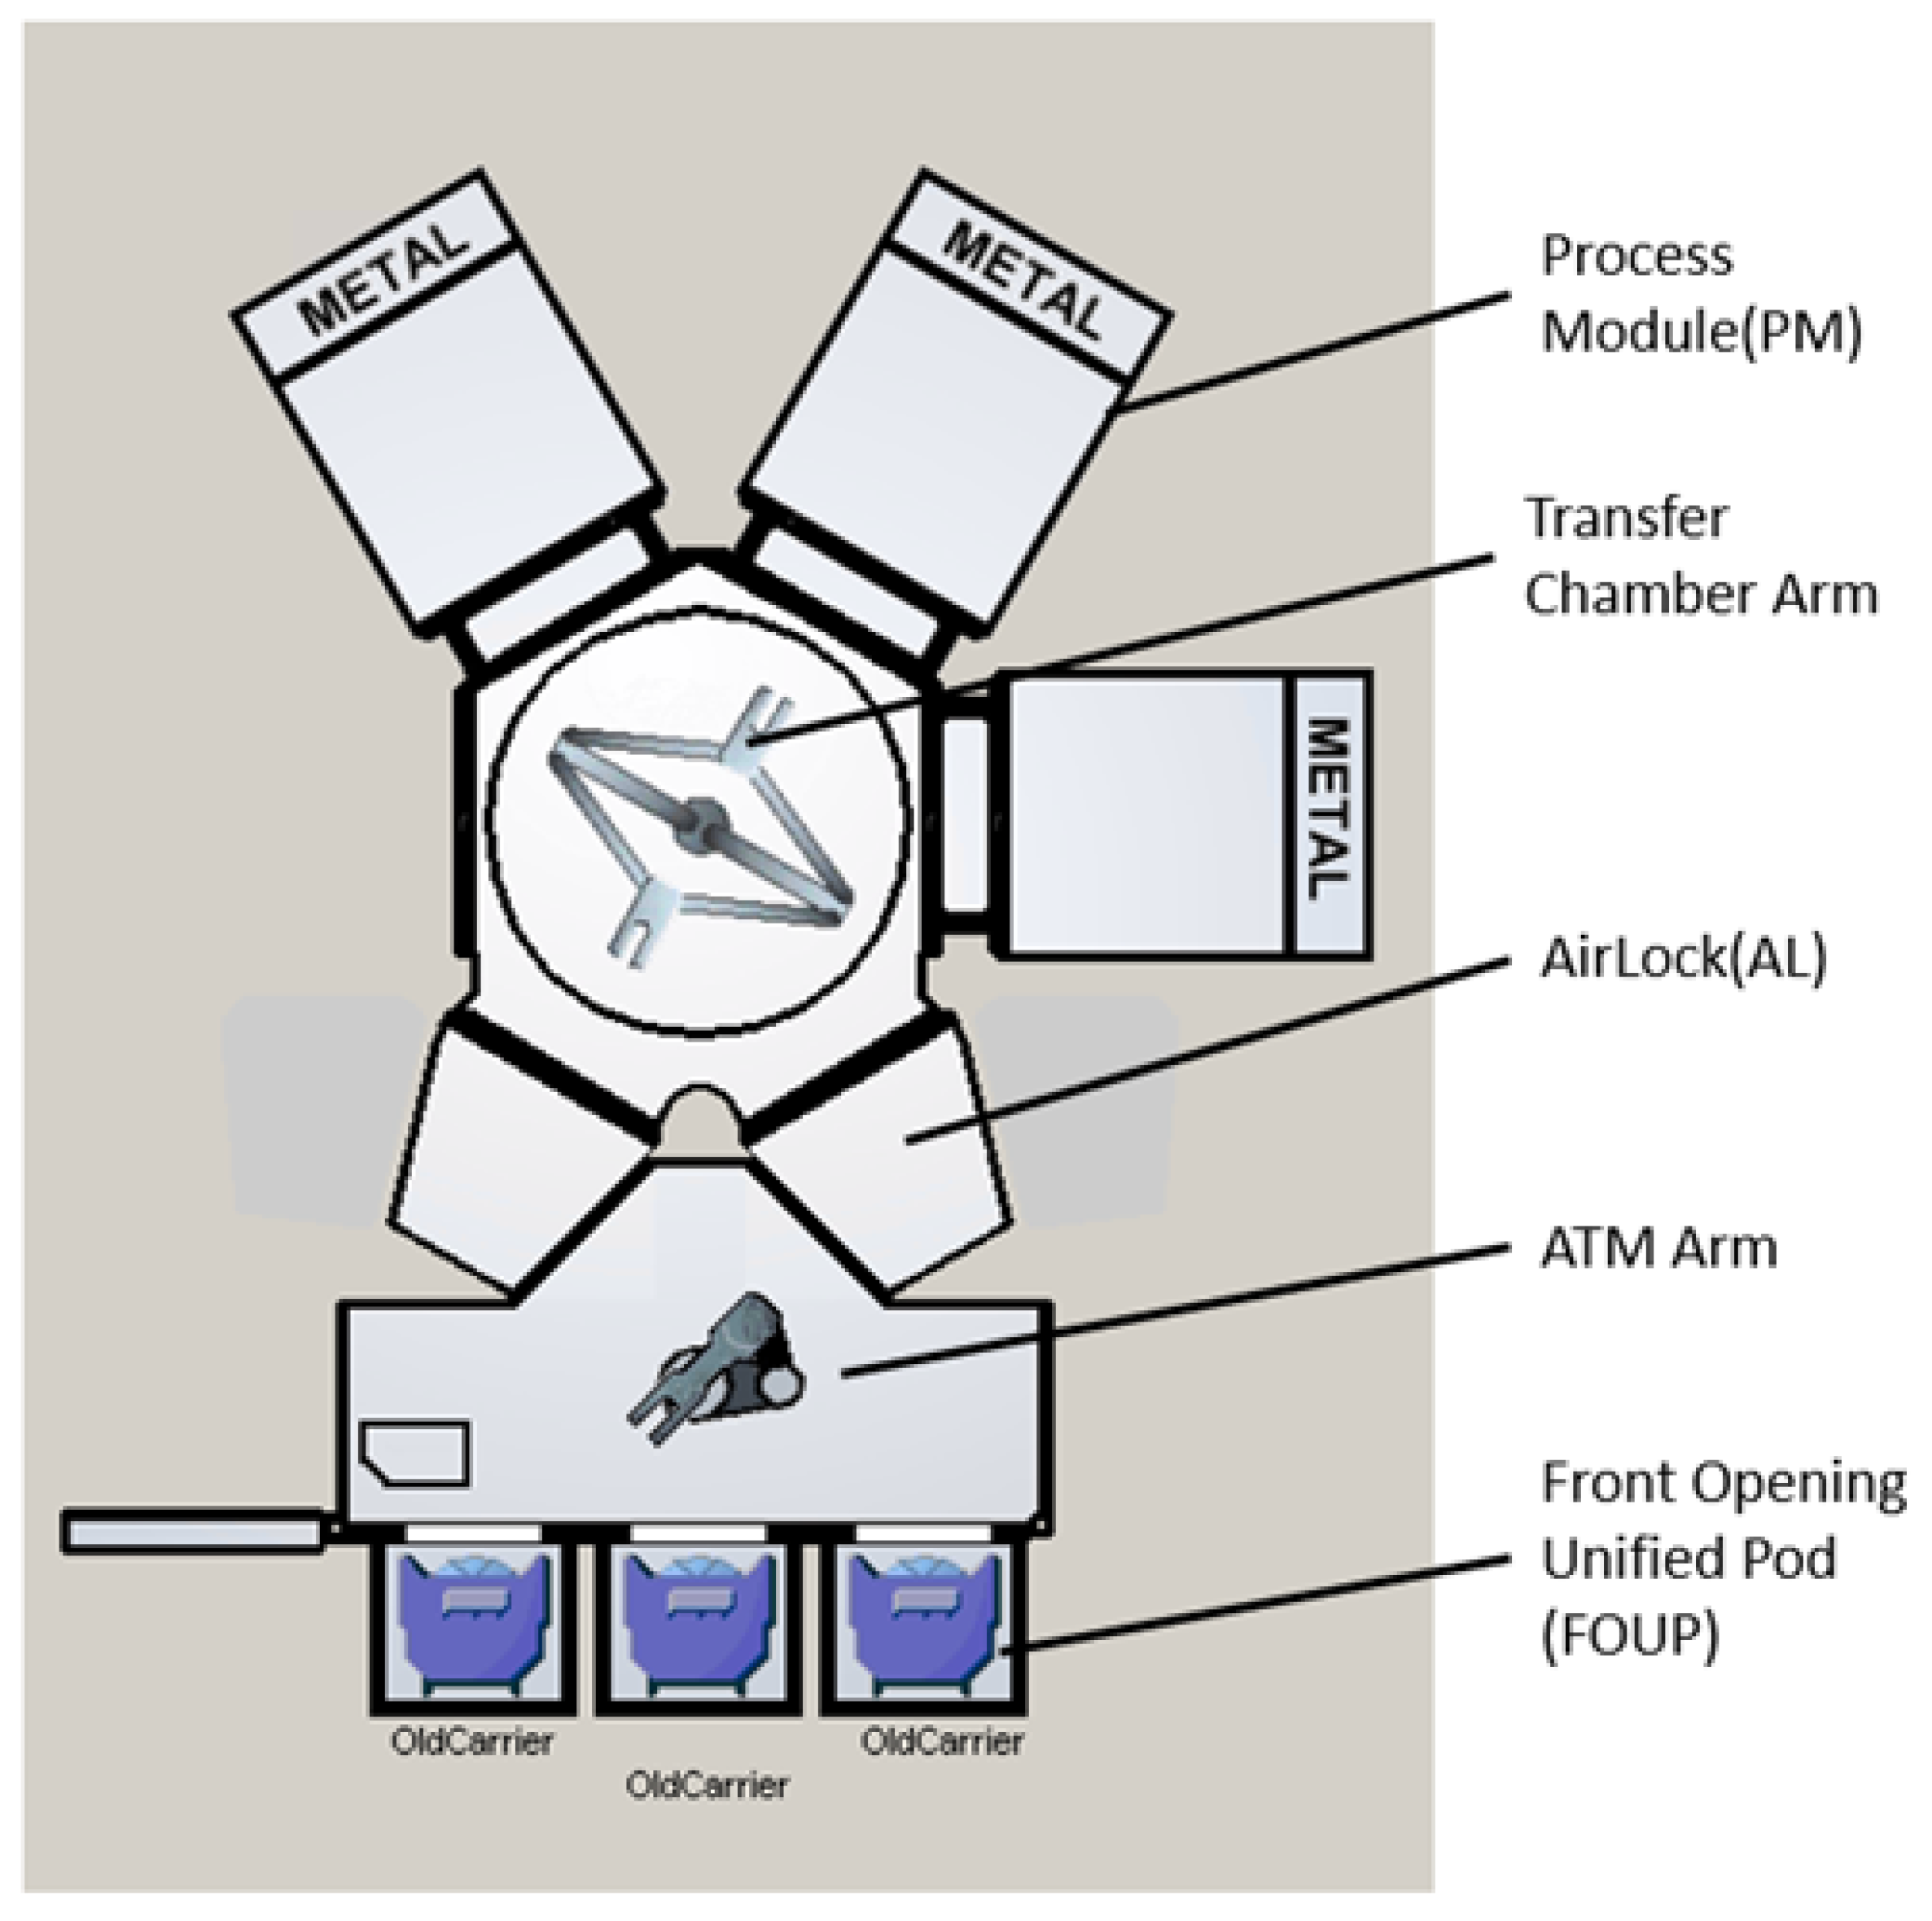
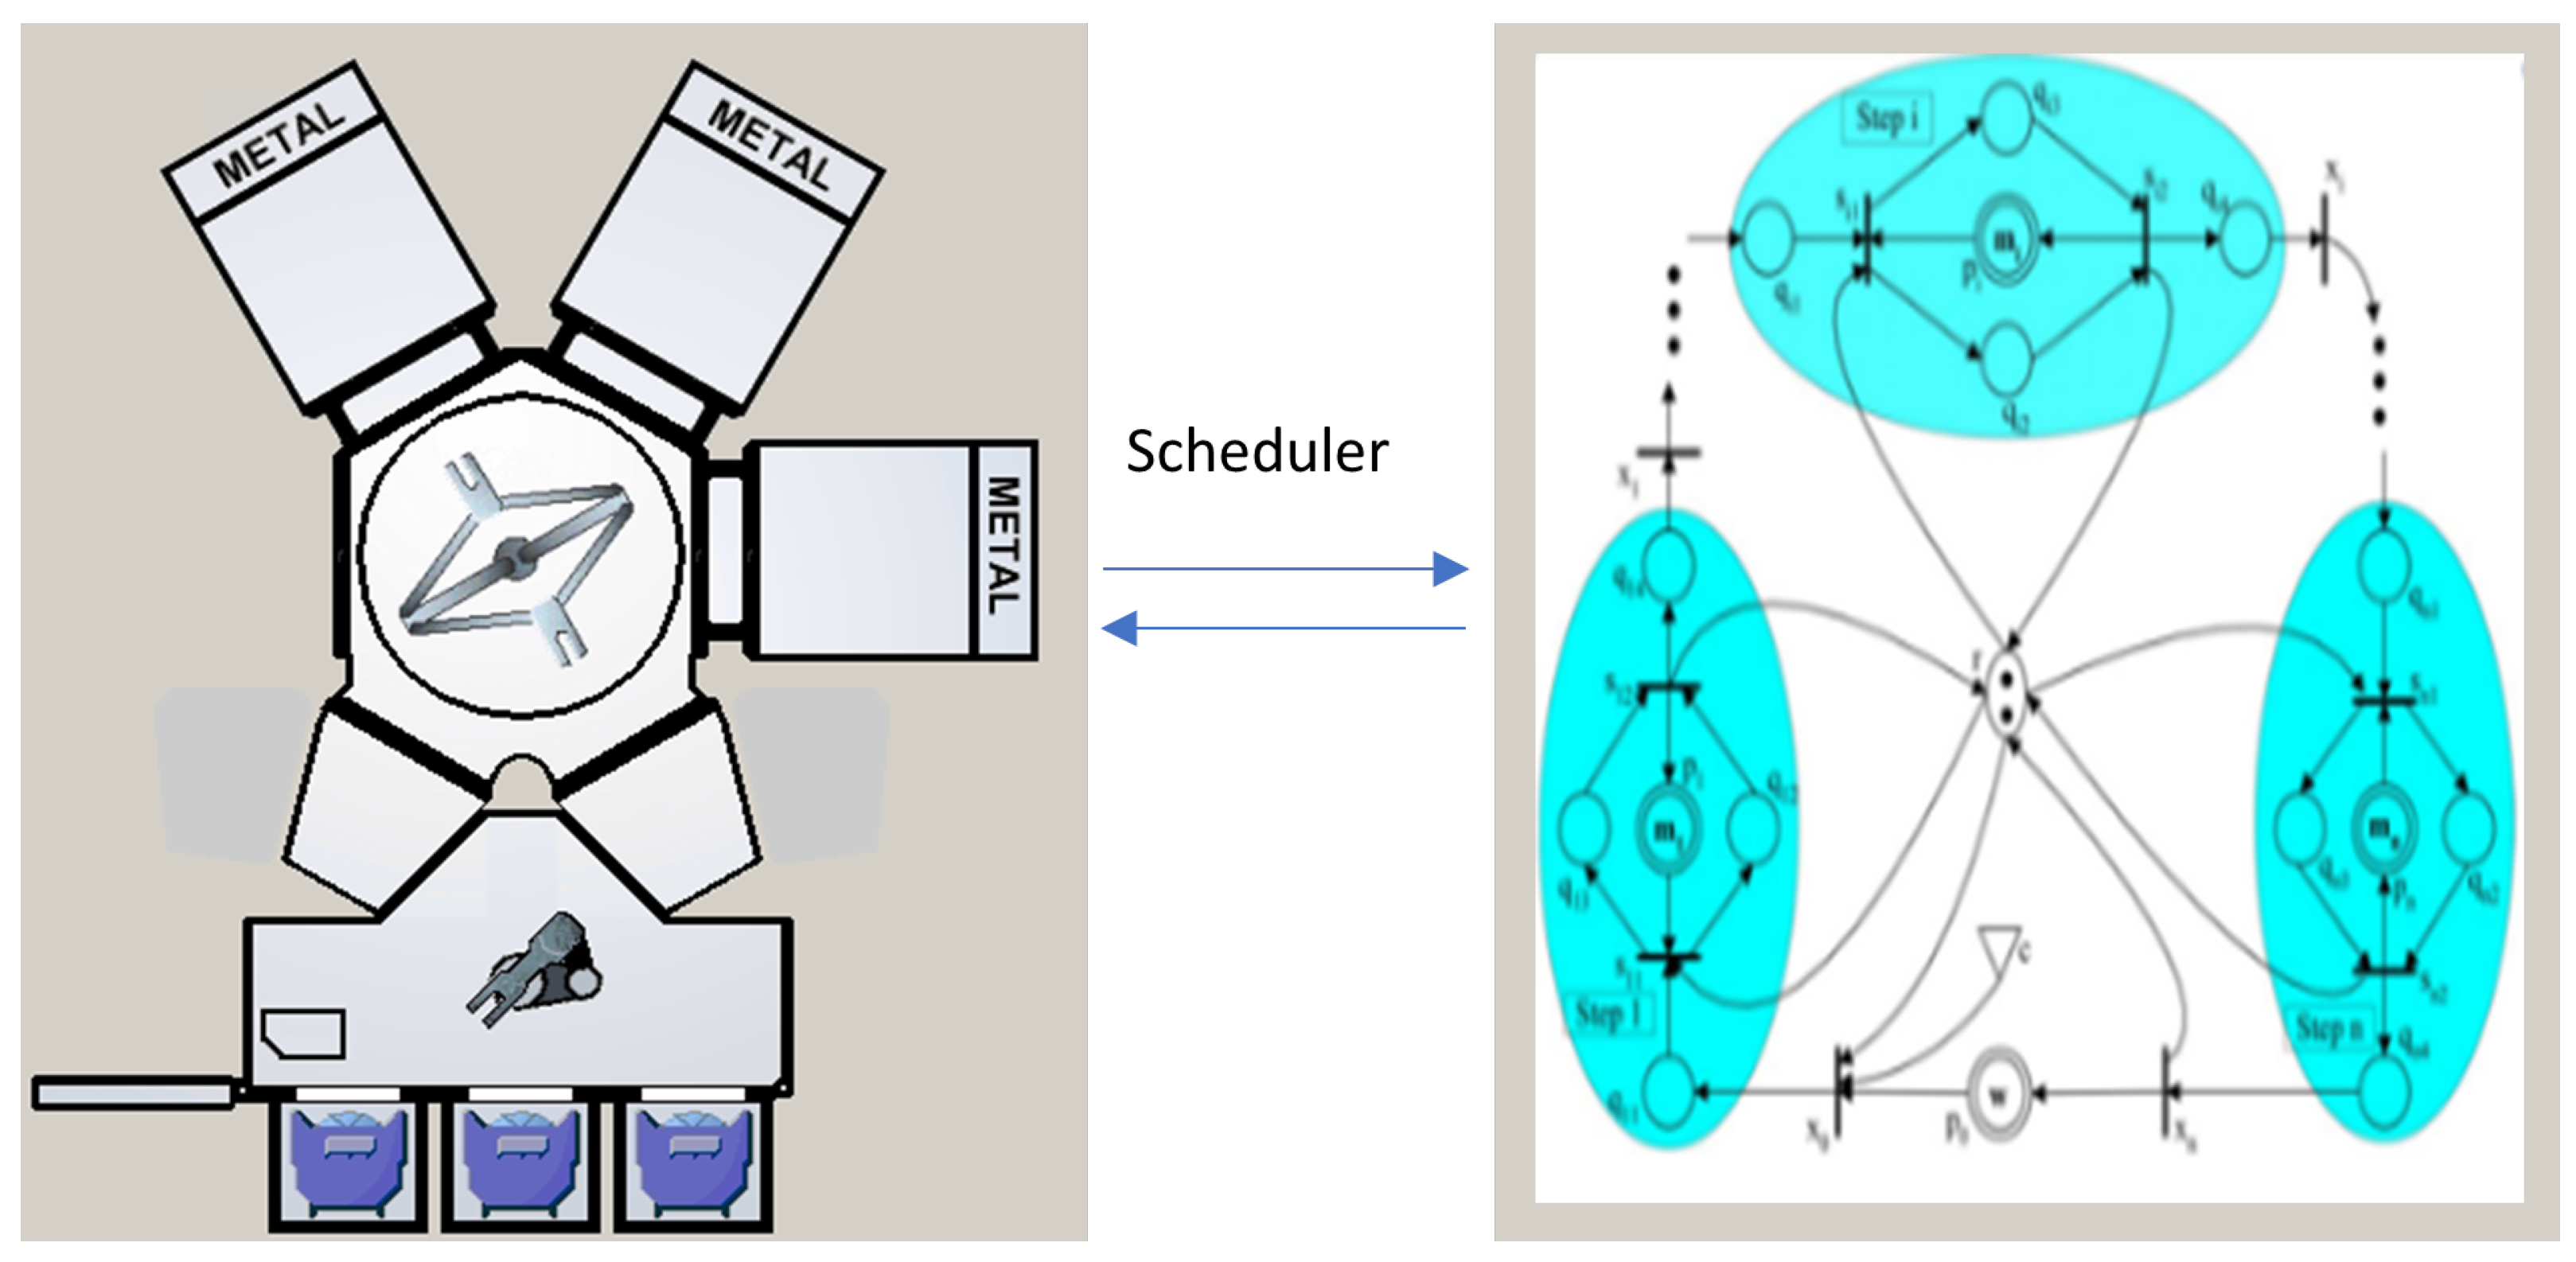
2.1. Structure and Operation of Cluster Tools
2.2. Productivity Parameters of Cluster Tools
2.3. Maximizing the Throughput of the Cluster Tool
3. JIT1 Optimization for Throughput Maximization
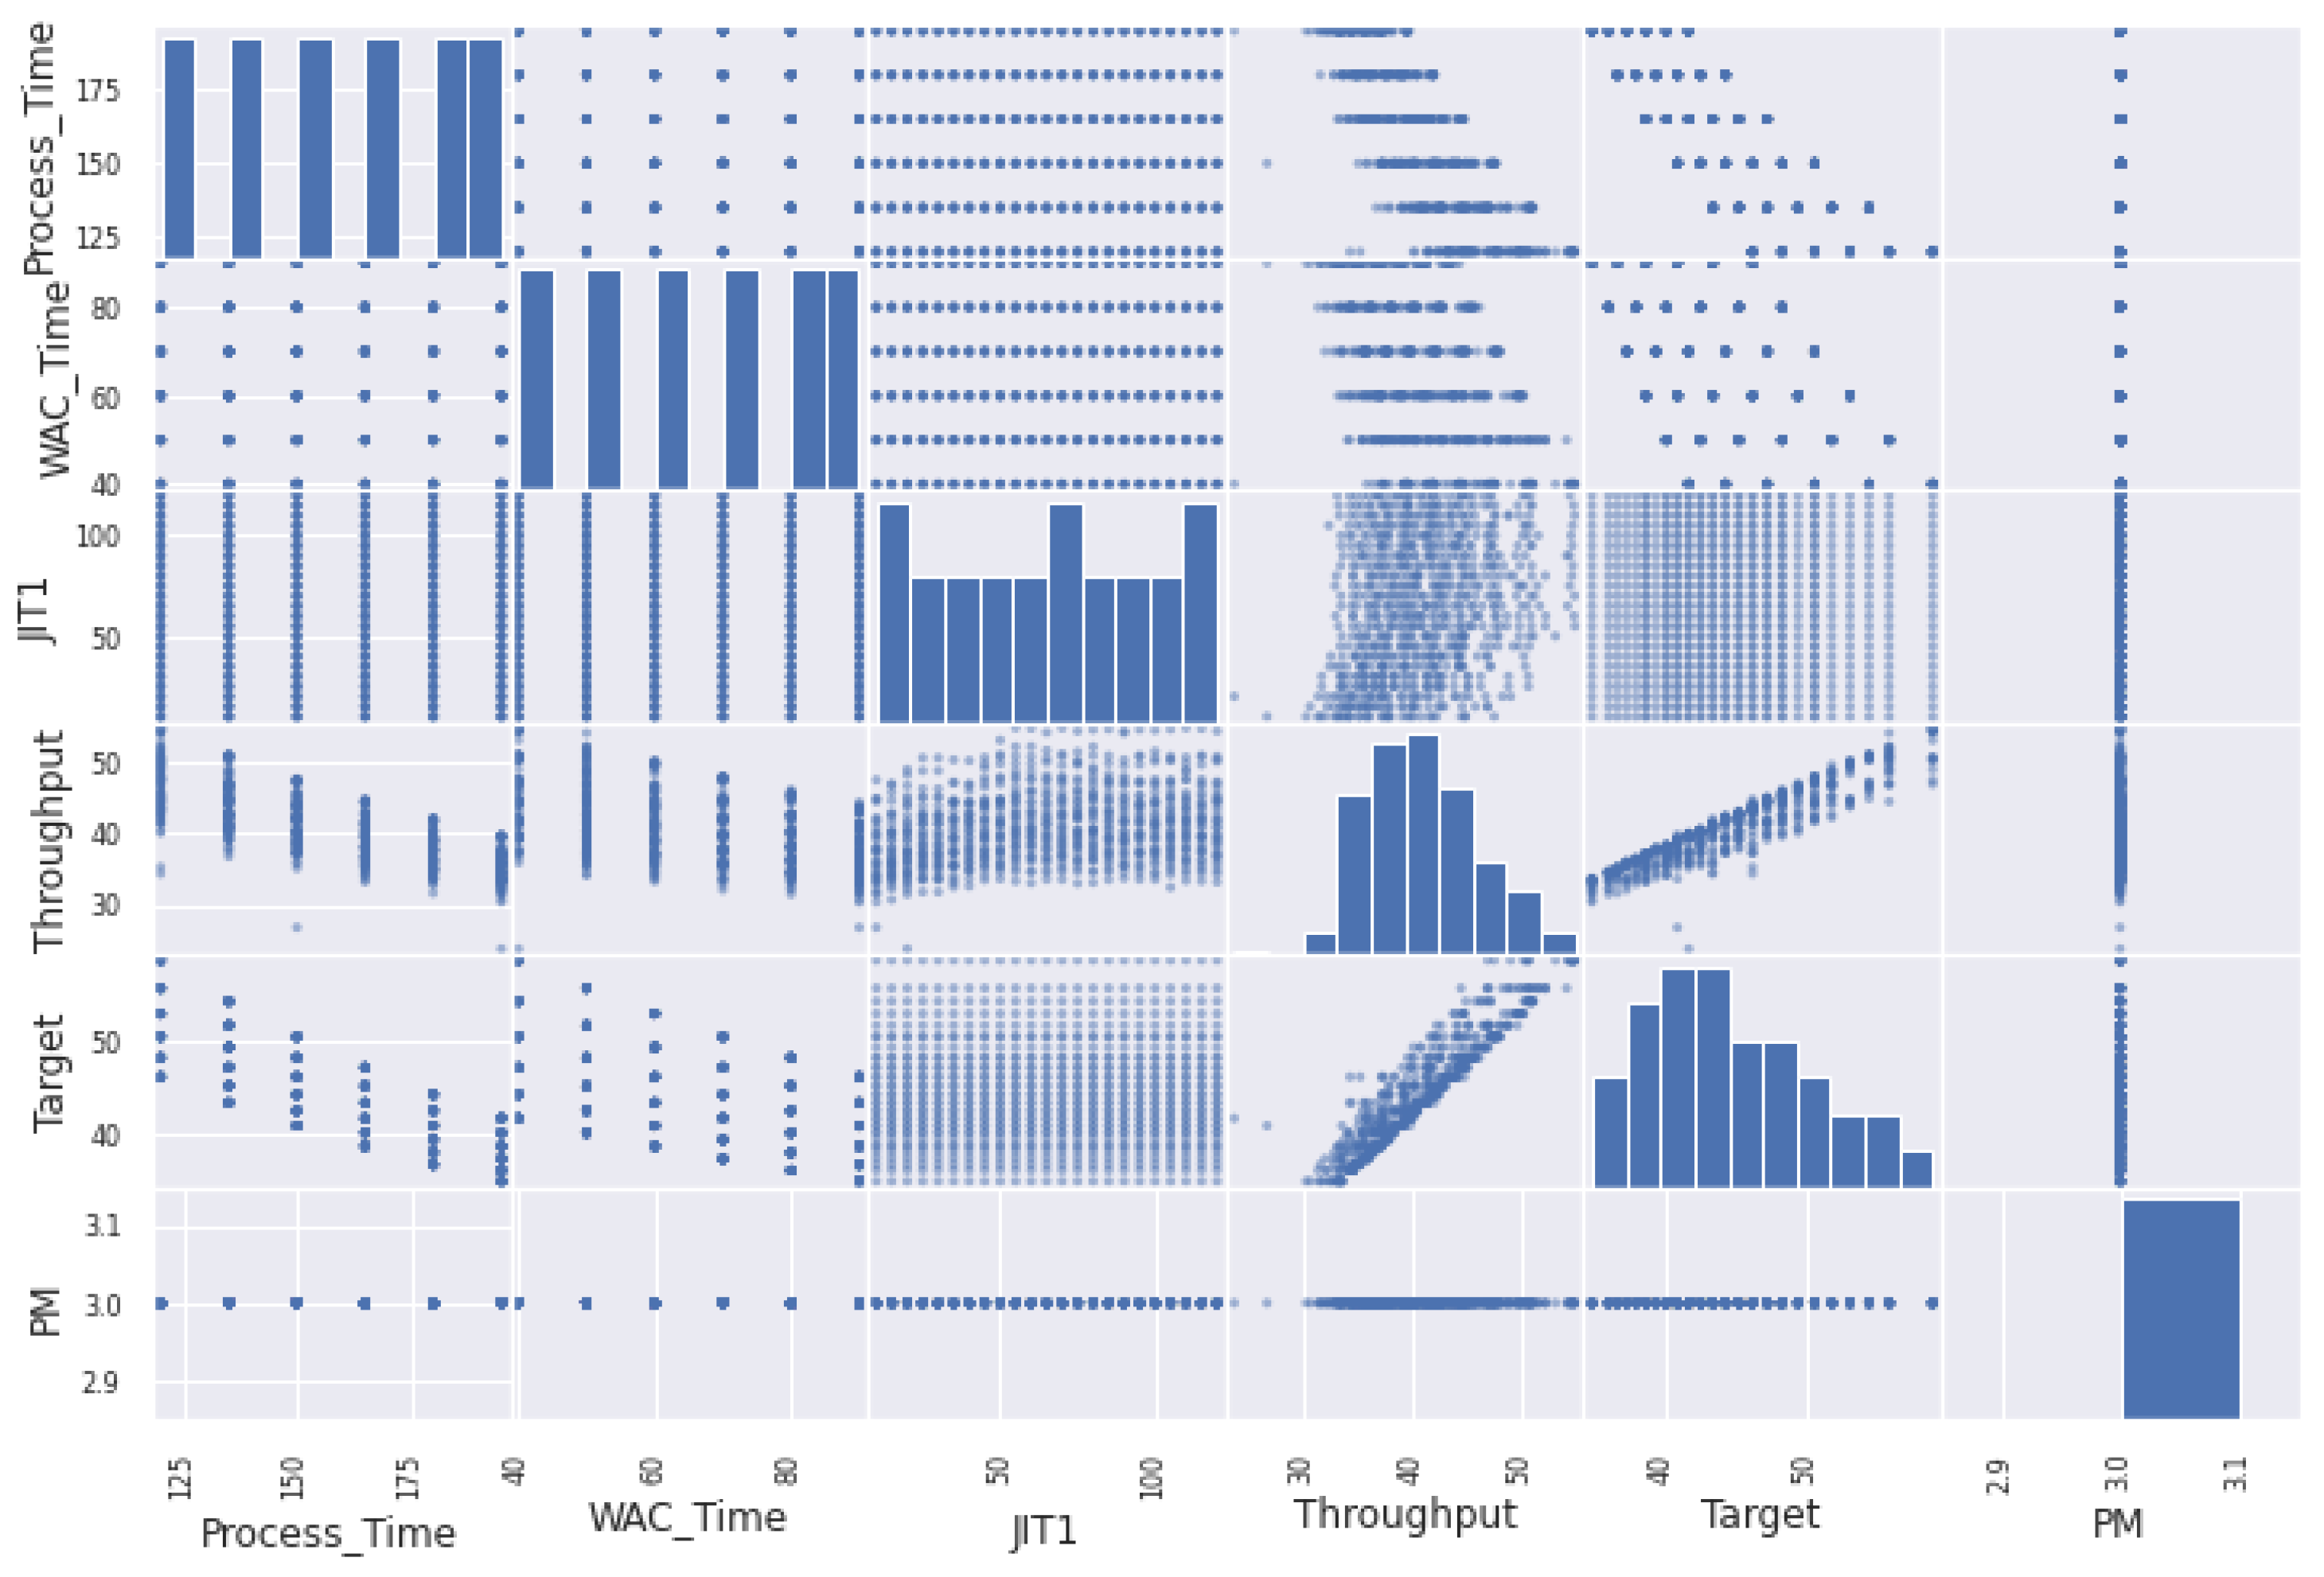
Throughput Optimization through ML
4. Simulation and Results
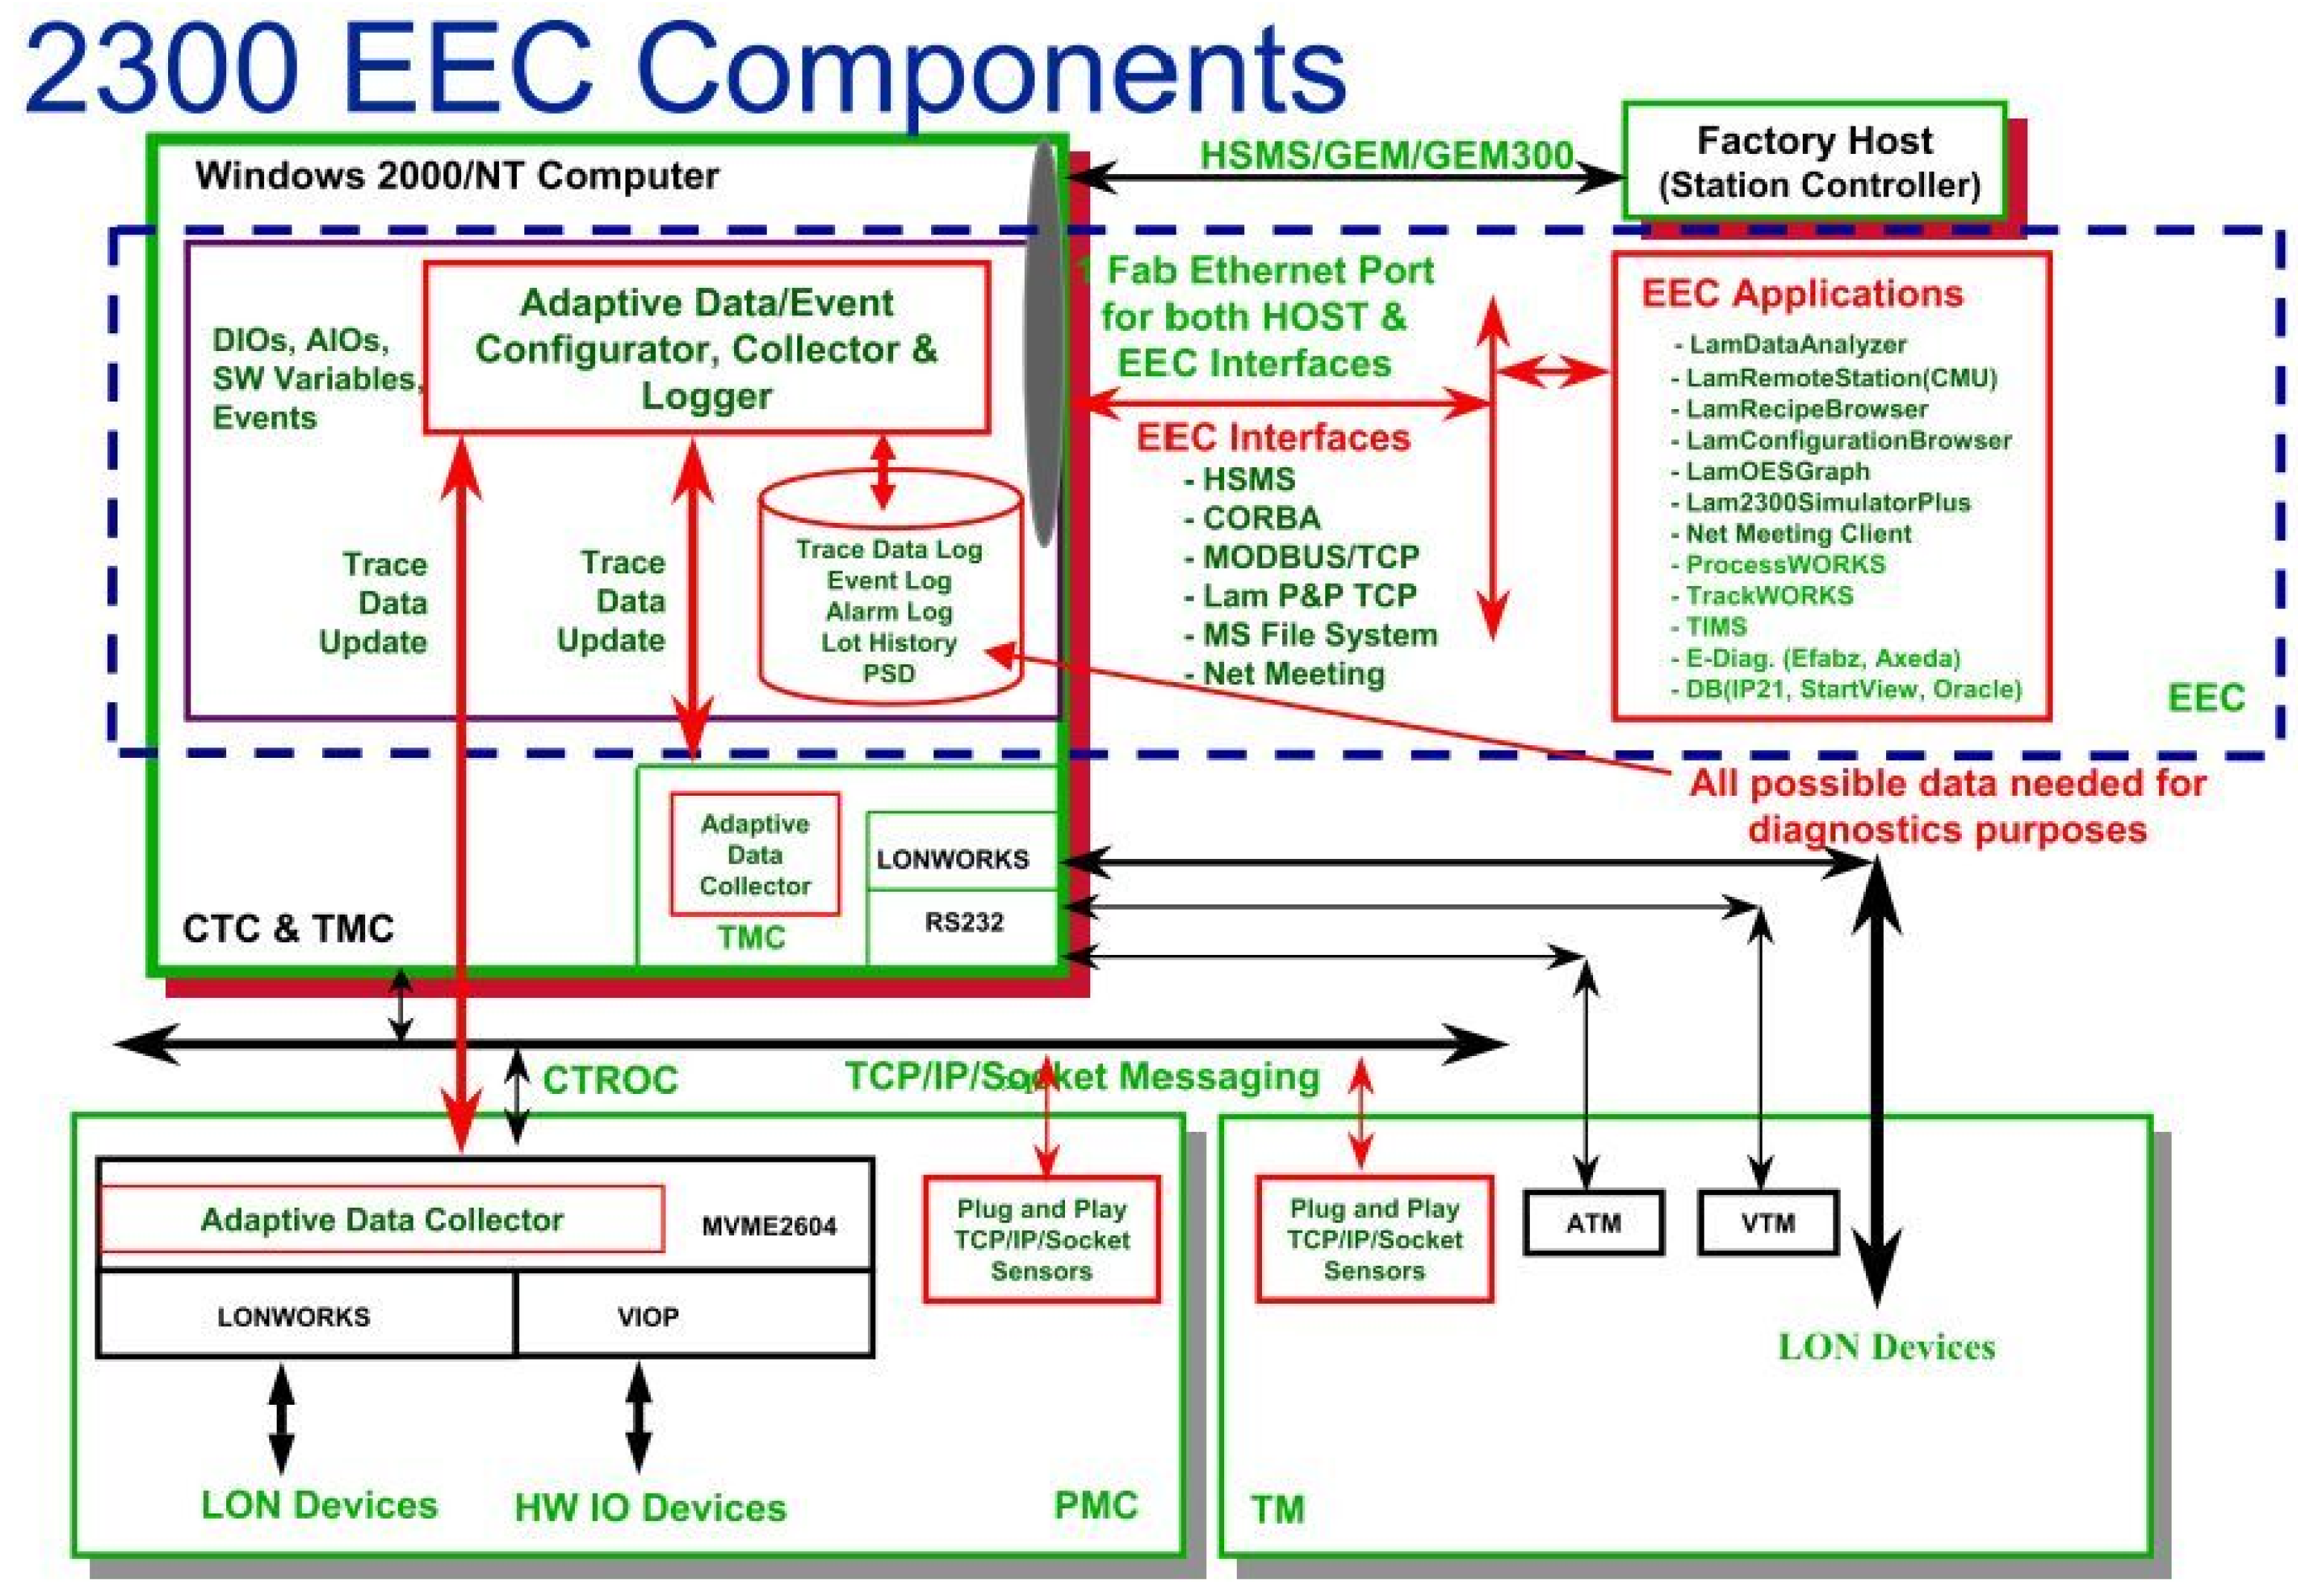
4.1. Simulation Environment
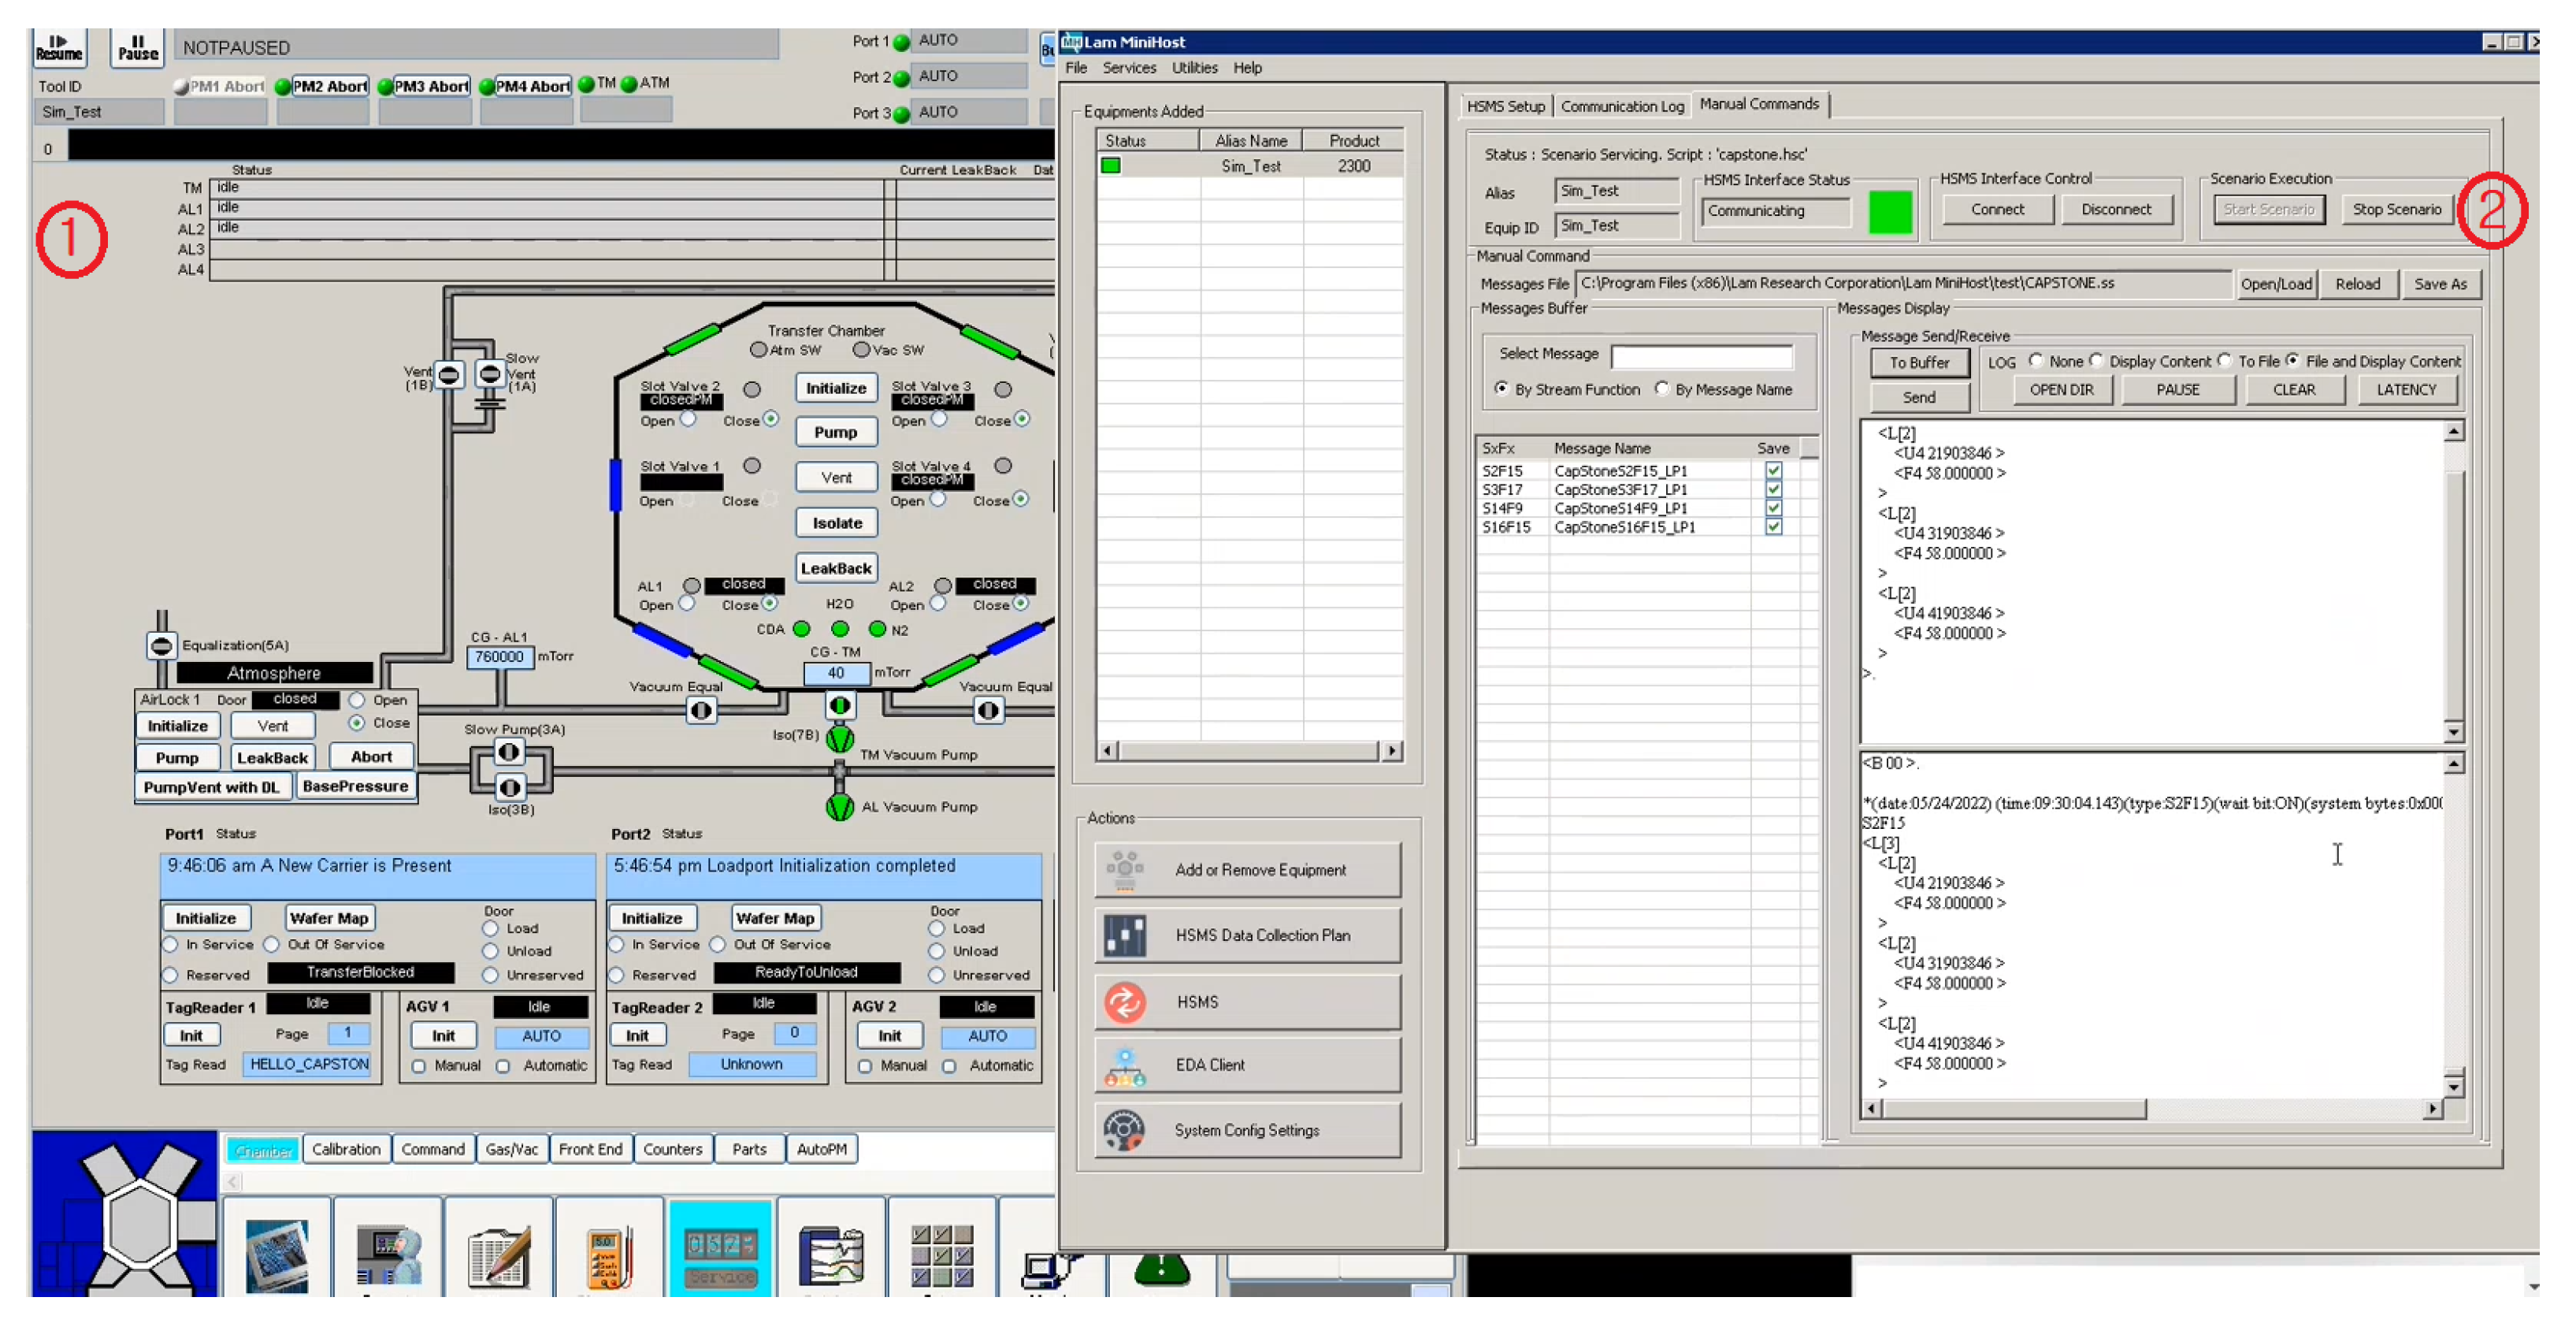
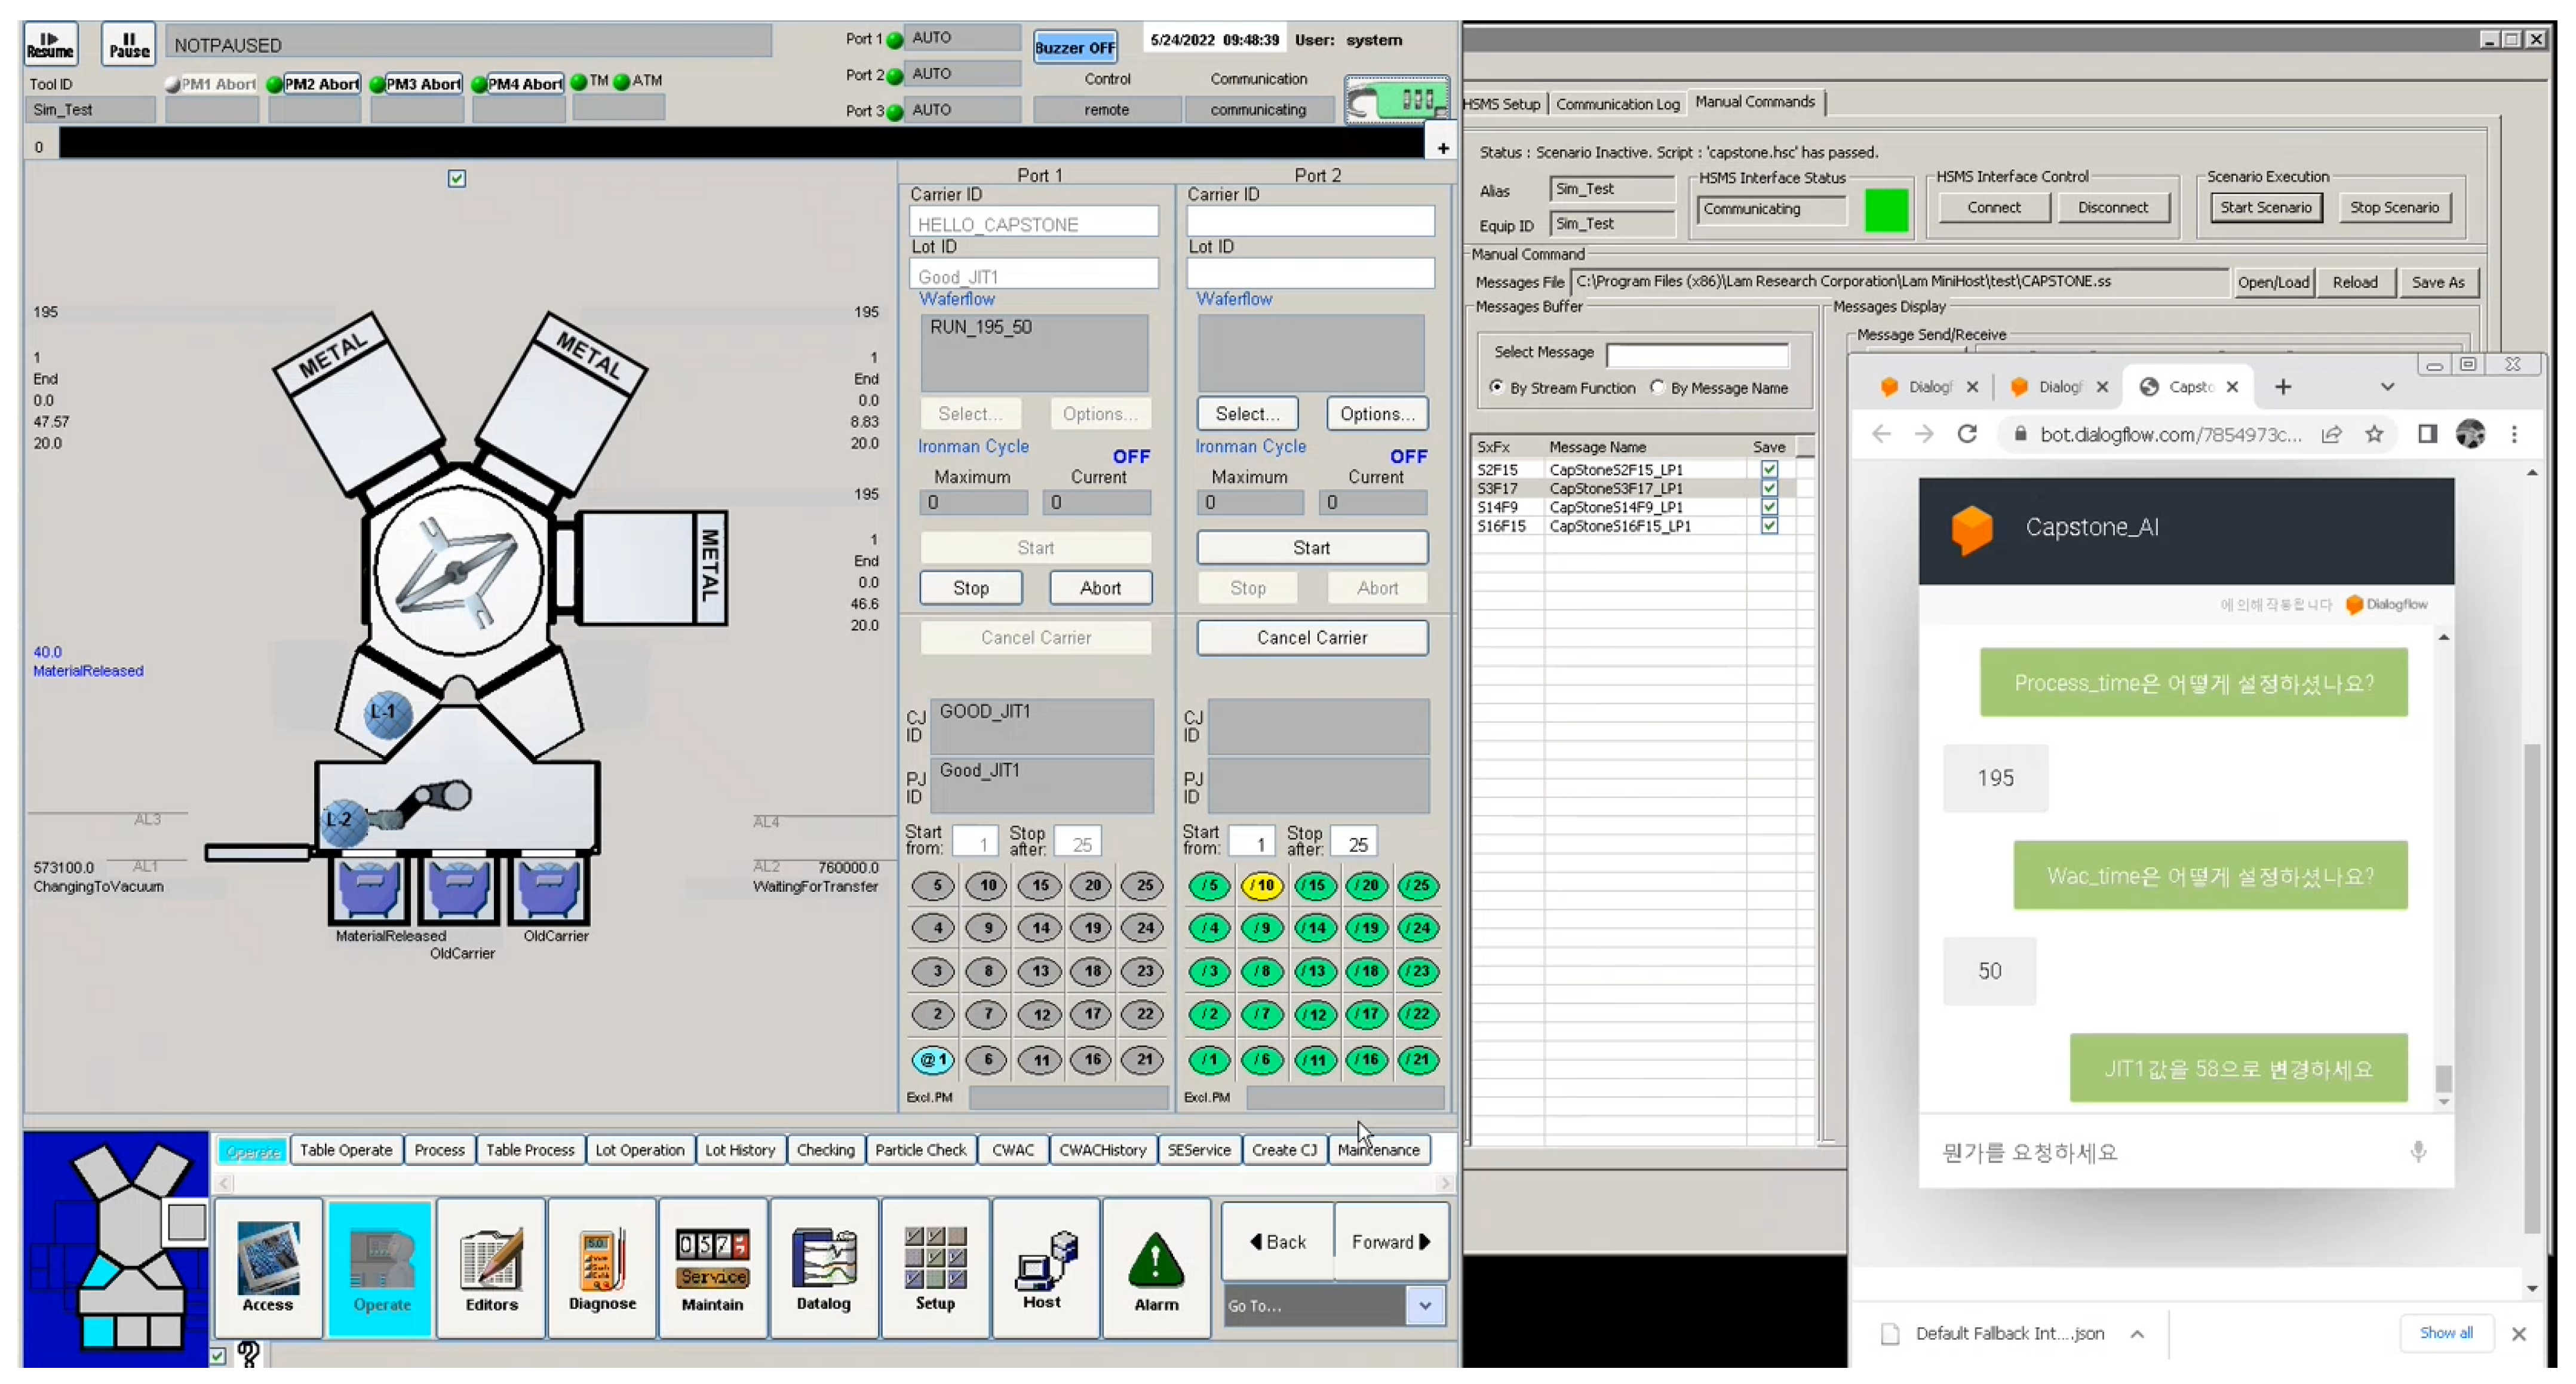
4.2. Cluster Tool Control in Semiconductor Manufacturing Fab
4.3. Result
5. Conclusions
Author Contributions
Funding
Institutional Review Board Statement
Informed Consent Statement
Data Availability Statement
Conflicts of Interest
References
- Kim, J.H.; Lee, T.E.; Lee, H.Y.; Park, D.B. Scheduling analysis of time-constrained dual-armed cluster tools. IEEE Trans. Semicond. Manuf. 2003, 16, 521–534. [Google Scholar] [CrossRef] [Green Version]
- Zhu, Q.; Qiao, Y.; Wu, N.; Hou, Y. Post-processing time-aware optimal scheduling of single robotic cluster tools. IEEE/CAA J. Autom. Sin. 2020, 7, 597–605. [Google Scholar] [CrossRef]
- Tu, Y.M. Short-Term Scheduling Model of Cluster Tool in Wafer Fabrication. Mathematics 2021, 9, 1029. [Google Scholar] [CrossRef]
- Jeong, T.; Prakash Kankalale, D.; Chau, R.; Jeon, H. Going Deeper or Wider: Throughput Prediction for Cluster Tools with Machine Learning. In Proceedings of the 6th IEEE/ACM International Conference on Big Data Computing, Applications and Technologies, Auckland, New Zealand, 2–5 December 2019; pp. 21–30. [Google Scholar]
- Yu, T.S.; Lee, T.E. Scheduling dual-armed cluster tools with chamber cleaning operations. IEEE Trans. Autom. Sci. Eng. 2017, 16, 218–228. [Google Scholar] [CrossRef]
- Cho, J.H.; Ryu, S.J.; Chae, S.K.; Hwasung-City, G.D.; Gyeonggi-Do, K.H.C. Throughput analysis for cluster tool under transfer bound condition and its application to dry etch equipment. In Proceedings of the ISSM2003 (International Symposium on Semiconductor Manufacturing), Tokyo, Japan, 12–13 December 2003; pp. 289–292. [Google Scholar]
- Jeong, T.; Parikh, K.; Chau, R.; Huang, C.H.; Chan, H.; Jeon, H. Two-Stage Sequence Model for Maximum Throughput in Cluster Tools. In Proceedings of the 2021 IEEE 19th World Symposium on Applied Machine Intelligence and Informatics (SAMI), Herl’any, Slovakia, 21–23 January 2021; pp. 49–54. [Google Scholar]
- Qiao, Y.; Wu, N.; Zhou, M. Petri net modeling and wafer sojourn time analysis of single-arm cluster tools with residency time constraints and activity time variation. IEEE Trans. Semicond. Manuf. 2012, 25, 432–446. [Google Scholar] [CrossRef]
- Zhu, Q.; Zhou, M.; Qiao, Y.; Wu, N. Petri net modeling and scheduling of a close-down process for time-constrained single-arm cluster tools. IEEE Trans. Syst. Man Cybern. Syst. 2016, 48, 389–400. [Google Scholar] [CrossRef]
- Zhou, M.; DiCesare, F. Parallel and sequential mutual exclusions for Petri net modeling of manufacturing systems with shared resources. IEEE Trans. Robot. Autom. 1991, 7, 515–527. [Google Scholar] [CrossRef]
- Paek, J.H.; Lee, T.E. Optimal scheduling of dual-armed cluster tools without swap restriction. In Proceedings of the 2008 IEEE International Conference on Automation Science and Engineering, Arlington, VA, USA, 23–26 August 2008; pp. 103–108. [Google Scholar]
- Suerich, D.; McIlroy, T. Artificial Intelligence for Real Time Cluster Tool Scheduling: EO: Equipment Optimization. In Proceedings of the 2022 33rd Annual SEMI Advanced Semiconductor Manufacturing Conference (ASMC), Saratoga Springs, NY, USA, 2–5 May 2022; pp. 1–3. [Google Scholar]
- Havey, R.; Wang, L.; Kim, D. Application of tool science techniques to improve tool efficiency for a dry etch cluster tool. In Proceedings of the 2011 Winter Simulation Conference (WSC), Phoenix, AZ, USA, 11–14 December 2011; pp. 1921–1926. [Google Scholar]
- Rostami, S.; Hamidzadeh, B.; Camporese, D. An optimal periodic scheduler for dual-arm robots in cluster tools with residency constraints. IEEE Trans. Robot. Autom. 2001, 17, 609–618. [Google Scholar] [CrossRef]
- Venkatesh, S.; Davenport, R.; Foxhoven, P.; Nulman, J. A steady-state throughput analysis of cluster tools: Dual-blade versus single-blade robots. IEEE Trans. Semicond. Manuf. 1997, 10, 418–424. [Google Scholar] [CrossRef]
- López, M.J.; Wood, S.C. Systems of multiple cluster tools: Configuration, reliability, and performance. IEEE Trans. Semicond. Manuf. 2003, 16, 170–178. [Google Scholar] [CrossRef]
- Hong, J.P.; Lee, K.S. Throughput Analysis of the Twin Chamber Platform Equipment according to the Load-lock Configuration. J. Semicond. Disp. Technol. 2008, 7, 39–43. [Google Scholar]
- Aybar, M.; Potti, K.; LeBaron, T. Using simulation to understand capacity constraints and improve efficiency on process tools. In Proceedings of the Winter Simulation Conference, San Diego, CA, USA, 8–11 December 2002; Volume 2, pp. 1431–1435. [Google Scholar]
- Van Dongen, B.F.; Alves de Medeiros, A.; Wen, L. Process mining: Overview and outlook of petri net discovery algorithms. In Transactions on Petri Nets and Other Models of Concurrency II; Springer: Berlin/Heidelberg, Germany, 2009; pp. 225–242. [Google Scholar]
- Srinivasan, R. Modeling and performance analysis of cluster tools using Petri nets. IEEE Trans. Semicond. Manuf. 1998, 11, 394–403. [Google Scholar] [CrossRef]
- Perkinson, T.L.; McLarty, P.K.; Gyurcsik, R.S.; Cavin, R.K. Single-wafer cluster tool performance: An analysis of throughput. IEEE Trans. Semicond. Manuf. 1994, 7, 369–373. [Google Scholar] [CrossRef]
- Zuberek, W.M. Cluster tools with chamber revisiting-modeling and analysis using timed Petri nets. IEEE Trans. Semicond. Manuf. 2004, 17, 333–344. [Google Scholar] [CrossRef]
- Hauser, J.R.; Rizvi, S.A. Cluster tool technology. In Process Module Metrology, Control and Clustering; International Society for Optics and Photonics: Bellingham, WA, USA, 1992; Volume 1594, pp. 45–54. [Google Scholar]
- Hansen, B. Benefits of cluster tool architecture for implementation of evolutionary equipment improvements and applications. In Process Module Metrology, Control and Clustering; International Society for Optics and Photonics: Bellingham, WA, USA, 1992; Volume 1594, pp. 83–91. [Google Scholar]
- Sun, T.H.; Cheng, C.W.; Fu, L.C. A Petri net based approach to modeling and scheduling for an FMS and a case study. IEEE Trans. Ind. Electron. 1994, 41, 593–601. [Google Scholar]
- Wood, S.C.; Tripathi, S.; Moghadam, F. A generic model for cluster tool throughput time and capacity. In Proceedings of the 1994 IEEE/SEMI Advanced Semiconductor Manufacturing Conference and Workshop (ASMC), Cambridge, MA, USA, 14–16 November 1994; pp. 194–199. [Google Scholar]
- Wood, S.C. Simple performance models for integrated processing tools. IEEE Trans. Semicond. Manuf. 1996, 9, 320–328. [Google Scholar] [CrossRef]
- Zhou, M.; Wu, N. System Modeling and Control with Resource-Oriented Petri Nets; CRC Press: Boca Raton, FL, USA, 2009. [Google Scholar]
- Odrey, N.G.; Green, J.D.; Appello, A. A generalized Petri net modeling approach for the control of re-entrant flow semiconductor wafer fabrication. Robot. Comput.-Integr. Manuf. 2001, 17, 5–11. [Google Scholar] [CrossRef]
- Hong, J.P.; Kim, J.K.; Han, J.H.; Chae, S.K. Throughput analysis and productivity enhancement for CVD equipment. In Proceedings of the 2004 IEEE/SEMI Advanced Semiconductor Manufacturing Conference and Workshop (IEEE Cat. No. 04CH37530), Boston, MA, USA, 4–6 May 2004; pp. 48–51. [Google Scholar]
- Makanju, A.; Brooks, S.; Zincir-Heywood, A.N.; Milios, E.E. Logview: Visualizing event log clusters. In Proceedings of the 2008 Sixth Annual Conference on Privacy, Security and Trust, Fredericton, NB, Canada, 1–3 October 2008; pp. 99–108. [Google Scholar]


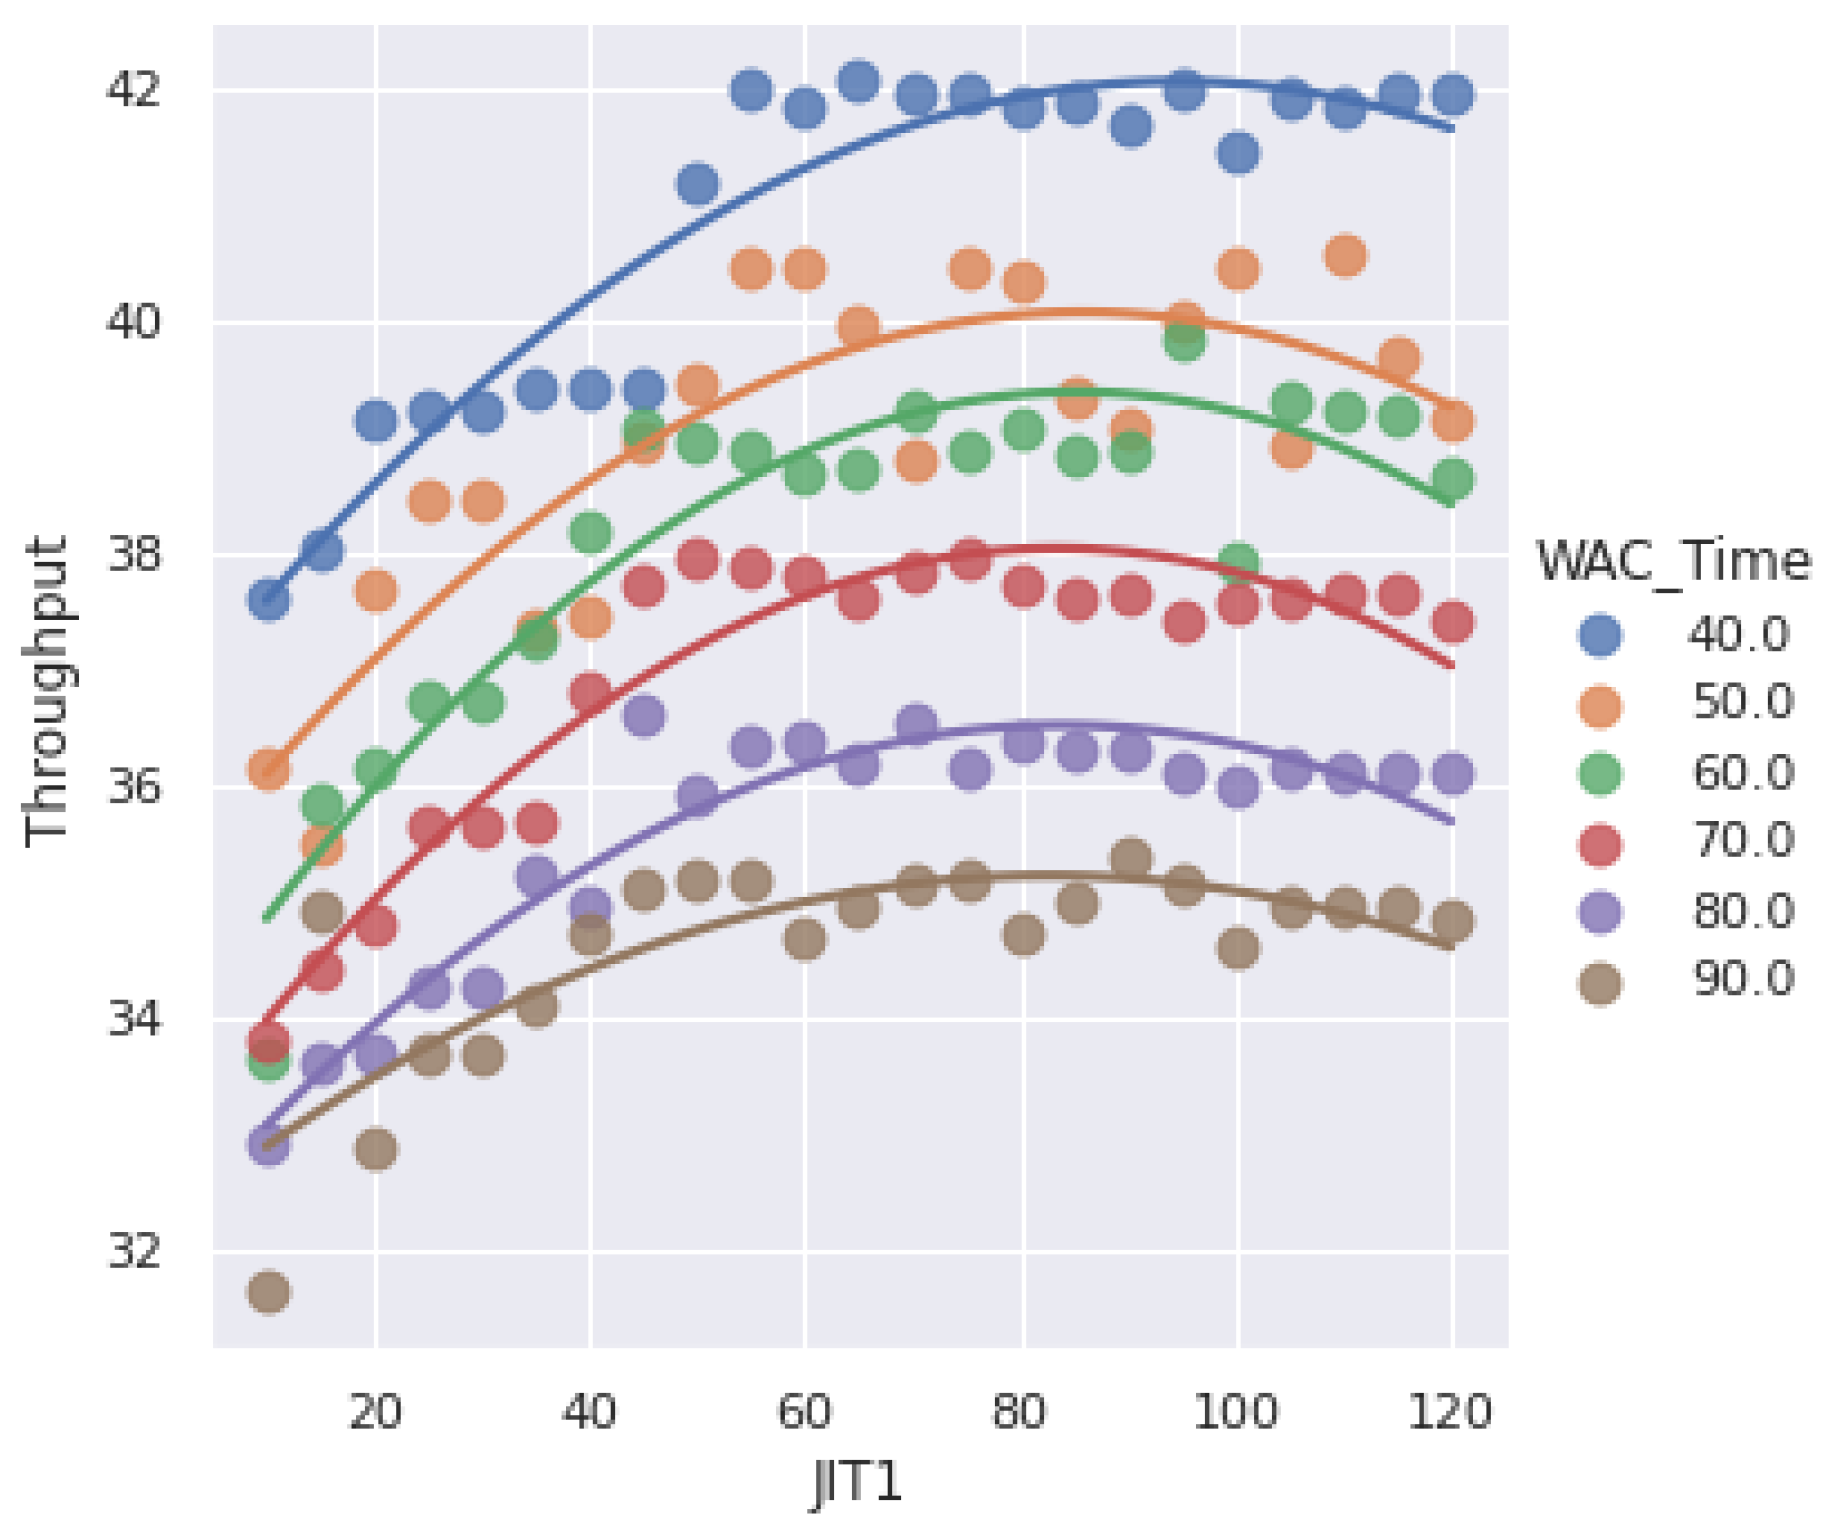
| Process Time | WAC Time | Tput (JIT = 10) | Tput (JIT = 15) | …… |
|---|---|---|---|---|
| 120.00 | 40.00 | 47.51 | 46.92 | …… |
| 120.00 | 50.00 | 44.48 | 46.87 | …… |
| 120.00 | 60.00 | 44.85 | 44.59 | …… |
| 120.00 | 70.00 | 41.62 | 42.38 | …… |
| 120.00 | 80.00 | 40.14 | 41.50 | …… |
| 120.00 | 90.00 | 35.29 | 34.37 | …… |
| 135.00 | 40.00 | 44.91 | 45.78 | …… |
| 135.00 | 50.00 | 42.24 | 42.69 | ……. |
| 135.00 | 60.00 | 40.81 | 40.12 | …… |
| 135.00 | 70.00 | 39.13 | 39.97 | …… |
| 135.00 | 80.00 | 38.04 | 39.09 | …… |
| 135.00 | 90.00 | 37.39 | 36.76 | …… |
| 150.00 | 40.00 | 41.88 | 42.95 | …… |
| 150.00 | 50.00 | 39.61 | 40.08 | …… |
| 150.00 | 60.00 | 37.24 | 37.51 | …… |
| 150.00 | 70.00 | 37.88 | 37.89 | …… |
| 150.00 | 80.00 | 35.94 | 37.10 | …… |
| 150.00 | 90.00 | 26.81 | 35.11 | …… |
| …… | …… | …… | …… | …… |
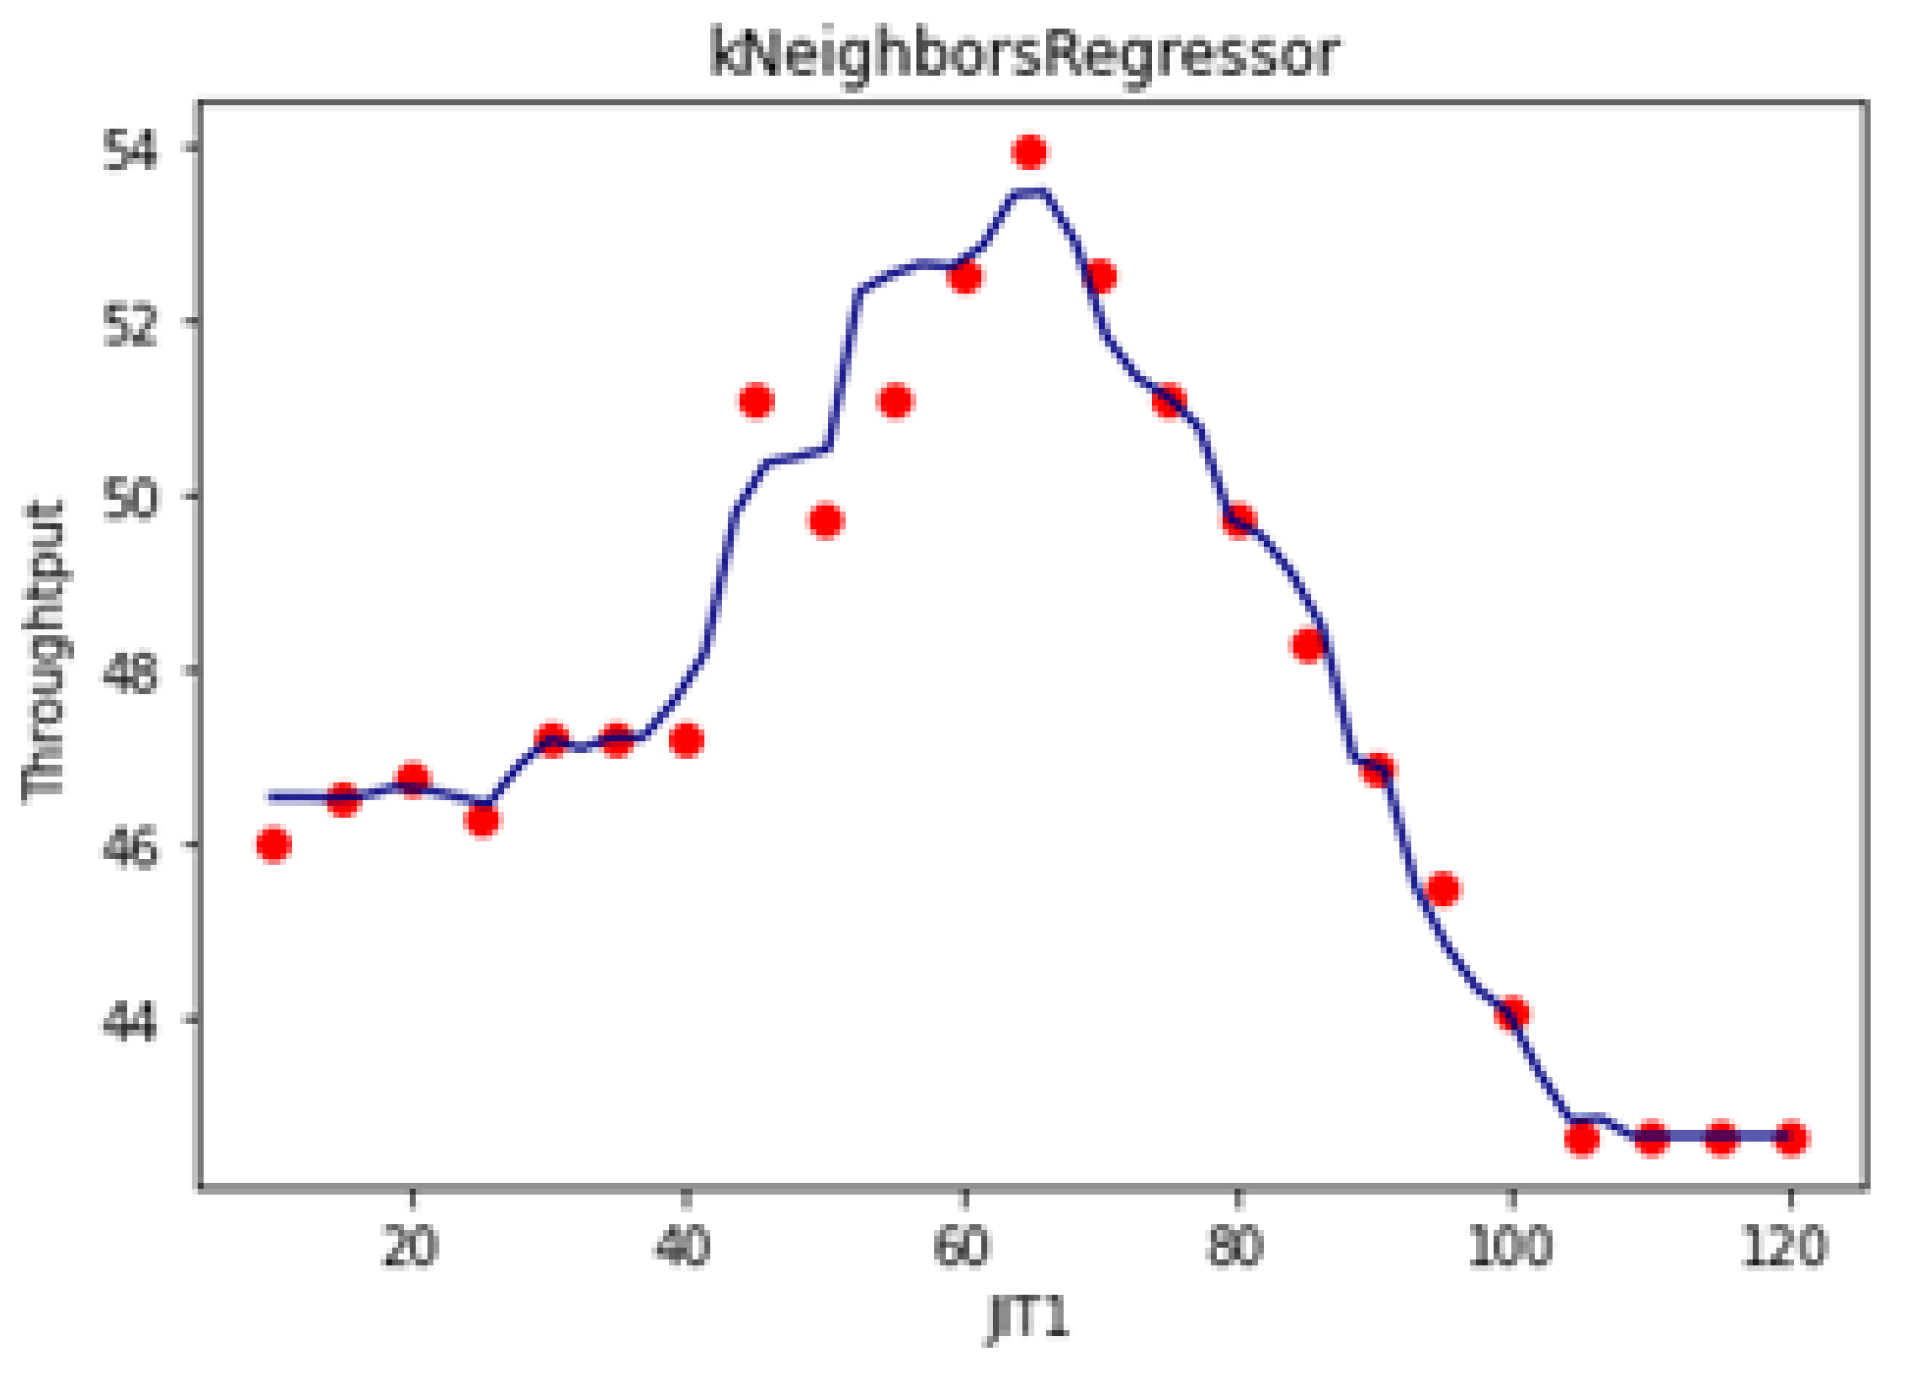
| Models | Pearson Coefficient | RMSE |
|---|---|---|
| Linear regression | 0.941 | 6.80 |
| Polynomial regression | 0.949 | 6.32 |
| SVM with rbf | 0.974 | 4.76 |
| KNN | 0.989 | 3.28 |
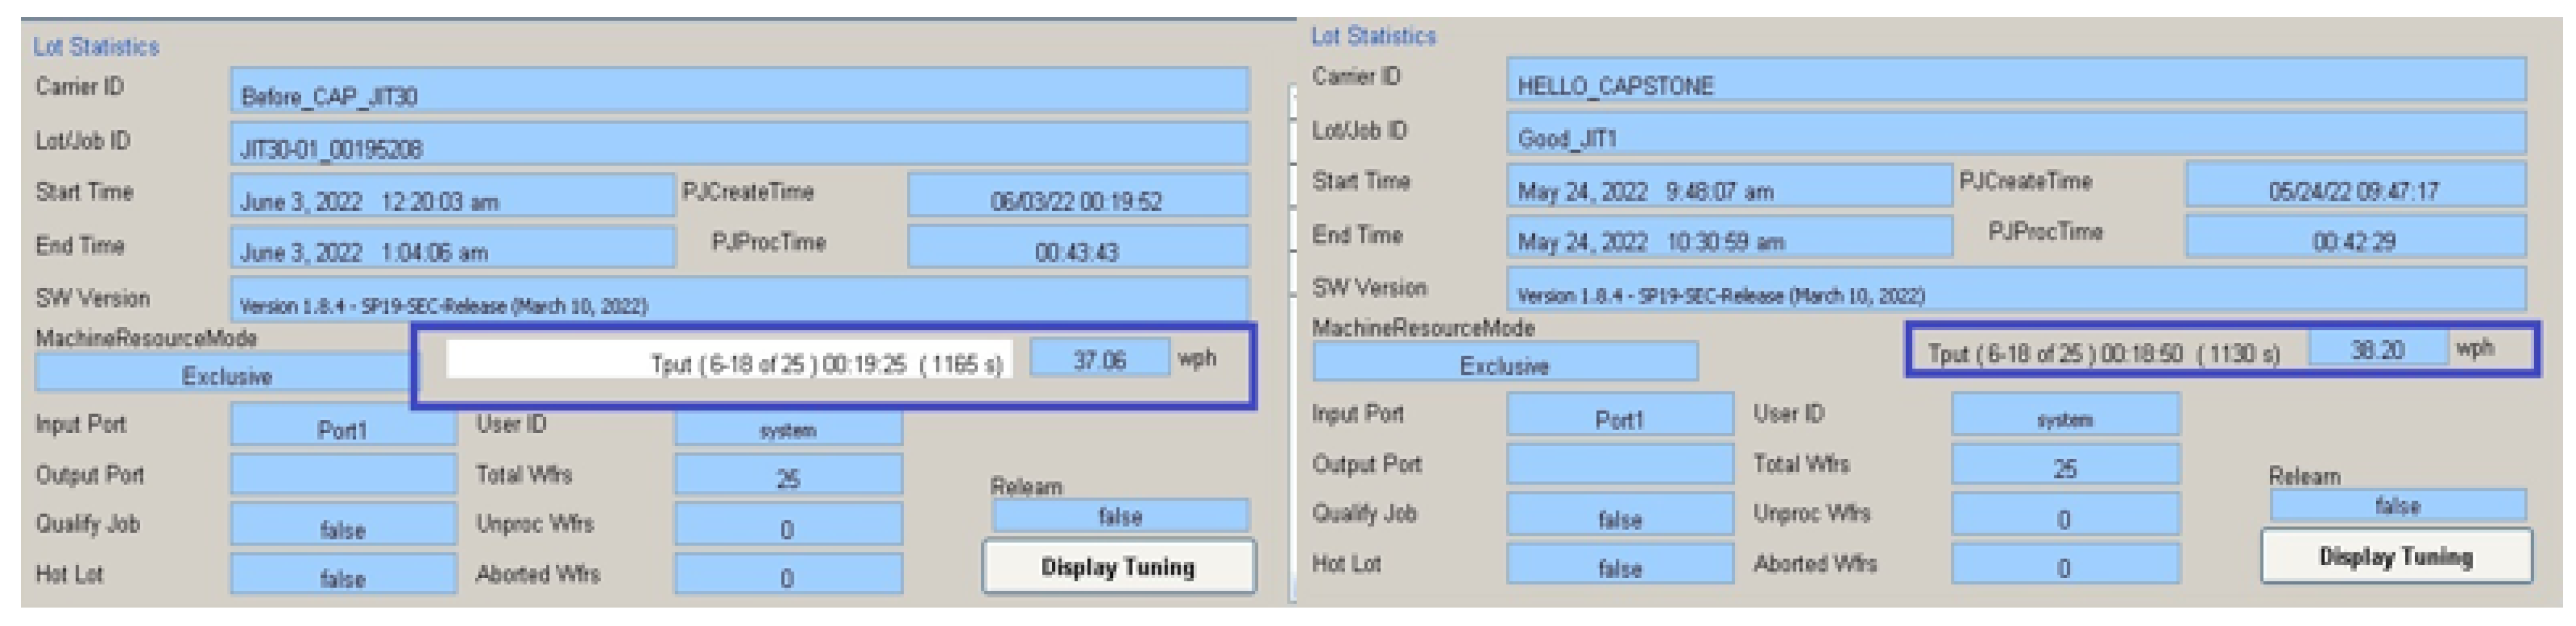
| Process Time | WAC Time | Tput (Pre-Optimization: JIT1 = 30) | Tput (Post-Optimization: JIT1 = 58) | Tput (Caculated Maximum) |
|---|---|---|---|---|
| 195.00 | 50.00 | 37.06 | 38.20 | 40.14 |
Publisher’s Note: MDPI stays neutral with regard to jurisdictional claims in published maps and institutional affiliations. |
© 2022 by the authors. Licensee MDPI, Basel, Switzerland. This article is an open access article distributed under the terms and conditions of the Creative Commons Attribution (CC BY) license (https://creativecommons.org/licenses/by/4.0/).
Share and Cite
Kim, Y.; Lee, G.; Jeong, J. ML-Based JIT1 Optimization for Throughput Maximization in Cluster Tool Automation. Appl. Sci. 2022, 12, 7519. https://doi.org/10.3390/app12157519
Kim Y, Lee G, Jeong J. ML-Based JIT1 Optimization for Throughput Maximization in Cluster Tool Automation. Applied Sciences. 2022; 12(15):7519. https://doi.org/10.3390/app12157519
Chicago/Turabian StyleKim, Youngsoo, Gunwoo Lee, and Jongpil Jeong. 2022. "ML-Based JIT1 Optimization for Throughput Maximization in Cluster Tool Automation" Applied Sciences 12, no. 15: 7519. https://doi.org/10.3390/app12157519