Article

A Study on Ergonomic Layout of Automotive Electronic Shift Buttons

1
Department of Safety Engineering, Incheon National University, Incheon 22012, Korea
2
Department of Industrial Engineering, Keimyung University, Daegu 42601, Korea
3
Digital Appliances Business, Samsung Electronics Co. Ltd., Seoul 06765, Korea
*
Authors to whom correspondence should be addressed.
These authors contributed equally to this work.
Appl. Sci. 2022, 12(18), 9222; https://doi.org/10.3390/app12189222
Submission received: 7 August 2022 / Revised: 8 September 2022 / Accepted: 12 September 2022 / Published: 14 September 2022
(This article belongs to the Special Issue State-of-the-Art in Human Factors and Interaction Design)

Abstract

:
Automotive gear shifters are among the most important control devices in driving tasks, and their user-centered design has a direct impact on the driving performance and safety. In recent years, shift-by-wire systems with electronic shift buttons have replaced conventional transmission systems due to their advantages, such as the ease of shifting and space utilization inside vehicles. However, there are no minimum requirements or specific regulations for electronic shift button layouts. Thus, different car manufacturers and models have adopted different layouts, and this in turn has induced the risk of driver confusion/error in the shifting operation. Therefore, this study aimed to evaluate the ergonomic performance of different electronic shift button layouts and examine the variance in performance depending on driving experience. Here, 21 survey respondents with different levels of driving experience subjectively evaluated 12 different shift button layouts for 7 ergonomic evaluation measures (accuracy, convenience, rapidity, learnability, intuitiveness, safety, and preference). The outcomes of the study elucidate ergonomic layouts that receive high rankings in each driving experience group (all, novice, and experienced drivers) and principles that should be considered when designing shift button layouts for each group. These findings are expected to contribute to the ergonomic design and international standardization of shift button layouts, thereby preventing driver confusion/errors and improving road safety.

1. Introduction

Automotive transmissions, which are used to shift between park (P), reverse (R), neutral (N), and drive (D) for longitudinal vehicle control, are among the most important control devices for driving [1]. In 1965, the American Society of Automotive Engineers (SAE) established an international standard requiring car manufacturers to design gear shifters according to the manual control sequence P-R-N-D [2]. This standard was intended to reduce accidents caused by driver confusion and erroneous operations, which occurred frequently mainly because the arrangement and order of gear positions (hereafter, referred to as layout) previously differed for each car manufacturer/model. The Code of Federal Regulations (CFR), title 49 (transportation), stipulates the following [3]:
“S3.1.1 Location of transmission shift positions on passenger cars. The N position is to be located between the D and R positions.”
“S3.1.1.1 Transmission shift levers. If a steering-column-mounted transmission shift lever is used, the movement from the N position to the D position is to be clockwise. If the transmission shift lever sequence includes a P position, it is to be located at the end adjacent to the R position.”
The recent advances in automotive transmissions have enabled various advantages in shift-by-wire (SBW) systems. As a result, they have replaced the conventional mechanical transmission system [4,5], and they have become customary over the last several decades. The SBW systems not only possess several advantages in terms of driver convenience and ease of gear shift operation, but they also help improve the level of freedom in transmission system design and space utilization inside vehicles [5,6,7]. In particular, an SBW system with electronic shift buttons facilitates easier gear shifting as compared with a transmission shift lever [8]. Moreover, there is no restriction on the mounting position of the gear shifter, and thus the internal space of the vehicle can be effectively utilized. Furthermore, in the event of an accident, no collision can occur between the body of the passenger and the gear shifter, thereby preventing injury to the passenger [6].
Despite these advantages, SBW systems with electronic shift buttons are not within the scope of the aforementioned SAE/CFR international standard. Therefore, there are no minimum requirements or regulations for the electronic shift button layouts. In addition to this, there are no detailed regulations related to various design factors such as the shift button size, color, separation, and visual/tactile feedback. Accordingly, as shown in Table 1, various layouts have been adopted by different car manufacturers/models, and this introduces the risk of erroneous operation by drivers. Qiu et al. [9] demonstrated that ill-structured console layouts result in an increase in the operator workload and subsequently increase the task completion time and error rate. The electronic shift button layout determines the accuracy, convenience, and speed of gear shifting, and it may affect the driving performance and overall safety [10]. Even though erroneous operation and safety accidents have occurred due to ill-structured shift button layouts and vehicles have been recalled accordingly [11,12], and standardization efforts and studies of ergonomic performance of electronic shift button layouts have not been actively performed. Given that electronic shift buttons are key elements in longitudinal vehicle control, a well-designed button layout is particularly important from an ergonomic perspective [13]. Accordingly, it is necessary to determine ergonomic electronic shift button layouts to improve the driving performance and reduce erroneous operation.
Therefore, as an effort toward the ergonomic design of automotive electronic shift button layouts and its global standardization, we investigated the ergonomic performance of different shift button layouts. Given that individual driving experiences significantly affect the driving performance, especially gear shifting performance for longitudinal control [14,15], it is necessary to consider the driving experience when designing shift button layouts [13,16]. Accordingly, we aimed to address the following unexplored research questions. The research activities performed to address the questions were also defined as follows:
Research question 1: What constitutes an ergonomic electronic shift button layout?
Research activity 1-1) Identify excellent shift button layouts that receive high marks from all respondents (regardless of driving experience).
Research activity 1-2) Determine principles that should be considered when designing shift button layouts.
Research question 2: How does the ergonomic performance of electronic shift button layouts vary depending on driving experience?
Research activity 2-1) Identify excellent shift button layouts that receive high scores from each driving experience group (driving for ≤2 years or >2 years).
Research activity 2-2) Determine principles that should be considered when designing shift button layouts for each driving experience group.
To address the aforementioned research questions and perform the corresponding activities, 12 different button layouts were established that considered the currently commercialized shift button layouts and ergonomic principles. A total of 21 respondents, consisting of 11 novice (driving for ≤2 years) and 10 experienced (driving for >2 years) drivers, were required to evaluate each of the 12 button layouts using 7 ergonomic evaluation measures (accuracy, convenience, rapidity, learnability, intuitiveness, safety, and preference).

2. Methods

2.1. Respondents

In this study, a novice driver was defined as “a person for whom two years have not passed from the day on which a driver’s license was obtained” according to the Road Traffic Act Section 2 (27) [17]. Accordingly, 11 novice drivers with 2 or fewer years of driving experience and 10 experienced drivers with more than 2 years of driving experience were recruited. Given that the experience using electronic shift buttons could affect the results of the study, such experiences were considered in addition to the driving experience when recruiting the respondents. Each respondent signed an informed consent form before participation. The characteristics of the respondents are summarized in Table 2.

2.2. Design Alternatives

In an effort to properly address the research question of ‘What constitutes an ergonomic electronic shift button layout?’, this study aimed at generating many different layout design alternatives in an exploratory/opportunistic way, and then comprehensively/comparatively evaluating them in terms of the ergonomic performance.
Note that in generating the button layout design alternatives, the current study considered only the four shift buttons (P, R, N, and D) pertaining to the key elements for the shifting operation, not other functional buttons for starting the engine or changing the driving modes (sport, comfort, eco, etc.); furthermore, other design factors besides layout, such as the size, color, material, or spacing of buttons, were not considered.
The ergonomic principles applied to generate various button layout design alternatives were as follows:
  • Consistency: Maintaining consistency of the component layout across the same or similar systems (systems designed for the same or similar functions) [18,19,20]:
The button layout was designed such that it is the same as or similar to commercialized button layouts that have been adopted for popular car brands, as shown in Table 1.
  • Functional similarity: Grouping components that are functionally related in the operation of the system [9,13,21,22]:
The P and N buttons associated with the stop function were positioned close together and away from the D and R buttons associated with the driving function. Nakade et al. [4] stated that locating the push switch for shifting to hold the vehicle stationary (i.e., P) away from those used to change the driving force direction (i.e., D and R) could help prevent mis-shifts into the P position when changing the driving force direction.
  • Compatibility: Designing control layouts such that the system response (movement) to the user operation meets his/her expectations [18,20,23]:
Relative to the N button, the D button was positioned in front and the R button behind.
  • Stereotype: Designing control layouts in line with the expectations of a particular group of users [13]:
The D and R buttons that determine the direction of longitudinal vehicle control were positioned in the longitudinal direction.
A total of 12 design alternatives were generated through the following two-step process.
  • Step 1: A total of six button layouts were derived by applying the consistency principle, in other words, designed to be the same as or similar to internationally manufactured/commercialized ones. These six layouts were odd-numbered (hereafter referred to as L1, L3, L5, L7, L9, and L11).
  • Step 2: Each of the six button layouts derived in Step 1 was slightly modified by applying other ergonomic layout design principles instead of the consistency principle, generating six other novel button layouts. These six layouts were even-numbered (hereafter referred to as L2, L4, L6, L8, L10, and L12).
Table 3 summarizes/illustrates the 12 design alternatives with the 6 odd-numbered and 6 even-numbered layouts in the left and right columns, respectively; furthermore, the ergonomic layout design principles applied in each design alternative are also indicated.

2.3. Pairs Compared to Examine the Effectiveness of Applying Ergonomic Principles

To study the effectiveness of each ergonomic principle, pairs of layouts were compared based on Table 3; layouts with and without each ergonomic principle applied formed a pair (Table 4). These pairs were used in Research activity 1-2 and Research activity 2-2. There was no such layout wherein the principles of compatibility and consistency were applied simultaneously in this study because the compatibility principle has not been applied to the currently commercialized button layouts. In other words, a layout with the consistency principle applied was a layout without the compatibility principle applied, and vice versa.

2.4. Questionnaires

Seven measures—specifically, accuracy, convenience, rapidity, learnability, intuitiveness, safety, and preference—were employed to evaluate the design alternatives from an ergonomic perspective. The descriptions of these measures and the questions asked to the respondents regarding each measure are given in Table 5.
For each of the seven measures, the respondents answered the question using a 7-point Likert scale [24,25] with the endpoints “Strongly disagree” (1) and “Strongly agree” (7) and the midpoint “Neutral” (4). After obtaining subjective ratings for each design alternative, additional opinions (reasons for the answers, points to be improved, etc.) on the alternative were collected through a post-questionnaire/interview.

2.5. Conducting Online Surveys

The survey in this study was conducted on an online platform called “Survey Monkey.” Each respondent was asked to complete the survey assuming a situation in which repetitive and rapid gear shifting was needed (such as when parking or yielding on a narrow road). The presentation order of the 12 design alternatives was randomized for each respondent. To minimize the effect of mental fatigue, each respondent conducted the survey over a period of seven days.

2.6. Data Analyses

The methods for analyzing the results corresponding to each of the four research activities to address the two research questions of this study were as follows. The two research questions were (1) “What constitutes an ergonomic electronic shift button layout?” (Research question 1) and (2) “How does the ergonomic performance of electronic shift button layouts vary depending on driving experience?” (Research question 2).

2.6.1. Research Activity 1-1) Identify Excellent Shift Button Layouts that Receive High Marks from All Respondents (Regardless of Driving Experience)

A one-way repeated-measures analysis of variance (ANOVA) was conducted to test the impact of the independent variable (layout) on each dependent variable (accuracy, convenience, rapidity, learnability, intuitiveness, safety, and preference). Mauchly’s test was performed to assess the sphericity of the data for each ANOVA test. In cases wherein the sphericity was violated, the degrees of freedom were corrected; the Greenhouse–Geisser correction was used when the Greenhouse–Geisser estimate of sphericity (ɛ) was less than 0.75; otherwise, the Huynh–Feldt correction was used [26,27]. In the case of statistically significant ANOVA results, post-hoc multiple comparisons with Bonferroni corrections were conducted to determine the pairs of button layouts that significantly differed in terms of the mean value.

2.6.2. Research Activity 1-2) Determine Principles that Should Be Considered when Designing Shift Button Layouts

A paired t-test was conducted to study the impact of the independent variable (ergonomic principle) on each dependent variable (accuracy, convenience, rapidity, learnability, intuitiveness, safety, and preference). The pairs of layouts that were compared to study the effectiveness of applying each ergonomic principle are provided in Table 4.

2.6.3. Research Activity 2-1) Identify Excellent Shift Button Layouts that Receive High Scores from Each Driving Experience Group (Driving for ≤2 Years or >2 Years)

Two-way mixed ANOVA was conducted to test the main and interaction effects of the independent variables (layout and driving experience) on each dependent variable (accuracy, convenience, rapidity, learnability, intuitiveness, safety, and preference). The simple main effects for each independent variable in the case where there was a significant interaction effect between the independent variables were investigated.

2.6.4. Research Activity 2-2) Determine Principles that Should Be Considered when Designing Shift Button Layouts for Each Driving Experience Group

A two-way mixed ANOVA was conducted to test the main and interaction effects of the independent variables (ergonomic principle and driving experience) on each dependent variable (accuracy, convenience, rapidity, learnability, intuitiveness, safety, and preference). In the case where there was a significant interaction effect between the independent variables, simple main effects for each independent variable were investigated. The pairs of layouts in Table 6 were again used here to examine the effectiveness of applying each ergonomic principle.
All statistical tests were conducted using IBM SPSS Statistics 23.0 and were based on an alpha level of 0.05.

3. Results

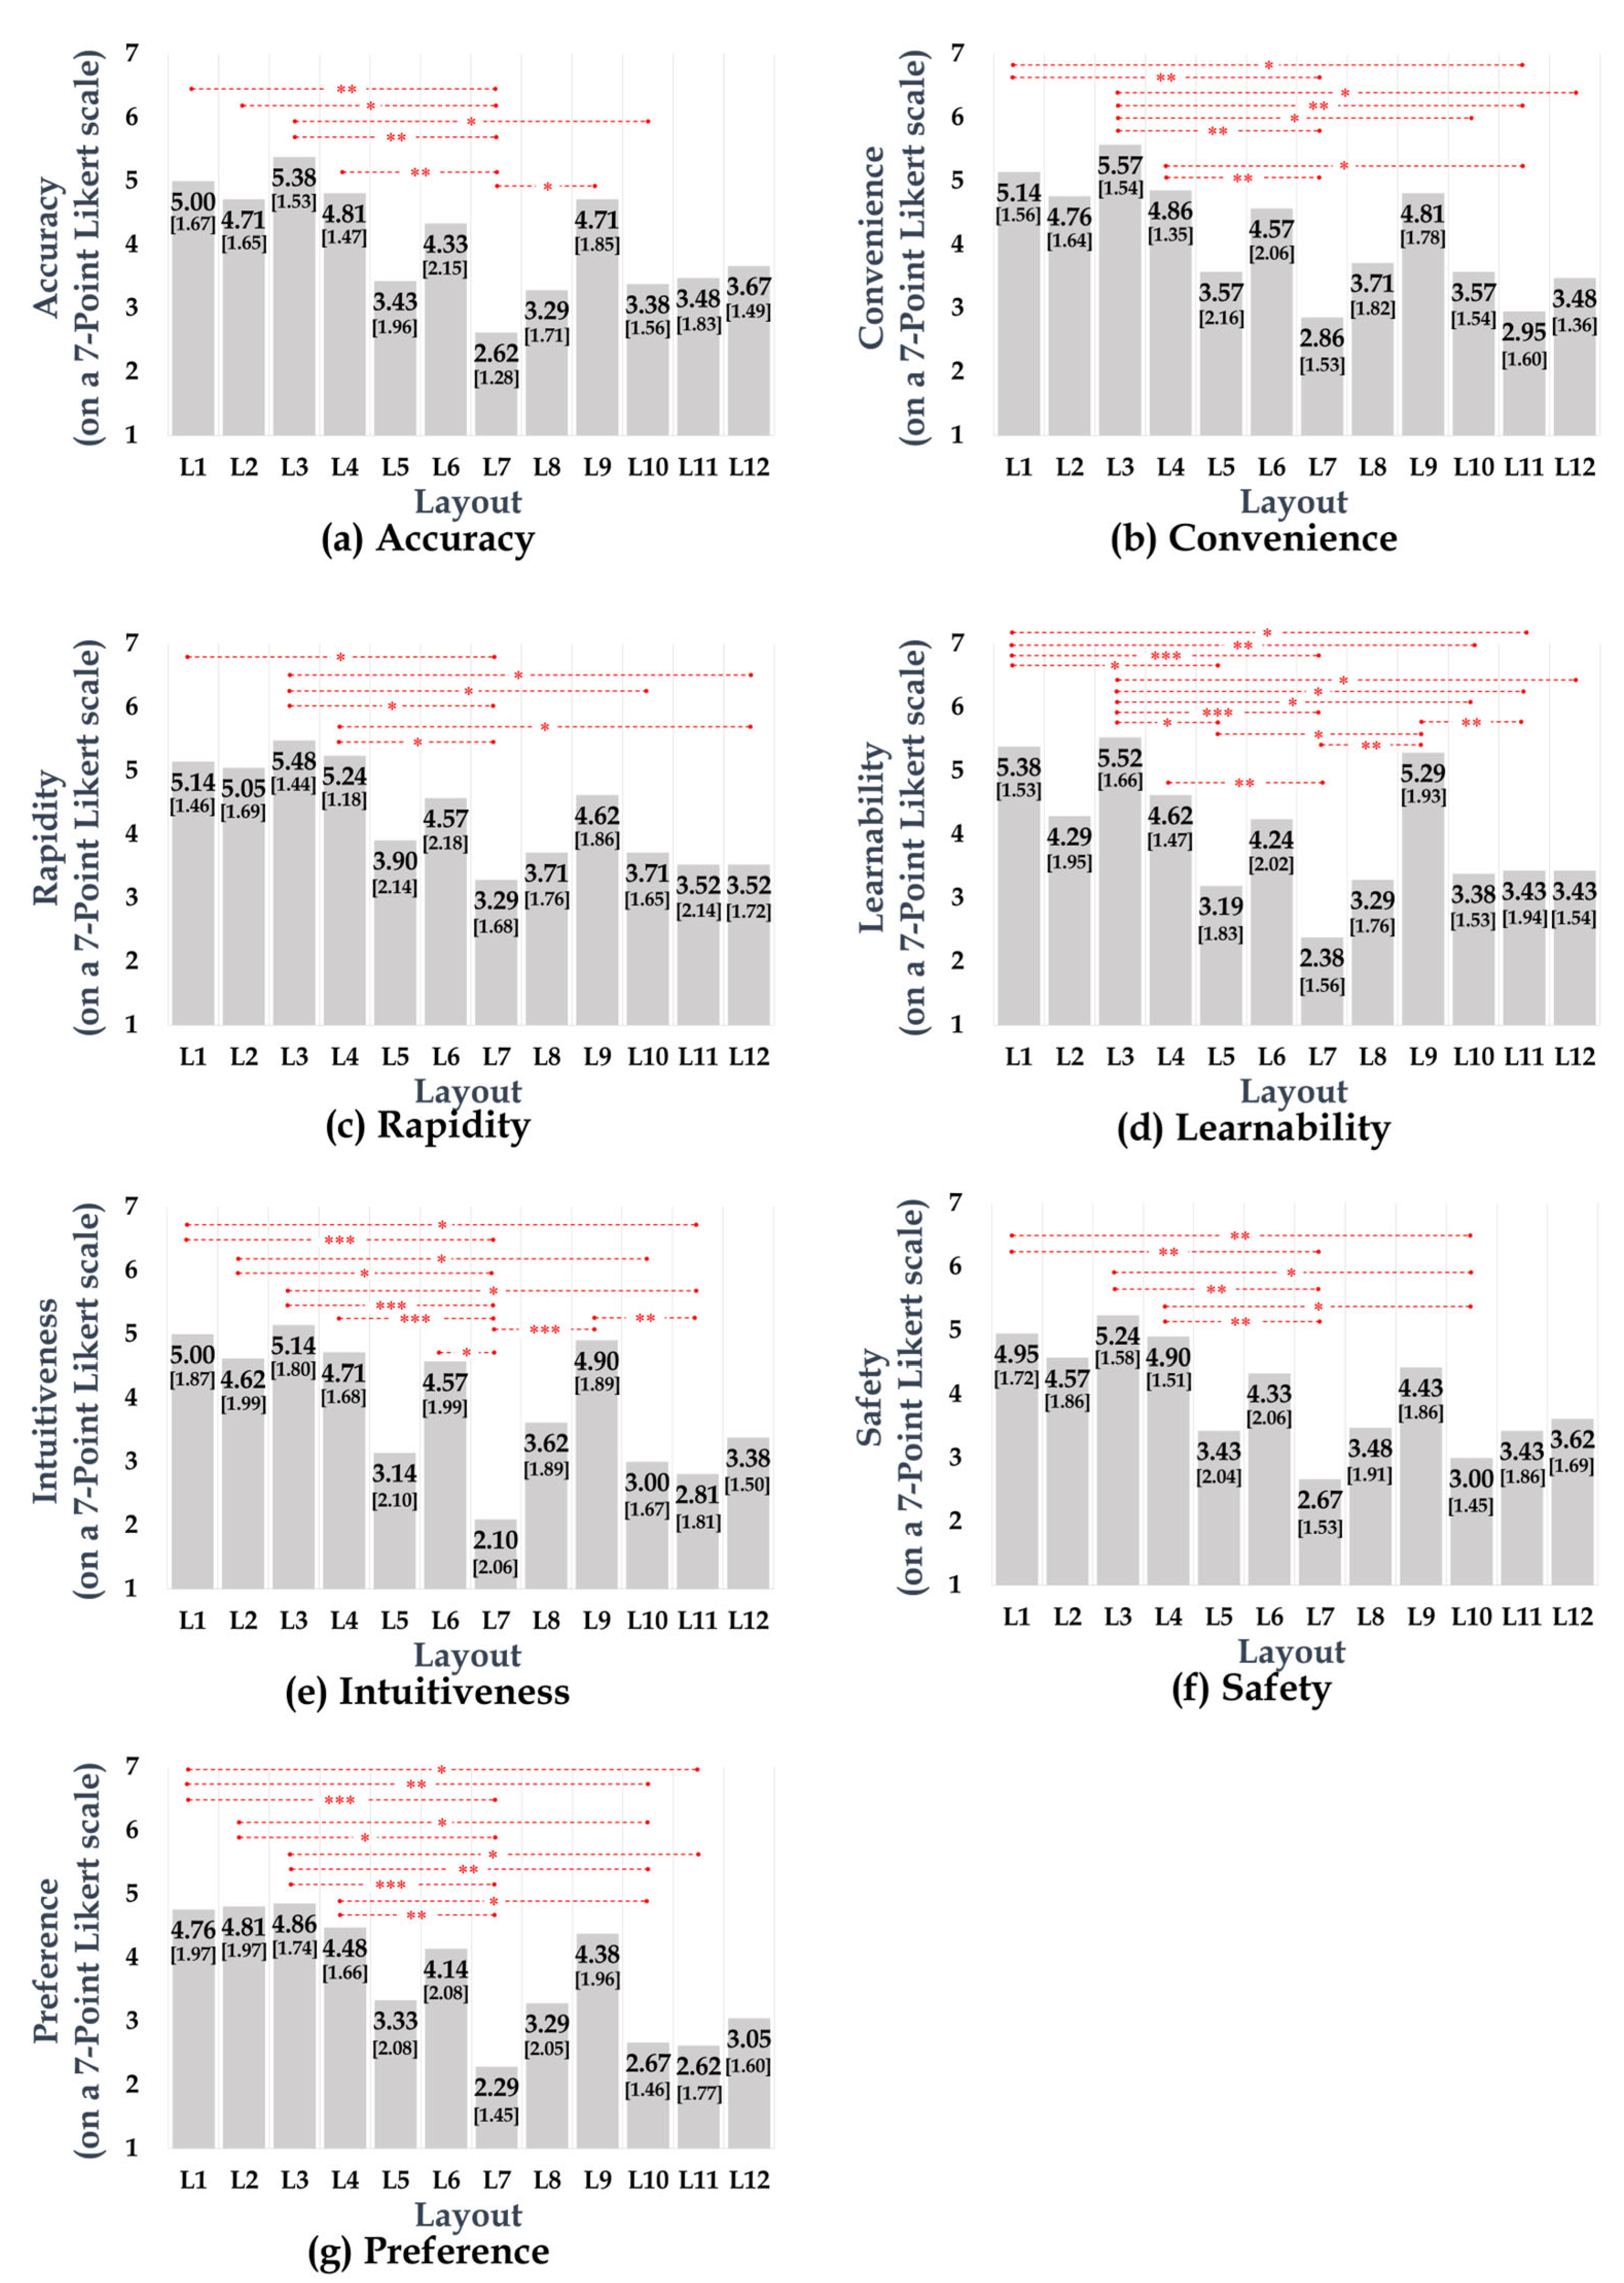
3.1. Effects of Layout on Each of the Seven Dependent Measures

The ANOVA results showed that the layout affected all seven dependent measures (accuracy, convenience, rapidity, learnability, intuitiveness, safety, and preference), with each p-value being less than 0.001. For each of these dependent variables, the mean and standard deviation of each layout design are shown in Figure 1, and the asterisks indicated statistical significance in post-hoc multiple comparisons with Bonferroni corrections.
Across all seven measures, L1, L2, L3, L4, L6, and L9 show scores higher than 4 (“Neutral”). The layouts that exhibit statistically significant differences for each of the six layouts are as follows:
  • L1 displays significantly higher mean scores compared to L5 for learnability; L7 in terms of all seven measures; L10 in terms of learnability, safety, and preference; and L11 in terms of convenience, learnability, intuitiveness, and preference.
  • L2 exhibits significantly higher mean scores compared to L7 in terms of accuracy, intuitiveness, and preference, and L10 in terms of intuitiveness and preference.
  • L3 shows significantly higher mean scores compared to L5 in terms of learnability; L7 in terms of all seven measures; L10 in terms of convenience, rapidity, learnability, safety, and preference; L11 in terms of convenience, learnability, intuitiveness, and preference; and L12 in terms of convenience, rapidity, and learnability.
  • L4 presents significantly higher mean scores compared to L7 in terms of all seven measures; L10 in terms of safety and preference; and L11 in terms of convenience.
  • L6 shows a significantly higher mean score compared to L7 in terms of intuitiveness.
  • L9 has significantly higher mean scores compared to L5 and L7 in terms of learnability and L11 in terms of learnability and intuitiveness.

3.2. Effects of Ergonomic Principle on the Dependent Measures

Table 6 shows the mean differences between layouts to which ergonomic principles (consistency, compatibility, functional similarity, and stereotype) were applied and layouts to which they were not applied. The bold type and asterisks indicate statistical significance in the paired t-test.
The pairs of layouts that show statistically significant differences for each of the seven dependent measures are as follows:
  • For all seven measures, L9, wherein the compatibility principle was not applied, presents a significantly higher mean score than L10, to which this principle was applied.
  • For rapidity, L3, to which the functional similarity principle was applied, exhibits a significantly higher mean score than L9, to which this principle was not applied; for all seven measures, L4, to which the functional similarity principle was applied, shows a significantly higher mean score than L10, to which this principle was not applied.
  • For learnability, intuitiveness, and safety, L6, to which the stereotype principle was applied, exhibits a significantly higher mean score than L5, to which this principle was not applied; for convenience, learnability, intuitiveness, and preference, L8, to which the stereotype principle was applied, shows a significantly higher mean score than L7, to which this principle was not applied. Regarding accuracy, convenience, learnability, intuitiveness, safety, and preference, L9, to which the stereotype principle was applied, displays a significantly higher mean score than L11, to which this principle was not applied.

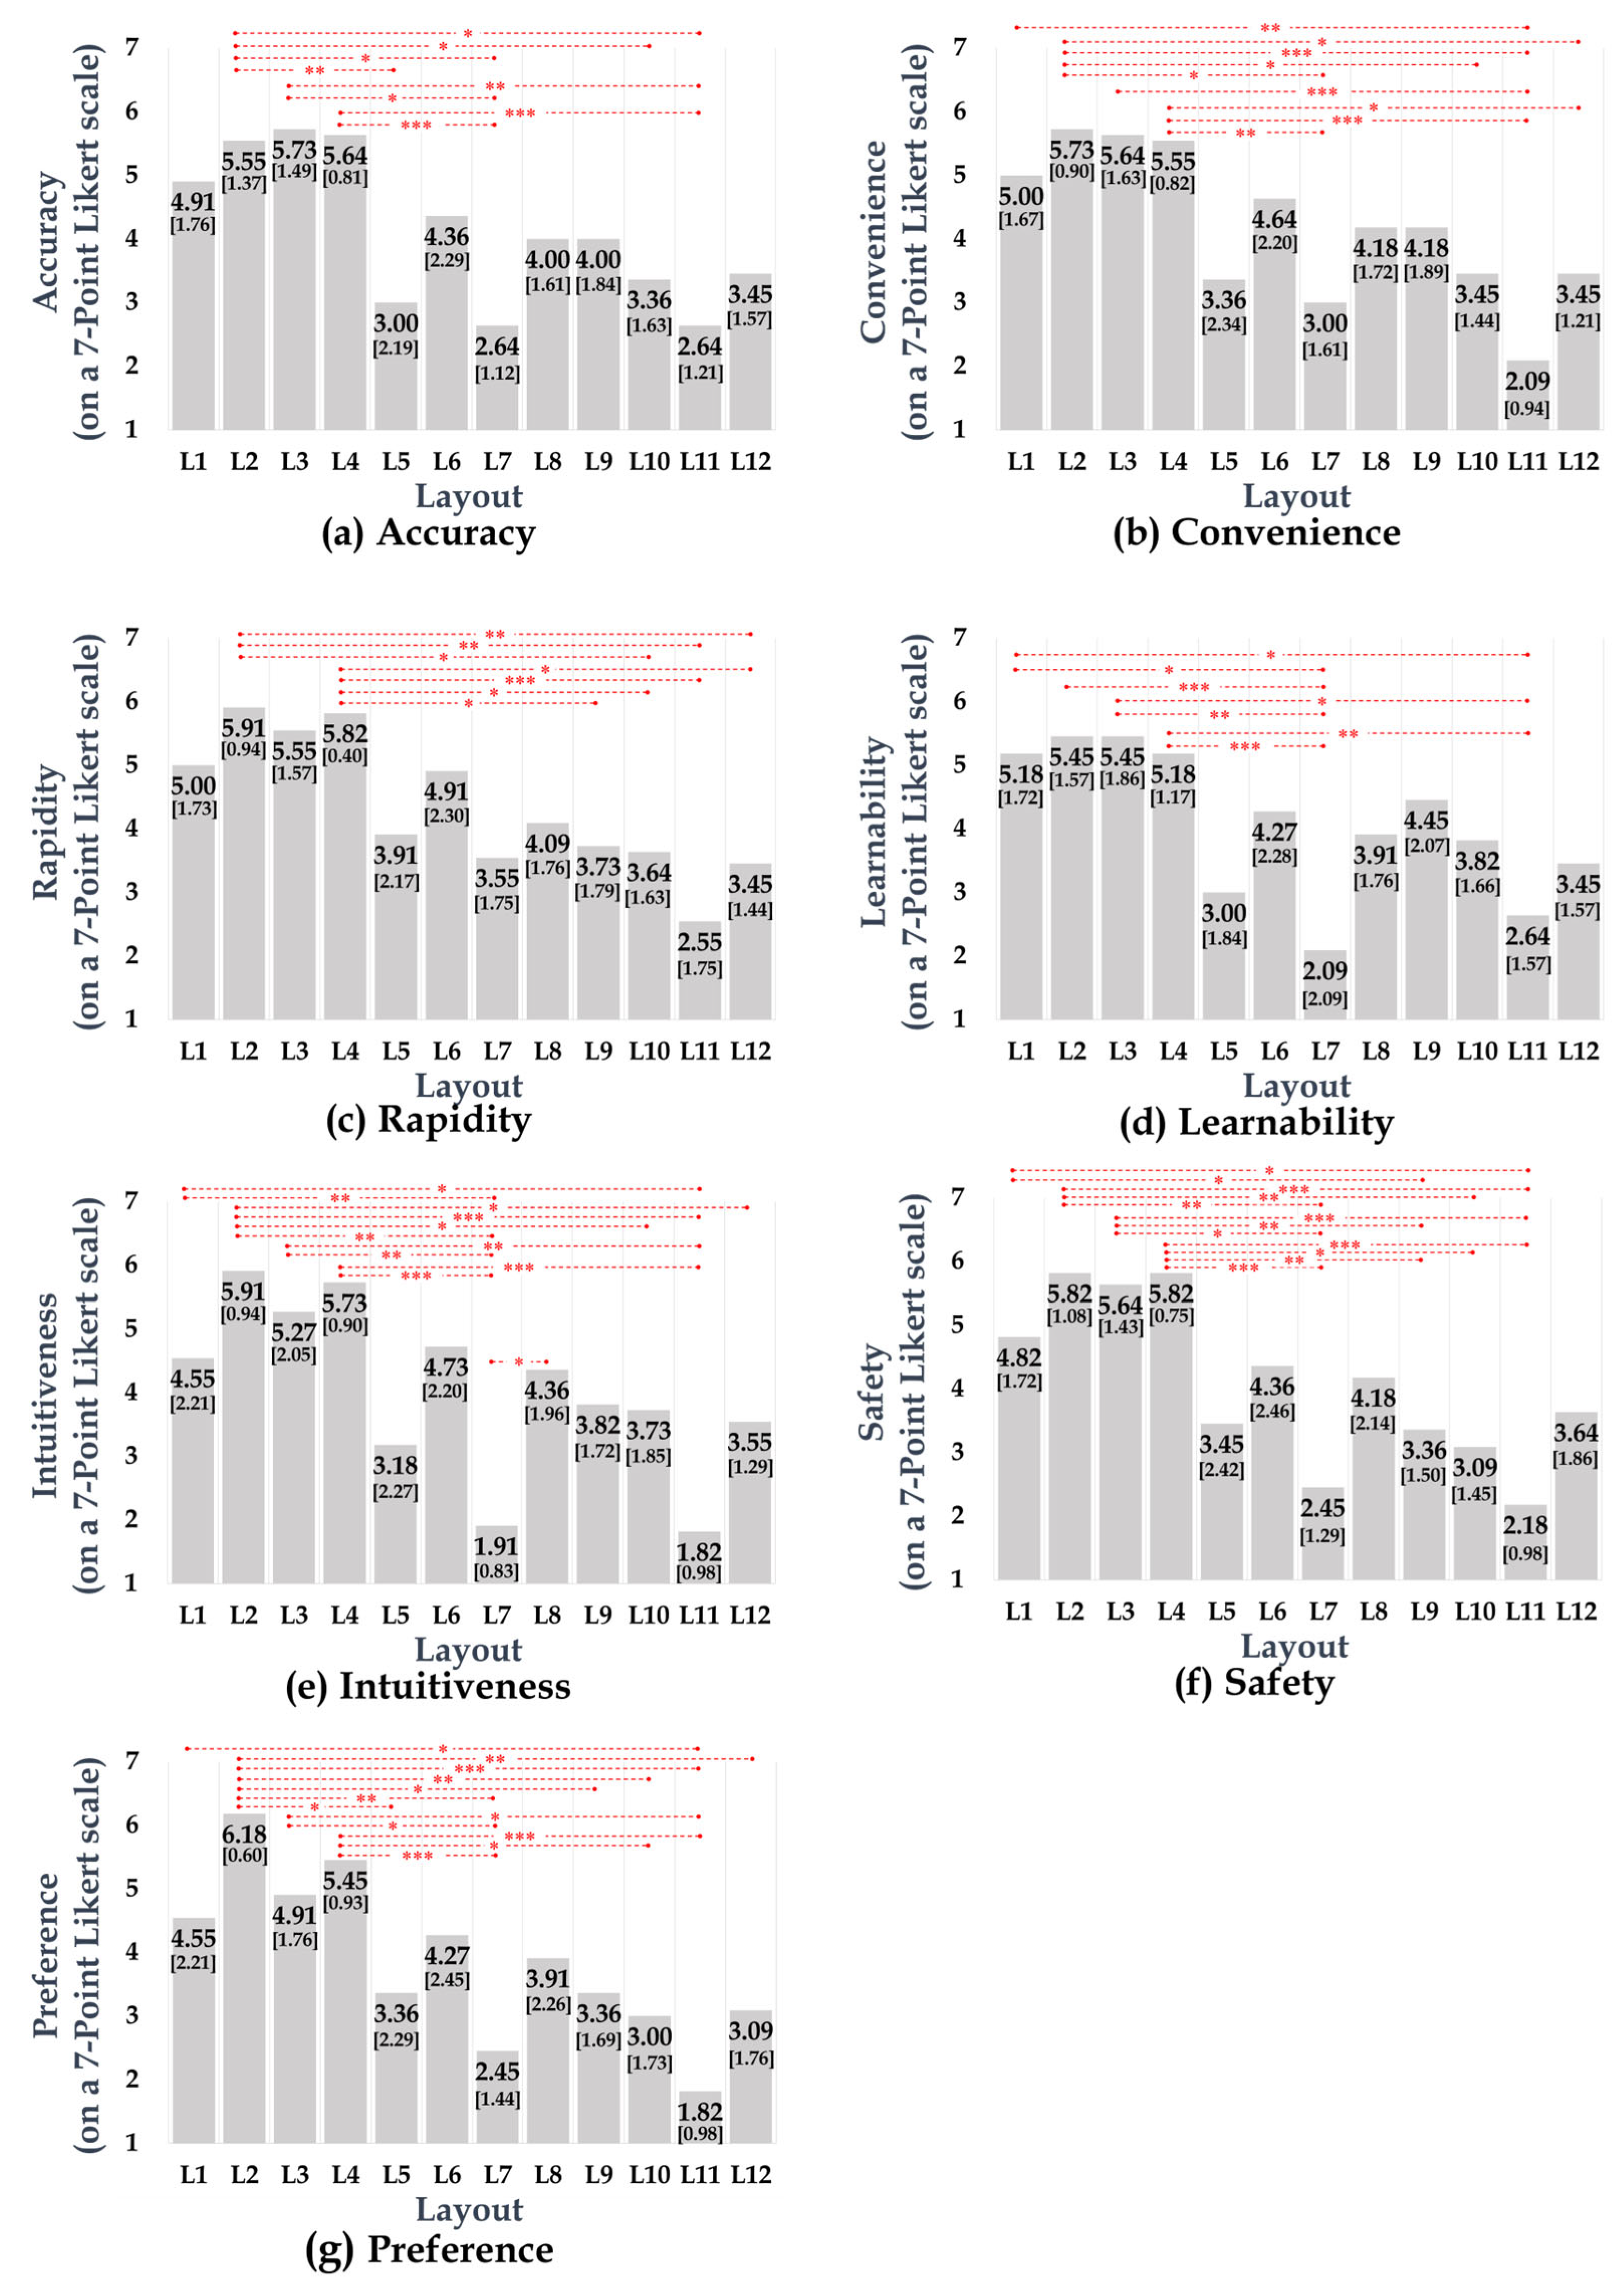
3.3. Effects of Layout and Driving Experience on Each of the Seven Dependent Measures

The ANOVA results showed that the interaction effect between the layout and driving experience was statistically significant for all seven measures. For each measure, the simple main effects for layout and driving experience were also statistically significant. Regarding the simple main effects for layout, the mean and standard deviation of each subjective rating measure for each layout in the novice driver group are presented in Figure 2, with asterisks indicating significant layout effects.
Across all seven measures, L1, L2, L3, L4, and L6 show higher scores than 4 (“Neutral”). Among these five layouts, all except L6 display statistically significant mean differences from the others, and the results are as follows:
  • L1 exhibits significantly higher mean scores compared to L7 in terms of learnability and intuitiveness; L9 in terms of safety; and L11 in terms of convenience, intuitiveness, safety, and preference.
  • L2 presents significantly higher mean scores compared to L5 in terms of accuracy and preference; L7 in terms of accuracy, convenience, learnability, intuitiveness, safety, and preference; L9 in terms of preference; L10 and L11 in terms of accuracy, convenience, rapidity, intuitiveness, safety, and preference; and L12 for convenience, rapidity, intuitiveness, and preference.
  • L3 shows significantly higher mean scores compared to L7 for accuracy, learnability, intuitiveness, safety, and preference; L9 in terms of safety; and L11 in terms of accuracy, convenience, learnability, intuitiveness, safety, and preference.
  • L4 displays significantly higher mean scores compared to L7 in terms of accuracy, convenience, learnability, intuitiveness, safety, and preference; L9 in terms of rapidity and safety; L10 in terms of rapidity, safety, and preference; L11 in terms of all seven measures; and L12 in terms of convenience and rapidity.
In addition, L8 shows a higher score than 4 (“Neutral”) for all measures except learnability and preference and a higher mean than L7 in terms of intuitiveness.
Figure 3 presents the mean and standard deviation of each subjective rating measure for each layout in the experienced driver group, wherein the asterisks indicate significant layout effects.
Across all seven measures, L1, L3, and L9 present scores higher than 4 (“Neutral”). The layouts that show statistically significant differences for each of these three layouts are as follows:
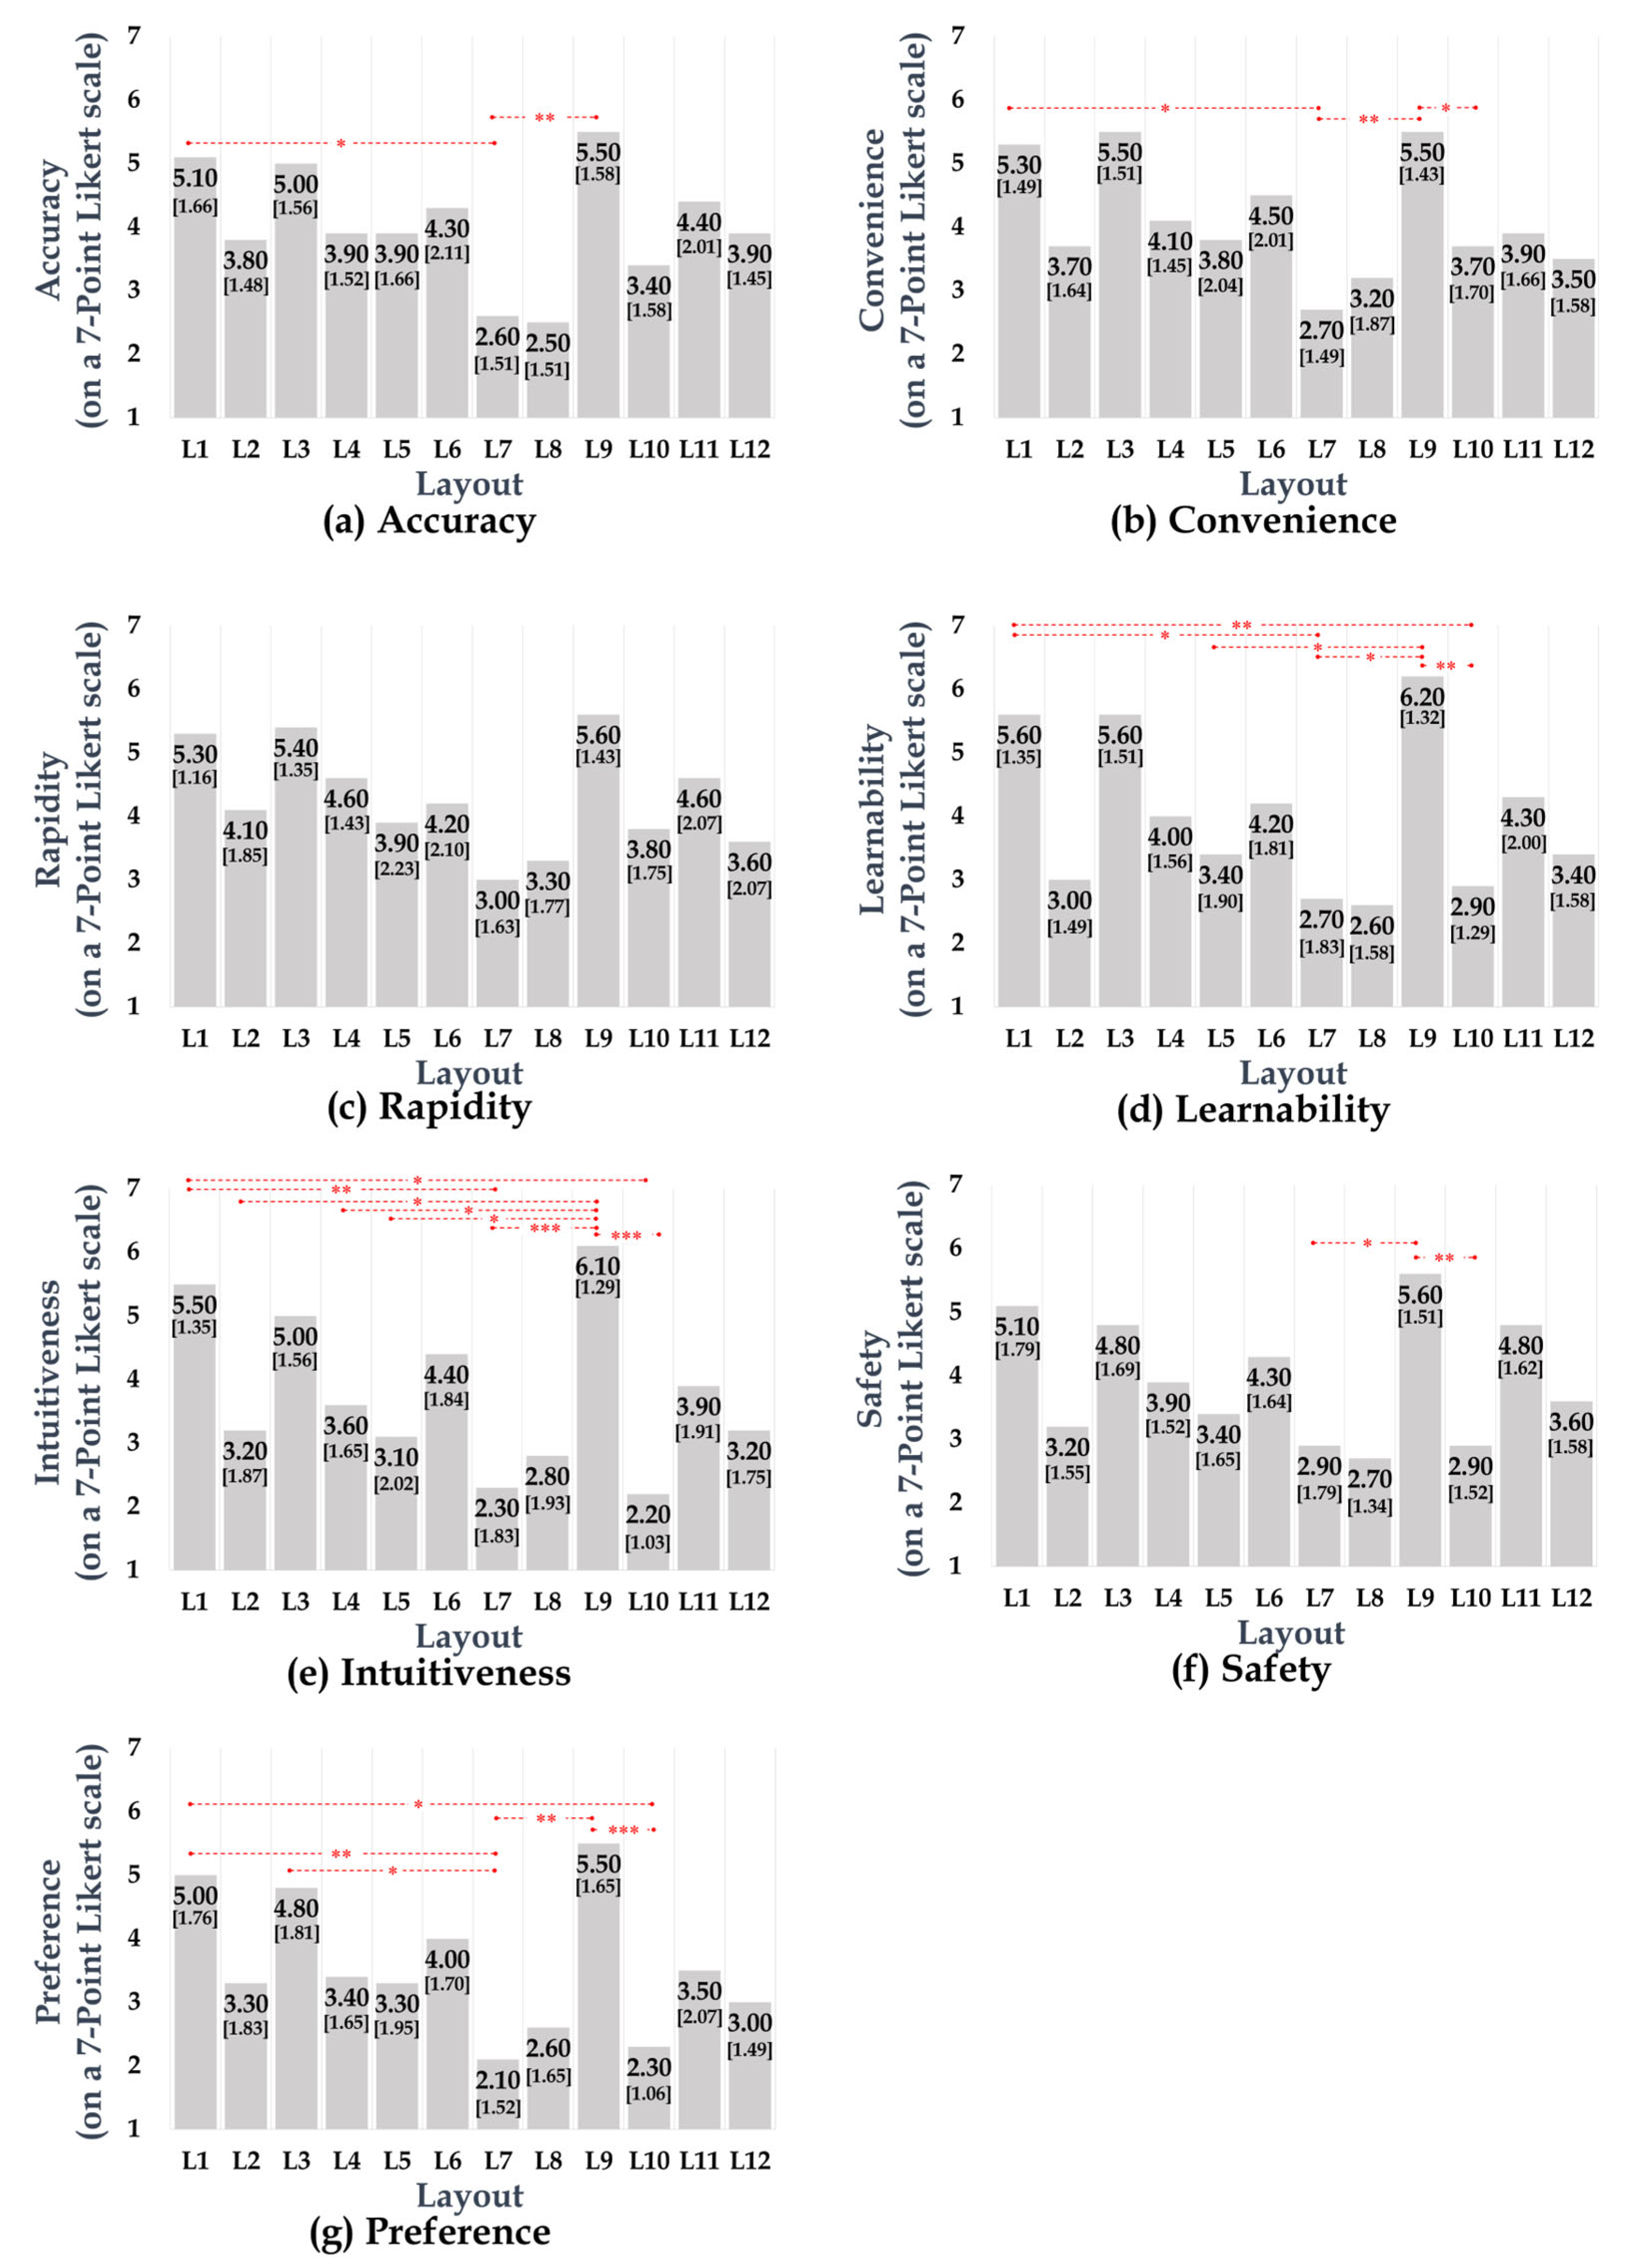
  • L1 displays significantly higher mean scores compared to L7 in terms of accuracy, convenience, learnability, intuitiveness, and preference, and L10 in terms of learnability, intuitiveness, and preference.
  • L3 exhibits a significantly higher mean score compared to L7 in terms of preference.
  • L9 shows significantly higher mean scores compared to L2 and L4 in terms of intuitiveness; L5 in terms of learnability and intuitiveness; L7 in terms of accuracy, convenience, learnability, intuitiveness, safety, and preference; and L10 for convenience, learnability, intuitiveness, safety, and preference.
Regarding the simple main effects for driving experience, the mean differences of the seven dependent measures between the novice and experienced driver groups for each layout are shown in Table 7 (where a positive value indicates that the mean evaluation score is higher for the novice group than for the experienced group). The mean differences with statistically significant simple main effects for driving experience are indicated by bold font and asterisks.
For each of the seven dependent measures, the layouts that show statistically significant mean differences between the novice and experienced driver groups are as follows:
  • For L2, the novice driver group exhibits significantly higher mean scores than the experienced driver group for all seven measures.
  • For L4, the novice driver group displays significantly higher mean scores than the experienced driver group for all measures except learnability.
  • For L8, the novice driver group shows a significantly higher mean accuracy score than the experienced driver group.
  • For L9, the experienced driver group presents significantly higher mean scores than the novice driver group in terms of accuracy, learnability, intuitiveness, safety, and preference.
  • For L11, the experienced driver group shows significantly higher mean scores than the novice driver group for all seven measures.

3.4. Effects of Ergonomic Principle and Driving Experience on EACH Dependent Measure

Table 8 and Table 9 show the mean differences between layouts to which ergonomic principles (consistency, compatibility, functional similarity, and stereotype) were applied and layouts to which they were not applied for the novice and experienced driver groups, respectively. The mean differences with statistically significant simple main effects for layout are indicated by bold font and asterisks.
For the novice driver group, the comparison pairs that show statistically significant differences for each dependent measure are as follows:
  • For convenience, intuitiveness, and safety, L12, to which the compatibility principle was applied, exhibits significantly higher mean scores compared to L11, to which this principle was not applied.
  • For all the measures except convenience, L3, to which the functional similarity principle was applied, presents significantly higher mean scores compared to L9, to which this principle was not applied.
  • For learnability, intuitiveness, and safety, L8, to which the stereotype principle was applied, displays significantly higher mean scores compared to L7, to which this principle was not applied.
For the experienced driver group, the comparison pairs that show statistically significant differences for each dependent measure are as follows:
  • For all the measures except rapidity, L1, to which the compatibility principle was not applied, exhibits significantly higher mean scores compared to L2, to which this principle was applied.
  • For preference, L3, to which the compatibility principle was not applied, displays a significantly higher mean score compared to L4, to which this principle was applied.
  • For rapidity, learnability, intuitiveness, safety, and preference, L9, to which the compatibility principle was not applied, presents significantly higher mean scores than L10, to which this principle was applied.

4. Discussion

To achieve ergonomic electronic shift button layouts and global standardization of these layouts, the following two research questions were addressed in this study:
  • What constitutes an ergonomic electronic shift button layout? (Research question 1).
  • How does the ergonomic performance of electronic shift button layouts vary depending on driving experience? (Research question 2).
To answer these questions, 12 different button layouts were derived considering the currently commercialized shift button layouts and ergonomic design principles. A total of 21 respondents with different levels of driving experience were recruited and required to evaluate each of the layouts using 7 ergonomic evaluation measures (accuracy, convenience, rapidity, learnability, intuitiveness, safety, and preference).
Based on the evaluation results, four research activities were performed.
  • Excellent shift button layouts that received high marks from all respondents (regardless of driving experience) were identified (Research activity 1-1).
  • Principles that should be considered when designing shift button layouts were determined (Research activity 1-2).
  • Excellent shift button layouts that received high scores from each driving experience group (driving for ≤2 years or >2 years) were identified (Research activity 2-1).
  • Principles that should be considered when designing shift button layouts for each driving experience group were determined (Research activity 2-2).
Regarding Research activity 1-1, for all seven measures, L1, L2, L3, L4, L6, and L9 showed scores higher than 4 (“Neutral”) and higher mean scores than L5, L7, L10, L11, and L12, with statistical significance in some of the pairwise comparisons (Figure 1). The six layouts that received high marks (L1, L2, L3, L4, L6, and L9) were those to which the stereotype principle was commonly applied. In contrast, among the five layouts that received low marks (L5, L7, L10, L11, and L12), L5, L7, L11, and L12 were those to which the stereotype principle was not applied. Therefore, it can be said that it is important to apply the stereotype principle when designing gear shift button layouts. Our findings appear to be well supported by the existing literature, emphasizing that the equipment and systems should be designed such that they can, as far as possible, be in accordance with the stereotype trends for the relevant population to reduce the risk of error and improve safety [13,23,28,29].
Meanwhile, among the five layouts that received low marks, L5, L7, and L11 were those to which the consistency principle, that is, the shift button layouts currently adopted by many car manufacturers, was applied. These are half of the six commercialized layouts considered in this study, which demonstrates the risk of confusion and erroneous operation and the need for ergonomic review. It should be noted that only the consistency principle was applied to the three layouts. This finding suggests that other ergonomic principles should be considered and applied together with the consistency principle when designing gearshift button layouts. However, in the case of L10, even though the stereotype principle was applied along with the compatibility principle (instead of the consistency principle), it received low marks, which suggests that the consistency principle is an important design principle when designing shift button layouts with longitudinal arrangements, such as L9 and L10. Indeed, 5 of the 21 respondents stated that it would be desirable to modify the button layout in the order of P-R-N-D (i.e., to apply the consistency principle) to improve L10.
Regarding Research activity 1-2, the observations that L4 and L9 had higher mean scores than L10; L3 had higher mean scores than L9; L6 had higher mean scores than L5; L8 had higher mean scores than L7; and L9 had higher mean scores than L11 (Table 6), suggest that consistency, functional similarity, and stereotype principles should be considered important when designing shift button layouts. The fact that L9 had significantly higher mean scores than L10 for all seven measures could be explained by the aforementioned reason that L10 received low marks (i.e., the consistency principle was deemed important when designing shift button layouts with longitudinal arrangements was not applied). Thus, in addition to L10 (in which the buttons were in the order D-N-R-P), which was significantly different from L9 (in which the buttons were in the order P-R-N-D) to which the consistency principle was applied, wherein slightly modified layouts need to be further considered. Indeed, for L10, some respondents answered that it would be better if the P button was placed at the top (i.e., if the buttons were in the order P-D-N-R).
The observations that L3 had higher mean scores than L9 and L4 had higher mean scores than L10 agreed well with the results of Research activity 1-1, wherein L3 and L4 received high marks, indicating that the functional similarity principle plays an important role in the subjective evaluation of shift button layouts. These findings are well supported by those of previous studies that emphasized that controls and displays associated with similar functions should be grouped and located together for ease of finding and operating [13].
In addition, the observations that L6 had higher mean scores than L5; L8 had higher mean scores than L7; and L9 had higher mean scores than L11 suggest that the stereotype principle should be considered important when designing shift button layouts, which is also in line with the results of Research activity 1-1.
Therefore, to summarize the aforementioned results, among the six layouts (L1, L2, L3, L4, L6, and L9) that received high marks in Research activity 1-1, L3, to which the consistency, functional similarity, and stereotype principles that were found to be important in Research activity 1-2 were applied altogether, can be recommended as the most ergonomic layout.
However, the results of Research activity 2-1 indicated that the shift button layout evaluation differed considerably depending on driving experience. In Research activity 2-1, in the case of the novice driver group, L1, L2, L3, and L4 showed higher scores than 4 (“Neutral”) for all 7 measures and higher mean scores than L5, L7, L9, L10, L11, and L12, with statistical significance in some of the pairwise comparisons (Figure 2). In the experienced driver group, L1, L3, and L9 received higher scores than 4 (“Neutral”) for all 7 measures and higher mean scores than L2, L4, L5, L7, and L10, with statistical significance in some of the pairwise comparisons (Figure 3). The five layouts that received high marks in the novice or experienced driver groups (L1, L2, L3, L4, and L9) were among the layouts that received high marks from all respondents in Research activity 1-1; thus, it can be confirmed that the stereotype principle was applied to these five layouts. Interestingly, L6, which received high marks in Research activity 1-1, did not show superiority compared to the other layouts in both groups in Research activity 2-1. Given that L6 was a layout to which only the stereotype principle was applied, these results suggest that, despite the importance of the stereotype principle, it is preferable to apply it in combination with other principles rather than alone. This result is consistent with the fact that L8, to which only the stereotype principle was applied, was not superior to the other layouts in both groups. Future studies may consider various layouts to which only the stereotype principle is applied to enhance the understanding of the effects of that principle.
For both the novice and experienced driver groups, L1 and L3 received high scores in Research activity 2-1. The consistency and stereotype principles were applied to both the layouts, and the functional similarity principle was applied to L3. In contrast, for L2, L4, and L9, conflicting results were obtained from the novice and experienced driver groups. The compatibility principle (instead of the consistency principle) was applied to L2 and L4, which received high marks only in the novice driver group, whereas the consistency principle (instead of the compatibility principle) was applied to L9, which received high marks only in the experienced driver group.
These conflicting results between the groups are also displayed in Table 7. Here, L2 and L4, to which the compatibility principle was applied, received higher scores in the novice driver group than in the experienced driver group. In contrast, L9, to which the consistency principle was applied, received higher marks in the experienced driver group than in the novice driver group. L11, to which the consistency principle was applied, also received higher marks in the experienced driver group than in the novice driver group, although it was not among the five layouts that received high marks in the novice or experienced driver groups (L1, L2, L3, L4, and L9). These findings suggest that the compatibility principle may be more significant for novice drivers, whereas the consistency principle may be more significant for experienced drivers. Indeed, 5 of the 10 respondents in the experienced driver group stated that it would be desirable to swap the positions of the D and R buttons (i.e., to change the order to P-R-N-D by applying the consistency principle instead of the compatibility principle) to improve L2. In addition, in the case of L4, 6 of the 10 respondents in the experienced driver group stated that it was necessary to change the order of the shift buttons. In contrast, 2 of the 11 respondents in the novice driver group stated that it would be desirable to swap the positions of the D and R buttons (i.e., to change the order to P-D-N-R by applying the compatibility principle instead of the consistency principle) to improve L9.
The aforementioned results indicate that the ergonomic principle that was considered important when designing shift button layouts can vary depending on the level of driving experience. For the novice driver group, in Research activity 2-2, L12 showed higher mean scores than L11; L3 showed higher mean scores than L9; and L8 showed higher mean scores than L7 (Table 8). These findings suggest that the compatibility, functional similarity, and stereotype principles should be considered when designing shift button layouts for novice drivers. In particular, the importance of the compatibility principle for the novice driver group confirmed in Research activity 2-2 is consistent with the result of Research activity 2-1, wherein the compatibility principle was more significant than the consistency principle for novice drivers. In general, it is known that the user learning speed and satisfaction are improved, and the reaction time and error rate are reduced in a system to which the compatibility principle is applied [18]. Given that novice drivers are inexperienced drivers who generally have inadequate driving skills and difficulties perceiving traffic conditions [30], it is important to apply the compatibility principle when designing shift button layouts for them.
In the experienced driver group, L1 had higher mean scores than L2; L3 had higher mean scores than L4; and L9 had higher mean scores than L10 (Table 9). Here, L1, L3, and L9, which received high marks, were the layouts in which the consistency principle was applied. These results are in accordance with the existing literature, which states that it is easier for users to learn and process information in systems designed to be similar or identical to existing systems [19]. According to a previous study [31], unlike a new driver, an experienced driver may have even more difficulty adjusting to a vehicle because the previously acquired habits may interfere with the new skills required, which becomes particularly critical in emergency situations in which quick and accurate responses are needed. Thus, it is apparently important to apply the consistency principle when designing shift button layouts for experienced drivers.
The aforementioned results suggest that for novice drivers, among the four layouts (L1, L2, L3, and L4) that received high marks in Research activity 2-1, L4––to which the compatibility, functional similarity, and stereotype principles that were found to be important in Research activity 2-2 were applied altogether––can be recommended as the most ergonomic layout. For experienced drivers, L1, L3, and L9 can be recommended as the most ergonomic layouts. These layouts not only received high marks in Research activity 2-1, but also incorporated the consistency principle that was found to be important in Research activity 2-2.
In summary, as an answer to Research question 1 (What constitutes an ergonomic electronic shift button layout?), it can be concluded that L3 is the best layout in terms of ergonomics, regardless of driving experience. Given the finding that the layout evaluations varied depending on the level of driving experience, it would be more desirable to consider the level of driving experience when designing layouts. Regarding Research question 2 (How does the ergonomic performance of electronic shift button layouts vary depending on driving experience?), L4 can be recommended as the most ergonomic layout for novice drivers, and L1, L3, and L9 can be recommended for experienced drivers.
The current study has both practical and theoretical implications. First, it may help not only prevent driver confusion and erroneous operation, but also improve driving safety and convenience by providing ergonomic design guidelines for shift button layouts. In addition, it is expected to contribute to the international standardization of electronic shift button layouts. Second, the study results could be practically applied not only to automotive transmission systems, but also to the ergonomic design of control devices with electronic buttons for the operation of machines/tools currently used throughout the industry. They could also be applied to design control devices for future industrial robots and unmanned vehicles. Third, the study results showed that some shift button layouts designed to be the same as or similar to the existing commercialized ones were not found to be superior to others. In a similar vein, the study findings revealed that the sequence of P-R-N-D, which has been dominantly adopted in the conventional lever-type gear shifter, would not necessarily lead to the most excellent sequence in the button-type gear shifter as well, thereby suggesting that some important design characteristics could be changed depending on the type or operation method of the gear shifter. Therefore, the current study indicated that in designing an electronic gear shifter or, more generally, a control device, it would be desirable to comparatively evaluate different alternatives, including novel unexplored designs rather than blindly applying the consistency principle to make a correct design decision. Finally, this study revealed that the compatibility, functional similarity, and stereotype principles were more significant for novice drivers, whereas the consistency principle was more significant for experienced drivers when designing button layouts. In other words, this study empirically demonstrated that the effectiveness and importance/priority of a series of design principles related to control layouts described in the existing ergonomic literature and textbooks can vary depending on the user characteristics, such as the degree of skillfulness, which may help improve the understanding of the design principles further.
A few limitations of this study are described below, along with other topics for future research. First, the 12 design alternatives in this study were derived by changing only the layout of the 4 gear shift buttons. Given that there are various design factors other than the button layout, such as the size, color, materials, separation, slope, and visual/tactile feedback of the shift buttons [32], future studies will involve ergonomic design guidelines for each of these factors. Second, although the number of survey respondents in the current study was adequate to allow statistical testing of the mean difference without much concern for statistical power, future studies with a larger sample size would be needed for more accurate study results. Besides such statistical testing of the mean difference, some other mathematical approaches could be applied to the collected data to achieve different meaningful study findings. One possible approach would be using a multiple regression analysis with an ergonomic performance (evaluation score) of a shift button layout as the dependent variable and its constituent design characteristics as the independent variables (predictors). For example, a regression model fitted with predictors indicating whether an ergonomic layout design principle was applied or not could be utilized to predict an ergonomic performance of a novel unexplored shift button layout, and could be used to reveal the relative importance of the four ergonomic layout design principles considered in this study. Third, considering that there is no restriction on the mounting position of the SBW system with electronic shift buttons [6], future studies may consider different in-vehicle positions of the gear shifter (e.g., on the steering wheel, center fascia, or center console) to elucidate the interaction effects between the mounting position and layout. Fourth, while most of the survey respondents had prior experience using electronic shift buttons, each respondent had used only a subset of the 6 layout designs to which the consistency principle was applied (i.e., the existing commercialized designs) out of the total of 12 designs considered in the current study—no one experienced the other 6 novel designs generated in this study. It would be cognitively difficult for the survey respondents to evaluate each shift button layout design without real-use experience and, therefore, solely based on their mental simulation—they may need prior actual experience of using each design alternative in the real or realistic contexts for adequate/accurate evaluation. Thus, prior to data collection from the survey respondents, future research efforts would need to involve a session of providing them with the relevant actual or simulated experience for each design alternative by using a real car/product or realistic simulator/prototype. Finally, future empirical studies are needed to verify the survey results by employing various objective physiological/behavioral measures through a laboratory (simulator) or field (on-road) experiment. In conducting such experimental studies, it would be desirable to focus on a selective/reduced subset of the 12 designs, especially those that received high marks in this study (e.g., L1, L2, L3, L4, L6, and L9).

5. Conclusions

Regarding Research question 1 (What constitutes an ergonomic electronic shift button layout?):
  • L1, L2, L3, L4, L6, and L9 were identified as excellent shift button layouts that received high marks from all respondents (regardless of driving experience);
  • the ergonomic layout design principles of consistency, functional similarity, and stereotype were important in designing shift button layouts;
  • among the six excellent layouts, L3, to which these three design principles were applied together, can be recommended as the best (most ergonomic) layout design.
Related to Research question 2 (How does the ergonomic performance of electronic shift button layouts vary depending on driving experience?):
(1)
for novice drivers:
  • L1, L2, L3, and L4 were identified as excellent shift button layouts;
  • the principles of compatibility, functional similarity, and stereotype were important;
  • L4 satisfied all of these three principles and can be recommended as the best design.
(2)
for experienced drivers:
  • L1, L3, and L9 were identified as excellent shift button layouts;
  • only the consistency principle was important;
  • all three layouts (L1, L3, and L9) can be recommended as the best designs.

Author Contributions

Conceptualization, G.C.; Methodology, G.C., H.K. and D.B.; Formal Analysis, G.C., Y.J. and D.B.; Investigation, G.C., H.K., M.S. and D.B.; Resources, D.B.; Data Curation, G.C., H.K. and Y.J.; Writing—original draft, G.C., H.K. and M.S.; Writing—review and editing, M.S. and D.B.; Visualization, H.K.; Project Administration, D.B.; Funding Acquisition, D.B. All authors have read and agreed to the published version of the manuscript.

Funding

This work was supported by the National Research Foundation of Korea (NRF) grant funded by the Korea government (MSIT) (No. 2022R1F1A1074737).

Institutional Review Board Statement

The study was conducted in accordance with the Declaration of Helsinki.

Informed Consent Statement

Written informed consent has been obtained from the participants to publish this paper.

Data Availability Statement

Not applicable.

Conflicts of Interest

The authors declare no conflict of interest.

References

  1. Sun, Z.; Hebbale, K. Challenges and opportunities in automotive transmission control. In Proceedings of the 2005, American Control Conference, Portland, OR, USA, 8–10 June 2005; pp. 3284–3289. [Google Scholar]
  2. Sadlier, J. Automatic Transmissions—Manual Control Sequence; SAE International Journal: Warrendale, PA, USA, 2017. [Google Scholar]
  3. 49 CFR 571.102. Available online: https://www.ecfr.gov/current/title-49/subtitle-B/chapter-V/part-571/subpart-B/section-571.102#p-571.102(S3.) (accessed on 10 September 2022).
  4. Nakade, Y.; Kamada, A.; Ueno, K.; Kume, M.; Sakaguchi, K. Shift-by-wire system for Lexus RWD vehicles. SAE Int. J. Engines 2017, 10, 689–694. [Google Scholar] [CrossRef]
  5. Han-Wook, B.; Youngkwang, K.; Younghoon, C.; Byungkan, K.; Kwangsoo, N.; Taekjae, L.; Ho, H.H. Development of Shift-by-Wire System for Passenger Car. Proc. Korean Soc. Auto. Eng. 2005, 15, 41–46. [Google Scholar]
  6. Eunsik, K. Button Type Electronic Shift Lever System. KR Patent 10-1704268, 1 February 2017. [Google Scholar]
  7. Kobiki, Y.; Inoue, Y.; Sekiguchi, S.; Itoh, T.; Kamio, S. Toyota’s New Shift-by-Wire System for Hybrid Vehicles (No. 2004-01-1112); SAE Technical Paper; SAE: Warrendale, PA, USA, 2004. [Google Scholar]
  8. Bladfält, S.L.; Grane, C.; Friström, J. Field study investigating gear shifter usability in car rental scenario. Rep. Stud. Health Sci. 2016, 204–208. [Google Scholar]
  9. Qiu, H.; Fang, W.; Guo, B. A layout generation algorithm for unequal-area display and control console considering ergonomics. IEEE Access 2020, 8, 29912–29921. [Google Scholar] [CrossRef]
  10. Tao, D.; Yuan, J.; Liu, S.; Qu, X. Effects of button design characteristics on performance and perceptions of touchscreen use. Int. J. Ind. Ergonom. 2018, 64, 59–68. [Google Scholar] [CrossRef]
  11. Isidore, C. Ford Recalls SUVs Because Drivers Are Accidentally Turning Them off. Money.CNN.com. Available online: https://money.cnn.com/2015/01/06/autos/ford-push-button-ignition-recall/index.html (accessed on 28 February 2022).
  12. Dapena, P.V. Why Car Gear Shifters Are so Confusing. Money.CNN.com. Available online: https://money.cnn.com/2016/06/21/autos/anton-yelchin-gear-selectors/index.html (accessed on 28 February 2022).
  13. Bhise, V.D. Ergonomics in the Automotive Design Process; CRC Press: Boca Raton, FL, USA, 2011. [Google Scholar]
  14. Alfonsi, R.; Ammari, A.; Usami, D.S. Lack of Driving Experience, European Road Safety Decision Support System, Developed by the H2020 Project SafetyCube. Available online: www.roadsafety-dss.eu (accessed on 28 February 2002).
  15. Regan, M.A.; Lee, J.D.; Young, K. Driver Distraction: Theory, Effects, and Mitigation; CRC Press: Boca Raton, FL, USA, 2008. [Google Scholar]
  16. Lee, S.C.; Ji, Y.G. Complexity of in-vehicle controllers and their effect on task performance. Int. J. Hum. Comput. Interact. 2019, 35, 65–74. [Google Scholar] [CrossRef]
  17. Korean National Police Agency. The Road Traffic Act Section 2 (27). Available online: https://www.law.go.kr/%EB%B2%95%EB%A0%B9/%EB%8F%84%EB%A1%9C%EA%B5%90%ED%86%B5%EB%B2%95 (accessed on 10 September 2022).
  18. Sanders, M.S.; McCormick, E.J. Human Factors in Engineering and Design; McGraw-Hill Education: New York, NY, USA, 1998. [Google Scholar]
  19. Wickens, C.D.; Gordon, S.E.; Liu, Y.; Lee, J. An Introduction to Human Factors Engineering, Volume 2; Pearson Prentice Hall: Upper Saddle River, NJ, USA, 2004. [Google Scholar]
  20. Karwowski, W. (Ed.) International Encyclopedia of Ergonomics and Human Factors, 3 Volume Set; CRC Press: Boca Raton, FL, USA, 2000. [Google Scholar]
  21. Bonney, M.C.; Williams, R.W. CAPABLE. A computer program to layout controls and panels. Ergonomics 1977, 20, 297–316. [Google Scholar] [CrossRef]
  22. Alppay, C.; Bayazit, N. An ergonomics-based design research method for the arrangement of helicopter flight instrument panels. Appl. Ergon. 2015, 51, 85–101. [Google Scholar] [CrossRef] [PubMed]
  23. Tsang, S.N.; Ho, J.K.; Chan, A.H. Interface design and display-control compatibility. Meas. Control. 2015, 48, 81–86. [Google Scholar] [CrossRef]
  24. Likert, R. A technique for the measurement of attitudes. Arch. Psychol. 1932, 22, 5–55. [Google Scholar]
  25. Joshi, A.; Kale, S.; Chandel, S.; Pal, D.K. Likert scale: Explored and explained. Br. J. Appl. Sci. Technol. 2015, 7, 396–403. [Google Scholar] [CrossRef]
  26. Field, M.; Golubitsky, M. Symmetry in Chaos: A Search for Pattern in Mathematics, Art, and Nature; Society for Industrial and Applied Mathematics: Philadelphia, PA, USA, 2009. [Google Scholar]
  27. Girden, E.R. ANOVA: Repeated Measures (No. 84); Sage: New York, NY, USA, 1992. [Google Scholar]
  28. Hendrick, H.W. Ergonomic design of controls, displays, and workspace arrangements to reduce human error. In Proceedings Kongres Nasional XI dan Seminar Ilmiah XIII Ikatan Ahli Ilmu Faal Indonesia dan International Seminar on Ergonomics and Sports Physiology; SEMAC: Juarez, Mexico, 2002; pp. 14–17. [Google Scholar]
  29. Shinar, D.; Acton, M.B. Control-display relationships on the four-burner range: Population stereotypes versus standards. Hum. Factors. 1978, 20, 13–17. [Google Scholar] [CrossRef]
  30. Yang, H.; Wu, Z. Effect of novice driver’s car-following characteristic on roadway segment capacity. Adv. Mech. Eng. 2017, 9, 1687814017711853. [Google Scholar] [CrossRef]
  31. Perel, M. Vehicle familiarity and safety (No. DOT HS-S06 509); National Highway Traffic Safety Administration: Washington, DC, USA, 1983. [Google Scholar]
  32. Ishino, T.; Takai, S. Development of a Push Button-Type Electrically Controlled Gear Selector (No. 2015-01-1634); SAE Technical Paper; SAE: Warrendale, PA, USA, 2015. [Google Scholar]
Figure 1. Mean and standard deviation of each subjective rating measure for each layout: (a) accuracy, (b) convenience, (c) rapidity, (d) learnability, (e) intuitiveness, (f) safety, and (g) preference. * p < 0.05, ** p < 0.01, *** p < 0.001.
Applsci 12 09222 g001
Figure 2. Mean and standard deviation of each subjective rating measure for each layout in the novice driver group: (a) accuracy, (b) convenience, (c) rapidity, (d) learnability, (e) intuitiveness, (f) safety, and (g) preference. * p < 0.05, ** p < 0.01, *** p < 0.001.
Applsci 12 09222 g002
Figure 3. Mean and standard deviation of each subjective rating measure for each layout in the experienced driver group: (a) accuracy, (b) convenience, (c) rapidity, (d) learnability, (e) intuitiveness, (f) safety, and (g) preference. * p < 0.05, ** p < 0.01, *** p < 0.001.
Applsci 12 09222 g003
Table 1. Different types of electronic shift button layouts according to car manufacturer/model.
Car
Manufacturer
Illustrated Example and Corresponding Car Model
HYUNDAI Applsci 12 09222 i001IONIQ Electric Applsci 12 09222 i002KONA Electric, NEXO Applsci 12 09222 i003PALISADE, TUCSON,
SONATA, GRANDEUR, etc. *
ASTON MARTIN Applsci 12 09222 i004VANTAGE Applsci 12 09222 i005DB11, DBX, VANQUISH, RAPIDE, DBS, DB9
MCLAREN Applsci 12 09222 i006SPEEDTAIL Applsci 12 09222 i007570S, 720S, 765LT, GT, SENNA, etc. **
CHEVROLET Applsci 12 09222 i008BOLT EV, BOLT EUV Applsci 12 09222 i009TAHOE,
SUBURBAN
GMC Applsci 12 09222 i010TERRAIN,
ACCADIA
Applsci 12 09222 i011YOKON, YOKON XL, YOKON
DENALI
LINCOLN Applsci 12 09222 i012MKZ, MKX, MKC,
NAUTILUS (~2020)
Applsci 12 09222 i013NAVIGATOR, AVIATOR, CORSAIR,
NAUTILUS (2021~)
HONDA Applsci 12 09222 i014ACCORD,
ODYSSEY, ACURA-RLX, etc. ***
FIAT Applsci 12 09222 i015500
RENAULT Applsci 12 09222 i016TWIZY
etc. *: SONATA Hybrid, GRANDEUR Hybrid, TUCSON Hybrid, SANTAFE Hybrid; etc. **: 650S, 675S, 600LT; etc. ***: CR-V Hybrid, Pilot, ACURA-MDX, TLX, NSX.
Table 2. Respondent characteristics.
GroupExperience Using Electronic Shift ButtonsNDriving Experience (Years)
MeanSDRange
Novice driver
(≤2 years)
No60.990.430.50–1.67
Yes55.960.510.42–2
Total111.050.480.42–2
Experienced
driver
(>2 years)
No56.581.264.75–8
Yes55.580.514.67–6.08
Total105.961.154.67–8
Table 3. Twelve design alternatives and corresponding ergonomic principles.
LayoutPrinciple LayoutPrincipleErgonomic Principles
L1 Applsci 12 09222 i017


L2 Applsci 12 09222 i018


Consistency:
Design the button layout to be the same as or similar to currently commercialized button layouts

Functional similarity:
Position the P button close to the N button associated with the stop function and away from the D and R buttons associated with the driving function

Compatibility:
Relative to the N button, position the D button in front and the R button behind

Stereotype:
Position the D and R buttons that determine the direction of longitudinal vehicle control in the longitudinal direction
L3 Applsci 12 09222 i019


L4 Applsci 12 09222 i020


L5 Applsci 12 09222 i021


L6 Applsci 12 09222 i022


L7 Applsci 12 09222 i023


L8 Applsci 12 09222 i024


L9 Applsci 12 09222 i025


L10 Applsci 12 09222 i026


L11 Applsci 12 09222 i027


L12 Applsci 12 09222 i028


Table 4. Pairs of layouts compared to study the effectiveness of each ergonomic principle.
PrincipleCompatibilityFunctional SimilarityStereotype
AppliedUnappliedAppliedUnappliedAppliedUnapplied
Pair of layouts comparedL2L1L3L1L6L5
L4L3L4L2L8L7
L10L9L3L9L9L11
L12L11L4L10L10L12
Table 5. Seven subjective rating measures and corresponding questions.
MeasureQuestion
AccuracyThis layout will help me shift gears accurately without error.
ConvenienceThis layout will help me shift gears conveniently in terms of gaze behavior or manipulation.
RapidityThis layout will help me shift gears quickly.
LearnabilityThis layout can be adopted easily and used without much effort or learning.
IntuitivenessThe arrangement and order of buttons in this layout meet my expectations.
SafetyThis layout will help me drive safely.
PreferenceI like this layout (I’m willing to use/buy it).
Table 6. Mean differences between layouts to which ergonomic principles were applied and layouts to which they were not applied.
PrinciplePair of Layouts
Compared
AccuracyConvenienceRapidityLearnabilityIntuitivenessSafetyPreference
CompatibilityL2-L1–0.29–0.38–0.10–1.10–0.38–0.380.05
L4-L3–0.57–0.71–0.24–0.90–0.43–0.33–0.38
L10-L91.33 **1.24 **0.90 *1.90 **1.90 **1.43 **1.71 **
L12-L110.190.520.000.000.570.190.43
Functional
similarity
L3-L10.380.430.330.140.140.290.10
L4-L20.100.100.190.330.100.33–0.33
L3-L90.670.760.86 *0.240.240.810.48
L4-L101.43 **1.29 *1.52 ***1.24 **1.71 ***1.90 ***1.81 ***
StereotypeL6-L50.901.000.671.05 *1.43 *0.90 *0.81
L8-L70.670.86 *0.430.90 *1.52 **0.811.00 *
L9-L111.24 **1.86 ***1.101.86 ***2.10 ***1.00 *1.76 ***
L10-L12–0.290.100.19–0.05–0.38–0.62–0.38
* p < 0.05, ** p < 0.01, *** p < 0.001.
Table 7. Mean differences of seven dependent measures between the novice and experienced driver groups for each layout (Meannovice driver − Meanexperienced driver).
AccuracyConvenienceRapidityLearnabilityIntuitivenessSafetyPreference
L1–0.19–0.30–0.30–0.42–0.95–0.28–0.45
L21.75 *2.03 **1.81 *2.45 **2.71 ***2.62 ***2.88 ***
L30.730.140.15–0.150.270.840.11
L41.74 **1.45 *1.22 *1.182.13 **1.92 **2.05 **
L5–0.90–0.440.01–0.400.080.050.06
L60.060.140.710.070.330.060.27
L70.040.300.55–0.61–0.39–0.450.35
L81.50 *0.980.791.311.561.481.31
L9–1.50–1.321.87 *1.75 *2.28 **2.24 **2.14 **
L10–0.04–0.25–0.160.921.530.190.70
L111.76 *1.81 **2.05 *1.66 *2.08 **2.62 ***1.68 *
L12–0.45–0.05–0.150.050.350.040.09
* p < 0.05, ** p < 0.01, *** p < 0.001.
Table 8. Evaluation results for novice driver group: mean differences between layouts to which ergonomic principles were applied and layouts to which they were not applied.
PrinciplePair of Layouts
Compared
AccuracyConvenienceRapidityLearnabilityIntuitivenessSafetyPreference
CompatibilityL2-L10.640.730.910.271.361.001.64
L4-L3–0.09–0.090.27–0.270.450.180.55
L10-L9–0.64–0.73–0.09–0.64–0.09–0.27–0.36
L12-L110.821.36 *0.910.821.73 *1.45 *1.27
Functional similarityL3-L10.820.640.550.270.730.820.36
L4-L20.09–0.18–0.09–0.27–0.180.00–0.73
L3-L91.73 *1.451.82 **1.00 *1.45 *2.27 ***1.55 *
L4-L102.272.092.181.362.002.732.45
StereotypeL6-L51.361.271.001.271.550.910.91
L8-L71.361.180.551.82 **2.45 **1.73 **1.45
L9-L111.362.091.181.822.001.181.55
L10-L12–0.090.000.180.360.18–0.55–0.09
* p < 0.05, ** p < 0.01, *** p < 0.001.
Table 9. Evaluation results for experienced driver group: mean differences between layouts to which ergonomic principles were applied and layouts to which they were not applied.
PrinciplePair of Layouts
Compared
AccuracyConvenienceRapidityLearnabilityIntuitivenessSafetyPreference
CompatibilityL2-L11.30 *1.60 *–1.202.60 **2.30 **1.90 *1.70 *
L4-L3–1.10–1.40–0.80–1.60–1.400.901.40 *
L10-L9–2.10–1.801.80 *3.30 ***3.90 ***2.70 ***3.20 ***
L12-L11–0.50–0.40–1.00–0.90–0.70–1.20–0.50
Functional similarityL3-L1–0.100.200.100.00–0.50–0.30–0.20
L4-L20.100.400.501.000.400.700.10
L3-L9–0.500.00–0.20–0.60–1.10–0.80–0.70
L4-L100.500.400.801.101.401.001.10
StereotypeL6-L50.400.700.300.801.300.900.70
L8-L7–0.100.500.30–0.100.50–0.200.50
L9-L111.101.601.001.902.200.802.00
L10-L12–0.500.200.20–0.50–1.00–0.70–0.70
* p < 0.05, ** p < 0.01, *** p < 0.001.
Publisher’s Note: MDPI stays neutral with regard to jurisdictional claims in published maps and institutional affiliations.

