1. Introduction
It is to the consumer’s advantage to choose clothes and textiles which appeal to the individual’s sense of touch. Montagu [
1] emphasizes the importance of tactile interaction, touching on all facets of human development. Also, in adulthood, it is the many aspects of touch that determine people’s preferences. Therefore, tactile properties are considered to be the most important [
2,
3]. Nowadays, textiles’ variations and modifications are versatile. Along with technological developments, the promotion of natural resources and sustainability questions also affect the choice and production of materials and products. This can be confusing for the everyday consumer. Marketing messages and branding activities also add to the complexity of the topic, as claims like “soft” or “comfortable” are not always easy to quantify and prove. This topic is relevant for both private and professional users. Two approaches need to be distinguished here: the voluntary choice of textile material (the buyer’s decision); and the use of textiles for special work uniforms, which most often have other, protective properties in the first place. However, in order to make the duty of special task workers as ergonomic as possible, hand-feel assessment is an important feature beyond the textile material characteristics of personal protection.
Suppliers of workwear, personal protective clothing (PPE), uniforms, and other special-purpose clothing are sometimes confused by the wide range of fabric offers and suffer from a lack of knowledge and the absence of universally recognized standards. The conformity of clothing is achieved, not only by the appropriate quality of patterns but also by the ability to integrate the properties of the selected textile material into them, anticipating the influence of their various characteristics in the finished product. The functionality of uniforms, special-purpose clothing, and PPE is primarily determined by the utilization properties of the textile (protection, wearability, care, visibility/camouflage, etc.), and the properties of such specific materials affect the shape and ergonomics of clothing (e.g., fit, slip, elongation, etc.). Therefore, knowledge and practical understanding of fabric parameters [
4] including geometrical/structural characteristics, and mechanical and physical properties are required to ensure clothing’s conformity. While physical and utility-related textile properties are mostly covered by standardized testing to fulfill technical specifications, physiological, comfort-related, and haptic aspects remain a subject of debate, as existing instrumental assessments still have a number of shortcomings, beginning with the cost of measuring equipment [
5]. Knowledge of the physical properties of a fabric is not always sufficient to predict its behavior in clothing. For example, fabric strength and abrasion resistance can be measured, but they do not tell how the fabric is perceived by consumers, where tactile, organoleptic, moisture management, and skin contact play important roles. Existing test methods for such parameters are mostly nonstandardized and very expensive. As for the fabric hand, the assessment is challenged by individual human subjective preferences. In addition, regional, cultural, gender-specific, climate, and functional expectations also influence the perception. Fabric hand can be evaluated by human judges, or by mechanical or electronic instruments which mimic aspects of hand action or skin perception [
6].
Reproducible assessment and documentation of the hand-feel properties of textiles have been a wide field of research in the last decades [
6,
7]. Various instrumental measurement methods were developed to mimic the hand-feel actions and the resulting information based on force, heat flux [
8,
9], and even acoustics [
10], of which the approach developed by Kawabata [
11] is the most elaborated and recognized [
12]. Many later instrumental approaches based on physical properties can be considered as simplifications of Kawabata, meaning a compromise in precision and a versatility of parameters for the sake of practicability and cost reduction. In an industrial environment, the hand-feel topic can be crucial in terms of quality consistency, claims, and product development. While consumer tests obviously cannot be performed frequently, instrumental assessment can imply high investment or purchase costs, unlikely to be afforded by a small or middle producer.
Furthermore, though instrumental methods can be used and provide a quantitative reference for the fabric hand-feel-related properties—as far as these are recognized by all parties as such—this does not mean that the resulting numbers always predict human perception. Consequently, a human reference needs to be consulted at some point.
A human reference remains essential in the development of textile surfaces due to the complexity of human perception as well as to the diversity of the textile field, where various construction and treatment parameters play different roles in influencing human sensorial perception. Fabric hand feel can be analyzed into different components, which can be attributed to defined hand actions. This can allow joint understanding and therefore a reliable scaling or ranking, at least within the compared group of fabrics [
3]. The challenge is to ensure representativeness and reproducibility, as humans have different perceptions and are not always consistent [
13].
Accepting the complexity of this topic, and the fact that up to now no single absolute quantification system is available, subjective and objective hand-feel evaluations are performed on defined fabric groups to provide a relative judgment. A panel with a limited number of experts (personnel trained in textile and material assessment) could provide a compromise between consumer tests and purely instrumental measurement. Various works have been published on training, maintaining, and monitoring expert panels. The approach has also been normed, for example by AATCC [
14] and HESC [
15]. Trained panels are offered by various institutions and can usually provide a reliable assessment of hand feel [
13]. The drawback is that maintaining such panels can be costly in terms of manpower. Also, the costs of consulting external expert panels are usually higher than instrumental measurements. A praxis-near approach is to train inside the company a semiexpert hand-feel panel from within the field to provide a fast and reliable evaluation of developments. The group deals with a limited number of fabric variations and can focus on fine-tuning within the same quality range and provide a reliable comparison to a set reference.
Regular investigations on the effects of different parameters such as fiber content, fabric construction parameters, and surface treatment on fabric hand feel are possible when focused on comparable fabric collections and a defined task. This paper presents the case of a simplified method to train an open semiexpert group that is workable in an industrial environment. The results are presented in comparison with other human, as well as with instrumental, assessments.
2. Materials and Methods
Previous studies [
6,
14,
15,
16] suggest a definition of hand feel based on the physicomechanical properties of textiles. This is in accordance with the physical sensation of the fabric—a person’s somatic senses are defined by the receptor and nervous system. There are many types of receptors in the skin: mechanoreceptors, which feel pressure; thermoreceptors, which feel the temperature; nociceptors, which feel pain. Mechanoreceptors are stimulated at the time of touch and are distributed throughout the human body, with the participation of pain receptors that inform the brain of excessive irritation (thus detecting too sharp, irritating textiles), while thermoreceptors are stimulated by changes in temperature.
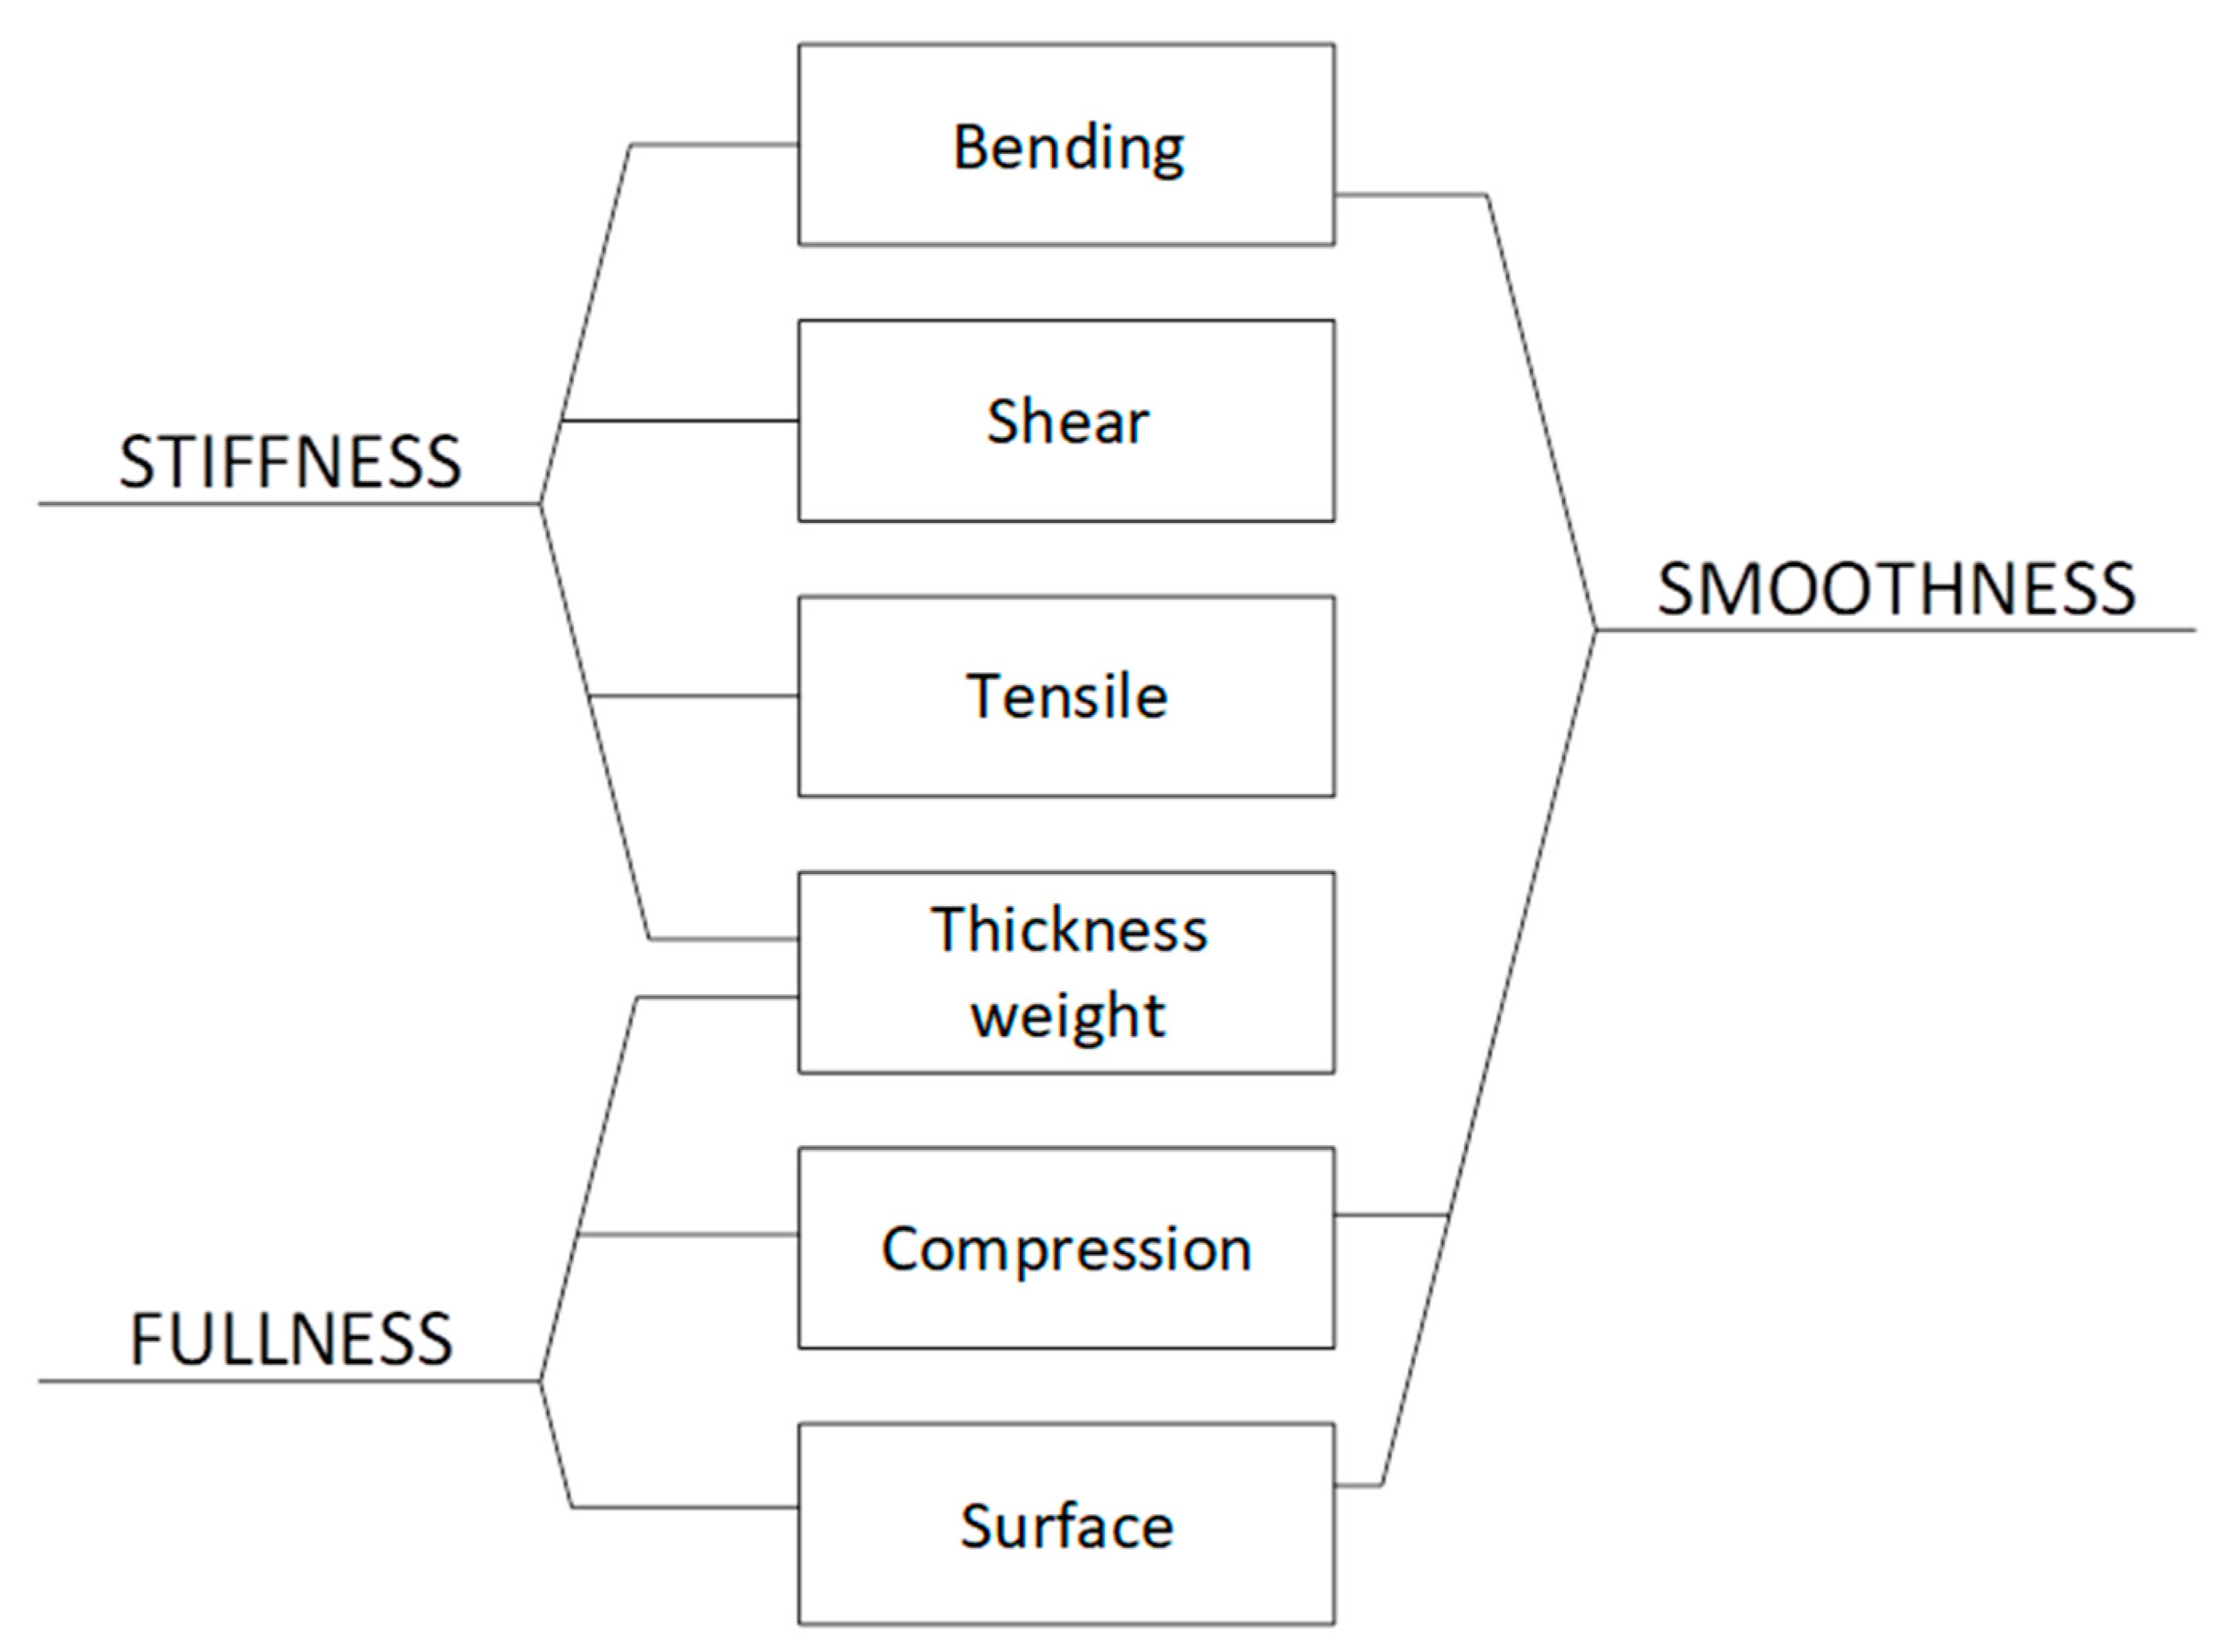
The quality and performance characteristics of fabrics are related to their low-stress mechanical, surface, and dimensional properties. The experimental errors involved in the measurement of these properties are known to be much smaller than the errors involved in a subjective assessment of fabric quality attributes, especially those made by individual judges [
16]. Hallos et.al [
17] proposed that properties are linked to known methods of measuring the various physical properties involved (see
Figure 1). El-Mogahzy et.al. [
6], on the other hand, point to the close connection between fabric hand and the comfort of the human-clothing system and define four components of hand-feel assessment.
The key elements in subjective hand evaluation may be defined as (adapted from [
2]):
The judges, particularly their expertise or semiexpertise.
The criteria of judgment, the choice of descriptors for fabric attributes (can differ from fabric to fabric).
The assessment conditions, seen or unseen, controlled temperature, and relative humidity (or simulated non-specific environment as in the shop).
The assessment technique, free or specified fabric, manipulation technique for assessment of given attributes (teaching of hand actions to the experts involved).
The method of ranking or scaling the assessment, rank order, graded standards, magnitude, and estimation (Likert’s scale range).
Analyses of results, the relative importance of individual descriptors for end-use, and concordance between descriptors.
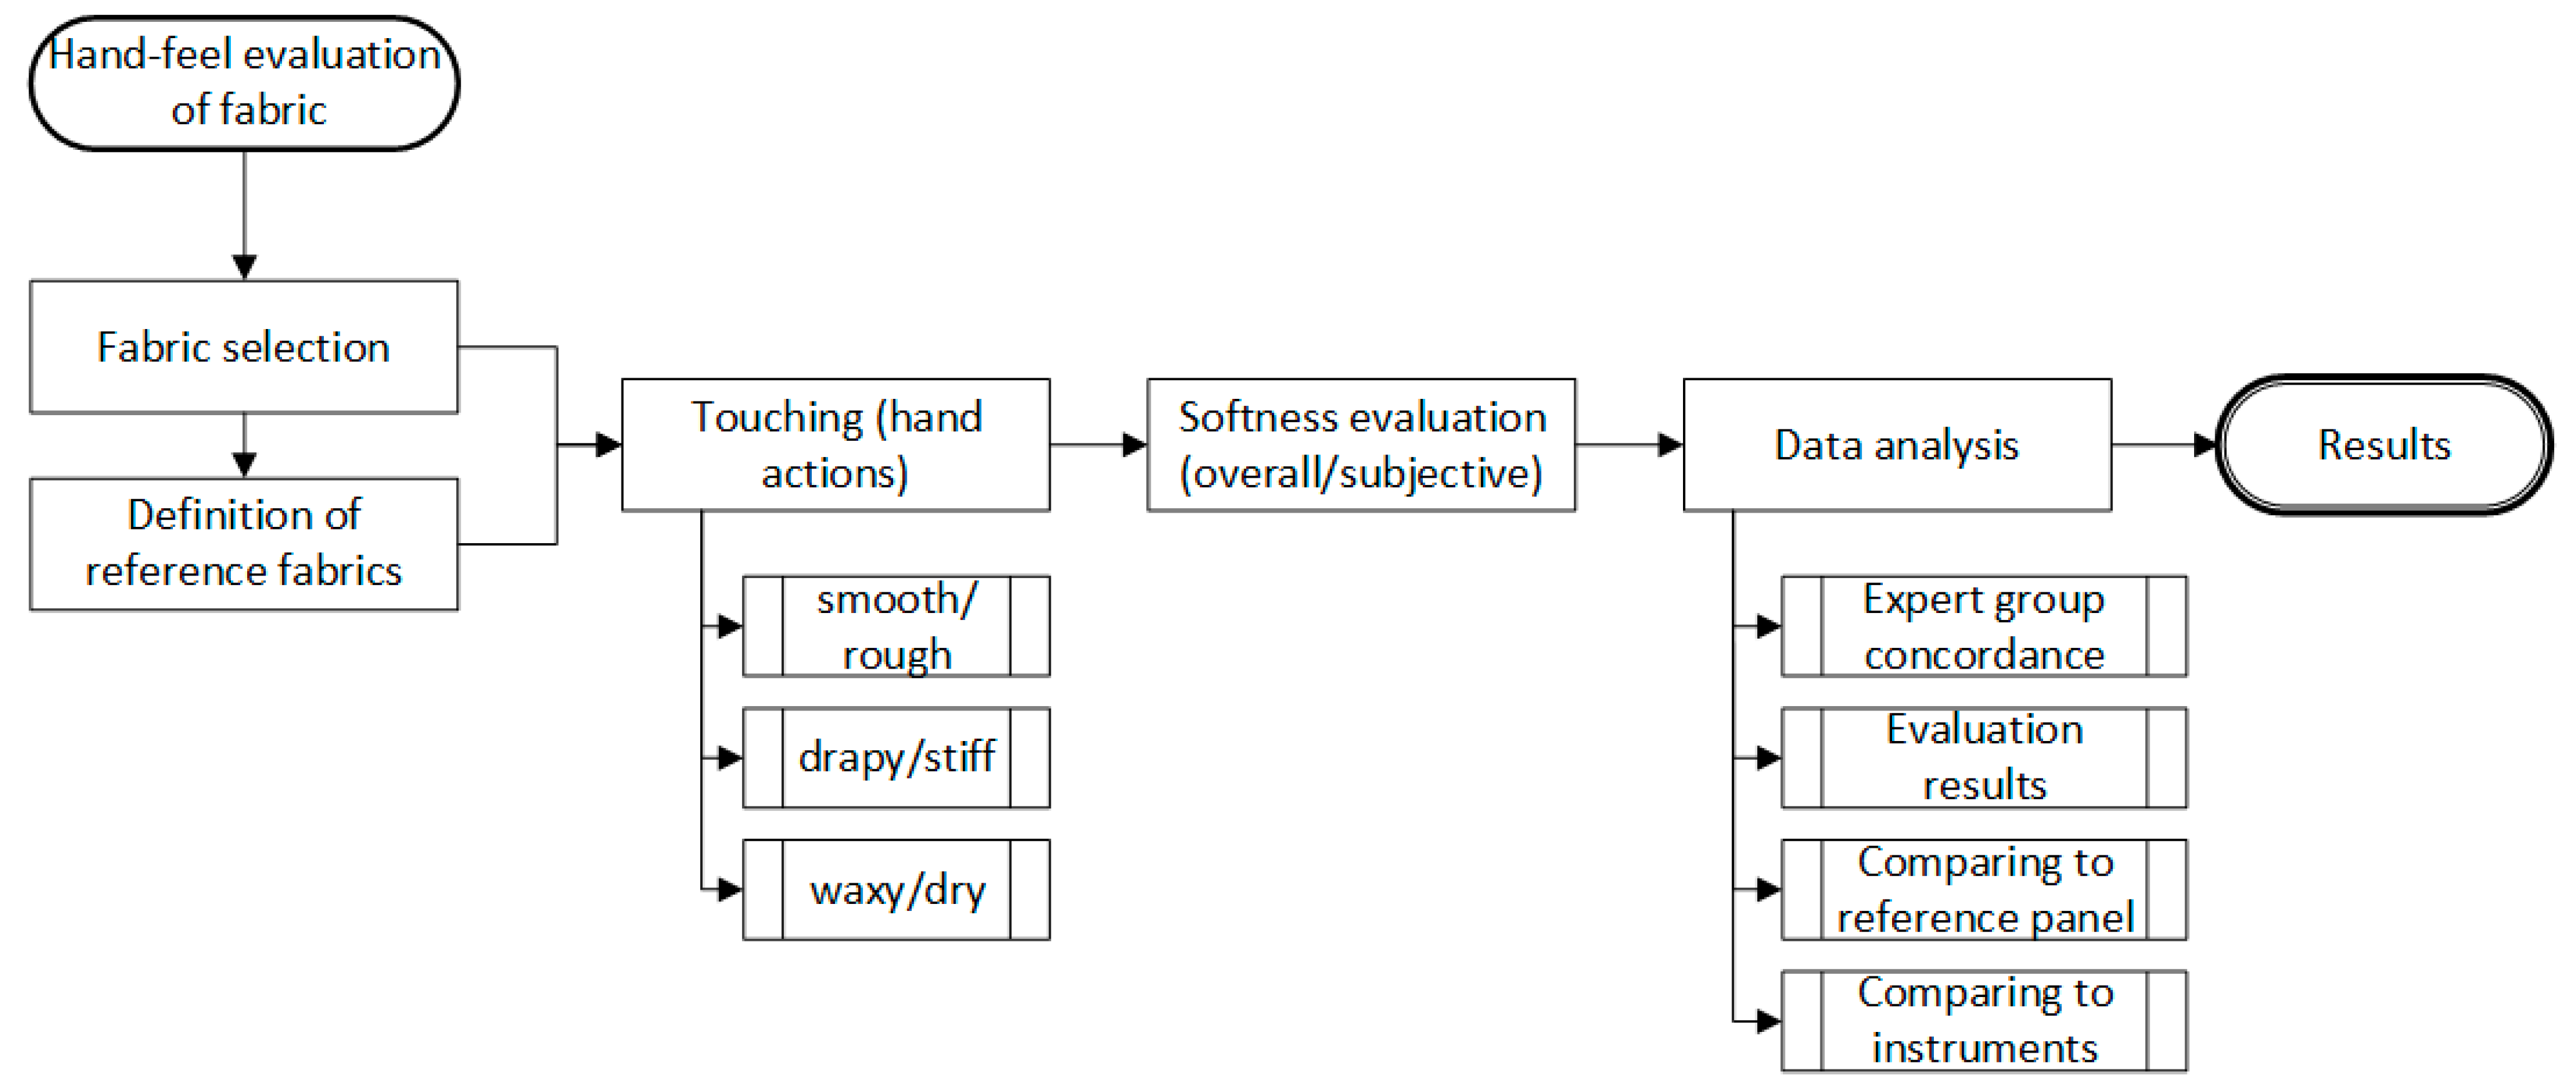
Based on the literature review and experimental experience, the design of the study is developed in several stages, where the hand feel of the selected textile set is evaluated step by step (see
Figure 2).
Fabrics are first selected, then reference fabrics are defined, and hand actions are performed. Then, experts/semiexperts are given the opportunity to perform an overall evaluation (in
Figure 2 and the text, the overall evaluation is related to a subjective evaluation of softness, namely, it refers to a personal feeling about the general properties of the fabric. In the paper, it is called overall (overall) and/or softness evaluation). Data processing during the experiment shows a close relationship between the evaluation of all selected descriptor pairs, but it is worth keeping them, since in the two-step decision-making process it is easier for experts to perform an overall evaluation, thus achieving higher concordance in expert evaluation.
In addition to the study, to confirm that consumers’ ratings are similar to those that can be assessed by a panel of experts in certain circumstances, a study was conducted during a textile exhibition, where visitors, mostly active in the textile sector (professional audience), were offered five different fabrics and asked to rate the fabrics according to felt softness.
2.1. Materials
Two commonly used fabric constructions (for description see
Table 1) were selected for experiments (all fabrics were provided by Lenzing AG, Lenzing, Austria):
Lightweight knits
Lightweight wovens
Most of the fabrics were based on Nm 50 (Ne 30) yarns. The fabrics received only the type-typical washing resp. desizing and washing, and the cotton fabrics bleaching. No softeners or other finishing agents were used, except for the fabrics R2k, K6, and R2w, which were chosen to represent the “softest” hand. Commercial fabrics with a surface soft finish based on Nm 100 (Ne 60) yarn were chosen. The wood-based fibers have a titer of 1.3 dtex in the standard, and ~1dtex in the “micro” version.
In each fabric group, two references were chosen to represent the extremes. Definition of reference fabrics: for each fabric construction group, and based on average group preference, fabrics of two extremes, chosen by the group as “softest” and “least soft,” were selected as reference fabrics R1 and R2 and obtain positions 2 and 8 on a numeric scale between 1 and 10 (from worst to best) for woven and a scale between 1 and 15 (from worst to best) for the knitted (as more differences among the fabrics were obvious, this also helped to reduce the variation). During the training, it was recognized that woven fabrics are more difficult to differentiate than knitted because of the structure of the materials. Therefore, finer tuning within the knitted fabrics could be reached by enlarging the scale to 15 instead of 10 degrees.
2.2. Experimental
2.2.1. Hand-Feel Panel
The hand-feel panel was held according to the instruction AATCC 5:2006, especially regarding the instructions on hand washing, drying, and the avoidance of creams. The evaluations were carried out at ambient room temperature and humidity. Twelve participants (10 female and 2 male) were involved, who performed different activities at Lenzing AG. The assessments were performed without blindfolding since all materials were white and with similar fabric construction.
Training to set up evaluation parameters was made for each fabric category. The hand-feel panel working modus was defined as follows:
Definition of reference fabrics: for each fabric construction group, and based on average group preference, fabrics of two extremes, chosen by the group as “softest” and “least soft” were selected as reference fabrics R1 and R2 and obtained positions 2 and 8 on a numeric scale between 1 and 10. Further fabrics are to be rated relative to R1 and R2.
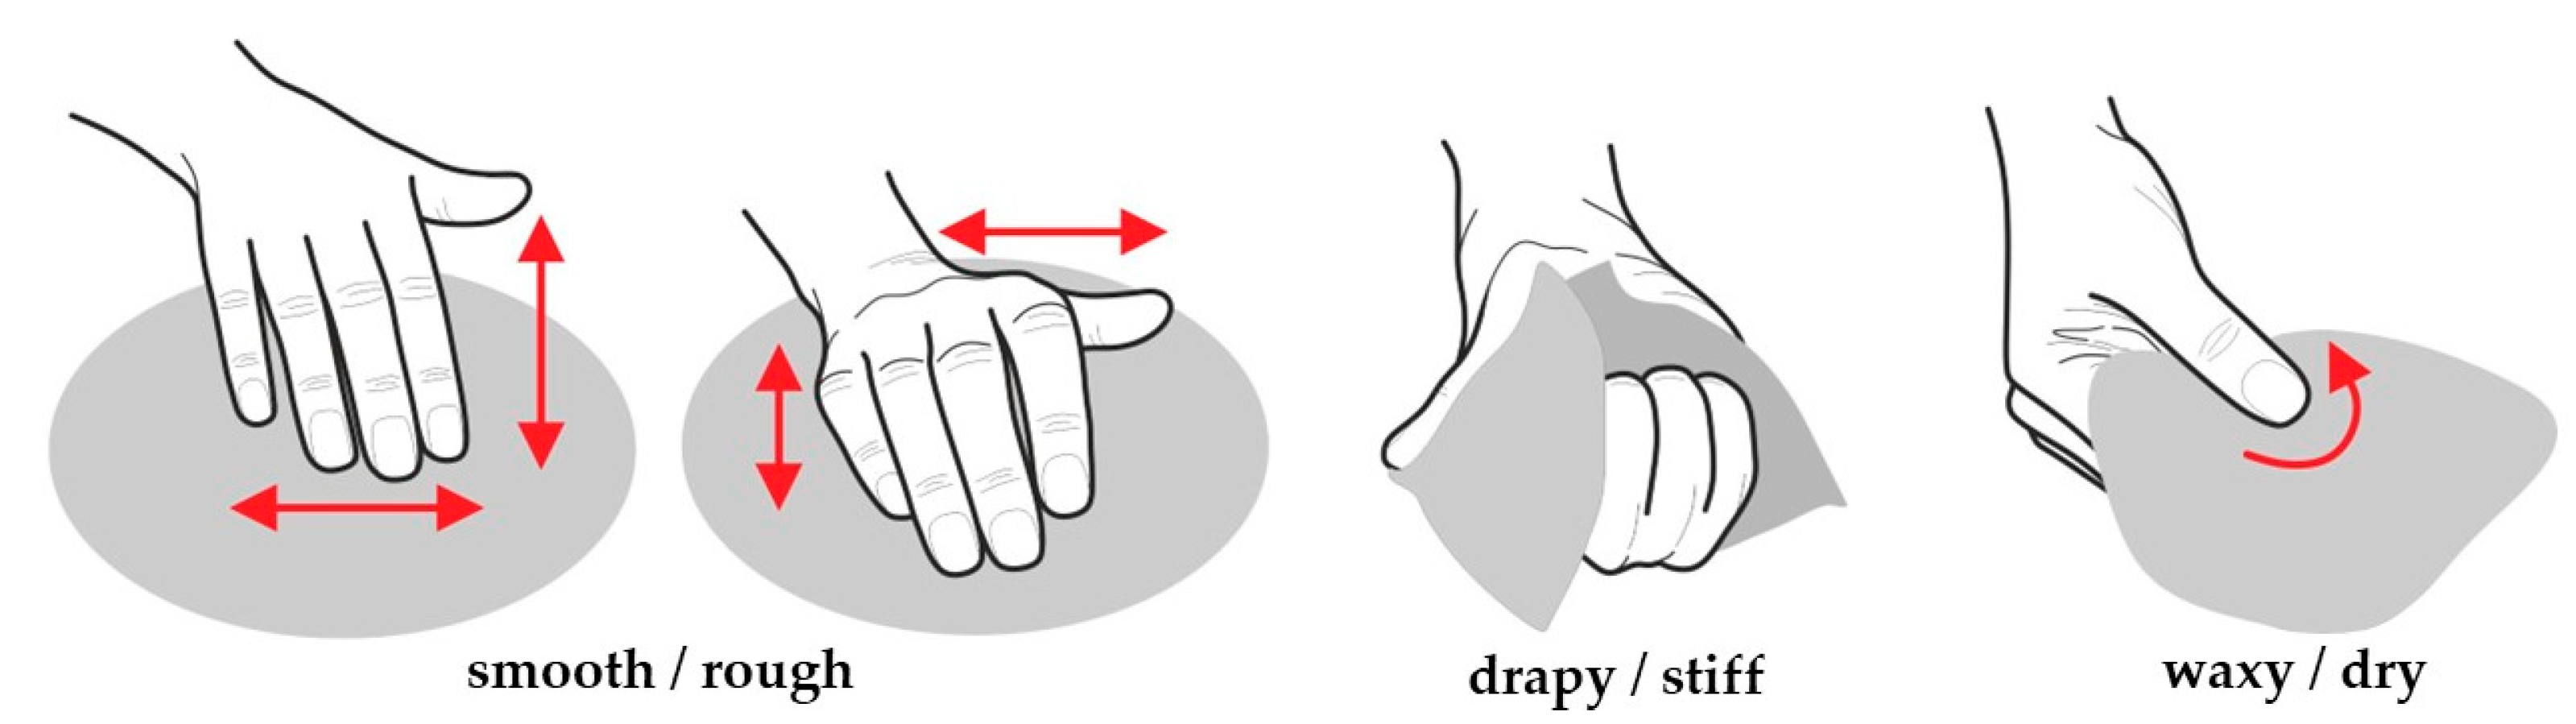
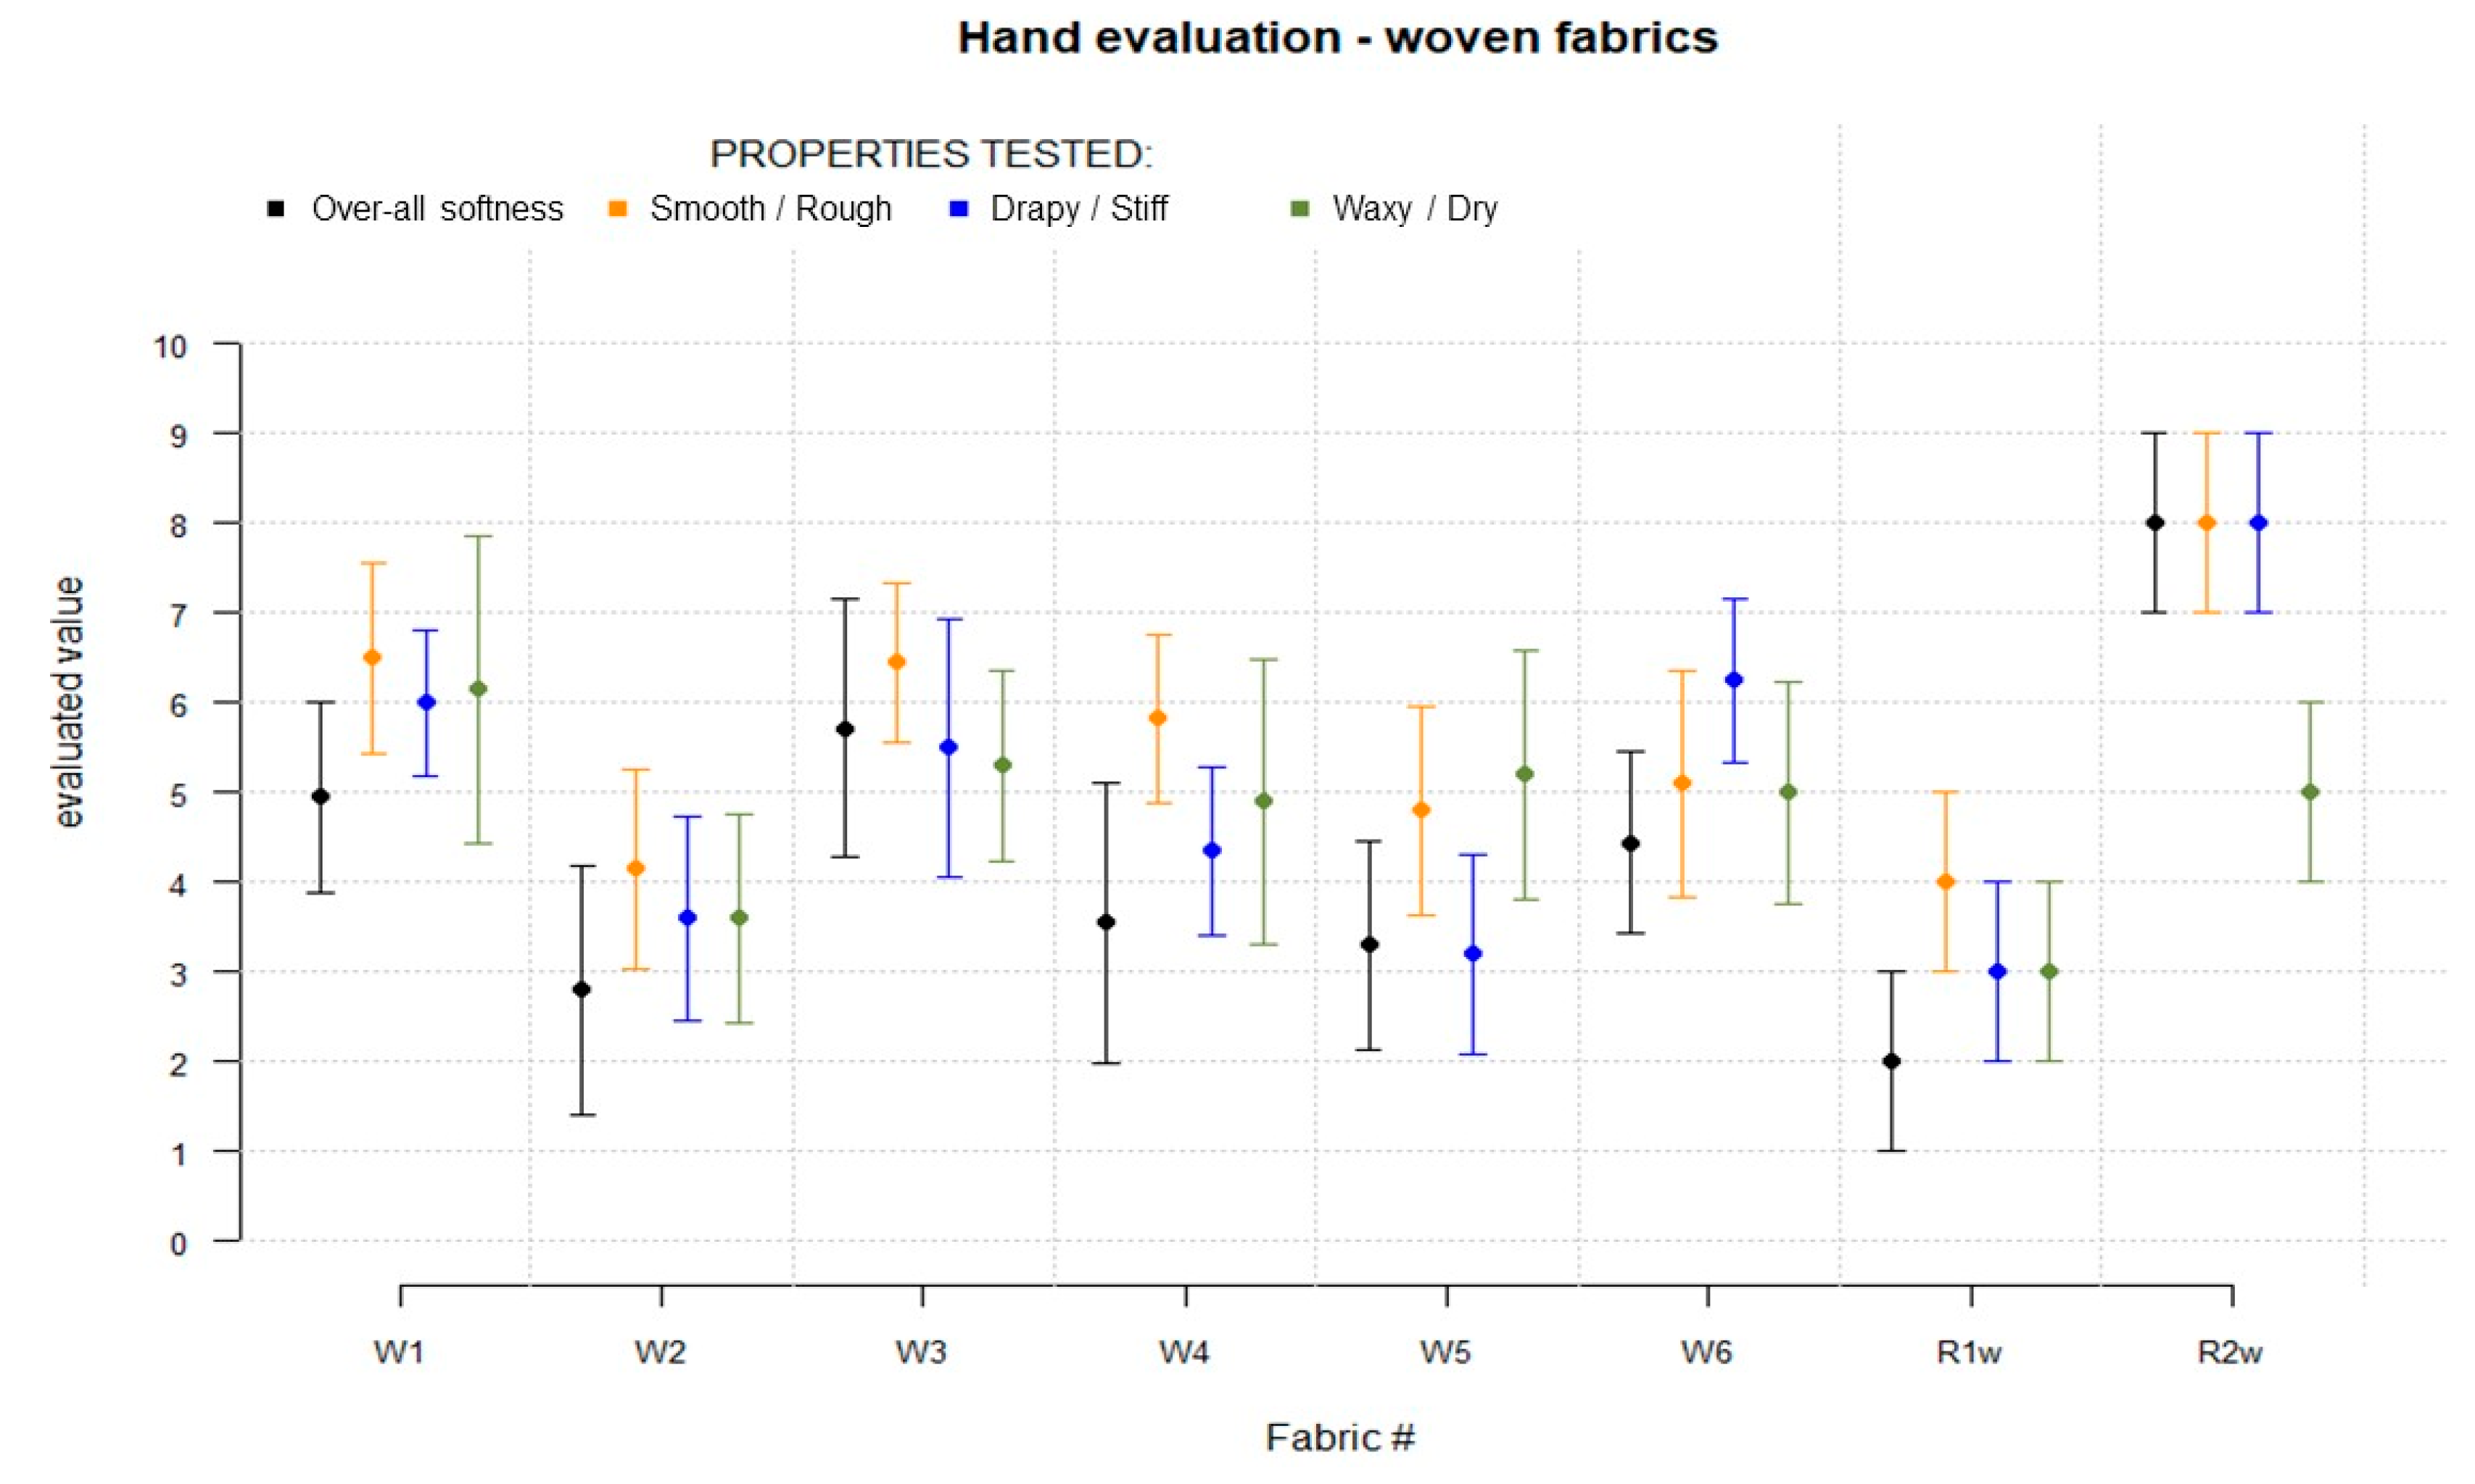
Definition of the semantic grid: descriptive adjectives (word pairs) were agreed upon among the hand-feel panel participants after being discussed to obtain a common understanding. Besides all-over softness perception, descriptive word pairs were selected, which the participants considered most appropriate for the textile type: smooth/rough, drapey/stiff, and waxy/dry.
Hand actions to evaluate each descriptive were defined as shown in
Figure 3. The fabrics were evaluated regarding each defined description parameter by applying the corresponding defined hand action. As illustrated in
Figure 3, the property rough/smooth was assessed by caressing the fabric surface in both directions with the fingertips or the hand wrist, applying minimal pressure. The property stiff/flexible was assessed by compressing the fabric inside the palm of the hand. The property dry/waxy was assessed by rubbing the fabric between the thumb and the finger and applying pressure.
Reference fabrics were evaluated accordingly, and the average values were given fixed positions on the scale. After thus defining the evaluation pattern, the fabrics were evaluated in comparison to the reference fabrics. To avoid confusion and loss of sensitivity [
11], maximally five fabrics per session were evaluated.
2.2.2. Reference Panel
As a human reference, the evaluation results of the same fabrics by the panel trained at the University of Ghent were taken for comparison. The reference panel consisted of 20 persons (textile engineering postgraduate students, researchers, or technical staff with different experiences in fabric hand evaluation [
13]. The reference panelists were selected based on finger sensitivity as tested by the JVP Domes system, which consists of a kit of eight plastic gratings with equidistant bar and grooves widths (0.35, 0.50, 0.75, 1.00, 1.20, 1.50, 2.00, and 3.00 mm). In that test, the persons should blindly distinguish horizontal and vertical grating with at least 75% correct answers) [
13,
18]. In that test protocol, the assessment was performed in two double-blind sessions, meaning that the panel and the assessor did not know what type the fabrics were. The fabrics (5 woven and 5 knitted from the same group of fabrics, both reference fabrics and the first 3 fabrics from each group) were separated into 2 groups and evaluated in 2 sessions, where each time 5 fabrics were assessed. Then the data from the two sessions were merged and the results were rescaled [
13].
2.2.3. Instrumental Assessment
Instrumental (physical) methods were used as an objective reference to the subjective assessment, knowing that these methods cover only the mechanical aspects (bending, shearing, and surface friction) of the fabric properties. For all commercially offered methods, the correlation between these methods and among separate parameters of the same was investigated.
Tissue Softness Analyzer (TSA) measurements were performed using a TSA device by Emtec GmbH (Germany), applying standard test protocol [
8,
19]. By this method, the noise generated on the fabric surface by a rotating part is quantified in decibels as a measure of fabric smoothness and fiber softness. In the captured sonic spectrum, the signal peak at 750 Hz (stated as TS750) is the result of the vibration of the fabric under the rotating part and should correlate with the fabric’s smoothness. The signal at 6500 Hz (stated as TS7) results from the vibration on the rotating blades above the fabric surface and its strength is an indication of the “softness” of the surface fibers bending under the blade. The lower these values, the smoother resp. softer the fabric. An algorithm based on the correlation of these values, fabric mass per unit area, thickness, and the correlation with a human assessment provides the Handfeel Value (HF). Fabrics were measured on the right fabric side only.
Phabrometer™ measurements were performed using a Nu Cybertek (Hong Kong) device following the AATCC test method 202-2012. The force-displacement curve was measured. The resulting numbers on softness, drape, smoothness, resilience, and relative hand-feel value (ranking) are based on the curve analysis by the system software [
12,
20,
21].
Kawabata (KES-f system) measurements were performed at IFTH (France) following standard test protocol [
11,
22]. The resulting values are tensile and shearing strength and elongation (tearing device), compression and resilience (compression device), bending stiffness, surface characterization (friction and roughness), and thermal effusivity (Qmax).
All measurement results have been cross-checked. The level of concordance of the expert assessment, the average values of the assessment, and their deviations have been clarified. Data were compared with the results obtained from the expert group and the instruments (considering the predefined/expected correlations).
3. Results
3.1. Results of the Subjective Evaluations
In order to analyze the relevance of the properties (descriptors) to the evaluation process, and to understand the evaluability of descriptor “overall” softness (subjective parameter—perceptive softness), after the experiment (fabric evaluation) the hand-feel panel was asked to compare the ease in assessing each property in a binary evaluation compared to each other. A summary table was created to evaluate the result (see
Table 2). The table summarizes the results according to the binary principle, if the descriptor is rated as easier to assessable, it gets 1 point (score), if it is rated as difficult, it gets 0 points. If the evaluation among the experts is ambiguous, then the descriptor is evaluated with half a point (score of 0.5). The points are summed, and this determines the ranking.
The summary shows that the easiest to assess is the fabric drape, as evidenced by the results’ standard deviation. Next in rank is the general descriptor’s overall softness. In addition, the experimental results show a high correlation between descriptor ratings.
A standard deviation of maximally ±10% was targeted.
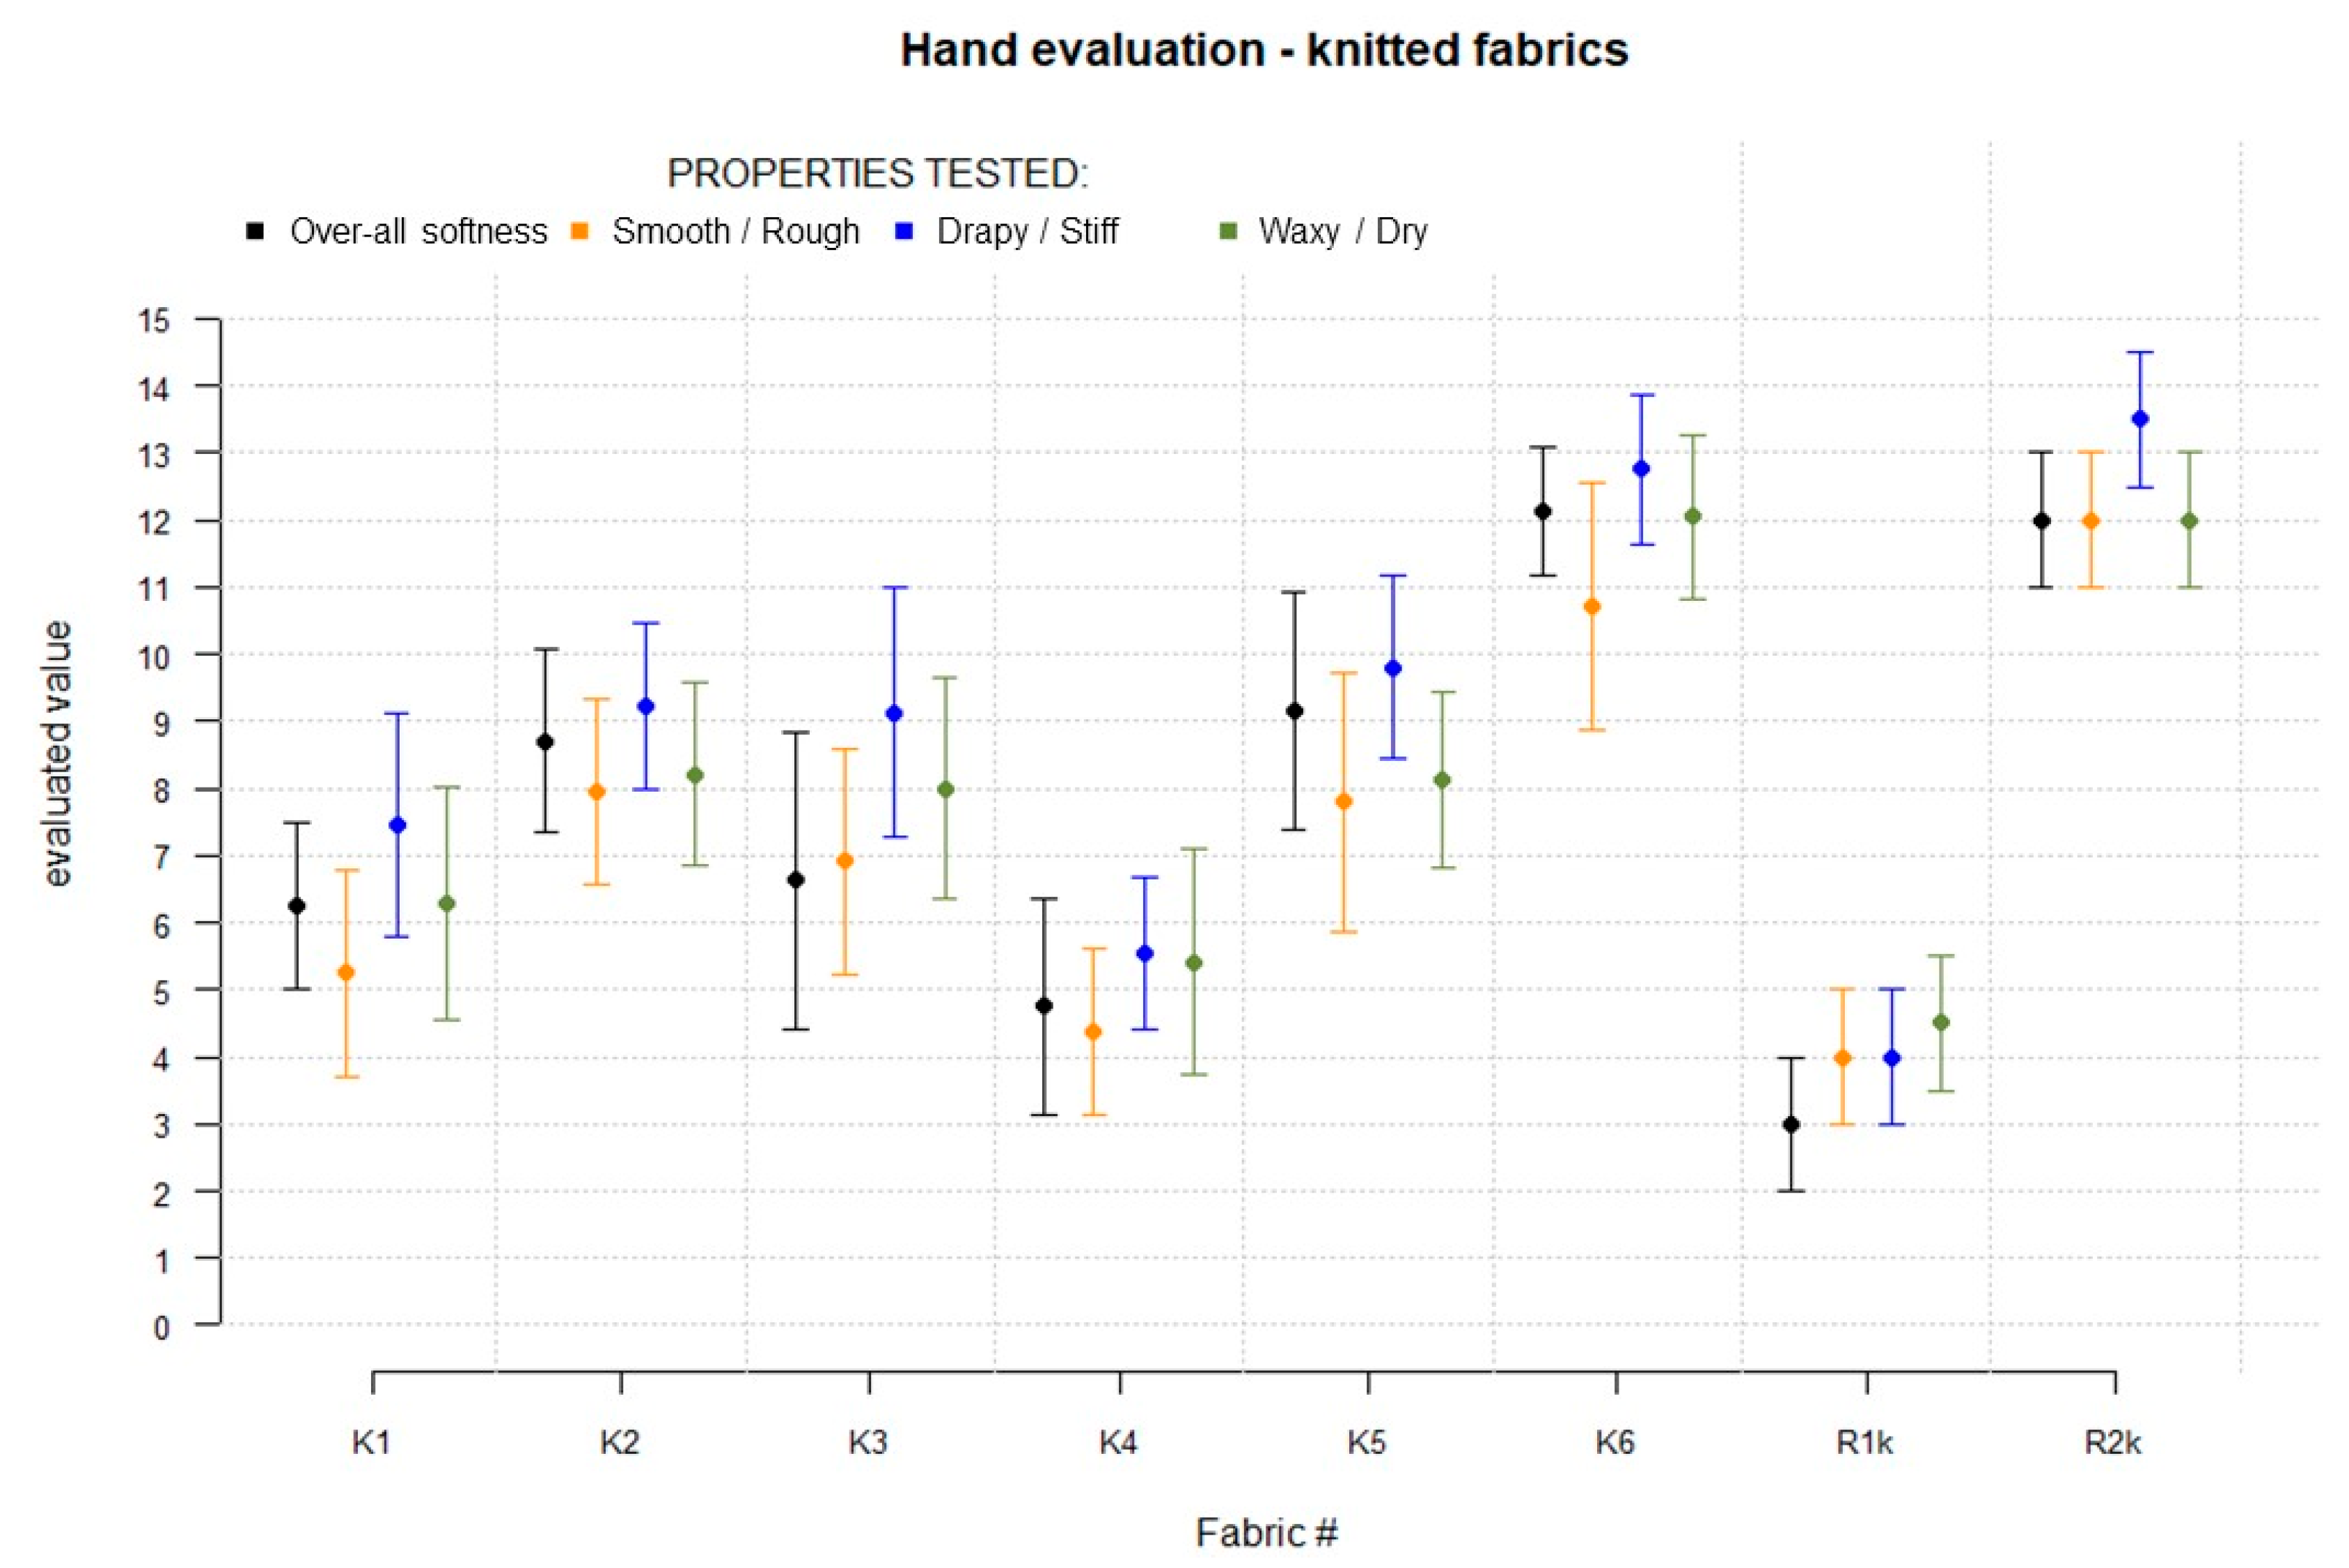
Figure 4 and
Figure 5 show that this target was reached for most properties. Larger disagreements were found on certain evaluated fabrics and in the description words. Further, the obtained results show similar trends in all investigated properties. The Pearson correlation between all the parameters is higher than 0.9. This means, for this type of fabric, perceived flexibility and surface smoothness cannot be considered independent properties. The evaluation can, in this case, be abbreviated to one parameter. Therefore, in the approbation of the method, a general evaluation (overall softness) of the fabric can be made in future evaluations. Nevertheless, in further analysis, each parameter will be discussed in relation to instrumental parameters with similar physical action.
For the knitted fabrics, the group average shows a significant difference between cotton and fabrics made of wood-based fibers. The cotton/lyocell blended fabric K4 lays in between. Among the wood-based group fabrics, the differences are in the trend. Other fabrics differ in the trend, showing higher scores for the modal-based fabrics K2 and K5, followed by the viscose and lyocell K1 and K3. Having the lyocell/cotton fabric between 100% cotton and 100% wood-based confirms the trend. The modal (micro) fabrics R2k and K6 excel significantly among the wood-based group.
Woven fabrics showed less differentiation and more variation in the results than the knitted, whereas similar trends were observed. The group average shows a significant difference between the modal (micro) woven fabric (W1, R2w) and the 100% cotton fabrics (W2, R1w). The other fabrics made of wood-based fibers were felt by the group as more similar and could only be differentiated in trend.
3.2. Evaluation of Hand-Feel Group Ranking Concordance
Kendall concordance factor W shows 0,01–0.20 slight agreement; 0.21–0.40 fair agreement; 0.41–0.60 moderate agreement; 0.61–0.80 substantial agreement; 0.81–1.00 almost perfect agreement [
23]. The concordance of the ranking among the group for each analytical property among the group was calculated (see
Table 3). While “substantial” concordance was observed in the analytical properties, an “almost perfect” agreement was observed in the overall softness evaluation.
Kendall factor shows substantial to moderate concordance on most of the properties within the group. The lowest concordance was found for the property “waxy/dry”. Also, for this descriptor, the standard deviation of the scaling was found the highest. This indicates that this property is more difficult to assess by the hand-feel panel.
3.3. Correlation with Instrumental Methods and a Reference Panel
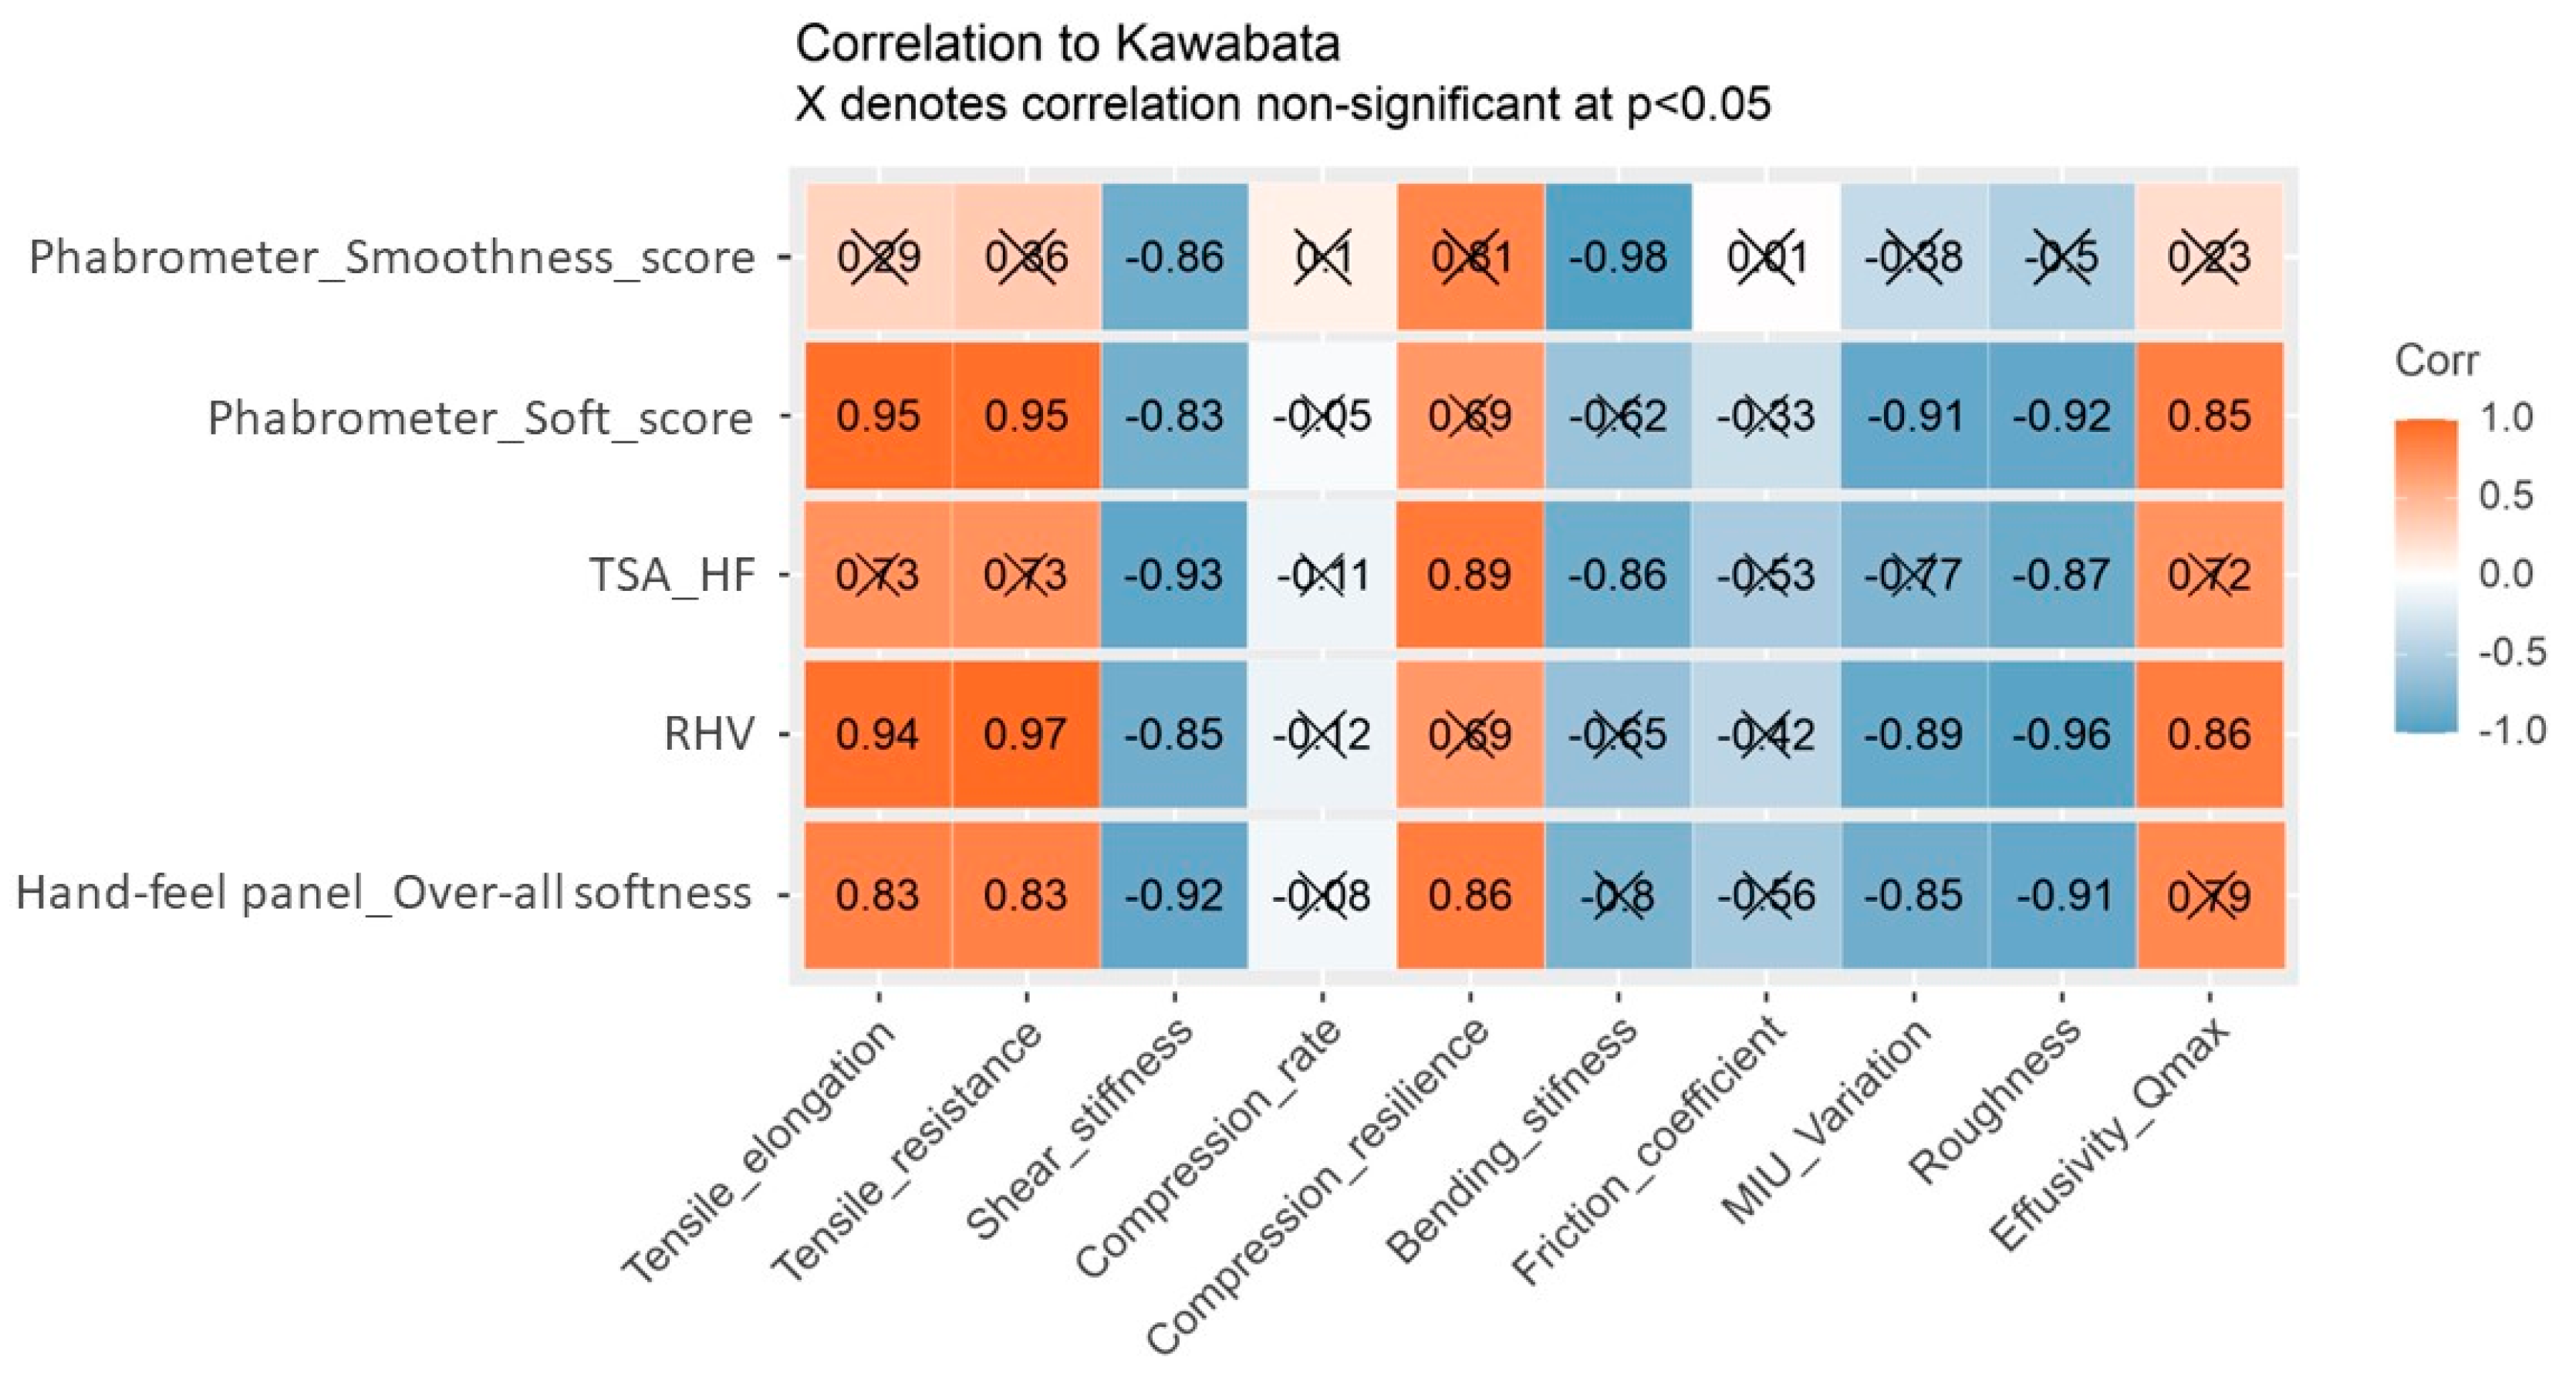
Physical measurement parameters can be categorized in groups according to the physical actions, and hence are expected to correlate with the reference panel parameters obtained by a corresponding hand action. As TSA acoustic values are an indirect measure, they are to be compared with all panel values.
Table 4 shows the Pearson correlation factor for each parameter of the panel with each parameter of the methods mentioned above. Expected correlations, based on the similarity of applied action, are marked in the table (with bold/white contour). For better visualization, all values are graded from dark orange (coefficient + 1 strong positive correlation) to dark blue (coefficient −1 strong negative correlation). If there is no correlation, the value is marked white (coefficient 0 correlation does not exist), respectively the lighter variations of the two colors indicate a weaker correlation. All values are given for both types of fabrics involved, indicated as K for knitted and W for woven fabrics.
For knitted fabrics, human and instrumental assessments showed a high correlation. As the table shows, all-over knitted fabric “softness” evaluations resp. calculations by both human panels and the Phabrometer (RHV (Relative Hand Value)) show a correlation above 0.9. Panel results corresponding to actions where the fabric is bent or sheared show a correlation between 0.8 and 0.95 with Kawabata and the Phabrometer, as well as with the human “softness” assessment by the Reference Panel the procedure followed there. Hand actions on the surface, i.e., caressing for “smoothness” and applying higher finger pressure for “waxiness” correlate with Kawabata MIU (Rubbing coefficient) variation and roughness indicator. A lower correlation was observed with Phabrometer “smoothness” as well as with the “smoothness” results from the reference panel. However, the research panel’s “waxiness” correlated better than “smoothness” with the reference panel’s “smoothness”. This indicates the dependence of this parameter on the applied pressure, parallel to what is expected when measuring friction.
Based on the experience from the tissue sector [
24], the TSA provider states TS7 as a measure of fiber softness, and TS750 for total surface smoothness. Basically, all panel “softness” results correlate with TS7 (>−0.9). “Softness” related values show a fair correlation with TS750 (~0.8), while surface-related “smoothness” shows correlation factors around 0.7. The hand-feel value HF is obtained by an algorithm, which had been developed by the provider based on the TSA parameters, fabric mass per unit area, thickness, and panel assessment of the knitted fabrics, to be used and tested for fabrics of comparable construction.
As for woven fabrics, the hand-feel panel showed an acceptable correlation with the “softness” results from the reference panel, while no agreement was found regarding “smoothness” was found.
No substantial correlation between human perception and measured physical parameters was observed. The assessment of the hand-feel properties of lightweight woven fabrics shows a wider variation in the results than obtained with the knitted ones. Low or no correlation of the panel with all relevant Kawabata parameters was observed.
Also, with TSA the correlation was poor. The highest correlation factor (0.63) was observed between the acoustic TS750 and the property “drapey/stiff”. Being based on acoustic measurement, the airflow through the fabric plays a role in the received signal strength. In the standard measurement protocol used in this study, the microphone is positioned below the fabric, while the rotating part is above. The alternative setting for fabrics with lower air permeability (woven fabrics, spunlace, etc.), which includes a different positioning of the microphone, was suggested by the provider [
25] and will be the subject of future research.
3.4. Correlations among Instrumental Measurement
Taking Kawabata measurements as a reference, results from other instrumental methods were compared and the correlation of relevant values was investigated. The correlation of the overall softness values from the panel, as well as the other physical methods with each Kawabata parameter, is shown in
Figure 6.
All “softness” values were found to correlate with Kawabata’s shear stiffness and tensile resistance. The correlations with the other Kawabata parameters will be discussed in the following in light of the mechanical action taking place in each method.
The Phabrometer is based on measuring the force required for pushing the fabric through an opening. The values are calculated from the analysis of the force/displacement diagram. Actions taking place thereby, such as squeezing and tearing of the fabric, would be expected to involve the shearing and stretching of the fabric, and hence the correlation with these parameters. One-dimensional bending, on the other hand, is not involved in the Phabrometer action.
Kawabata’s compression rate and the pure friction coefficient do not show a correlation with “softness” assessments. Moderate to good correlations were found with the surface characterization values (MIU variation (Rubbing coefficient)) and “roughness”. As hand action implies squeezing and caressing the fabric, relevant parameters, such as surface, shear, and bending stiffness, as well as surface smoothness expressed by MIU roughness.
A relation between heat flow (Qmax) and softness perception can be derived from the relation between smoothness and subjective softness perception. Thermal effusivity (Qmax) is higher for smooth surfaces due to higher heat dissipation, but it is unlikely to be related to dynamic fabric properties. Further correlation factors between Phabrometer and Kawabata parameters are shown in
Figure 6. Expected correlations are marked grey in the table. Though the calculated Phabrometer RHV (Relative Hand Value) shows a good correlation with all Kawabata mechanical and surface-related parameters, the analytical values (drape, smoothness, and softness) do not correlate with the Kawabata parameters where they are expected to. The Phabrometer “drape” correlated with Kawabata’s elongation and resilience, not with bending stiffness. Interestingly, it also correlates with the Kawabata’s thermal parameters.
No correlation was observed between Kawabata friction values and Phabrometer calculated “smoothness”. Here, the best correlation was found between Kawabata shearing and the overall softness of all observed methods. It would be expected that Kawabata Thermal values correlate with Phabrometer “smoothness”, but the correlation was rather observed with the values related to “softness” and “drape resilience”.
In total, other than the calculated values “softness” and “smoothness”, Phabrometer RHV can be considered a reliable ranking. A deeper interpretation of Phabrometer results requires a theoretical revision of the analysis of the displacement/force curve and exceeds the scope of this study.
The HF values (hand feel values) from TSA show a high correlation with Kawabata’s shearing, compression resilience, bending stiffness, and optical roughness (
Table 4). Moderate correlation with MIU (rubbing coefficient). As for the measured acoustic values, TS7 should correlate with the softness (flexibility) of single fibers. Flexible fibers mean better bending and shearing and less friction. Correlation values widely fit with the expectations. TS750, although originally presented in the tissue sector as fabric “smoothness”, correlates rather with the fabric dynamic values than with surface properties. Here, high correlations with Kawabata’s bending and shearing, and compression were observed.
3.5. The Hand Feel Panel Assessment in a Comparison with Consumer Test
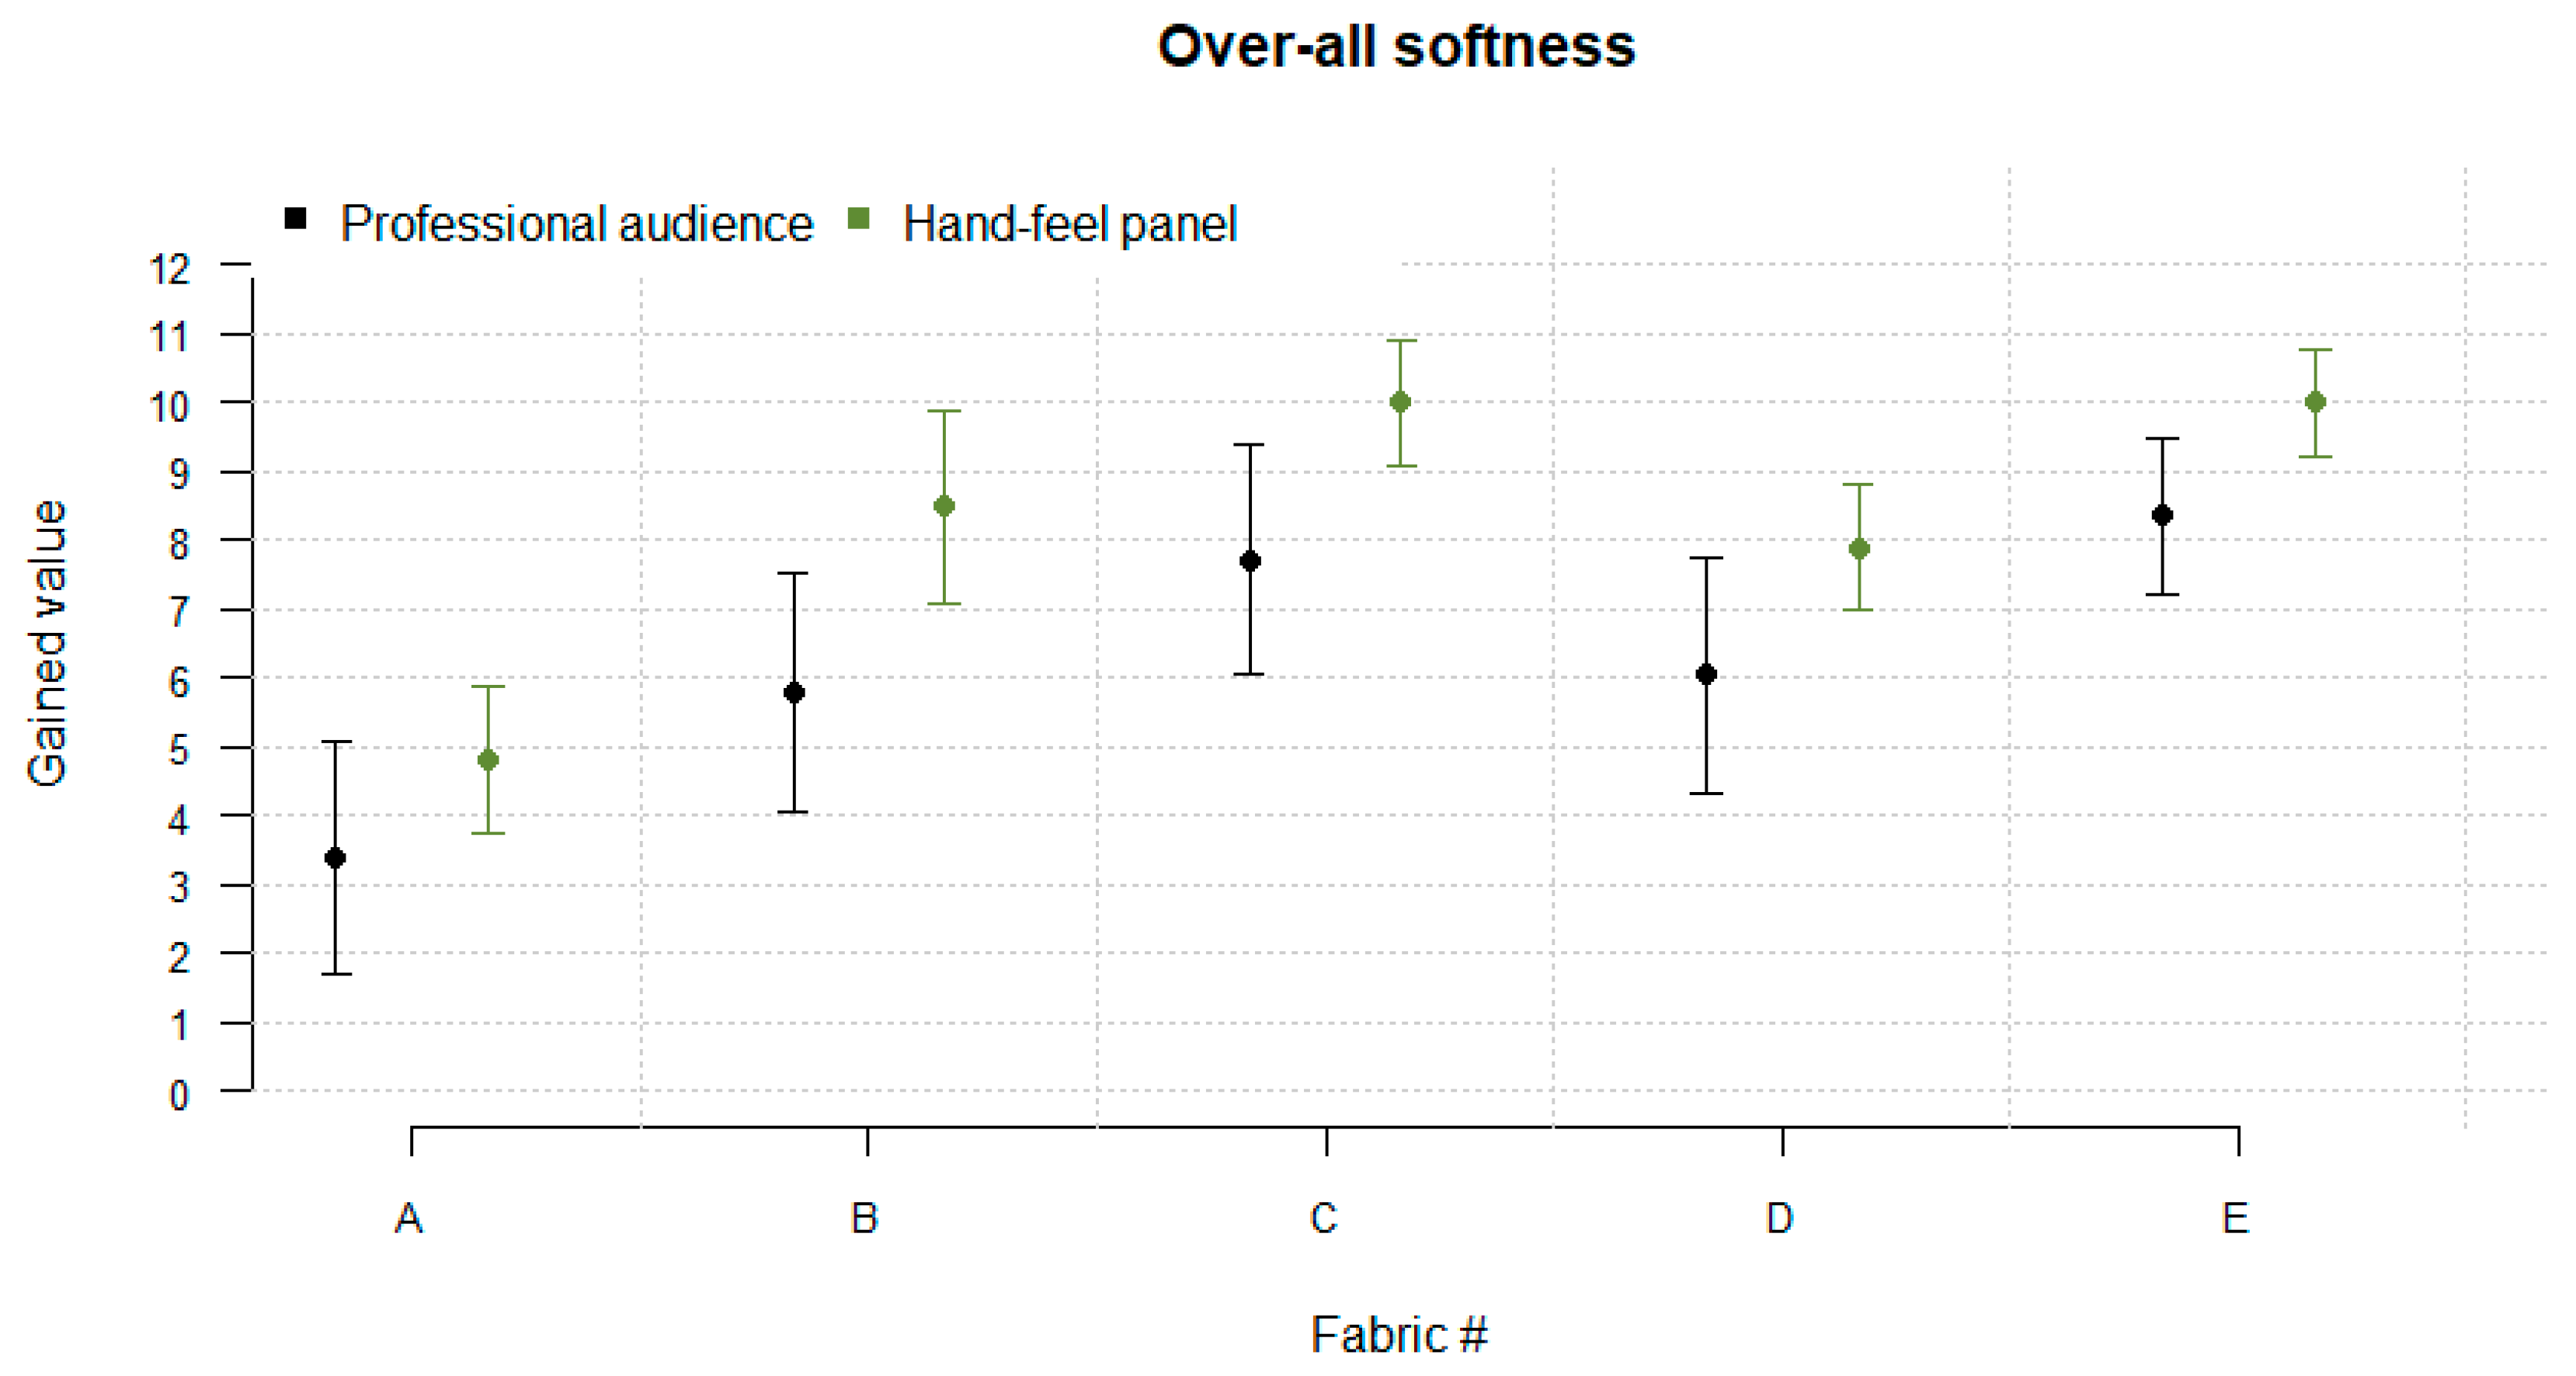
A different set of knitted fabrics made of different cellulosic fibers in two yarn counts (Nm 50 and 70) was evaluated by the hand feel panel in the same scaling method. Ten fabrics were scaled in two successive sessions, relative to the fixed reference fabrics R1k and R2k.
Five fabrics were selected to be evaluated at a consumer test. The fabrics were evaluated by 42 participants at a commercial textile fair (Premier Vision, Paris, 2019) at the Lenzing booth. The participant was asked to select the “softest” fabric, and if possible, to provide scaling of the fabrics regarding softness. Unlike the hand-feel panel, the participants scaled the fabrics without external reference fabrics. The results are shown in
Table 5.
While the hand feel panel ranked fabrics # E and # C equally, a vast majority chose fabric # E as the “softest” fabric, and fabric # C came in second place. Forty-two participants were able to provide a scaled comparison of the fabrics, ranking the fabrics on a given scale between 1 (roughest) and 10 (softest), according to softness preference. In this test, the fabrics were compared with each other without an external reference fabric. A high variation was observed. Comparing the average consumer results with the hand feel panel scale shows acceptable accordance in categorizing the fabrics. The hand feel panel and the consumer ranking are concordant with the softest and least soft fabrics. Some discordance occurs in the two middle-range fabrics, whereas the score difference between the fabrics is low on both sides.
Although scores on a scale of 1 to 10 (their mean values, see
Figure 7) are different between both groups, the standard deviations in all measurements are overlapping, so the data can be considered to be consistent, and the hand feel panel’s view is to be taken into account in determining customer preferences.
4. Discussion/Conclusions
This study presents a case of training a hand feel panel under industry-relevant conditions and facing limitations in time and personnel resources. A group of persons working in a textile field with different competencies, varying abilities, and availability, were given the task of assessing the hand feel of fabric samples, which are mostly very near to each other, and differ in only a few parameters. Agreeing on wording, meaning, and the corresponding hand action, the group was able to provide a scaled and ranked assessment of knitted and woven fabrics’ hand feel, with results showing an acceptable correlation with instrumental as well as with referenced human assessment. Human and instrumental assessments widely agreed on the differentiation among the fabrics based on cellulosic fibers, showing the softness gradient from modal (micro) as the softest and cotton as the least soft in the investigated fabric types, whereas fabrics based on the 1.3 dtex modal and lyocell fibers came in the middle range, with a perceivable advantage of modal in comparison to lyocell.
For knitted fabrics, the panel proved reliable in providing a scaled assessment as well as a ranking of hand feel. Analytical physical characteristics related to all-over hand feel appear not to be independent of each other. The reason may be in the three-dimensional nature or the similarity of these fabrics, being all cellulosic and having a comparable yarn and fabric construction. Surface smoothness is more difficult to assess than dynamic properties (bending, compression). The reason could be differences in the individually applied pressures as well as in the skin sensitivity and condition of each participant. Depending on the research task and fabric type, some parameters can be combined into an all-over softness evaluation.
The Phabrometer RHV (Relative Hand Value) values correlate well with Kawabata mechanics, but the single descriptors derived from the interpretation and segmenting of the location/force curve do not. TSA noise signals show, in many cases, a good correlation with fiber softness as well as with fabric mechanics. A hand-feel algorithm for the investigated type of fabric could be developed by the provider and will be, besides alternative test settings for woven fabrics and fabrics with lower air permeability, the subject of further testing and validation.
The hand feel assessment of the lightweight woven fabric resulted in more difficulty than on knits. The compact and rigid character of the fabric appears to lead to a different perception. The analytical properties are less connected to each other than in the case of the knits. The assessment of dynamic fabric properties also seems to be easier than surface-related ones. For the second, blindfolding (reference panel) proved to provide a better correlation with the instrumental friction measurements.
The practical examples show that the panel was able to predict the consumer decision for a defined fabric type. In conclusion, the method offers fast training of an expert (or at least semiexpert) hand feel panel under daily business conditions to assess the main hand feel characteristics with minimal personnel resources, especially in cases where the fabrics have a known purpose (predefined use that facilitates evaluation and preference).


