1. Introduction
Modern measuring systems are more and more often found to contain converters with a frequency output [
1]. In this type of converter, information about changes in the processed quantity
x(
t) is transferred via the frequency value of the converter output signal; hence, the devices are called physical-quantity-to-frequency (X/f) converters [
2]. There are two common ways of converting the quantity
x(
t) into a variable frequency signal [
3]. In the first case, frequency-to-voltage conversion is used, and further processing involves an analogue-to-digital converter [
4]. The second method is the conversion of the frequency signal directly into numerical values by a specialized frequency-to-code (f/N) converter [
5].
The transmission of information by means of a frequency signal has many advantages [
6]. Such a signal is resistant to interference and can be transmitted in a simple and effective way over long distances without the loss of information [
7,
8].
Company devices for continuous frequency measurement have been known for years [
9]. However, one can still encounter research on new methods of frequency signal processing [
10], reducing errors in frequency signal processing [
11,
12], or the estimation of processing accuracy [
13,
14].
Due to the wide possibilities of microprocessor systems, they have also been used in measurements of the variable frequency of the signal [
15,
16]. It is also very interesting to use the microprocessor system not only for frequency processing [
2] but also for the adaptive correction of the system parameters during the measurement. This raises the possibility of increasing the accuracy of the results [
2].
Research into new processing methods is very time-consuming. They can be implemented both by experiments and simulation. Experimental testing enables new processing methods to be unequivocally verified but requires a lot of time and is very expensive. There may also be significant problems with the selection of equipment for the experiment. The simulation test offers a limited possibility of verification. However, with the adoption of appropriate assumptions, it significantly supports the initial tests and accelerates the obtaining of information, allowing for decisions regarding the implementation of new methods in the physical model [
17].
The simulation can be performed with the use of basic programming languages, such as C [
18] or Python [
19]. However, it is more convenient to use specialized software for this purpose, such as Matlab [
20] or LabVIEW [
21]. Matlab is a software dedicated to calculations [
22]. However, compared to LabVIEW [
23], it has a limited possibility of connecting external devices. Considering that, during the research, in order to verify the experimental work of the fragments of the virtual channel model, it may be very useful to process data generated in external devices, so it was decided to use the LabVIEW programming environment. It also has the advantage that, in the event of the need to use Matlab script, LabVIEW offers this possibility [
24].
2. Converting Frequency into Numerical Values
The variable frequency signal can be measured using various methods [
25]. One of them is the application of a microprocessor system that performs digital period measurement, supported by a counter with an additional register attached, which captures the current state of the counter [
26]. The counter operating in this mode works continuously; i.e., after reaching its maximum value, it starts counting from the beginning. The reading of the counter status is performed by transferring the current contents of the counter totalizing register [
27], without stopping the summation of pulses, to a special register that keeps the instantaneous value of the state [
28].
In the present system, the reading of the counter status is controlled by a microprocessor. The system measures the frequency by determining the duration of a single period
Txi [
14]. The block diagram of the system operating according to the proposed method is presented in
Figure 1.
Figure 2 shows the waveforms presenting the operation of the periods processing system of the signal of variable frequency.
The counter is controlled by a clock generator with the period
T0 (
Figure 2c). The code output of the counter is connected through a register capturing the state of the counter to the microprocessor. A frequency signal with period
Txi is applied to the selected microprocessor input (
Figure 2b). The microprocessor reads the counter state at the instants of receiving the start and end impulse
Txi (
Figure 2d). In this way, in the memory of the microprocessor, information is collected in the form of numbers representing successive values of the periods
Txi of the variable frequency signal from the physical-quantity-to-frequency converter.
The frequency for a given
Txi is determined by the formula:
where:
ti,
ti+1—time instants when the characteristic slopes of the testing signal with variable frequency appear. The numerical value corresponding to the length of a given period
Txi is described by the formula:
where:
Ni and
Ni−1—the states of the totalizing register of the counter at the times instants
ti and
ti+1, respectively,
Nmax—capacity of the counter, and
O—number of overflows of the counter during the measurement of each interval
Txi.
The
Txi period estimate of the f/N converter input signal is calculated from the formula:
Hence, the estimated frequency of the tested signal can be described by the formula:
where:
T0—the period of the clock generator output signal. In this way, the data for calculating the values of consecutive periods of the input signal of the f/N converter are obtained. Taking into account the sensitivity
S of the X/f converter, the data allow for a direct reconstruction of the waveform
x(
t) (
Figure 2a) by using the dependency:
3. Errors of the Measurement Channel with a Frequency Carrier of Information
The accuracy of the direct conversion of the frequency signal periods into numerical values in the frequency-to-code converter is mainly limited by two components: the quantization error and the averaging error, which are described in [
14].
The quantization error in measuring the period of a variable frequency signal depends on the value of the converted period of the signal [
29]. The quantization error δ
k can be calculated from the dependence:
An example of the quantization error curve is shown in
Figure 3.
The averaging error arises as a result of the integral action of the input quantity by the physical-quantity-to-frequency converter [
14]. It was assumed that the test input signal
x(
t) has a sinusoidal shape, the amplitude and the constant component of which are equal to each other, and the variability range is between −
Xm and +
Xm. Taking the above into account, the relative error of averaging is calculated from the dependence [
14]:
where
F is the frequency of the signal
x(
t). This relationship shows that the averaging error depends on the value of the period
Txi and the frequency
F. The error value increases with the increase of both of these parameters.
The analysis of the information processing error in the measurement channel with the frequency-to-code converter, after adopting the ideal X/f conversion (the work concerns the modification of the processing method in the f/N converter), allowed to determine the formula for the maximum total error [
14] as:
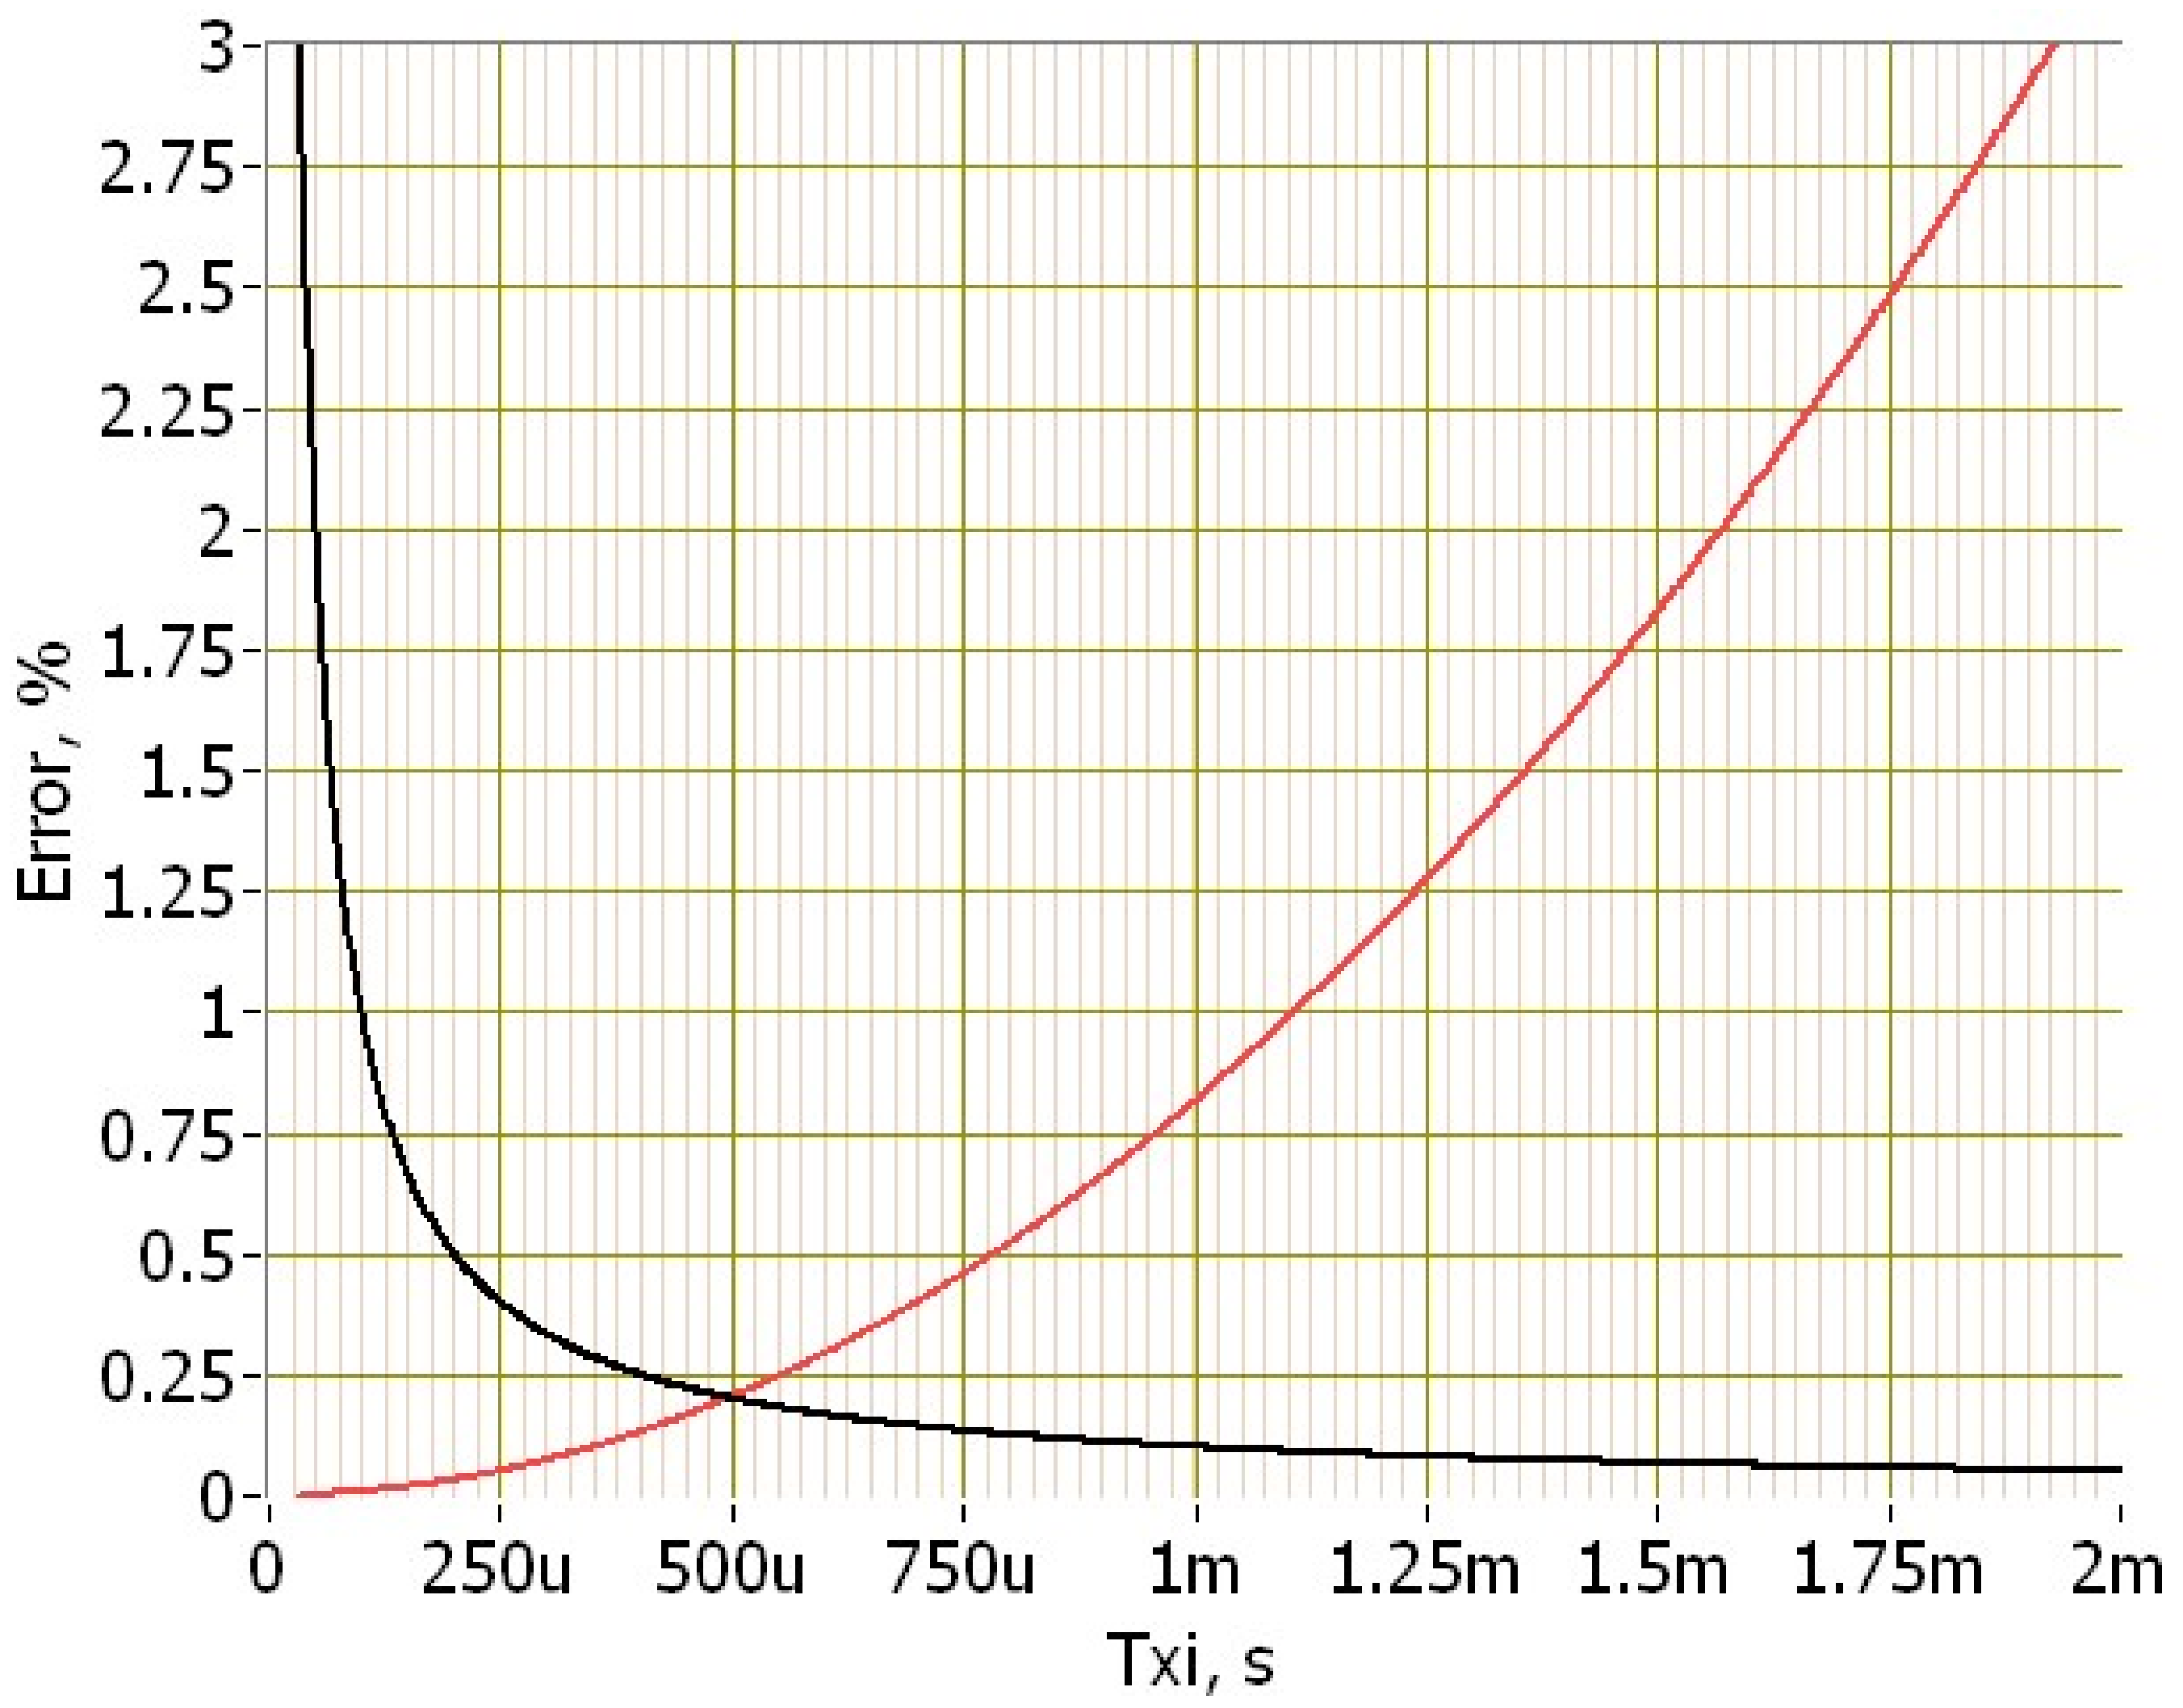
Formula (8) shows that the increase of the
Txi period causes the increase of the averaging error, while its decrease causes the increase of the quantization error (
Figure 4). An exemplary plot of the total error δ
∑ is shown in
Figure 5.
There is a certain minimum between the values causing the increase of the above-mentioned errors at which the measuring system works with the highest accuracy [
2]. The frequency of the clock frequency generator
f0 has an impact both on the quantization error δ
k and indirectly, by influencing the measurement of successive periods
Txi of the frequency signal, also on the averaging error δ
a [
14]. The increase in the frequency of the clock generator reduces the quantization error and increases the resolution of the period measurement of the frequency signal [
30]. Unfortunately, processing a larger number of pulses requires counters with greater capacity [
31]. The opposite situation reduces the demand for the counter capacity but deteriorates the accuracy of the measurement [
14]. The conclusion is that it is possible to choose such an output frequency value of the clock generator of the f/N converter that will allow to achieve an acceptable compromise between the capacity of the counter and the value of the clock signal frequency. Of course, it should be remembered that the frequency of the clock signal will produce different error values depending on the frequency of the input signal of the f/N converter [
29]. The proposed method describes how to select the frequency of the clock signal to improve the information processing parameters in the measurement circuit with a frequency information carrier.
Figure 6 shows examples of the quantization and averaging errors for the signal
x(
t) changing with the frequency of 1 Hz. It is evident that only one of the above-mentioned errors has the dominant value at the ends of the processing range.
For the upper range, where the period tends to the minimum values, the quantization error has a significant impact on the total error, and the averaging error is negligible in this case. The reverse is true for
Txi reaching
Tmax. Taking the above into account, it is possible to use the transformed formulas for the errors mentioned to determine the value of the period
Txi at which, and, thus, the value of
Nxi representing it, the given value of the resultant error is obtained. Since each measurement of the
Txi period is performed as an independent measurement [
14], the processing error is also determined as the maximum error of a single measurement.
Taking into account the considerations presented above, it can be assumed for the processing error δ
Σ in the upper measuring range with a satisfactory approximation that its value describes the Formula (6). Therefore, after transformation, it can be written that the numerical value representing
Txi at which a given error occurs can be calculated from the transformed dependence (6) taking into account Formula (3):
In the lower part of the frequency conversion range, the value of the averaging error [
17] described by relationship (7) prevails. Due to the problem of the direct determination of the dependence on the value of
Nxi from the above-mentioned equation, the Taylor series expansion [
32] of the sinus function was used for the transformation; only the first two unfolding elements were taken. As a result, after transformations and assuming the processing range of the X/f converter to be 0 ÷
Xm, the dependence on the averaging error took the form:
The above dependence, after taking the Formula (3) into account, is used to obtain the formula for the value of
Nxi obtained for the given value of the processing error:
The dependencies (9) and (11) allow to establish the Nxi threshold values at which the change of the clock signal frequency f0 in the f/N converter will improve the information processing parameters.
Increasing
f0 reduces the quantization error. The use of a programmable frequency multiplier [
33] may enable an increase in the accuracy in the processing of high-frequency signals of a variable frequency signal [
29].
In the low frequency range, the value of the frequency
f0 influences the value of the number
Nxi. The appropriate reduction of
f0 allows the information to be processed by the f/N converter with a reduced number of signal pulses with the frequency
f0 registered by the f/N converter counter with the maximum averaging error δ
a unchanged. Reducing the sum of pulses in the measurement of a given
Txi allows increasing the maximum length of the
Txi period [
34] that can be measured by the f/N converter.
4. Adaptive Method of Improving the Processing Parameters in the Frequency-to-Code Converter
The presented method is not intended to compete with the systems realizing high-speed analog-to-digital processing. Rather, it is recommended for using in a measurement channel with a frequency information carrier in which the integrating nature of the operation of the X/f converter allows the processing of signals with low frequencies [
14].
The discussed author’s method allows for the adaptive improvement of the processing parameters in the frequency-to-code converter of successive periods of the input signal with a variable frequency into its digital representation in a manner adapted to the performance of the processor used in the frequency-to-code converter.
Frequency-to-code converters are often based on a counter system [
3] that allows for a continuous reading of the status without stopping the counter operation. Typically, the counter circuit works with a processor with attached RAM memory. The reason is the lack of the possibility of the clear, direct presentation of the current, rapidly changing measurement results on a simple indicator (e.g., LED, LCD). Consequently, it is necessary to process and store the obtained results, for example, in RAM or on a memory card, for analyses performed with a certain delay, imposed by the adopted technical solutions in a specific device. The presentation of the method is based on the previously shown structure of the microprocessor system of the f/N converter (
Figure 1). The modification of the circuit is shown in
Figure 7. The basic circuit in
Figure 1 has been supplemented with a clock frequency divider/multiplier module
f0. The method allows reducing the error made during the measurement of successive periods of the variable frequency signal, thus increasing the measuring range of the device in which the measurement will be carried out with a similar processing error. The implementation of the method is possible with processor systems and programmable circuits widely used in practice that can perform such functions. The description of the operation of the program variants can be presented by an algorithm, a comparison table, and other methods. Due to the relatively low complexity of the algorithms, it was assumed that the operation of the adaptive method will be described using algorithms. The basic algorithm of the method is shown in
Figure 8. The method of the adaptive improvement of the processing parameters in the frequency-to-code converter is carried out in several phases. In the first phase, the previously discussed basic measurement of the first period
Txi of the variable frequency signal is made.
To simplify the considerations, it was assumed that a square wave signal with logical levels adapted to the voltage levels required by the processor is fed into the input of the f/N converter. Changes in the logic states at the processor input allow the processor software to determine the beginnings of subsequent
Txi periods. At the moment of detecting the beginning of the next
Txi, the processor reads the current state of the counter, summing the pulses formed by the signal periods from the prescaler/frequency multiplier module and changing the frequency of the reference signal
f0 from the clock signal generator. The read state from the counter system is stored in RAM memory until the next state is read, corresponding to the detection by the processor software of the beginning of the next period
Txi. Then, the processor calculates the difference of the successive states read from the counter, representing the period length
Txi of the variable frequency signal. At this point, the second phase of the frequency-to-code converter operation begins, carrying out the procedure correcting the frequency change factor
f0 of the signal from the reference frequency generator. The difference of states read from the counter system reflects the period value that takes into account the frequency change factor in the prescaler/multiplier module and the frequency of the signal from the clock signal generator. The computed difference
Nxi is used to determine the value of the maximum processing error (8) made when measuring the period
Txi [
14]. The value of
Nxi is stored in the RAM at the index
i. After detecting that the permissible value of the quantization error has been exceeded (option “Y” in
Figure 8 and
Figure 9), the procedure determines the frequency change factor that allows reducing the processing error to the limit set in the program and sets the required frequency change factor in the prescaler/multiplier module.
In addition, the value of the frequency change factor is stored in the memory for use in computing the period value with index
i + 1. In the case that the error does not exceed the predetermined value (option “N”
Figure 8 and
Figure 9), the procedure ends without changing the reference frequency correction coefficient, performing only the operation of assigning the period with index
i + 1 to the value of the coefficient of change as for the period with index
i. As a result, pairs of numbers are stored in the memory of the frequency-to-code converter: the calculated state differences corresponding to the successive periods
Txi and the values of the frequency change factor set in the prescaler/multiplier module when measuring the length of these periods. Thanks to this, the master device, which is most often a computer, can read the assigned, stored data pairs through the interface and calculate the values of the successive
Txi periods. The operation requires only taking into account the constant for a given converter frequency-to-code frequency of the clock signal, which can also be sent by the converter or entered directly into the master device software.
In the case of using a processor with sufficient computational speed compared to the rate of change of frequency of the processed variable frequency signal, it is possible to calculate the period value directly in the frequency-to-code converter. The algorithm for measuring the variable frequency with an f/N converter with a microprocessor system with a satisfactory performance is shown in
Figure 9. In this case, the processor also calculates the difference of states read from the counter system, which represents the period value, taking into account the degree of frequency correction in the prescaler/multiplier module and the frequency
f0 of the generator model. The computed difference is used to determine the maximum value of the total error made in measuring the period
Txi [
14], then the computed state difference is used to calculate the actual period value, which is then stored at a given index
i in the RAM. Upon detecting that the admissible quantization error value has been exceeded (option “Y”), the procedure calculates a frequency correction factor that allows the processing error (8) to be reduced to the limit set in the program and changes the frequency correction factor in the prescaler/multiplier module. In addition, the value of the frequency shift factor is stored in memory for use in computing the period value with the index
i + 1. If the error does not exceed the set value (option “N”), the procedure ends without changing the change factor of frequency, performing only the operation of assigning the
i + 1 period to the scaling factor value, such as for the period with the index
i. In the case of the alternative algorithm, the master device has the ability to directly read the successive values of the period calculated in seconds.
5. Simulation of the f/N Converter Working in Adaptive Mode
The simulator’s task developed by the author is to perform partial simulations for individual elements of the measurement channel with a frequency carrier of information and to present the final effect of the f/N conversion using the previously discussed processing method. During the simulator operation, the following steps are carried out:
Simulator configuration, setting simulation parameters and test signal parameters;
Simulation of the operation of the X/f converter, preparation of the Txi period table representing the given test signal;
F/N processing using the discussed method;
The reconstruction of the x(t) waveform from the collected numerical values Nxi;
Using the numerical representations of the test signal and the reconstructed signal to calculate the absolute error and relative information processing;
Saving the simulation results under unique names in the form of a text file with data and a graphic file with the visualization of the simulator work results.
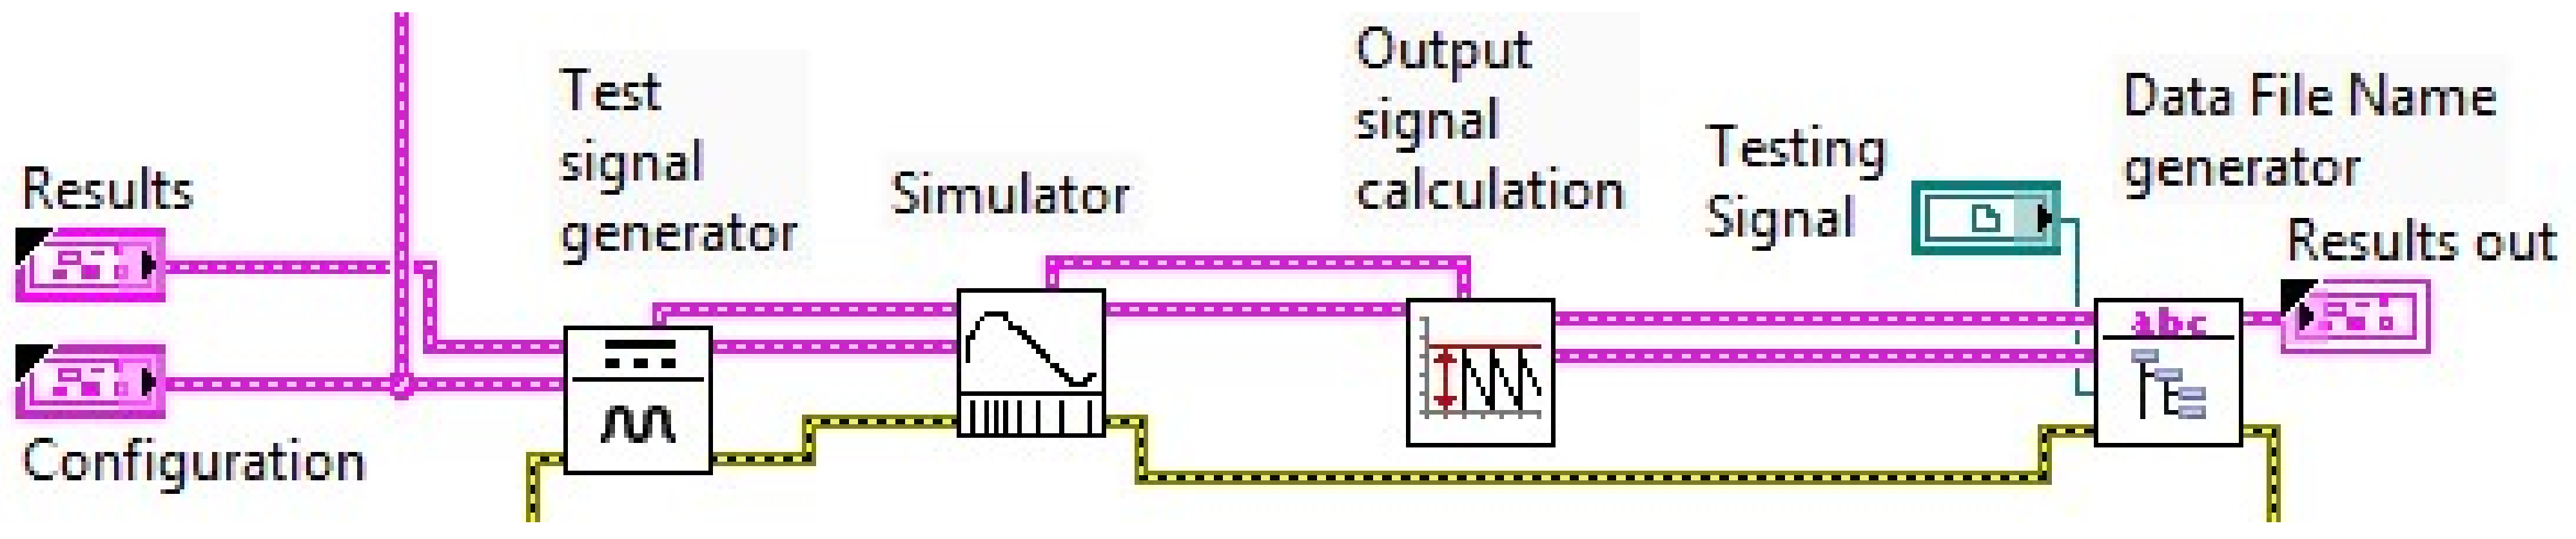
Figure 10 shows the fragment of the application diagram with the presentation of the subroutines that perform the following sequence: creation of the
Txi period table, f/N processing, reconstruction of the
x(
t) waveform, and creation of a unique name of data files containing information about the test signal parameters and simulator application configuration.
Figure 11 shows the fragment of the diagram that realizes the setting of the
Nxi threshold values that trigger the change of the clock signal frequency controlling the operation of the f/N converter counter. The upper Case structure [
21] is activated if the current value of
Nxi is greater than the value of
Nxi max set in the application panel (
Figure 12). Then, the frequency change factor Prec Lo is set (
Figure 11 and
Figure 12). The middle Case structure handles the case where the current numerical value of
Nxi is between the set values of
Nxi min and
Nxi max. Lastly, the lower Case structure handles the signal if the current
Nxi is less than the given value of
Nxi min. Then, the change factor Presc Hi is set.
In addition, on the application panel shown in
Figure 12, one can directly read the maximum and minimum numerical values of
Nxi and check the parameters of the test signal, the setpoint value of the
K conversion constant of the X/f converter, and the minimum and maximum value of the relative error of the test signal processing.
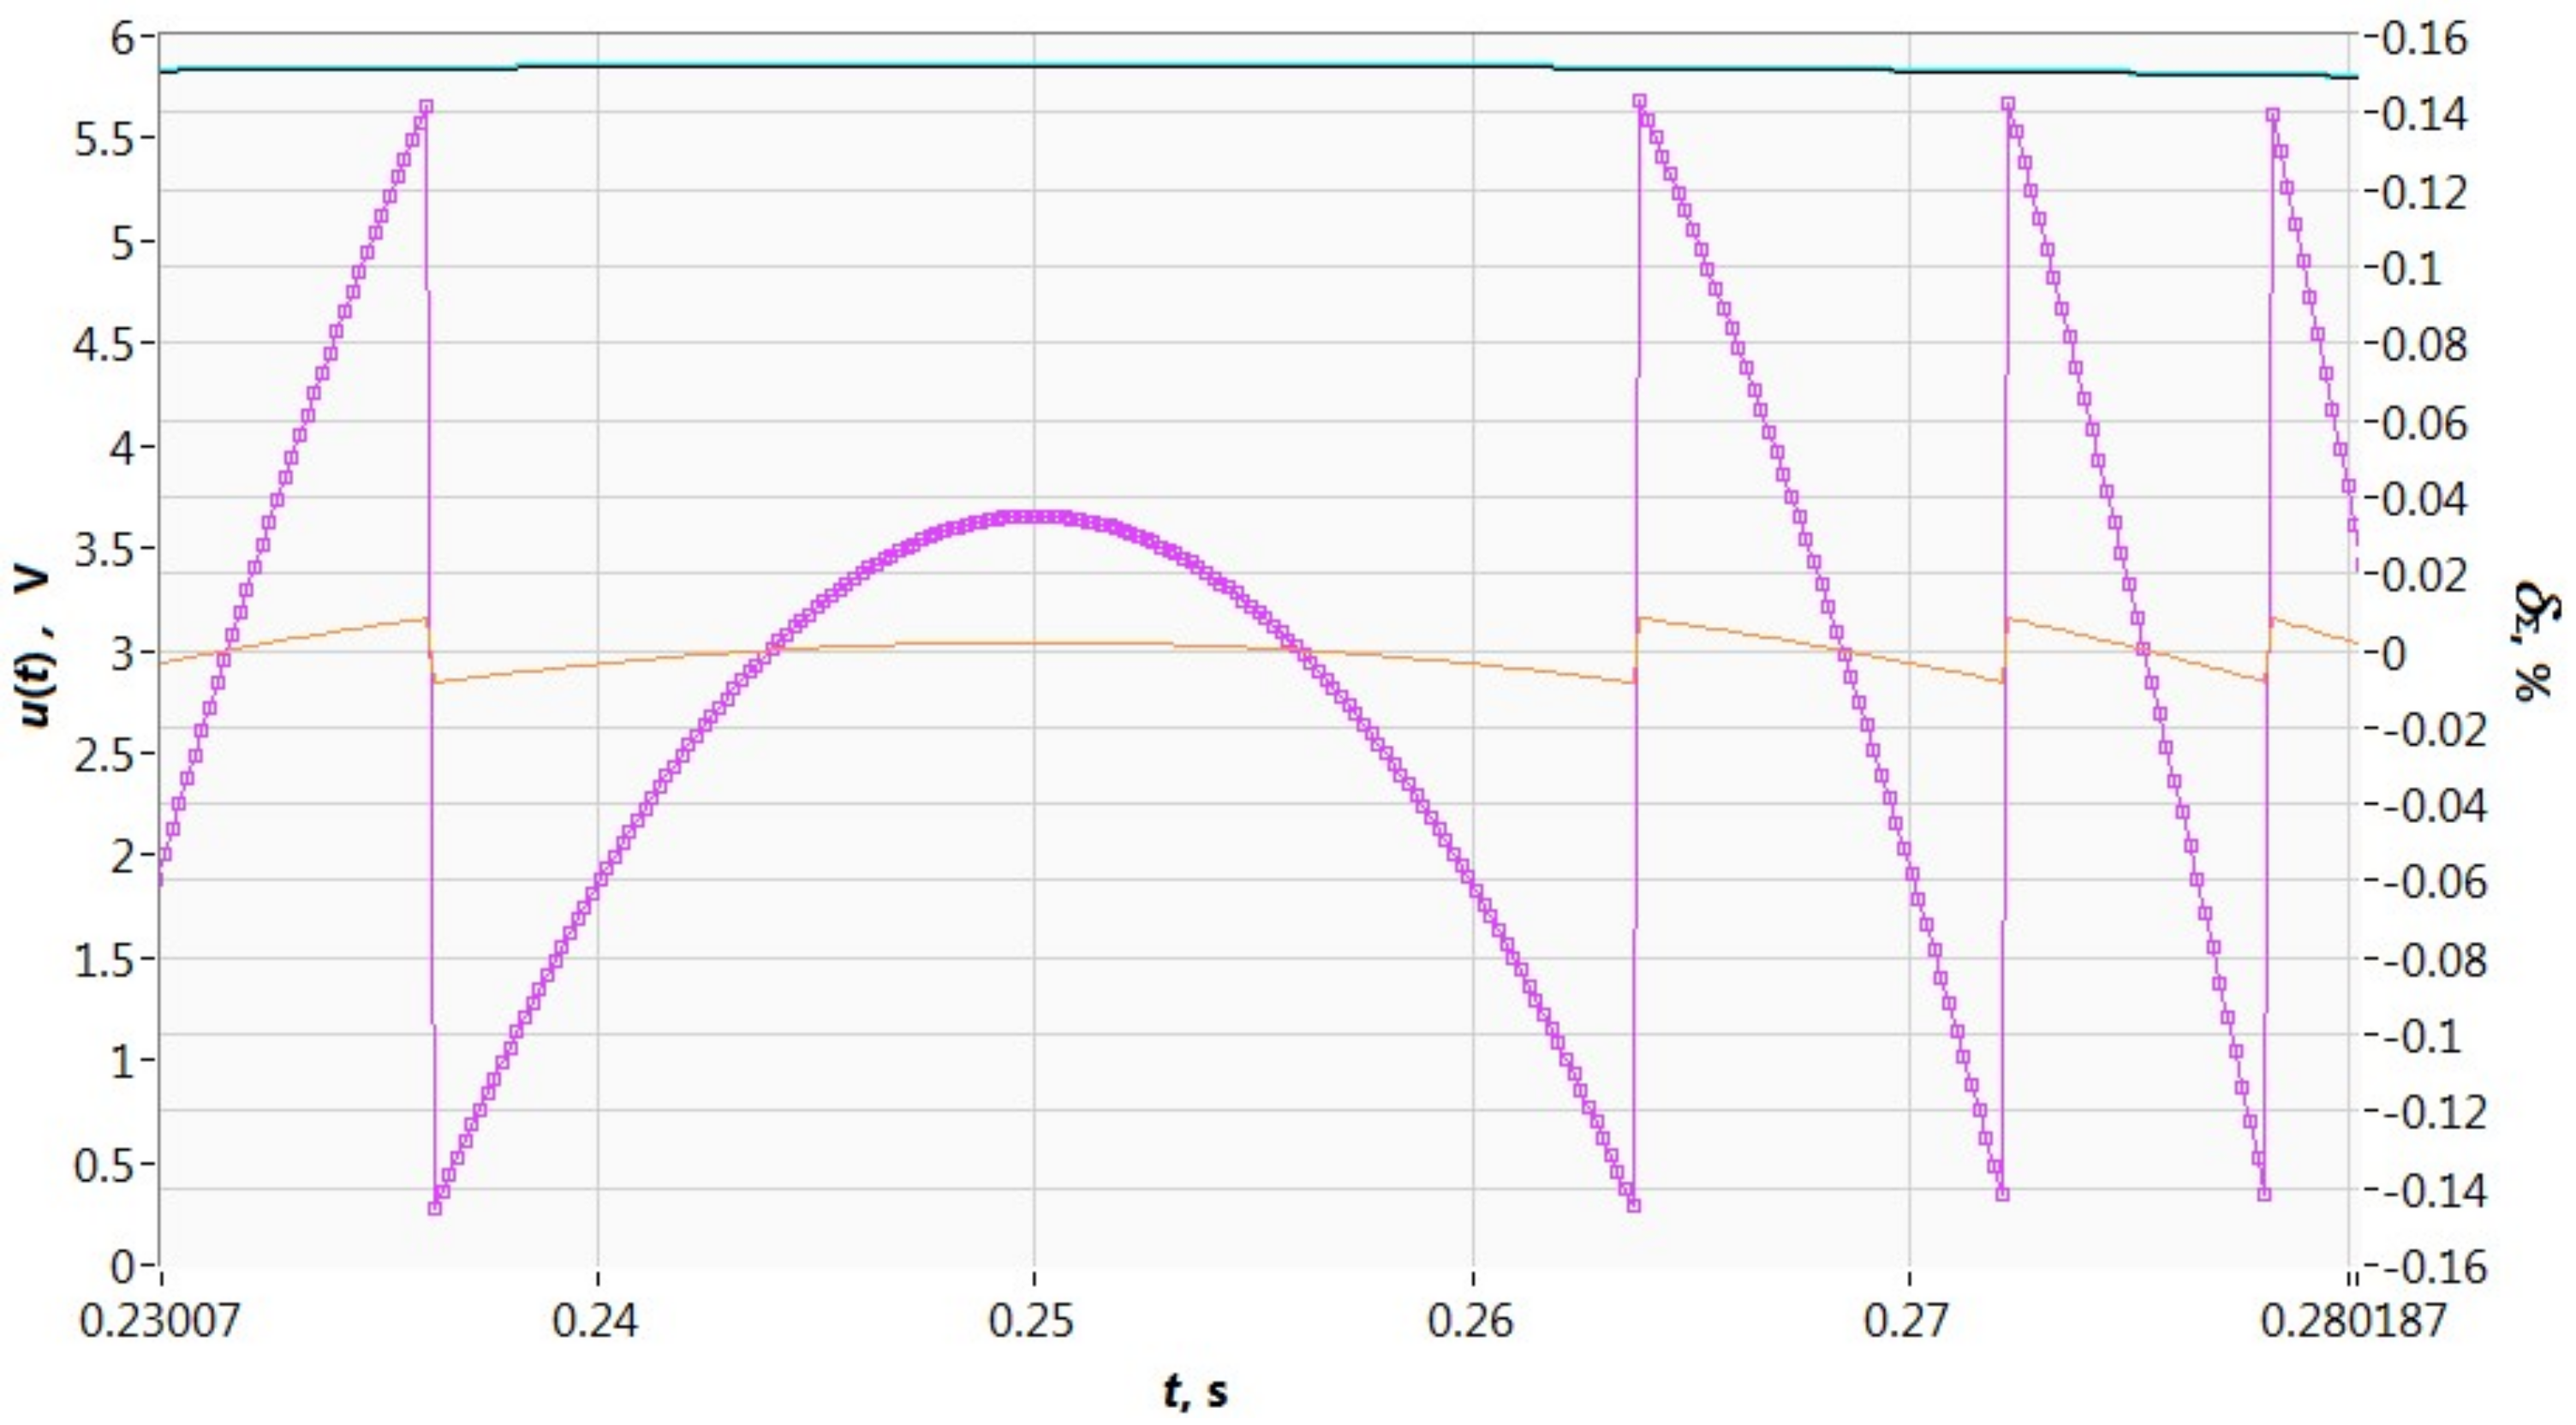
The colors of the curves on the charts denote: black—set waveform, blue—reconstructed waveform, orange—absolute error, purple—relative error.
The operation of an adaptive method for improving the conversion parameters of a “frequency-to-code” converter is discussed using an example of a selected design implementing continuous digital period measurement using a single counter. However, this is not the only possible structure to be used. The method can also be used in alternative structures, realizing measurement with two counters [
8], the method of dependent counting [
35], or any other method [
3,
25,
34] realizing digital period measurement based on determining the product of the numerical value representing the length of the measured period and the length of the period T0 of the clock signal from the reference generator. In these cases, decreasing the T0 will increase the accuracy of determining the period
Txi, while decreasing the T0 will extend the measuring range of the “frequency-to-code” converter in the range of large values of
Txi.
6. Results
In order to carry out the simulation, the calculations necessary for the configuration of the activation thresholds of setting the prescaler module/frequency multiplier were made. The calculations for the selected values of the resultant error δ
∑ were made assuming that the f/N converter uses a clock signal with a frequency of 1 MHz. The calculation results are given in
Table 1.
The numerical values of
Nxi min and
Nxi max are given with two decimal places to accurately present the results. To configure the f/N converter, integer values that round the given values were used. The second column in the table needs an explanation. It represents half the error value in the first column. The reason is that the maximum error in the range of the high input frequencies of the f/N converter occurs during the error transitions from the negative maximum value to the positive error maximum for high frequencies. The problem is shown in
Figure 13. As a result, the
Nxi data representing two states read in the f/N converter counter causes an error with a value close to the double quantization error. Hence, the additional calculation in column 2 of the table appears.
In order to bring the simulation results closer to the real measurement, it was assumed that the test waveform would be a voltage waveform of a sinusoidal shape with a constant component of 3 V, amplitude 2.85 V, and frequency 1 Hz. The simulation assumes that the X/f converter is perfect, and its conversion constant is 1 m V/Hz.
Figure 14 shows the results of the simulation of the test signal processing by an f/N converter using the basic processing method. The effect was in line with the expectations. In the range of the high values of the instantaneous voltage, a very large influence of the quantization error δ
k can be seen. In terms of the smallest instantaneous values of the test signal, a significant influence of the averaging error δ
a is evident. The values of
Nxi represent the test signal ranged from 171 to 6656. The relative error of the information processing was within the range of −0.29% to 0.23%.
Figure 15 shows the first simulation of the adaptive work of the f/N converter. The threshold values for
Nxi min = 400 and
Nxi max = 1400 were set. The waveforms obtained show that the clock generator frequency change in the range of large values is triggered at the wrong level of the
Nxi value. The quantization error was reduced only in a part of the range of higher instantaneous
u(
t) values. In the range of the low voltage values, the adaptive work increased the changes in the processing error, but the maximum error in the discussed range remained unchanged. The instantaneous values of
Nxi varied in the range from 200 to 3328. The information processing error δ
Σ varied from −0.245% to 0.236%.
Figure 16 shows the simulation results of the f/N converter with the error threshold for the upper range voltages at 0.05%, which corresponds to
Nxi min = 1000. The lower range voltage threshold was set at 0.25 × 10
−3%, which corresponds to setting the rounded value of
Nxi max = 1744 (
Table 1). The waveforms show that the threshold values have been chosen significantly better. The quantization error for the upper voltage range was reduced; also, the correction for low instantaneous voltages worked correctly. The values of
Nxi were in the range of 342 to 4034, which shows that it is possible to increase the processing range by increasing the measurable maximum period of
Txi. Compared to the previous simulation, the information processing error δ
Σ has been significantly reduced. Its value was within the range −0.146% ÷ 0.143%.
In summary, it can be stated that increasing f0 for small values of Txi periods reduces the quantization error δk. Increasing T0 for large values of Txi periods causes an increase in the averaging error δa, which forces an increase in the intermediate values of the processing error δ∑ and a decrease in the numerical values of Nxi representing the consecutive periods Txi. However, the threshold value of Nxi max may be chosen such that the maximum processing error for the lower range will not change.
A question may be posed: is it permissible to set the Nxi thresholds arbitrarily? The answer is given by the next two drawings presenting the results of subsequent simulations.
Figure 17 shows the results of the simulation of test signal processing with the threshold
Nxi set in the entire processing range of 171, which forced the f/N converter to work with the clock signal of
f0/2. As a result,
Nxi decreased: it changed in the range of 85 ÷ 3328, but the information processing error δ
Σ increased noticeably. Its value was within the range −0.586% ÷ 0.58%.
Figure 18 shows the opposite. The clock frequency of the f/N converter was set to 2
f0 to simulate the processing in the whole range. As a result, the regularity of the shape of the error curve δ
Σ increased in relation to the simulation shown in
Figure 16; unfortunately, the error value remained at the same level. Doubling the frequency forced the counter to operate faster. The running value of
Nxi changed in the range of 342 ÷ 13313.
It can be concluded that the excessive and arbitrary increase in the frequency of the clock signal generator in the frequency-to-code converter in the incorrectly selected range of processed frequencies of the tested signal increases the demand for the counter capacity and does not give noticeable advantages in accuracy processing.
The presented simulation results for the test signal given in the article positively verify the assumptions of the method and confirm its effectiveness. It is known that the accuracy of processing and the results of information processing in the discussed system depend on the parameters of the signal
x(t) and the counter capacity of the “frequency-code” converter. As the example of the resultant error plot shows (
Figure 5), depending on the frequency of the signal
x(t) and the range of the period change
Txi, different settings will be required to achieve an optimal compromise between the length of the period T0 and the capacity of the counter necessary to process the maximum required period
Txi. For a waveform
x(t) with different parameters, required conversion range, and required f/N converter counter volume, the threshold settings should be calculated each time, taking into account the maximum value of the conversion error occurring for the maximum frequency of the signal
x(t) at the ends of the conversion range of the periods
Txi.
It is reasonable to ask about the practical application of a “frequency-to-code” converter using a counter circuit to process successive periods of a variable frequency signal. The presented structure and method can be used, for example, in the case of the need to process the rotational speed and irregularity of engine rotation by means of a rotary-pulse converter [
36]. Such a circuit directly produces a variable frequency signal. To convert it into a voltage signal for the conversion to digital form by an “analog-to-digital” converter would be to add another processing block generating additional errors. Other examples of transducers that directly produce a variable frequency signal include the string transducer [
37] and the paddle flow transducer [
38]. Moreover, in these cases, the presented direct conversion of frequency into numerical values can be advantageous. Of course, if necessary, the discussed solution can be used to process any variable frequency waveforms, e.g., from the output signals of popular “voltage-to-frequency” transducers.
7. Conclusions
The simulation studies show that the presented method of the adaptive operation of the f/N converter turns out to be effective in improving the operating parameters of the converter. It has been demonstrated that it is possible to select the Nxi threshold values to force a change in the frequency f0 of the clock signal of the f/N converter, allowing to improve the accuracy of processing information about the test signal and to extend the processing range.
Possible problems that may occur with the wrong selection of the Nxi threshold values were indicated. It turned out that a considerable increase in the f0 reduces the quantization error, unfortunately, at the same time, increasing the demand for the capacity of the counter.
It is possible to select the clock period of the f/N converter so that the maximum averaging error does not increase. The increase of period T0 reduces the Nxi values obtained from the f/N converter counter, which allows longer Txi periods to be processed. Generally, increasing T0 allows to increase the lower range of measurable frequencies. The simulation results confirmed the correctness of the theoretical considerations.
The LabVIEW development environment turned out to be useful for the development of an effective and graphically readable simulator application.


