1. Introduction
The proposed measuring system in this paper can be compared to a wireless oscilloscope while maintaining some of its functionality. It is designed for specific applications, in particular, measuring the value of discharges induced by surge generators. It consists of measuring probes and one receiver connected to a computer via a USB port. One receiver can manage 32 measurement probes using dedicated software. It is possible to choose many important parameters, e.g., number of samples, sampling frequency, release voltage, synchronization (e.g., common to all probes from one source). The prototype measurement system allows sampling with a resolution of 16 bit at 20 MSps, which gives a data stream equal to 320 Mbps. A very good representation of the measured signal value is provided by 16-bit resolution. The main criteria for determining the maximum sampling rate were the complexity of the probe, the cost of the components and long battery life (for measurements in places with no power supply). The main goal of the described project is to develop a low-cost measurement system for testing in places exposed to damage (to expensive recording devices). Overvoltage can damage equipment throughout the laboratory. It is possible to perform preliminary measurements while maintaining a high quality of recorded data without the risk of overvoltage. The use of such devices is justified among others during the study of lightning effects, both natural and simulated by specialized impulse generators. The wireless connection ensures separation from the hazard point, ensuring the safe operation of people during measurements. The currently used measurement systems are often based on copper cable connections (coaxial), which are a potential hazard [
1]. Safety is guaranteed by fiber optic systems, which, in turn, are expensive. They have a short working time between charging and are more difficult to carry [
2]. An alternative solution may be the use of the Power over Fiber technology, which allows the use of a single- or multi-fiber optical transmission path with the simultaneous supply of distributed measuring devices [
3]. The limitations of such a system are its efficiency and energy saving [
4]. The advantage of the proposed solution is the resignation from the physical connection of the measuring probe and the recorder. This makes it possible to quickly change the measuring point. There is no limit to the length of the cables or their insulation from the elements of the tested object through which overvoltage may occur.
2. Theory
The study of the impact of lightning discharges is of great importance for the everyday life of people, the operation of facilities and their technical equipment. The frequency of storms depends on the region of the world and on topography. The lightning discharge takes place in the thin core of the channel, formed during the stepped leader stage before the first return-stroke and during the dart leader stages before the next subsequent return-strokes. Therefore, this process can be compared to the flow in a conductor of a fast-varying surge current with a very high peak value in the order of tens of kiloamperes. The effect of this is the propagation of an electromagnetic field in the form of the so-called LEMP (Lightning ElectroMagnetic imPulse) [
5]. The LEMP couples with the conductive transmission lines and induces dangerous overvoltage (
Figure 1). Among others, sensitive electronic systems such as avionics, power grid supervision systems, or various types of measuring and monitoring devices located on telecommunications masts are at risk.
The measurement systems of surge waveforms (naturally and artificially generated) are specialized systems. They enable the recording of fast-changing waveforms with a voltage up to megavolts and a current in the order of a hundred kiloamperes. They must perform measurements with a high sampling frequency due to the nature of lightning phenomena [
6,
7]. Surge waveforms are defined in different standards and they represent discharges in clouds and between cloud and earth. For example, in lightning protection of aircraft, a pulse numbered as WF4 with the waveshape 6.4/69 μs (rise time/time to half-peak on the falling slope), representing the lightning impact, is defined in the DO-160 standard, which is dedicated to immunity tests of avionics [
8,
9]. Therefore, what is needed is a system capable of recording the surge waveforms with the time resolution in the order of hundreds of nanoseconds [
2]. The method of determining the time parameters of the impulse time parameters is shown in
Figure 2. One can find the same definition of rising time and time to half-peak on the falling slope in the lightning protection standard PN-EN 62305-1 [
10] for buildings and the standard for electromagnetic compatibility PN-EN 61000-4-5: 2014-10 [
11].
As mentioned, lightning discharge measurements are recorded using various types of devices [
12,
13,
14]. They are determined by the place, working time and type of the tested signal. Monitoring systems use dedicated solutions [
15,
16,
17]. In laboratories, oscilloscopes are used [
18,
19]. The parameters of these devices allow for the accurate recording of the tested waveform, but they do not always provide protection against interference and overvoltage. Each system uses security measures to ensure the safety of people and equipment, and one must be aware that conducting high-voltage tests is a risk. For lightning resistance tests, standardized waveforms are used as discussed (e.g., avionics). Their measurement is primarily the protection of measuring cables against LEMP [
20].
Another method is computer simulation [
21,
22]. It enables 3D modeling and examination of the same object many times without changing the parameters [
23,
24,
25]. It is a very good solution for protection design. However, a mathematical model is necessary. It can be created in a laboratory by measuring the values tested. [
26] It is also very important to compare the results of experiments and simulations. This allows to determine whether the designed model corresponds to the real object [
26,
27].
Current shunts, Rogowski coils and high-voltage measurement probes are most often used to measure different surge waveforms [
28,
29]. They are used both for recording the lightning current (mainly at stations located at high facilities), as well as during laboratory and field tests using impulse current/voltage generators [
30]. Due to the specificity of lightning discharges (in particular, the stochastic nature and the random location of the occurrence of the phenomenon), systematic research is significantly difficult or, in some cases, even impossible. Therefore, detailed studies of lightning interactions are usually carried out with the use of specialized impulse generators that form repetitive current or voltage surges.
Rogowski coils are used in many research projects, for example: spires of tall buildings and radio masts [
28,
29,
31]. For signal transmission, cable connections are mainly used, but also optical fibers [
32]. The use of a larger number of coils enables the construction of self-powered measuring systems during an atmospheric discharge [
33]. Fiber optic systems are expensive and complex. Changing the place of measurement requires delicacy and caution (the optical fibers are easily damaged) [
2,
32].
To measure overvoltage in power distribution lines, ceramic-capacitor insulators are used. They measure overvoltage and send the measurement results via the GSM network. These are permanently installed systems for monitoring line sections particularly exposed to lightning strikes [
34]. Another group of measuring devices designed to record lightning currents are non-contact systems. Antennas record the magnitude of the magnetic field at a certain distance from the tested object. The current is proportional to the measured intensity [
35]. However, these are systems designed for larger objects and do not allow for precise measurement when there are more than one conductor.
Figure 2.
Pulse of the WF4 type, representing the impact of lightning (DO-160 standard for avionics testing) [
9,
10,
36].
Figure 2.
Pulse of the WF4 type, representing the impact of lightning (DO-160 standard for avionics testing) [
9,
10,
36].
3. Conception of Measuring System
The first example is a fiber optic measurement system with real-time digital data transmission. Optical transmission and effective shielding ensures a galvanic separation (from the measurement point) and resistance to electromagnetic interferences, which can be induced in the measuring connections in the case of the conductive path (
Figure 1). Such a solution allows for obtaining higher accuracy of the conducted measurements [
37,
38].
Another example is an optical fiber system using analog transmission [
39]. The analog-to-digital conversion takes place in the recording device and the measuring probe can be powered by PoF technology. However, analog circuits are sensitive to temperature changes and need to be calibrated regularly [
40]. In a measuring system based on analog transmission strong electromagnetic interference that could disturb the real-time transmission is important to consider. The solution to this problem is to store data (the measurement samples) in the probe’s memory. After the electromagnetic noise ceases, collected samples can be transmitted to the recorder.
The assumptions of the designed measurement system were to enable the observation of the surge pulses in accordance with the international standards. Shannon’s law says that the requirement for the correct reproduction of an analog signal is to ensure a sampling rate greater than twice the maximum frequency of signal harmonic [
41]. As mentioned, a typical rise time of the wave is 6.4 µs, therefore we decided to build a measurement system between 10 and 30 MHz of sampling rate.
To ensure the accuracy of mapping the signal with variable polarization, an 8-bit converter is insufficient. The minimum bit resolution is 12 (for the entire measuring range). Sampling up to 30 MHz while writing 2 bytes means that the control processor has to write 480 Mbps. Therefore, two solutions are possible: microprocessors in the 8-bit architecture working with a high frequency of the clock or 32-bit equipped with an oscillator working twice as slow. It is necessary to record more than 8 bits simultaneously. Note that the maximum clock frequency of a microprocessor does not imply its ability to perform calculations. In each system, there are from one to several instructions per clock tick, and the procedure of reading the value at the input and writing it to the appropriate memory location may take up to several clock cycles. This means that the clock frequency should be selected appropriately higher (multiplied by the number of clock cycles needed to complete the entire recording procedure).
It is not possible to use a ready-made microcomputer due to its dimensions and energy consumption. The measuring system under development must meet the criterion of continuous operation throughout the day, which means that the amount of energy consumption is important. Therefore, a low-level solution should be used: a microprocessor with computing power similar to the need (with the smallest possible number of peripherals). The whole device should be small and compact to allow measurements to be made in any (difficult to reach) place. Therefore, it is not possible to use batteries with very high capacity, so that they do not constitute more than 70% of the volume of the entire device.
The solution to the problem of selecting a microprocessor that meets the criteria of low energy consumption and high operating frequency may be the use of an external RAM. This solution allows transferring the record at high speed to an external system dedicated to this task. The microprocessor is only a supervisor of this process. The memory must be selected in terms of maximum write speed to ensure throughput of 320 Mbps. There are two choices, also depending on the analog-to-digital converter used: serial or parallel communication.
The use of serial communication requires the use of memory and a 480 Mbps converter. This is a significant drawback since it requires a clock within the device to clock a stable signal at such a high frequency. The disadvantages also include the jitter, i.e., the lack of time synchronization between systems operating at high frequency (for communication without confirming the correctness of the transmitted data). The advantage is a single transmission line and no dynamic hazards from parallel connection. The dynamic and functional hazard of the parallel transmission, the second solution, is the generation of errors due to the different path lengths for all transmitted bits [
42]. For the parallel transmission of 2 bytes, it is necessary to provide 16 transmission lines between the ADC and RAM. The different lengths of the paths result in a different propagation time of the signal (for high frequencies and significant length differences), which can lead to a situation where some bits are read from the current data frame and some from the previous (because they arrived late). The use of parallel transmission for the proposed solution has a decisive advantage: it allows to work at a speed of 30 MHz, because 2 bytes are written in the same clock cycle. One really reliable method is good synchronization, which is not applicable in some cases. So circuits should be carefully designed to have equal delays in each path [
18]. The disadvantage, however, is the size of the data bus itself, which occupies a significant area and can cause mutual interference [
43,
44].
It is essential to use a cover to protect the separated area from the influence of an external electromagnetic field. Shielding effectiveness is affected by the physical properties of the metal. These may include conductivity, permeability, solderability, thickness, and weight. Electrically dominant waves are reflected by highly conductive metals (copper or aluminum) but magnetically dominant waves are absorbed/suppressed by a less conductive metal such as steel [
45,
46].
4. Prototype
Taking into account all aspects of the above discussion, a measurement system based on an 8-bit microprocessor (AVR ATmega 1284) working with a system clock with a frequency of 16 MHz (20 MHz in the final version) was proposed. The maximum writing speed of the 2-byte data system itself is 2 MHz (measured), which is insufficient for the assumptions made. It was decided to use the system clock signal to directly trigger both A/D converters and external RAM. This solution allowed to perform sampling with a frequency of 16 MHz. The external integrated circuit type 4040, which is a 12-bit counter, is responsible for addressing the memory cells. Two 8-bit AD9280 converters were used for analog-to-digital conversion, separately for positive and negative signals in relation to the ground. This solution allowed to obtain a resolution of 16 bits, which in combination with 16 MSps ensures good signal mapping (16 samples per 1 μs). For typical surges related to lightning with 6.4 μs rise time, the system records 102 measurement samples, allowing the observation of the wavefront in detail. The presented parameters, compared to a traditional oscilloscope, are not impressive, however, it should be noted that the prototype measuring probe has the dimensions (including battery power for the entire day of testing) 8 × 5 × 5 cm (length/width/height). The dimensions include the housing and batteries, which are not shown in the photo. The close-up shows the integrated circuits and the control microprocessor. The prototype was made on a single-layer board. In the final device, these dimensions can be reduced by twice. Small dimensions and weight allow connecting the measuring probe in any (hard-to-reach) place, without the need to connect the measuring cables. Moreover, this avoids breakdown between different elements through which the partial lightning current flows. A comparison of five different lightning recording systems is presented in
Table 1.
In the developed prototype (
Figure 3), the microprocessor is responsible for supervising the ADC module and RAM work, by setting the direction of information flow on the data bus, and also sets the beginning of the addressing performed by the counter. It does not take part in sampling the signal and saving data to memory. This process, after switching on the “record” mode by the operator, continues cyclically, without interruption. The data is stored in a loop, which allows the signal to be recorded before the onset of the lightning current. The processor records the value of the analog signal at the input and compares it with the predetermined trigger threshold. It indicates when the impulse occurred. From this point on, the microprocessor controls the further sampling time and stops sampling when the memory buffer is full.
This solution allows registering data both before and after the impulse. The range of both buffers is configurable before starting the measurements. Data are read from RAM and then transmitted via the radio system to the recorder (
Figure 4). This is possible by scaling the system clock signal (full speed for writing, slow speed for reading). Adjusting the reading speed to the transmission allows reducing interference and no need to buffer data in the microprocessor memory.
The proposed measuring system has a built-in voltage divider, providing a measuring range similar to a typical oscilloscope (10 Vpp). Range is limited to tests (with the possibility to select the measuring range by using an appropriate divider at the device input).
5. Results
In order to present the operation of the proposed solution, measurements of impulse voltages are presented. To verify the obtained data, they were compared with the readings made by the RIGOL oscilloscope. The first example regards the impulse, which is similar to those defined in DO-160 (WF4 with the waveshape 6.4/69 μs) but is 10 times faster (
Figure 5). The accuracy of the measurement was 85%.
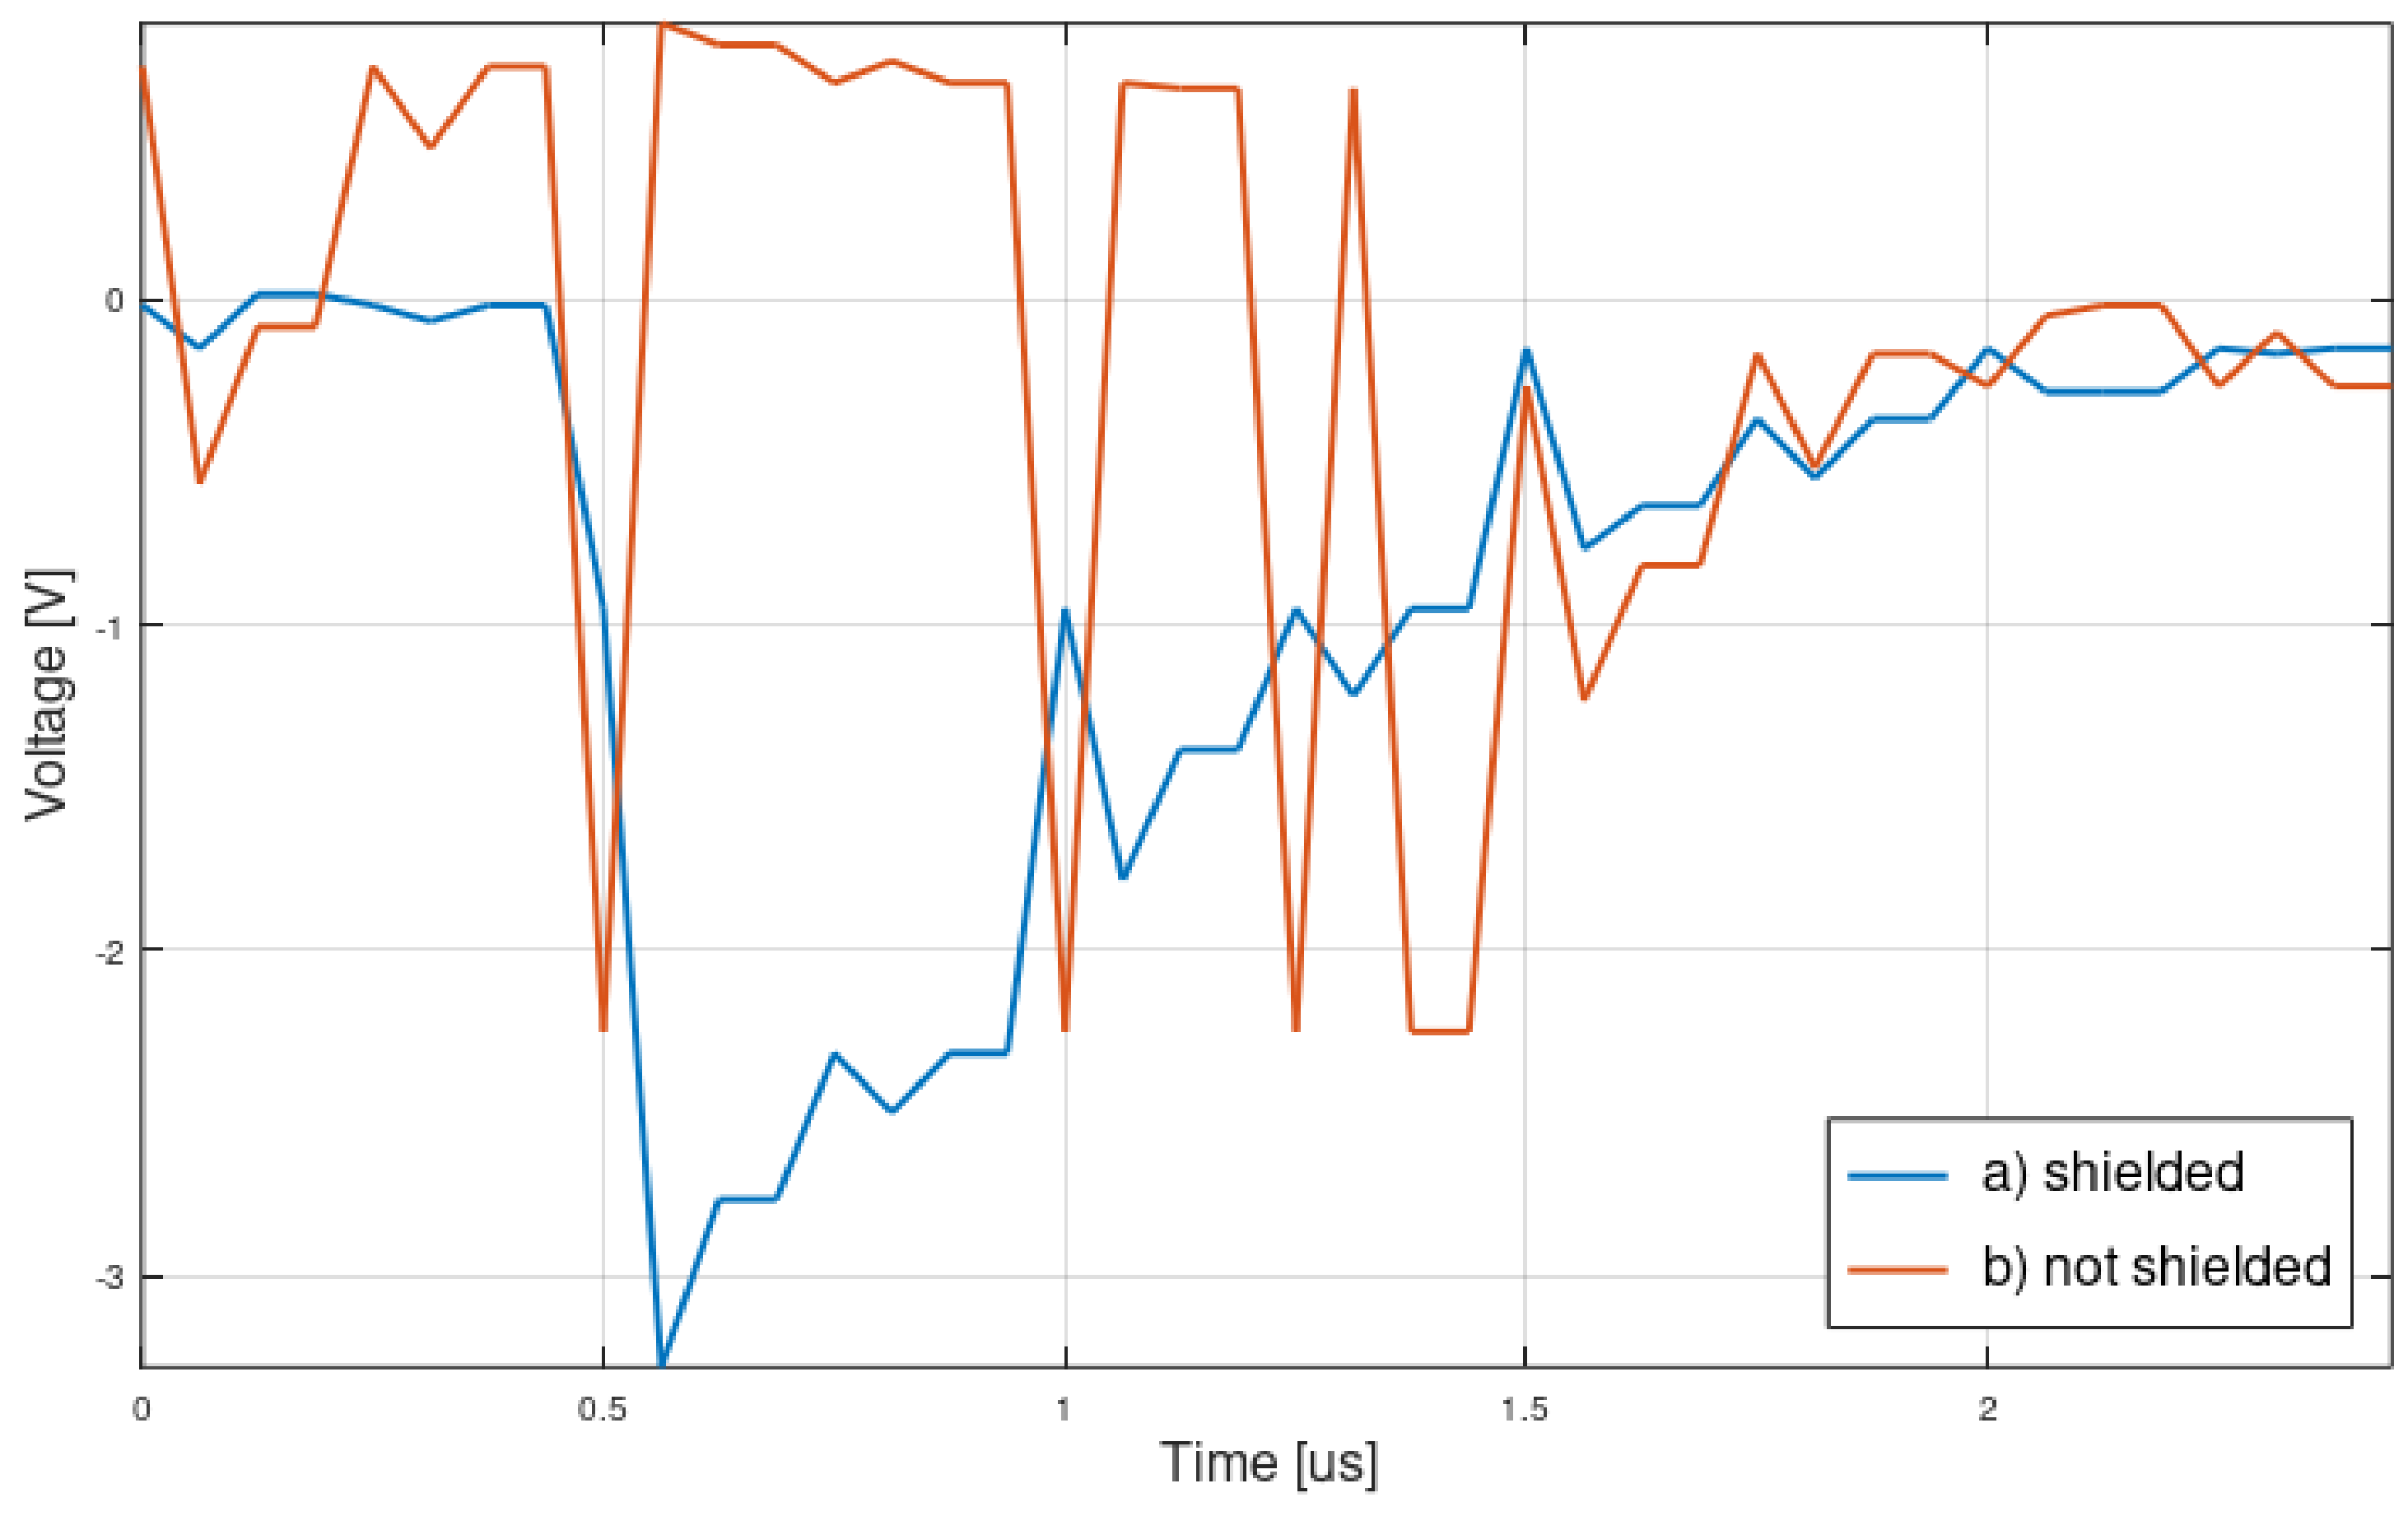
The shape of the tested signal is good. The number of samples allowed to recreate the pulse shape and observe the disturbances. The amplitude of the signals measured with the prototype system was about 10% lower than the reference. This can be corrected by calibrating the device. The influence of electromagnetic disturbances produced by circuits of the impulse generator and propagating in the air was significant, and the shielding allowed for their reduction.
Figure 6 shows disturbances without (the accuracy of the measurement was 66%) and with shielding (the accuracy of the measurement was 85%) using steel cover. The reference signal was presented too, directly from the oscilloscope to compare differences between shapes of impulses. During the selection of the shielding material, 0.5 mm thick aluminum alloy and 1 mm thick carbon steel were tested. For the screen made of steel, a clear reduction of the disturbances in the course of the recorded pulse was observed. For the aluminum screen, the change was less pronounced (
Figure 7) and the accuracy of the measurement was 48%. A combination of both types of materials was also used because aluminum has better absorption properties for the electric component of the field, and steel for the magnetic component of the field [
22]. The effectiveness of shielding is influenced not only by the type of material, but also by its thickness and shape as well as the correct selection of holes required for charging connector [
23]. Due to the lack of space and weight limitations, it is optimal to use a screen with a greater wall thickness made of a material with greater shielding capacity for magnetic radiation. In the existing measurement systems, screening made of steel sheets was used, such as for the discussed optical fiber system (1.5 mm thick walls) [
2].
Significant disturbances are clearly visible in
Figure 8, which shows the registered impulse waveform without and with the shielding enclosure. Their source was the semiconductor switching circuits and other elements being a part of the generator. These disturbances are even more clearly shown in
Figure 9 when the reference signal represents a sine wave with a frequency about 10 times greater than the maximal frequency in the signal spectrum depicted in
Figure 6, and 100 times greater than in the WF4 type signal. With such a high frequency signal, the capabilities of the proposed measuring system were clearly visible. A negative polarity was chosen to verify the correctness of the measurements for the entire measuring range. Interference without shielding of the tested device prevents correct measurements.
Periodic disturbances are clearly visible in the sine wave. On the rising edge, they have a positive component (amplitude gain) and for the falling edge they have a negative component (they reduce the signal) as shown in
Figure 9. The measurements were made for the maximum sampling frequency and sinusoidal signal with a frequency of 300 kHz. The accuracy of the measured signal was not tested. This example was intended to show generator noise and propagation in the environment.
The influence of the measuring probe grounding on the intensity of the electromagnetic disturbance in the measured impulse was also verified. When measuring surge discharges, it is very important to ground all components of the measurement system. This ensures noise reduction. In the configuration with the earthing system, a steel casing connected to the protective conductor (PE) of the TN-C-S electrical system was used (
Figure 10). The lower disturbance absorption capacity of the steel cladding made it possible to show the differences. In the absence of a ground connection, the interference was greater. The repeatability of the disturbances was proof that their source was the pulse generator circuits. The best solution would be to connect the aluminum and steel housing with the grounding of the measuring probe during the measurements (locally at the test point).
Another signal that was chosen for testing the proposed measured system was a damped sine wave with a frequency of 2.5 MHz, shown in
Figure 11. The accuracy of the measurement was 78%. It should be noted that this was a much higher frequency than the one for which the system was designed. The example showed the system’s measurement capabilities for various waveforms with much higher frequencies than assumed.
The comparison of the reference waveforms and the measured waveforms registered by the proposed measuring system is also shown in
Figure 11. The consistency of obtained results guaranteed a proper measurement of atmospheric disturbances related to the lightning current effects, the spectrum of which contained frequencies by two orders lower. This test showed correct measurements for zero crossing signals (common point for the two analog-to-digital converters).
6. Discussion
The operation of a prototype measuring system for recording lightning current effects, both natural and simulated using impulse generators, was presented in the paper. The main advantage of the presented device is to save the data in the place where measurements are made, and then, to transmit the stored data via the radio channel just after the electromagnetic interference propagating in the environment reaches the acceptable level. The results of the study can be summarized as:
This solution is resistant to induced overvoltage, LEMP, and it provides galvanic separation, which results in greater convenience of use compared to the systems using coaxial cables or optical fibers.
The voltage/current measurement accuracy compared to the oscilloscope (reference device) is 85%. This value provides a good representation of the recorded mileage (work on improving this value is ongoing).
It was possible to develop a measurement system with a very good representation of the signal value (16 bits of resolution) with a sampling rate of 16 MS/s. This device was designed to work with lightning generators where waveforms up to 500 kHz are used.
This is a very specific application that allows you to quickly change the measurement site (without cables in which interference propagates) and the joint operation of many measurement probes without the need for power supply.
There are many applications of the proposed solution: working in the open space, measuring objects in motion, the possibility of mounting the device on a drone or a weather balloon. The device can be used for measurements in aviation, construction, automotive, wind farms, telecommunication masts and many others.
There is the possibility to select the measuring range by using an appropriate divider at the device input.
The most important aspect is to protect the life and health of researchers. The prototype also protects expensive measuring equipment against unexpected surges.
Note that the cost of the proposed device is a small part of the entire registration system. Consequently, in the developed device, it was decided to use independent integrated circuits performing specific tasks. This required designing a device consisting of many interdependent elements. As shown, the length of the paths and the control of information flow across the parallel data line were important. It was a difficult design task, completely different from FPGA programmable single-chip structures. The choice of a device made of many components allowed for easier repair and diagnostics in the event of failure. The presented measurement data recorded with the developed device showed how important are the proper shielding and earthing of the measuring probe. The presented registration results showed the need for further work on improving the device in order to increase the accuracy of the measurements. The performed analyses will allow for the development of even more functional recording systems in the near future, which can be used to study the effects of lightning current on both avionics systems and electrical installations in ground facilities. In fact, the tested system should be suitable for quick verification of initial measurements, when the course of the experiment is not yet fully known and controlled. The narrow practical application of the proposed device can be successfully extended by using other analog-to-digital converters. Measurements in motion can enable the device to work where it has been impossible so far (enabling new forms of research).


