Article

Effects of Workers Exposure to Nanoparticles Studied by NMR Metabolomics

by
Štěpán Horník
1,2,†,
Lenka Michálková
1,2,†,
Jan Sýkora
1,*,
Vladimír Ždímal
1,
Štěpánka Vlčková
3,
Štěpánka Dvořáčková
4 and
Daniela Pelclová
3,*
1
Institute of Chemical Process Fundamentals of the CAS, Rozvojová 1/135, 165 02 Prague, Czech Republic
2
Department of Analytical Chemistry, University of Chemistry and Technology Prague, 166 28 Prague, Czech Republic
3
Department of Occupational Medicine, First Faculty of Medicine, Charles University in Prague and General University Hospital in Prague, Na Bojišti 1, 128 00 Prague, Czech Republic
4
Department of Machining and Assembly, Department of Engineering Technology, Department of Material Science, Faculty of Mechanical Engineering, Technical University in Liberec, Studentska 1402/2, 461 17 Liberec, Czech Republic
*
Authors to whom correspondence should be addressed.
These authors contributed equally to this study.
Appl. Sci. 2021, 11(14), 6601; https://doi.org/10.3390/app11146601
Submission received: 7 June 2021 / Revised: 13 July 2021 / Accepted: 14 July 2021 / Published: 18 July 2021

Abstract

:
In this study, the effects of occupational exposure to nanoparticles (NPs) were studied by NMR metabolomics. Exhaled breath condensate (EBC) and blood plasma samples were obtained from a research nanoparticles-processing unit at a national research university. The samples were taken from three groups of subjects: samples from workers exposed to nanoparticles collected before and after shift, and from controls not exposed to NPs. Altogether, 60 1H NMR spectra of exhaled breath condensate (EBC) samples and 60 1H NMR spectra of blood plasma samples were analysed, 20 in each group. The metabolites identified together with binning data were subjected to multivariate statistical analysis, which provided clear discrimination of the groups studied. Statistically significant metabolites responsible for group separation served as a foundation for analysis of impaired metabolic pathways. It was found that the acute effect of NPs exposure is mainly reflected in the pathways related to the production of antioxidants and other protective species, while the chronic effect is manifested mainly in the alteration of glutamine and glutamate metabolism, and the purine metabolism pathway.

1. Introduction

Nanoscience and nanotechnology have been developing rapidly in recent years, especially in new materials for electronics and optoelectronics fields, for energy technology, and in technology fields related to medical products, particularly for diagnostics and drugs delivery systems. The increased use of nanoparticles has raised concerns in many areas including the environment, human public health, consumer safety, and occupational safety and health [1,2]. Nanoparticles (NPs) are defined as particles with one or more dimensions at the nanoscale, less than 100 nm. The physiological response to NPs and the potential adverse effect on human health requires further research since contact with NPs is becoming a common part of everyday life. In recent years, numerous toxicity studies have assessed the hazard of NPs exposure [2,3,4,5,6,7,8,9,10,11,12,13,14]. In general, several health issues were associated with NPs including allergy, injury of epithelial tissue, inflammation, and oxidative stress response [1,2,3,6,10,11,15,16]. The mechanisms of NPs’ biological interaction may vary according to the chemical composition, size, shape, bulk chemical composition, solubility, dose, etc. Moreover, NPs may show an increased toxicity when compared to larger particles of the same chemical composition that are little or even non-toxic by themselves [2,10,16,17].
For humans, inhalation is probably the most common way of NPs access followed by oral and dermal routes of exposure. Inhaled NPs can be deposited throughout the human respiratory system including pharyngeal, nasal, transbronchial and alveolar regions, depending on the particle size. The fractional deposition efficiency of particles below 100 nm is in the range of 30–70% in pulmonary regions, and the alveolar deposition increases as the size of NPs decreases [2,16,17,18]. After deposition in the respiratory tract, NPs may penetrate through membranes and thus enter the blood, pulmonary interstitium, brain, liver, heart, spleen and possibly to the foetus in pregnant females. Since NPs can have the same dimensions as some biomolecules, such as proteins and nucleic acids, adsorption and subsequent disruption of their structure are also possible [2,3,10,11,19].
The existing toxicological methodology for NPs still requires further adjustment to properly assess the risks, including the transport and distribution of NPs in the human body and the mechanism of interaction at the subcellular and molecular level, and to extrapolate the results from in vitro and animal models experiments, which may explain the human health deterioration. Another challenge of this field is to find a fast, specific and sensitive way to evaluate occupational risk. So far, the number of human studies is very limited. As the main exposure to NPs takes place via inhalation and the respiratory system is the primary afflicted organ system, collection and analysis of exhaled breath condensate (EBC) is the most frequently used non-invasive technique for assessment of a subject’s condition. EBC contains, besides water, a small proportion of inorganic ions, small organic molecules, proteins and other macromolecules. Analysis of EBC enables the determination of important biomarkers as a response to current physiological conditions [20].
Recently, two toxicological studies were performed on a cohort of 20 workers exposed to NPs during their occupation [12,13]. A detailed analysis of lung function parameters obtained by spirometry revealed a significant decline of forced expiratory volume (FEV1) and its ratio to forced vital capacity (FVC) when compared to the pre-shift values or to the control group. These data were accompanied by LC-MS analysis of inflammation markers in EBC. The levels of pro-inflammatory markers LTB4, LTD4, LTE4, IL 9 and TNF were found to be increased in the worker group relative to controls. On the other hand, the levels of anti-inflammatory LXB4 and IL 10 were lower in the worker group than in controls. Moreover, the levels of the TNF (tumour necrosis factor) found in the pre-shift samples were positively correlated with the duration of employment in the NPs processing workshop [13]. LC-MS analysis was also targeted at markers of oxidative stress. The oxidation of lipids was evaluated from the levels of malondialdehyde (MDA), 4-hydroxy-trans-hexenal (HHE), 4-hydroxy-trans-nonenal (HNE), C6–C13 aldehydes, and 8-isoprostane; oxidative damage of nucleic acids from levels of 8-hydroxyguanosine (8-OHG), 8-hydroxy-2-deoxyguanosine (8-OHdG), and 5-hydroxymethyl uracil (5-OHMeU); oxidation of proteins from levels of o-tyrosine (o-Tyr), 3-chlorotyrosine (3-ClTyr), and 3-nitrotyrosine (3-NOTyr). A statistically significant increase was observed for all markers of lipid oxidation in post-shift samples relative to pre-shift ones, while the markers of oxidation of nucleic acids and proteins were found already significantly elevated in the pre-shift EBC samples, and no further increase was observed in the post-shift samples [12]. Both studies suggested lung impairment at the molecular level induced by oxidative stress associated with NPs exposure. However, the adverse effects were attributed rather to NPs in general than to specific chemical composition of NPs.
In this study, the EBC and blood plasma samples of the same cohort were analysed by 1H NMR spectroscopy and processed by means of multivariate statistical analysis. It has already been shown that such NMR-based metabolomics can be advantageously used in NPs toxicology studies [1,11,21,22,23,24,25,26,27,28] reflecting the molecular changes induced by NPs inhalation. The samples studied here were examined as pre-shift and post-shift and were compared to controls. The main goal of this study was to assess the acute and chronic effect of NPs occupational exposure.

2. Materials and Methods

2.1. Workplace and Process Description

Subjects of the study were recruited at a research and development unit at a national research university, where a new thermoplastic or reactoplastic composite material was being developed. In the workplace, three different operations are performed, specifically, welding on metal surfaces, smelting of mixtures containing nanoadditives, and machining of the finished nanocomposite. A chemical analysis of aerosol generated in the working environment showed Fe, Mn and Si as the most abundant elements [12]. Aerosol mass concentration ranged from 0.12 to 1.84 mg/m3 during nanocomposite machining processes. Median particle number concentration ranged from 4.8 to 105 × 106 particles/m3 with the particle size ranging from 25 to 860 nm [12].

2.2. Subject Recruitment and Sample Collection

The samples were collected from 20 nanocomposite workers (15 men, 5 women; age 29–63, average 42 years; 1 smoker, 19 non-smokers) and from 20 control subjects living in the same district but working only in an office without any contact with NPs (13 men, 7 women; age 20–66, average 43 years; 2 smokers, 18 non-smokers).
The EBC and blood plasma samples from nanocomposite workers were collected twice during the workday, pre-shift (i.e., before 2.5 h exposure to NPs) and post-shift (i.e., after NPs exposure). The examinations are referred to as pre-shift and post-shift. Beside the NP exposed workplace, the rest of the 8-hour shift was spent in the office. The controls were examined only once during the same time frame as the workers.
The pre-shift samples were used to study the subacute/chronic effect on the subjects of exposures in previous days. Comparison of the pre-shift and post-shift samples was intended to evaluate the acute effect of exposure during the shift.
All subjects were asked questions from a standardized questionnaire which summarized information on personal and occupational history, medical treatments, dietary habits, smoking habits, and alcohol intake (Table S1, Supplementary Materials). Participants underwent a physical examination, followed by the collection of biological samples—exhaled breath condensate and blood plasma.
This study has been approved by the Ethics Committee of the 1st Medical Faculty, Charles University. All procedures were performed following the Helsinki Declaration and the Collection Law of the Czech Republic. All participants signed an informed consent.

2.3. EBC Collection

EBC samples were collected using an Ecoscreen Turbo DECCS device (Jaeger, Hochberg, Germany) equipped with a filter. All subjects breathed tidally for 15 min through a mouthpiece connected to the condenser (−20 °C) while wearing a nose-clip. A minimum volume of exhaled air of 120 L was monitored via the EcoVent device (Jaeger, Wurzburg, Germany). The sample collection took approximately 15 min. All samples were immediately frozen and stored at −80 °C.

2.4. Blood Plasma Collection

Venous blood (9 mL) from the subjects studied was collected using sterile blood collection tubes with heparin as an anticoagulant. The plasma fractions were obtained by centrifugation at 15,000 g for 10 min and immediately frozen and stored at −80 °C.
For more details on the subjects’ cohort, working environment, analysis of NPs composition and properties, see previous publications [12,13]. A follow-up of the researchers in 2017 and 2018 confirmed the results from 2016 [29].

2.5. Sample Preparation

Samples were thawed at room temperature. For preparation of EBC and blood plasma samples for 1H NMR analysis, the following operation procedures were determined.

2.6. EBC Sample Preparation

An aliquot of 500 µL of EBC was mixed with 100 µL phosphate buffer (0.1 mol/L1, pH = 7.4, 0.1 mol/L1 sodium salt of trimethylsilyl-2,2,3,3-d4-propionic acid (TSP), 38 mmol/L1 NaN3). Thus, sufficient sample volume for NMR analysis was obtained and pH was adjusted to 7.7.

2.7. Blood Plasma Sample Preparation

Aliquots of 350 µL of blood plasma were centrifuged through an Amicon 3-kDa cut-off filter (Merck, Germany) for 30 min at 14,000 rpm to isolate low-molecular metabolites. Subsequently, the filtrate was mixed with 350 µL phosphate buffer in D2O (0.1 mol/L1, pH = 7.4, 0.1 mol/L1 sodium salt of trimethylsilyl-2,2,3,3-d4-propionic acid (TSP), 38 mmol/L1 NaN3). Thus, sufficient sample volume for NMR analysis was obtained and pH was adjusted to 7.4.

2.8. Acquisition

One dimensional proton NMR spectra for all EBC and plasma samples were acquired using a Varian INOVA 500 MHz spectrometer (Varian Instruments Inc., Palo Alto, CA, USA) operating at 499.87 MHz, equipped with Ultra Shim System II. A 5 mm probe with inner 1H coil was used to maximize the sensitivity. Prior to the analysis, samples were kept for at least 10 min inside the NMR probe for temperature equilibration (298.15 K). The 1H NMR spectra of EBC and plasma samples were obtained using wet1D and tnnoesy pulse sequence, respectively. Spectral width covered 8 kHz using 2.7 s acquisition time. A relaxation delay of 4 s and 2 s was used for EBC and plasma samples, respectively. The final spectrum resulted from an accumulation of 1000 scans. Representative 1H NMR spectra can be found in Figures S1 and S2 in the Supplementary Materials.

2.9. Data Processing

The Fourier-transform spectra were manually corrected for phase and baseline distortions using Chenomx NMR Suite 8.0 (NMR Suite program, Edmonton, Alberta, Canada [30]). The experimental spectrum was referenced to TSP. The solvent signal residuum was subtracted, TSP signal linewidth was determined, and pH was set.
Compound profiling was performed in the Chenomx Profiler by precise fitting of the compounds from the Chenomx library to the experimental spectrum. In EBC samples, 15 metabolites were identified, while 58 metabolites were identified in blood plasma samples. Since only 15 metabolites were quantified in the EBC, binning was used for EBC spectra to obtain more variables per sample. The binning was applied to each spectrum in the range 0.7–8.6 ppm, except for the region containing residual water signal (4.1–5.6 ppm). Standard bin size of 0.02 ppm was used, yielding 320 bins.
The concentration data from plasma samples were normalized to the total concentration sum to reduce the effects of sample dilution prior to statistical analysis. Total area normalization works well in biofluids, in which overall concentrations of metabolites are almost constant among the samples, such as blood plasma or urine [31]. However, normalization to the total area is not recommended in the case of EBC samples because of large differences in dilution [32]. Hence, PQN normalization was used for the EBC samples as a more robust type of normalization [33].

2.10. Statistical Analyses

All data analyses were performed using the open-source software R [34] and Metaboanalyst 5.0 [35]. Multivariate data analyses were conducted on processed concentration data and binned data separately. As a first step of statistical analysis, principal component analysis (PCA) was used to provide preliminary insight on the data complexity, trends of grouping or identifying outliers. Subsequently, orthogonal partial least squares discriminant analysis (OPLS-DA) was used for sample classification. Multilevel partial least squares analysis (mPLS) was used in the case of comparison of the pre-shift and post-shift samples [36]. All reported values of accuracy, sensitivity, and specificity were assessed by means of 100 cycles of a Monte Carlo cross-validation scheme where 90% of the samples were randomly selected at each iteration as a training set to build the model; the remaining 10% were subsequently tested on performance characteristics for the classification.
In order to identify the most influential and statistically significant compounds, the Wilcoxon rank-sum test and its paired version, the Wilcoxon signed-rank test, were used. Obtained p-values were adjusted for multiple comparisons using the Benjamini and Hochberg correction [37]. The threshold of adjusted p-values was set to <0.05 for statistical significance. Fold change was performed following the general formula defined as a logarithm of base 2 of a division of a median concentration of an individual compound in one group by a median concentration of an individual compound in the other group. The result is projected in logarithm to base 2 scale.
Altered metabolic pathways were detected using Metaboanalyst 5.0 using the metabolite ID taken from the Human Metabolome Database. Metabolic pathway analysis was performed on blood plasma metabolic profiles to reveal the biological impact of NPs inhalation. A plot of affected pathways contained 43 nodes, each representing one pathway, with colour and size coding corresponding to pathway significance and its impact, respectively. The significance was generated from betweenness centrality and out-degree centrality measurements. The pathway impact was generated by the summation of importance measures of matched metabolites to all metabolites present within the pathway.

3. Results and Discussion

In this study, 1H NMR spectra of 60 exhaled breath condensate (EBC) samples and 60 blood plasma samples were analysed. The samples originate from a research nanoparticles-processing unit at a national research university. The samples were taken from three groups of subjects: (i) samples from workers exposed to nanoparticles (NPs) collected before shift (pre-shift, 20 EBC and 20 blood plasma) and (ii) after shift (post-shift, 20 EBC and 20 blood plasma), and (iii) a control group of subjects not exposed to NPs (controls, 20 EBC and 20 blood plasma). The pre-shift and post-shift samples were collected from the same individuals. Individual groups are defined in Materials and Methods. A comparative study of the pre-shift and control samples was applied to reveal a subacute/chronic effect of NPs exposure, while the comparison of the pre-shift and post-shift samples should reflect the acute effect on the workers’ health.

3.1. Exhaled Breath Condensate

Since exhaled breath condensate is composed of 99.9% water, the other constituents are rather diluted. For this reason, quantitative analysis of 1H NMR spectra using the Chenomx reference library provided only 15 metabolites. Due to the limited number of metabolites quantified, a meaningful multivariate statistical analysis cannot be performed on such a dataset. However, univariate statistical analysis identified some of the metabolites as statistically significant for discrimination of the groups studied. A Wilcoxon rank-sum test showed that pre-shift and post-shift EBC samples are mainly characterized by significantly elevated levels of acetoin and propionate, and decreased acetone, isopropanol and lactate levels when compared to control samples (Table S2, Supplementary Materials). On the other hand, an increase in dimethylamine and decrease in acetoin are the most significant changes induced by NPs exposure as observed in comparison of pre-shift and post-shift EBC samples (Figure 1).
Final group discrimination analysis was performed using binning data. Fingerprinting of individual 1H NMR spectra provided 320 bins which subsequently served as an input into multivariate statistical analysis. Principal component analysis (PCA) of all binned spectra did not show any significantly outlying sample. It also indicated certain trends in group separation; however, a clear discrimination was not achieved (Figure S3, Supplementary Materials). Satisfactory group separation was achieved by orthogonal partial least squares discriminant analysis (OPLS-DA), which was applied to the pre-shift and control group to reveal the chronic effect of NPs exposure and to the pre-shift/post-shift and post-shift/control group to uncover the acute effect.
An excellent separation between the pre-shift and control group was achieved using three components. The model was characterized by 81.4% sensitivity, 94.8% specificity and 88.1% accuracy after Monte Carlo cross-validation (Figure 2a). Similarly, the separation of post-shift and the control group was achieved using a seven-component model yielding 88.7% accuracy, 93.9% sensitivity and 83.5% specificity after Monte Carlo cross-validation (Figure 2b).
The bins contributing significantly to the group separation were identified from OPLS-DA loadings provided by Metaboanalyst. These bins show increased EBC concentration of acetoin, acetate and propionate in the pre-shift and post-shift samples when compared to the controls. Mainly increased signal intensities of alcohols were found in controls. These findings correspond well with the statistically significant compounds identified by univariate statistics as discussed above (Figure 1).
The comparison of the pre-shift and post-shift groups should reveal the acute effect of NPs exposure. The performed OPLS-DA provided a very good discrimination of the two groups using six components with accuracy of 83.1%, sensitivity of 84.1% and specificity of 82.1% after Monte Carlo cross-validation (Figure 3a). As both groups consist of the same 20 subjects whose samples were collected before and after the shift, a pairwise multilevel partial least squares (mPLS) analysis can be applied [36]. Compared to other PLS analyses, mPLS does not focus on investigation of the studied groups as a whole, but rather observes changes in each individual before and after the stimulus of the change and reflects the changes occurring within the same subject. The mPLS analysis showed a satisfactory discrimination of the two groups using three components with 82.0% accuracy after Monte Carlo cross-validation (Figure 3b). Although the OPLS and the mPLS models show similar accuracy, the mPLS model requires fewer components.
The bins responsible for the group separation correspond to acetoin, which was found increased in the pre-shift group, and to lactate, formate and unsaturated chains of higher carboxylic acids increased in the post-shift group. This is in agreement with the statistically significant compounds identified by univariate statistics (Figure 1).
Acetoin is a commonly identified metabolite in EBC [38,39,40] as a product of the detoxification process of acetaldehyde [41].
Since dimethylamine was found increased only in the post-shift group, it is probable that it may be associated with the acute effect of NPs exposure.
The increased levels of short-chain fatty acids such as acetate, propionate and butyrate in NPs exposed groups in comparison to the control group could be attributed to involvement in the regulation of several leukocyte functions such as eicosanoids and cytokines/chemokines production [38]. Propionate is associated with lipid metabolism [39], which was also found affected by chronic exposure to NPs [12]. Boxplots of selected metabolites affected by NPs exposure are depicted in Figure 4.

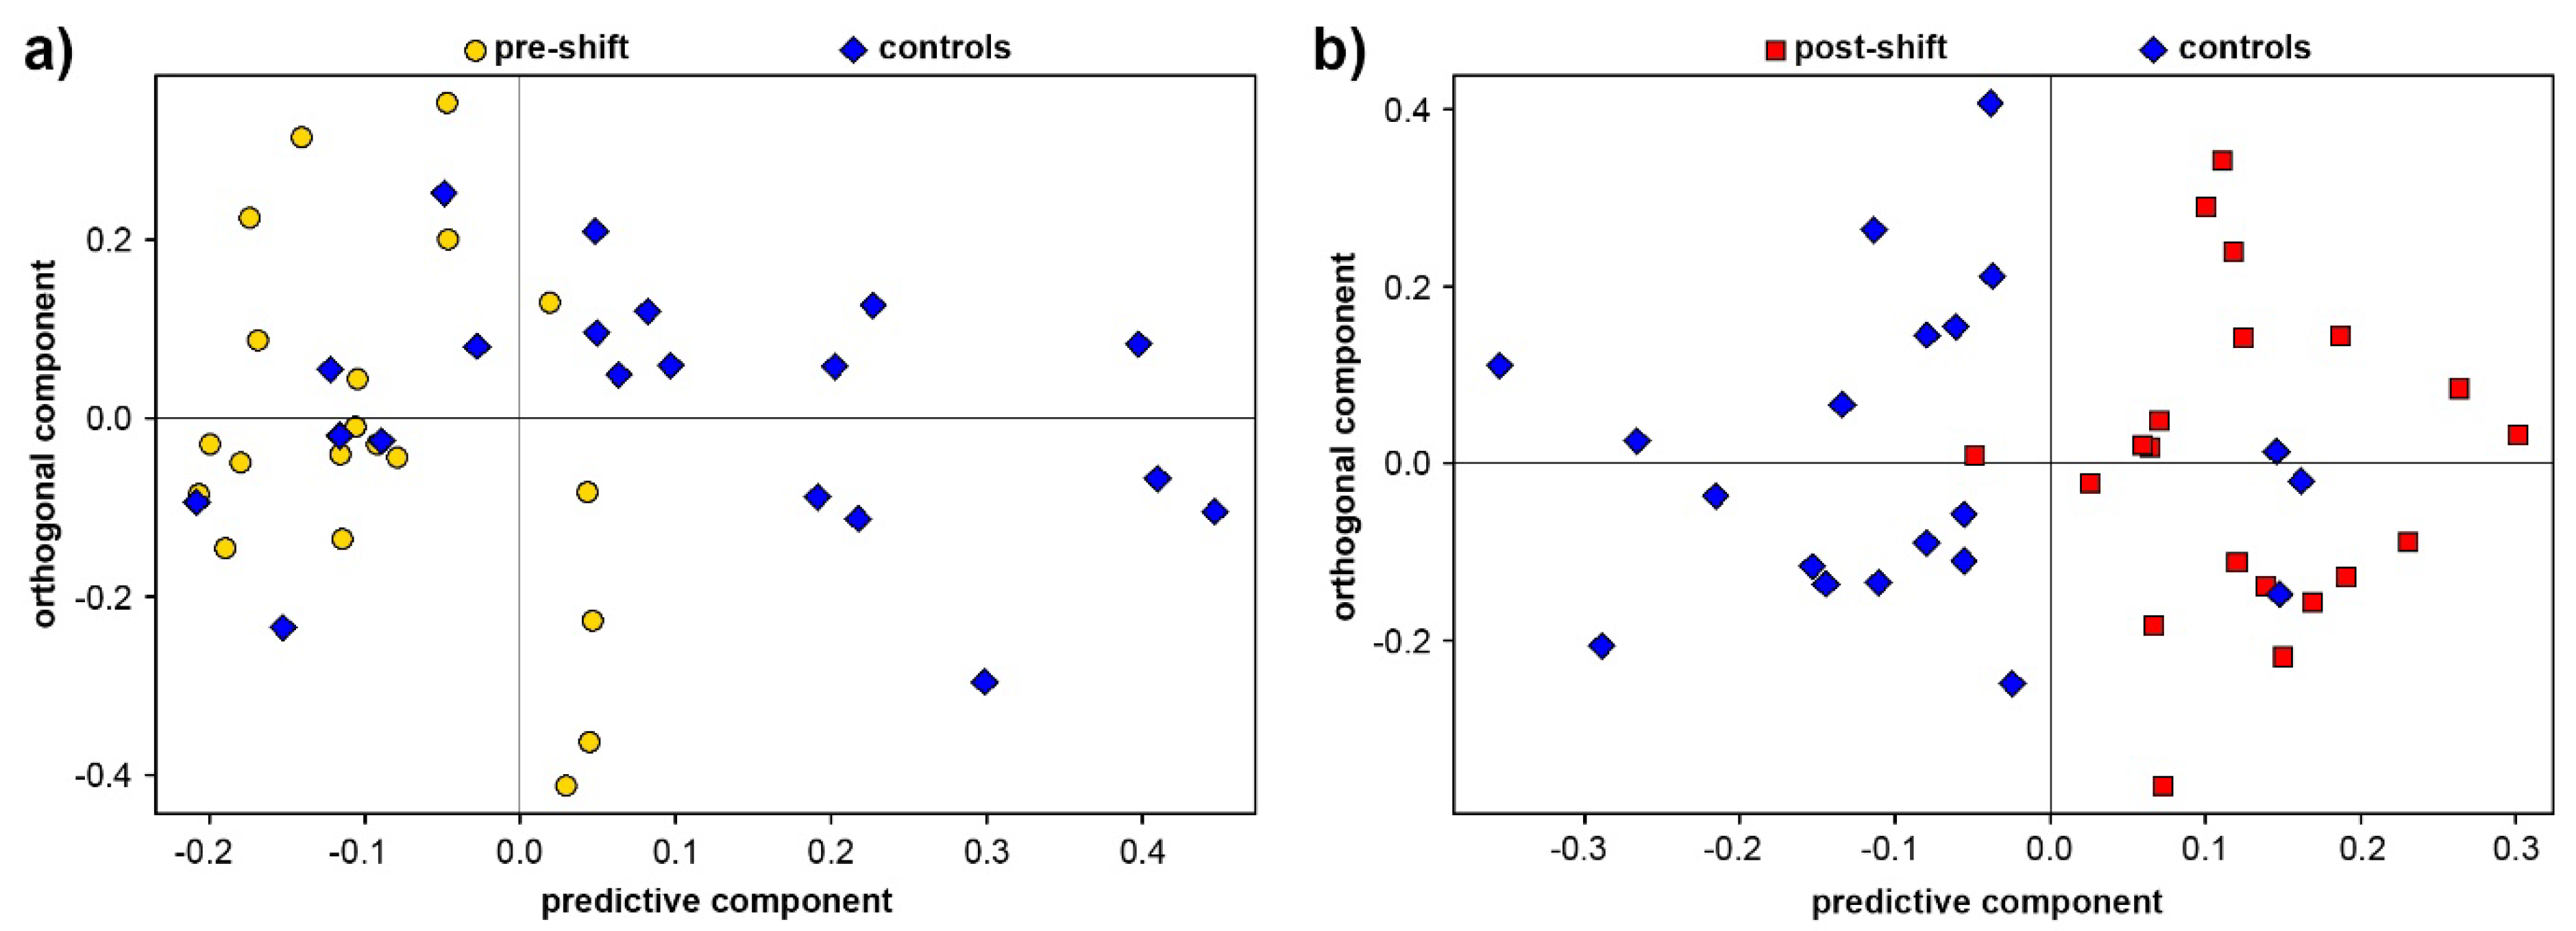
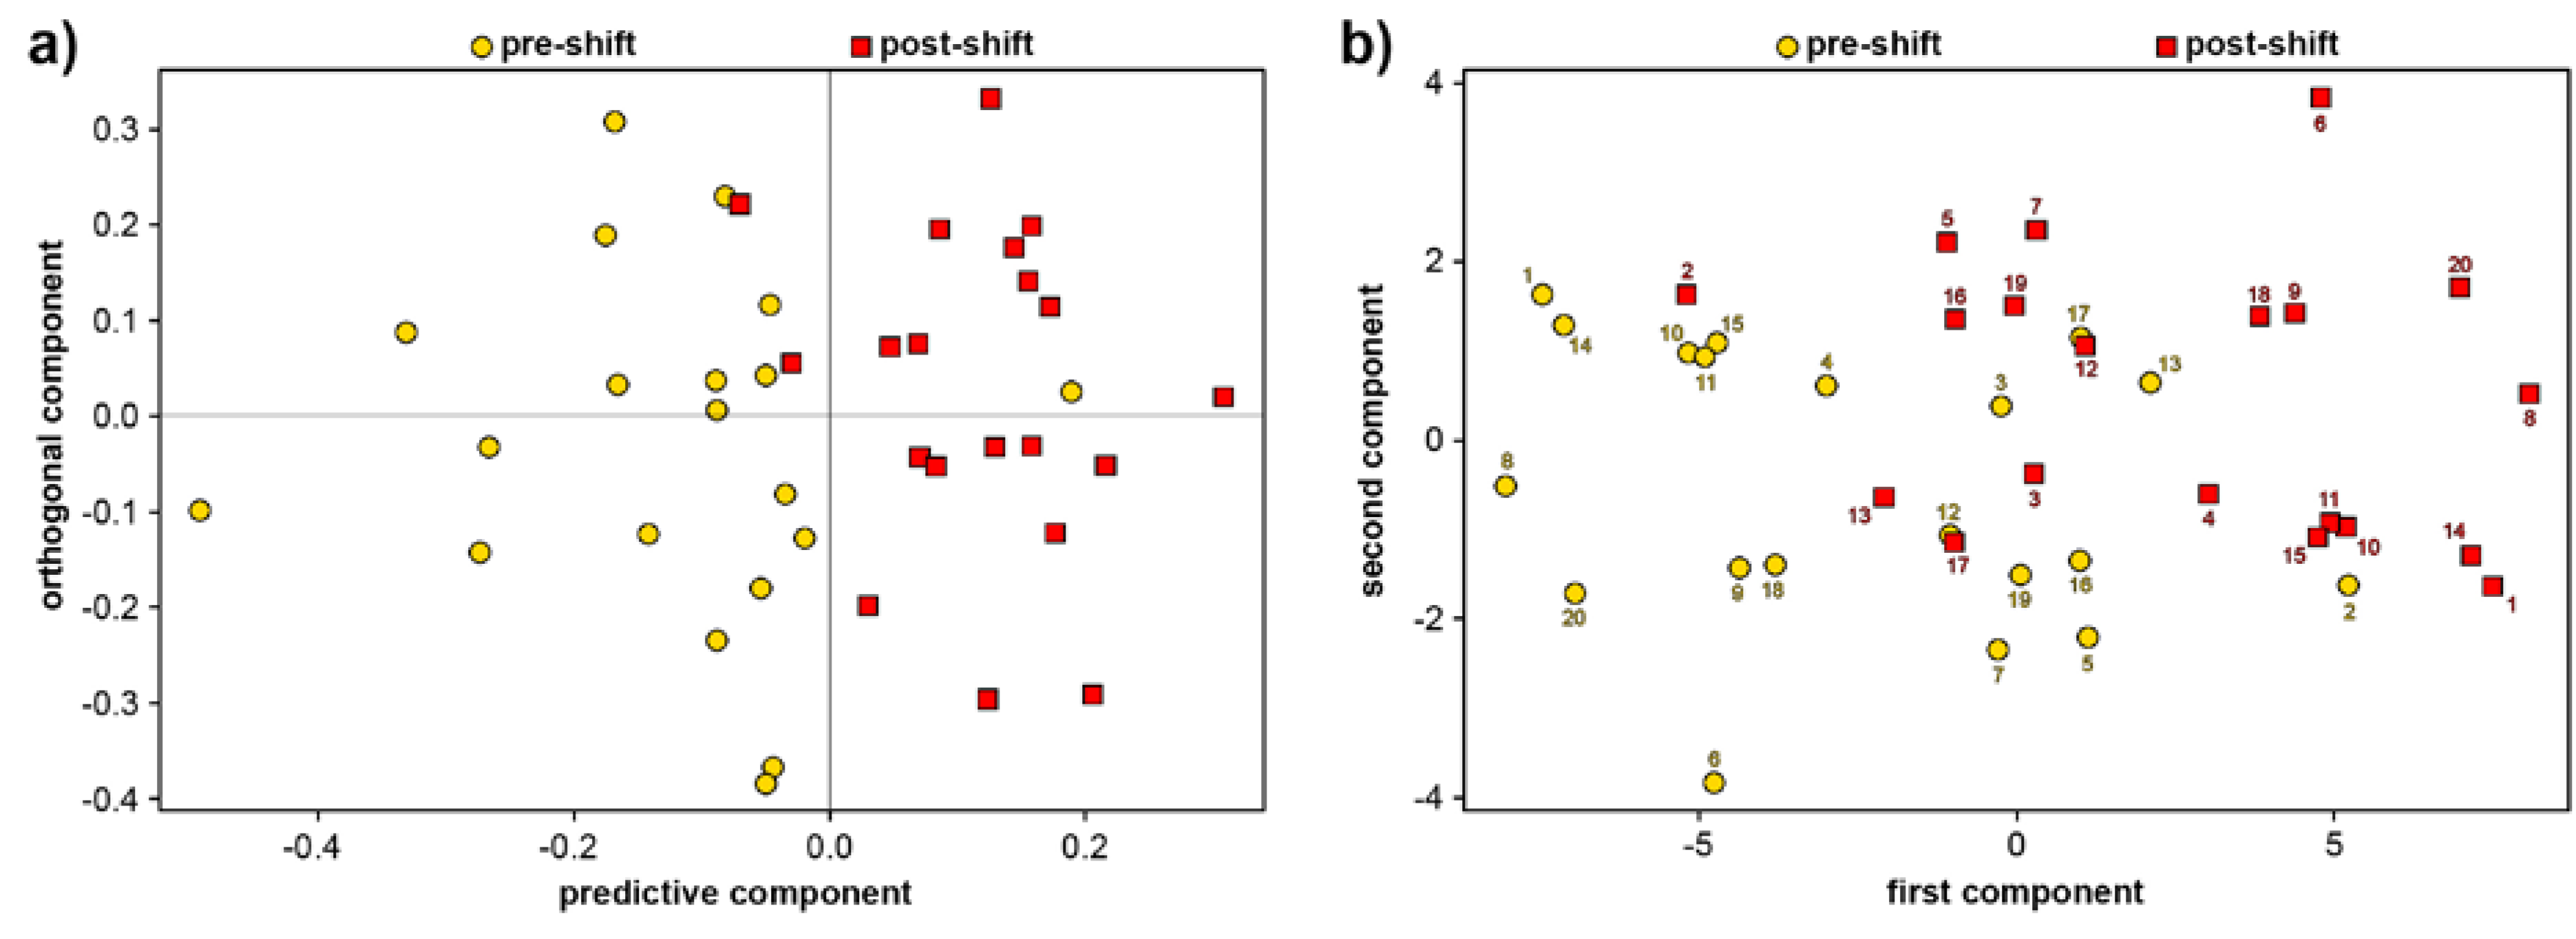
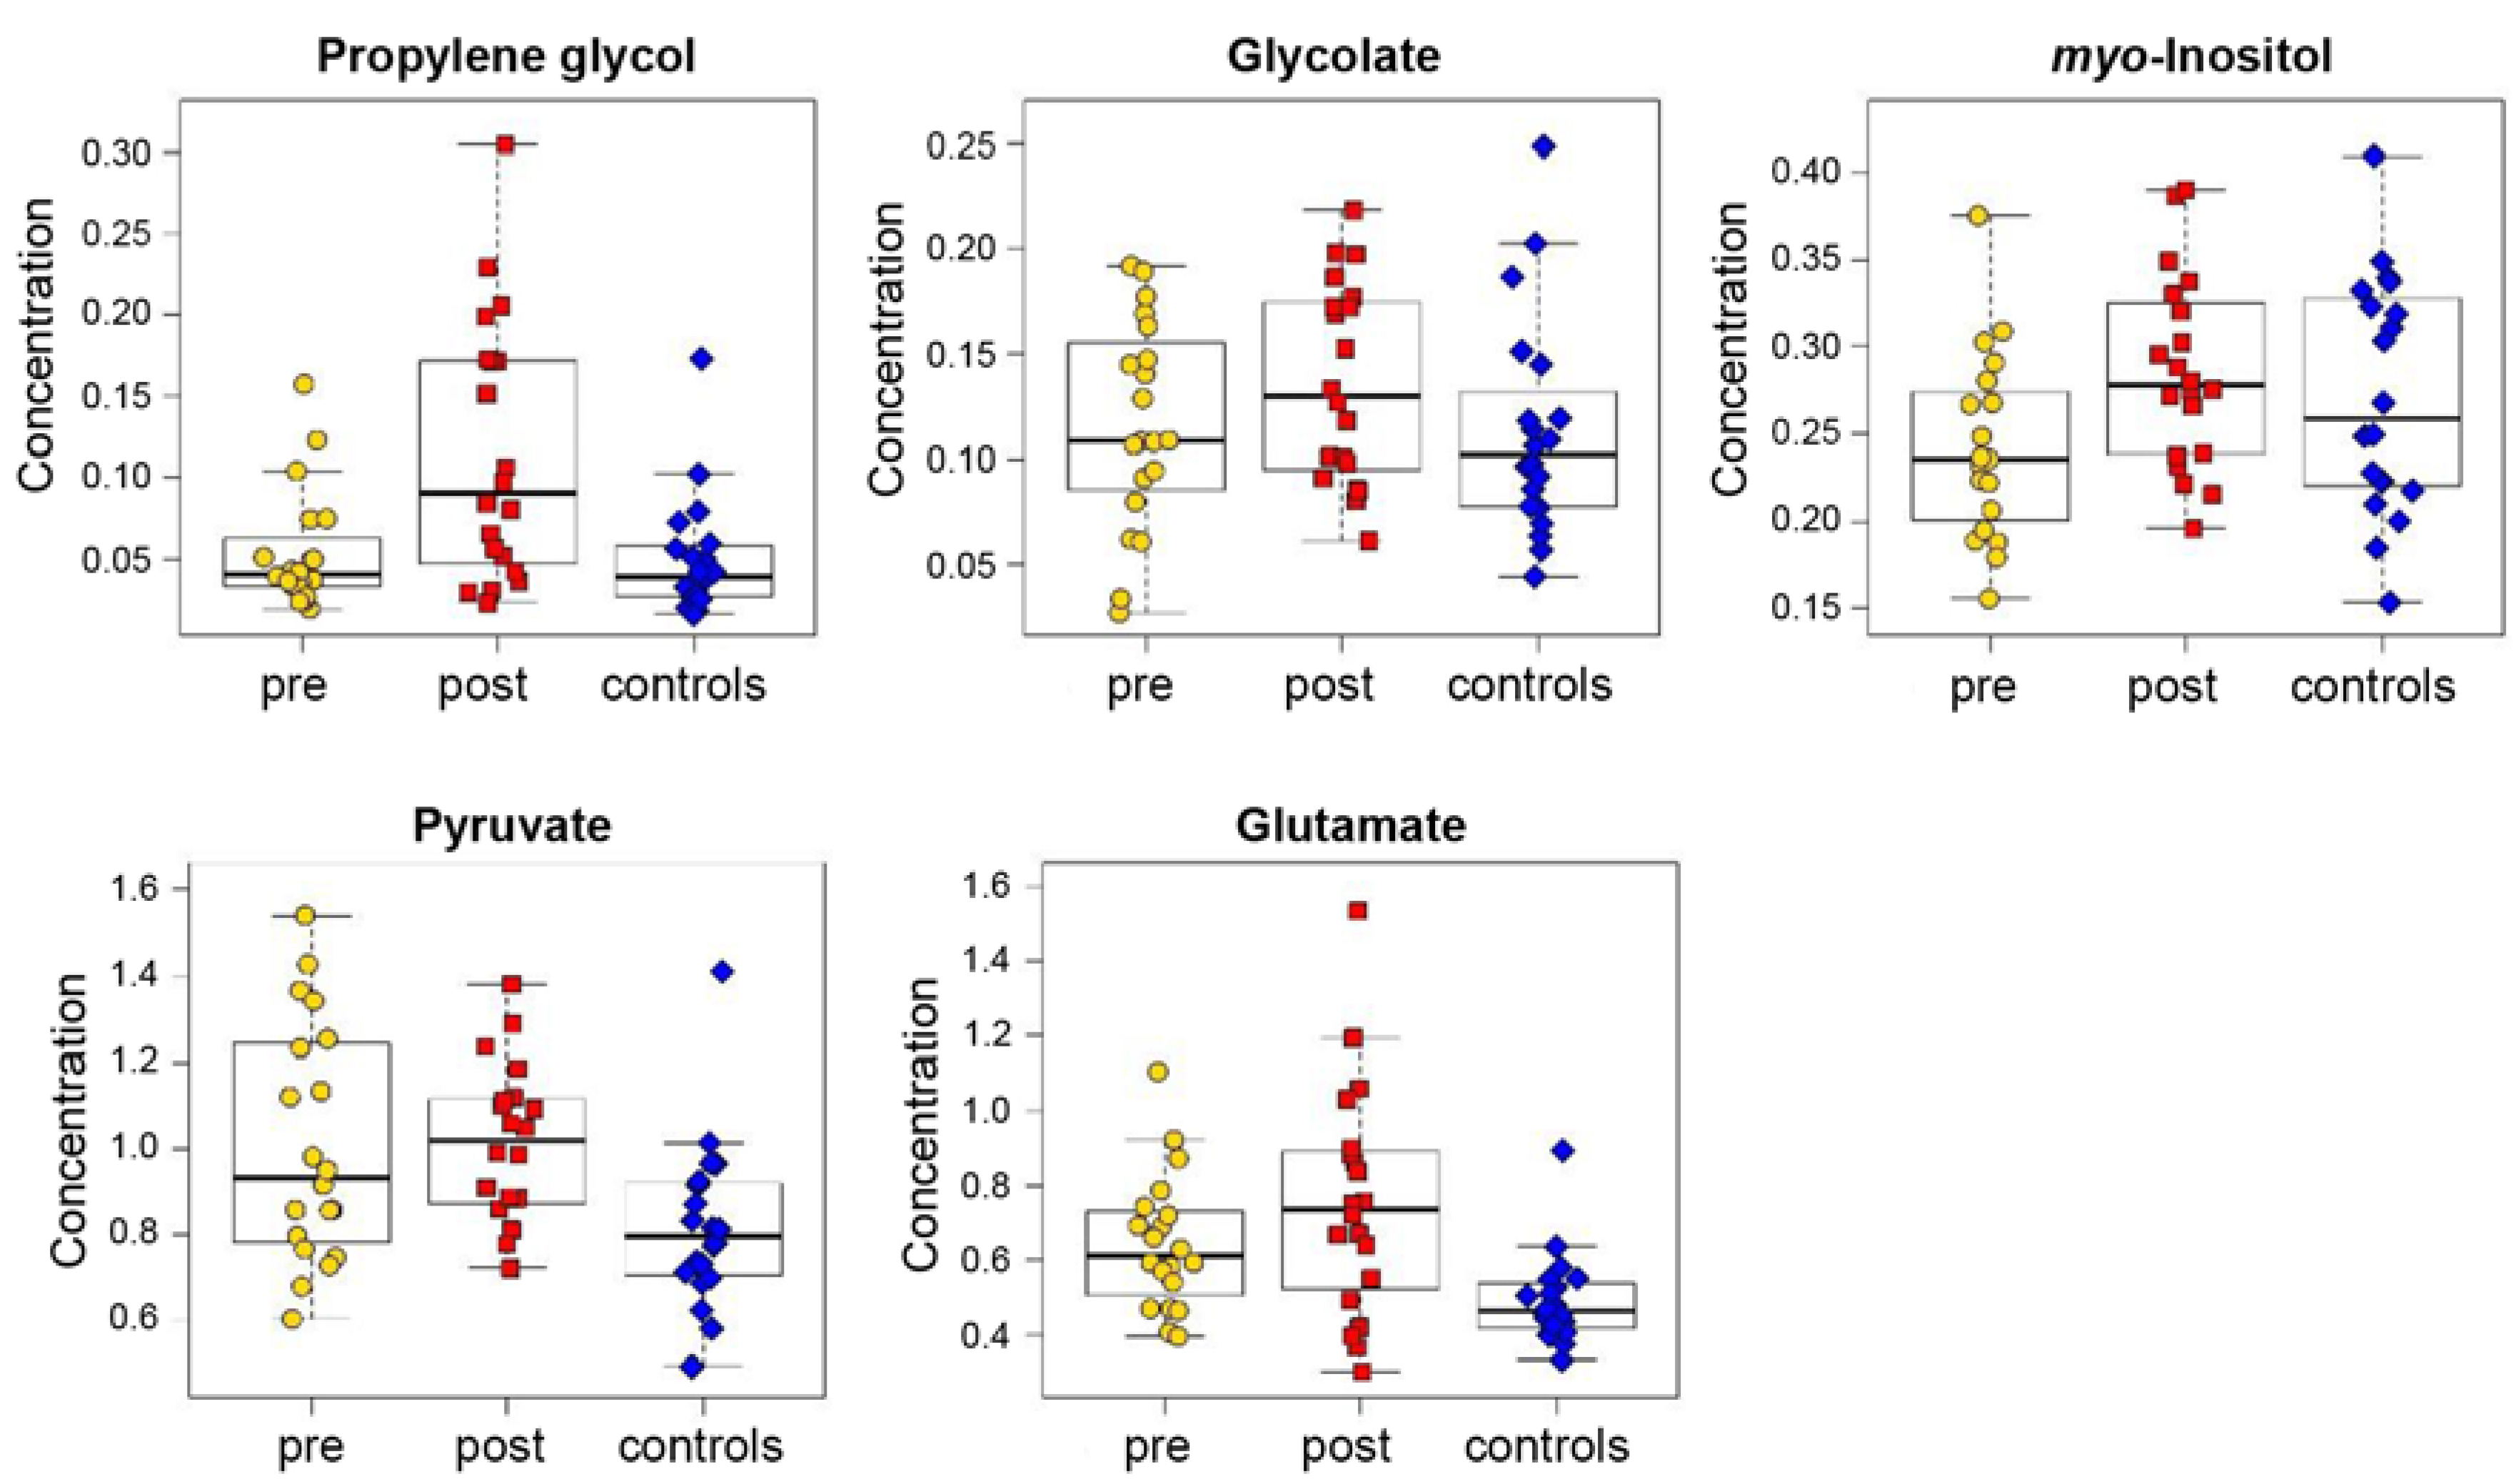
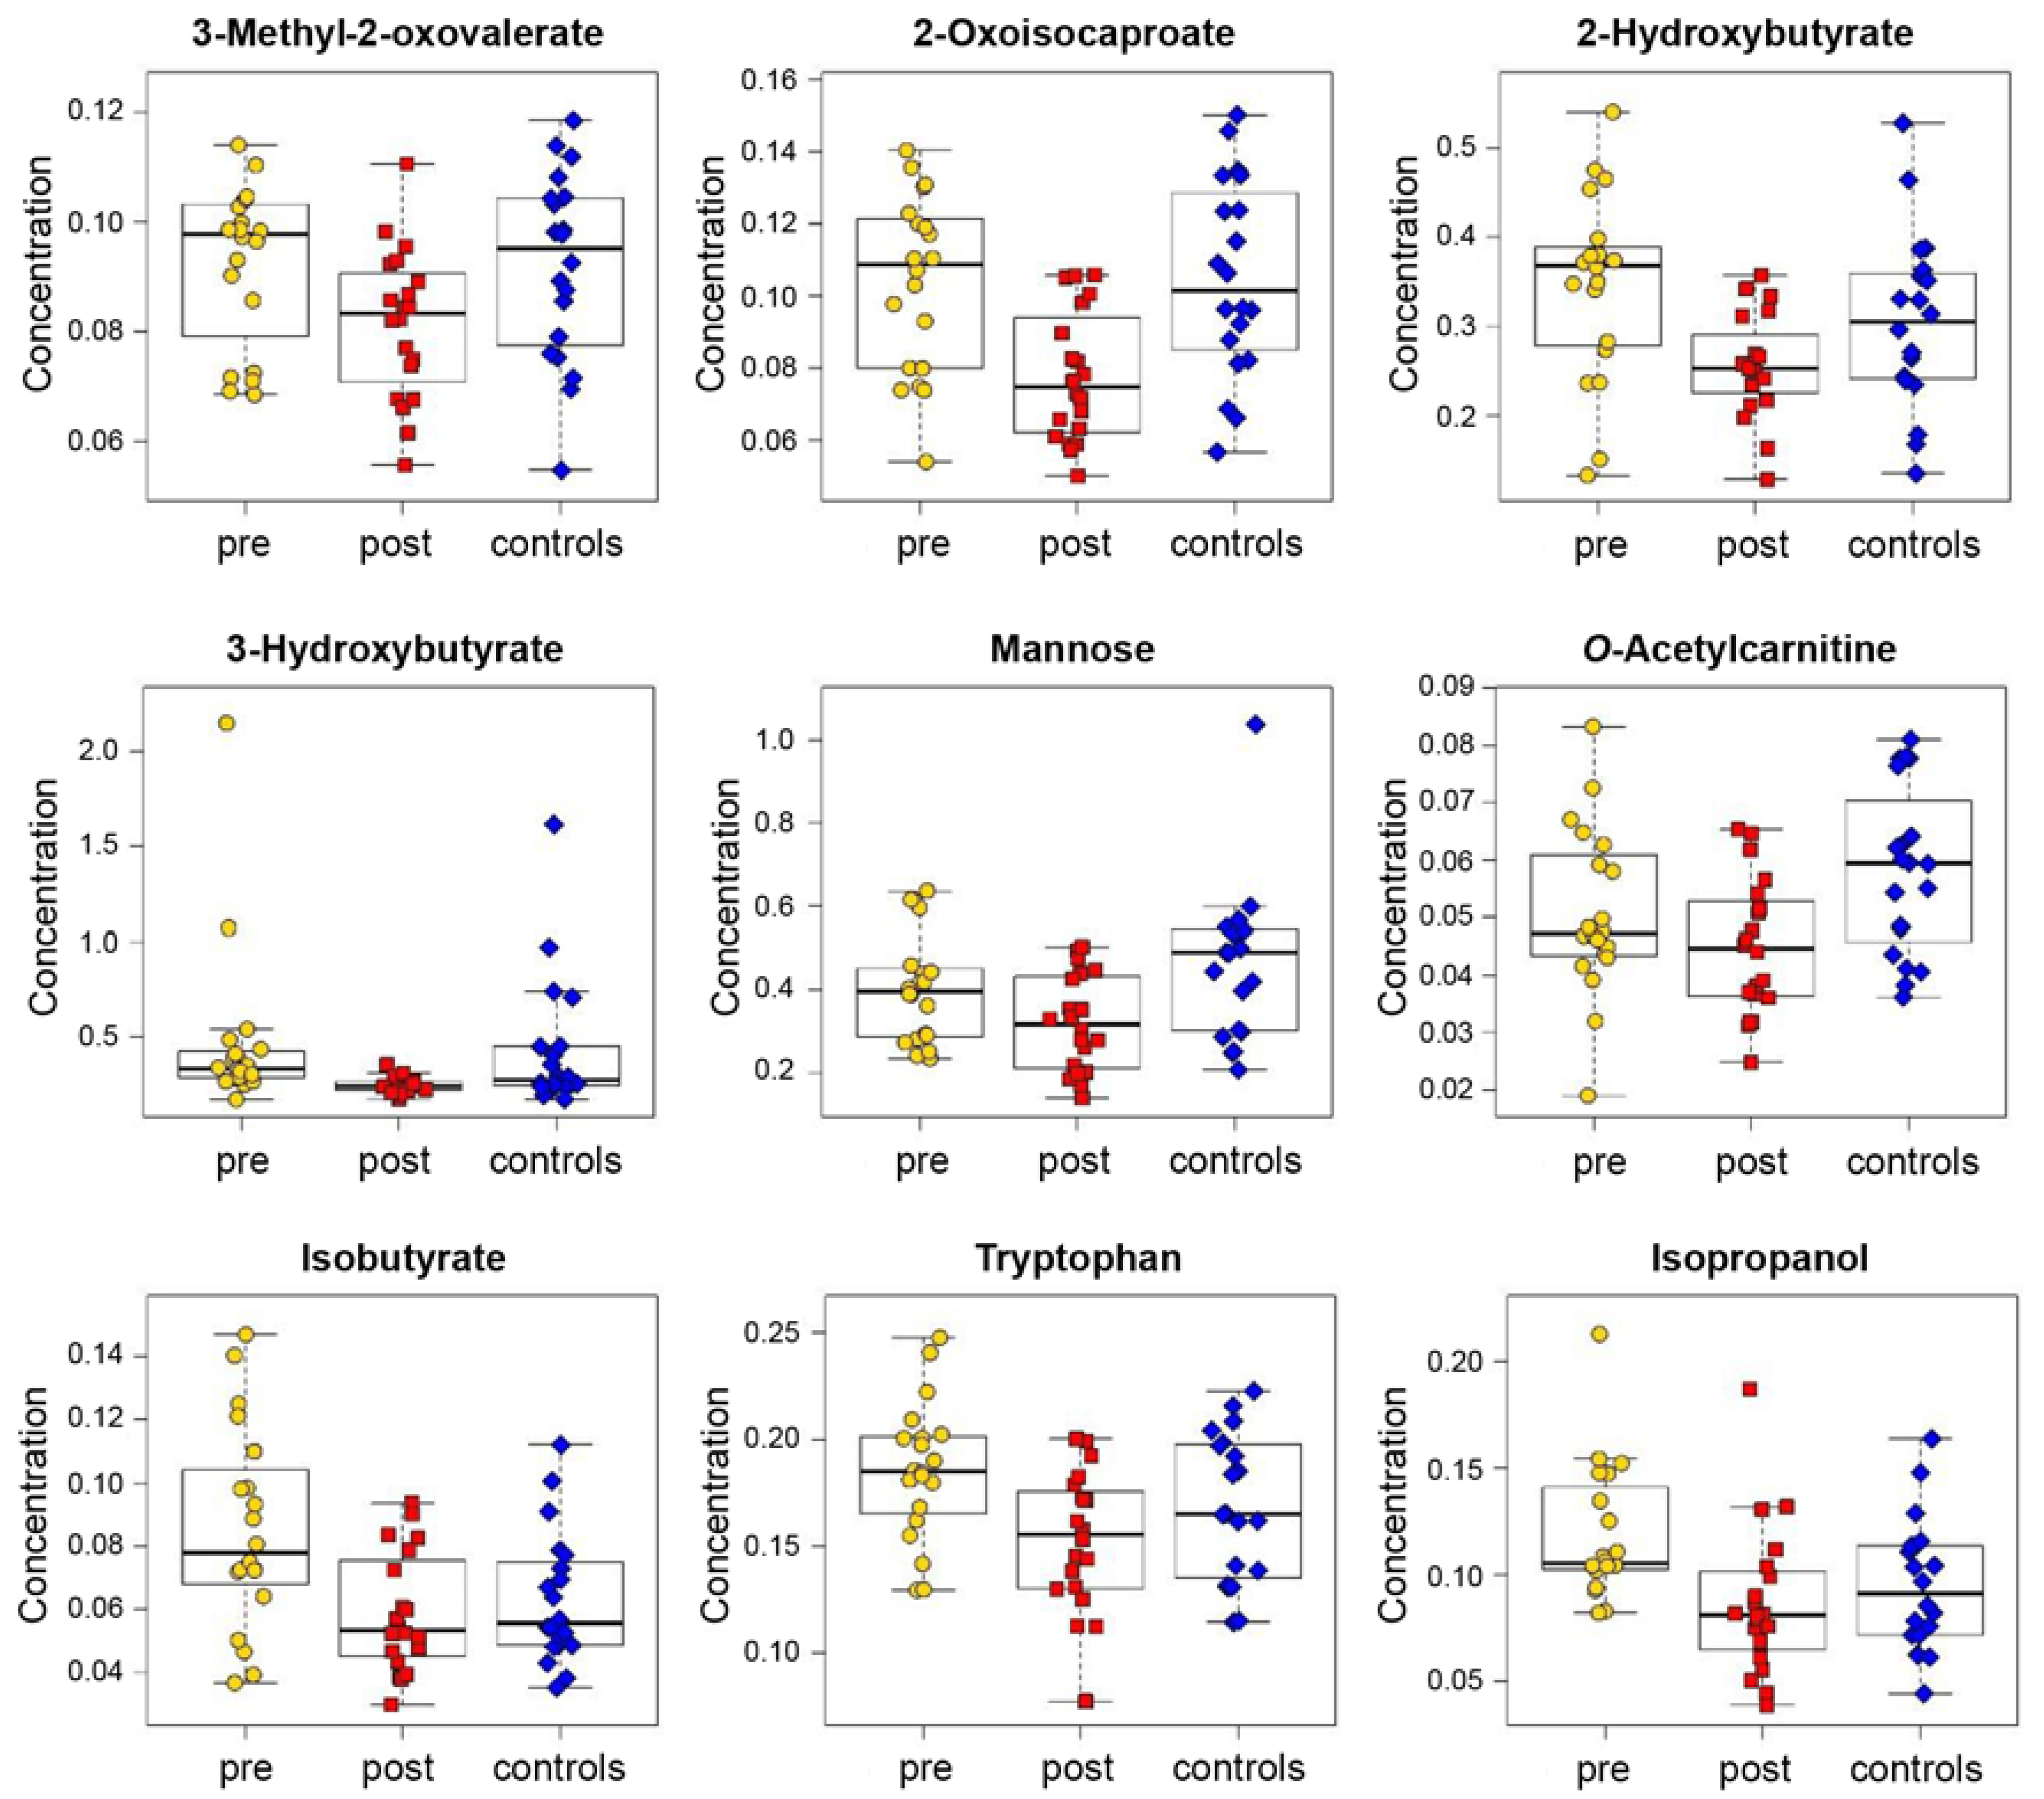
3.2. Analysis of Blood Plasma

Using the Chenomx reference library, 58 metabolites were identified and quantified in each 1H NMR spectrum of blood plasma samples. The concentration data of all quantified metabolites were used as an input for both multivariate and univariate statistical analyses to reveal important features of each group. The homogeneity of the groups was tested by principal component analysis (PCA) as an unsupervised statistical method. According to PCA, no sample was found significantly outlying. Nevertheless, group discrimination was not achieved (Figure S4, Supplementary Materials).
Subsequently, a supervised statistical method (OPLS-DA) was employed to pre-shift and control samples. A very good separation between these two groups was achieved using three components. The model was characterized by 88.2% sensitivity, 73.2% specificity and 80.7% accuracy after Monte Carlo cross-validation (Figure 5a).
The nonparametric Wilcoxon rank-sum test was used to reveal statistically significant compounds that should reflect the effect of chronic exposure to NPs. Only acetone was found under the threshold for statistical significance (adjusted p-value ≤ 0.05). Four other metabolites were close to this threshold, specifically glutamate, glutamine, cystine and hypoxanthine (Table S3 and Figure S5 in Supplementary Materials). Levels of acetone, glutamine and cystine were found increased in the control group, whereas glutamate and hypoxanthine show higher levels in the pre-shift group.
OPLS-DA was also used for differentiation between the post-shift subjects and the healthy controls. A very good separation of the two groups was obtained using a six-component model with an accuracy of 86.0%, sensitivity of 86.4% and specificity of 85.7% after Monte Carlo cross-validation (Figure 5b). The nonparametric Wilcoxon rank-sum test was used to reveal statistically significant compounds (Table S3 and Figure S6 in Supplementary Materials). Seven metabolites were found under the threshold for statistical significance (adjusted p-value ≤ 0.05). Levels of propylene glycol, glutamate and pyruvate were found increased in the post-shift group, whereas acetone, mannose, 2-oxoisocaproate and O-acetylcarnitine showed higher levels in the control group.
Analogically, the acute effect of NPs exposure was also studied on plasma samples of the pre- and post-shift groups using OPLS-DA (Figure 6a). This discrimination analysis showed a certain potential to distinguish between the two groups with a model based on eight components characterized by 75.4% accuracy, 74.0% sensitivity and 76.9% specificity. Subsequently, mPLS was performed with a remarkable discrimination of the two groups using five components with 89.0% accuracy after Monte Carlo cross-validation (Figure 6b). In this case, mPLS reflects the intra-individual differences within each subject; therefore, it provides better group separation than discrimination analysis based on OPLS.
Subsequent analysis by the nonparametric pairwise Wilcoxon signed-rank test revealed 11 statistically significant compounds (Table S3 and Figure S7 in Supplementary Materials). Only compounds with adjusted p-value ≤ 0.05 after Benjamini-Hochberg correction were deemed statistically significant. Out of the 11 statistically significant compounds, increased levels for eight metabolites were found in the pre-shift group, specifically isobutyrate, 2-hydroxybutyrate, 2-oxoisocaproate, lactate, 3-hydroxybutyrate, isopropanol, tryptophan and 3-methyl-2-oxovalerate. Levels of three statistically significant metabolites were elevated in post-shift groups, namely propylene glycol, glycolate and myo-inositol.
The stress induced by NPs exposure is well documented by increased levels of certain metabolites in post-shift samples when compared to the pre-shift samples or controls. In particular, increased levels were found for propylene glycol, glycolate, myo-inositol, pyruvate and glutamate (Figure 7). Propylene glycol is known to be predominantly of exogenous origin as a part of various vitamins and other dietary supplements. The increased concentrations of propylene glycol in the post-shift group corresponds to the increased consumption of such supportive products in the morning before the shift.
On the other hand, the NPs exposure also induced a depletion of other metabolites in post-shift samples; namely of 3-methyl-2-oxovalerate, 2-oxoisocaproate, 2-hydroxybutyrate, 3-hydroxybutyrate, isobutyrate, isopropanol, mannose, O-acetylcarnitine and tryptophan (Figure 8). All the changes found in the post-shift group can be attributed to the acute effect of the NPs on workers’ health.
The long-term effect of the NPs on workers’ health can be deduced from the simultaneous changes in the pre- and post-shift group when compared to the control group. The levels of acetone, glutamine and cystine were found to decrease, while the levels of lactate and hypoxanthine increased in both groups when compared to the controls (Figure 9). The changes in levels of lactate and hypoxanthine were found to be more pronounced in the pre-shift group, which indicates involvement of these compounds in several metabolic pathways and mixing of acute and chronic effects.
Metabolic pathway analysis was performed in MetaboAnalyst to assess involvement of the statistically significant metabolites in the individual metabolic pathways. The alterations between individual groups found by the pathway analysis are depicted in Figure S8 (Supplementary Materials) and the most affected pathways are summarized in Table S4 (Supplementary Materials).
The increased levels of lactate found in the pre-shift group can be partially associated with the metabolism of propylene glycol, which is contained in the food supplements administrated before the shift, as mentioned above. On the other hand, lactate is also involved in several other metabolic pathways, including pyruvate metabolism, according to pathway analysis (Figure S6 in Supplementary Materials) or glucose-alanine metabolism, according to the literature [42]. These pathways play an important role as energy pathways where lactate is usually produced from pyruvate. The highest concentrations of pyruvate were found in the post-shift group, indicating that the energy pathways were affected and the transformation between lactate and pyruvate is impacted by the NPs exposure. Increased levels of lactate have been observed in several studies on the impact of NPs exposure to rats [21,43,44]. Additionally, decreased levels of mannose, which can serve as an additional energy source, were observed in the post-shift group [45].
Elevated levels of lactate can lead to metabolic acidosis, similarly to increased levels of glycolate, which were found in the post-shift group. The formation of acid metabolites can induce inhibition of other metabolic pathways [46]. Glycolate is mainly involved in glyoxylate metabolism where it is oxidized to glyoxylate, which is further transformed into glycine [47]. Glyoxylate can be also transformed into oxalate, which is then caught and secreted by the renal tubules. Excessive concentrations of oxalate cause urolithiasis and nephrocalcinosis [48]. The excessive oxidation of glyoxylate to oxalate by lactate dehydrogenase is prevented by reduction of cytosolic and mitochondrial glyoxylate to glycolate by cytosolic glyoxylate reductase [48].
The post-shift group also manifested increased concentrations of myo-inositol. This metabolite has an important osmoregulatory role and is involved in the running of a wide range of cell functions, including cell growth and survival [49,50], which could explain why myo-inositol is increased in the acute state. Several studies have reported alterations in the myo-inositol levels after exposure to NPs in rats [43] or mouse fibroblast cells L929 [51].
The decreased tryptophan concentration in the post-shift group could be explained by its transformation to kynurenic acid via the kynurenine pathway (pathway tryptophan metabolism in Figure S8c in Supplementary Materials). Kynurenic acid has a protective effect against oxidative stress and lung inflammation induced by exposure to NPs [52]. Furthermore, the kynurenine pathway was previously associated with the elevated levels of cytokines [53], which is consistent with the results of our previous study [12,13]. A decreased concentration of tryptophan was also observed in rat blood serum after exposure to TiO2 NPs [52], which is in agreement with the findings in workers exposed to nanoTiO2, and similar oxidative stress effects [54,55].
The levels of several metabolites associated with the synthesis of glutathione were found altered, namely cystine, glutamate and 2-hydroxybutyrate. Glutathione as a major antioxidant is synthesized from cysteine, glutamate and glycine. Cysteine is transformed to glutathione in response to oxidative stress. This is reflected in decreased levels of cystine, an oxidized dimer form of cysteine. The availability of cysteine was reported as the rate-limiting step in the glutathione synthesis where cysteine is supplied via the cystine-glutamate antiporter system [49,56]. Elevated levels of glutamate in the pre- and post-shift group indicate that glutamate is exchanged for cystine in the antiporter system [49]. The elevated levels of glutamate also affect several other metabolic pathways, such as glutamine and glutamate metabolism, alanine, aspartate and glutamate metabolism, arginine and proline metabolism, histidine metabolism and butanoate metabolism, as is shown in the metabolic pathway analysis via MetaboAnalyst (Figure S8a,b in Supplementary Materials). Alterations in glutamate levels have also been observed in several studies focusing on NPs’ impact on rats [26,43,51].
The utilization of glutamate in glutathione biosynthesis leads to higher demands on glutamate and increases glutamine transformation into glutamate via the glutamine and glutamate metabolism pathway. This is documented by decreased levels of glutamine in both pre- and post-shift groups compared to the control group. Together with glutamate, glutamine is also involved in the pathway of alanine, aspartate and glutamate metabolism, which was also found altered according to metabolic pathway analysis (Figure S8a,b in Supplementary Materials). Glutamine and glutamate were also found affected in the study of Kitchin et al. [57], in which the effect of TiO2 and CeO2 nanomaterials on human liver HepG2 cells was examined. A significant decrease in glutamine was observed, similar to observations from our study. Nevertheless, a decrease in glutamate was observed, on the contrary to our study, indicating that glutamate was involved at least partially in a different way.
2-Hydroxybutyrate is a reduction product of 2-ketobutyrate, which is produced during the transformation of cystathionine to cysteine within the methionine degradation pathway [58]. Since the concentration of 2-hydroxybutyrate is decreased in the acute state, 2-ketobutyrate is probably transformed into other metabolites, including propionyl-CoA [59], which is also associated with degradation of branched-chain amino acids, as discussed below.
The concentrations of two ketone bodies metabolites, 3-hydroxybutyrate and acetone, were found altered. Both compounds are closely connected to acetoacetate, another ketone body, which was, however, found unaltered. Nevertheless, decreased concentrations of 3-hydroxybutyrate and acetone after exposure to NPs suggest that the metabolic pathway of ketone body metabolism is affected. This was also revealed in the metabolic pathway analysis via MetaboAnalyst (Figure S8b in Supplementary Materials). 3-Hydroxybutyrate is also involved in butanoate metabolism, and it is also a degradation product of branched-chain amino acids, mainly of leucine [60]. The decreased concentrations of 3-hydroxybutyrate and acetone after NPs exposure are in contrast with other studies, which reported elevated levels of 3-hydroxybutyrate [21,23,61]. However, these studies were performed on rats exposed to high NPs doses. 3-Hydroxybutyrate is also an end product of β-oxidation of fatty acids [21]. The impairment of this metabolic pathway is also reflected in a decreased concentration of O-acetylcarnitine. This molecule serves as a carrier of acetyl from acetyl-CoA derived from fatty acids to mitochondria [62], thus taking part in energy metabolism. Moreover, decreased levels of O-acetylcarnitine can also be associated with oxidative stress. Similarly to this study, decreased levels of O-acetylcarnitine were also observed in zebrafish and mice embryos after Fe2O3 NPs exposure [62]. Accordingly, workers exposed to NPs during iron oxide pigment production showed elevated markers of lipid, nucleic acid, and protein oxidation in their EBC [63].
Decreased levels of 3-methyl-2-oxovalerate and 2-oxoisocaproate (4-methyl-2-oxovalerate) were found in the post-shift group. These compounds are produced as direct metabolites of isoleucine and leucine during their degradation by branched-chain amino acid aminotransferase [64]. Since the concentrations of leucine and isoleucine were found almost unaffected, leucine and isoleucine are involved in other pathways or processes, and the direct degradation pathway of these amino acids is inhibited. Isobutyrate is another metabolite associated with the metabolism of branched-chain amino acids, mainly of valine [65]. The decreased concentration of isobutyrate in the post-shift group also indicates that branched-chain amino acids’ degradation is inhibited in the acute state. However, this inhibition was not manifested in the metabolic pathway analysis performed in MetaboAnalyst.
Hypoxanthine is an important part of purine metabolism [66], thus the elevated levels of hypoxanthine found mainly in pre-shift plasma samples indicate alterations in this metabolism. Such an observation is complementary to the findings of a previous study performed on the same cohort, where the markers of nucleic acids’ oxidation (8-hydroxyguanosine and 8-hydroxy-2-deoxyguanosine) were identified in pre-shift EBC samples. Similar markers were also found in other toxicological studies of occupational exposure to different NPs, indicating a general effect of chronic NPs exposure [12,54,55].
The metabolic pathway analysis performed mainly indicates that the induced oxidative stress activates anti-oxidative pathways, and antioxidants, such as glutathione, are extensively consumed. Higher demands in the supplement of the consumed antioxidants can be observed in decreasing levels of their intermediates, in particular glutamine and cystine. The decreased tryptophan levels may be related to the production of its metabolites like kynurenic acid, which have protective effects against oxidative stress and lung inflammation. Moreover, alterations of several other metabolic pathways were observed.
The changes induced in metabolic profiles by NPs exposure were associated predominantly to the organism’s response to oxidative stress. Similar response has been observed in studies dedicated to evaluation of the oxidative stress induced by smoking. Despite the number of smoking subjects being rather small in the presented study, statistical analysis was also performed after exclusion of the smoking subjects. One subject was excluded from the pre-shift/post-shift group and two subjects from the control group. The obtained results were in correspondence with those found in the original study and only minor changes were observed. Adjusted p-values of several metabolites levels previously found as statically significant raised slightly above the designated threshold. On the other hand, the adjusted p-value of hypoxanthine in blood plasma descended below the threshold in the comparison of the pre-shift and control groups (Tables S5 and S6 in Supplementary Materials). It is worth noting that the changes found in the results of univariate statistical analysis can be partially attributed to the decreased number of samples. The group separation provided by multivariate statistical analyses remained unaffected (Figures S9–S12 in Supplementary Materials). Major limitation of this study is the small number of subjects reflecting the actual size of the workplace, as all available workers were included.

4. Conclusions

The EBC and blood plasma samples of a cohort of 20 workers exposed to NPs during their occupation were analysed by 1H NMR spectroscopy and processed by statistical analysis. Altogether, 15 metabolites were identified in EBC samples, while the analysis of plasma samples provided 58 metabolites. Subsequent multivariate statistical analyses performed on binning data from EBC and concentrations of 58 metabolites from plasma samples enabled clear discrimination between the pre-shift, post-shift and control groups. The univariate statistical analysis revealed statistically significant metabolites. Although plasma and EBC samples each showed changes in levels of different metabolites, the metabolic pathway analysis indicated, in both cases, mainly a reaction of the organism to oxidative stress and subsequent efforts for its protection.
The comparison of the pre-shift and post-shift group accompanied by comparison of the post-shift and control group provided insight into the acute effect of the NPs exposure. Altered levels of lactate, pyruvate, 3-hydroxybutyrate, mannose and O-acetylcarnithine indicated an energy balance impairment. The altered levels of glutamate, cystine, tryptophan, acetate, propionate and butyrate were associated to the pathways related to the production of antioxidants, mainly glutathione, and other protective species. The comparison of the pre-shift and control group revealed that the chronic effect of the NPs exposure manifested mainly in an alteration in glutamine and glutamate metabolism. The increased levels of hypoxanthine indicated an impairment of the purine metabolism pathway.
The presented results correspond well with similar studies performed on cohorts exposed to different types of NPs, indicating that the observed adverse effects can be attributed to nanoparticles in general, rather than to their chemical nature.
This work is one of the few dealing with the occupational exposure to NPs studied by the means of NMR metabolomics. Similar response to NPs exposure was observed for both types of samples indicating that either biofluid can be used for evaluation of adverse effects of nanoparticles inhalation. Potentially, blood derivatives could serve as an alternative to commonly used EBC samples.

Supplementary Materials

The following are available online at https://www.mdpi.com/article/10.3390/app11146601/s1, Table S1: Basic characteristics of the samples; Figure S1: 1H NMR spectrum of a representative EBC sample; Figure S2: 1H NMR spectrum of a representative blood plasma sample; Table S2: Wilcoxon test for EBC samples; Figure S3: Principal component analysis for EBC samples; Figure S4: Principal component analysis for plasma samples; Table S3: Wilcoxon test for blood plasma samples; Figure S5: Fold change projection of pre-shift subjects and healthy controls; Figure S6: Fold change projection of post-shift subjects and healthy controls; Figure S7: Fold change projection of pre-shift and post-shift subjects; Figure S8: Metabolic pathway analysis; Table S4: Overview of the most influenced metabolic pathways; Table S5: Wilcoxon test for EBC samples after exclusion of smoking subjects; Table S6: Wilcoxon test for blood plasma samples after exclusion of smoking subjects; Figures S9 and S10: Multivariate statistical analysis of EBC samples after exclusion of smoking subjects; Figures S11 and S12: Multivariate statistical analysis of plasma samples after exclusion of smoking subjects.

Author Contributions

Conceptualization, V.Ž., Š.D. and D.P.; methodology, Š.H., L.M. and J.S.; formal analysis, J.S. and D.P.; investigation, Š.H. and L.M.; resources, J.S., V.Ž. and D.P.; data curation, Š.H., L.M., J.S. and Š.V.; writing—original draft preparation, Š.H. and L.M.; writing—review and editing, J.S.; visualization, Š.H., L.M. and J.S.; supervision, J.S.; project administration, Š.V. and D.P.; funding acquisition, J.S., V.Ž. and D.P. All authors have read and agreed to the published version of the manuscript.

Funding

This work was supported by the Ministry of Youth, Education and Sports of the Czech Republic, project No. LM2018122 and by the Technology Agency of the Czech Republic (Grant No. TK02010035) and projects Progres Q25 and Q29 of the Charles University.

Institutional Review Board Statement

The study was conducted according to the guidelines of the Declaration of Helsinki, and approved by the Ethical Committee of 1st Medical Faculty, Charles University.

Informed Consent Statement

All participants were informed of the study aim at least five days earlier, and signed an informed consent form before the study began.

Data Availability Statement

The NMR spectra or evaluated data used in this study are available on request from the author: sykora@icpf.cas.cz.

Acknowledgments

The authors are grateful to Andrew Christensen for proofreading.

Conflicts of Interest

The authors declare no conflict of interest.

References

  1. Schnackenberg, L.K.; Sun, J.; Beger, R.D. Metabolomics techniques in nanotoxicology studies. Methods Mol. Biol. 2012, 926, 141–156. [Google Scholar] [CrossRef]
  2. Oberdörster, G.; Oberdörster, E.; Oberdörster, J. Nanotoxicology: An emerging discipline evolving from studies of ultrafine particles. Environ. Health Perspect. 2005, 113, 823–839. [Google Scholar] [CrossRef]
  3. Oberdörster, G.; Maynard, A.; Donaldson, K.; Castranova, V.; Fitzpatrick, J.; Ausman, K.; Carter, J.; Karn, B.; Kreyling, W.; Lai, D.; et al. Principles for characterizing the potential human health effects from exposure to nanomaterials: Elements of a screening strategy. Part. Fibre Toxicol. 2005, 2, 8. [Google Scholar] [CrossRef]
  4. Oberbek, P.; Kozikowski, P.; Czarnecka, K.; Sobiech, P.; Jakubiak, S.; Jankowski, T. Inhalation exposure to various nanoparticles in work environment—Contextual information and results of measurements. J. Nanoparticle Res. 2019, 21, 222. [Google Scholar] [CrossRef] [Green Version]
  5. Geiser, M.; Jeannet, N.; Fierz, M.; Burtscher, H. Evaluating adverse effects of inhaled nanoparticles by realistic in vitro technology. Nanomaterials 2017, 7, 49. [Google Scholar] [CrossRef] [Green Version]
  6. Kim, Y.J.; Yu, M.; Park, H.O.; Yang, S.I. Comparative study of cytotoxicity, oxidative stress and genotoxicity induced by silica nanomaterials in human neuronal cell line. Mol. Cell. Toxicol. 2010, 6, 337–344. [Google Scholar] [CrossRef]
  7. Shvedova, A.; Castranova, V.; Kisin, E.; Murray, A.; Gandelsman, V.; Baron, P. Journal of Toxicology and Environmental Health, Part A: Current Issues Exposure to Carbon Nanotube Material: Assessment of Nanotube Cytotoxicity using Human Keratinocyte Cells. J. Toxocol. Environ. Health Part A 2011, 66, 1909–1926. [Google Scholar] [CrossRef]
  8. Brown, D.M.; Donaldson, K.; Borm, P.J.; Schins, R.P.; Dehnhardt, M.; Gilmour, P.; Jimenez, L.A.; Stone, V. Calcium and ROS-mediated activation of transcription factors and TNF-α cytokine gene expression in macrophages exposed to ultrafine particles. Am. J. Physiol. Lung Cell. Mol. Physiol. 2004, 286, 344–353. [Google Scholar] [CrossRef] [PubMed]
  9. Dick, C.A.J.; Brown, D.M.; Donaldson, K.; Stone, V. The Role of Free Radicals in the Toxic and Inflammatory Effects of Four Different Ultrafine Particle Types. Inhal. Toxicol. 2003, 15, 39–52. [Google Scholar] [CrossRef] [PubMed]
  10. Nel, A.; Xia, T.; Mädler, L.; Li, N. Toxic Potential of Materials at the Nanolevel. Science 2006, 311, 622–627. [Google Scholar] [CrossRef] [PubMed] [Green Version]
  11. Fröhlich, E. Role of omics techniques in the toxicity testing of nanoparticles. J. Nanobiotechnol. 2017, 15, 84. [Google Scholar] [CrossRef]
  12. Pelclova, D.; Zdimal, V.; Schwarz, J.; Dvorackova, S.; Komarc, M.; Ondracek, J.; Kostejn, M.; Kacer, P.; Vlckova, S.; Fenclova, Z.; et al. Markers of oxidative stress in the exhaled breath condensate of workers handling nanocomposites. Nanomaterials 2018, 8, 611. [Google Scholar] [CrossRef] [PubMed] [Green Version]
  13. Pelclova, D.; Zdimal, V.; Komarc, M.; Vlckova, S.; Fenclova, Z.; Ondracek, J.; Schwarz, J.; Kostejn, M.; Kacer, P.; Dvorackova, S.; et al. Deep airway inflammation and respiratory disorders in nanocomposite workers. Nanomaterials 2018, 8, 731. [Google Scholar] [CrossRef] [Green Version]
  14. Fröhlich, E. Comparison of conventional and advanced in vitro models in the toxicity testing of nanoparticles. Artif. Cells Nanomed. Biotechnol. 2018, 46, 1091–1107. [Google Scholar] [CrossRef] [Green Version]
  15. Dybing, E.; Løvdal, T.; Hetland, R.B.; Løvik, M.; Schwarze, P.E. Respiratory allergy adjuvant and inflammatory effects of urban ambient particles. Toxicology 2004, 198, 307–314. [Google Scholar] [CrossRef]
  16. Seaton, A.; Tran, L.; Aitken, R.; Donaldson, K. Nanoparticles, human health hazard and regulation. J. R. Soc. Interface 2010, 7, S119–S129. [Google Scholar] [CrossRef] [Green Version]
  17. Oberdörster, G.; Kuhlbusch, T.A.J. In vivo effects: Methodologies and biokinetics of inhaled nanomaterials. NanoImpact 2018, 10, 38–60. [Google Scholar] [CrossRef]
  18. Cassee, F.R.; Muijser, H.; Duistermaat, E.; Freijer, J.J.; Geerse, K.B.; Marijnissen, J.C.; Arts, J.H. Particle size-dependent total mass deposition in lungs determines inhalation toxicity of cadmium chloride aerosols in rats. Application of a multiple path dosimetry model. Arch. Toxicol. 2002, 76, 277–286. [Google Scholar] [CrossRef] [PubMed]
  19. Buckley, A.; Hodgson, A.; Warren, J.; Guo, C.; Smith, R. Size-dependent deposition of inhaled nanoparticles in the rat respiratory tract using a new nose-only exposure system. Aerosol Sci. Technol. 2016, 50, 1–10. [Google Scholar] [CrossRef]
  20. Horváth, I.; Barnes, P.J.; Loukides, S.; Sterk, P.J.; Högman, M.; Olin, A.C.; Amann, A.; Antus, B.; Baraldi, E.; Bikov, A.; et al. A European respiratory society technical standard: Exhaled biomarkers in lung disease. Eur. Respir. J. 2017, 49, 1600965. [Google Scholar] [CrossRef] [Green Version]
  21. Lee, S.H.; Wang, T.Y.; Hong, J.H.; Cheng, T.J.; Lin, C.Y. NMR-based metabolomics to determine acute inhalation effects of nano- and fine-sized ZnO particles in the rat lung. Nanotoxicology 2016, 10, 924–934. [Google Scholar] [CrossRef]
  22. Li, X.; Ban, Z.; Yu, F.; Hao, W.; Hu, X. Untargeted Metabolic Pathway Analysis as an Effective Strategy to Connect Various Nanoparticle Properties to Nanoparticle-Induced Ecotoxicity. Environ. Sci. Technol. 2020, 54, 3395–3406. [Google Scholar] [CrossRef]
  23. Li, J.; Zhao, Z.; Feng, J.; Gao, J.; Chen, Z. Understanding the metabolic fate and assessing the biosafety of MnO nanoparticles by metabonomic analysis. Nanotechnology 2013, 24, 455102. [Google Scholar] [CrossRef]
  24. Zhang, W.; Zhao, Y.; Li, F.; Li, L.; Feng, Y.; Min, L.; Ma, D.; Yu, S.; Liu, J.; Zhang, H.; et al. Zinc oxide nanoparticle caused plasma metabolomic perturbations correlate with hepatic steatosis. Front. Pharmacol. 2018, 9, 57. [Google Scholar] [CrossRef] [Green Version]
  25. Dailey, L.A.; Hernández-Prieto, R.; Casas-Ferreira, A.M.; Jones, M.-C.; Riffo-Vasquez, Y.; Rodríguez-Gonzalo, E.; Spina, D.; Jones, S.A.; Smith, N.W.; Forbes, B.; et al. Adenosine monophosphate is elevated in the bronchoalveolar lavage fluid of mice with acute respiratory toxicity induced by nanoparticles with high surface hydrophobicity. Nanotoxicology 2015, 9, 106–115. [Google Scholar] [CrossRef]
  26. Guo, Z.; Luo, Y.; Zhang, P.; Chetwynd, A.J.; Qunhui Xie, H.; Monikh, F.A.; Tao, W.; Xie, C.; Liu, Y.; Xu, L.; et al. Deciphering the particle specific effects on metabolism in rat liver and plasma from ZnO nanoparticles versus ionic Zn exposure. Environ. Int. 2020, 136, 105437. [Google Scholar] [CrossRef] [PubMed]
  27. Cui, L.; Wang, X.; Sun, B.; Xia, T.; Hu, S. Predictive Metabolomic Signatures for Safety Assessment of Metal Oxide Nanoparticles. ACS Nano 2019, 13, 13065–13082. [Google Scholar] [CrossRef] [PubMed]
  28. Guo, N.L.; Poh, T.Y.; Pirela, S.; Farcas, M.T.; Chotirmall, S.H.; Tham, W.K.; Adav, S.S.; Ye, Q.; Wei, Y.; Shen, S.; et al. Integrated transcriptomics, metabolomics, and lipidomics profiling in rat lung, blood, and serum for assessment of laser printer-emitted nanoparticle inhalation exposure-induced disease risks. Int. J. Mol. Sci. 2019, 20, 6384. [Google Scholar] [CrossRef] [PubMed] [Green Version]
  29. Pelclova, D.; Zdimal, V.; Komarc, M.; Schwarz, J.; Ondracek, J.; Ondrackova, L.; Kostejn, M.; Vlckova, S.; Fenclova, Z.; Dvorackova, S.; et al. Three-year study of markers of oxidative stress in exhaled breath condensate in workers producing nanocomposites, extended by plasma and urine analysis in last two years. Nanomaterials 2020, 10, 2440. [Google Scholar] [CrossRef]
  30. Chenomx Inc. ChenomX NMR Suite 8.0; Chenomx Inc.: Edmonton, AB, Canada, 2016. [Google Scholar]
  31. Bertini, I.; Luchinat, C.; Miniati, M.; Monti, S.; Tenori, L. Phenotyping COPD by 1H NMR metabolomics of exhaled breath condensate. Metabolomics 2014, 10, 302–311. [Google Scholar] [CrossRef]
  32. Vignoli, A.; Ghini, V.; Meoni, G.; Licari, C.; Takis, P.G.; Tenori, L.; Turano, P.; Luchinat, C. High-Throughput Metabolomics by 1D NMR. Angew. Chem. Int. Ed. 2019, 58, 968–994. [Google Scholar] [CrossRef]
  33. Dieterle, F.; Ross, A.; Schlotterbeck, G.; Senn, H. Probabilistic Quotient Normalization as Robust Method to Account for Dilution of Complex Biological Mixtures. Application in 1H NMR Metabonomics. Anal. Chem. 2006, 78, 4281–4290. [Google Scholar] [CrossRef]
  34. RC Team. R: A Language and Environment for Statistical Computing; R Foundation for Statistical Computing: Vienna, Austria, 2017. [Google Scholar]
  35. Pang, Z.; Chong, J.; Zhou, G.; de Lima Morais, D.A.; Chang, L.; Barrette, M.; Gauthier, C.; Jacques, P.-É.; Li, S.; Xia, J. MetaboAnalyst 5.0: Narrowing the gap between raw spectra and functional insights. Nucleic Acids Res. 2021, 49, W388–W396. [Google Scholar] [CrossRef]
  36. Westerhuis, J.A.; van Velzen, E.J.J.; Hoefsloot, H.C.J.; Smilde, A.K. Multivariate paired data analysis: Multilevel PLSDA versus OPLSDA. Metabolomics 2010, 6, 119–128. [Google Scholar] [CrossRef] [Green Version]
  37. Benjamini, Y.; Hochberg, Y. Controlling the False Discovery Rate: A Practical and Powerful Approach to Multiple Testing. J. R. Stat. Soc. Ser. B 1995, 57, 289–300. [Google Scholar] [CrossRef]
  38. de Laurentiis, G.; Paris, D.; Melck, D.; Montuschi, P.; Maniscalco, M.; Bianco, A.; Sofia, M.; Motta, A. Separating Smoking-Related Diseases Using NMR-Based Metabolomics of Exhaled Breath Condensate. J. Proteome Res. 2013, 12, 1502–1511. [Google Scholar] [CrossRef]
  39. Airoldi, C.; Ciaramelli, C.; Fumagalli, M.; Bussei, R.; Mazzoni, V.; Viglio, S.; Iadarola, P.; Stolk, J. 1H NMR to Explore the Metabolome of Exhaled Breath Condensate in α1-Antitrypsin Deficient Patients: A Pilot Study. J. Proteome Res. 2016, 15, 4569–4578. [Google Scholar] [CrossRef]
  40. Vignoli, A.; Santini, G.; Tenori, L.; Macis, G.; Mores, N.; Macagno, F.; Pagano, F.; Higenbottam, T.; Luchinat, C.; Montuschi, P. NMR-Based Metabolomics for the Assessment of Inhaled Pharmacotherapy in Chronic Obstructive Pulmonary Disease Patients. J. Proteome Res. 2020, 19, 64–74. [Google Scholar] [CrossRef] [PubMed]
  41. Otsuka, M.; Harada, N.; Itabashi, T.; Ohmori, S. Blood and urinary levels of ethanol, acetaldehyde, and C4 compounds such as diacetyl, acetoin, and 2,3-butanediol in normal male students after ethanol ingestion. Alcohol 1999, 17, 119–124. [Google Scholar] [CrossRef]
  42. Sun, M.; Zhang, J.; Liang, S.; Du, Z.; Liu, J.; Sun, Z.; Duan, J. Metabolomic characteristics of hepatotoxicity in rats induced by silica nanoparticles. Ecotoxicol. Environ. Saf. 2021, 208, 111496. [Google Scholar] [CrossRef] [PubMed]
  43. Feng, J.; Liu, H.; Bhakoo, K.K.; Lu, L.; Chen, Z. A metabonomic analysis of organ specific response to USPIO administration. Biomaterials 2011, 32, 6558–6569. [Google Scholar] [CrossRef] [PubMed]
  44. Lin, B.; Zhang, H.; Lin, Z.; Fang, Y.; Tian, L.; Yang, H.; Yan, J.; Liu, H.; Zhang, W.; Xi, Z. Studies of single-walled carbon nanotubes-induced hepatotoxicity by NMR-based metabonomics of rat blood plasma and liver extracts. Nanoscale Res. Lett. 2013, 8, 236. [Google Scholar] [CrossRef] [PubMed] [Green Version]
  45. Sharma, V.; Ichikawa, M.; Freeze, H.H. Mannose metabolism: More than meets the eye. Biochem. Biophys. Res. Commun. 2014, 453, 220–228. [Google Scholar] [CrossRef] [Green Version]
  46. Brent, J. Current Management of Ethylene Glycol Poisoning. Drugs 2001, 61, 979–988. [Google Scholar] [CrossRef]
  47. Meléndez-Hevia, E.; De Paz-Lugo, P.; Cornish-Bowden, A.; Cárdenas, M.L. A weak link in metabolism: The metabolic capacity for glycine biosynthesis does not satisfy the need for collagen synthesis. J. Biosci. 2009, 34, 853–872. [Google Scholar] [CrossRef] [PubMed]
  48. Salido, E.; Pey, A.L.; Rodriguez, R.; Lorenzo, V. Primary hyperoxalurias: Disorders of glyoxylate detoxification. Biochim. Biophys. Acta Mol. Basis Dis. 2012, 1822, 1453–1464. [Google Scholar] [CrossRef] [Green Version]
  49. Carrola, J.; Bastos, V.; Daniel-da-Silva, A.L.; Gil, A.M.; Santos, C.; Oliveira, H.; Duarte, I.F. Macrophage Metabolomics Reveals Differential Metabolic Responses to Subtoxic Levels of Silver Nanoparticles and Ionic Silver. Eur. J. Inorg. Chem. 2020, 2020, 1867–1876. [Google Scholar] [CrossRef]
  50. Chhetri, D.R. Myo-inositol and its derivatives: Their emerging role in the treatment of human diseases. Front. Pharmacol. 2019, 10, 1172. [Google Scholar] [CrossRef] [Green Version]
  51. Bo, Y.; Jin, C.; Liu, Y.; Yu, W.; Kang, H. Metabolomic analysis on the toxicological effects of TiO2 nanoparticles in mouse fibroblast cells: From the perspective of perturbations in amino acid metabolism. Toxicol. Mech. Methods 2014, 24, 461–469. [Google Scholar] [CrossRef]
  52. Chen, Z.; Han, S.; Zhou, D.; Zheng, P.; Zhou, S.; Jia, G. Serum metabolomic signatures of Sprague-Dawley rats after oral administration of titanium dioxide nanoparticles. NanoImpact 2020, 19, 100236. [Google Scholar] [CrossRef]
  53. Pedraz-Petrozzi, B.; Elyamany, O.; Rummel, C.; Mulert, C. Effects of inflammation on the kynurenine pathway in schizophrenia—A systematic review. J. Neuroinflammation 2020, 17, 56. [Google Scholar] [CrossRef] [PubMed]
  54. Pelclova, D.; Zdimal, V.; Fenclova, Z.; Vlckova, S.; Turci, F.; Corazzari, I.; Kacer, P.; Schwarz, J.; Zikova, N.; Makes, O.; et al. Markers of oxidative damage of nucleic acids and proteins among workers exposed to TiO2 (nano) particles. Occup. Environ. Med. 2016, 73, 110–118. [Google Scholar] [CrossRef] [PubMed]
  55. Pelclova, D.; Zdimal, V.; Kacer, P.; Zikova, N.; Komarc, M.; Fenclova, Z.; Vlckova, S.; Schwarz, J.; Makeš, O.; Syslova, K.; et al. Markers of lipid oxidative damage in the exhaled breath condensate of nano TiO2 production workers. Nanotoxicology 2017, 11, 52–63. [Google Scholar] [CrossRef] [PubMed]
  56. Klomsiri, C.; Karplus, P.A.; Poole, L.B. Cysteine-based redox switches in enzymes. Antioxid. Redox Signal. 2011, 14, 1065–1077. [Google Scholar] [CrossRef] [PubMed] [Green Version]
  57. Kitchin, K.T.; Grulke, E.; Robinette, B.L.; Castellon, B.T. Metabolomic effects in HepG2 cells exposed to four TiO2 and two CeO2 nanomaterials. Environ. Sci. Nano 2014, 1, 466–477. [Google Scholar] [CrossRef]
  58. Grapov, D.; Fiehn, O.; Campbell, C.; Chandler, C.J.; Burnett, D.J.; Souza, E.C.; Casazza, G.A.; Keim, N.L.; Newman, J.W.; Hunter, G.R.; et al. Exercise plasma metabolomics and xenometabolomics in obese, sedentary, insulin-resistant women: Impact of a fitness and weight loss intervention. Am. J. Physiol. Endocrinol. Metab. 2019, 317, E999–E1014. [Google Scholar] [CrossRef]
  59. Adams, S.H. Emerging perspectives on essential amino acid metabolism in obesity and the insulin-resistant state. Adv. Nutr. 2011, 2, 445–456. [Google Scholar] [CrossRef] [Green Version]
  60. Worrall, E.B.; Gassain, S.; Cox, D.J.; Sugden, M.C.; Palmer, T.N. 3-Hydroxyisobutyrate dehydrogenase, an impurity in commercial 3-hydroxybutyrate dehydrogenase. Biochem. J. 1987, 241, 297–300. [Google Scholar] [CrossRef] [Green Version]
  61. Bu, Q.; Yan, G.; Deng, P.; Peng, F.; Lin, H.; Xu, Y.; Cao, Z.; Zhou, T.; Xue, A.; Wang, Y.; et al. NMR-based metabonomic study of the sub-acute toxicity of titanium dioxide nanoparticles in rats after oral administration. Nanotechnology 2010, 21, 125105. [Google Scholar] [CrossRef]
  62. Huang, Z.; Xu, B.; Huang, X.; Zhang, Y.; Yu, M.; Han, X.; Song, L.; Xia, Y.; Zhou, Z.; Wang, X.; et al. Metabolomics reveals the role of acetyl-l-carnitine metabolism in γ-Fe2O3 NP-induced embryonic development toxicity via mitochondria damage. Nanotoxicology 2019, 13, 204–220. [Google Scholar] [CrossRef] [PubMed]
  63. Pelclova, D.; Zdimal, V.; Kacer, P.; Fenclova, Z.; Vlckova, S.; Syslova, K.; Navratil, T.; Schwarz, J.; Zikova, N.; Barosova, H.; et al. Oxidative stress markers are elevated in exhaled breath condensate of workers exposed to nanoparticles during iron oxide pigment production. J. Breath Res. 2016, 10, 016004. [Google Scholar] [CrossRef] [PubMed]
  64. Islam, M.M.; Wallin, R.; Wynn, R.M.; Conway, M.; Fujii, H.; Mobley, J.A.; Chuang, D.T.; Hutson, S.M. A novel branched-chain amino acid metabolon: Protein-protein interactions in a supramolecular complex. J. Biol. Chem. 2007, 282, 11893–11903. [Google Scholar] [CrossRef] [PubMed] [Green Version]
  65. Oliphant, K.; Allen-Vercoe, E. Macronutrient metabolism by the human gut microbiome: Major fermentation by-products and their impact on host health. Microbiome 2019, 7, 91. [Google Scholar] [CrossRef] [PubMed]
  66. Pang, B.; McFaline, J.L.; Burgis, N.E.; Dong, M.; Taghizadeh, K.; Sullivan, M.R.; Elmquist, C.E.; Cunningham, R.P.; Dedon, P.C. Defects in purine nucleotide metabolism lead to substantial incorporation of xanthine and hypoxanthine into DNA and RNA. Proc. Natl. Acad. Sci. USA 2012, 109, 2319–2324. [Google Scholar] [CrossRef] [PubMed] [Green Version]
Figure 1. Fold change projections depicting differences in levels of individual metabolites observed in EBC samples between individual groups.
Applsci 11 06601 g001
Figure 2. OPLS-DA of pre-shift subjects (yellow circles) and healthy controls (blue diamonds) using 320 bins from EBC samples; Acc. 88.1%, Sen. 81.4%, Spe. 94.8% (a). OPLS-DA of post-shift subjects (red squares) and healthy controls (blue diamonds) using 320 bins from EBC samples; Acc. 88.7%, Sen. 93.9%, Spe. 83.5% (b).
Applsci 11 06601 g002
Figure 3. OPLS-DA of pre-shift (yellow circles) and post-shift subjects (red squares); Acc. 83.1%, Sen. 84.1%, Spe. 82.1% (a). Multilevel partial least squares (mPLS) analysis of pre-shift (yellow circles) and post-shift subjects (red squares); Acc. 82% (b). Both using 320 bins in each EBC sample.
Applsci 11 06601 g003
Figure 4. Boxplots of selected metabolites affected by NPs exposure.
Applsci 11 06601 g004
Figure 5. OPLS-DA of healthy controls (blue diamonds) and pre-shift subjects (yellow circles); Acc. 80.7%, Sen. 88.2%, Spe. 73.2% (a). OPLS-DA of post-shift subjects (red squares) and healthy controls (blue diamonds); Acc. 86.0%, Sen. 86.4%, Spe. 85.7% (b). Both using 58 normalized metabolites from blood plasma samples.
Applsci 11 06601 g005
Figure 6. OPLS-DA of pre-shift (yellow circles) and post-shift subjects (red squares); Acc. 75.4%, Sen. 74.0%, Spe. 76.9% (a). mPLS analysis of pre-shift (yellow circles) and post-shift subjects (red squares); Acc. 89% (b). Both using 58 normalized metabolites from blood plasma samples.
Applsci 11 06601 g006
Figure 7. Boxplots of metabolites with increased levels in the post-shift samples.
Applsci 11 06601 g007
Figure 8. Boxplots of metabolites showing a depletion in the post-shift samples.
Applsci 11 06601 g008
Figure 9. Boxplots of metabolites showing simultaneous changes in the pre- and post-shift group in comparison to the controls.
Applsci 11 06601 g009
Publisher’s Note: MDPI stays neutral with regard to jurisdictional claims in published maps and institutional affiliations.

