
A Comparison of Cone Beam Computed Tomography and Periapical Digital Radiography for Evaluation of Root Canal Preparation

Abstract
:1. Introduction
2. Materials and Methods
3. Results
4. Discussion
5. Conclusions
Funding
Institutional Review Board Statement
Informed Consent Statement
Data Availability Statement
Conflicts of Interest
References
- Pham, K.; Phan, T. Evaluation of root canal preparation using two nickel-titanium instrument systems via cone-beam computed tomography. Saudi Endod. J. 2019, 9, 210–215. [Google Scholar] [CrossRef]
- Pham, K.; Nguyen, N. Cutting efficiency and dentinal defects using two single-file continuous rotary nickel-titanium instruments. Saudi Endod. J. 2020, 10, 56–60. [Google Scholar] [CrossRef]
- Freire, L.G.; Gavini, G.; Cunha, R.S.; Santos, M.D. Assessing apical transportation in curved canals: Comparison between cross-sections and micro-computed tomography. Braz. Oral Res. 2012, 26, 222–227. [Google Scholar] [CrossRef] [PubMed] [Green Version]
- Fidler, A.; Plotino, G.; Kuralt, M. A critical review of methods for quantitative evaluation of root canal transportation. J. Endod. 2021, 47, 721–731. [Google Scholar] [CrossRef] [PubMed]
- Van Pham, K. Endodontic length measurements using 3D Endo, cone-beam computed tomography, and electronic apex locator. BMC Oral Health 2021, 21, 271. [Google Scholar] [CrossRef] [PubMed]
- Van Pham, K. Endodontic length measurements using cone beam computed tomography with dedicated or conventional software at different voxel sizes. Sci. Rep. 2021, 11, 9432. [Google Scholar] [CrossRef] [PubMed]
- Pham, K.V.; Khuc, N.K. The accuracy of endodontic length measurement using cone-beam computed tomography in comparison with electronic apex locators. Iran. Endod. J. 2020, 15, 12–17. [Google Scholar] [CrossRef]
- Nguyen, P.; Pham, K. Endodontic length measurements using different modalities: An in vitro study. J. Int. Soc. Prev. Community Dent. 2020, 10, 752–758. [Google Scholar] [CrossRef] [PubMed]
- Portelli, M.; Militi, A.; Lo Giudice, A.; Lo Giudice, R.; Rustico, L.; Fastuca, R.; Nucera, R. 3D assessment of endodontic lesions with a low-dose CBCT protocol. Dent. J. 2020, 8, 51. [Google Scholar] [CrossRef] [PubMed]
- Lo Giudice, R.; Nicita, F.; Puleio, F.; Alibrandi, A.; Cervino, G.; Lizio, A.S.; Pantaleo, G. Accuracy of periapical radiography and CBCT in endodontic evaluation. Int. J. Dent. 2018, 2018, 2514243. [Google Scholar] [CrossRef] [PubMed] [Green Version]
- Ammar, S.A.; Sabet, N.E.; Bastawy, H.A. Accuracy of CBCT, digital and conventional radiography in evaluating the shaping performance of a novel niti rotary system (an in vitro study). Egypt. Dent. J. 2020, 66, 2751–2761. [Google Scholar] [CrossRef]
- Schneider, S.W. A comparison of canal preparations in straight and curved root canals. Oral Surg. Oral Med. Oral Pathol. 1971, 32, 271–275. [Google Scholar] [CrossRef]
- Neelakantan, P.; Subbarao, C.; Subbarao, C.V. Comparative evaluation of modified canal staining and clearing technique, cone-beam computed tomography, peripheral quantitative computed tomography, spiral computed tomography, and plain and contrast medium–enhanced digital radiography in studying root canal morphology. J. Endod. 2010, 36, 1547–1551. [Google Scholar] [CrossRef] [PubMed]
- Lee, J.; Koh, D.; Ong, C.N. Statistical evaluation of agreement between two methods for measuring a quantitative variable. Comput. Biol. Med. 1989, 19, 61–70. [Google Scholar] [CrossRef]
- Bland, J.M.; Altman, D.G. A note on the use of the intraclass correlation coefficient in the evaluation of agreement between two methods of measurement. Comput. Biol. Med. 1990, 20, 337–340. [Google Scholar] [CrossRef]
- Bland, J.M.; Altman, D.G. Measuring agreement in method comparison studies. Stat. Methods Med. Res. 1999, 8, 135–160. [Google Scholar] [CrossRef] [PubMed]
- Bland, J.M.; Altman, D.G. Statistical methods for assessing agreement between two methods of clinical measurement. Lancet 1986, 1, 307–310. [Google Scholar] [CrossRef]
- Altman, D.G.; Bland, J.M. Measurement in medicine: The analysis of method comparison studies. J. R. Stat. Soc. Ser. D 1983, 32, 307–317. [Google Scholar] [CrossRef]
- Bui, A.; Pham, K. Evaluation of reparative dentine bridge formation after direct pulp capping with biodentine. J. Int. Soc. Prev. Community Dent. 2021, 11, 77–82. [Google Scholar] [CrossRef] [PubMed]


| Parameters | Levels (mm) | Paired t-Test | Linear Regression | Fixed Bias | Proportional Bias | ||
|---|---|---|---|---|---|---|---|
| Mean Bias | 95% CI | p | p | ||||
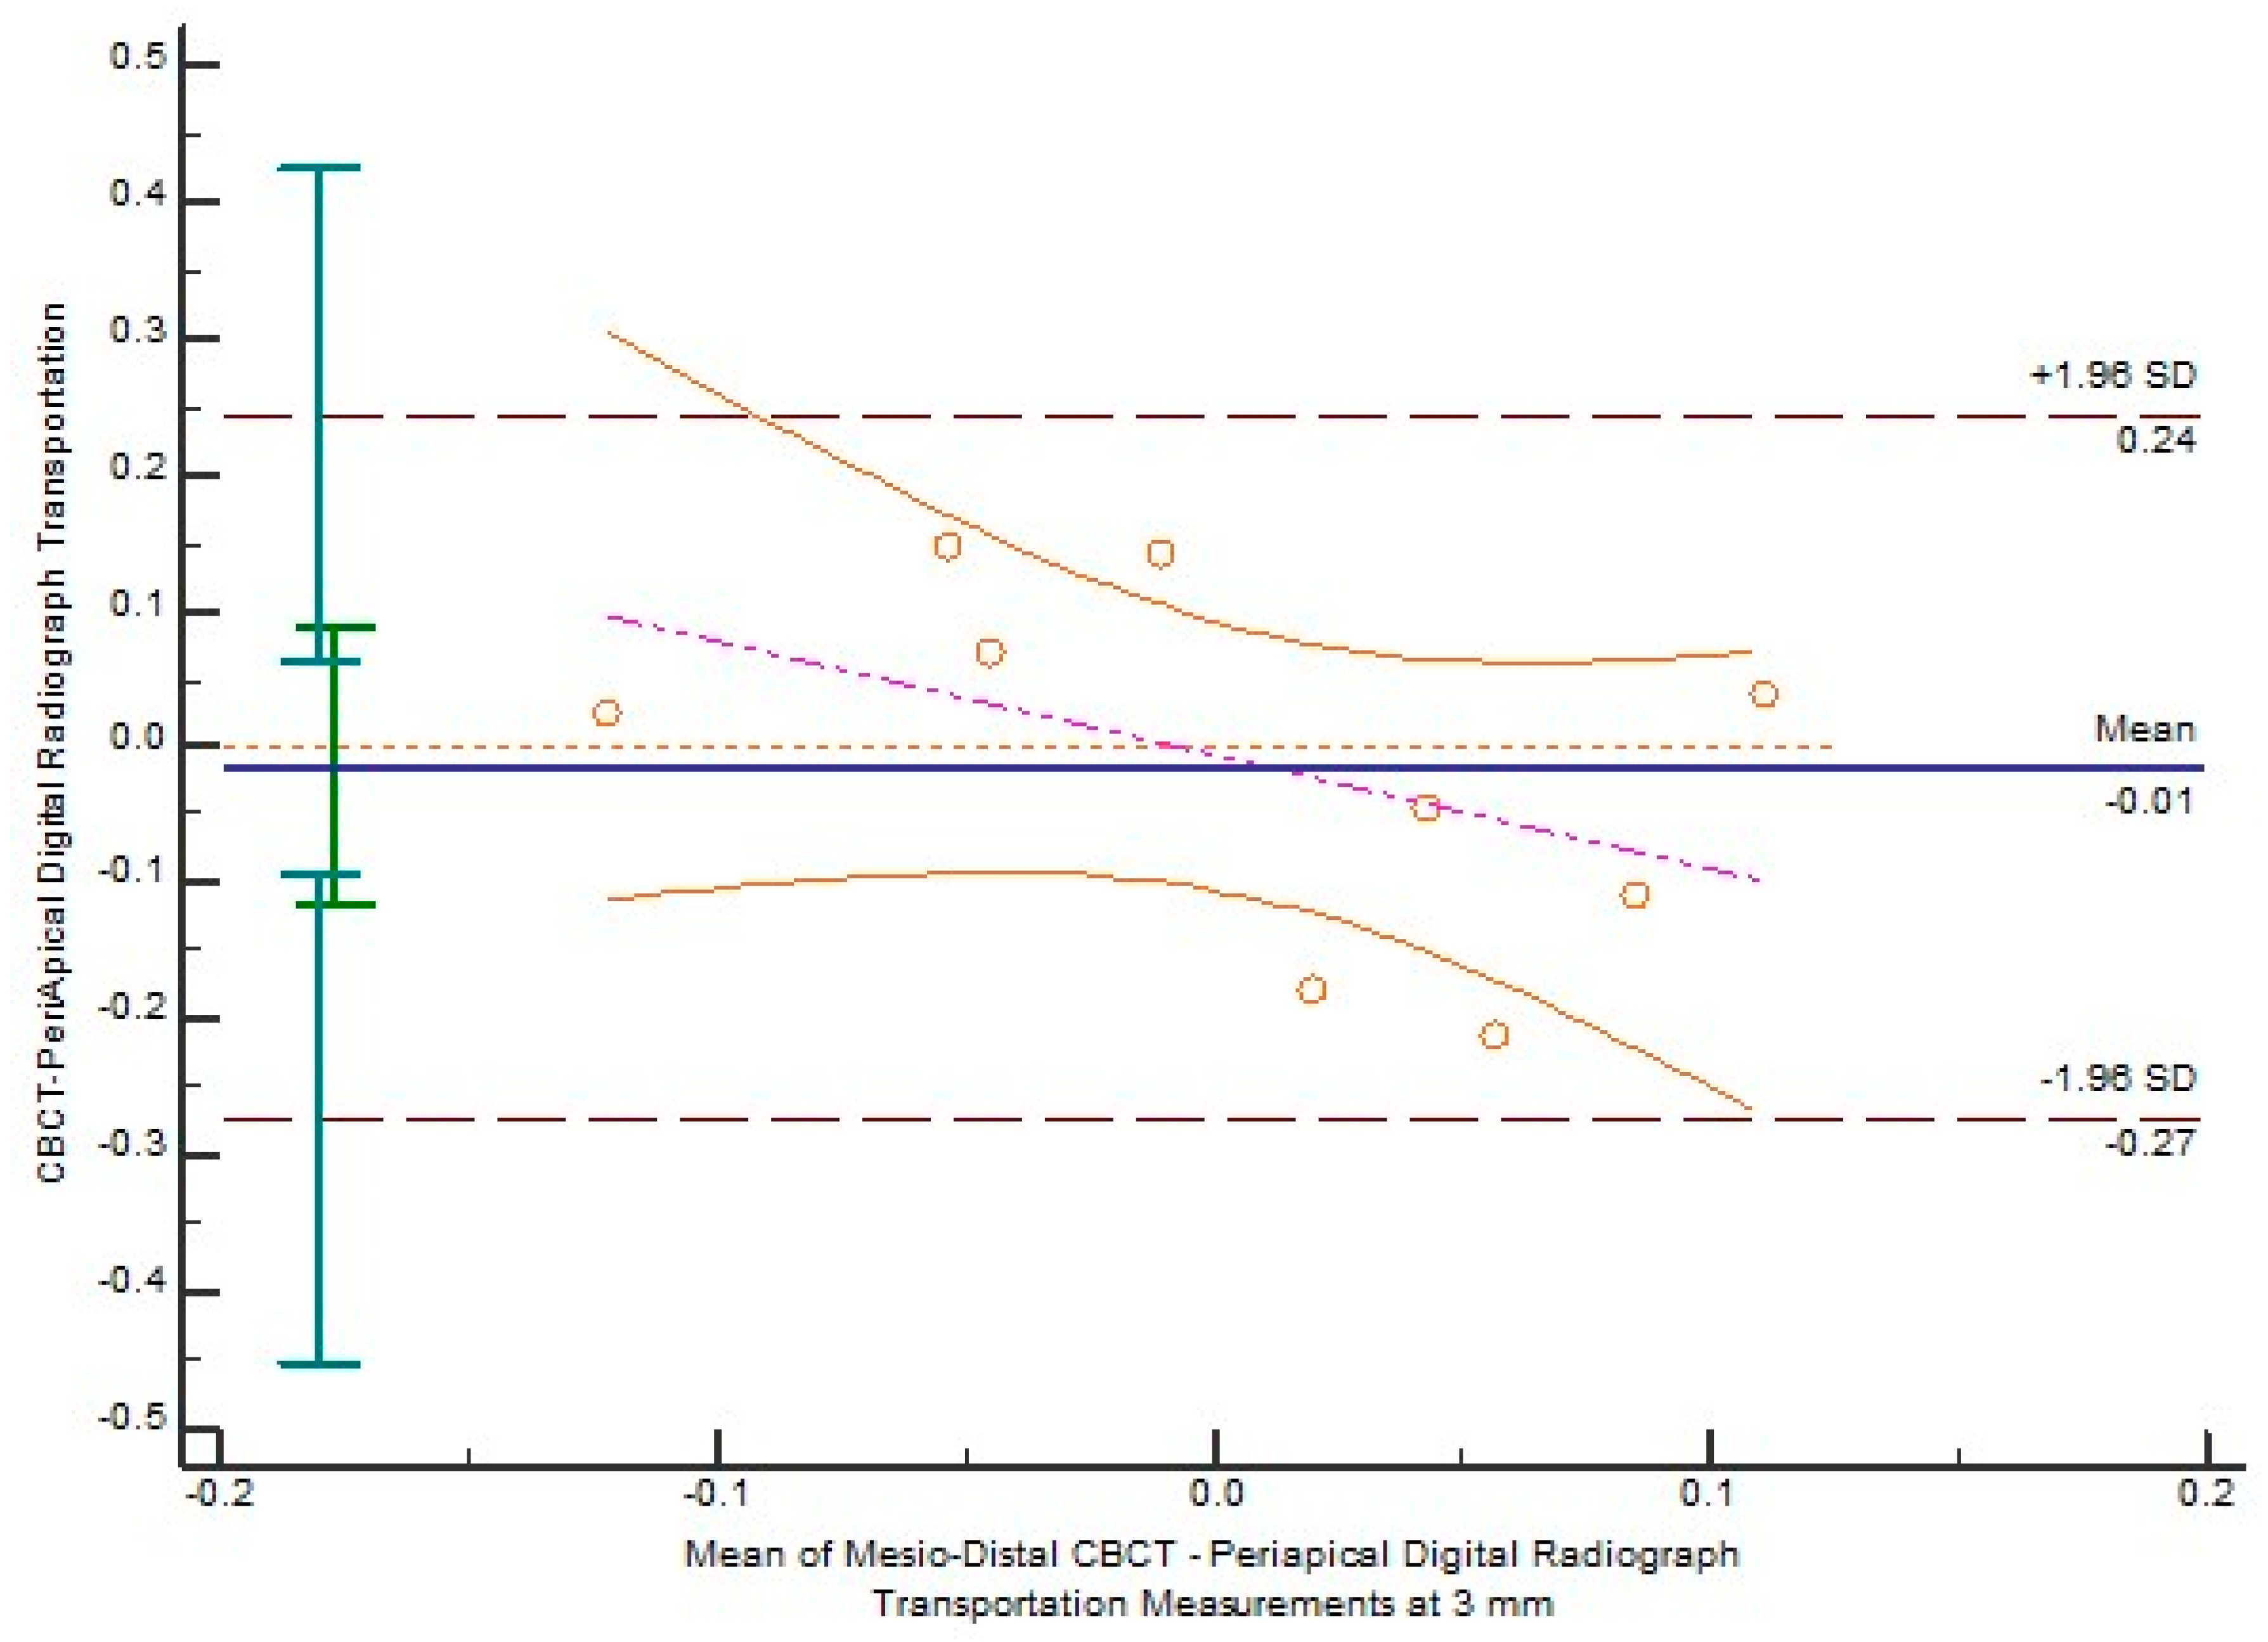
| Transportation | 3 | −0.01489 | −0.1162 to 0.08643 | 0.7434 | 0.1974 | No | No |
| 4 | 0.06433 | −0.04719 to 0.1759 | 0.2201 | 0.0056 * | No | Yes | |
| 5 | 0.06322 | −0.05968 to 0.1861 | 0.2696 | 0.7004 | No | No | |
| 6 | 0.03778 | −0.06980 to 0.1454 | 0.4415 | 0.6484 | No | No | |
| 7 | −0.07056 | −0.1506 to 0.009513 | 0.0766 | 0.9111 | No | No | |
| Centering ratio | 3 | 0.3951 | −1.2221 to 2.0123 | 0.5886 | 0.8721 | No | No |
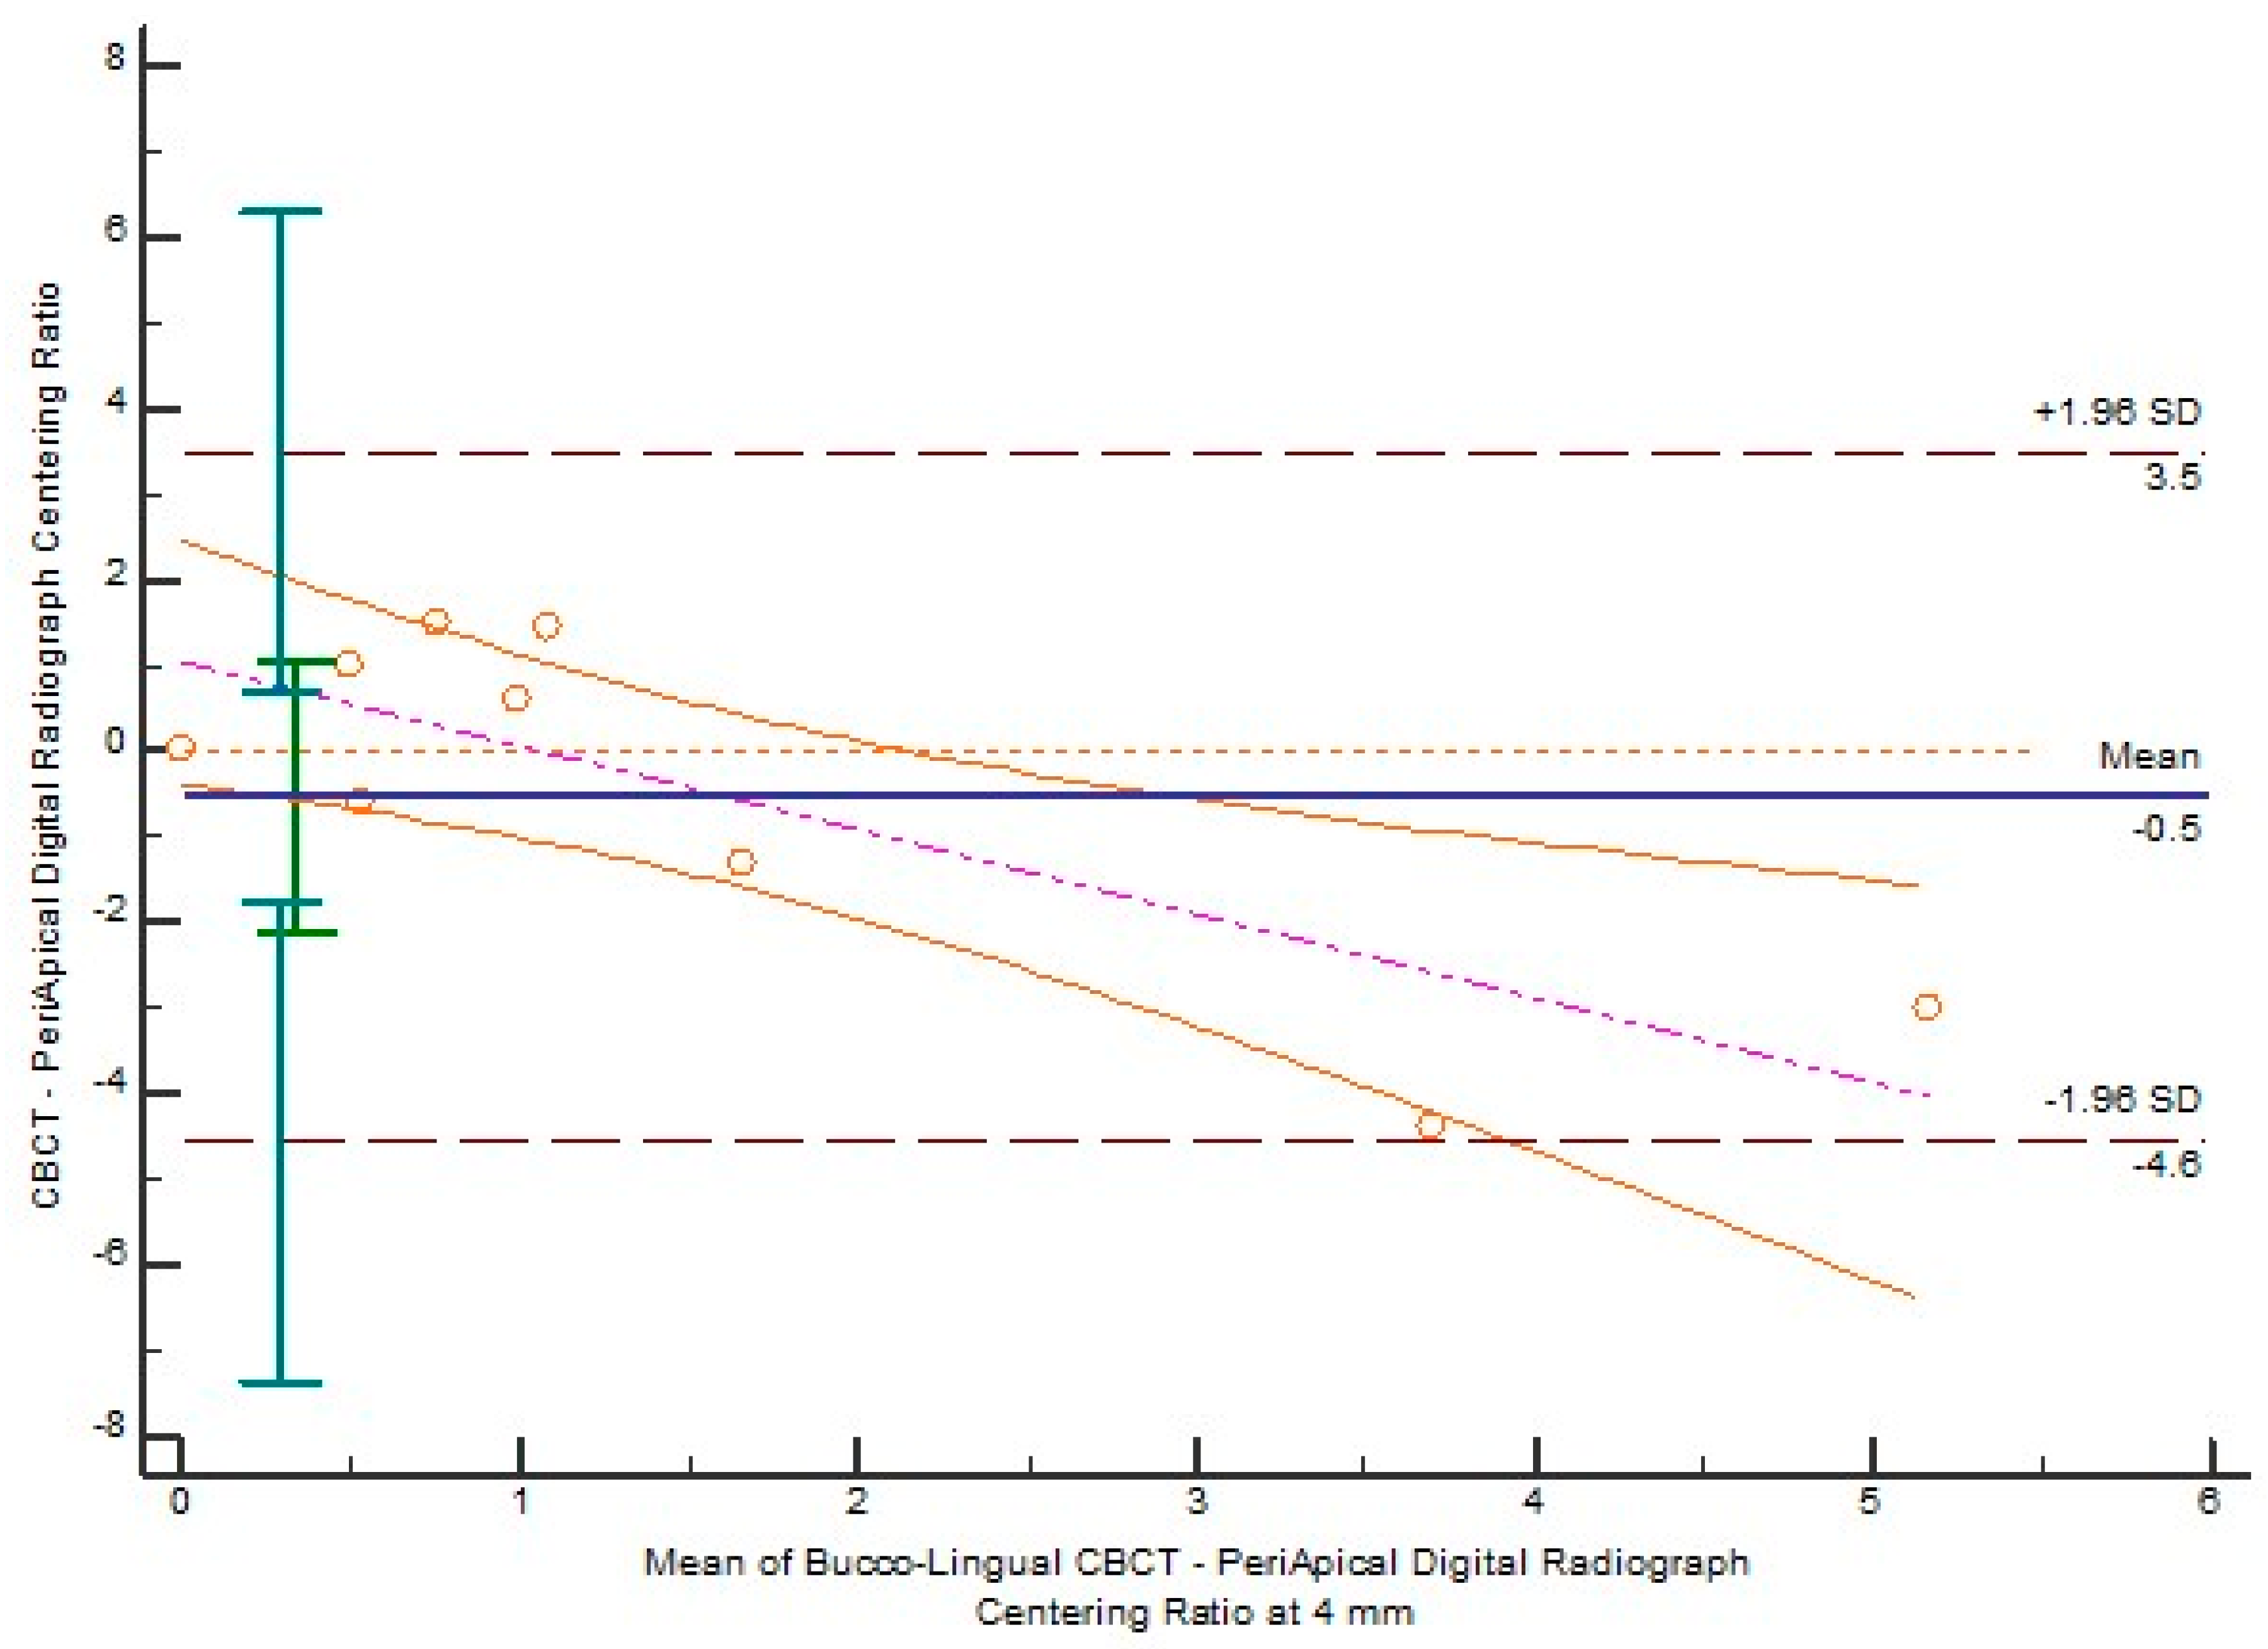
| 4 | 0.6271 | −0.2147 to 1.4689 | 0.1241 | 0.0114 * | No | Yes | |
| 5 | 0.1771 | −1.7706 to 2.1247 | 0.8392 | 0.0527 | No | No | |
| 6 | 0.3352 | −0.2695 to 0.9399 | 0.2370 | 0.2078 | No | No | |
| 7 | −0.3834 | −0.7697 to 0.002949 | 0.0514 | 0.2339 | No | No | |
| Parameters | Levels (mm) | Paired t-Test | Linear Regression | Fixed Bias | Proportional Bias | ||
|---|---|---|---|---|---|---|---|
| Mean Bias | 95% CI | p | p | ||||
| Transportation | 3 | −0.01700 | −0.07900 to 0.04500 | 0.5448 | 0.6202 | No | No |
| 4 | 0.002000 | −0.1571 to 0.1611 | 0.9776 | 0.2485 | No | No | |
| 5 | −0.05544 | −0.1687 to 0.05778 | 0.2915 | 0.0978 | No | No | |
| 6 | 0.01144 | −0.2180 to 0.2408 | 0.9112 | 0.7939 | No | No | |
| 7 | −0.01744 | −0.2471 to 0.2122 | 0.8653 | 0.0211 * | No | Yes | |
| Centering ratio | 3 | 0.7195 | −0.4977 to 1.9368 | 0.2100 | 0.2946 | No | No |
| 4 | −0.5300 | −2.1093 to 1.0492 | 0.4612 | 0.0076 * | No | Yes | |
| 5 | −0.1309 | −2.8404 to 2.5786 | 0.9140 | 0.3154 | No | No | |
| 6 | −0.1871 | −4.0681 to 3.6940 | 0.9142 | 0.9227 | No | No | |
| 7 | −1.2193 | −3.7273 to 1.2887 | 0.2948 | 0.0011 * | No | Yes | |
| Directions | Parameters | Paired t-Test | Linear Regression | Fixed Bias | Proportional Bias | ||
|---|---|---|---|---|---|---|---|
| Mean Bias | 95% CI | p | p | ||||
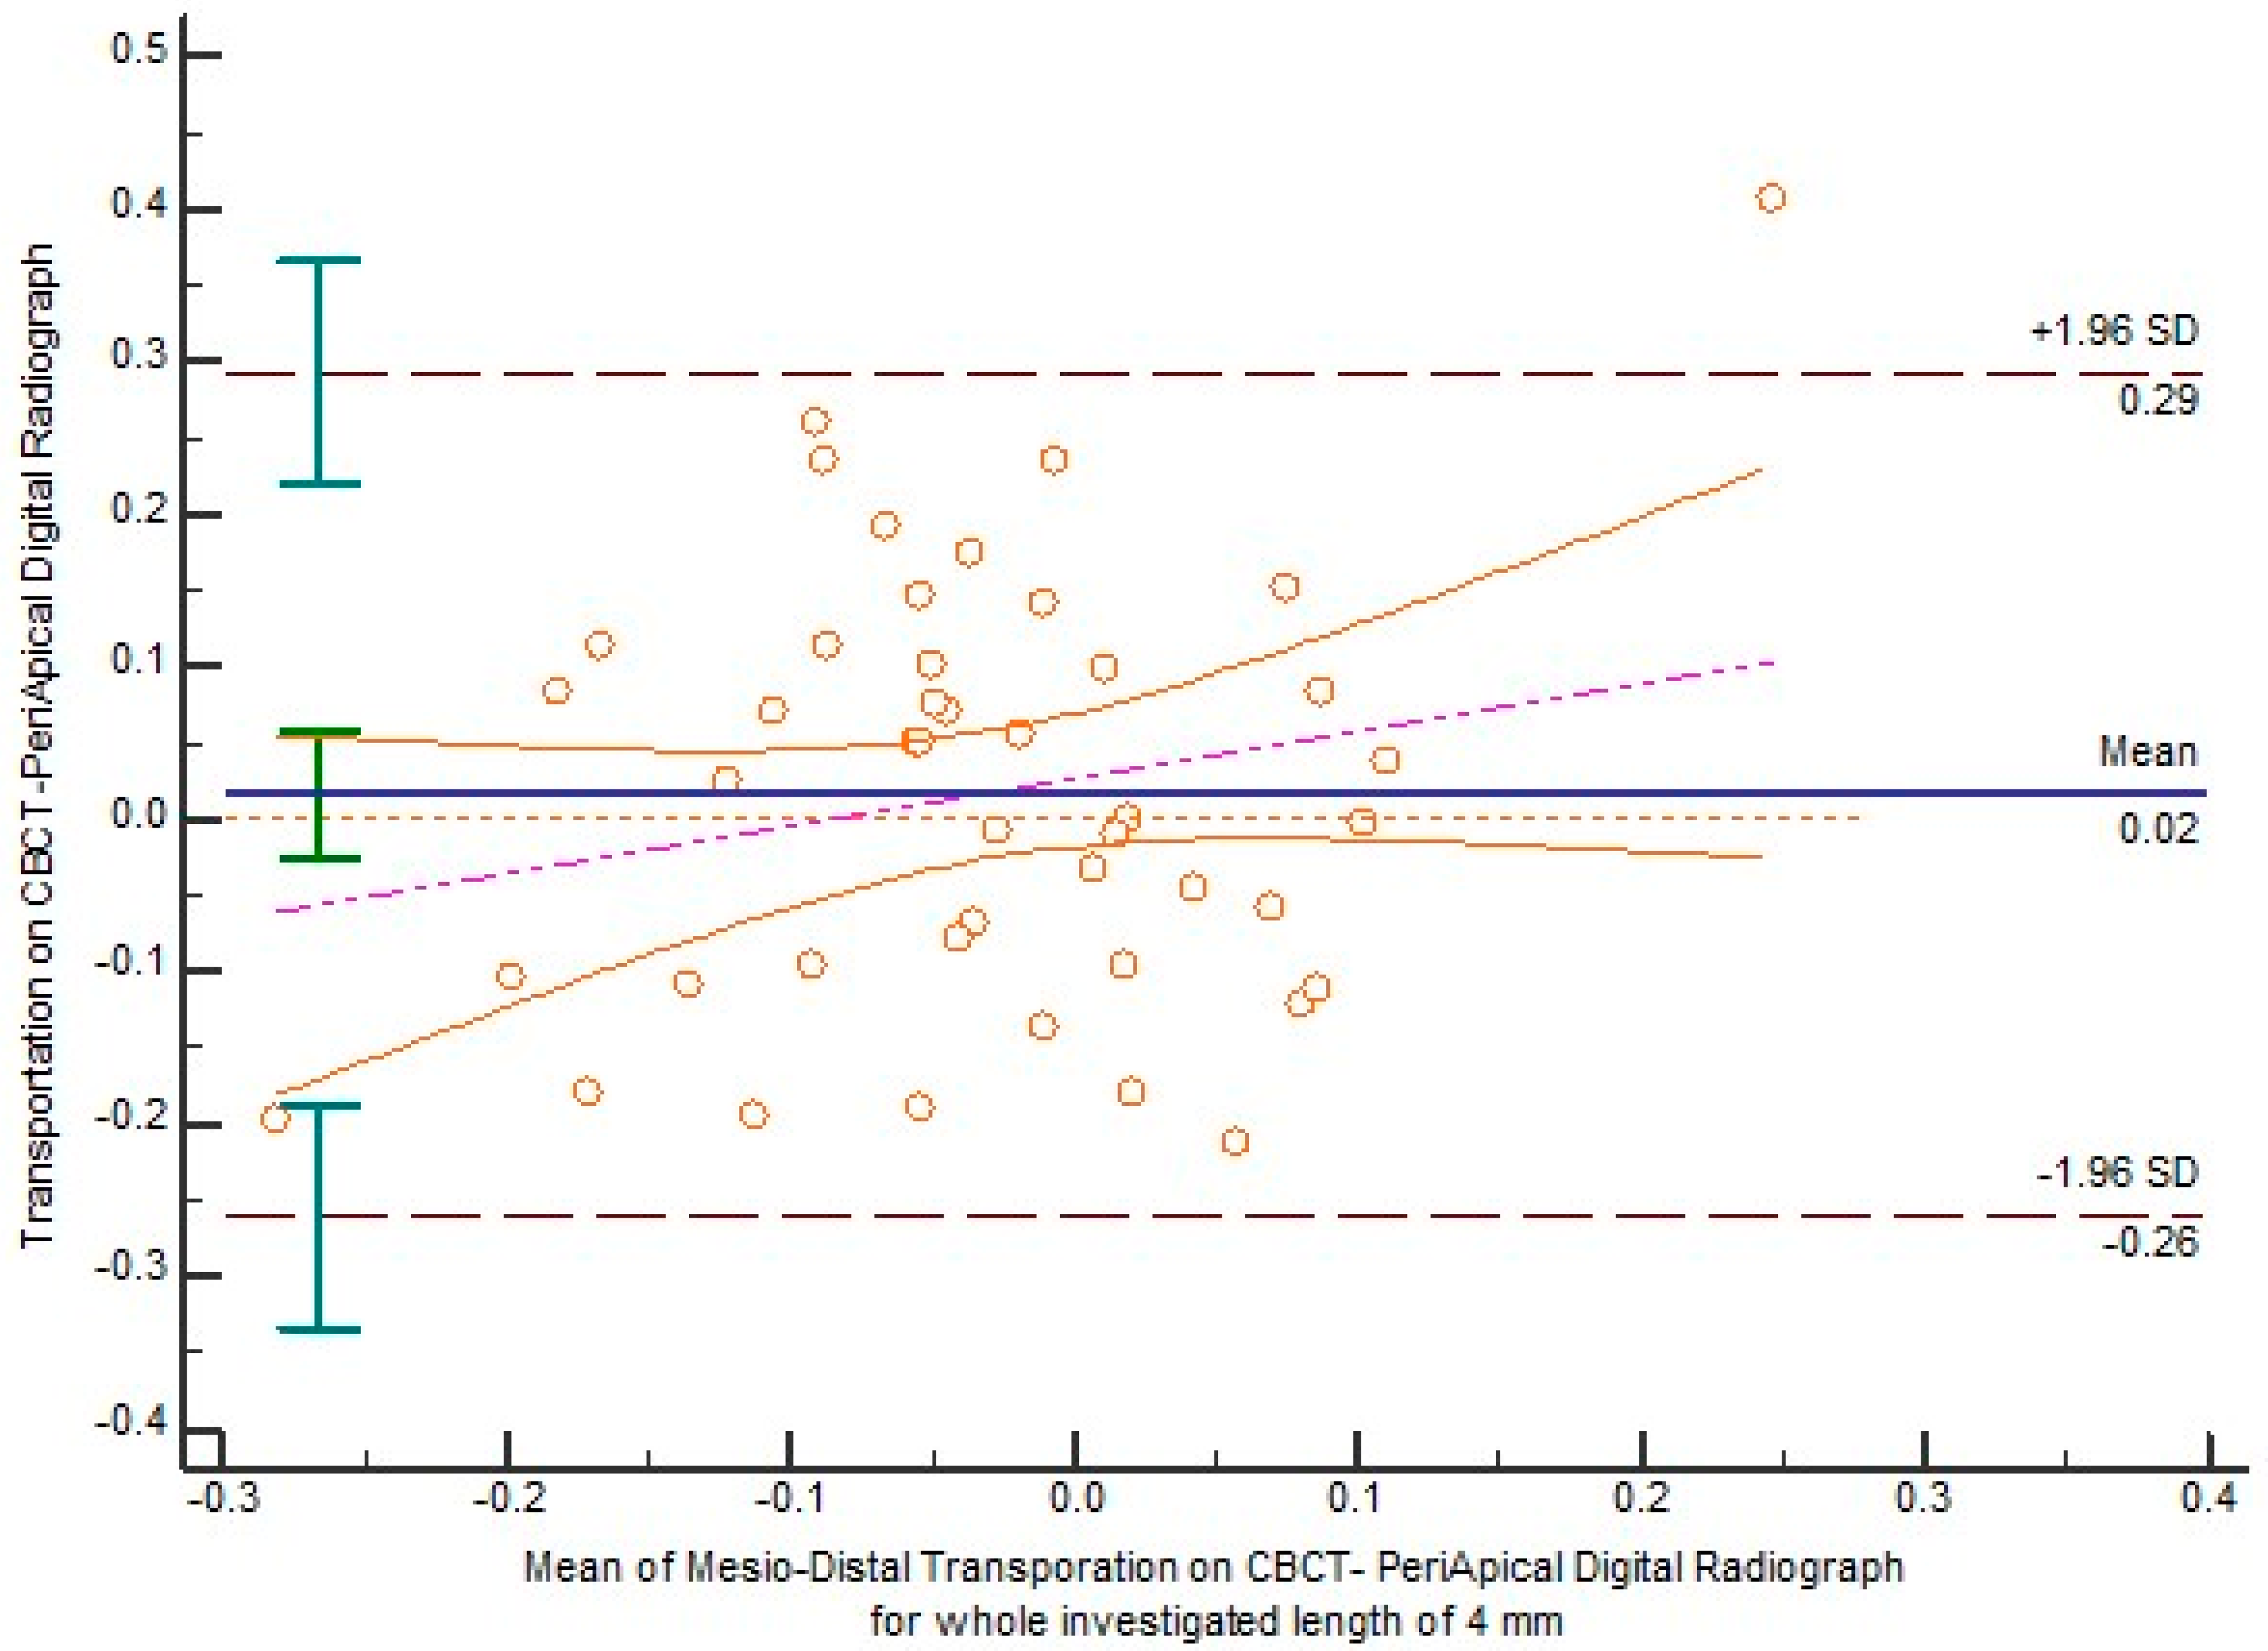
| Mesio-distal | Transportation | 0.01598 | −0.02643 to 0.05839 | 0.4517 | 0.1612 | No | No |
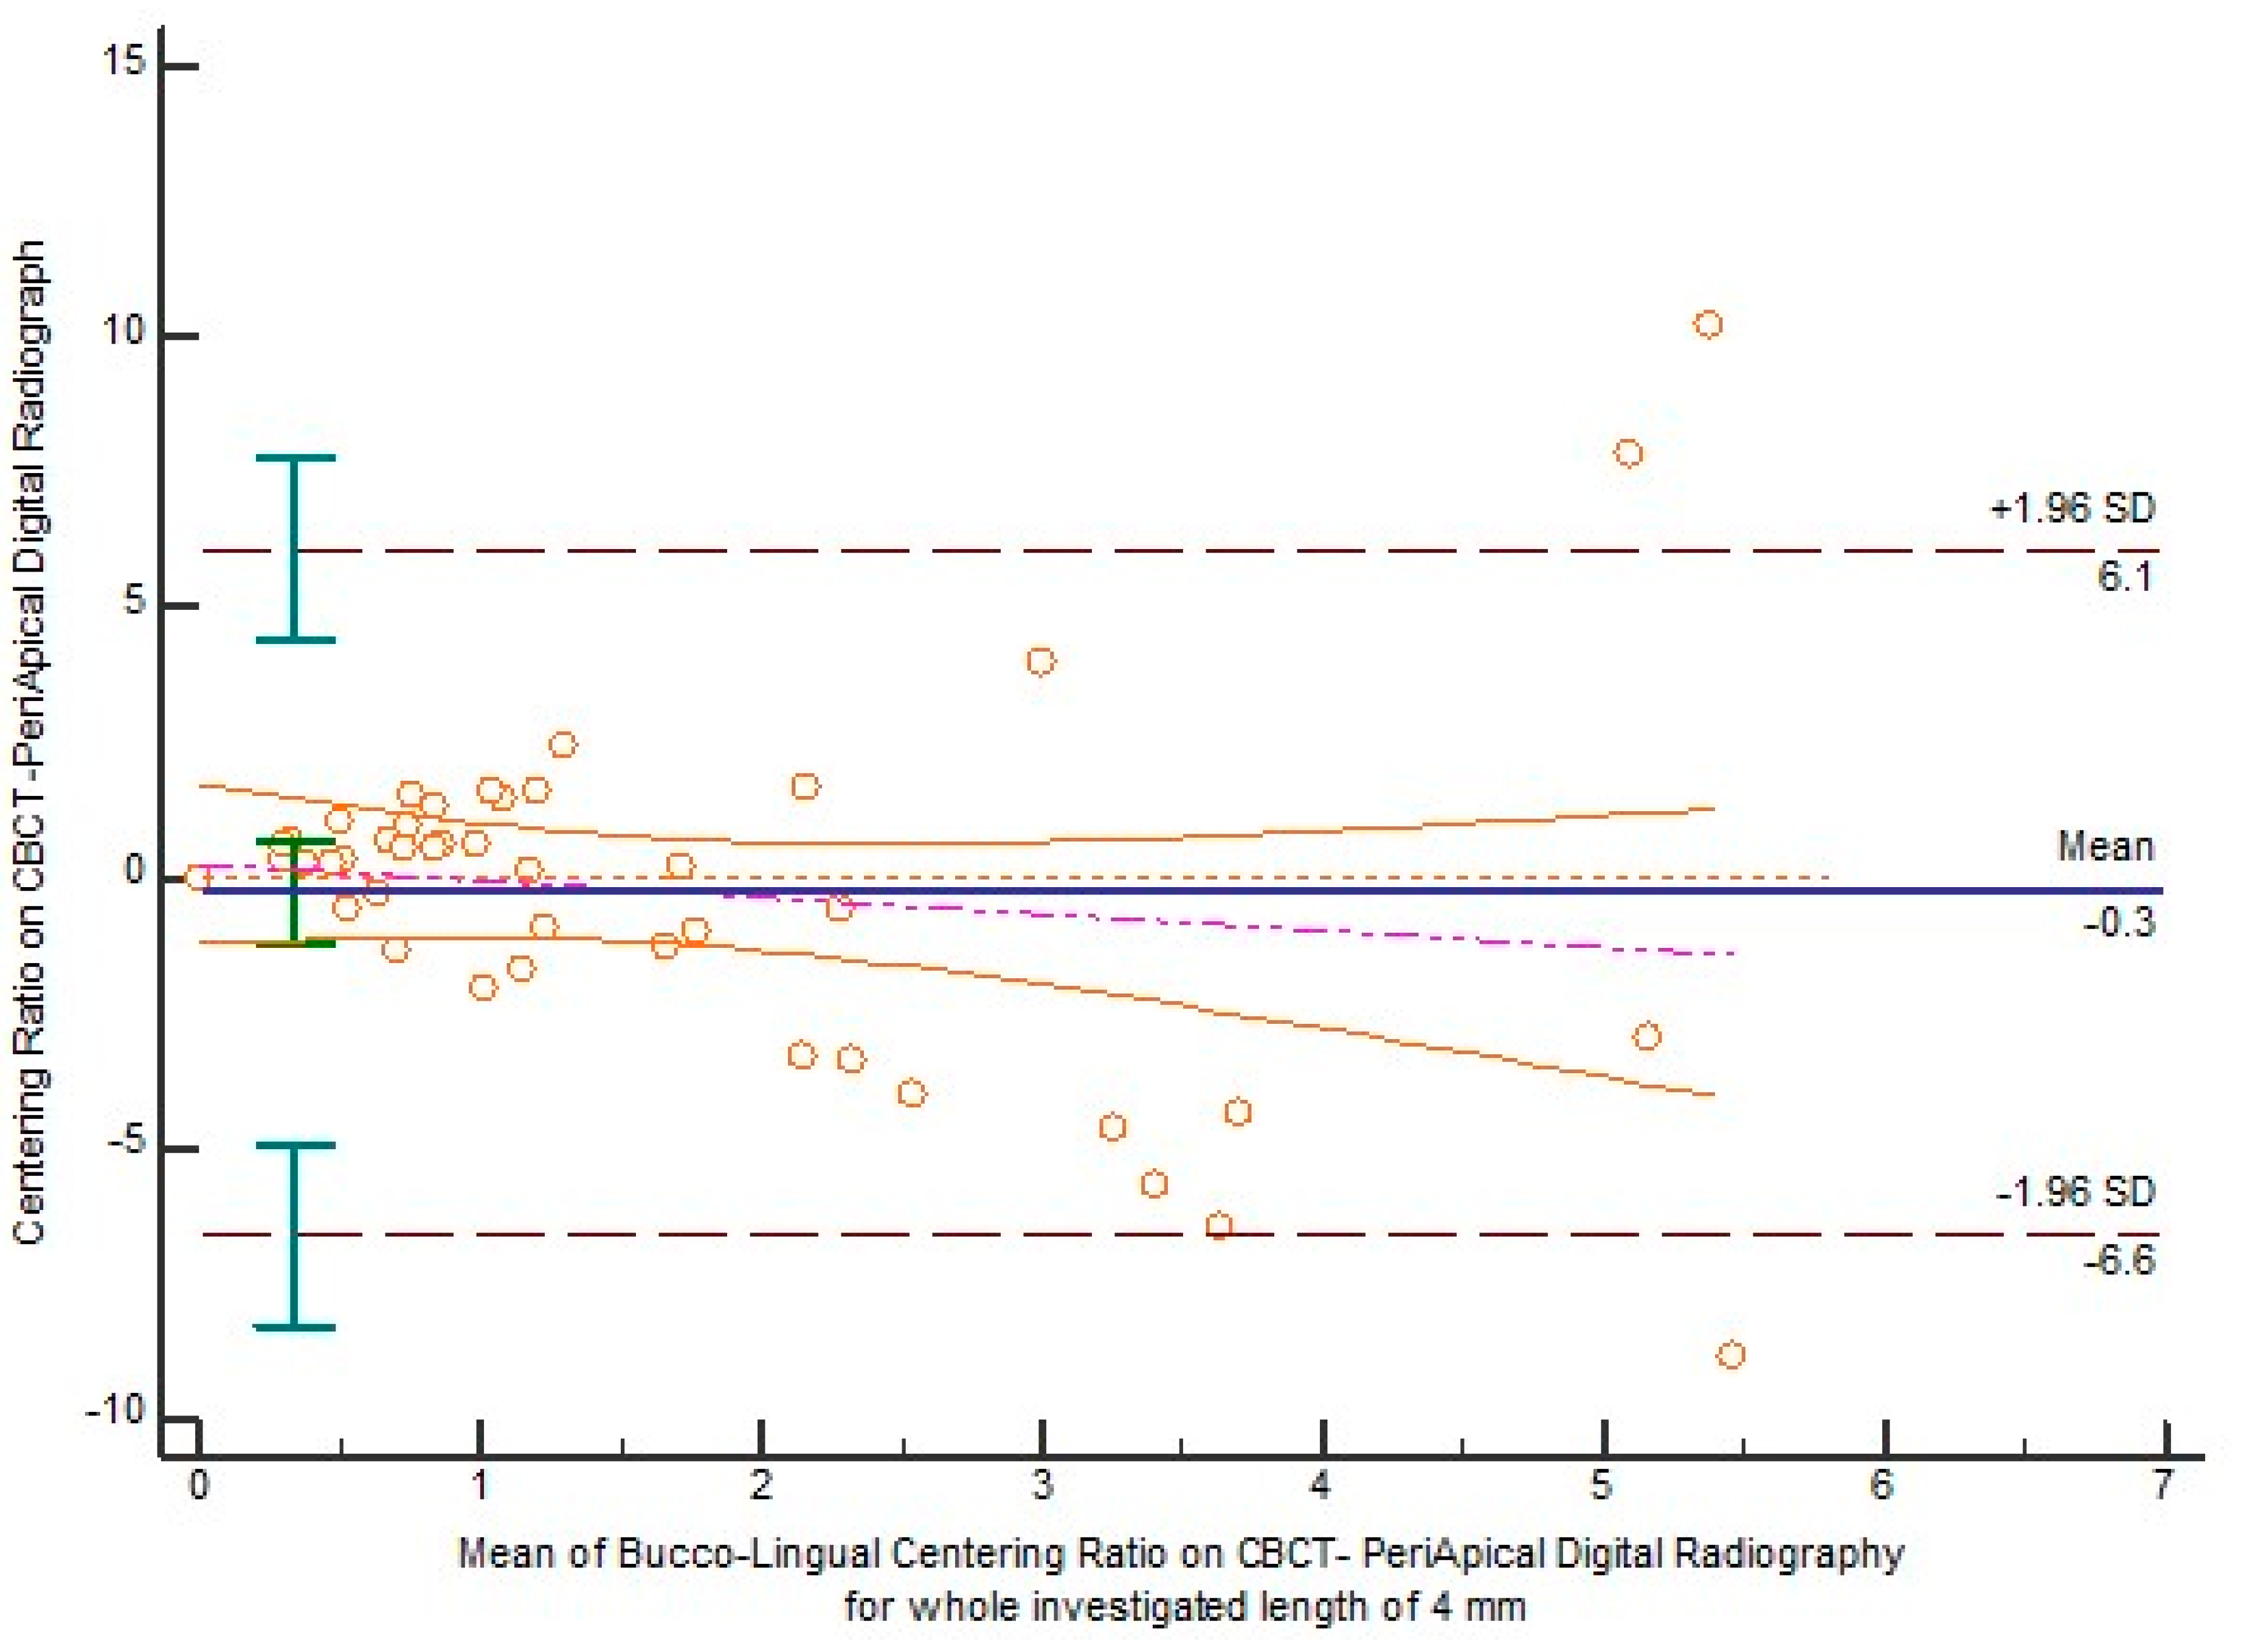
| Centering ratio | 0.2302 | −0.2416 to 0.7020 | 0.3308 | 0.8432 | No | No | |
| Bucco-lingual | Transportation | −0.01529 | −0.07964 to 0.04906 | 0.6344 | 0.2332 | No | No |
| Centering ratio | −0.2696 | −1.2411 to 0.7020 | 0.5789 | 0.3601 | No | No | |
Publisher’s Note: MDPI stays neutral with regard to jurisdictional claims in published maps and institutional affiliations. |
© 2021 by the author. Licensee MDPI, Basel, Switzerland. This article is an open access article distributed under the terms and conditions of the Creative Commons Attribution (CC BY) license (https://creativecommons.org/licenses/by/4.0/).
Share and Cite
Pham, K.V. A Comparison of Cone Beam Computed Tomography and Periapical Digital Radiography for Evaluation of Root Canal Preparation. Appl. Sci. 2021, 11, 6599. https://doi.org/10.3390/app11146599
Pham KV. A Comparison of Cone Beam Computed Tomography and Periapical Digital Radiography for Evaluation of Root Canal Preparation. Applied Sciences. 2021; 11(14):6599. https://doi.org/10.3390/app11146599
Chicago/Turabian StylePham, Khoa Van. 2021. "A Comparison of Cone Beam Computed Tomography and Periapical Digital Radiography for Evaluation of Root Canal Preparation" Applied Sciences 11, no. 14: 6599. https://doi.org/10.3390/app11146599