Article

Exploring Serum NMR-Based Metabolomic Fingerprint of Colorectal Cancer Patients: Effects of Surgery and Possible Associations with Cancer Relapse

1
Magnetic Resonance Center (CERM) and Department of Chemistry “Ugo Schiff”, University of Florence, 50019 Sesto Fiorentino, Italy
2
Consorzio Interuniversitario Risonanze Magnetiche Metallo Proteine (CIRMMP), 50019 Sesto Fiorentino, Italy
3
Department of Medical Oncology, New Hospital of Prato-S. Stefano, 59100 Prato, Italy
4
“Sandro Pitigliani” Translational Research Unit, New Hospital of Prato-S. Stefano, 59100 Prato, Italy
5
Bioinformatics Unit, Medical Oncology Department, New Hospital of Prato-S. Stefano, 59100 Prato, Italy
6
Department of Surgery, New Hospital of Prato-S. Stefano, 59100 Prato, Italy
7
Department of Medicine (DAME), University of Udine, 33100 Udine, Italy
*
Authors to whom correspondence should be addressed.
Co-first authors.
Appl. Sci. 2021, 11(23), 11120; https://doi.org/10.3390/app112311120
Submission received: 21 October 2021 / Revised: 11 November 2021 / Accepted: 18 November 2021 / Published: 23 November 2021

Abstract

:
Background: Colorectal cancer (CRC) is the fourth most commonly diagnosed and third most deadly cancer worldwide. Surgery is the main treatment option for early disease; however, a relevant proportion of CRC patients relapse. Here, variations among preoperative and postoperative serum metabolomic fingerprint of CRC patients were studied, and possible associations between metabolic variations and cancer relapse were explored. Methods: A total of 41 patients with stage I-III CRC, planned for radical resection, were enrolled. Serum samples, collected preoperatively (t0) and 4–6 weeks after surgery before the start of any treatment (t1), were analyzed via NMR spectroscopy. NMR data were analyzed using multivariate and univariate statistical approaches. Results: Serum metabolomic fingerprints show differential clustering between t0 and t1 (82–85% accuracy). Pyruvate, HDL-related parameters, acetone, and 3-hydroxybutyrate appear to be the major players in this discrimination. Eight out of the 41 CRC patients enrolled developed cancer relapse. Postoperative, relapsed patients show an increase of pyruvate and HDL-related parameters, and a decrease of Apo-A1 Apo-B100 ratio and VLDL-related parameters. Conclusions: Surgery significantly alters the metabolomic fingerprint of CRC patients. Some metabolic changes seem to be associated with the development of cancer relapse. These data, if validated in a larger cohort, open new possibilities for risk stratification in patients with early-stage CRC.

Graphical Abstract

1. Introduction

Colorectal cancer (CRC) is the third most frequently diagnosed cancer and the second leading cause of cancer death worldwide [1,2,3]. A total of 80% of colon cancers are diagnosed at early stage (stage 1 to 3), and surgery is the primary treatment option with curative intent for this type of disease [4]. Unfortunately, about 35% of these patients develop cancer relapse, which, in the majority of cases, occurs within the first 2–3 years after surgery [5,6]. TNM staging at diagnosis, based on depth of tumor wall invasion (T), lymph node involvement (N), and presence of distant metastasis (M), is currently the principal instrument available to predict risk of relapse, and thus to identify patients who may have potential benefits from adjuvant treatment [7,8].
Colorectal cancer is a heterogeneous disease, even within the same pathological stage, with different characteristics of clinical onset and different individual response to treatment. Moreover, patients with stage II and III CRC are shown to have different prognoses, particularly those who receive adjuvant chemotherapy, with 5-year overall survival (OS) ranging between 50% and 90% [9].
Adjuvant chemotherapy is strongly indicated in stage III disease, which is associated with a reduction of the relative risk of death of 33%, and an absolute survival benefit of 5–10% [10]. In stage III, the use of oxaliplatin in addition to fluoropyrimidines yields a further significant advantage of about 5% in terms of disease-free survival (DFS) and OS. Conversely, the therapeutic indication in patients with stage II CRC is controversial, as treatment with 5-Fluorouracil has an absolute benefit of 3–4% [11,12]. In patients with clinicopathologically high-risk stage II disease [13], decision-making around adjuvant chemotherapy treatment needs to be carefully evaluated and discussed, considering also recurrence risk factors such as baseline carcinoembryonic antigen and vascular invasion [7]. There is no evidence to support the use of adjuvant chemotherapy in stage I disease. Considering all the above mentioned data, identifying patients who are most likely to benefit from adjuvant chemotherapy and preventing the other patients from futile treatments and unnecessary exposure to toxicity is crucial in stage II disease.
Early detection of disease relapse is extremely relevant in CRC, as radical surgical intervention in patients with oligometastatic CRC can achieve a proven survival benefit. Therefore, early detection of relapse could potentially increase cure rates. Postoperative surveillance with clinical, radiological, and markers examination is often unable to identify early metastatic disease and/or postoperative minimal residual disease. Based on these considerations, improved risk stratification tools are required to reduce the number of patients treated unnecessarily.
Metabolomics is defined as the comprehensive measurement of the ensemble of metabolites present in a biological specimen, the so-called metabolome [14]. Metabolites represent, at the same time, the downstream output of the genome, transcriptome, and proteome, as well as the upstream input from various exogenous factors such as environment, lifestyle, diet, and drug administration [15]. In contrast to genomics, which indicates what might happen, metabolomic profiling/phenotyping captures what is actually happening in the body, and for this reason, in the last few years, metabolomics has been extensively applied in biomedical research [16,17,18,19,20,21,22].
Several relevant efforts to improve risk stratification in CRC have been made in the past years, considering mismatch repair (MMR) status, as well as BRAF and KRAS mutations, and the presence of tumor-derived circulating DNA [23,24]. Metabolomics has also emerged as a technique capable of contributing significantly in this setting [25,26,27,28,29,30,31]. Some of us have shown, in a cohort of elderly patients, that nuclear magnetic resonance (NMR)-based metabolomics can discriminate between early and metastatic CRC. This approach may be a useful tool to build a prognostic model capable of assessing the likelihood of cancer relapse, based on the degree to which a serum fingerprint derived from a patient with early disease resembles that of a metastatic patient [13].
The study presented here explores the variations among preoperative and postoperative metabolomic serum fingerprints of CRC patients, obtained via NMR spectroscopy (Figure 1); moreover, for the first time, to the best of our knowledge, possible associations between pre/post-surgery metabolic variations and cancer relapse are examined.

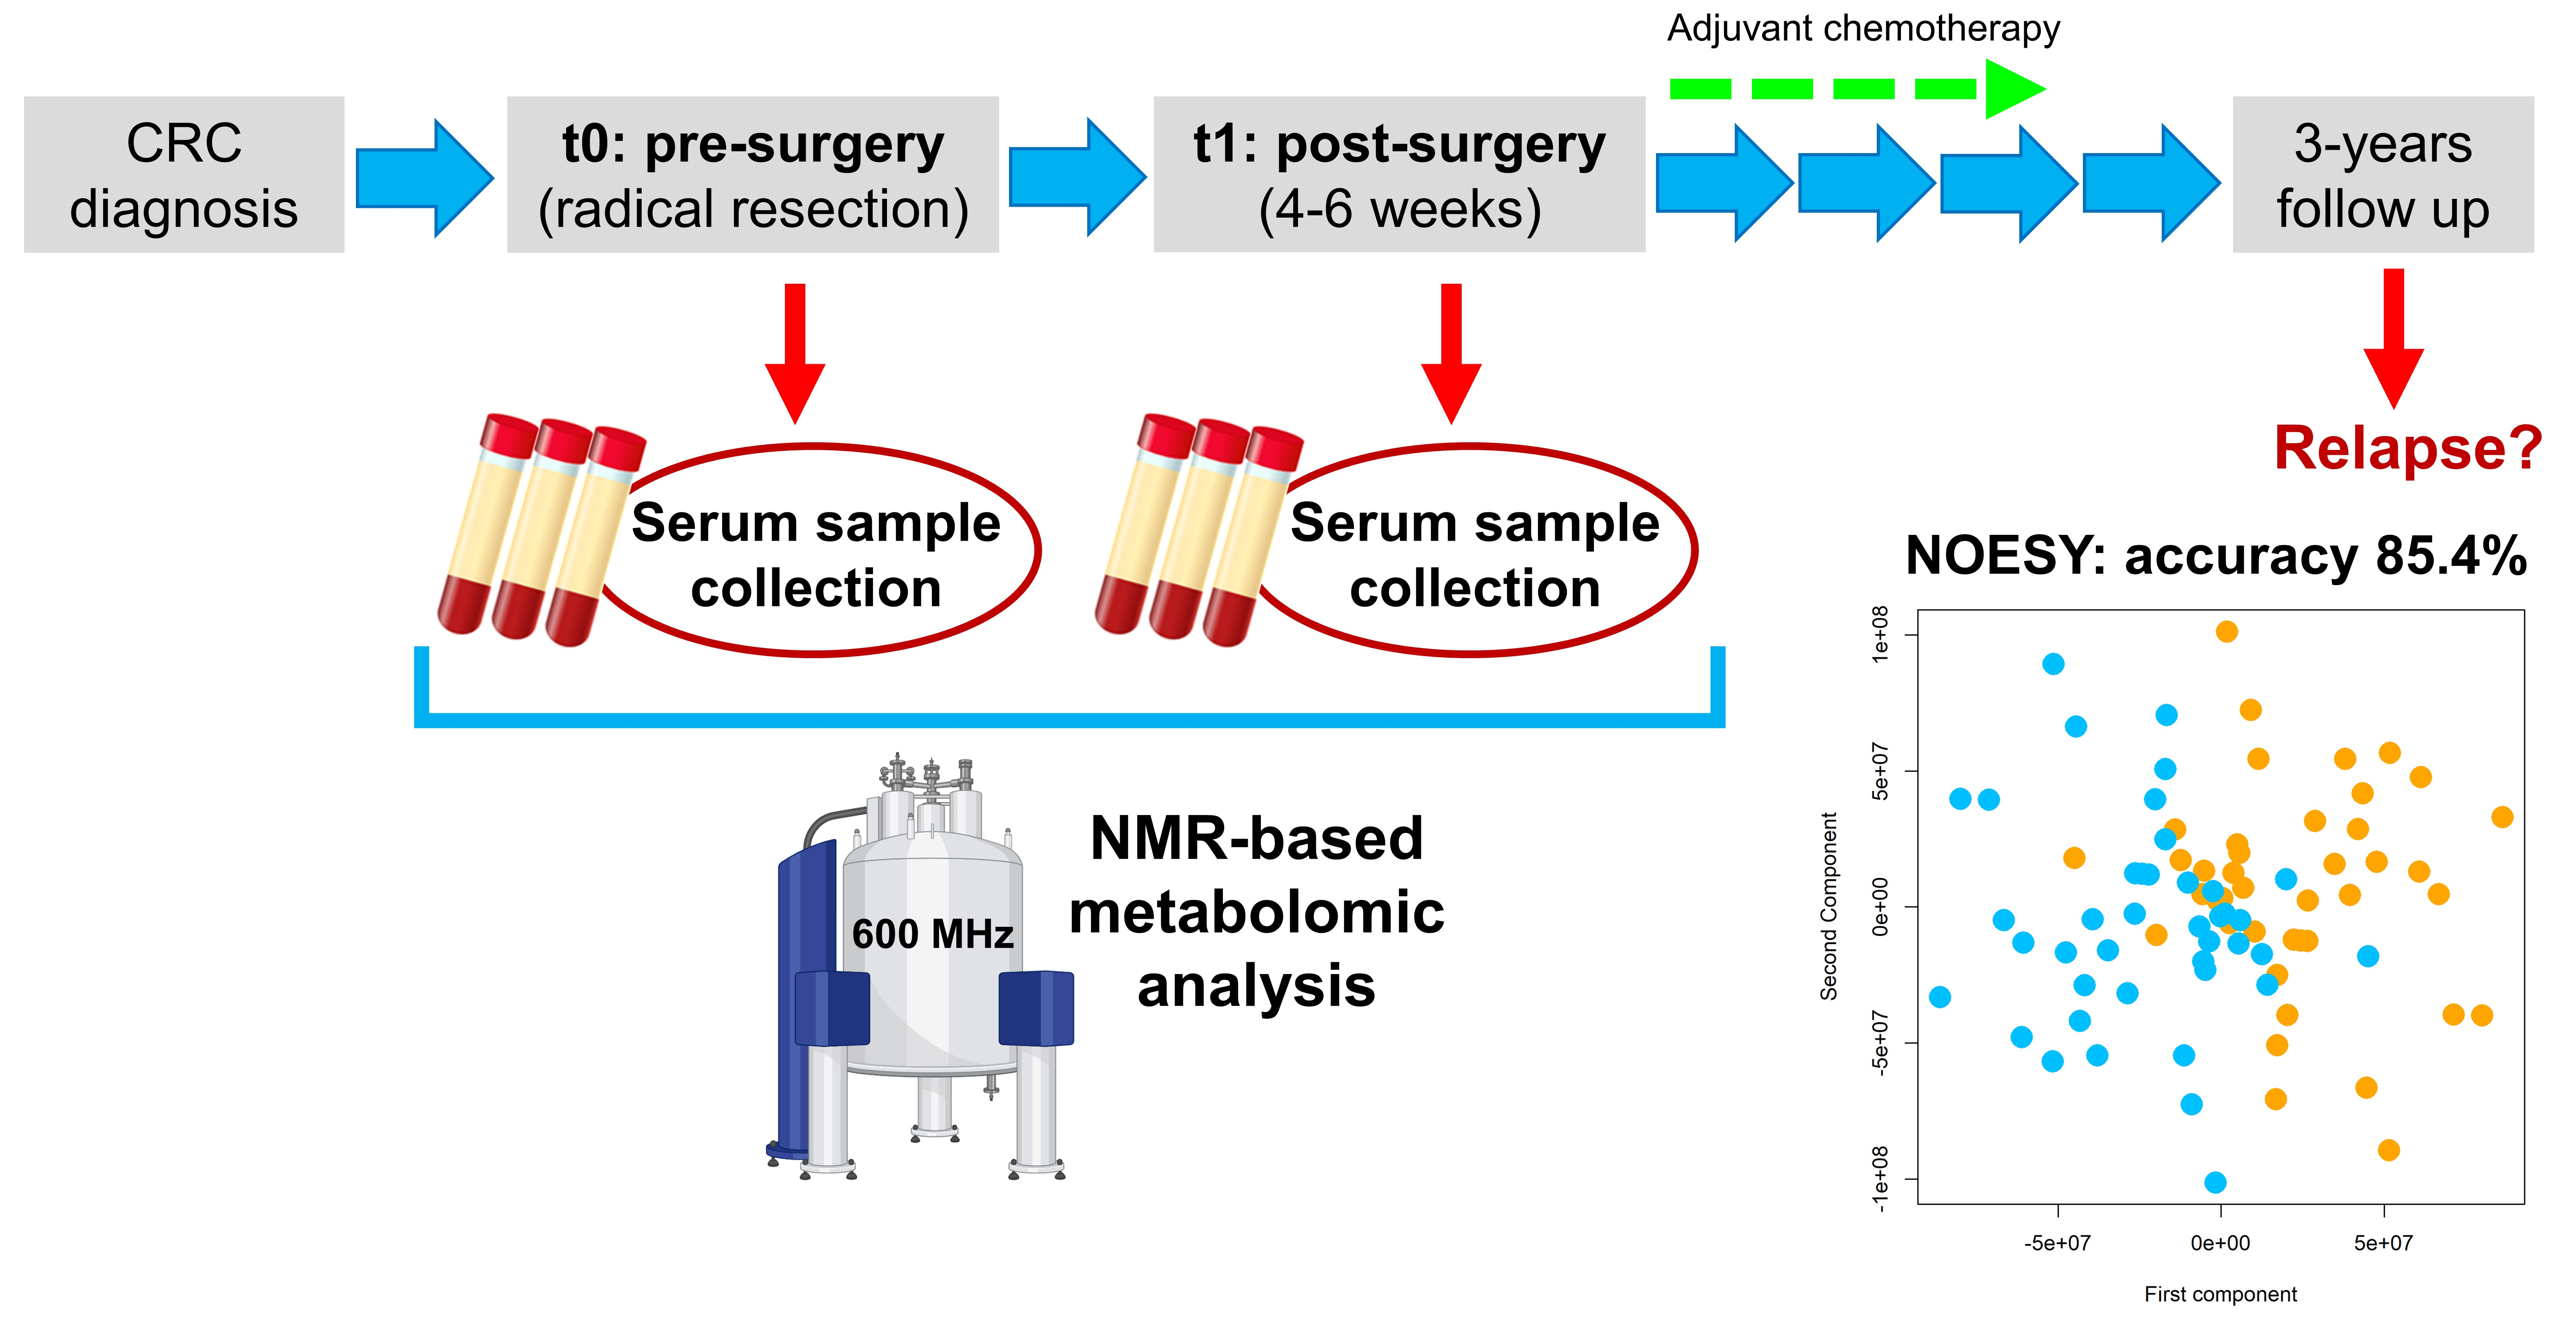
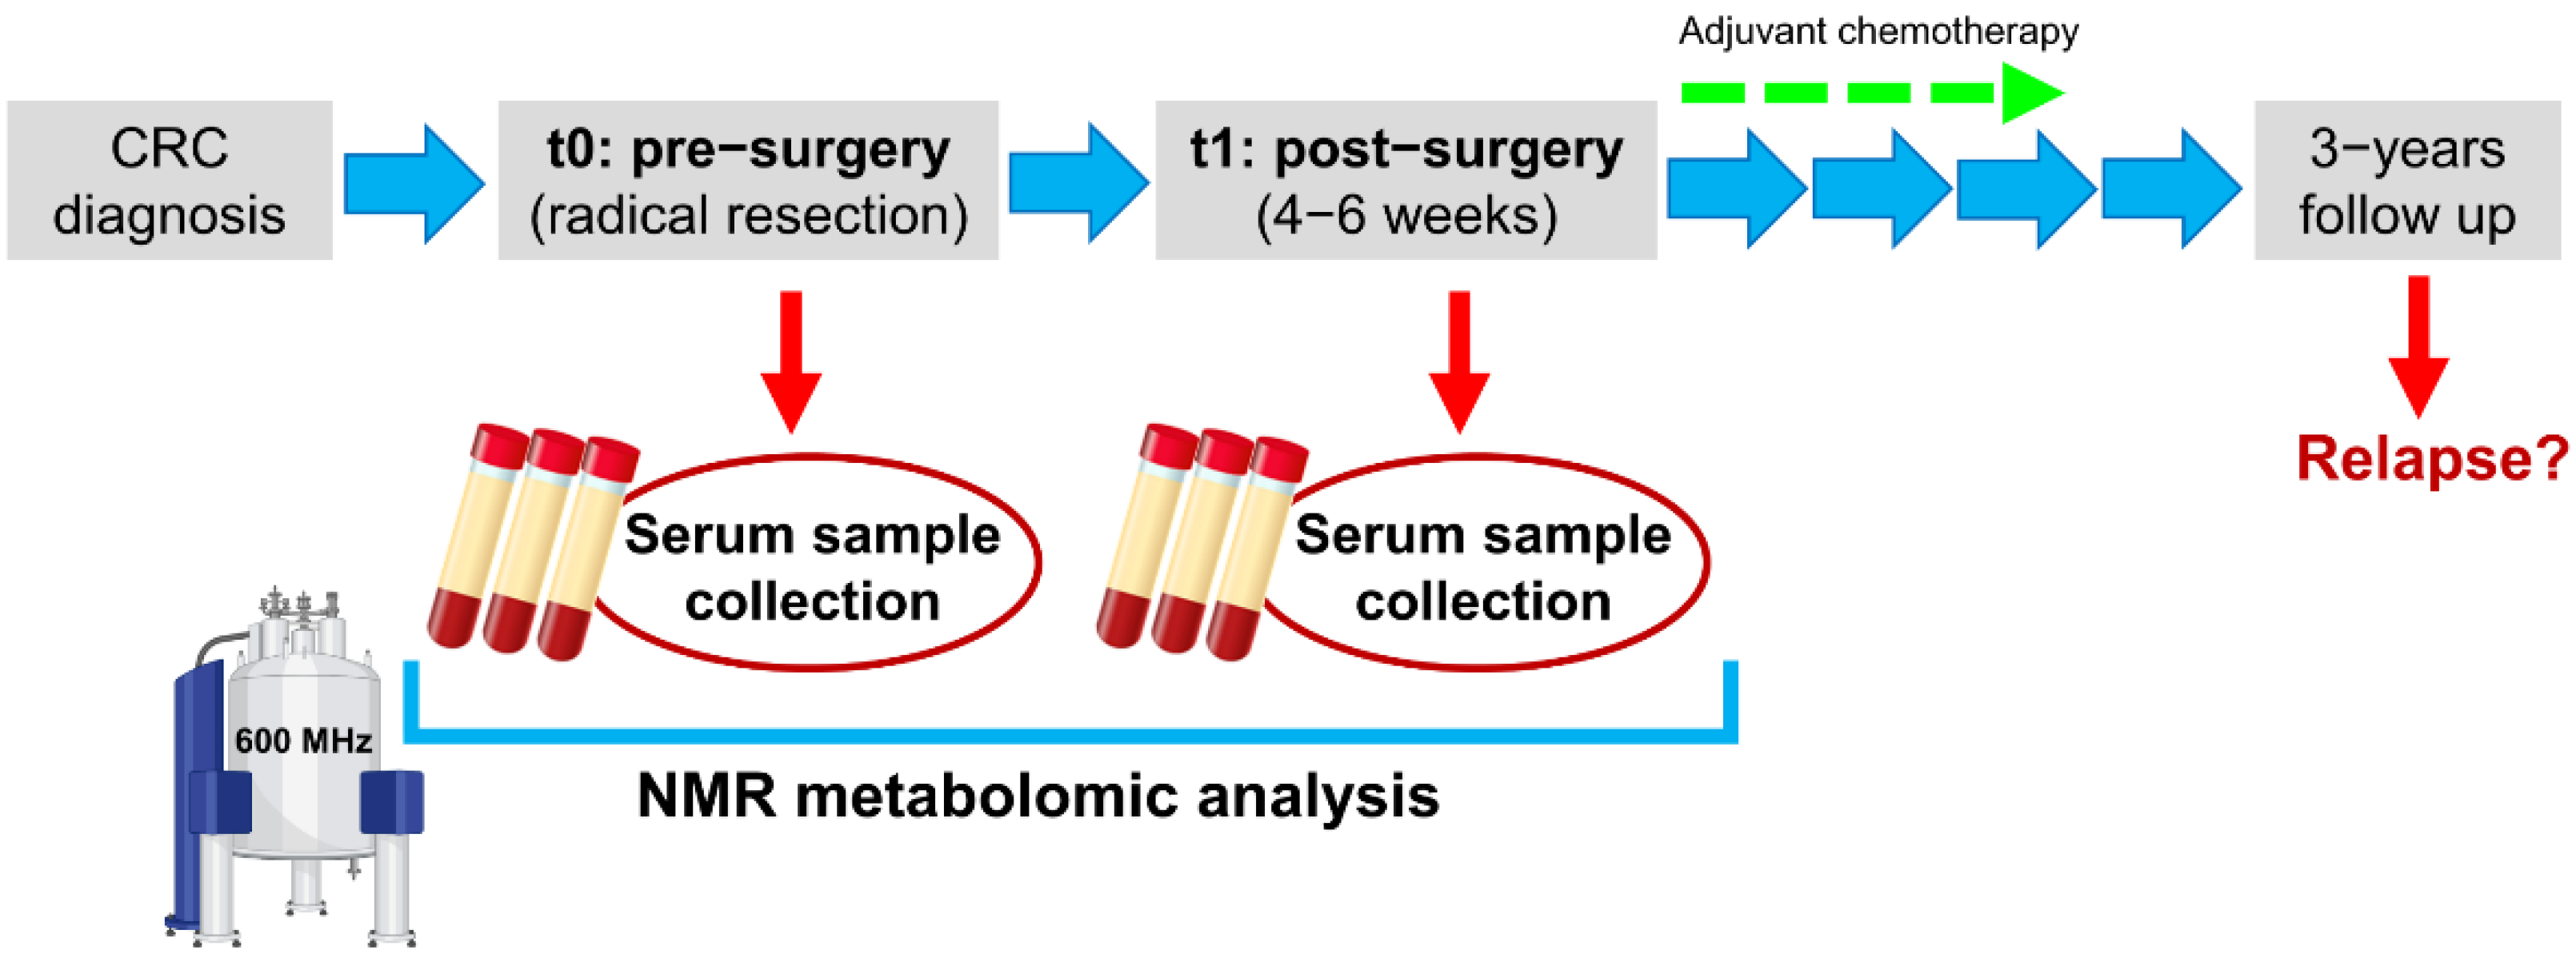
2. Materials and Methods

2.1. Study Cohort

From June 2017 to August 2018, we prospectively enrolled 41 patients with histologically diagnosed CRC, who were treated as per standard clinical practice at the Prato Hospital. All patients enrolled met the following inclusion criteria: (i) female or male patients with radically operable heteroplasia of the colon/rectum (stage I, II, III); (ii) Eastern Cooperative Oncology Group Scale of Performance Status (ECOG PS) 0–1; (iii) patients of age ≥18 years. For all patients enrolled, the following data were collected: (i) demographic data; (ii) clinical and histological characterization of the tumor; (iii) any other clinical information useful for the study (i.e., comorbidities, drug treatments).
All patients signed informed consent before entry into the study. The present study complies with the 1964 Declaration of Helsinki and its later amendments and received the approval by the local ethics committee (Comitato Etico Regione Toscana—Area Vasta Centro, study number: 10208_bio).

2.2. Samples Collection

Serum samples were collected and stored following standard operating procedures validated at international level [32]. Two × 10 mL of overnight fasting peripheral blood were collected for each patient at the two timepoints (t0: before the radical tumor resection; t1: 4–6 weeks after surgery before the start of any adjuvant treatment) in serum vacutainer and processed within one hour from phlebotomy. After clot formation at room temperature, tubes were centrifuged at 1600 RCF for 10 min at 4 °C. Then, serum aliquots of 1 mL (labelled with an anonymized code) were immediately frozen at −80 °C, pending NMR analysis.

2.3. NMR Analysis

2.3.1. Acquisition of NMR Data

All NMR spectra were acquired using a Bruker 600 MHz spectrometer (Bruker BioSpin, Rheinstetten, Germany) operating at 600.13 MHz proton Larmor frequency, equipped with an automatic refrigerated (6 °C) sample changer (SampleJet, Bruker BioSpin). Temperature stabilization (approximately 0.1 K at the sample) was obtained using a BTO 2000 thermocouple. Before NMR acquisition, to equilibrate temperature at 310 K, each sample was maintained inside the NMR probe head for at least 300 s. The spectrometer was calibrated daily, before any measurement, following strict standard operation procedures [33] to ensure high spectral quality and reproducibility.
Serum samples contain low molecular weight metabolites as well as high molecular weight macromolecules; for this reason, three different pulse sequences were used to enable the selective detection of the different serum molecular components: a 1D spin echo Carr–Purcell–Meiboom–Gill sequence (CPMG) was used to selectively detect signals of low molecular weight metabolites, and a 1D diffusion-edited pulse sequence was used to selectively acquire the signals of high molecular weight components (i.e., lipids, lipoproteins, proteins). Moreover, a 1D nuclear Overhauser effect spectroscopy pulse sequence (NOESY) was applied to detect signals of all molecules present in concentrations above the NMR detection limit.
A detailed description of sample preparation procedures, instrument configuration, and NMR parameters setting can be retrieved from our previous publication [16].

2.3.2. Spectral Processing

Before applying Fourier transform, free induction decays were multiplied by an exponential function equivalent to a 0.3 Hz line-broadening factor. Using automated routine of TopSpin 3.6 (Bruker BioSpin), Fourier-transformed spectra were corrected for phase and baseline distortions, and NOESY and CPMG spectra were also calibrated at the anomeric glucose 1H doublet at δ 5.24 ppm. Each 1D spectrum in the range between 0.2 and 10.0 ppm was segmented into chemical shift bins of 0.02 ppm, and the corresponding spectral areas were integrated using AssureNMR software (Bruker BioSpin). The spectral region containing residual water signal (δ 5.12–4.38 ppm) was removed, and the dimension of the system was reduced to 453 bins.

2.4. Statistical Analysis

All data analysis was executed in the “R” statistical environment [34]. Multivariate analysis was performed on binned spectra without any a priori knowledge of the metabolites present. Multilevel partial least square analysis (mPLS) [35,36] was performed to obtain data reduction (R script developed in-house). Support vector machine [37] applied on the first nine mPLS components was used for classification purposes. Models were evaluated by means of 100 cycles of a Monte Carlo cross-validation scheme (in-house-developed R script). In brief, 90% of the pairs of data, selected at random at each iteration, were used as a training set to build the model. Then, the remaining 10% was tested, and sensitivity, specificity, and accuracy (calculated according to the standard definitions) were assessed.
Univariate analysis was conducted directly on the spectral regions associated with the metabolites/lipoproteins present in all serum samples at concentrations above the detection limit (>1 μM). Metabolites and lipoprotein-related parameters were identified and quantified using the Bruker IVDr quantification platform [38]. Metabolites whose levels were lower than the limit of quantification (LOQ) were imputed with half the LOQ (Table S1). Nonparametric Wilcoxon signed-rank test was used to infer intraindividual differences between the two timepoints. The p-values were adjusted for multiple testing using the false discovery rate (FDR) procedure with Benjamini–Hochberg [39] correction at α = 0.05. Wilcoxon rank-sum test was used to infer differences between metabolites/lipoproteins of free-from-disease and relapsed CRC patients. The p-values were not adjusted for multiple testing because the group of relapse patients is small, and therefore the correction would be too severe, increasing the risk of missing promising biomarkers. However, we are aware that this could increase the risk of a type I error.
Univariate analysis on clinical data was performed using the Fisher test for categorical variables and the ANOVA test for continuous variables. Polyserial correlations between ordinal clinical variables (pT, N, grade, stage, ECOG PS) and metabolites were calculated using the function “polyserial” (R package “polycor”). Point-biserial correlations between dichotomous clinical variables (tumor localization, sex) and metabolites were calculated using the function “biserial.cor” (R package “ltm”).

3. Results

3.1. Characteristics of Enrolled Patients

Forty-one patients were enrolled in the study (21 female and 20 male). The median age was 73 years (Table 1).
Most of the enrolled patients had a good Eastern Cooperative Oncology Group (ECOG) performance status (PS), with 29 patients (71%) having a PS 0. However, over one half of the patients (n = 38; 69%) had comorbidity, of which 20 patients had vascular comorbidity.
By inclusion criteria, all patients have early-stage disease: 11 patients (27%) with stage I, 13 patients (32%) stage II, and 17 patients (41%) stage III. In particular, six patients had a pT1 (5 N0 e 1 N+), eight patients had a pT2 (6 N0 and 2 N+), 23 patients had a pT3 (18 N+), and four patients had a pT4 (3 N0 and 1 N+).
Regarding the 13 patients with stage II, two were at low risk and 11 at high risk for the presence of lymphovascular invasion, T4 or G3–4.
The majority of tumors had intermediate (G2; 48%: N = 19) or high (G3–G4; 47% N = 19) histologic grading, while G1 accounted for 5% of tumors in this population (N = 2). A total of 13 patients had left CRC and 28 right CRC (Table 1).
Half of the patients (46%; n = 19) received adjuvant chemotherapy, in accordance with clinical stage of disease. Nine patients received fluoropyrimidine monotherapy and 10 patients received polychemotherapy with oxaliplatin and fluoropyrimidine. Six out of eleven patients at stage II at high risk received adjuvant treatment; the rest of them did not receive chemotherapy for age or comorbidity
Thirteen out of the 17 patients with stage III disease received adjuvant treatment according to tumor stage. At the last follow-up, 19% (n = 8) of patients had disease relapse (Table 1). As expected, the patients with relapse had a history of stage III disease or stage II at high risk.

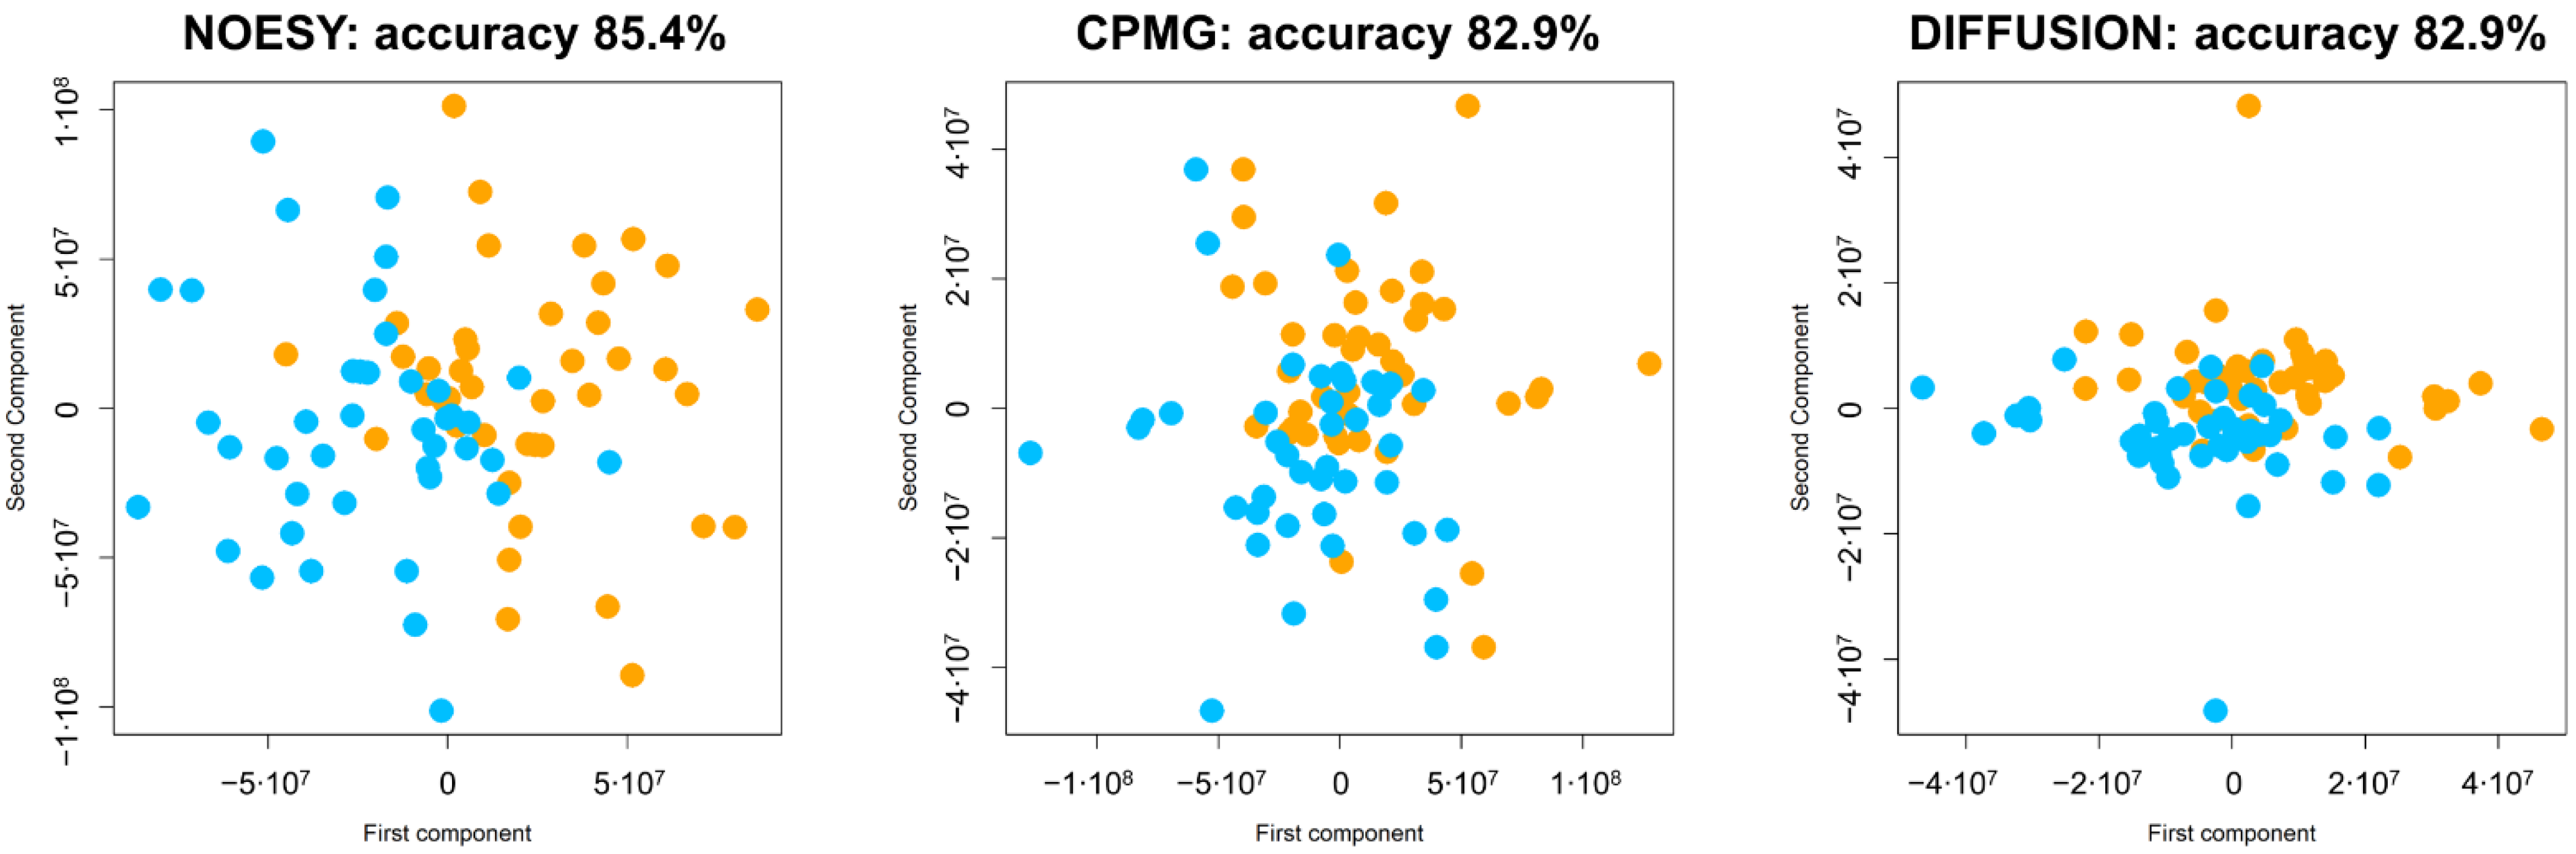
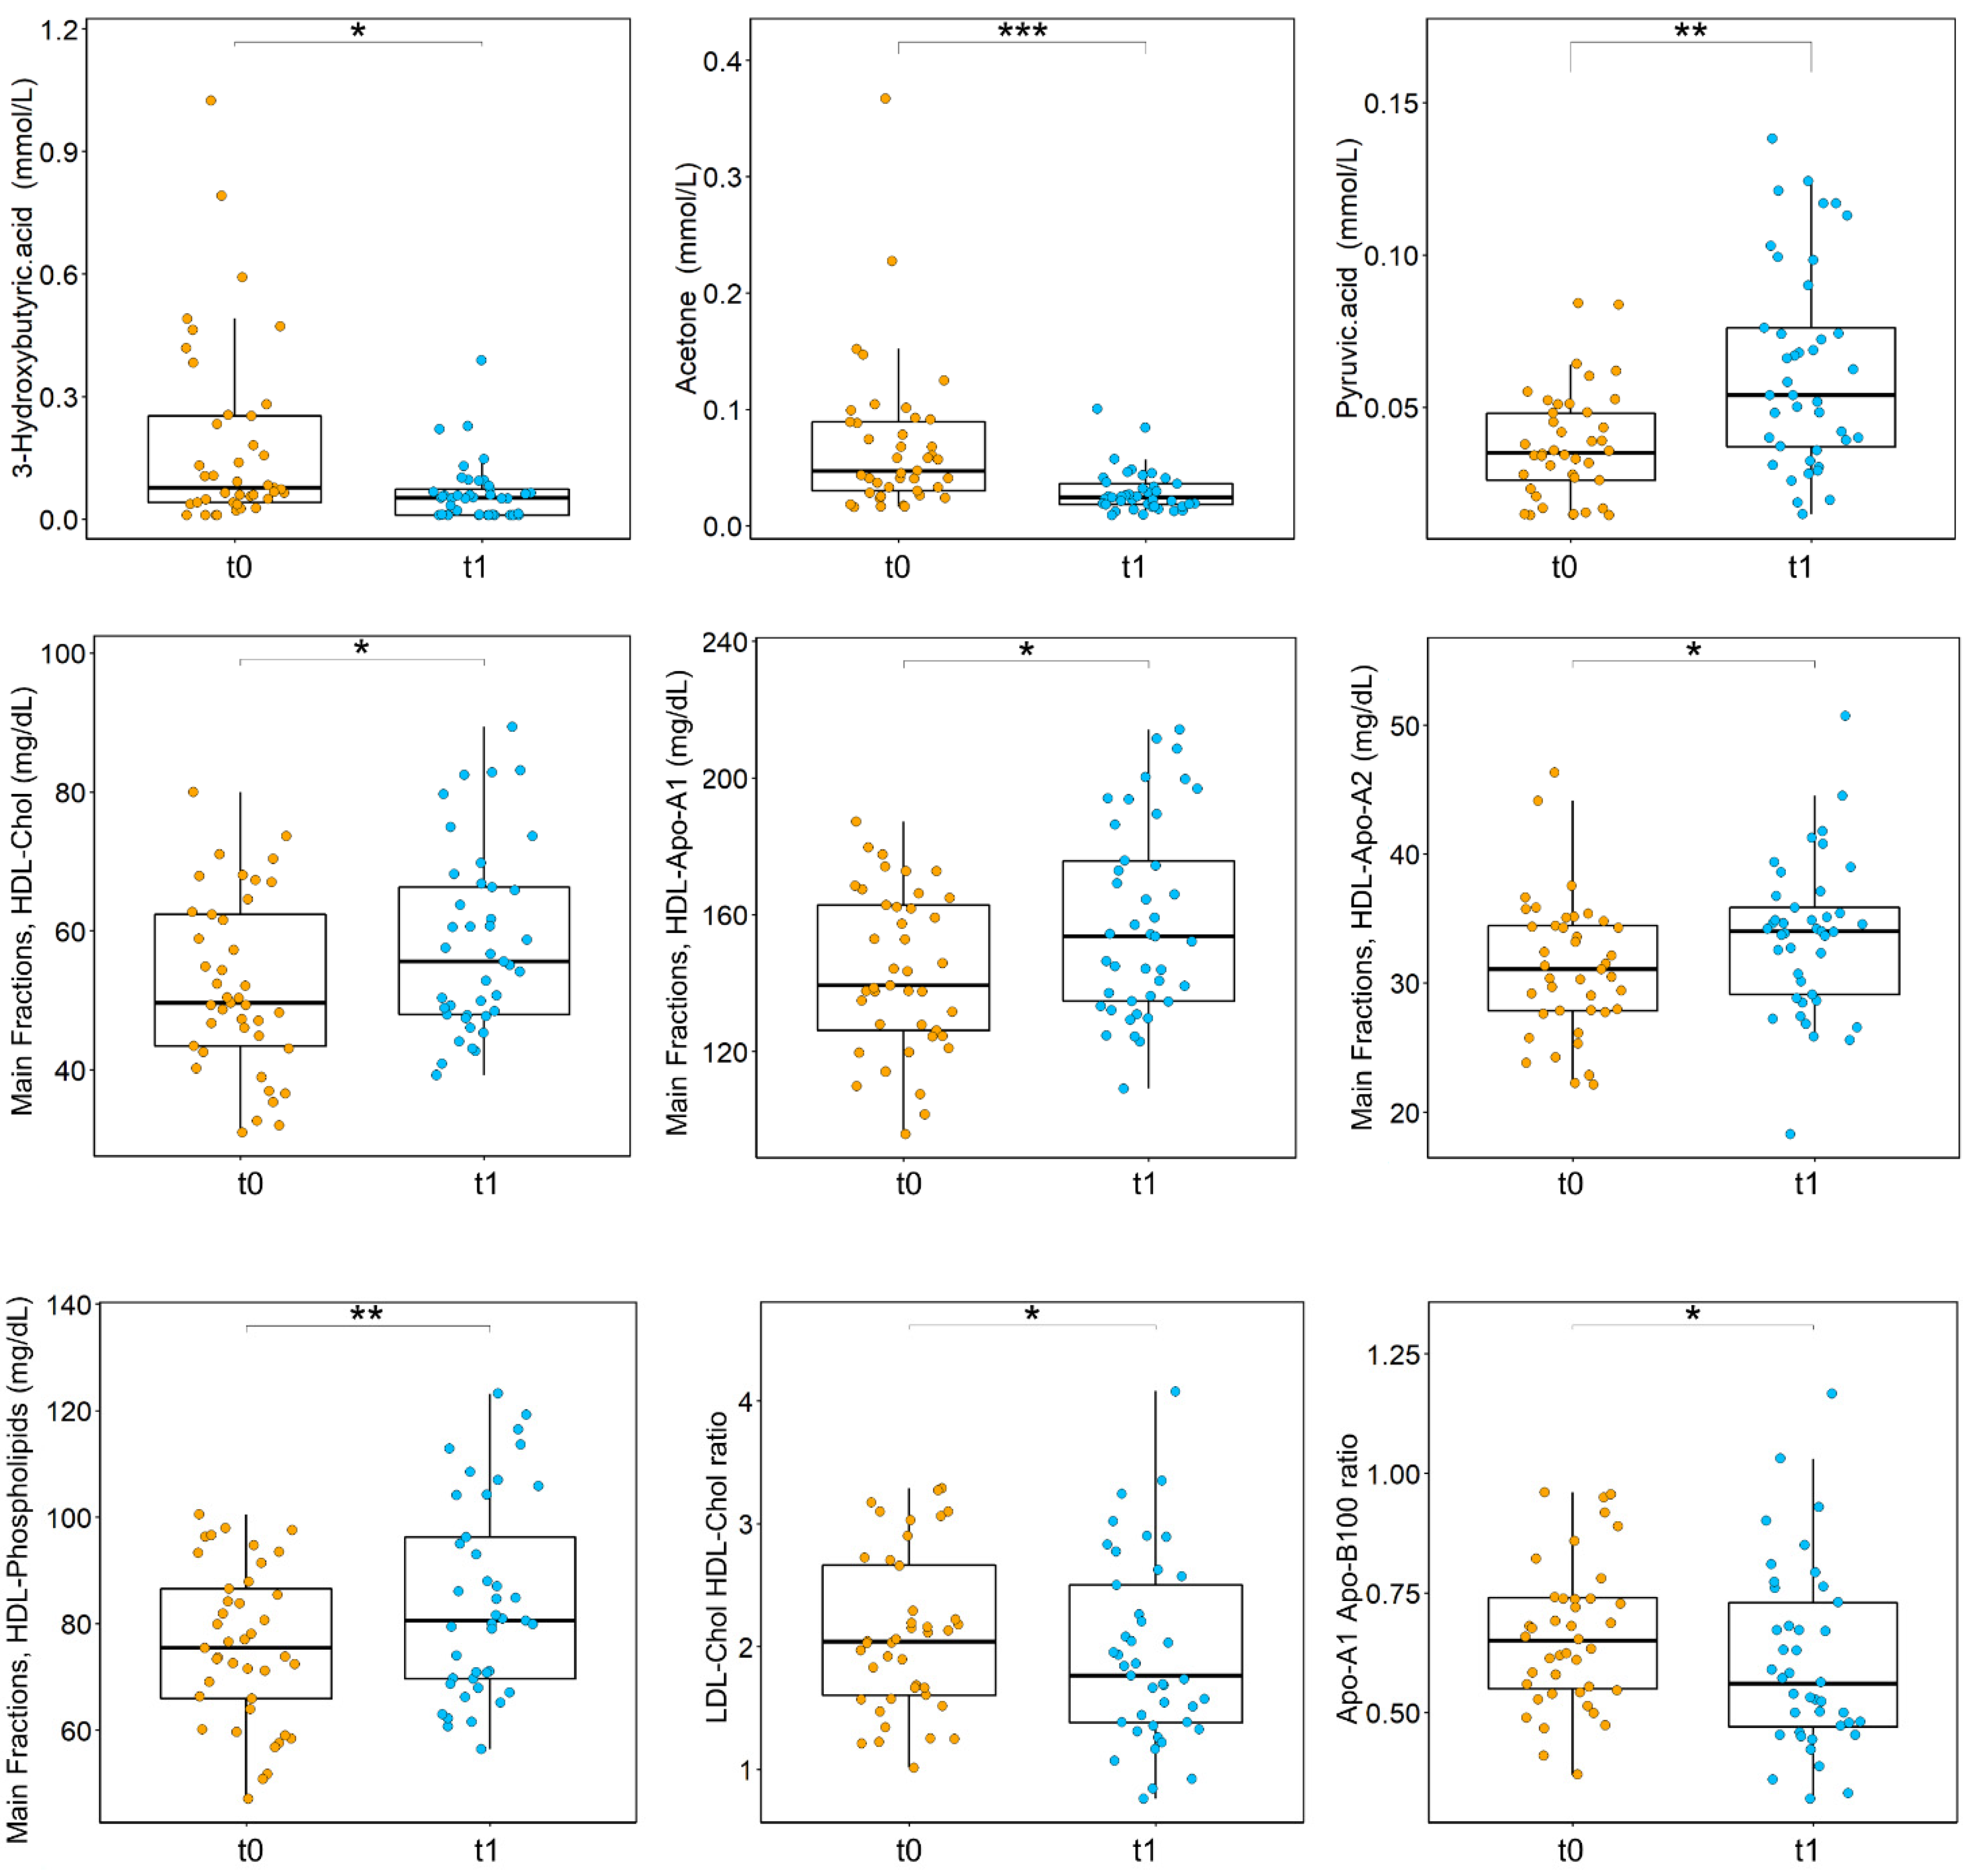
3.2. Effects of Surgery on the Metabolome of CRC Patients

The mPLS analysis was performed to assess intraindividual variations between t0 and t1 in the metabolomic fingerprints of CRC patients. The results obtained show significant differential clustering, with optimal separation of the two timepoints using each type of NMR spectra acquired, namely CPMG, NOESY, and DIFFUSION (Figure 2). All models classify t0 and t1 samples with an accuracy in the range 82–85%, and the best results were obtained using NOESY spectra. These data indicate that both low molecular weight metabolites and high molecular weight macromolecules (i.e., lipoproteins, proteins) contribute to the discrimination.
From univariate analysis emerges that after surgery there is a significant increase of pyruvate, HDL cholesterol, HDL phospholipids, HDL Apo-A1, and HDL Apo-A2 (Figure 3). Moreover, after surgery we observed a significant decrement of acetone, 3-hydroxybutyrate, LDL-Chol/HDL-Chol ratio, and Apo-A1/Apo-B100 ratio (Figure 3). Furthermore, several lipoprotein-related subfractions were shown to be significantly altered between t0 and t1 (Figure S1). These data point to a relevant rearrangement of the metabolic pathways related to lipoproteins, ketone bodies, and energy metabolism.

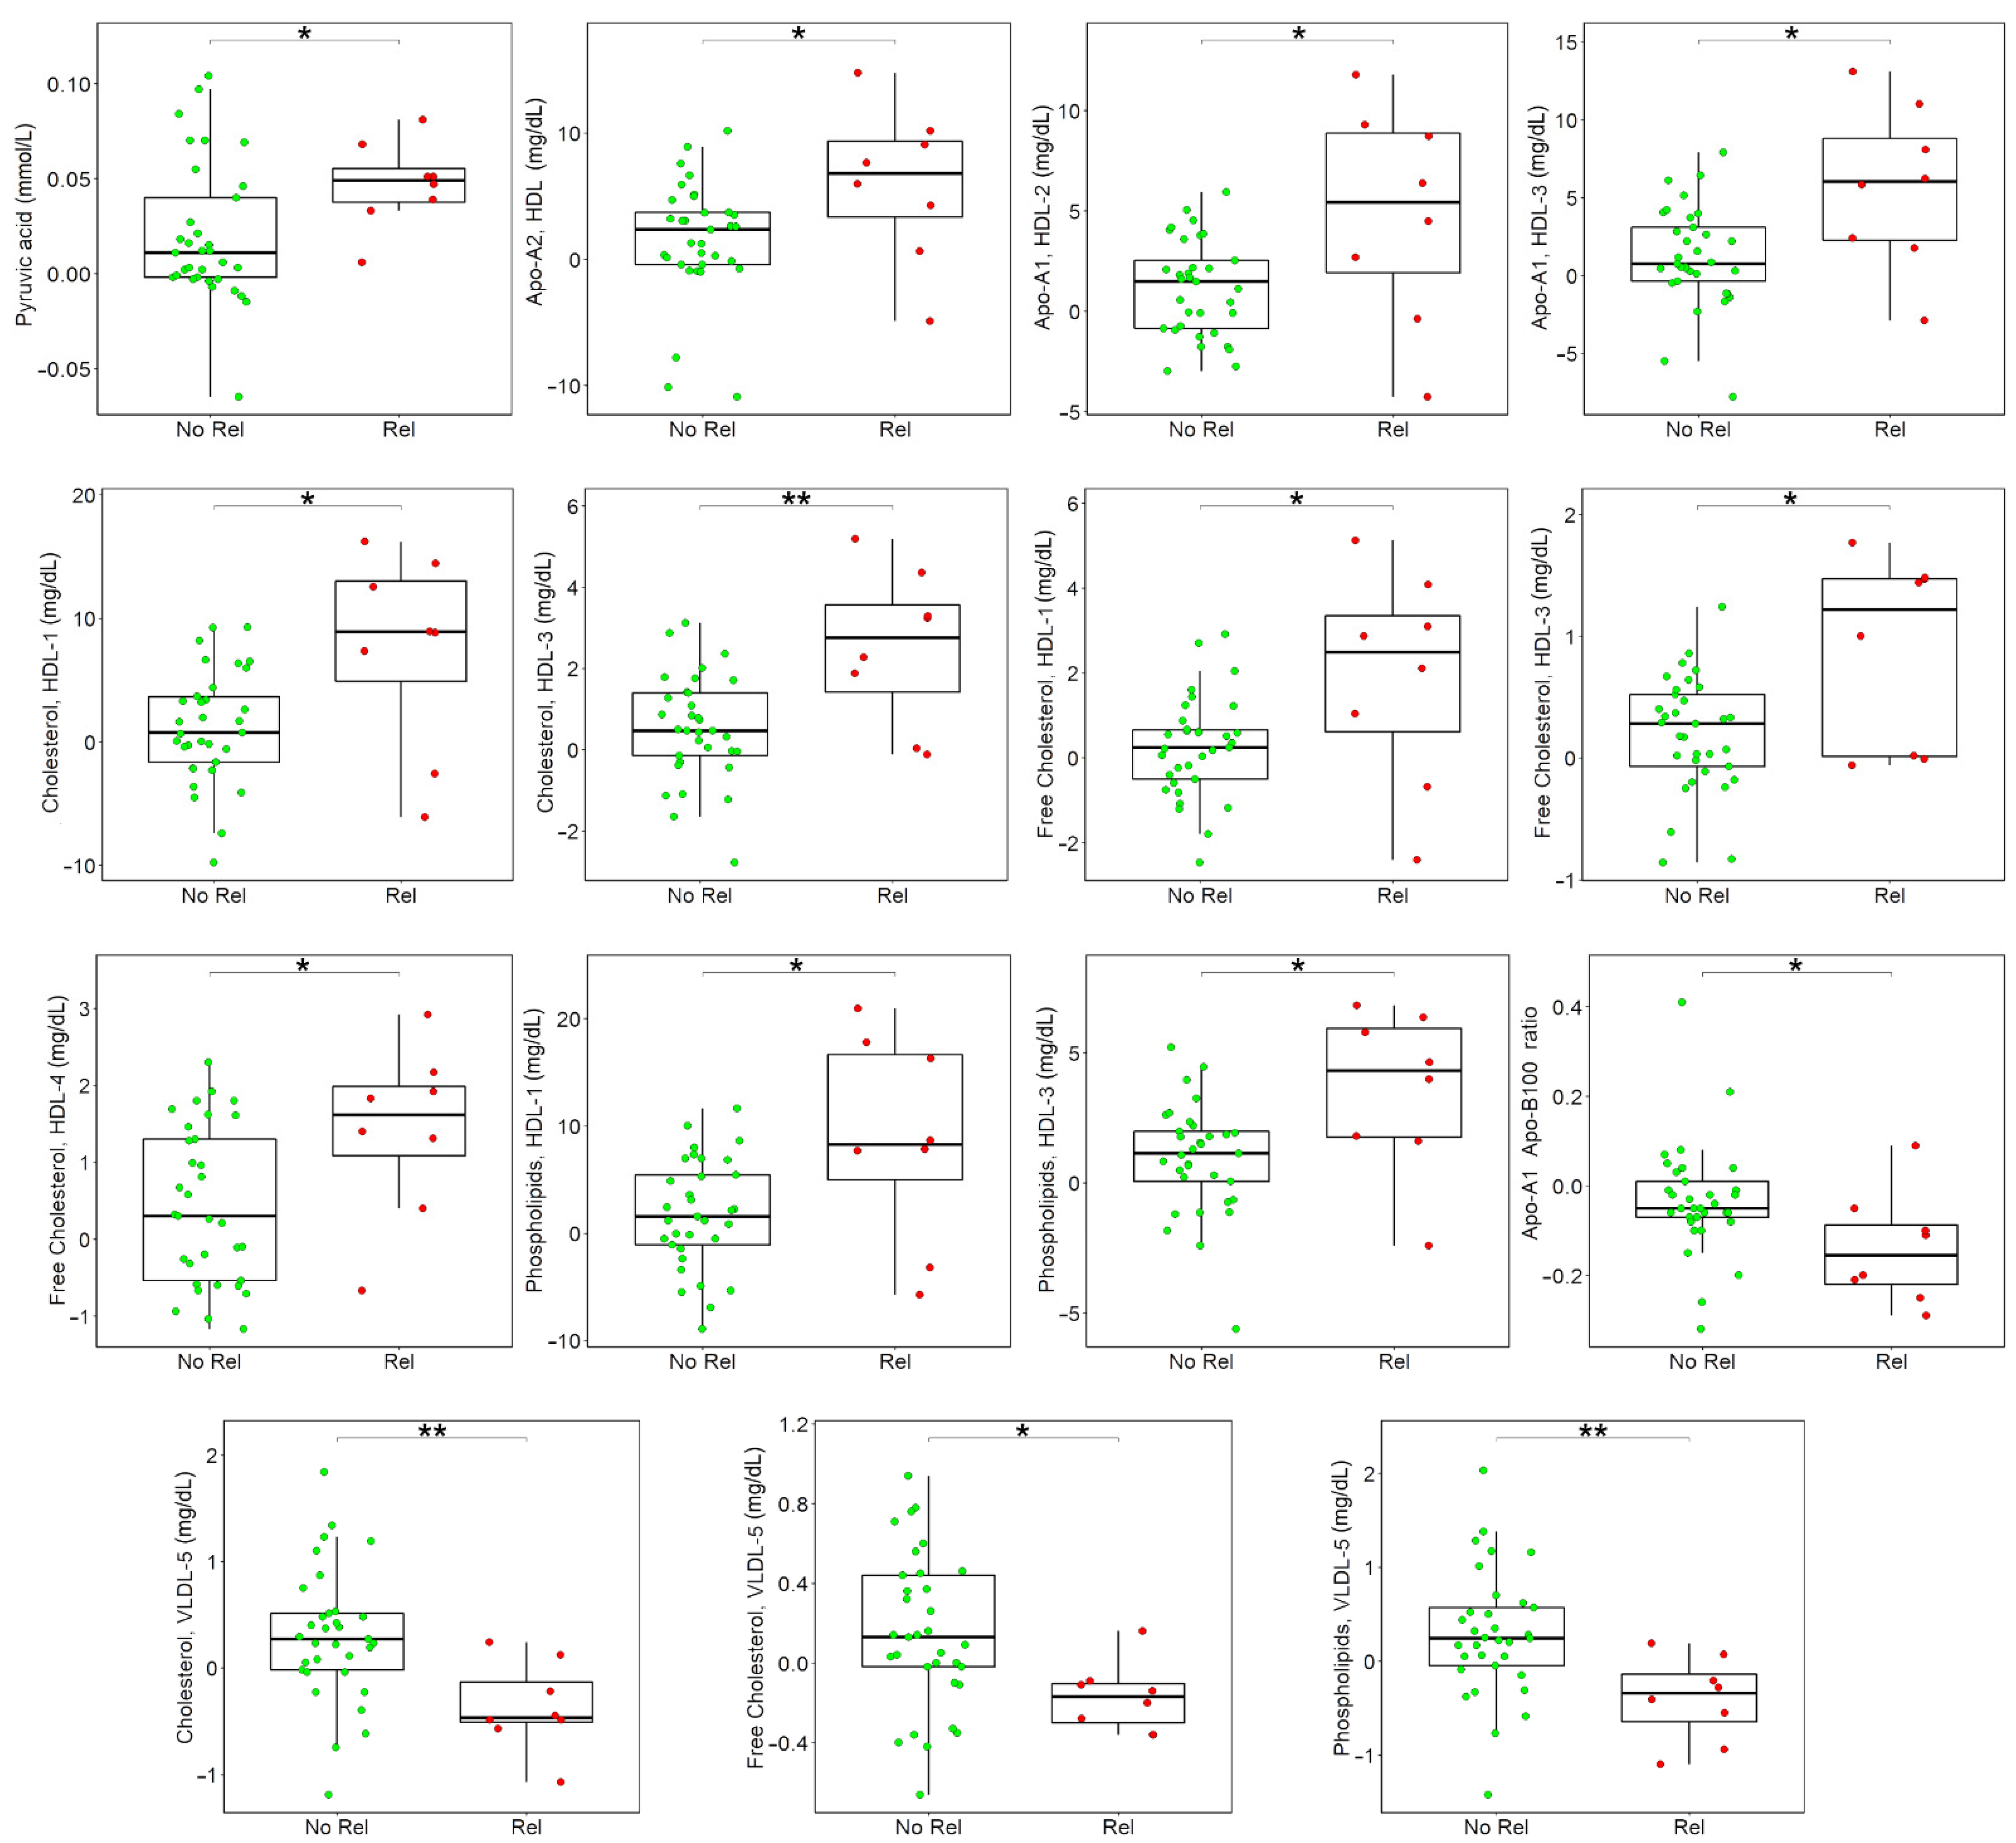
3.3. Associations between Metabolome Variations after Surgery and Cancer Relapse

Eight out of the 41 CRC patients enrolled in the present study developed cancer relapse in the three years after diagnosis. We hypothesized that different changes in preoperative and postoperative metabolomic serum profiles could be predictive of patients’ prognosis. To explore this hypothesis, the difference between each metabolite/lipoprotein-related parameter at t1 and t0 was calculated, and each resulting difference analyzed via univariate approaches to underline possible divergent behavior in free-from-disease and relapsed CRC patients. Postoperative, relapsed CRC patients show a significant increase of pyruvate, HDL Apo-A1, HDL Apo-A2, HDL cholesterol, HDL free cholesterol, and HDL phospholipids, and a significant decrease of Apo-A1 Apo-B100 ratio, VLDL-5 cholesterol, VLDL-5 free cholesterol, and VLDL-5 phospholipids (Figure 4).

3.4. Associations between Metabolites and Clinical Variables

Possible associations between metabolites/lipoproteins (main fractions) and clinical variables were investigated. Results are reported in Table S2.
Glycine and histidine showed statistically significant correlations with tumor size. Tyrosine correlates with tumor stage and regional lymph nodal spread (N). N also correlates with isoleucine, Apo-A1, and Apo-A2. Tumor localization (left or right colon) shows correlations with acetone, cholesterol, LDL cholesterol, and Apo-B100. Interestingly a panel of eight metabolic variables (N,N-Dimethylglycine, valine, dimethylsulfone, triglycerides, cholesterol, LDL cholesterol, Apo-A2, Apo-B100) correlates with the Eastern Cooperative Oncology Group Scale of Performance Status. Moreover, as expected, sex shows significant correlations with several metabolites/lipoproteins: creatine, creatinine, glutamine, glycine, isoleucine, leucine, formic acid, cholesterol, LDL cholesterol, HDL cholesterol, Apo-A1, Apo-A2, and Apo-B100. Of note, none of the examined metabolic features show significant correlation with tumor grade.

4. Discussion

The primary option for the treatment of colorectal cancer is surgery. Adjuvant chemotherapy is strongly indicated in stage III disease and in stage II patients at high risk of relapse. Whereas, in low-risk stage II disease decision-making around adjuvant chemotherapy must be carefully evaluated. At present, postoperative surveillance via clinical, radiological and biomarkers examination often cannot identify early metastatic disease and/or postoperative micrometastatic residual disease.
Based on these considerations, especially in stage II disease, improved risk-stratification tools are required to identify those patients who are most likely to benefit from adjuvant chemotherapy and need to be followed up more closely after surgery to timely detect systemic recurrence. On the other hand, accurate stratification instruments could prevent low-risk patients from unnecessary treatment and possible mild-to-severe adverse reactions.
The analysis described in the present research article shows for the first time, to the best of our knowledge, the metabolomic variations among preoperative and postoperative NMR-based serum fingerprint of CRC patients. Furthermore, metabolomics as novel approach for risk-stratification in CRC setting was evaluated by studying differences between pre- and postoperative serum samples of each patient enrolled. With this innovative approach, each patient in the study population acts as his/her own control, thus eliminating noise from interindividual variability.
Our data demonstrate that metabolomics profiles are influenced by the presence or absence of the cancerous mass. Indeed, the mPLS models calculated using each of the three NMR spectra acquired (namely, CPMG, NOESY, and DIFFUSION) show high discrimination accuracies (range 82–85%). This evidence poses an important question in terms of future study design, since sample collection when the tumor was still in place or after resection can significantly impact on metabolomic data.
From the univariate analysis, it emerges that after surgery, there is a significant increase of pyruvate, HDL cholesterol, HDL phospholipids, HDL Apo-A1, and HDL Apo-A2. Moreover, we observed, postoperative, a significant decrement of acetone, 3-hydroxybutyrate, LDL-Chol/HDL-Chol ratio, and Apo-A1/Apo-B100 ratio. These data point to a relevant rewiring of the metabolic pathways associated to lipoproteins, ketone bodies, and energy metabolism.
Depletion of pyruvate and increase of ketone bodies has been observed in sera of metastatic CRC patients with respect to healthy controls, and this evidence has been associated with an altered energy metabolism, probably reflecting an increased gluconeogenesis and fatty acid oxidation [31]. It is interesting to note that in our dataset, these three metabolites show trend inversions after surgery.
Our data show an increase of several HDL-Chol and a decrease of LDL-Chol lipoprotein-related parameters post-surgery. This may be explained by the fact that, after cancer resection, an improvement in the inflammatory status of the gut is achieved, allowing for an improved lipid metabolism and lipid assimilation in the absence of the tumor.
Strikingly, despite the low number of recurrence events registered, it is peculiar that the difference in HDL-Chol is particularly marked in relapsed patients and is coupled with a decrease of VLDL-Chol. It has been observed that in colorectal cancerous tissue, the levels of cholesterol and triglycerides were reduced and HDL-Cholesterol level increased, indicating that CRC development destroys the physiological balance of lipids and lipoproteins, leading to lipid metabolic disorders [40]. Preclinical and clinical studies have already investigated the role of cholesterol in CRC progression; however, a clear understanding of the molecular mechanism linking these two entities is still lacking [40,41].
In conclusion, our results show that surgery can affect the metabolomic and lipidomic profiles of CRC patients and they point to possible associations between these metabolic changes and cancer recurrence. This study is based on a small population of CRC patients in which a very limited number of recurrence events are present; therefore, at present, results are only speculative and require further confirmation. In order to validate these findings in a general population, we are conducting a multicentric prospective trial focused on high-risk stage disease, the LIquid BIopsy and METabolomics in colon cancer (LIBIMET) study. LIBIMET aims primarily at redefining the risk of relapse in patients with high-risk, early-stage colon cancer by combining of ctDNA and serum metabolomics.

5. Conclusions

Taken together, the data here presented highlight the notion that CRC can induce metabolic changes that are reflected at a systemic level and can be detected in serum. This evidence suggests that our approach aimed at detecting micrometastatic CRC by assessing its metabolomic fingerprint in serum is correct, and that this may be exploited for biomarker-oriented research to contribute towards better management of colorectal cancer.

Supplementary Materials

The following are available online at https://www.mdpi.com/article/10.3390/app112311120/s1. Table S1: Data completeness for the different metabolites quantified in the serum samples analyzed via NMR. LOQ = limit of quantification. Table S2: Correlation between clinical data and metabolites. Correlation coefficients and p-values are reported in table. Figure S1: Boxplots of the statistically significant lipoproteins-related parameters discriminating of CRC patients at t0 (orange) and t1 (turquoise); p-values obtained using Wilcoxon signed-rank test and adjusted for FDR are reported.

Author Contributions

Study conception and design, E.M., S.D.D., C.L., L.T. and L.B.; patient enrolment and management: E.M., S.D.D., V.C., S.C., M.B. (Maddalena Baraghini) and A.G.; collection of clinical data and serum samples: E.M., S.D.D., C.B., M.B. (Maddalena Baraghini), V.C., A.P., S.C., M.B. (Matteo Benelli), A.G. and F.D.M.; NMR analysis: A.V.; statistical analysis, biostatistics, and computational analysis, A.V., C.B., M.B. (Matteo Benelli), D.R. and L.T.; results interpretation, A.V., E.M., S.D.D., L.M., I.M., C.L., L.T. and L.B.; writing—original draft preparation: A.V. and E.M.; writing—review and editing: A.V., E.M., S.D.D., L.M., C.B., M.B. (Matteo Benelli), V.C., A.P., S.C., M.B. (Maddalena Baraghini), A.G., F.D.M., D.R., I.M., C.L., L.T. and L.B.; supervision, C.L, L.T. and L.B. All authors have read and agreed to the published version of the manuscript.

Funding

This research received no external funding.

Institutional Review Board Statement

The study was conducted according to the guidelines of the Declaration of Helsinki and approved by the local ethics committee (Comitato Etico Regione Toscana—Area Vasta Centro, study number: 10208_bio).

Informed Consent Statement

Written informed consent was obtained from all subjects involved in the study.

Data Availability Statement

Data and R script are available from the corresponding authors upon reasonable request.

Acknowledgments

In memoriam of Angelo Di Leo who passed away on 13 June 2021, while this work was being completed. The authors acknowledge the Fondazione Pitigliani per la lotta contro i tumori ONLUS for its support. The authors acknowledge Instruct-ERIC, a Landmark ESFRI project, and specifically the CERM/CIRMMP Italy Centre. Alessia Vignoli was supported by an AIRC fellowship for Italy.

Conflicts of Interest

The authors declare no conflict of interest.

References

  1. NCCN Guidelines for Colon Cancer 2021. Available online: https://www.nccn.org/guidelines/guidelines-detail (accessed on 5 November 2021).
  2. Siegel, R.L.; Miller, K.D.; Jemal, A. Cancer Statistics, 2020. CA Cancer J. Clin. 2020, 70, 7–30. [Google Scholar] [CrossRef] [PubMed]
  3. Sung, H.; Ferlay, J.; Siegel, R.L.; Laversanne, M.; Soerjomataram, I.; Jemal, A.; Bray, F. Global Cancer Statistics 2020: GLOBOCAN Estimates of Incidence and Mortality Worldwide for 36 Cancers in 185 Countries. CA Cancer J. Clin. 2021, 71, 209–249. [Google Scholar] [CrossRef] [PubMed]
  4. AIOM: Linee Guida Tumori del Colon 2020. Available online: https://www.aiom.it/linee-guida-aiom-2020-tumori-del-colon/ (accessed on 5 November 2021).
  5. Reinert, T.; Schøler, L.V.; Thomsen, R.; Tobiasen, H.; Vang, S.; Nordentoft, I.; Lamy, P.; Kannerup, A.-S.; Mortensen, F.V.; Stribolt, K.; et al. Analysis of Circulating Tumour DNA to Monitor Disease Burden Following Colorectal Cancer Surgery. Gut 2016, 65, 625–634. [Google Scholar] [CrossRef] [PubMed] [Green Version]
  6. Guraya, S.Y. Pattern, Stage, and Time of Recurrent Colorectal Cancer After Curative Surgery. Clin. Colorectal Cancer 2019, 18, e223–e228. [Google Scholar] [CrossRef]
  7. Hall, M.J.; Morris, A.M.; Sun, W. Precision Medicine Versus Population Medicine in Colon Cancer: From Prospects of Prevention, Adjuvant Chemotherapy, and Surveillance. Am. Soc. Clin. Oncol. Educ. Book 2018, 38, 220–230. [Google Scholar] [CrossRef] [PubMed]
  8. Dienstmann, R.; Mason, M.J.; Sinicrope, F.A.; Phipps, A.I.; Tejpar, S.; Nesbakken, A.; Danielsen, S.A.; Sveen, A.; Buchanan, D.D.; Clendenning, M.; et al. Prediction of Overall Survival in Stage II and III Colon Cancer beyond TNM System: A Retrospective, Pooled Biomarker Study. Ann. Oncol. 2017, 28, 1023–1031. [Google Scholar] [CrossRef]
  9. SEER Cancer Statistics Review, 1975–2017. Available online: https://seer.cancer.gov/csr/1975_2017/index.html (accessed on 30 March 2021).
  10. Renfro, L.A.; Grothey, A.; Xue, Y.; Saltz, L.B.; André, T.; Twelves, C.; Labianca, R.; Allegra, C.J.; Alberts, S.R.; Loprinzi, C.L.; et al. ACCENT-Based Web Calculators to Predict Recurrence and Overall Survival in Stage III Colon Cancer. J. Natl. Cancer Inst. 2014, 106, dju333. [Google Scholar] [CrossRef] [Green Version]
  11. Benson, A.B.; Schrag, D.; Somerfield, M.R.; Cohen, A.M.; Figueredo, A.T.; Flynn, P.J.; Krzyzanowska, M.K.; Maroun, J.; McAllister, P.; Van Cutsem, E.; et al. American Society of Clinical Oncology Recommendations on Adjuvant Chemotherapy for Stage II Colon Cancer. J. Clin. Oncol. 2004, 22, 3408–3419. [Google Scholar] [CrossRef]
  12. Kumar, A.; Kennecke, H.F.; Renouf, D.J.; Lim, H.J.; Gill, S.; Woods, R.; Speers, C.; Cheung, W.Y. Adjuvant Chemotherapy Use and Outcomes of Patients with High-Risk versus Low-Risk Stage II Colon Cancer. Cancer 2015, 121, 527–534. [Google Scholar] [CrossRef]
  13. Di Donato, S.; Vignoli, A.; Biagioni, C.; Malorni, L.; Mori, E.; Tenori, L.; Calamai, V.; Parnofiello, A.; Di Pierro, G.; Migliaccio, I.; et al. A Serum Metabolomics Classifier Derived from Elderly Patients with Metastatic Colorectal Cancer Predicts Relapse in the Adjuvant Setting. Cancers 2021, 13, 2762. [Google Scholar] [CrossRef] [PubMed]
  14. Nicholson, J.K.; Lindon, J.C. Systems Biology: Metabonomics. Nature 2008, 455, 1054–1056. [Google Scholar] [CrossRef]
  15. Vignoli, A.; Risi, E.; McCartney, A.; Migliaccio, I.; Moretti, E.; Malorni, L.; Luchinat, C.; Biganzoli, L.; Tenori, L. Precision Oncology via NMR-Based Metabolomics: A Review on Breast Cancer. Int. J. Mol. Sci. 2021, 22, 4687. [Google Scholar] [CrossRef]
  16. Vignoli, A.; Ghini, V.; Meoni, G.; Licari, C.; Takis, P.G.; Tenori, L.; Turano, P.; Luchinat, C. High-Throughput Metabolomics by 1D NMR. Angew. Chem. Int. Ed. 2019, 58, 968–994. [Google Scholar] [CrossRef] [PubMed]
  17. Wishart, D.S. Emerging Applications of Metabolomics in Drug Discovery and Precision Medicine. Nat. Rev. Drug Discov. 2016, 15, 473–484. [Google Scholar] [CrossRef] [PubMed]
  18. Vignoli, A.; Tenori, L.; Giusti, B.; Valente, S.; Carrabba, N.; Baizi, D.; Barchielli, A.; Marchionni, N.; Gensini, G.F.; Marcucci, R.; et al. Differential Network Analysis Reveals Metabolic Determinants Associated with Mortality in Acute Myocardial Infarction Patients and Suggests Potential Mechanisms Underlying Different Clinical Scores Used To Predict Death. J. Proteome Res. 2020, 19, 949–961. [Google Scholar] [CrossRef] [PubMed]
  19. Zhang, L.; Zhu, B.; Zeng, Y.; Shen, H.; Zhang, J.; Wang, X. Clinical Lipidomics in Understanding of Lung Cancer: Opportunity and Challenge. Cancer Lett. 2020, 470, 75–83. [Google Scholar] [CrossRef] [PubMed]
  20. Pietzner, M.; Stewart, I.D.; Raffler, J.; Khaw, K.-T.; Michelotti, G.A.; Kastenmüller, G.; Wareham, N.J.; Langenberg, C. Plasma Metabolites to Profile Pathways in Noncommunicable Disease Multimorbidity. Nat. Med. 2021, 27, 471–479. [Google Scholar] [CrossRef] [PubMed]
  21. Vignoli, A.; Paciotti, S.; Tenori, L.; Eusebi, P.; Biscetti, L.; Chiasserini, D.; Scheltens, P.; Turano, P.; Teunissen, C.; Luchinat, C.; et al. Fingerprinting Alzheimer’s Disease by 1H Nuclear Magnetic Resonance Spectroscopy of Cerebrospinal Fluid. J. Proteome Res. 2020, 19, 1696–1705. [Google Scholar] [CrossRef] [PubMed]
  22. Vignoli, A.; Tenori, L.; Giusti, B.; Takis, P.G.; Valente, S.; Carrabba, N.; Balzi, D.; Barchielli, A.; Marchionni, N.; Gensini, G.F.; et al. NMR-Based Metabolomics Identifies Patients at High Risk of Death within Two Years after Acute Myocardial Infarction in the AMI-Florence II Cohort. BMC Med. 2019, 17, 3. [Google Scholar] [CrossRef] [Green Version]
  23. Auclin, E.; Zaanan, A.; Vernerey, D.; Douard, R.; Gallois, C.; Laurent-Puig, P.; Bonnetain, F.; Taieb, J. Subgroups and Prognostication in Stage III Colon Cancer: Future Perspectives for Adjuvant Therapy. Ann. Oncol. 2017, 28, 958–968. [Google Scholar] [CrossRef]
  24. Copija, A.; Waniczek, D.; Witkoś, A.; Walkiewicz, K.; Nowakowska-Zajdel, E. Clinical Significance and Prognostic Relevance of Microsatellite Instability in Sporadic Colorectal Cancer Patients. Int. J. Mol. Sci. 2017, 18, 107. [Google Scholar] [CrossRef] [PubMed]
  25. Nannini, G.; Meoni, G.; Amedei, A.; Tenori, L. Metabolomics Profile in Gastrointestinal Cancers: Update and Future Perspectives. World J. Gastroenterol. 2020, 26, 2514–2532. [Google Scholar] [CrossRef] [PubMed]
  26. Ma, Y.; Zhang, P.; Wang, F.; Liu, W.; Yang, J.; Qin, H. An Integrated Proteomics and Metabolomics Approach for Defining Oncofetal Biomarkers in the Colorectal Cancer. Ann. Surg. 2012, 255, 720–730. [Google Scholar] [CrossRef]
  27. Nishiumi, S.; Kobayashi, T.; Ikeda, A.; Yoshie, T.; Kibi, M.; Izumi, Y.; Okuno, T.; Hayashi, N.; Kawano, S.; Takenawa, T.; et al. A Novel Serum Metabolomics-Based Diagnostic Approach for Colorectal Cancer. PLoS ONE 2012, 7, e40459. [Google Scholar] [CrossRef]
  28. Qiu, Y.; Cai, G.; Zhou, B.; Li, D.; Zhao, A.; Xie, G.; Li, H.; Cai, S.; Xie, D.; Huang, C.; et al. A Distinct Metabolic Signature of Human Colorectal Cancer with Prognostic Potential. Clin. Cancer Res. 2014, 20, 2136–2146. [Google Scholar] [CrossRef] [Green Version]
  29. Farshidfar, F.; Weljie, A.M.; Kopciuk, K.; Buie, W.D.; Maclean, A.; Dixon, E.; Sutherland, F.R.; Molckovsky, A.; Vogel, H.J.; Bathe, O.F. Serum Metabolomic Profile as a Means to Distinguish Stage of Colorectal Cancer. Genome Med. 2012, 4, 42. [Google Scholar] [CrossRef] [PubMed] [Green Version]
  30. Farshidfar, F.; Weljie, A.M.; Kopciuk, K.A.; Hilsden, R.; McGregor, S.E.; Buie, W.D.; MacLean, A.; Vogel, H.J.; Bathe, O.F. A Validated Metabolomic Signature for Colorectal Cancer: Exploration of the Clinical Value of Metabolomics. Br. J. Cancer 2016, 115, 848–857. [Google Scholar] [CrossRef] [Green Version]
  31. Bertini, I.; Cacciatore, S.; Jensen, B.V.; Schou, J.V.; Johansen, J.S.; Kruhøffer, M.; Luchinat, C.; Nielsen, D.L.; Turano, P. Metabolomic NMR Fingerprinting to Identify and Predict Survival of Patients with Metastatic Colorectal Cancer. Cancer Res. 2012, 72, 356–364. [Google Scholar] [CrossRef] [PubMed] [Green Version]
  32. ISO/DIS 23118 Molecular In Vitro Diagnostic Examinations—Specifications for Pre-Examination Processes in Metabolomics in Urine, Venous Blood Serum and Plasma. Available online: https://www.iso.org/obp/ui/#iso:std:iso:23118:ed-1:v1:en (accessed on 4 June 2021).
  33. Bruzzone, C.; Bizkarguenaga, M.; Gil-Redondo, R.; Diercks, T.; Arana, E.; García de Vicuña, A.; Seco, M.; Bosch, A.; Palazón, A.; San Juan, I.; et al. SARS-CoV-2 Infection Dysregulates the Metabolomic and Lipidomic Profiles of Serum. iScience 2020, 23, 101645. [Google Scholar] [CrossRef]
  34. R Core Team. R: A Language and Environment for Statistical Computing; R Foundation for Statistical Computing: Vienna, Austria, 2014. [Google Scholar]
  35. van Velzen, E.J.J.; Westerhuis, J.A.; van Duynhoven, J.P.M.; van Dorsten, F.A.; Hoefsloot, H.C.J.; Jacobs, D.M.; Smit, S.; Draijer, R.; Kroner, C.I.; Smilde, A.K. Multilevel Data Analysis of a Crossover Designed Human Nutritional Intervention Study. J. Proteome Res. 2008, 7, 4483–4491. [Google Scholar] [CrossRef]
  36. Westerhuis, J.A.; van Velzen, E.J.; Hoefsloot, H.C.; Smilde, A.K. Multivariate Paired Data Analysis: Multilevel PLSDA versus OPLSDA. Metabolomics 2010, 6, 119–128. [Google Scholar] [CrossRef] [Green Version]
  37. Cortes, C.; Vapnik, V. Support-Vector Networks. J. Mach. Learn. Res. 1995, 20, 273–297. [Google Scholar] [CrossRef]
  38. Jiménez, B.; Holmes, E.; Heude, C.; Tolson, R.F.; Harvey, N.; Lodge, S.L.; Chetwynd, A.J.; Cannet, C.; Fang, F.; Pearce, J.T.M.; et al. Quantitative Lipoprotein Subclass and Low Molecular Weight Metabolite Analysis in Human Serum and Plasma by 1H NMR Spectroscopy in a Multilaboratory Trial. Anal. Chem. 2018, 90, 11962–11971. [Google Scholar] [CrossRef]
  39. Benjamini, Y.; Hochberg, Y. Controlling the False Discovery Rate: A Practical and Powerful Approach to Multiple Testing. J. R. Stat. Soc. Ser. B 1995, 57, 289–300. [Google Scholar] [CrossRef]
  40. Zhang, X.; Zhao, X.-W.; Liu, D.-B.; Han, C.-Z.; Du, L.-L.; Jing, J.-X.; Wang, Y. Lipid Levels in Serum and Cancerous Tissues of Colorectal Cancer Patients. World J. Gastroenterol. 2014, 20, 8646–8652. [Google Scholar] [CrossRef] [PubMed]
  41. Mayengbam, S.S.; Singh, A.; Pillai, A.D.; Bhat, M.K. Influence of Cholesterol on Cancer Progression and Therapy. Transl. Oncol. 2021, 14, 101043. [Google Scholar] [CrossRef] [PubMed]
Figure 1. Study design.
Applsci 11 11120 g001
Figure 2. Score plots of the first two components of the mPLS models calculated using each of the three typologies of NMR spectra acquired: CPMG; NOESY; diffusion-edited. Discrimination accuracy of each model is reported. Each dot represents an NMR spectrum; dots are colored as follows: t0—orange, t1—turquoise. The first component mainly describes the differences between t0 and t1. The second component mainly reports the within-subject variation.
Applsci 11 11120 g002
Figure 3. Boxplots of the statistically significant metabolites and lipoproteins-related parameters discriminating CRC patients at t0 (orange) and t1 (turquoise); p-values obtained using Wilcoxon signed-rank test and adjusted for FDR are reported. *** p < 0.001; ** p < 0.01; * p < 0.05.
Applsci 11 11120 g003
Figure 4. Boxplots of the differences between t1 and t0 discriminating free-from-disease (green) and relapsed (red) patients, only statistically significant metabolites and lipoproteins-related parameters are reported; p-values obtained using Wilcoxon signed-rank test are reported. ** p < 0.01; * p < 0.05.
Applsci 11 11120 g004
Table 1. Descriptive statistics of enrolled CC patients at the time of analysis.
Whole Sample
(N = 41)
Stratified by
Progression Status
Stratified by
Chemotherapy Treatment
Not Relapsed
(N = 33)
Relapsed
(N = 8)
p-ValueCapecitabine
(N = 9)
XELOX
(N = 10)
No CT
(N = 22)
p-Value
Age at study entryMedian (min; max)73 (51;92)71 (51;92)78 (68;86)0.03277 (68;86)65 (51;72)78 (54;92)0.001
SexF21 (51%)18 (55%)3 (38%)0.4542 (22%)7 (70%)12 (55%)0.109
M20 (49%)15 (45%)5 (62%)7 (78%)3 (30%)10 (45%)
ECOG PSPS 029 (71%)23 (70%)6 (75%)17 (78%)10 (100%)12 (55%)0.102
PS 18 (20%)7 (21%)1 (12%)1 (11%)0 (0%)7 (32%)
PS 24 (10%)3 (9%)1 (12%)1 (11%)0 (0%)3 (14%)
pTpT16 (15%)6 (18%)0 (0%)0.0860 (0%)1 (10%)5 (23%)0.477
pT28 (20%)8 (24%)0 (0%)1 (11%)1 (10%)6 (27%)
pT323 (56%)17 (52%)6 (75%)7 (78%)7 (70%)9 (41%)
pT44 (10%)2 (6%)2 (25%)1 (11%)1 (10%)2 (9%)
NN024 (59%)23 (70%)1 (12%)0.0053 (33%)3 (30%)18 (82%)0.005
N+17 (41%)10 (30%)7 (88%)6 (67%)7 (70%)4 (18%)
Stage riskStage I11 (27%)11 (33%)0 (0%)0.0350 (0%)0 (0%)11 (50%)0.002
Stage II Low risk2 (5%)2 (6%)0 (0%)0 (0%)0 (0%)2 (9%)
Stage II High risk11 (27%)10 (30%)1 (12%)3 (33%)3 (30%)5 (23%)
Stage III17 (41%)10 (30%)7 (88%)6 (67%)7 (70%)4 (18%)
GradingG12 (5%)1 (3%)1 (12%)0.1681 (11%)1 (10%)0 (0%)0.205
G219 (48%)17 (53%)2 (25%)2 (22%)4 (40%)13 (62%)
G317 (42%)13 (41%)4 (50%)5 (56%)5 (50%)7 (33%)
G42 (5%)1 (3%)1 (12%)1 (11%)0 (0%)1 (5%)
NA110001
LocalizationLeft-sided13 (32%)12 (36%)1 (12%)0.3983 (33%)6 (60%)4 (18%)0.07
Right-sided28 (68%)21 (64%)7 (88%)6 (67%)4 (40%)18 (82%)
ComorbiditiesNo com.13 (32%)8 (24%)5 (62%)0.1114 (44%)3 (30%)6 (27%)0.519
No vascular com.8 (20%)8 (24%)0 (0%)0 (0%)3 (30%)5 (23%)
Vascular com.20 (49%)17 (52%)3 (38%)5 (56%)4 (40%)11 (50%)
MSIInstable1 (11%)1 (14%)0 (0%)10 (0%)0 (0%)1 (33%)0.278
MSI1 (11%)1 (14%)0 (0%)0 (0%)0 (0%)1 (33%)
Stable7 (78%)5 (71%)2 (100%)2 (100%)4 (100%)1 (33%)
NA322667619
CDX2Positive1 (100%)0 (0%)1 (100%)-1 (100%)0 (0%)0 (0%)-
NA4033781022
KRASMutated5 (29%)1 (11%)4 (50%)0.1313 (50%)0 (0%)2 (67%)0.042
WT12 (71%)8 (89%)4 (50%)3 (50%)8 (100%)1 (33%)
NA242403219
NRASWT13 (100%)8 (100%)5 (100%)-4 (100%)8 (100%)1 (100%)-
NA282535221
BRAFMutated4 (24%)3 (33%)1 (12%)0.5761 (17%)3 (38%)0 (0%)0.461
WT13 (76%)6 (67%)7 (88%)5 (83%)5 (62%)3 (100%)
NA242403219
ECOG PS: Eastern Cooperative Oncology Group Performance Status; pT: primary tumor size; N: regional lymph nodes; MSI: microsatellite instability.
Publisher’s Note: MDPI stays neutral with regard to jurisdictional claims in published maps and institutional affiliations.

