Article

The Ability to Normalise Energy Metabolism in Advanced COVID-19 Disease Seems to Be One of the Key Factors Determining the Disease Progression—A Metabolomic NMR Study on Blood Plasma

1
Biomedical Center Martin, Jessenius Faculty of Medicine in Martin, Comenius University in Bratislava, Mala Hora 4, 036 01 Martin, Slovakia
2
Clinic of Pneumology and Phthisiology, Jessenius Faculty of Medicine and University Hospital in Martin, Comenius University in Bratislava, Mala Hora 4, 036 01 Martin, Slovakia
3
Clinic of Neurology, Jessenius Faculty of Medicine and University Hospital in Martin, Comenius University in Bratislava, Mala Hora 4, 036 01 Martin, Slovakia
4
Department of Medical Biochemistry, Jessenius Faculty of Medicine in Martin, Comenius University in Bratislava, Mala Hora 4, 036 01 Martin, Slovakia
*
Author to whom correspondence should be addressed.
Appl. Sci. 2021, 11(9), 4231; https://doi.org/10.3390/app11094231
Submission received: 8 April 2021 / Revised: 30 April 2021 / Accepted: 4 May 2021 / Published: 7 May 2021

Abstract

:
Background: COVID-19 represents a severe inflammatory condition. Our work was designed to monitor the longitudinal dynamics of the metabolomic response of blood plasma and to reveal presumable discrimination in patients with positive and negative outcomes of COVID-19 respiratory symptoms. Methods: Blood plasma from patients, divided into subgroups with positive (survivors) and negative (worsening condition, non-survivors) outcomes, on Days 1, 3, and 7 after admission to hospital, was measured by NMR spectroscopy. Results: We observed changes in energy metabolism in both groups of COVID-19 patients; initial hyperglycaemia, indicating lowered glucose utilisation, was balanced with increased production of 3-hydroxybutyrate as an alternative energy source and accompanied by accelerated protein catabolism manifested by an increase in BCAA levels. These changes were normalised in patients with positive outcome by the seventh day, but still persisted one week after hospitalisation in patients with negative outcome. The initially decreased glutamine plasma level normalised faster in patients with positive outcome. Patients with negative outcome showed a more pronounced Phe/Tyr ratio, which is related to exacerbated and generalised inflammatory processes. Almost ideal discrimination from controls was proved. Conclusions: Distinct metabolomic responses to severe inflammation initiated by SARS-CoV-2 infection may serve towards complementary personalised pharmacological and nutritional support to improve patient outcomes.

1. Introduction

COVID-19, which develops after SARS-CoV-2 infection, represents a severe inflammatory condition. Over the past two decades, a close link between metabolism and immunity has emerged [1,2]. The immune reaction in severe inflammation is intimately associated with a dependency on amino acids included in the proteosynthesis and specific metabolism of immunocompetent cells [3]. In addition, the immune response of the organism is also closely related to glucose energetical metabolism [1,2,4,5,6]. Synergic interactions between metabolism and immune processes serve as a tool to monitor the particular state of an organism relating to immunological response via metabolomics analysis. The increasing number of studies confirms the great potential of the metabolomic approach in the evaluation of COVID-19 disease, its course, and its outcome [7,8,9,10]. A comprehensive metanalysis of COVID-19 patients showed several key metabolic characteristics for disease progression and clinical outcome [11]. Untargeted metabolomics on patients’ serum via mass spectroscopy revealed potential prognostic markers of both severity and outcome [10,12]. Interestingly, metabolomics may also predict antiviral drug efficacy in COVID-19 [13], and metabolomic analysis of patients’ exhaled air can identify patients with COVID-19 in acute respiratory distress syndrome. NMR-based metabolomic profiling of blood samples has been already used to monitor COVID-19 patients’ response to tocilizumab [14].
We focused herein on the dynamics of metabolomic changes in blood plasma at three successive time points during the first week of COVID-19 patient hospitalisation, with patients divided into two groups: (i) those with a positive outcome (survivors) and (ii) those with a negative outcome (non-survivors or obviously worsening condition). Hospitalised COVID-19 patients with clinically proven moderate-to-severe pneumonia with acute hypoxemic respiratory failure were included. We were interested to explore the metabolic changes in blood plasma that could be associated with immune cell response, as well as with energy metabolism, in comparison to control subjects representing a sample of the normal population, without any acute or chronic inflammatory or pulmonary diseases. Secondarily, it was of interest as to whether there are metabolomic features in blood plasma that could predict patient outcome, at which time point are they recognisable, and to what extent. Complementary to testing significant changes, we also employed a discriminatory algorithm in the search for metabolites that could serve alone or in combination as plasma biomarkers.

2. Materials and Methods

2.1. Subjects

Altogether, 53 patients with PCR-confirmed SARS-CoV-2 were included in the study. Patients were admitted to the Clinic of Pneumology and Phthisiology, Martin University Hospital, Slovakia, due to chest X-ray/CT signs of bilateral pneumonia and acute hypoxemic respiratory failure requiring oxygen supplementation (oxygen saturation at <94% in room air). In general, patients presented with typical symptoms of COVID-19: fever, cough, dyspnoea, weakness, fatigue, myalgia and arthralgia, loss of smell and taste, and loss of appetite. Some patients suffered from gastrointestinal symptoms (diarrhoea) as well. Laboratory results on admission showed increased inflammatory markers (CRP, IL-6, ferritin, fibrinogen) and hypoxemic respiratory failure, and changes in differential blood count included leucocytosis, lymphopenia, neutrophilia, and eosinopenia in most patients.
During the study, patients received either standard hospital enteral nutrition or a diabetic diet (patients with diabetes). Patients incapable of oral food intake received the equivalent for enteral nutrition via nasogastric tube. None of the included patients had percutaneous endoscopic gastrostomy/jejunostomy. Neither nutritional supplementation nor parenteral nutrition was administered. When necessary, but only sporadically, patients received crystalloid solutions to treat dehydration or mineral imbalance.
Oxygen was administered via nasal cannula, face mask, or face mask with a rebreathing bag with flow adjusted to achieve target oxygen saturation of 94%. Seven patients required high-flow nasal oxygen therapy (HFNO), and in case of hypoxemic–hypercapnic respiratory failure, three received non-invasive ventilation (NIV). In patients with severe and critical clinical condition requiring a very high flow of oxygen, saturation of 90% was considered sufficient. None of the included patients received mechanical ventilation during sample collection; however, two patients were later intubated and mechanically ventilated. Apart from oxygen supply, patients were treated with dexamethasone (all patients, dose of 6 mg/day for a duration of 10 days); antivirals (remdesivir or favipiravir if eligible according to local guidelines—duration of symptoms less than 7 days), n = 17; antibiotics (in case of bacterial superinfection or its suspicion), n = 53; LMWH, n = 49; vitamins: vitamin C, n = 17, vitamin D, n = 19; zinc, n = 14; and betaglucans, n = 44.
Patients were divided into two subgroups: Group A (n = 34) contained patients with a positive outcome (survivors), while Group B (n = 19) contained patients with a negative outcome, i.e., patients with a worsening condition during the sampling period, or those who died (10 were dead at the time of manuscript preparation). All known patient comorbidities at the time of study enrolment are listed in Table 1. To assess the patients’ condition, the determining criterion was the need for increasing/decreasing oxygen flow or switch to HFNO, NIV, or mechanical ventilation to achieve target oxygen saturation, together with clinical evaluation and known clinical outcome. Due to various causes such as hospital discharge before Day 7, death, or even patient disagreement with other blood collections, the number of samples on Day 3 or Day 7 is slightly reduced. All details about subjects included in the study are summarised in Table 1.
As controls, plasma samples from age- and gender-matched subjects without any acute or chronic inflammatory diseases, any type of respiratory failure, or any pulmonary diseases, regardless of common highly age-related conditions (hypertensia, obesity, and others in the representative sample of the population) were used, representing a ‘sample of the normal population’, collected in a fasting state without any additional criteria. Included were 55 subjects: median age 64, IQR 18, female n = 25.

2.2. Sample Preparation

Blood was collected in EDTA-coated tubes, in the fasting state, after the first night in the hospital (Day 1) and then 2 and 6 days later (Day 3 and Day 7). Within 1 h after collection, blood was centrifuged to plasma at 4 °C, at 2000 rpm, for 20 min and stored at −80 °C until use. Plasma denaturation was carried out according to Gowda et al. [15]: 600 µL of methanol was added to 300 µL of blood plasma. The mixture was briefly vortexed and frozen at −24 °C for 20 min. After subsequent centrifugation at 14,000 rpm for 15 min, 700 µL of supernatant was taken, dried out, and stored at −24 °C. Before NMR measurement, the dried matter was mixed with 100 µL of stock solution (consisting of: phosphate buffer 200 mM pH 7.4 and 0.30 mM TSP-d4 (trimethylsilylpropionic acid -d4) as a chemical shift reference in deuterated water) and 500 µL of deuterated water. Finally, 550 µL of the final mixture was transferred into a 5 mm NMR tube.

2.3. NMR Measurement

NMR data were acquired on a 600 MHz Avance III NMR spectrometer from Bruker, Germany, equipped with a TCI CryoProbe at T = 310 K. Initial settings (basal shimming, receiver gain, and water suppression frequency) were performed on an independent sample and adopted for measurements. After preparation, samples were stored in a Sample Jet automatic machine, cooled at approximately 5 °C. Before measurement, each sample was preheated to 310 K for 5 min. An exponential noise filter was used to introduce 0.3 Hz line broadening before Fourier transform. All data were zero-filled. Samples were randomly ordered for acquisition.
We modified standard profiling protocols from Bruker as follows: denaturised plasma: noesy with presaturation (noesygppr1d): FID size 64k, dummy scans 4, number of scans 64, spectral width 20.4750 ppm; profiling cpmg (cpmgpr1d, L4 = 126, d20 = 3ms): number of scans 64, spectral width 20.4750 ppm. For 15 randomly chosen samples, 2D spectra were measured: cosy with presaturation (cosygpprqf): FID size 4k, dummy scans 8, number of scans 16, spectral width 16.0125 ppm; homonuclear J-resolved (jresgpprqf): FID size 8k, dummy scans 16, number of scans 32. Samples were randomly ordered for acquisition. For denaturised plasma samples, we kept the half-width of the TSP-d4 signal under 1.0 Hz. All experiments were conducted with a relaxation delay of 4 s.

2.4. Data Processing

Spectra were solved using the human metabolomic database (www.hmda.ca, accessed on 23 March 2021) [16], chenomics software free trial version, internal metabolite database, and research in the metabolomic literature [15]. The proton NMR chemical shifts are reported relative to the TSP-d4 signal assigned a chemical shift of 0.000 ppm. The peak multiplicities were confirmed in J-resolved spectra, and homonuclear cross peaks were confirmed in 2D cosy spectra. Peak assignments are listed in Table 2.
All spectra were binned to bins of size 0.001 ppm. No normalisation method was applied to the data. Then, the intensities of selected bins were summed only for spectra subregions with only one metabolite assigned or minimally affected by other co-metabolites. Metabolites showing weak intensive peaks or strong peak overlap were excluded from the evaluation. The obtained values were used as relative concentrations of particular metabolites.
Besides principal component analysis (PCA) and partial least squares discriminant analysis (PLS-DA), we applied the random forest (RF) discriminatory algorithm on the data. We ran nonparametric ANOVA (Kruskal–Wallis) and the nonparametric Mann–Whitney U-test to test significance. For data processing and analyses, we used the online tool metaboanalyst 5.0 [17], Origin Pro 2019, PASW Statistics software, and Matlab 2018b.

3. Results

Altogether, 24 metabolites were identified in denatured plasma in both patients and healthy subjects, where the signals from 19 compounds were sufficient for quantitative evaluation (Table 2). Further in the text, we use the trivial names of 2-ketoacids derived from leucine, isoleucine, and valine (IUPAC names are in Table 2). Besides molecular metabolites, we also evaluated the lipoprotein fraction, which, as described by Liu et al., contains very-low-density lipoproteins (VLDL), low-density lipoproteins (LDL), and high-density lipoproteins (HDL), including up to one-third of triacylglycerides [18]. For multivariate analyses, we used the relative concentrations of plasma metabolites (expressed as the integral of a particular spectral region) as an input in order to target biologically informative value. We avoided feeding the algorithms with binned NMR spectra as is common in metabolomic studies, since there may be regions of NMR spectra marked as important that are not straightforward and unambiguously related to biological relevance.
Firstly, the data of all patients were analysed (Group A and Group B together) on Day 1 against controls by PCA and PLS-DA (Figure 1). In contrast to patients, controls were relatively clustered together. The loading values were the highest for glucose, 3-hydroxybutyrate, and leucine in PC1 and alanine, lactate, and glutamine in PC2. The situation was very similar after the PLS-DA run. The 10-fold cross-validated PLS-DA algorithm performed with accuracy of 0.954, R2 of 0.7926, and Q2 of 0.6749 for eight components. The variables with the highest VIP scores were: glucose, 3-hydroxybutyrate, alanine, leucine, valine, and glutamine (performance measured in accuracy). The incorporation of additional variables did not improve the performance.
The PCA and PLS-DA analyses of the ternary system comprising Group A and Group B on Day 1 and the controls showed a very similar result to those for the previous binary system, where the patients were clustered together relatively well and patients were scattered among themselves without obvious differentiation between patient groups (results shown in Figure S1 in the supplement). PLS-DA analyses were further used to differentiate patient data on a given day. The results from these analyses can be summarised as follows (the best result, performance measured in accuracy): Day 1, accuracy of 0.73, R2 of 0.138 (one component); Day 3, accuracy of 0.76, R2 of 0.3905 (five components); and Day 7, accuracy of 0.72, R2 of 0.387 (four components). In all cases, Q2 values were negative, which suggests an overfitted model.
In the next step, we employed the random forest (RF) discriminatory algorithm to obtain a more realistic estimation of the discriminatory power of the system since RF is relatively robust to overfitting and outliers [19]. The RF algorithm used included cross-validation via balanced subsampling. It worked with two-thirds of the data for training and the rest for testing for regression, and about 70% of the data for training and the rest for testing during classification to overcome the negative aspects of training and testing on the same data. This approach partially substitutes the validation on an independent data set. As input variables also for this algorithm, we used relative concentrations of metabolites in plasma expressed by the spectral integrals of particular NMR regions. In the case of highly correlating predictors, RF may label some of them as unimportant, so RF was launched 10 times. Within the RF re-runs, metabolites slightly permuted in the importance order. As an output from these analyses, receiver operating characteristic curve (ROC) curves were created. The ROC is defined only for binary systems, and it is created by plotting the true-positive rate against the false-positive rate at various threshold settings. An important output is the area under the curve (AUC), which represents ranking quality. The AUC of a ranking is 1 (the maximum AUC value) when all samples are truly assigned into the groups. An AUC of 0.5 is equivalent to randomly classifying subjects as either positive or negative (i.e., the classifier is of no practical utility) [20]. We ran RF discriminatory analyses for the systems of patients versus controls, Group A versus controls, Group B versus controls, and Group A versus Group B on Days 1, 3, and 7. The results of RF classifications are summarised in Table 3.
For significance testing among relative concentrations of plasma metabolites in patients against controls and patients’ dynamic data, we used nonparametric ANOVA, known as the Kruskal–Wallis test. Due to the relatively low sample sizes, we continued with nonparametric testing via the Mann–Whitney U-test for the combination of binary data sets. The details are listed in Table 4. The Phe/Tyr ratio was also used as one variable. As the threshold to claim significance, the p-value was set to 0.05, as established. In the discussion, we did not strictly adhere to p-values, but we focused rather on the data behaviour visualised in the box plots.

4. Discussion

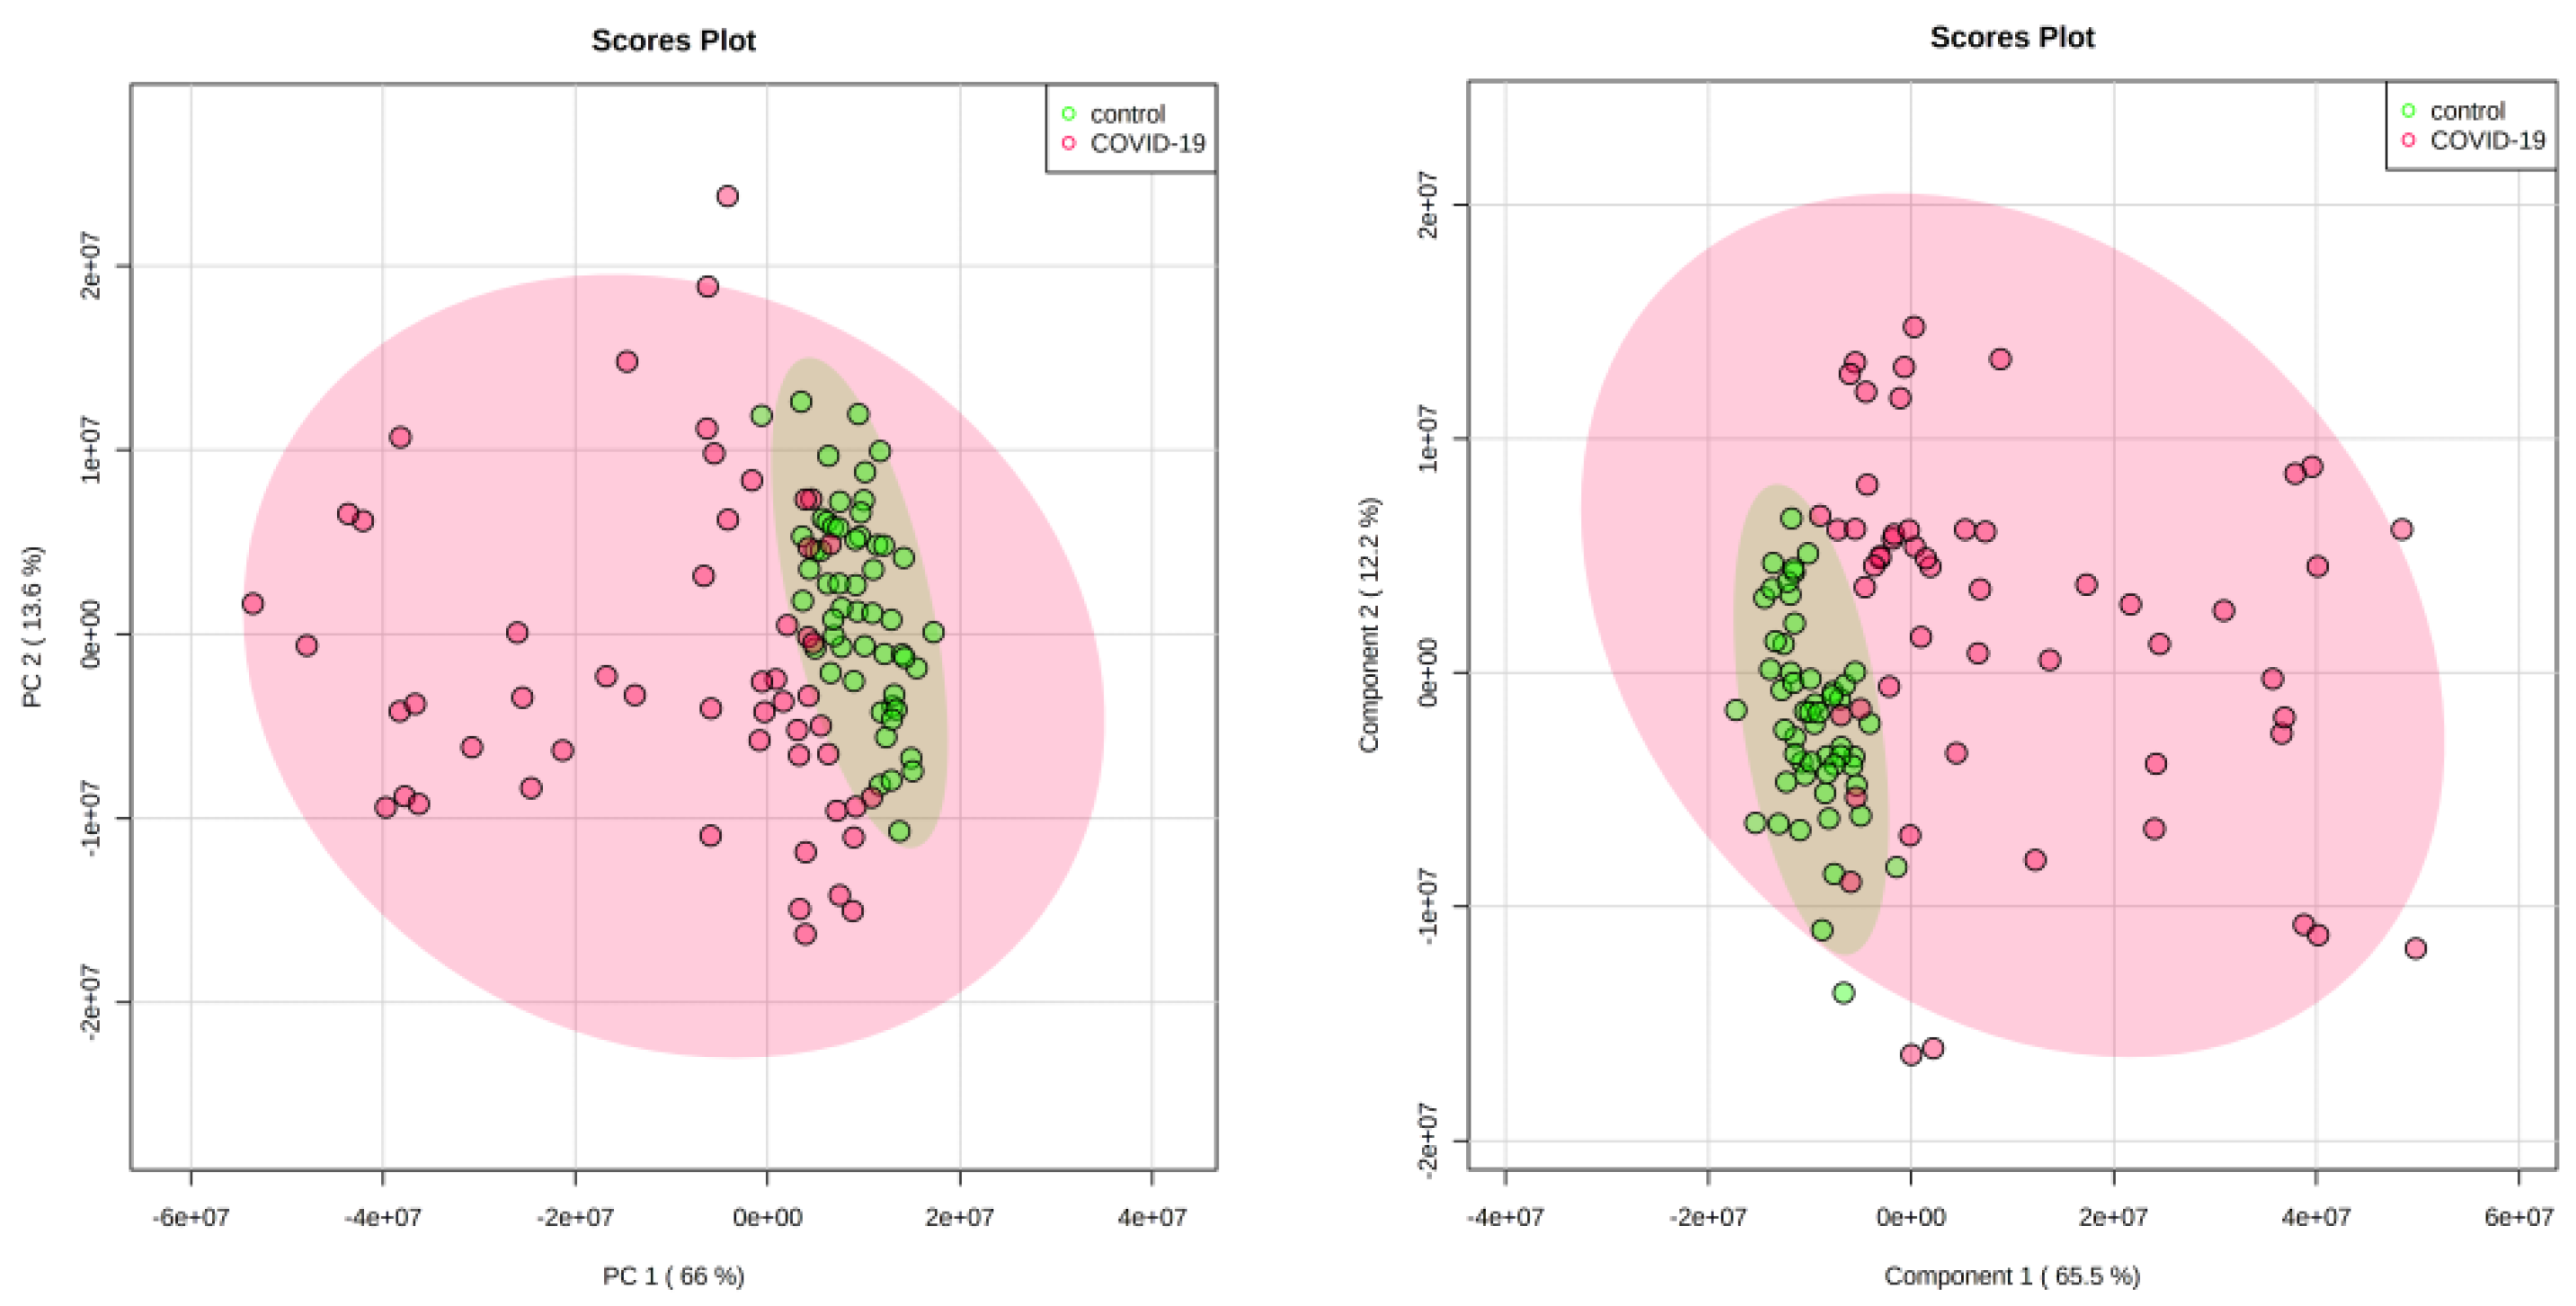
4.1. Discriminatory Analyses

PCA and PLS-DA analyses are well-established tools when evaluating multidimensional data. PCA analysis serves rather as a 2D visualisation of data sets indicating group proximity. PLS-DA includes a discriminatory algorithm and may be used also to differentiate among groups. PCA analysis of the patient data collected on Day 1 against controls showed controls clustered together, whilst patients were scattered in 2D space. This suggests the great data variability in patient samples, which was more or less confirmed by PLS-DA. As PLS-DA is known to overfit the data [19], for biomarker discovery, we employed a cross-validated RF algorithm. As an output, the ROC curve was created. For the system of patients on Day 1 and controls, RF performed very well with an AUC of 0.995 for five variables with an out-of-bag error of 3/108. The variables Phe/Tyr ratio, phenylalanine, 3-hydroxybutyrate, acetate, and glucose were of the highest importance. The corresponding ROC curve is shown in Figure 2.
Very similar performance—almost ideal discrimination—was achieved for the systems of Group A on Day 1 against controls and Group B on Day 1 against controls (details in Table 3). The five metabolites of the highest importance were identical to those before: phenylalanine, Phe/Tyr ratio, acetate, 3-hydroxybutyrate, glucose, permuted with glutamine, and proline.
The possibility to discriminate between acute COVID-19 patients and healthy controls has been proven in previous studies [7,10,11]. These studies covered another spectrum of metabolites evaluated by different analytical tools as NMR spectroscopy. Here, we also note that metabolites that were marked as the most important in the discrimination algorithm may not be specific to COVID-19 disease, since as discussed in the next text, they are generally related to inflammation, immune response, and energy metabolism.
It was of interest to see whether there are any metabolites in blood plasma that could serve as potential predictors of disease progress/outcome. We ran RF discrimination for binary systems of patients’ groups on collection days. Here the performance was weaker, with AUC values of 0.67 on Day 1 and 0.78 on Day 3 for common, permuting variables: Phe/Tyr ratio, alanine, lysine, glutamine, leucine, and phenylalanine. A further increase in the number of variables did not improve the performance of the discrimination analysis. For the data set of Group A versus Group B on Day 7, the system did not show any discriminatory potential, with an AUC value of 0.503, in other words, the classification was not relevant. Based on this, the biochemical changes observed were rather indicative, not defining unambiguous biomarkers for patient outcome.

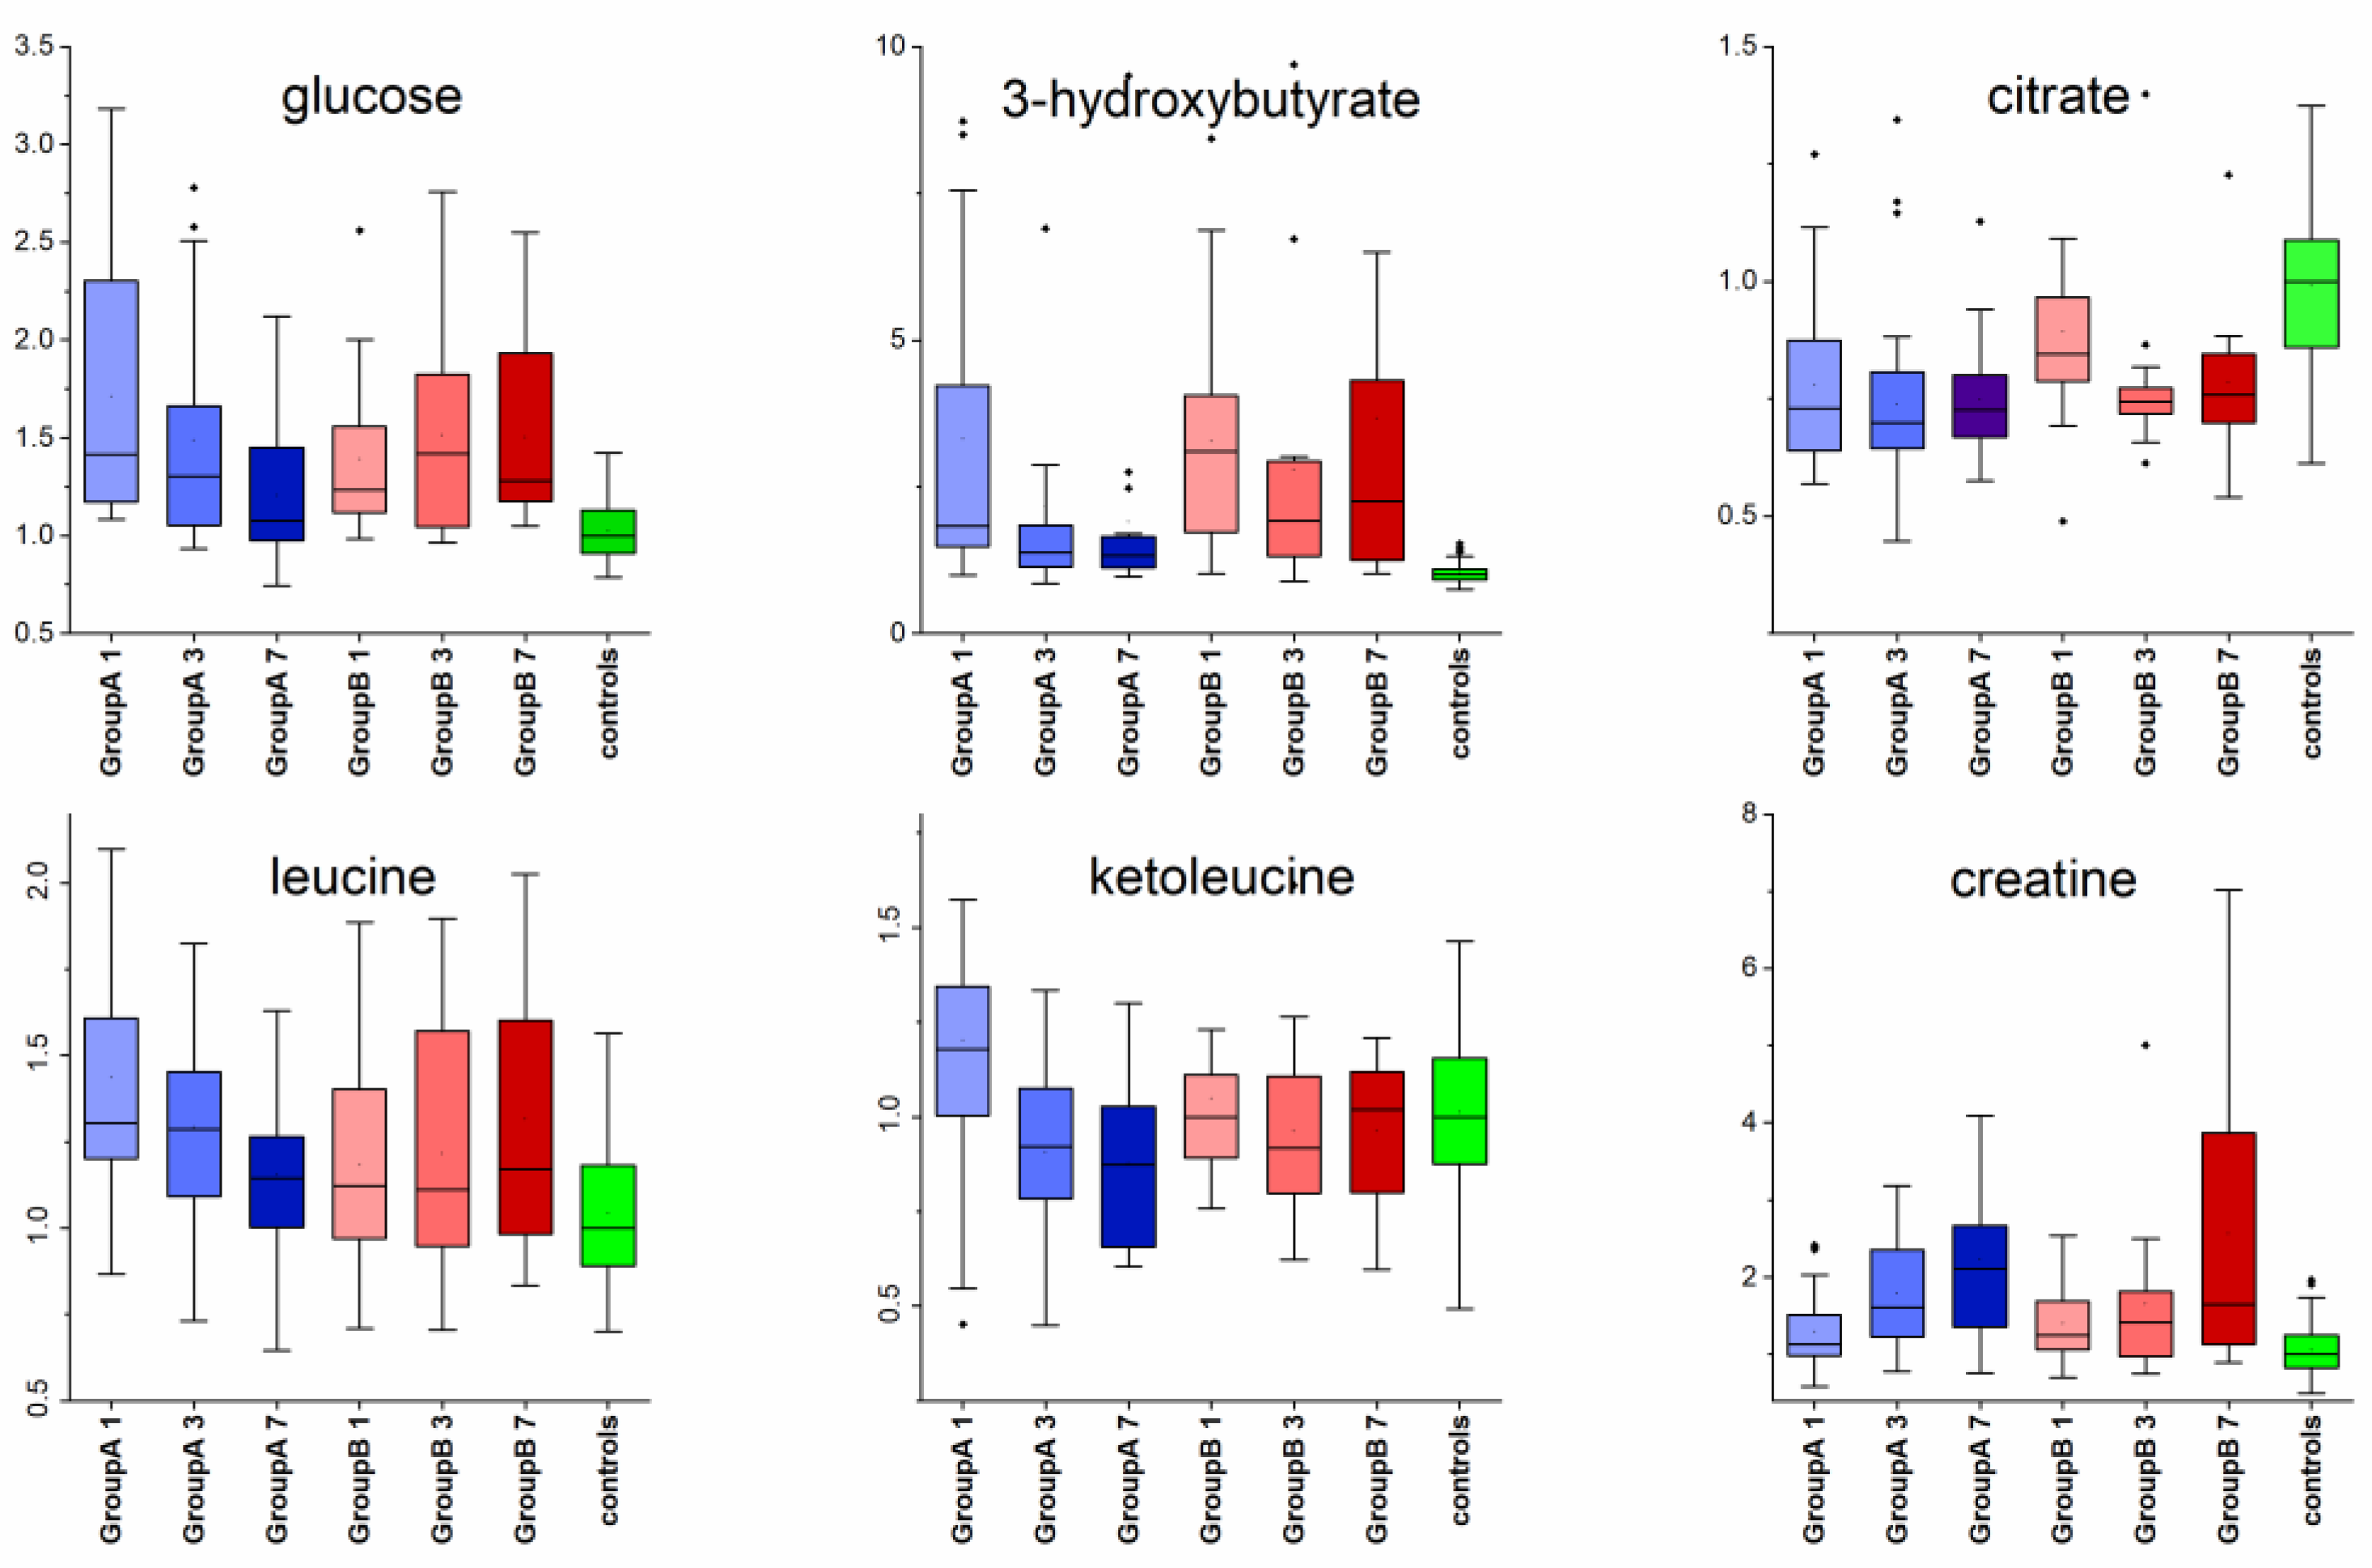
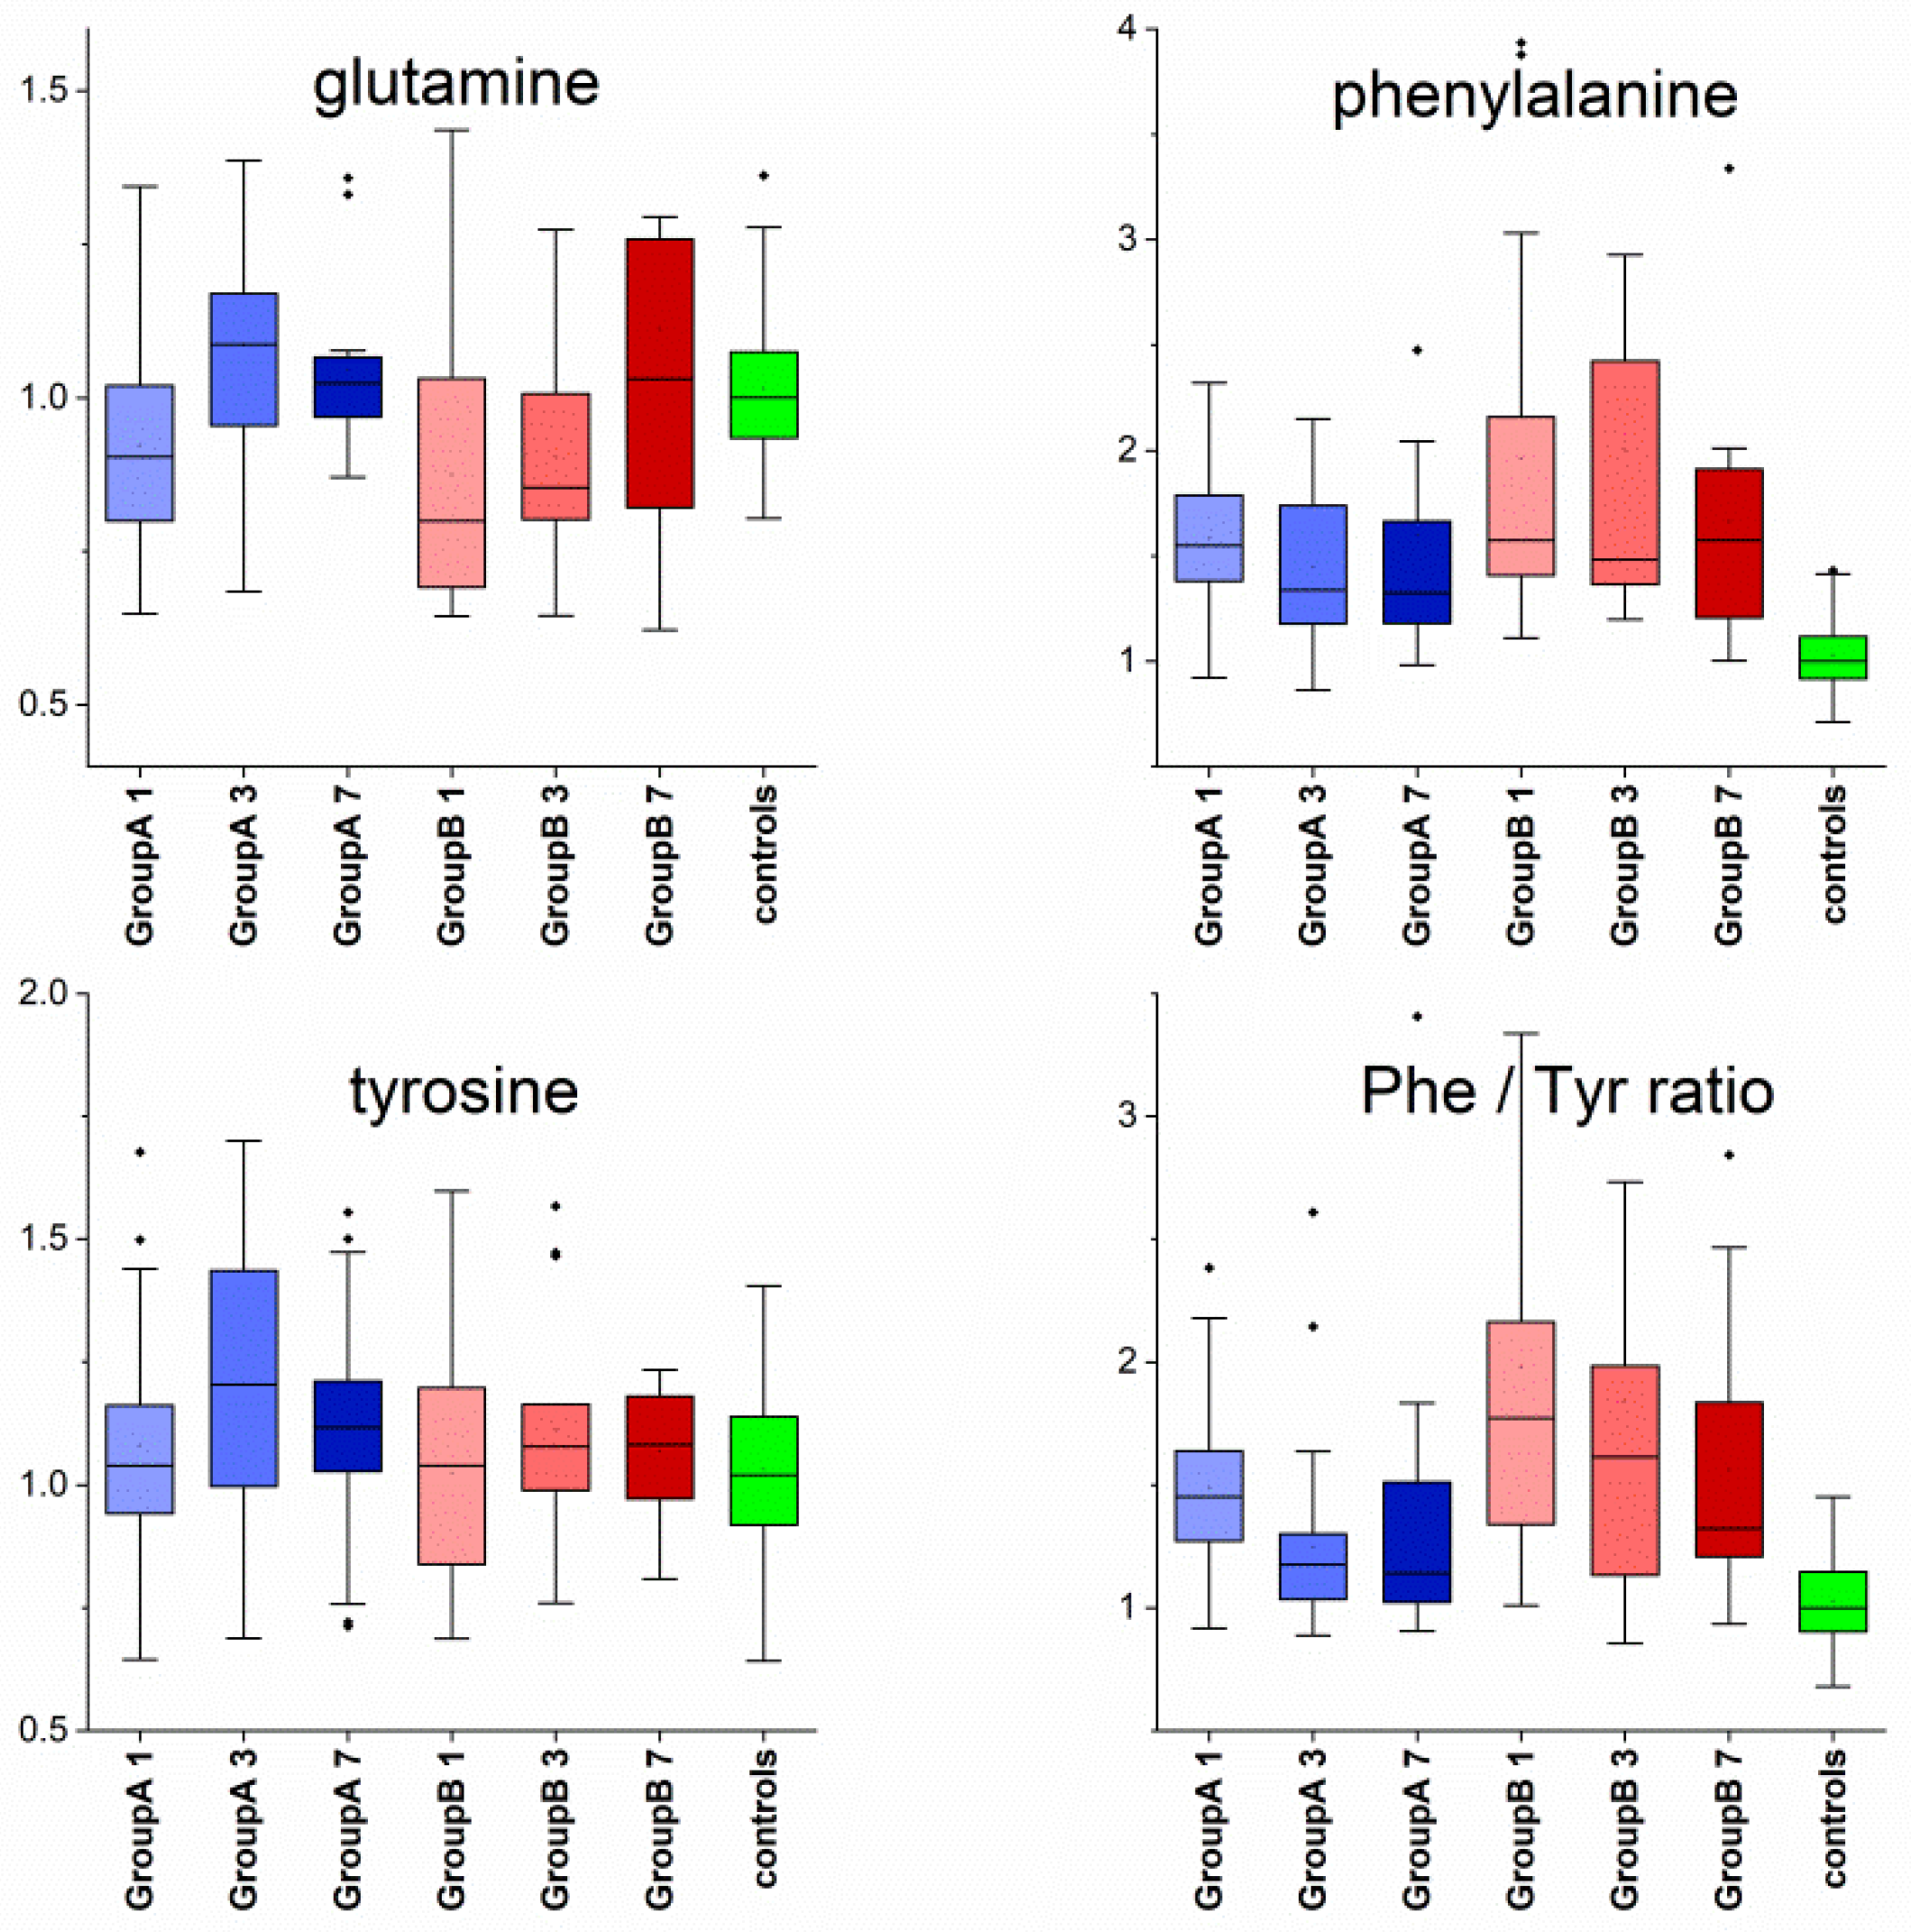
4.2. Metabolomic Changes

Patients hospitalised due to a severe course of COVID-19 showed a significantly increased glucose level on Day 1. All patients were equally treated over the whole time period with dexamethasone, which is known to impair glucose metabolism [21] via the stimulation of gluconeogenesis from amino acids released from muscles, and even one dose of 10 mg dexamethasone may lead to a temporarily increased blood glucose level [22]. The hyperglycaemia in COVID-19 patients treated with dexamethasone is presumably caused by ‘triple insult’: dexamethasone-induced impaired glucose metabolism, COVID-19-induced insulin resistance, and COVID-19 impaired insulin production [23]. Prolonged uncontrolled hyperglycaemia, regardless of diabetes mellitus, seems to be important in the pathogenesis of COVID-19 [24]. In our study, the hyperglycaemia normalised in Group A, but not in patients with unfavourable outcome included in Group B (Figure 3). This observed result is in line with general knowledge that hyperglycaemia is an unfavourable state in many clinical conditions, i.a., in severe inflammation [25], and is one of the important risk factors of COVID-19 disease progression [26]. The plasma levels of glycolytic products pyruvate and, eventually, lactate were not significantly changed in any group of patients. The relative plasma level of alanine, a metabolite that contributes significantly to liver gluconeogenesis, was decreased on Day 1 in both groups but normalised in patients with a positive outcome on Days 3 and 7; however, it stayed decreased in Group B (figure not shown).
In the blood plasma of COVID-19 patients, we observed a significantly increased level of 3-hydroxybutyrate, a ketone bodies representative. Besides serving as an energy source for the brain, heart, and skeletal muscle, ketone bodies play pivotal roles as signalling mediators, drivers of protein post-translational modification, and modulators of inflammation and oxidative stress [27]. 3-hydroxybutyrate exerts a predominantly anti-inflammatory response [28,29,30], but can also be pro-inflammatory [31]. A recent study on COVID-19 patients already showed dysbalance in ketone bodies [32]. In our study, the initially increased plasma level of 3-hydroxybutyrate decreased over Day 3 and Day 7 in Group A, but it stayed at an elevated level in Group B on the third and seventh days (Figure 3). Interestingly, the glucose level in this patient group also remained high. As we did not analyse the level of C peptide as a representative of the insulin level, we can hypothesise that the proposed glucose resistance or insufficient glucose utilisation is compensated by ketone bodies. The increase in the 3-hydroxybutyrate level in COVID-19 patients is accompanied by a decreased amount of lipoprotein fraction in blood plasma in patients suffering from COVID-19, containing up to one-third of triacylglycerides [18] as one of the additional substrates for ketone body synthesis (boxplot not shown).
We observed a decreased citrate level in the blood plasma in COVID-19 patients, suggesting alteration of the TCA cycle (Figure 3), similar to the results of a recent study by Pang et al. [11]. Besides including α-ketoglutarate, an essential substrate for endogenous glutamate/glutamine synthesis, there is evidence that TCA cycle intermediates also have an epigenetic impact by influencing DNA and histone methylation, including immune cells [33]. Further, the metabolite creatine, a part of muscle energy metabolism, was significantly increased in the blood plasma of COVID-19 patients compared with controls in both groups, rising with the time of hospitalisation (Figure 3). Patients forced to lie in bed for a sustained period lack spontaneous movement utilising muscle energy, which is probably the reason for the increase of plasma creatine.
BCAAs (branched chain amino acids), including leucine, isoleucine, and valine, share a common pattern of extrahepatic metabolism, and their relative plasma concentrations were represented similarly in both groups of patients. In Figure 3, we show only the dynamics of leucine since isoleucine and valine behaved almost identically. As a representative of ketoacids derived from BCAAs, we show only the course of ketoleucine, as the dynamics was repeated for the other two ketoacids: ketovaline and ketoisoleucine. Increased leucine in COVID-19 patients was reported by Dierckx et al. [34]. There is an established association between elevated circulating BCAAs and their deleterious effects, as their increased concentration may promote oxidative stress and inflammation [35], having also a neurological impact [36,37]. By monitoring dynamic changes for two different patient subgroups, we observed that initially increased plasma levels of BCAAs in both groups slowly decreased in Group A but not in Group B (Figure 3). Interestingly, the mean values of BCAAs in Group B obviously follow the course of the plasma glucose levels. The increase of BCAAs at time of impaired glycolysis and increased use of fatty acids were very recently discussed in a comprehensive review by Holecek [38], showing the important role of BCAAs in energy metabolism.
Taking the above discussed results together, severe inflammation induced by COVID-19 caused changes in energy metabolism, where we observed increased blood glucose that implies lowered glucose utilisation (the influence of dexamethasone treatment cannot be omitted). In balance, the body, including immune cells, uses ketone bodies (observed increased 3-hydroxybutyrate together with decreased triacylglycerides) as an energy source, and, alternatively also amino acids released by accelerated protein catabolism (increased levels of essential amino acids BCAAs). Interestingly, although all patients in both groups received the dexamethasone treatment during the follow-up period, the above mentioned changes normalised only in patients with a positive outcome; however, they persisted in patients with a negative outcome (more than half of them had died at the time of writing). This course was independent of the patients’ diet (Figure S2 in Supplement).
In acute inflammatory conditions, the demand on glutamine increases [39] which may lead to its plasma decrease if the endogenous synthesis of glutamine does not fulfil the requirements of the body [39]. Glutamine serves besides others as a fuel for immune cells—lymphocytes, neutrophils, and macrophages [39,40,41,42]—and plays a crucial role in cytokine production [42]. In our study, we noticed a decrease in the glutamine plasma level in COVID-19 patients on Day 1, observed to a lower extent in Group A, which is in accordance with another study where glutamine deficiency may have contributed to disease severity [43]. The glutamine plasma level normalised in both groups, but this was faster in Group A (Figure 4). On Day 7, both groups of patients showed plasma glutamine levels very similar to the level in control subjects, where probably the balance between glutamine production and utilisation had stabilised (Figure 4). Accelerated spontaneous stabilisation of glutamine levels in patients with better outcome supports the results from another study, where the administration of glutamine in the early period of infection suggested a shortened hospital stay and decreased the need for ICU stay [40].
Another significant metabolic parameter associated with immune activation and inflammation is the Phe/Tyr ratio [44,45]. Perturbations in phenylalanine and tyrosine biosynthesis were recognised in SARS-CoV-2 patients by Barberis et al. [46]. In our study, both groups showed initially increased plasma phenylalanine levels, as observed in another study [34], and the level tended to decrease in Group A but not in Group B (Figure 4). The plasma tyrosine level did not show any substantial change. The Phe/Tyr ratio was calculated by dividing the relative concentrations of both metabolites. The obtained value is only the relative ratio, but for comparison, it has the same informative value. The Phe/Tyr ratio was increased in both groups, obviously higher in patients with unfavourable outcome, where a course towards control levels was slowed down in Group B against Group A (Figure 4). Positive relationships between the Phe/Tyr ratio and immune activation markers have been described earlier in several papers [44,45]. It was suggested that suppression of body inflammation can, to a certain extent, improve abnormalities in Phe metabolism within associated neuropsychiatric symptoms [44], among which, e.g., depression and fatigue are some of the most recognised post-COVID-19 difficulties [47].

5. Conclusions

Metabolomic changes in blood plasma analysed by NMR in patients suffering COVID-19 were strong enough to obtain almost ideal discrimination from controls, where the ROC derived from random forest showed an AUC of 0.995 for the variables 3-hydroxybutyrate, phenylalanine, acetate, glucose, and Phe/Tyr ratio. The inflammation by COVID-19 caused changes in the body’s energy metabolism, where we observed increased blood glucose that implies lowered glucose utilisation, balanced with increased production of 3-hydroxybutyrate as an alternative energy source. Besides that, increased essential BCAAs are a sign of accelerated protein catabolism, offering a further energy source. Interestingly, although all COVID-19-positive patients received dexamethasone treatment during the follow-up period, the above mentioned changes (increased glucose, 3-hydroxybutyrate, and BCAAs levels in blood plasma) normalised only in patients with positive outcome by the seventh day; however, they persisted for over one week in patients with negative outcome (more than half of them had died at the time of writing). Further, patients suffering COVID-19 showed decreased plasma glutamine that normalised faster in patients with a positive outcome. With the length of hospital stay, plasma levels of creatine increased in patients in both groups. Increased Phe/Tyr ratio, which is closely connected with neuropsychiatric morbidities, often reported as post-COVID-19 symptoms, was more pronounced in patients with a negative outcome. Based on our results, the ability of patients to normalise energy metabolism seems to be one of the key factors determining the disease progression. This trend was observed independently of patient diet, which differed with respect to diabetic condition. This study documents evident differences in the course of the metabolomic response to COVID-19 in relation to patient outcome. However, the described changes may not be unique for COVID-19 since they reflect generalised immune response and alterations in body energy metabolism as well. The presented results may serve towards complementary personalised pharmacological and nutritional support in order to improve patient outcomes in severe inflammatory conditions.

Supplementary Materials

The following are available online at https://www.mdpi.com/article/10.3390/app11094231/s1, Figure S1: PCA (left) and PLD-DA analyses (right) of the system of patients divided into subgroups Group A and Group B on Day 1 versus controls; algorithms were fed relative concentrations of plasma metabolites, and analyses were run in metaboanalyst [16]. Figure S2. The relative changes in two metabolites closely related to energy metabolism—glucose and 3-hydroxybutyrate—where both Groups A and B were divided into subgroups according to patient diet (according to presence of diabetes) on Days 1, 3, and 7 after hospital arrival; not dia = non-diabetic patients on a normal diet, dia = diabetic patients on a diabetic diet. Values were relativized to median of controls set to 1.

Author Contributions

Conceptualization, E.B., A.B., R.V., V.N. and J.L.; methodology, E.B.; formal analysis, E.B.; investigation, E.B., Z.D. and J.L.; data curation, E.B., A.B., R.V., Z.D. and J.L.; writing—original draft preparation, E.B..; writing—review and editing, A.B., E.H., V.N. and J.L.; supervision, J.L.; funding acquisition, J.L. All authors have read and agreed to the published version of the manuscript.

Funding

This publication has been produced with the support of the Integrated Infrastructure Operational Program for the project: New possibilities for laboratory diagnostics and massive screening of SARS-Cov-2 and identification of mechanisms of virus behaviour in human body, ITMS: 313011AUA4, co-financed by the European Regional Development Fund and grant VEGA No. 230/20 and APVV 15/0107

Institutional Review Board Statement

This study was approved by the Ethics Committee of the Jessenius Faculty of Medicine in Martin (registered under IRB00005636 at Office for Human Research Protection, U.S. Department of Health and Human Services) under the code EK82/2020.

Informed Consent Statement

Informed consent was obtained from all subjects involved in the study.

Data Availability Statement

The NMR spectra or evaluated data used in this study are available on request from the author: eva.baranovicova@uniba.sk.

Acknowledgments

We would like to thank the medical staff from the Clinic of Pneumology and Phthisiology, Martin University Hospital, Slovakia, for their helpfulness during sample collection. This publication was produced with the support of the Integrated Infrastructure Operational Program for the project: New possibilities for laboratory diagnostics and massive screening of SARS-CoV-2 and identification of mechanisms of virus behaviour in human body, ITMS: 313011AUA4, co-financed by the European Regional Development Fund and grant VEGA No. 230/20.

Conflicts of Interest

The authors declare no conflict of interest.

References

  1. Wellen, K.E.; Hotamisligil, G.S. Inflammation, stress, and diabetes. J. Clin. Investig. 2005, 115, 1111–1119. [Google Scholar] [CrossRef] [Green Version]
  2. Jung, J.; Zeng, H.; Horng, T. Metabolism as a guiding force for immunity. Nat. Cell Biol. 2019, 21, 85–93. [Google Scholar] [CrossRef]
  3. McGaha, T.L.; Huang, L.; Lemos, H.; Metz, R.; Mautino, M.; Prendergast, G.C.; Mellor, A.L. Amino acid catabolism: A pivotal regulator of innate and adaptive immunity. Immunol. Rev. 2012, 249, 135–157. [Google Scholar] [CrossRef] [PubMed] [Green Version]
  4. Jafar, N.; Edriss, H.; Nugent, K. The Effect of Short-Term Hyperglycemia on the Innate Immune System. Am. J. Med Sci. 2016, 351, 201–211. [Google Scholar] [CrossRef]
  5. Berbudi, A.; Rahmadika, N.; Tjahjadi, A.I.; Ruslami, R. Type 2 Diabetes and its Impact on the Immune System. Curr. Diabetes Rev. 2020, 16, 442–449. [Google Scholar] [CrossRef] [PubMed]
  6. Geerlings, S.E.; Hoepelman, A.I.M. Immune dysfunction in patients with diabetes mellitus (DM). FEMS Immunol. Med. Microbiol. 1999, 26, 259–265. [Google Scholar] [CrossRef] [PubMed]
  7. Wu, D.; Shu, T.; Yang, X.; Song, J.-X.; Zhang, M.; Yao, C.; Liu, W.; Huang, M.; Yu, Y.; Yang, Q.; et al. Plasma metabolomic and lipidomic alterations associated with COVID-19. Natl. Sci. Rev. 2020, 7, 1157–1168. [Google Scholar] [CrossRef]
  8. Song, J.-W.; Lam, S.M.; Fan, X.; Cao, W.-J.; Wang, S.-Y.; Tian, H.; Chua, G.H.; Zhang, C.; Meng, F.-P.; Xu, Z.; et al. Omics-Driven Systems Interrogation of Metabolic Dysregulation in COVID-19 Pathogenesis. Cell Metab. 2020, 32, 188–202. [Google Scholar] [CrossRef]
  9. Blasco, H.; Bessy, C.; Plantier, L.; Lefevre, A.; Piver, E.; Bernard, L.; Marlet, J.; Stefic, K.; Bretagne, I.B.-D.; Cannet, P.; et al. The specific metabolome profiling of patients infected by SARS-COV-2 supports the key role of tryptophan-nicotinamide pathway and cytosine metabolism. Sci. Rep. 2020, 10, 1–12. [Google Scholar] [CrossRef]
  10. Shen, B.; Yi, X.; Sun, Y.; Bi, X.; Du, J. Proteomic and metabolomic characterisation of COVID-19 patient sera. Cell 2020, 182, 59–72. [Google Scholar] [CrossRef] [PubMed]
  11. Pang, Z.; Zhou, G.; Chong, J.; Xia, J. Comprehensive Meta-Analysis of COVID-19 Global Metabolomics Datasets. Metabolites 2021, 11, 44. [Google Scholar] [CrossRef]
  12. Roberts, I.; Muelas, M.W.; Taylor, J.M.; Davison, A.S.; Xu, Y.; Grixti, J.M.; Gotts, N.; Sorokin, A.; Goodacre, R.; Kell, D.B. Untargeted metabolomics of COVID-19 patient serum reveals potential prognostic markers of both severity and outcome. medRxiv 2020. [Google Scholar] [CrossRef]
  13. Migaud, M.; Gandotra, S.; Chand, H.S.; Gillespie, M.N.; Thannickal, V.J.; Langley, R.J. Metabolomics to Predict Antiviral Drug Efficacy in COVID-19. Am. J. Respir. Cell Mol. Biol. 2020, 63, 396–398. [Google Scholar] [CrossRef]
  14. Meoni, G.; Ghini, V.; Maggi, L.; Vignoli, A.; Mazzoni, A.; Salvati, L.; Capone, M.; Vanni, A.; Tenori, L.; Fontanari, P.; et al. Metabolomic/lipidomic profiling of COVID-19 and individual response to tocilizumab. PLoS Pathog. 2021, 17, e1009243. [Google Scholar] [CrossRef]
  15. Gowda, G.A.N.; Gowda, Y.N.; Raftery, D. Expanding the Limits of Human Blood Metabolite Quantitation Using NMR Spectroscopy. Anal. Chem. 2015, 87, 706–715. [Google Scholar] [CrossRef] [Green Version]
  16. Wishart, D.S.; Feunang, Y.D.; Marcu, A.; Guo, A.C.; Liang, K.; Vázquez-Fresno, R.; Sajed, T.; Johnson, D.; Allison, P.; Karu, N.; et al. HMDB 4.0: The human metabolome database for 2018. Nucleic Acids Res. 2018, 46, D608–D617. [Google Scholar] [CrossRef] [PubMed]
  17. Xia, J.; Wishart, D.S. Using MetaboAnalyst 3.0 for Comprehensive Metabolomics Data Analysis. Curr. Protoc. Bioinform. 2016, 55, 14-10. [Google Scholar] [CrossRef]
  18. Liu, M.; Tang, H.; Niholson, J.K.; Lindon, J.C. Use of 1H NMR-determined diffusion coefficients to characterise lipoprotein fractions in human blood plasma. Magn. Reson. Chem. 2002, 40, S83–S88. [Google Scholar] [CrossRef]
  19. Gromski, P.S.; Muhamadali, H.; Ellis, D.I.; Xu, Y.; Correa, E.; Turner, M.L.; Goodacre, R. A tutorial review: Metabolomics and partial least squares-discriminant analysis—A marriage of convenience or a shotgun wedding. Anal. Chim. Acta 2015, 879, 10–23. [Google Scholar] [CrossRef]
  20. Xia, J.; Broadhurst, D.I.; Wilson, M.; Wishart, D.S. Translational biomarker discovery in clinical metabolomics: An introductory tutorial. Metabolomics 2012, 9, 280–299. [Google Scholar] [CrossRef] [Green Version]
  21. Tamez-Pérez, H.E.; Quintanilla-Flores, D.L.; Rodríguez-Gutiérrez, R.; González-González, J.G.; Tamez-Peña, A.L. Steroid hyperglycemia: Prevalence, early detection and therapeutic recommendations: A narrative review. World J. Diabetes 2015, 6, 1073–1078. [Google Scholar] [CrossRef]
  22. Pasternak, J.J.; McGregor, D.G.; Lanier, W.L. Effect of Single-Dose Dexamethasone on Blood Glucose Concentration in Patients Undergoing Craniotomy. J. Neurosurg. Anesthesiol. 2004, 16, 122–125. [Google Scholar] [CrossRef]
  23. Rayman, G.; Lumb, A.N.; Kennon, B.; Cottrell, C.; Nagi, D.; Page, E.; Voigt, D.; Courtney, H.C.; Atkins, H.; Higgins, K.; et al. Dexamethasone therapy in COVID-19 patients: Implications and guidance for the management of blood glucose in people with and without diabetes. Diabet. Med. 2021, 38, e14378. [Google Scholar] [CrossRef] [PubMed]
  24. Brufsky, A. Hyperglycemia, hydroxychloroquine, and the COVID-19 pandemic. J. Med Virol. 2020, 92, 770–775. [Google Scholar] [CrossRef] [PubMed] [Green Version]
  25. Butkowski, E.G.; Jelinek, H.F. Hyperglycaemia, oxidative stress and inflammatory markers. Redox Rep. 2016, 22, 257–264. [Google Scholar] [CrossRef] [Green Version]
  26. Erener, S. Diabetes, infection risk and COVID-19. Mol. Metab. 2020, 39, 101044. [Google Scholar] [CrossRef]
  27. Puchalska, P.; Crawford, P.A. Multi-dimensional Roles of Ketone Bodies in Fuel Metabolism, Signaling, and Therapeutics. Cell Metab. 2017, 25, 262–284. [Google Scholar] [CrossRef] [Green Version]
  28. Fu, S.P.; Li, S.N.; Wang, J.F.; Li, Y.; Xie, S.S.; Xue, W.J.; Liu, H.M.; Huang, B.X.; Lv, Q.K.; Lei, L.C.; et al. BHBA suppresses LPS-induced inflammation in BV-2 cells by inhibiting NF-κB activation. Mediat. Inflamm. 2014, 2014, 983401. [Google Scholar] [CrossRef] [Green Version]
  29. Rahman, M.; Muhammad, S.; Khan, M.A.; Chen, H.; Ridder, D.A.; Muller-Fielitz, H.; Pokorna, B.; Vollbrandt, T.; Stolting, I.; Nadrowitz, R.; et al. The B-hydroxybutyrate receptor HCA2 activates a neuroprotective subset of macrophages. Nat. Commun. 2014, 5, 3944. [Google Scholar] [CrossRef] [PubMed]
  30. Youm, Y.; Nguyen, K.Y.; Grant, R.W.; Goldberg, E.L.; Bodogai, M.; Kim, D.; D’agostino, D.; Planavsky, N.; Lupfer, C.; Kanneganti, T.D.; et al. The ketone metabolite beta-hydroxybutyrate blocks NLRP3 inflammasome-mediated inflammatory disease. Nat. Med. 2015, 21, 263–269. [Google Scholar] [CrossRef] [Green Version]
  31. Shi, X.; Li, X.; Li, D.; Li, Y.; Song, Y.; Deng, Q.; Wang, J.; Zhang, Y.; Ding, H.; Yin, L.; et al. β-Hydroxybutyrate Activates the NF-κB Signaling Pathway to Promote the Expression of Pro-Inflammatory Factors in Calf Hepatocytes. Cell Physiol. Biochem. 2014, 33, 920–932. [Google Scholar] [CrossRef] [PubMed]
  32. Li, J.; Wang, X.; Chen, J.; Zuo, X.; Zhang, H.; Deng, A. COVID -19 infection may cause ketosis and ketoacidosis. Diabetes Obes. Metab. 2020, 22, 1935–1941. [Google Scholar] [CrossRef] [PubMed]
  33. Salminen, A.; Kauppinen, A.; Hiltunen, M.; Kaarniranta, K. Krebs cycle intermediates regulate DNA and histone methylation: Epigenetic impact on the aging process. Ageing Res. Rev. 2014, 16, 45–65. [Google Scholar] [CrossRef] [PubMed]
  34. Dierckx, T.; van Elslande, J.; Salmela, H.; Decru, B.; Wauters, E.; Gunst, J.; Van, H.Y.; Wauters, J.; Stessel, B.; Vermeersch, P.; et al. The metabolic fingerprint of COVID-19 severity. medRxiv 2020. [Google Scholar] [CrossRef]
  35. Zhenyukh, O.; Civantos, E.; Ruiz-Ortega, M.; Sánchez, M.S.; Vázquez, C.; Peiró, C.; Egido, J.; Mas, S. High concentration of branched-chain amino acids promotes oxidative stress, inflammation and migration of human peripheral blood mononuclear cells via mTORC1 activation. Free. Radic. Biol. Med. 2017, 104, 165–177. [Google Scholar] [CrossRef]
  36. HoleČek, M. Branched-chain amino acids in health and disease: Metabolism, alterations in blood plasma, and as supplements. Nutr. Metab. 2018, 15, 1–12. [Google Scholar] [CrossRef] [PubMed] [Green Version]
  37. Larsson, S.C.; Markus, H.S. Branched-chain amino acids and Alzheimer’s disease: A Mendelian randomisation analysis. Sci. Rep. 2017, 7, 13604. [Google Scholar] [CrossRef] [Green Version]
  38. Holeček, M. Why Are Branched-Chain Amino Acids Increased in Starvation and Diabetes? Nutrients 2020, 12, 3087. [Google Scholar] [CrossRef]
  39. Cruzat, V.; Rogero, M.M.; Keane, K.N.; Curi, R.; Newsholme, P. Glutamine: Metabolism and Immune Function, Supplementation and Clinical Translation. Nutrients 2018, 10, 1564. [Google Scholar] [CrossRef] [Green Version]
  40. Cengiz, M.; Uysal, B.B.; Ikitimur, H.; Ozcan, E.; Islamoğlu, M.S.; Aktepe, E.; Yavuzer, H.; Yavuzer, S. Effect of oral l-Glutamine supplementation on Covid-19 treatment. Clin. Nutr. Exp. 2020, 33, 24–31. [Google Scholar] [CrossRef]
  41. De Oliveira, D.C.; Lima, F.D.S.; Sartori, T.; Santos, A.C.A.; Rogero, M.M.; Fock, R.A. Glutamine metabolism and its effects on immune response: Molecular mechanism and gene expression. Nutrients 2016, 41, 14. [Google Scholar] [CrossRef] [Green Version]
  42. Shah, A.M.; Wang, Z.; Ma, J. Glutamine Metabolism and Its Role in Immunity, a Comprehensive Review. Animals 2020, 10, 326. [Google Scholar] [CrossRef] [PubMed] [Green Version]
  43. Abdelaal, M.A.; Abdelrahman, D.; Cengiz, M.; Yavuzer, H.; Yavuzer, S.; Bien, I.; Bhuva, P.; Pham, J.V.; Siu, R.; Tang, M.; et al. Actions of L-Glutamine vs. COVID-19 Suggest Additional Benefit in Sickle Cell Disease. Blood 2020, 136, 11–12. [Google Scholar] [CrossRef]
  44. Murr, C.; Grammer, T.B.; Meinitzer, A.; Kleber, M.E.; März, W.; Fuchs, D. Immune Activation and Inflammation in Patients with Cardiovascular Disease Are Associated with Higher Phenylalanine to Tyrosine Ratios: The Ludwigshafen Risk and Cardiovascular Health Study. J. Amino Acids 2014, 2014, 1–6. [Google Scholar] [CrossRef] [Green Version]
  45. Geisler, S.; Gostner, J.M.; Becker, K.; Ueberall, F.; Fuchs, D. Immune activation and inflammation increase the plasma phenylalanine-to-tyrosine ratio. Pteridines 2013, 24, 27–31. [Google Scholar] [CrossRef]
  46. Barberis, E.; Timo, S.; Amede, E.; Vanella, V.V.; Puricelli, C.; Cappellano, G.; Raineri, D.; Cittone, M.G.; Rizzi, E.; Pedrinelli, A.R.; et al. Large-Scale plasma analysis revealed new mechanisms and molecules associated with the host response to SARS-CoV-2. Int. J. Mol. Sci. 2020, 21, 8623. [Google Scholar] [CrossRef]
  47. Huang, C.; Huang, L.; Wang, Y.; Li, X.; Ren, L.; Gu, X.; Kang, L.; Guo, L.; Liu, M.; Zhou, X.; et al. 6-month consequences of COVID-19 in patients discharged from hospital: A cohort study. Lancet 2021, 397, 220–232. [Google Scholar] [CrossRef]
Figure 1. PCA (left) and PLD-DA analyses (right) of the system: patients in the hospital on Day 1 versus controls; algorithms were fed by the relative concentrations of plasma metabolites, and analyses were run in metaboanalyst [16].
Applsci 11 04231 g001
Figure 2. ROC curve with AUC values for systems of COVID-19 patients on Day 1 vs. controls, determined by random forest algorithm with relative concentrations of metabolites in blood plasma as input variables; analysis run in metaboanalyst [16].
Applsci 11 04231 g002
Figure 3. Relative concentrations of selected metabolites in blood plasma for patient Groups A and B on Day 1, Day 3, and Day 7. Values are relativised to the median of controls set to 1.
Applsci 11 04231 g003
Figure 4. Relative concentrations of selected metabolites related to immunity in blood plasma for patient Groups A and B on Day 1, Day 3, and Day 7. Values are relativised to the median of controls given a value of 1.
Applsci 11 04231 g004
Table 1. Characteristics of patients included in the study.
Parameter: Median (IQR)Group AGroup B
size3419
age, years 65 (21)71 (16)
gender15 female8 female
number of samples Day 13419
number of samples Day 33116
number of samples Day 72610
oxygen 3419
HFNO-7
NIV1 *2
smoker22
non smoker 2310
ex-smoker55
smoking not known42
chronic obstructive pulmonary disease24
obesity1111
hypertension2213
asthma2-
kidney disease44
ischemic heart disease99
diabetes147
cancer12
cancer history13
thyroid disease31
liver cirrhosis-1
rheumatoid arthritis13
stroke history11
acute stroke1-
sarcodiosis1-
* Patient with chronic hypoxemic–hypercapnic respiratory failure due to COPD on home NIV (non-invasive ventilation) with LTOT (long-term oxygen therapy).
Table 2. Chemical shifts (in ppm), J couplings (in Hz), and multiplicities (s, singlet; d, doublet; t, triplet; q, quartet; m, multiplet; dd, doublet of doublets; dq, doublet of quartets) for the pool of metabolites identified in blood plasma. Signals marked with # were not suitable for quantitative analyses.
MetaboliteNMR Peak Assignment, Confirmed by Jres and Cosy
lactate1.33 (d; J = 7.0), 4.12 (q; J = 7.0)
glutamine2.12 (m), 2.15 (m), 2.44 (m), 2.48 (m), 3.77 (dd)
isoleucine0.94 (t; J = 7.5), 1.01 (d; J = 7.0), 3.68 (d; J = 4.2)
leucine0.96 (d; J = 6.2), 0.97 (d; J = 6.1), 1.68 (m), 1.72 (m), 1.75(m)
phenylalanine3.13 (m), 3.28 (m), 7.34 (d; J = 7.5), 7.38 (t; J = 7.4), 7.44 (t)
tyrosine3.05 (dd), 3.20 (dd), 3.93 (dd), 6.91 (d; J = 8.5), 7.20 (d; J = 8.5)
valine0.99 (d; J = 7.1), 1.04 (d; J = 7.1), 2.27 (m), 3.61 (d; J = 4.4)
pyruvate2.38 (s)
citrate2.54 (d), 2.67 (d)
acetate1.92 (s)
alanine1.48 (d; J = 7.30), 3.78 (q)
glucose3.23 (m), 3.40 (m), 3.46 (m), 3.52 (dd), 3.78 (m), 3.82 (m), 3.89 (dd), 4.64 (d), 5.23 (d)
3-hydroxybutyrate1.20 (d; J = 6.23 Hz), 2.31 (m), 2.41 (m), 4.16 (m)
creatine3.04 (s), 3.94 (s)
lysine1.33 (d), 3.58 (d; J = 4.9), 4.25 (m)
2-oxoisocapronate (2-ketoleucine)0.94 (d; J = 6.6), 2.11 (m), 2.61 (d; J = 7.0)
α-ketoisovalerate (2-ketovaline)1.11 (d; J = 7.1), 3.01(dq)
3-methyl-2-oxo-valerate (2-ketoisoleucine)0.90 (t; J = 7.5), 1.10 (d; J = 6.7)
lipoprotein fraction0.82–0.93 (m), 1.20–1.37 (m)
# creatinine3.05 (s), 4.07 (s)
# histidine7.07 (s), 7.80 (s)
# proline1.46 (m), 1.50 (m), 1.73 (m), 1.89 (m), 1.93 (m), 3.03 (t; J = 7.6)
# threonine1.34 (d), 3.56 (d;J = 4.9),4.26 (m)
# tryptophan7.21 (t), 7.30 (t), 7.33 (s), 7.56 (d), 7.74 (d; J = 8.0)
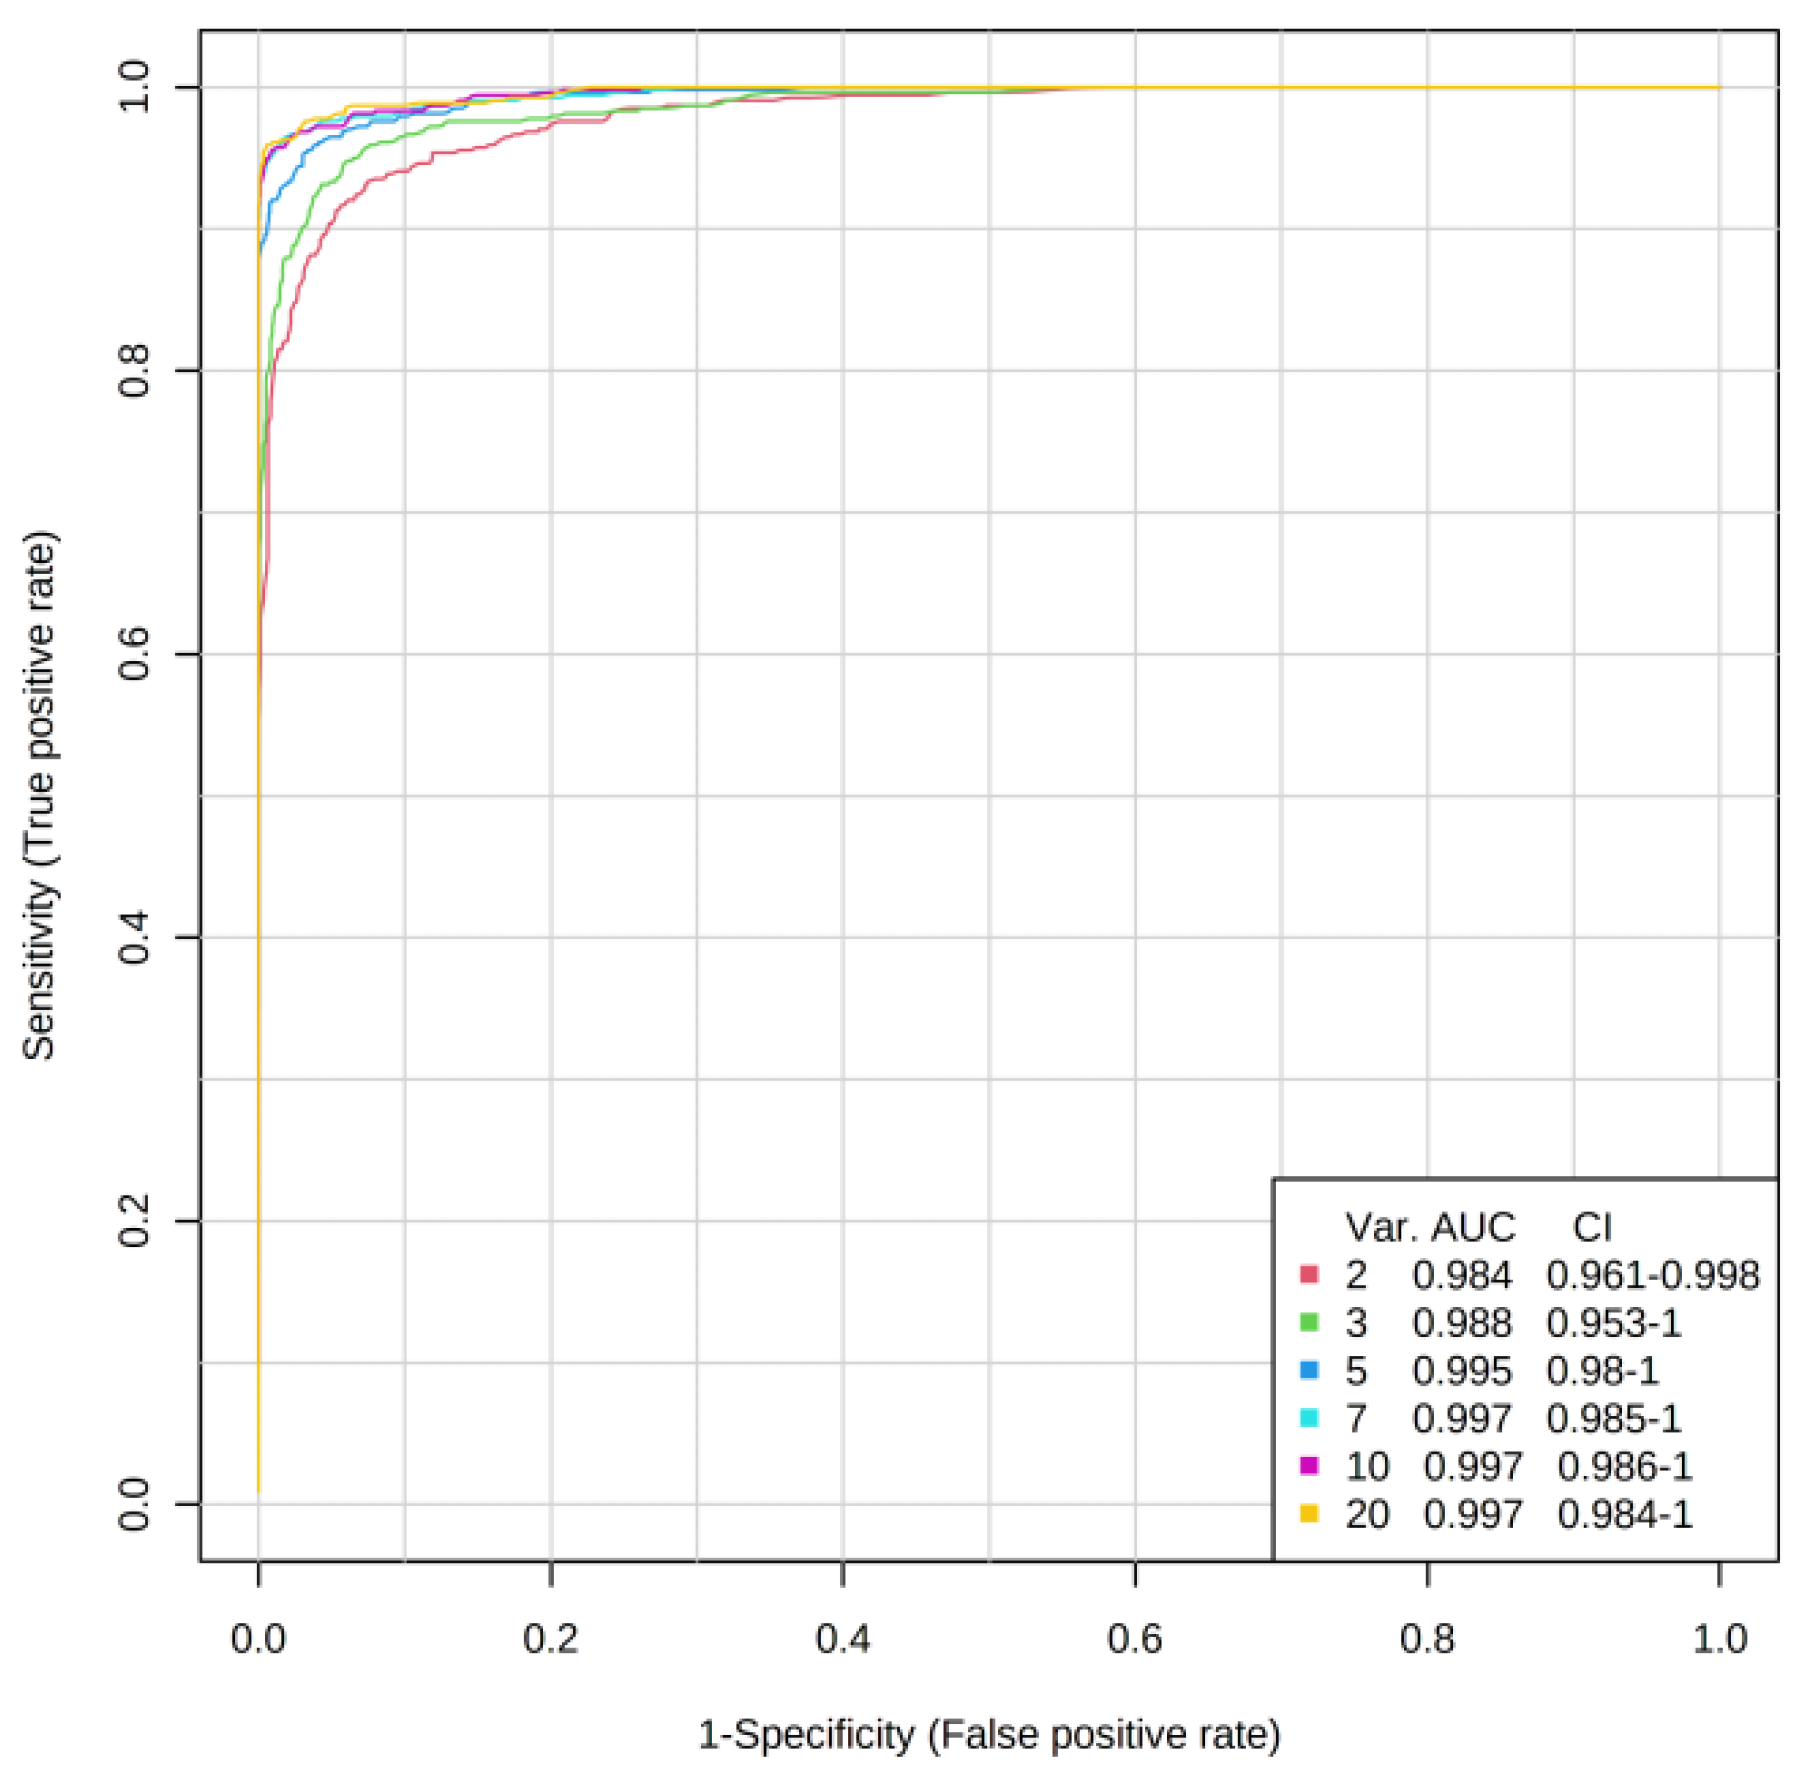
Table 3. Outputs from random forest discriminatory analyses for selected systems.
SystemOOB Error (5 Variables)AUCNumber of Variables Metabolites in Importance Order
All Patients Day 1/Controls 3/1080.984
0.995
2
5
3-hydroxybutyrate, phenylalanine, Phe/Tyr ratio, acetate, glucose
Group A Day 1/Controls1/890.977
0.996
2
5
3-hydroxybutyrate, phenylalanine, glucose, Phe/Tyr ratio, acetate,
Group B Day 1/Controls 1/740.972
0.991
2
5
phenylalanine, 3-hydroxybutyrate, Phe/Tyr ratio, acetate, glutamine or glucose
Group A/Group B Day1-0.568
0.674
2
5
AUC value too low
Group A/Group B Day 3-0.754
0.783
2
5
alanine, lysine, glutamine, Phe/Tyr ratio, phenylalanine
Group A/Group B Day 7-0.487
0.503
2
5
AUC value too low
Table 4. Results from statistical tests; p-value derived from nonparametric ANOVA and Mann–Whitney U-test.
MetaboliteNonparametric ANOVA
(Kruskal–Wallis)
Mann–Whitney U-test,
Only Significant Changes (p < 0.05) are Listed,
Arrows Indicate the Direction of Change
chi.
Squared
p-ValueFDR p-Value AdjustedGroup A Against ControlsGroup B Against ControlsGroup A Against GroupB
glucose803.9 × 10−151.4 × 10⁻¹⁴Day1↑, Day3↑Day1↑, Day3↑, Day7↑
3-OH-butyrate1301.1 × 10−241.2 × 10⁻²³Day1↑, Day3↑, Day7↑Day1↑, Day3↑, Day7↑Day7, A < B
citrate771.2 × 10−143.2 × 10⁻¹⁴Day1↓, Day3↓, Day7↓Day1↓, Day3↓, Day7↓
leucine397.6 × 10−71.5 × 10⁻⁶Day1↑, Day3↑, Day7↑Day1↑, Day3↑, Day7↑
isoleucine312.8 × 10−54.9 × 10⁻⁵Day1↑, Day3↑, Day7↑Day1↑, Day3↑, Day7↑
valine130.0400.047Day1↑, Day3↑, Day7↑Day1↑, Day3↑, Day7↑
ketoleucine253.7 × 10−45.5 × 10⁻⁴Day1↑, Day3↓, Day7↓ Day1, A > B
ketoisoleucine190.00420.0059Day1↑, Day3↓, Day7↓
ketovaline170.00940.012Day1↑, Day3↓, Day7↓ Day1, A > B
creatine648.5 × 10−122.0 × 10⁻¹¹Day3↑, Day7↑Day3↑, Day7↑
alanine498.5 × 10−91.8 × 10⁻⁸Day1↓Day1↓, Day3↓, Day7↓Day3, Day7, A > B
glutamine296.1 × 10−59.8 × 10⁻⁵Day1↓Day1↓,Day3↓
phenylalanine1201.2 × 10−238.5 × 10⁻²³Day1↑, Day3↑, Day7↑Day1↑, Day3↑, Day7↑
Phe/Tyr ratio853.3 × 10−161.4 × 10⁻¹⁵Day1↑, Day3↑, Day7↑Day1↑, Day3↑, Day7↑Day1, A < B
lipoproteins1507.8 × 10−311.6 × 10⁻²⁹Day1↓, Day3↓, Day7↓Day1↓, Day3↓, Day7↓
acetate100.2.1 × 10−191.1 × 10⁻¹⁸Day1↓, Day3↓, Day7↓Day1↓, Day3↓, Day7↓
lysine796.6 × 10−152.0 × 10⁻¹⁴Day1↑, Day3↑, Day7↑Day7↑
Publisher’s Note: MDPI stays neutral with regard to jurisdictional claims in published maps and institutional affiliations.

