Article

Fundamental Frequency Suppression for the Detection of Broken Bar in Induction Motors at Low Slip and Frequency †

by
Daivd A. Elvira-Ortiz
1,
Daniel Morinigo-Sotelo
2,*,
Angel L. Zorita-Lamadrid
2,
Roque A. Osornio-Rios
1 and
Rene de J. Romero-Troncoso
1
1
HSPdigital–CA Mecatronica, Facultad de Ingenieria, Universidad Autonoma de Queretaro, Campus San Juan del Rio, Rio Moctezuma 249, Col. San Cayetano, C. P., San Juan del Rio 76807, Mexico
2
HSPdigital–Research Group ADIRE, ITAP, University of Valladolid, UVa., Paseo del Cauce, 59, 47011 Valladolid, Spain
*
Author to whom correspondence should be addressed.
This paper is an extended version of paper published in the 2019 IEEE 12th International Symposium on Diagnostics for Electrical Machines, Power Electronics and Drives (SDEMPED) held in Toulouse, France, 27–30 August 2019.
Appl. Sci. 2020, 10(12), 4160; https://doi.org/10.3390/app10124160
Submission received: 31 May 2020 / Revised: 13 June 2020 / Accepted: 15 June 2020 / Published: 17 June 2020
(This article belongs to the Special Issue Modeling, Design and Control of Electric Machines)

Abstract

:
Broken rotor bar (BRB) is one of the most common failures in induction motors (IMs) these days; however, its identification is complicated since the frequencies associated with the fault condition appear near the fundamental frequency component (FFC). This situation gets worse when the IM slip or the operation frequency is low. In these circumstances, the common techniques for condition monitoring may experience troubles in the identification of a faulty condition. By suppressing the FFC, the fault detection is enhanced, allowing the identification of BRB even at low slip conditions. The main contribution of this work consists of the development of a preprocessing technique that estimates the FFC from an optimization point of view. This way, it is possible to remove a single frequency component instead of removing a complete frequency band from the current signals of an IM. Experimentation is performed on an IM operating at two different frequencies and at three different load levels. The proposed methodology is compared with two different approaches and the results show that the use of the proposed methodology allows to enhance the performance delivered by the common methodologies for the detection of BRB in steady state.

1. Introduction

Among all the electric machines used in industrial facilities, induction motors (IMs) are the most widely spread since their ability to transform electrical energy into mechanical energy make them essential for many industrial processes [1]. Additionally, their reliability and robustness results in a low cost and effort related with their maintenance [2,3]. The IM robustness can be both: a strength and a weakness. It is a strength because the motor is able of continue operating even when it presents a fault condition at the cost of reducing its efficiency [4]; notwithstanding, it can be harmful because a motor working in fault conditions directly affects the power quality and reliability of the entire power system [5], resulting in economic losses and malfunctioning of equipment connected to the same grid. Hence, resulting condition monitoring techniques are helpful for preventing unexpected stops in production processes that may result in losses [6]. In this sense, there are several methodologies that use different physical variables such as current, vibrations, and stray flux to determine the condition of the IM.
A well-studied faulty condition is the broken rotor bar (BRB); this condition represents around 15% of the faults presented in the IM [7]. When the BRB condition is presented in the IM, two spectral components appear in the neighborhoods of the fundamental frequency component (FFC) [8]. However, identifying these components is challenging because the energy of the FFC is high compared with the rest of spectral components. The identification is even harder when the IM is powered through a variable frequency drive (VFD) at a low frequency, because the lower the operation frequency is, the closer the failure harmonics get [9]. A similar situation is presented when the IM operates with low load where the sideband harmonics are very close to the FFC, making their detection more difficult [10]. Several techniques have been developed for the BRB detection in IMs, with the motor current signature analysis (MCSA) being the most common one [11,12,13]. The MCSA technique uses the fast Fourier transform (FFT) to obtain the spectra from the motor current signals and obtain the amplitude of the fault harmonics. Even though this technique has been used for many years, there are some issues related with their performance, for instance, large amounts of data are required to obtain a proper resolution and, if the FFC is not an integer multiple of the resolution, the resulting leakage can hide the sideband frequencies associated with the BRB condition. In order to deal with these issues, some works have proposed the use of different signal processing techniques like wavelet transform [14,15], non-uniform time resampling [16], multiple signal classification (MUSIC) [7,17], among others. Moreover, some other authors propose the analysis of variables different from the current such as sound [18] or vibration [19]. Even though the aforementioned methodologies deal with some of the issues related with the standard MCSA, they present some disadvantages, for instance, wavelet transform suffers from mode mixing and its analysis requires the experience of an expert; MUSIC demands a high computational effort and does not deliver accurate information regarding the fault severity. Additionally, these techniques are commonly used for the analysis of IM operating at a high load, and the case of motors operating at low load is ignored.
As aforementioned, when the motor operates at low frequency and the slip detection of a fault condition becomes harder, the failure harmonics become closer to the FFC and the spectral leakage hides them. To deal with this situation, there are works that propose the use of sliding windows to overcome the problems related with the spectral leakage that introduces the Fourier transform [20]. This work considers that the amplitude of the FFC fluctuates due to the existence of sidebands frequencies, and with the use of different windows, it is possible to appreciate these variations and relate them to the fault conditions. Notwithstanding, the results are highly dependent on the selected window, therefore, certain experience is required in the response of different windows. Moreover, the math behind the implementation is more complex than the one proposed by other methodologies. Another well-studied alternative is the use of the magnetic flux instead of the current signals [21,22,23]. These works consider that when a fault appears in the IM, a magnetic unbalance can be appreciated, and a portion of the magnetic flux is radiated outside the frame of the machine. However, the measured signal is very weak and can be affected by the surrounding noise in an easy way, compromising the accuracy of the results. On the other hand, the Hilbert transform is an effective tool that allows computing the instantaneous frequency of the current signal [24,25]. Notwithstanding, since the major problem in the detection of BRB is that the energy of the FFC is so high compared with the rest of spectral components, a more common solution is the use of techniques for suppressing the FFC from the current signals. Herein, the most explored technique is the use of notch filters (NFs) for attenuating a very reduced frequency bandwidth [26,27,28,29]. These works use the NF as a pre-processing stage in order to enhance the results delivered by the common methodologies. The problem with the use of NFs is that they suppress a complete frequency band instead of only removing a single frequency; therefore, if the frequency band is not narrow enough, the failure harmonics may be attenuated too. In this sense, developing a technique that is able to suppress a single frequency instead of a frequency band may improve the results in the detection of faulty conditions in the IM as BRB. Therefore, in [30], the use of the Teager–Kaiser energy operator is proposed for eliminating the FFC and obtaining the fault harmonics right at their characteristic frequencies, instead of bands around the FFC. However, the case when the IM operates at 50 and 60 Hz is only studied, and it is necessary to show what happens when the motor works at lower frequencies. Finally, it is important to mention that artificial intelligence techniques have been recently used as tools for condition monitoring of IM, with genetic algorithms (GAs), artificial neural networks (ANNs), and fuzzy logic being some of the reported techniques [3,31,32,33]. The use of artificial intelligence techniques allows to perform an automatic detection of any fault condition in the IM; however, they require a training process and large amounts of data to properly work. The amount of data and the training process could be reduced if a GA is used as a pre-processing stage that works, along with the conventional MCSA technique. A study like this is presented in [34], where a GA is used for suppressing the FFC in order to improve the detection of the broken bar condition in induction motors. However, the reported results consider only one operation frequency for the IM and no comparison with other methodologies is performed. In order to demonstrate that the results are reliable and that a significant improvement against other techniques is reached, it is necessary to carry out tests under different conditions and perform a fair comparison with other methodologies.
This work proposes a technique that allows the estimation of a single frequency, amplitude, and phase to define the FFC. The novelty of this work consists on the development of a preprocessing technique that estimates the parameters of the FFC as an optimization problem. Therefore, a GA is used for this task, allowing to deal with some of the issues related with other methodologies. For instance, the proposed methodology suppresses a single frequency component instead of removing a whole frequency band as the NF does. The proposed methodology is intended to work along with the MCSA for the detection of the BRB condition in the IM operating at steady state. A comparison is performed with the conventional MCSA without removing the FFC, and with a methodology that uses a NF to suppress the FFC before analyzing the current signature. The study is performed in an IM powered by a variable frequency drive (VFD) at 31 and 20 Hz. For every one of these two frequencies, three different levels of slip are used for testing the proposed methodology. Results prove that the use of this technique improves the results in comparison with the conventional MCSA or with the use of a NF, allowing to perform a better identification of the BRB condition in an IM when it operates at steady state. Finally, results show that the values reported by the MCSA technique concerning the amplitude of the side harmonics may be erroneous, generating behaviors different from those that describe the fault severity.

2. Theoretical Background

2.1. BRB Detection

When a rotor bar is broken or partially cracked, it cannot carry any current; hence, BRB is a condition that produces a geometric and magnetic unbalance on the IM [9]. Therefore, current components are induced in the stator and they appear as sidebands of the FFC in the current spectrum [25]. Depending on which side of the FFC they appear, these harmonics are called the left side harmonic (LSH), and the right side harmonic (RSH), and they can be calculated using (1) and (2) respectively:
f L S H = 1 2 s f F C ,
f R S H = 1 + 2 s f F C ,
where f L S H is the frequency of the LSH, f R S H is the frequency of the RSH, s is the IM slip, and f F C is the frequency of the fundamental component.

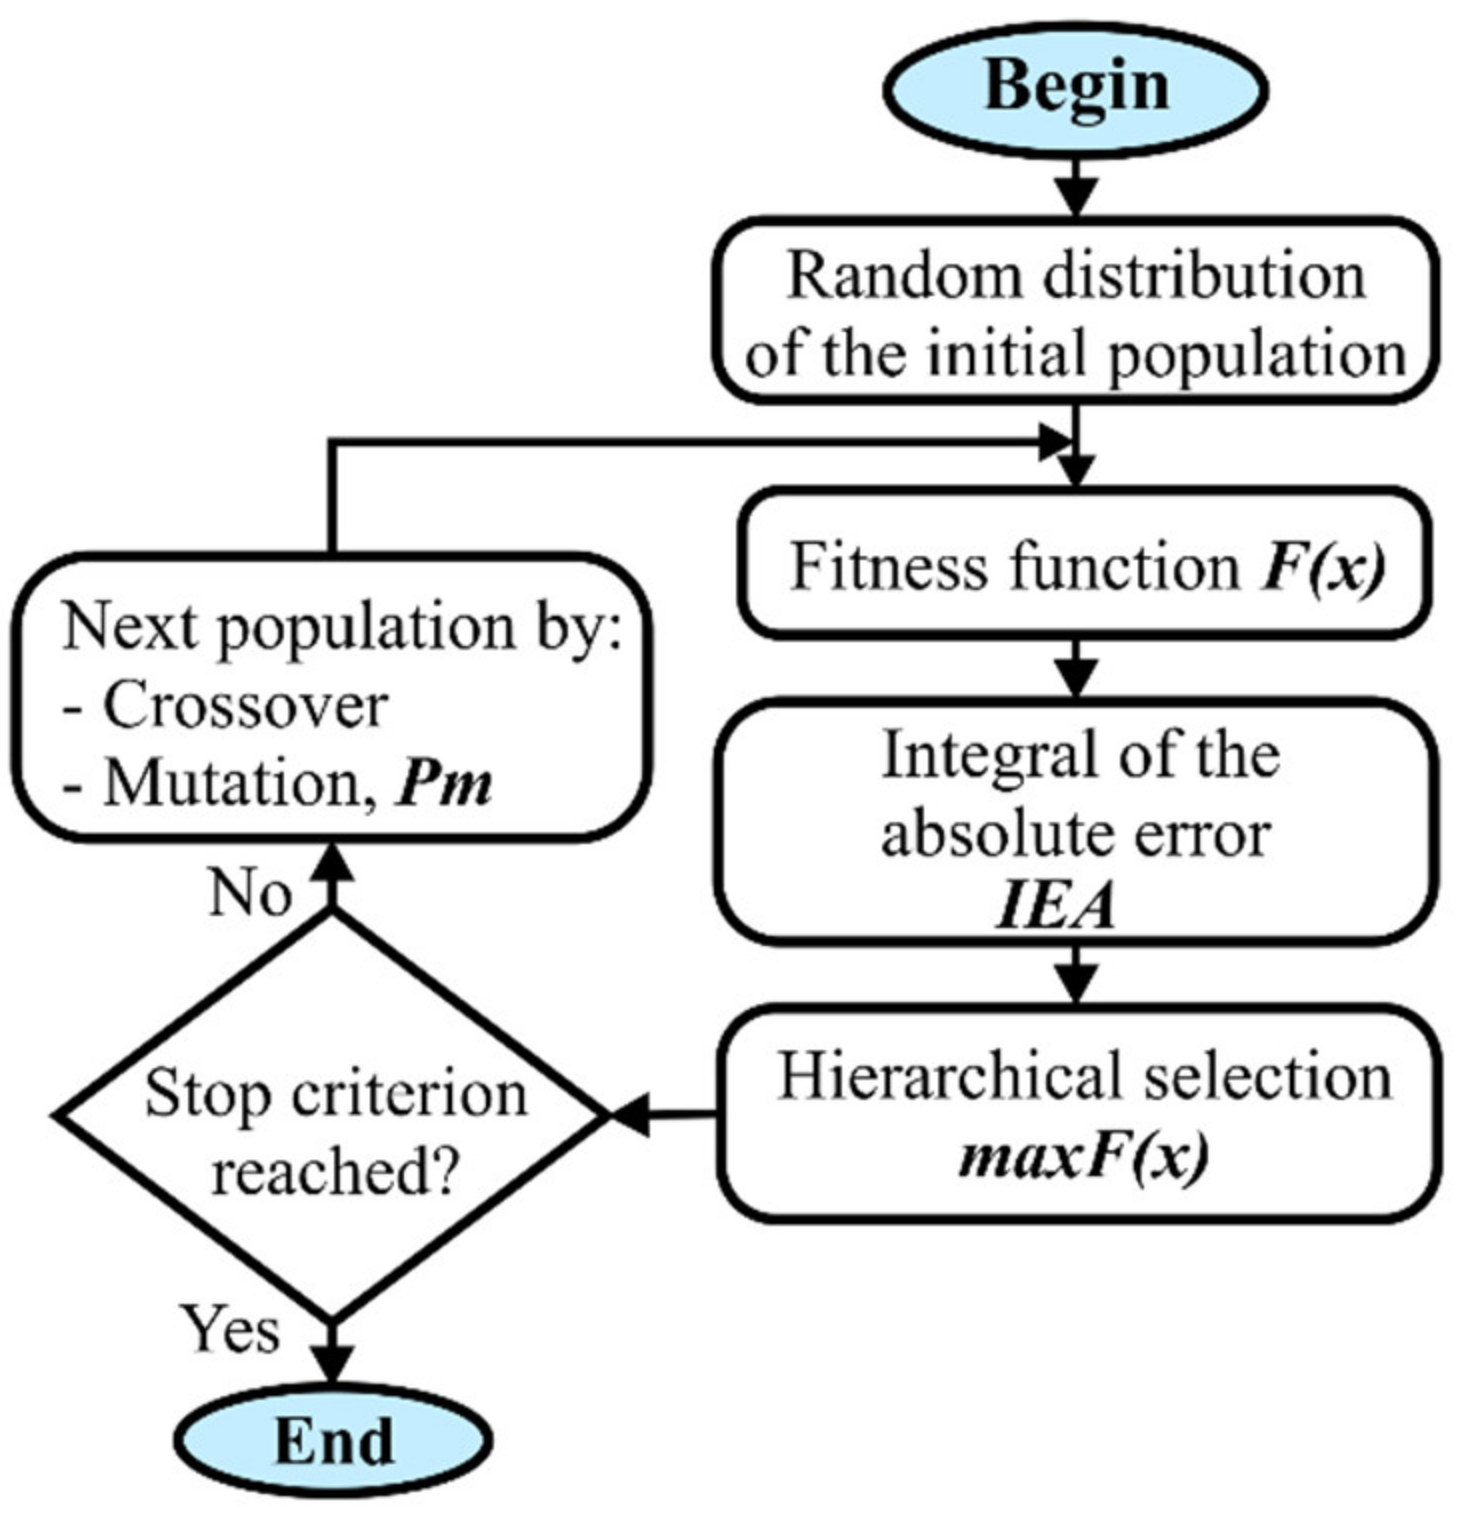
2.2. Genetic Algorithm
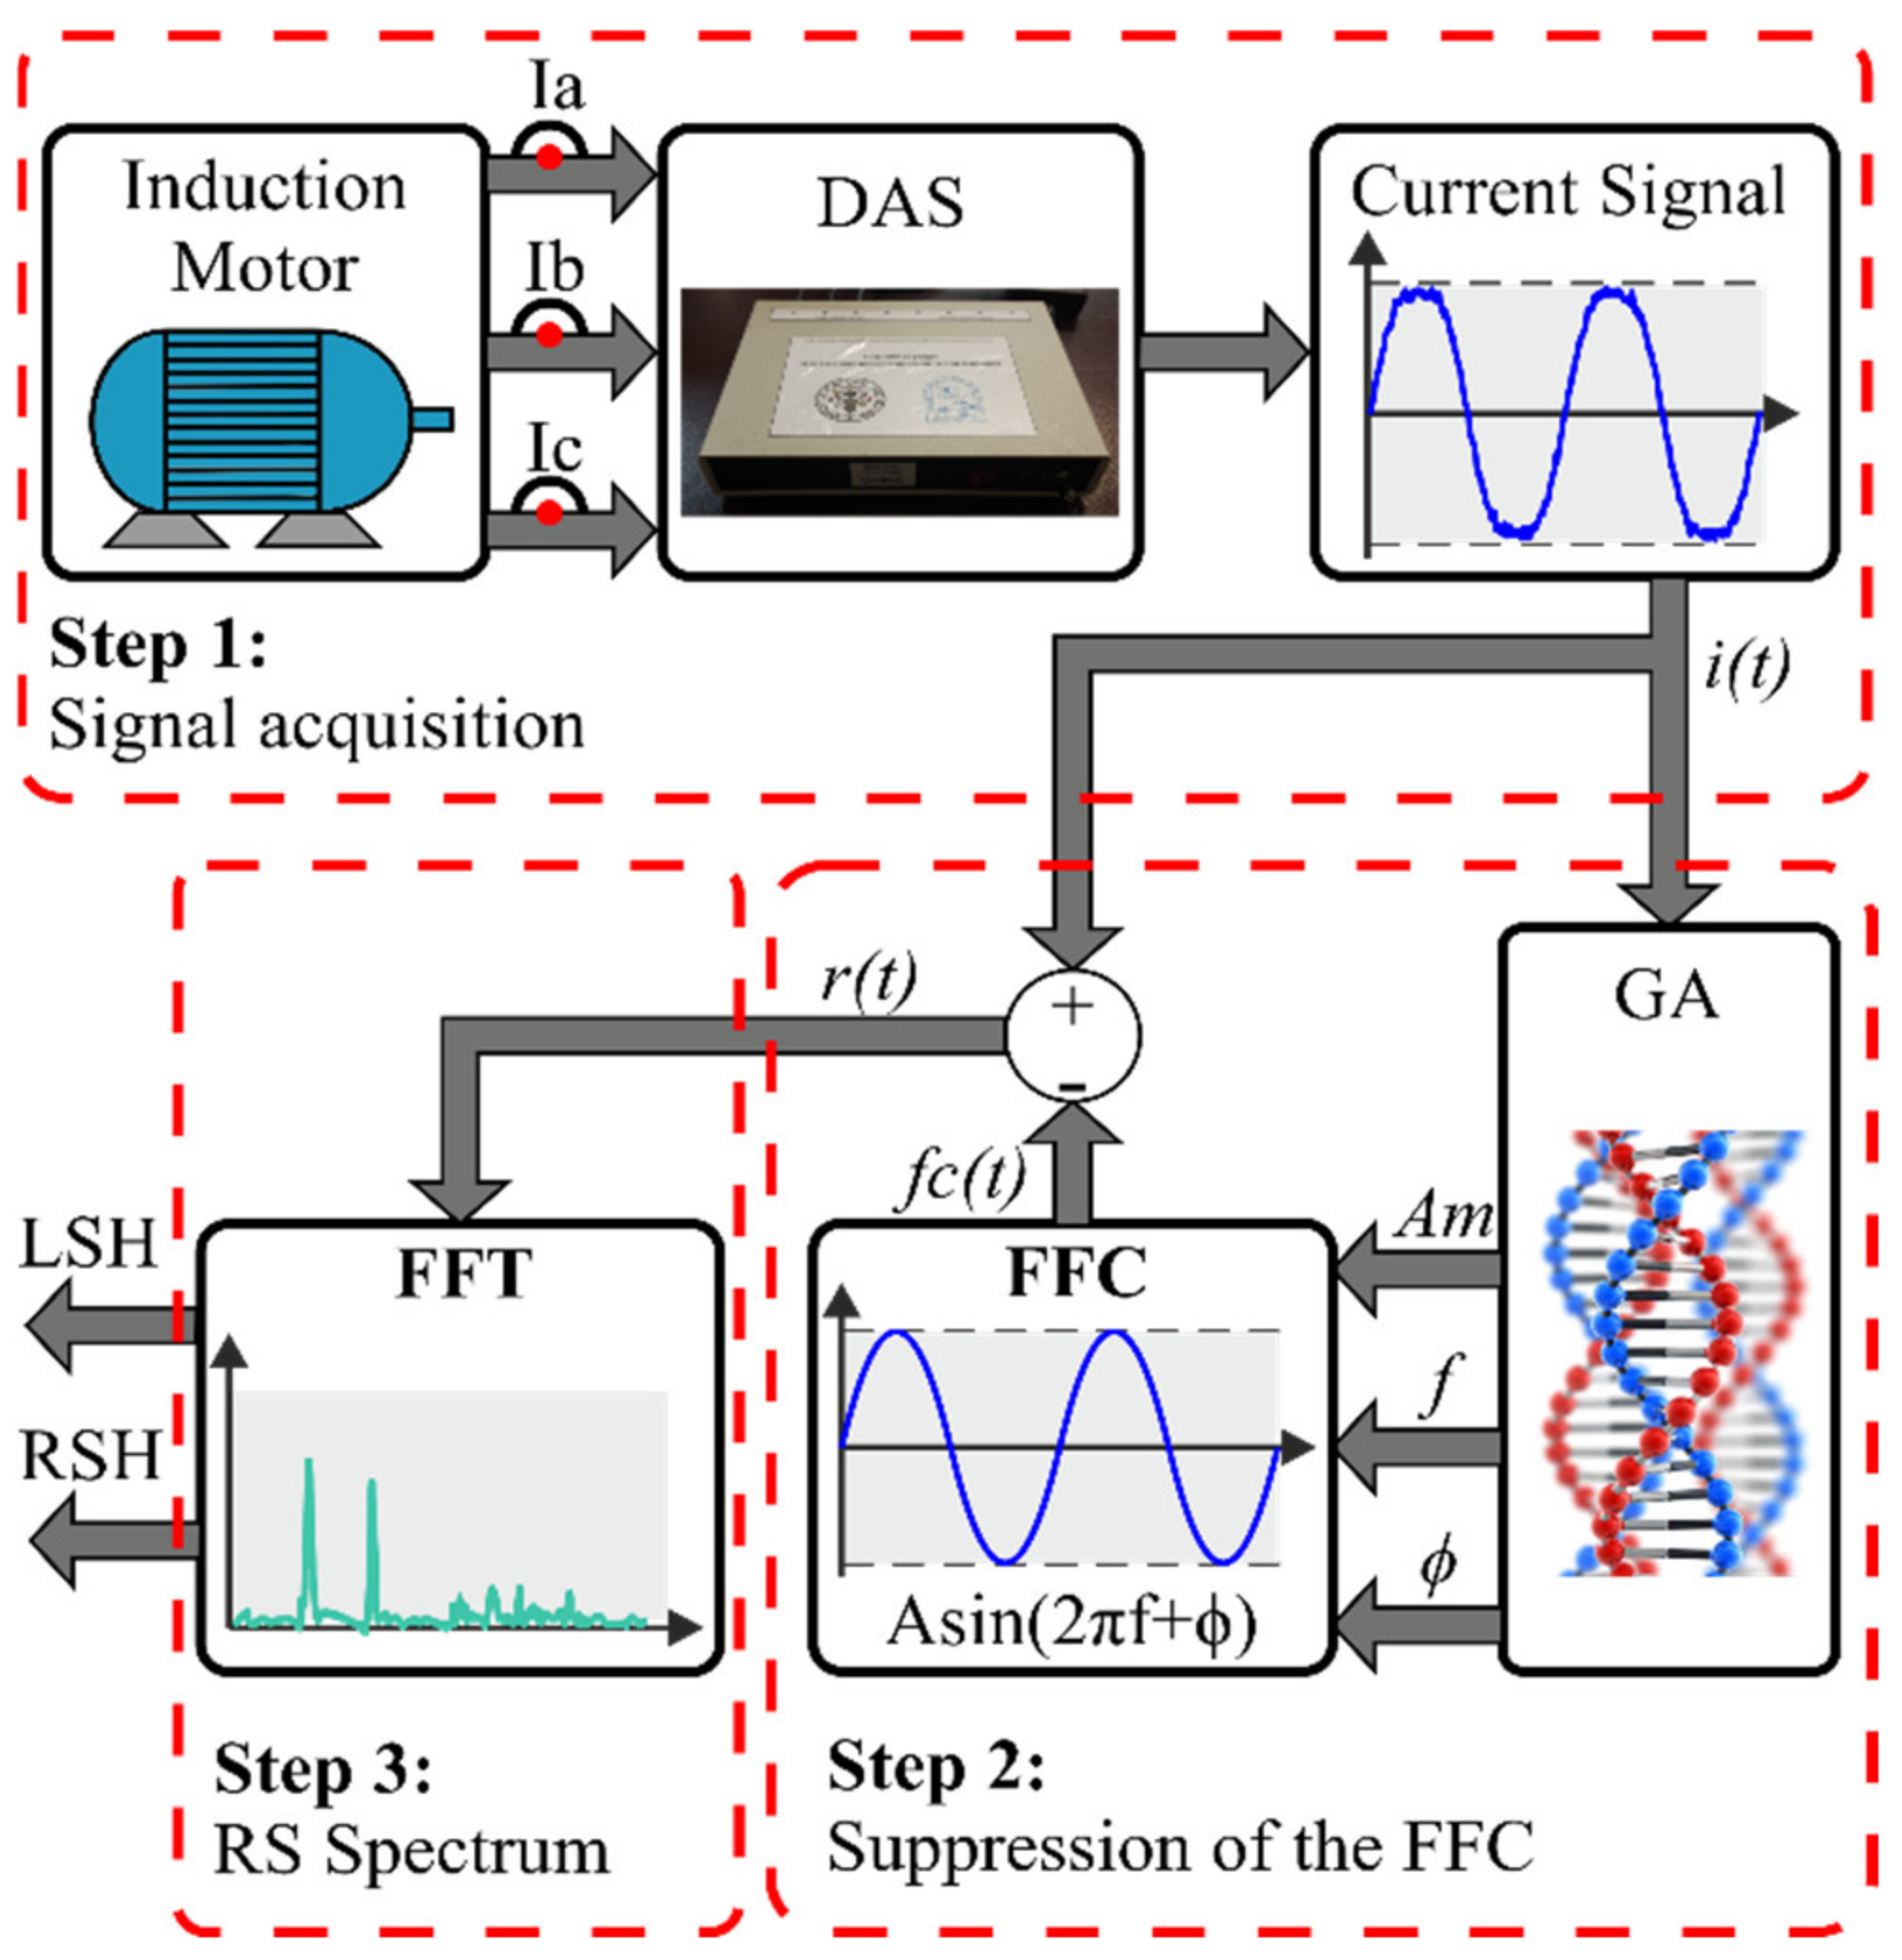
Many artificial intelligence techniques try to imitate the behavior of a biological system. These types of techniques are known as bio-inspired techniques and the GA falls into this classification since it tries to emulate the principles of natural evolution [35]. Figure 1 presents the flow chart for the computation of the GA. The first step consists of randomly generating the initial population. In this step, it is necessary to define proper boundaries to ensure that the individuals of the population remain within an acceptable range. Next, a fitness evaluation is performed. At this point, the performance of every individual has to be assessed. This task is carried out using a maximum value of a fitness function, m a x F x , whose value depends on the evaluation of several performance criteria considered in an objective function, J x . The integral of the absolute error (IAE) is one of the most common performance criteria applied on the GA and is based on a signal error, ε t , as specified by (3) and (4):
m a x F x = 1 / J x ,
I A E = 0 ε t = J x .
After evaluating every individual, a criterion that allows performing a hierarchical selection must be set. The purpose of the selection consists of classifying the individuals by function of their fitness value to select those individuals with the best attributes. GA is an iterative process, thus, it is necessary to define a stop condition that determines when the process must be finished. If the stop condition is not reached, a new population is generated through the crossover and mutation operations, and the process is repeated from the fitness evaluation. The best individual of the old population goes directly to the new population; the rest of the individuals are obtained by applying the crossover and the mutation operations between the best individual and the other individuals of the old population. Finally, the mutation operation consists of a random replacement of certain individuals in the population according to a mutation probability, P m .

3. Methodology

In this section, the GA-based methodology for suppressing the FFC from the current signals of the IM is described. The proposed methodology can estimate the amplitude, frequency, and phase shift that describe the FFC in order to suppress it, or at least highly reduce it. By attenuating the energy of the FFC, it is possible to better appreciate the failure harmonics because they are not overshadowed nor hidden by spectral leakage. In Figure 2, a diagram of the proposed methodology is observed. The methodology was performed through three steps: signal acquisition, suppression of the FFC, and residual signal (RS) spectrum. In the first step, the current signals of the IM operating at steady state were acquired using a proprietary data acquisition system (DAS). The current signals for the three phases, I a ,   I b , and I c , of the IM were simultaneously acquired; however, they were processed one at a time. In the second step, the current signal i t was sent to the GA in order to estimate the amplitude (Am), frequency (f), and phase (Φ) that better described the FFC. Since the methodology was designed for working with the motor signals at steady state, the first seconds of the current signal containing the transient were not taken into account. Thus, in order to perform the parameter estimation, a population of 30 individuals was considered in the implementation of the GA. Every individual was composed by the union of three different genes: the first represented the amplitude (Am), the second the frequency (f), and the third one the phase (Φ). To ensure that the individuals fell within an acceptable range, the next boundaries were set for the genes: 0 to 3 for the amplitude considering that peak current in steady state always remain in this range; 19 to 32 for the frequency since the two operating frequencies used in this work (20 and 31 Hz) were between these two values; and -π to π for the phase. The objective function is a pure sinusoidal wave; therefore, each individual was assessed using (5):
f c t = A m × sin 2 π f t + Φ .
After assessing the individuals, it was necessary to organize them by applying (3) and (4). This sorting was performed with the aim of obtaining the best member of the current population ( G 1 ), which is the one with the highest fitness value. This individual must be conserved in the next generation. The missing individuals in the new population needed to be generated using the crossover operation. To simplify the calculation of this operation, in this particular work, the crossover was reduced to an average value as shown in (6):
G n i = ( G 1 + G c i ) / 2 ,
where i = 2, …, 30; G c i is the i-th individual of the current population; and G n i is the i-th individual of the next population. To add diversity in the population and to avoid local maxima stagnation, a mutation probability P m = 0.2 was introduced in order to randomly exchange some individuals. These operations were performed a total of 300 times because it was experimentally demonstrated that this number of iterations was enough to ensure the convergence of the GA every time. The genes Am, f, and Φ from the best individual in the last iteration were considered as the parameters of the FFC. These parameters were substituted in (5) and the resulting signal f c t was considered as the FFC. The f c t signal was subtracted from the current signal i t and the result was called the RS. This signal contained all the harmonics and interharmonics from the original signal. It must be mentioned that the methodology cannot completely remove the FFC, a small amount of its energy may be preserved in the RS. Notwithstanding, the remaining energy was much lower than in the original signal because it had been attenuated by the GA-suppression technique. This situation achieves that the energy of the FFC no longer obstructed the visibility of other spectral components. In the last step, the FFT of the RS was computed to perform its analysis. Since the FFC no longer obstructed the failure harmonics, it was possible to carry out a more reliable analysis of the amplitude of the LSH and the RSH. A total of 30 different tests were performed: fifteen with IM operating at 31 Hz, and another fifteen for an operating frequency of 20 Hz. These tests were carried out considering three different load levels that resulted in three different slips: 2% (low load), 4% (medium load), and 6% (high load).
It is important to recall that the methodology described in this section was designed to work with steady state signals. However, there exist some industry applications where the IM operates at a variable speed and load rate. To deal with those scenarios, the proposed methodology should be modified to perform an adaptive estimation of the FFC parameters. Although this modification may be simple, the transient analysis is a topic that may provide material for a complete work in itself; therefore, such analysis is left for further development.

4. Experimental Setup

The experiments developed to test the proposed methodology were carried out with a 0.75 kW IM from Siemens. To vary the load conditions, a 1.1 kW electromagnetic break was used. Additionally, the motor was not directly connected to the power supply, and it was fed through a VFD CFW 11 from WEG instead.
To perform the data acquisition and collection, a proprietary FPGA-based DAS was used. This device was set to acquire the data from the three current signals of the IM simultaneously. The data acquisition process was made considering a sampling frequency of 8 kHz with a 16-bit resolution. All the data were stored using 128 GB standard micro SD card. Finally, to measure the currents in the IM, the YHDC SCT-013-010 current clamps were used. These current clamps can measure currents up to 10 A with a 100 mV per ampere resolution.

5. Results and Discussion

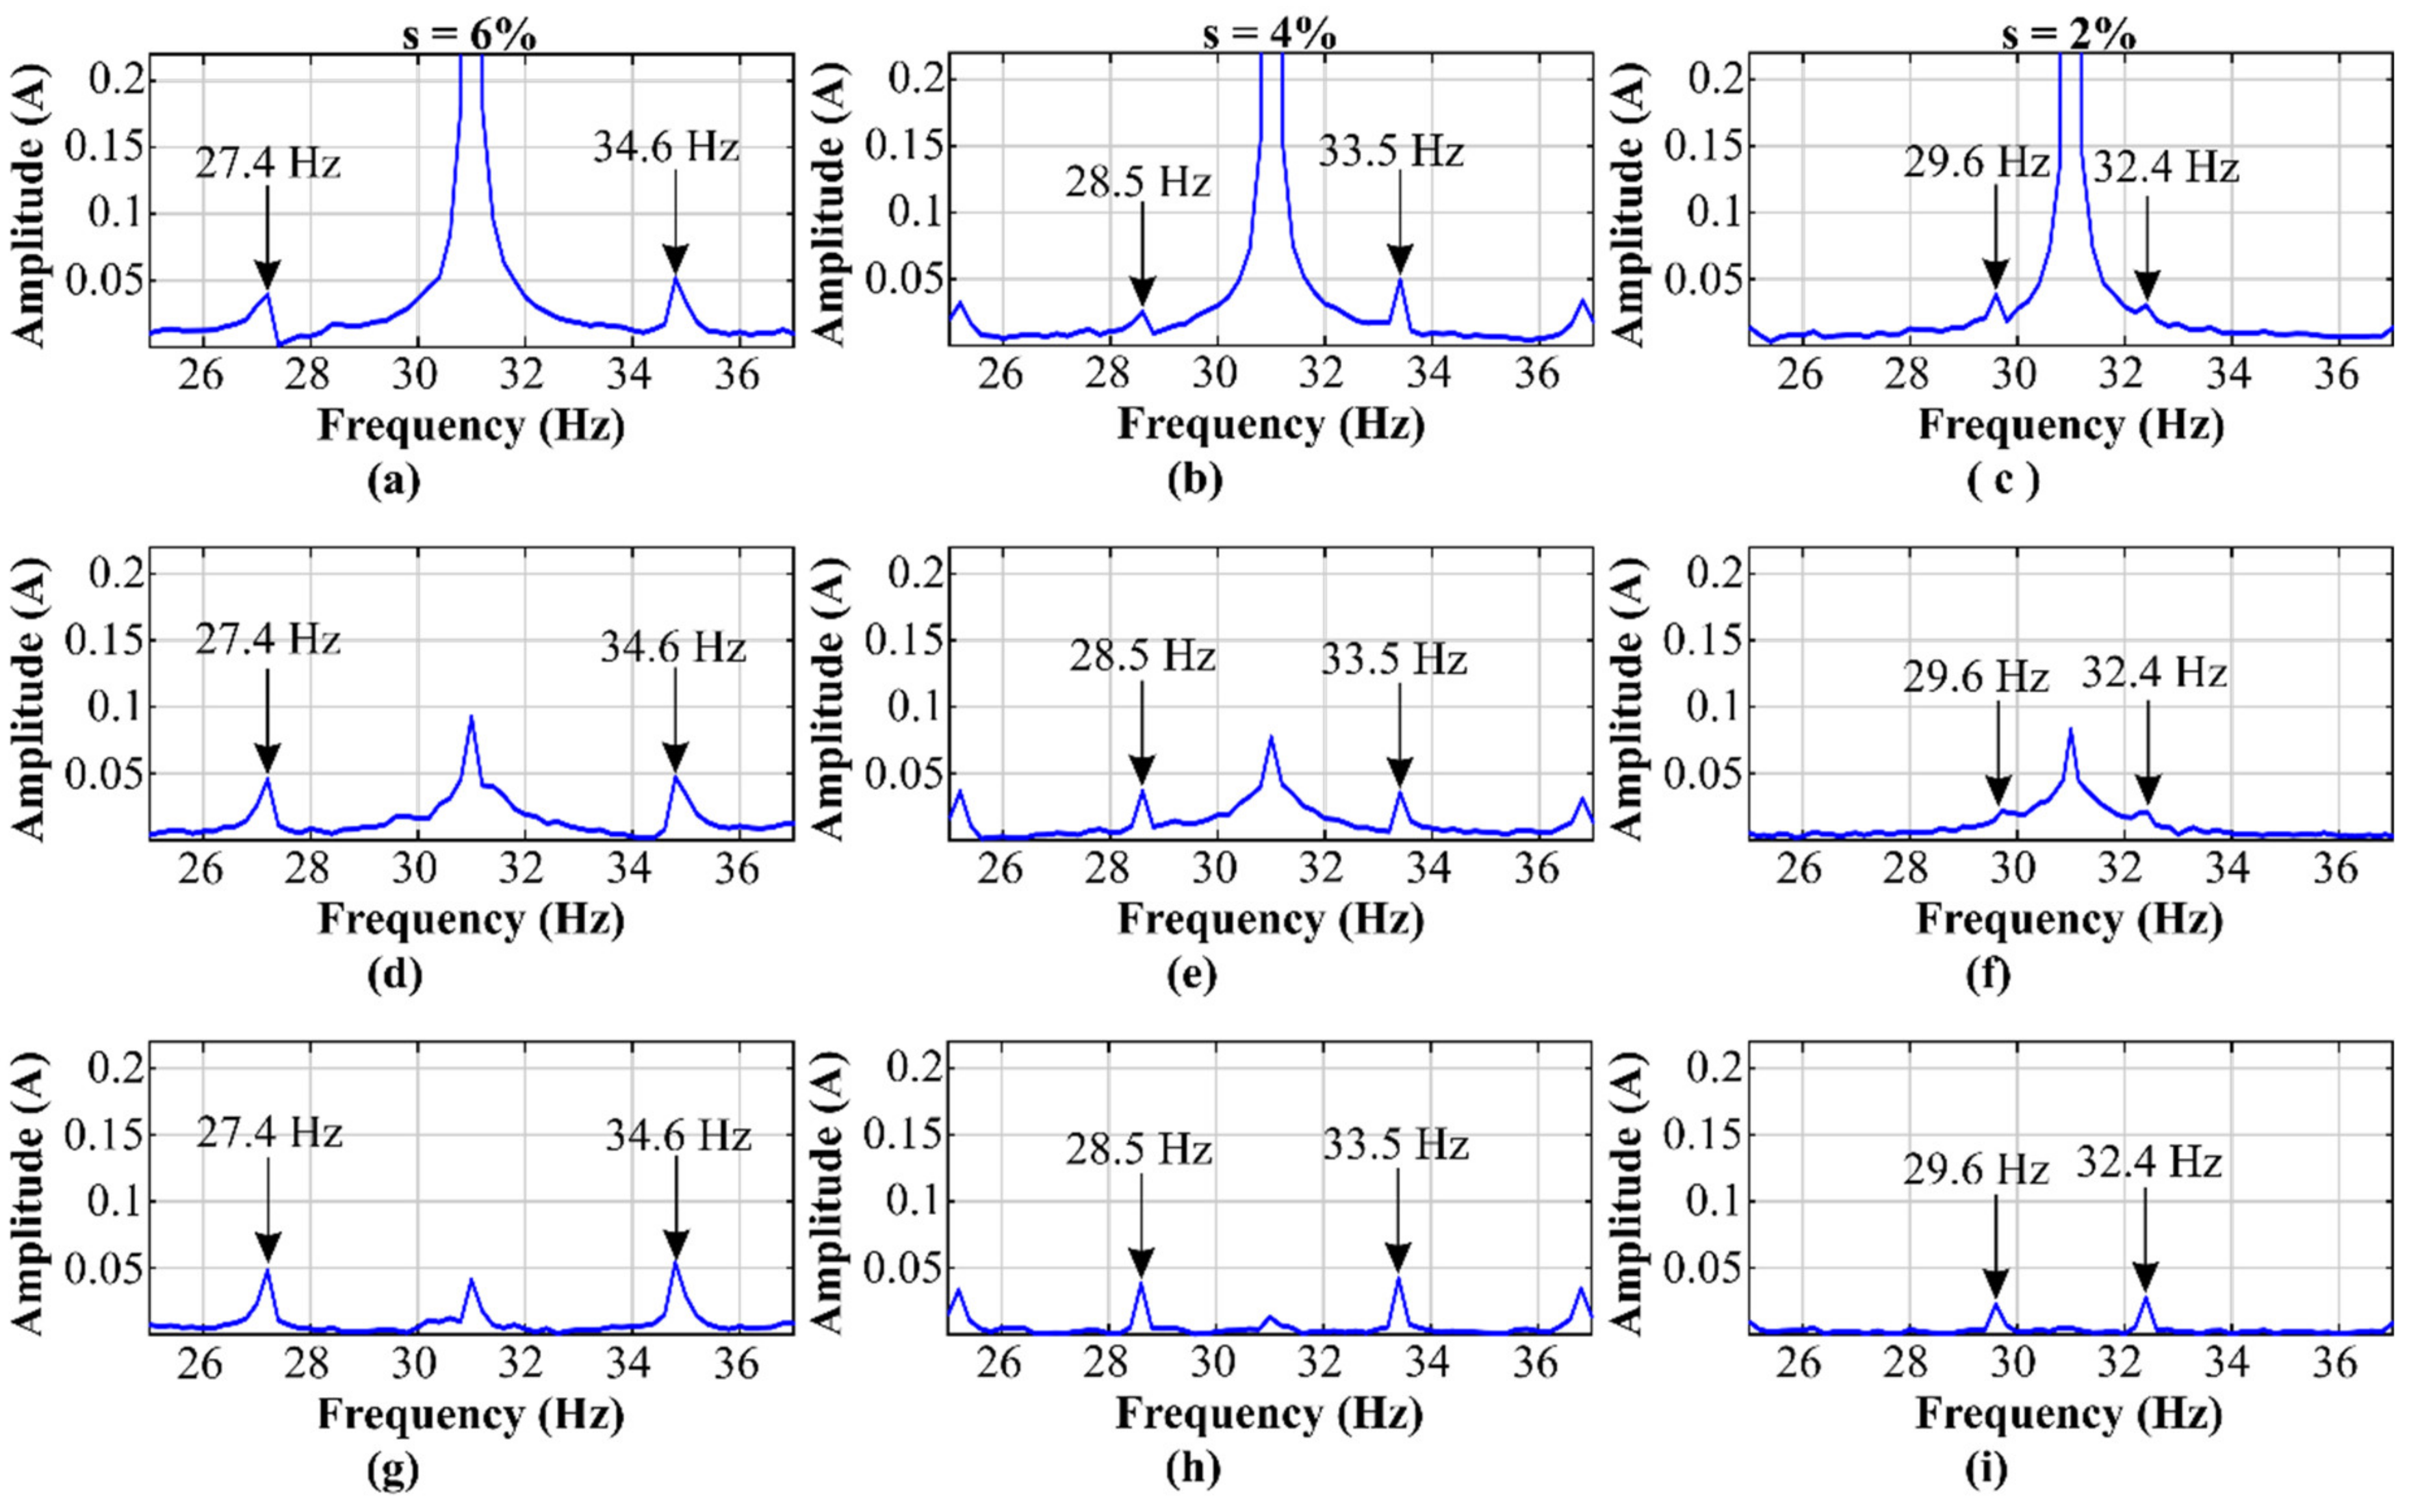
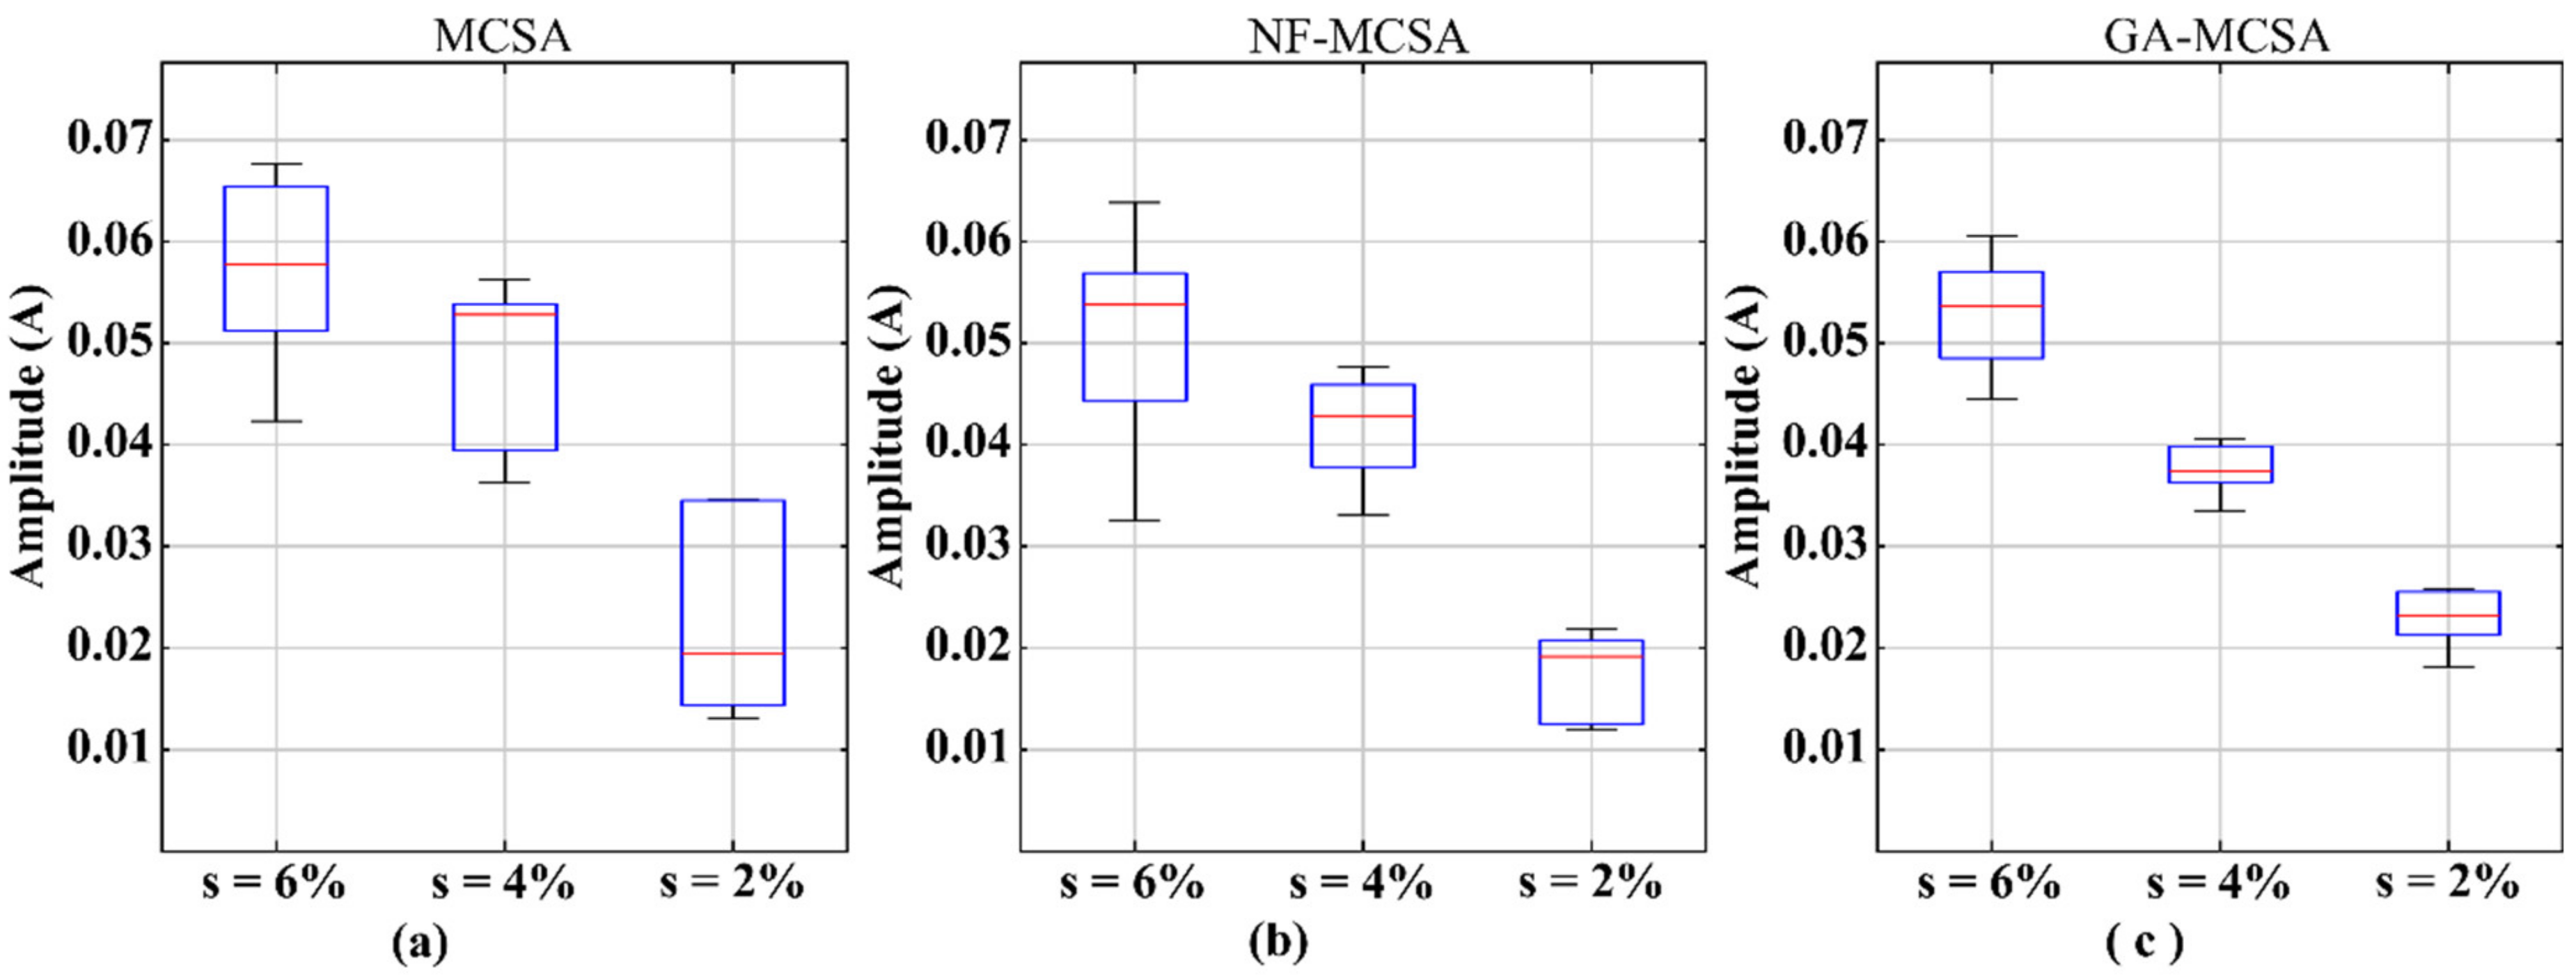
5.1. Results for the IM Operating at 31 Hz

First, the results for the motor operating at 31 Hz are introduced. To demonstrate the advantages of the proposed methodology against other methodologies, a comparison is performed first with the conventional MCSA without removing the FFC, using a total of 160,000 samples (20 s) of the signal to obtain a 0.05 Hz resolution. Then, the comparison is performed with a NF-MCSA methodology that uses a NF for removing the FFC before applying the MCSA technique. The designed NF considers a notch frequency of 31 Hz and a 0.8 Hz bandwidth. Finally, the analysis is performed with the proposed methodology (GA-MCSA) which uses a GA for suppressing the FFC before applying the MCSA. To show the advantages of the GA-MCSA methodology, only 80,000 samples (10 s) of the signal are used to compute the signal spectrum at a resolution of 0.1 Hz. The IM under test is operated at three different load levels: high load ( s = 6 % ), medium load ( s = 4 % ), and low load ( s = 2 % ). Figure 3 summarizes the results of applying the three methodologies at the three load levels in one of the current signals.
It is observed that when the IM operates at high load, the MCSA is able to detect the failure harmonics by itself (see Figure 3a). At these operating conditions, the LSH appears at 27.4 Hz and the RSH at 34.6 Hz. However, it is noticed that the energy of the FFC is so high that it goes outside the graphic. When the NF-MCSA methodology is applied, the LSH and the RSH are also visible in the spectrum (Figure 3d). Additionally, it can be seen that the remaining energy of the FFC is now visible at 31 Hz with an amplitude of around 0.1 A. This situation proves that the NF is effective in the attenuation of the FFC. Notwithstanding, it can be seen that the leakage effect is present in the range between 28 and the 34 Hz. This problem does not seem to affect the identification because the failure harmonics are located beyond this range. When the GA-MCSA technology is used, it is appreciated that the attenuation of the FFC is higher than that presented by the previous technique (Figure 3g), and the failure harmonics are clearly visible at 27.4 and 34.6 Hz respectively. The fact that the attenuation is higher seems to be an advantage because the leakage effect around the FFC is also reduced, falling to the range between 30 and the 32 Hz.
A similar analysis is carried out, but now for the IM operating at medium load. Here, the LSH is expected to appear at 28.5 Hz and the RSH at 33.5 Hz. The MCSA still can identify the failure harmonics (see Figure 3b) but their appearance is not as clear as in the previous case. The amplitude of the RSH is high, facilitating its observation; however, the amplitude of the LSH is not as high and it appears as a small peak in the spectrum of Figure 3b. By applying the NF, the results improve and it is easier to identify both failure harmonics (see Figure 3e). Although the identification improves, it is observed that the leakage around the FFC still appears between the 32 and the 34 Hz. Since the failure harmonics are now between this range, they appear mounted on the spectral leakage; therefore, the amplitudes regarding the failure harmonics are not reliable. When the GA-MCSA technique is used, the attenuation of the FFC is even better than in the high load case and the failure harmonics are easy to identify (see Figure 3h). Moreover, the spectral leakage around the FFC is reduced to the range between 30.5 and the 31.5 Hz; thus, the amplitudes of the failure harmonics remain unaltered.
Finally, the three techniques are used for the current signal when the motor operates at low load. In this case, it is expected that the failure harmonics appear at 29.6 and 32.4 Hz. From Figure 3c, it is clear the existence of the LSH; however, the presence of the RSH is not clear since its energy is low and the spectral leakage around the FFC hides it. In this case, when the NF is used for attenuating the FFC, the result gets even worse (see Figure 3f). It is observed that the spectral leakage associated with the FFC is so severe that the energies of the RSH and the LSH are completely covered; therefore, the presence of the failure harmonics cannot be properly observed. On the other hand, by looking at Figure 3i, it is clear that the FFC has been highly attenuated and it is almost imperceptible in the spectrum. This situation generates that the leakage around the FFC disappears and the LSH and the RSH are easy to observe at their respective frequencies. At this point, it is important to mention that, when the IM operates at high load and medium load, the MCSA is able to perform the identification by its own. However, the MCSA technique presents some problems when the IM operates at low load and the NF (which is probably the most common solution for the issues related with the MCSA technique) cannot solve these problems. In fact, the NF aggravates the situation. In this sense, the GA-MCSA proves to be the best of the three solutions for the analysis of the IM, even when it operates at low load, allowing the identification of the LSH and the RSH in an easy way. To prove the consistency of the results, five tests are carried out for each load level, resulting in a total of 15 tests. The obtained results are used to obtain the boxplots showed in Figure 4.
Since the results are similar for both failure harmonics, only the results for the LSH are presented. Here, it is important to mention that the amplitude of the failure harmonic is directly proportional to the IM slip. Thus, it is expected that when the slip is high, the amplitude of the failure harmonic is high too, and when the slip decreases, the amplitude of the failure harmonic decreases too. This situation is not present in Figure 4a. When the conventional MCSA is applied, a same amplitude value for the LSH appears when the IM operates at high load and also when it operates at medium load, i.e., there exists an overlap between these two operative conditions. By observing Figure 4a, it can be noticed that the region comprised between the 0.042 and the 0.057 A appears in both: the high load and the medium load condition. The only condition that does not share amplitudes is the low load operation that appears in the range between the 0.012 and the 0.035 A. All these results correspond to the use of the conventional MCSA.
When the amplitude of the LSH is analyzed after applying the NF-MCSA methodology (see Figure 4b), it is shown that for the case of the IM operating with s = 6%, the amplitudes fluctuate from 0.032 to 0.065 A; for the case of the IM working at medium load, the amplitudes lay between the 0.032 and the 0.048 A; and finally, for the case of low load operation, the amplitudes appear between the 0.011 and the 0.022 A. Thus, it is observed that all the amplitudes associated with the medium load case could also be related to the high load operation. Just as in the previous case, an overlap between the amplitude values of these two conditions is presented. This situation represents a problem, because, if the amplitude value is intended to be used as an indicator of the fault severity, with this overlap, it is not possible to correctly distinguish the correct result. These errors in the amplitude are related to the existence of spectral leakage in the neighborhood of the FFC. Since the failure harmonics are mounted on the leakage, their amplitudes are affected and they are not reliable.
Finally, when the proposed GA-MCSA methodology is applied, the amplitude ranges appreciated in Figure 4c are: from 0.045 to 0.06 A for the high load operation; from 0.032 to 0.04 A for the medium load case; and from 0.018 to 0.025 A. This means that none of the values from one operative condition appear in more than one case. In this sense, results provided by the GA-MCSA methodology are more reliable than those presented for the other two methodologies. This situation can be explained by the fact that, when the proposed methodology is applied, the leakage surrounding the FFC is greatly mitigated, therefore, the amplitude of the failure harmonic is not affected by the leakage, allowing the proper measurement of the failure severity.
The amplitude measurements could be used as an indicator of the failure severity. However, the implementation of a methodology for determining the severity based on the amplitude results would require a few extra steps. For instance, it is necessary to carry out a considerable number of tests of the motor operating at healthy conditions. With these tests, the amplitude of the frequencies related to the failure harmonics at a specific operative frequency must be measured. The mean value of these amplitudes could be considered as the expected value for the healthy conditions and the maximum value could be use as the threshold limit for this condition. If the definition of thresholds for different failure severities is required, it would be necessary to perform tests with the failure conditions and obtain the mean values to define the boundaries of every threshold. If there exist overlaps in the amplitude values for different fault severities, this boundary definition cannot be correctly performed, because there is no certainty in the thresholds. Then, periodical samples of the IM must be acquired and the amplitudes of the failure harmonics have to be compared with the established ranges to determine the existence of a failure. The use of periodical samples also allows to visualize the time evolution of a failure. However, such methodology goes beyond the scope of this work and is left for future research.

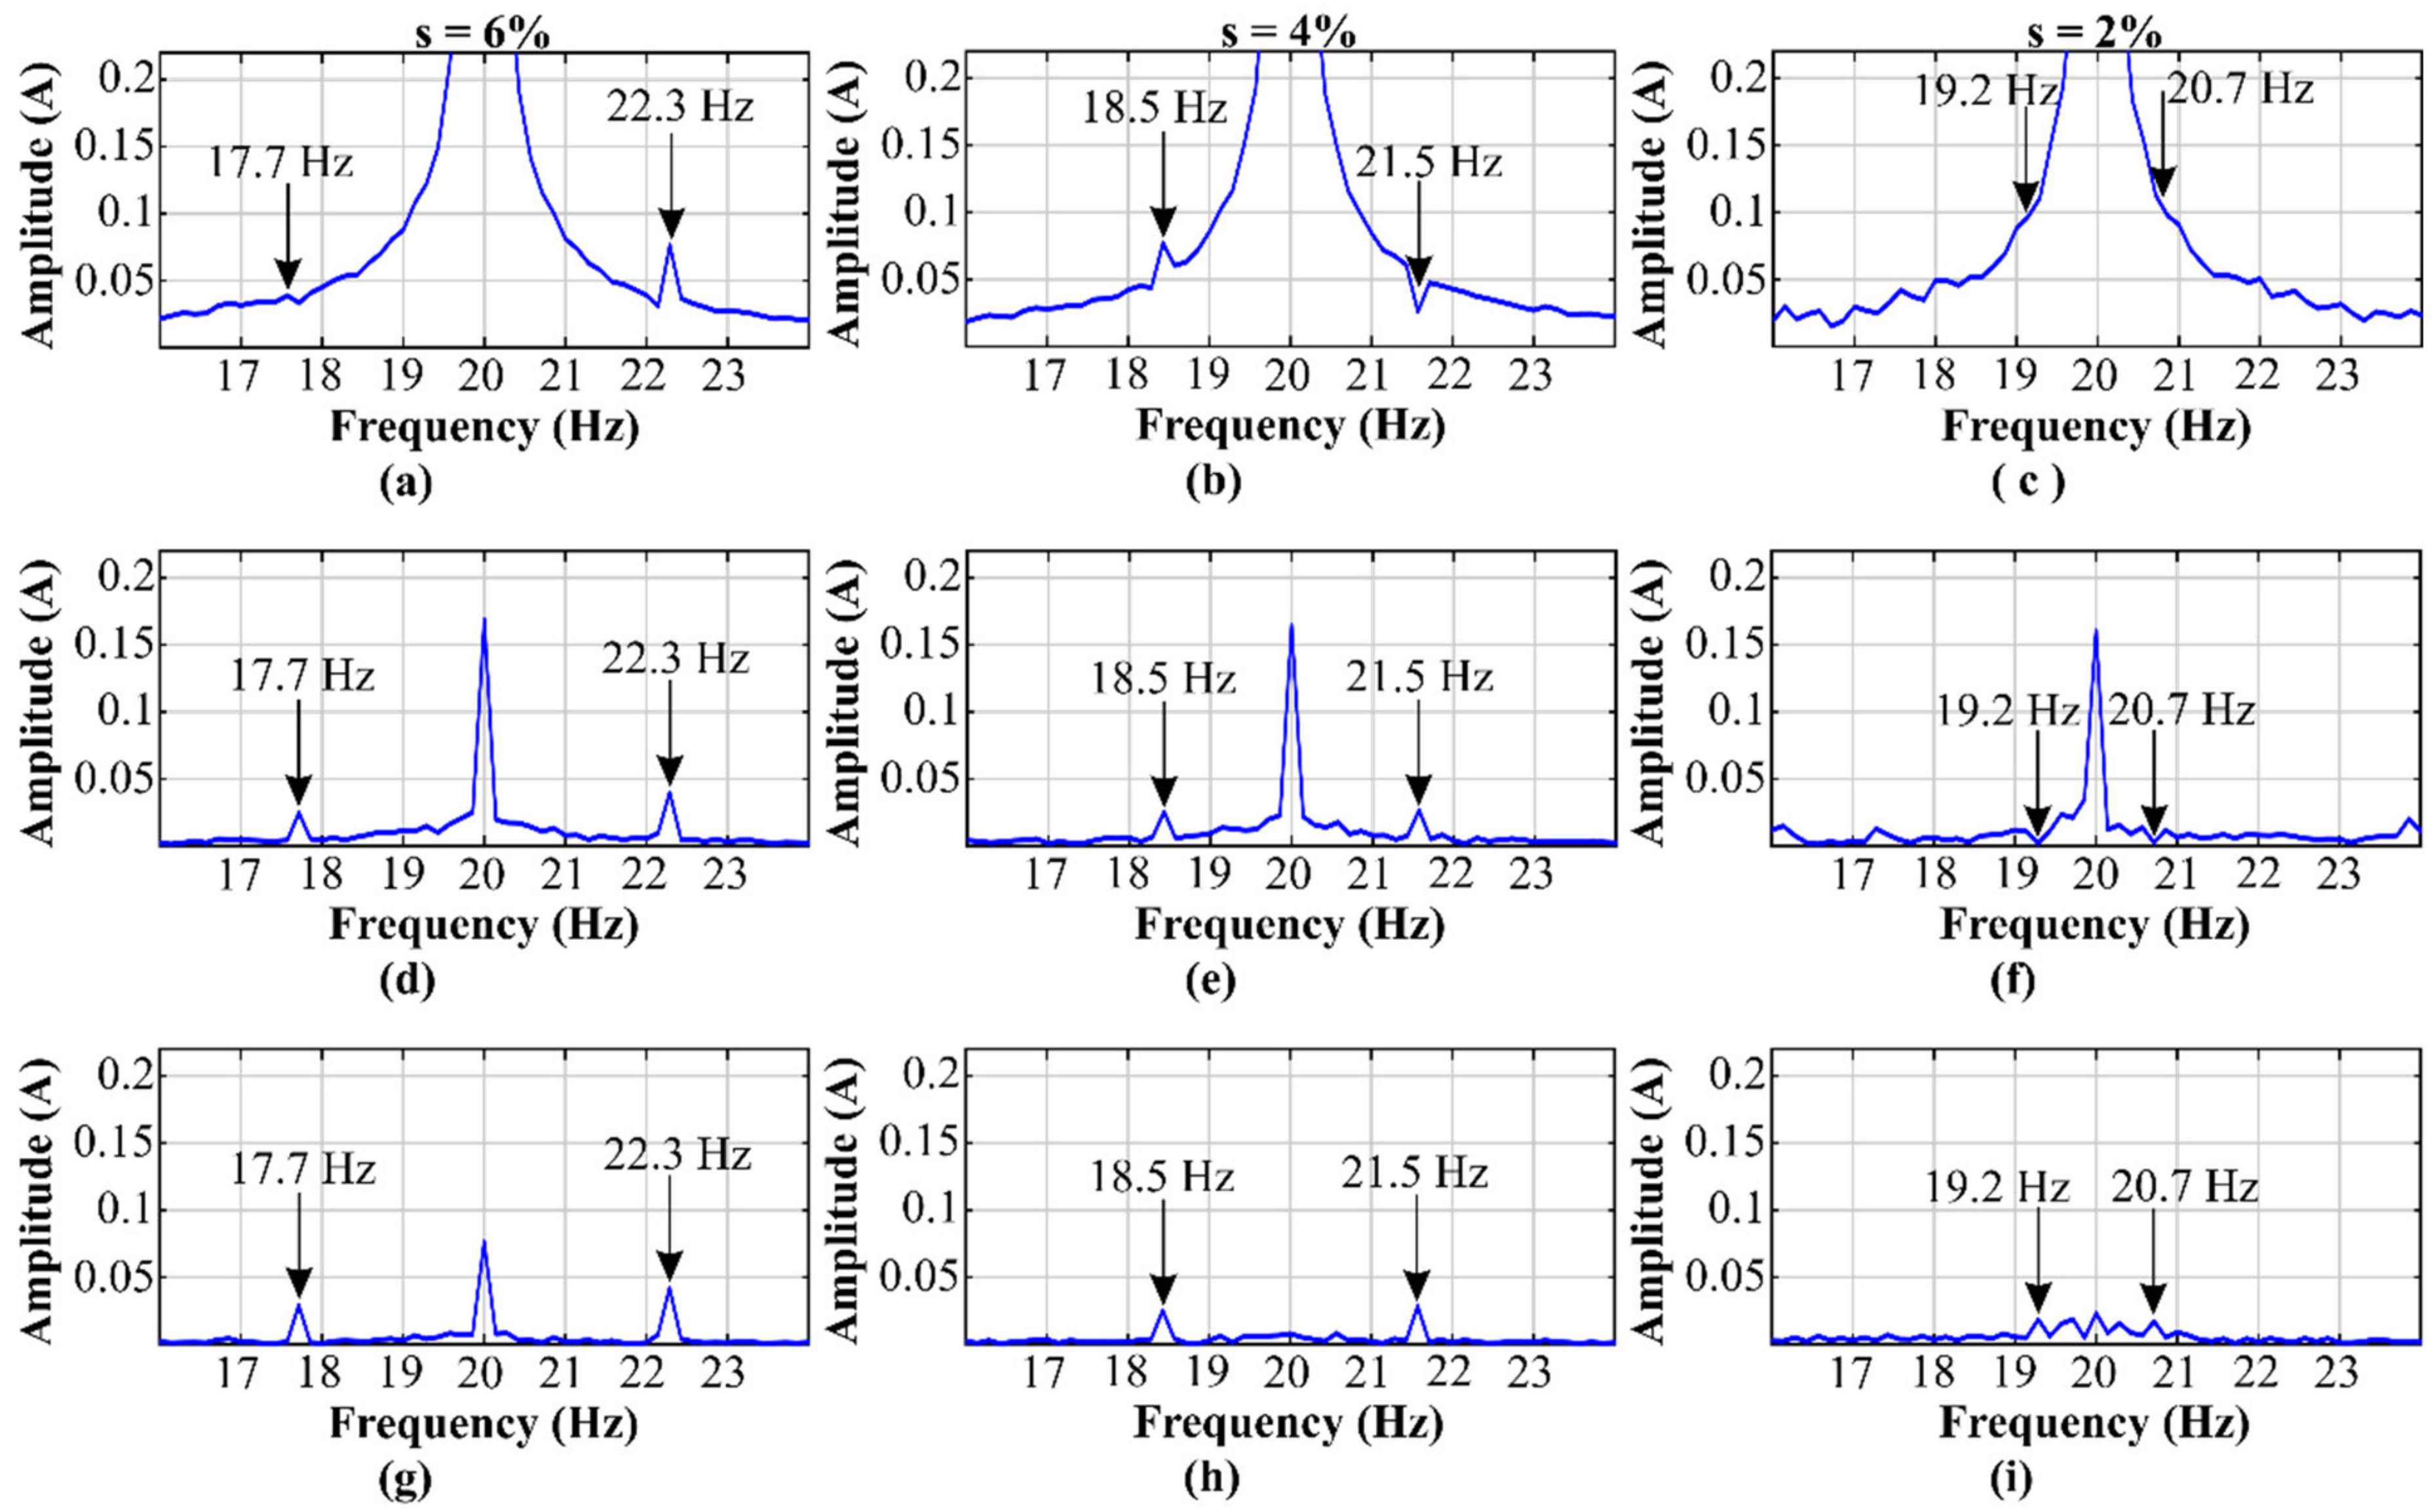
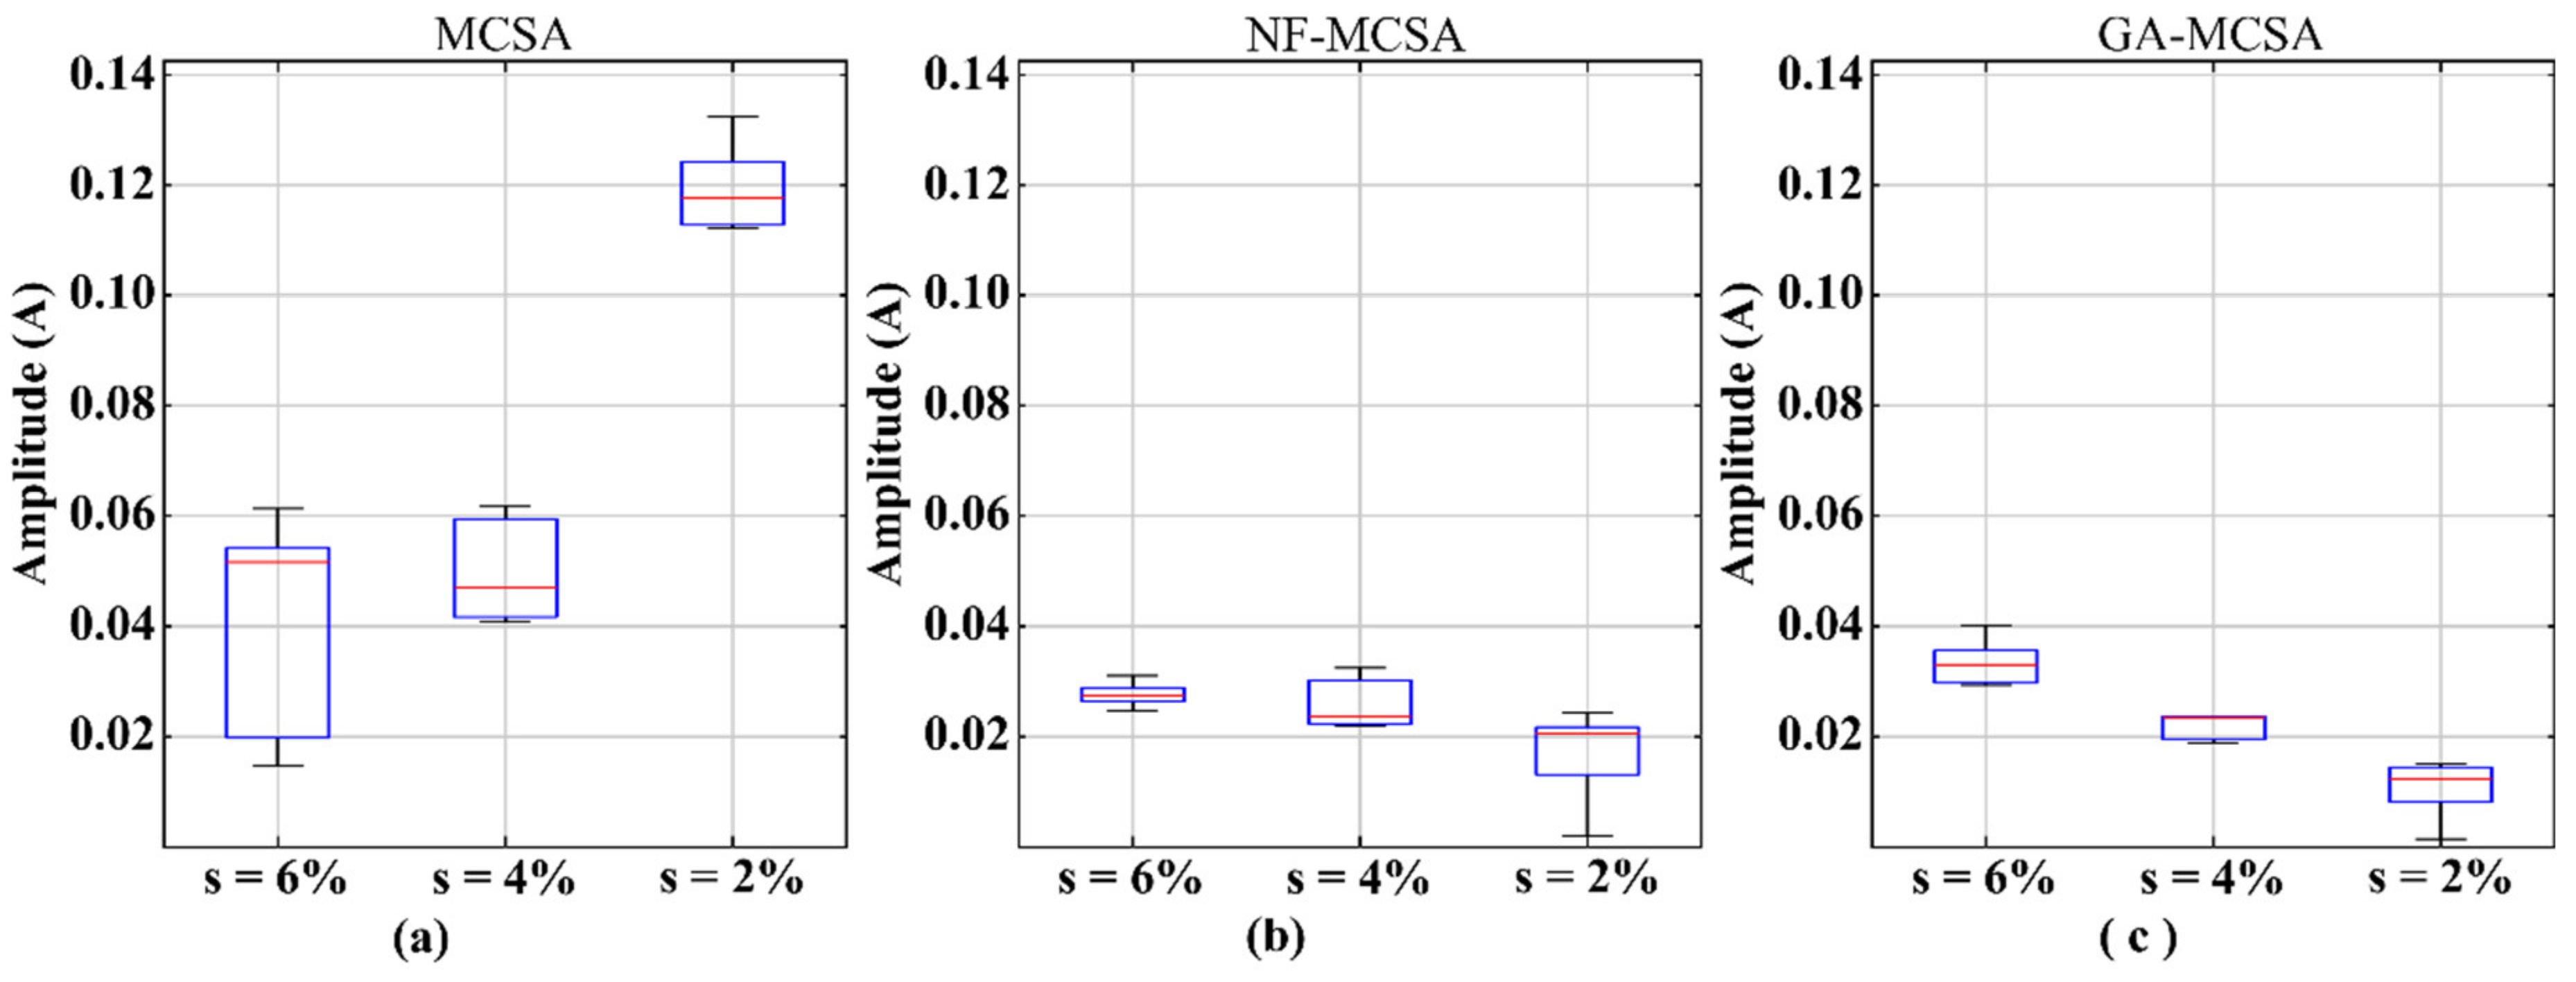
5.2. Results for the IM Operating at 20 Hz

Another test is performed for the IM operating at 20 Hz. The same three methodologies of the previous section are applied: the MCSA, the NF-MCSA, and the GA-MCSA. The conventional MCSA and the GA-MCSA techniques are applied without any modification. However, in the case of the NF-MCSA methodology, it is necessary to design a completely different NF. The filter used in the new test considers a notch frequency and a 0.8 Hz bandwidth. The spectra for the three methodologies at the three load levels are presented in Figure 5.
This time, the conventional MCSA presents difficulties for properly identifying the fault condition even when the motor operates at high load. It is observed in Figure 5a that the RSH is high enough to be detected at first sight; on the other hand, the LSH is merged on the spectral leakage and it cannot be appreciated in the figure. In this particular case, the NF is able to solve the issues related to the MCSA, allowing the proper identification of both failure harmonics (see Figure 5d). Notwithstanding, it is observed the effect of the leakage in the neighborhood of the FFC in the range between 18 and the 22 Hz. The GA methodology allows to perform a better attenuation of the FFC and provides the smallest range of spectral leakage of the three methodologies, and the most important part is that both failure harmonics can be easily appreciated in the spectrum of Figure 5g, even when a smallest number of data points are used. For the case of the IM operating at medium load, the MCSA can identify the LSH by itself, but the spectral leakage generates a detrimental effect, which causes the RSH to appear as a gap instead of a peak (see Figure 5b). Here, the remaining two methodologies (the NF and the GA) solve the problem, allowing the proper identification of both failure harmonics (Figure 5e,h respectively). However, it is observed that the GA is able to perform a bigger attenuation than the NF. The worst of all the presented cases occurs when the IM operates at 20 Hz and low load. In this case, the MCSA cannot provide a reliable result because the amplitudes of the failure harmonics are so low that they are completely covered by the spectral leakage that surrounds the FFC (Figure 5c). This time, the NF is not effective for solving the problem, by looking at Figure 5f, it is clear that the failure harmonics are not visible in the spectrum; therefore, it can be said that the NF-MCSA methodology experiences problems when the operation frequency and the load are low. Meanwhile, the GA-MCSA methodology can perform a correct suppression of the FFC, which allows observing the failure harmonics as two small peaks at their respective frequencies (see Figure 5i). In this sense, it can be said, that the only methodology that delivers reliable results, regardless of the operating conditions of the IM, is the GA-MCSA.
It must be said that in this work, the proposed methodology is compared with the use of a static NF. This technique is selected because it is very common, its implementation is simple, and it provides acceptable results in many cases. However, there are some other alternatives similar to NF that could have also been used. For instance, a more robust approach consists in the use of adaptive NF. These type of filters contain a preprocessing stage to estimate the required frequency for properly tuning the NF [36]. The estimated value is selected as the central frequency and it is considered to be the only frequency that can pass through the filter. Notwithstanding, this is the ideal behavior, but in real conditions, a narrow frequency band is suppressed. Moreover, the filter time response can become high due to the estimation process, leading to wrong results in signals with frequency variations. Another different technique is the phase-locked loop (PLL), which also allows to determine a single frequency and phase of any signal [37]. The problem with this technique is that it is prone to error when it operates in unbalanced conditions; moreover, if the amplitude is required, a different technique must be implemented for detecting it. Although these methodologies could be used to perform a FFC suppression, the GA is the only methodology that can estimate the three parameters in a single run, and it suppresses only one frequency component instead of a narrow frequency band and that is why its use is preferred.
On the other hand, the GA is a heuristic and not a deterministic technique. In this sense, it can be considered as a grey-box approach where the input–output relationship is modeled through the objective function which turns out to be a pure sinusoidal wave. This type of approach provides some benefits compared with other methodologies like ANNs which act as black-box models. The main issue related to the use of the ANN relies in the fact that there is no model that relates the output with the input, therefore, the delivered results may present a lack of physical meaning or context, leading to a high uncertainty in the result interpretation [38]. Additionally, the ANN requires an exhaustive training process, thus, a huge amount of data from all the conditions under test must be previously acquired. In this sense, the GA is more suitable in this work because it does not require this training process. Moreover, the ANN results are more helpful in applications where an automatic classification is carried. This is a situation that goes beyond the scope of this work. In addition, it has to be said that there are some other optimization techniques like the global–local optimization technique used in [38] which can also perform the estimation of the FFC parameters. The global–local optimization technique fuses the use of a GA algorithm for finding the global optimal with the Quasi-Newton method for identifying local optimal solutions. One of the aims of this work consists of developing a simple preprocessing technique. Moreover, for this particular case, only the global optimal is required, thus the use of a different technique for finding local optimal would only introduce unnecessary complexity and computational burden.
As in the case of the IM operating at 31 Hz, a total of 15 tests are performed to show the consistency of the results. The results of the LSH are used for conforming the boxplots of Figure 6. This time, it is observed that when the MCSA is used, the trend is contrary to what is expected because the highest amplitudes are measured when the IM operates at low load (see Figure 6a). Additionally, when the IM operates at medium load, the amplitudes of the LSH fall between 0.04 and 0.061 A, whereas for the case of the IM operating at high load, the amplitudes appear between 0.017 and 0.041 A. Therefore, all the amplitudes that describe the medium load fault condition are contained in the group for the high load condition and it is not possible to discriminate from one group to another.
The NF-MCSA methodology improves the results a little, and the groups are compact, indicating that the differences among the amplitude measurements are low. However, the highest amplitudes are presented when the IM operates at medium load, which is not the expected behavior either (see Figure 6b). In this case, it is observed that the three groups have values in the range comprised between 0.021 and the 0.023 A, i.e., there exists overlap among the three operative conditions. As explained before, this problem is originated by the spectral leakage that exists around the FFC. The leakage affects the amplitude of the failure harmonics, causing the conventional MCSA technique and the NF-MCSA to not properly identifying the failure severity.
Finally, by looking at Figure 6c, it is clear that when the GA-MCSA technique is used, the measured amplitudes behave as expected and, in addition, the amplitudes are smaller than those measured in the original signal. Moreover, the boxplots do not overlap in the y-axis, and the amplitude of the fault harmonic can be better measured. Again, it is necessary to mention that these results are achieved due to the suppression of the FFC performed using the GA. This suppression considerably reduces the spectral leakage around the FFC, allowing the correct measurement of the amplitude from the failure harmonics. In this sense, it can be said that another of the important contributions of this work consists of the development of a technique that reduces the detrimental effects of the spectral leakage in the vicinity of the FFC.
In order to demonstrate that the proposed methodology also allows to obtain a better grouping in the amplitudes of the LSH, the intra-cluster distance D i n t r a , and the inter-cluster distance D i n t e r as defined in [39] are used as features to measure the quality of the groping. The intra-cluster distance measures the scatter within every group, and the inter-cluster distance measures the separation between groups. Thus, the best grouping strategy consists of minimizing the intra-cluster distance and maximizing the inter-cluster distance. These indexes are computed for the three slip levels and for the two operation frequencies. Table 1 presents the results for the intra-cluster distance applied to groups resulting from the three different methodologies. It is easy to observe that in all the cases, the lowest value for the groups correspond to those reported by the proposed methodology. This is a strength of the GA-MCSA methodology because it implies that the values reported from one measurement to another are similar. It is also appreciated, that the highest scatter in the data occurs when the conventional MCSA is applied. This is indicative that, by itself, the MCSA may lead to wrong results. The NF-MCSA proves to be an intermediate point between the conventional MCSA and the proposed methodology; it improves the results but it is still affected by the spectral leakage around the FFC.
The inter-cluster distances are also calculated for the results delivered by the three methodologies and the obtained data are summarized in Table 2. The term D 24 i n t e r represents the inter-cluster distance between the case for a 2% slip and the case for a 4% slip. On the other hand, the term D 46 i n t e r represents the inter-cluster distance between the case for a 4% slip and the case for a 6% slip. The conventional MCSA and the NF-MCSA present good separation between the 2% slip and the 4% slip and this situation is appreciated in the results from Table 2. However, they present a high scatter and, therefore, the results for the distance between the 4% slip and the 6% slip are not as good as expected. The GA-MCSA methodology presents good values for the inter-cluster distance and combined with the low scatter in the data, it results in the best option for the proper detection of the fault severity.
As an additional analysis, Table 3 presents the computational cost and acquisition time related with every methodology. All the methodologies are implemented in a personal computer with 8 GB RAM memory and a microprocessor Intel (R) Core (TM) i7-5500U. It is observed that the fastest technique is the MCSA. This is a remarkable situation because this technique is also the one that uses the highest acquisition time. This acquisition time is required because, otherwise, the failure harmonics are not visible in the spectrum. As a disadvantage of the proposed methodology, it can be mentioned that it is the one that requires the highest computational burden even though it only works when 10 s of the signal is in steady state. This is because the GA is an iterative technique, and in this case, a total of 300 iterations are required, i.e., the 10 s of the signal are analyzed a total of 300 times. The NF-MCSA methodology also works with 10 s of the signal. The computational cost is a little higher than in the case of the conventional MCSA and it is lower than the one presented by the proposed methodology. However, the enhancement in the results worth the computational effort; moreover, since the length of the signal under analysis is not very high, the computational time remains in a tolerable range.
At this point, it must be said that the GA-MCSA methodology proved to be an effective tool for enhancing the identification of BRB on IM operating at steady state. Notwithstanding, these results cannot ensure that this methodology would lead to the same outcome in a transient analysis. To use the proposed methodology with transient signals, it must be applied in a piecewise sense. The GA cannot perform a parameter estimation with only one point, it requires a set of points in order to perform a proper estimation. Thus, if the signal frequency changes at a rate higher than the one allowed by the algorithm, the results would be erroneous. In this sense, it is possible that a different methodology is required to perform a transient analysis and ensure the estimation of instantaneous parameters.

6. Conclusions

The high energy of the FFC can hide the existence of a failure by covering the frequency components related to the failure. This situation becomes worse when the IM operates at low frequency and load. The use of a NF can partially solve the problem because it fails when both: the operating frequency and the load are low. The use of the GA for suppressing the FFC proved to be effective for the detection of the failure harmonics even when the load and frequency are low. The GA performs a better attenuation of the FFC, allowing the reduction of the spectral leakage around the FFC. In this sense, the proposed methodology becomes a powerful tool to enhance the results provided by the methodologies that aim to detect failure conditions in electric machines when they operate at steady state. In fact, the proposed methodology allows identifying interharmonics even in the vicinity of the FFC, which is essential for accurate broken rotor bar detection in induction motors.

Author Contributions

Conceptualization, D.A.E.-O., R.d.J.R.-T., R.A.O.-R., and D.M.-S.; data curation, D.A.E.-O., A.L.Z.-L., and D.M.-S.; methodology, D.A.E.-O., A.L.Z.-L., and D.M.-S.; software, D.A.E.-O. and D.M.-S.; validation, R.d.J.R.-T., and R.A.O.-R.; writing—original draft, D.A.E.-O., and R.d.J.R.-T.; writing—reviewing and editing, A.L.Z.-L., and R.A.O.-R. All authors have read and agreed to the published version of the manuscript.

Funding

This research was partially supported by CONACyT scholarship 415315; by a Mobility Grant of the University of Valladolid awarded to D. Morinigo-Sotelo; by project FOFI-UAQ 2018 FIN201812; and by PRODEP UAQ-PTC-385 grant.

Conflicts of Interest

The authors declare no conflict of interest. The funders had no role in the design of the study; in the collection, analyses, or interpretation of data; in the writing of the manuscript, or in the decision to publish the results.

Nomenclature

ε t Signal Error
ΦPhase
AmAmplitude
ANNArtificial Neural Networks
BRBBroken Rotor Bar
DASData Acquisition System
fFrequency
f c t Estimated Fundamental Component
f F C Frequency of the Fundamental Component
FFCFundamental Frequency Component
FFTFast Fourier Transform
f L S H Frequency of the Left Side Harmonic
FPGAField Programmable Gate Array
f R S H Frequency of the Right Side Harmonic
G 1 Best Member of the Current Population
GAGenetic Algorithms
G c i i-th Individual of the Current Population
G n i i-th Individual of the Next Population
i t Time Domain Current Signal
I a Current from phase a
IAEIntegral of the Absolute Error
I b Current from phase b
I c Current from phase c
IMInduction Motors
J x Objective Function
LSHLeft Side Harmonic
m a x F x Maximum value of a fitness function
MCSAMotor Current Signature Analysis
MUSICMultiple Signal Classification
NFNotch Filters
PLLPhase-Locked Loop
P m Mutation Probability
RSResidual Signal
RSHRight Side Harmonic
s Induction Motor Slip
VFDVariable Frequency Drive

References

  1. Aguilar, W.G.; Arcos-Avilés, D.; Sotomayor, D.; Granda, D. Broken Bar Diagnosis for Squirrel Cage Induction Motors Using Frequency Analysis Based on MCSA and Continuous Wavelet Transform. Math. Comput. Appl. 2017, 22, 30. [Google Scholar] [CrossRef] [Green Version]
  2. Guajardo, L.A.T.; Rodriguez-Maldonado, J.; Moonem, M.A.; Platas-Garza, M.A. A Multiresolution Taylor–Kalman Approach for Broken Rotor Bar Detection in Cage Induction Motors. IEEE Trans. Instrum. Meas. 2018, 67, 1317–1328. [Google Scholar] [CrossRef]
  3. Choudhary, A.; Goyal, D.; Shimi, S.L.; Akula, A. Condition Monitoring and Fault Diagnosis of Induction Motors: A Review. Arch. Comput. Methods Eng. 2018, 26, 1221–1238. [Google Scholar] [CrossRef]
  4. Singh, G.; Kumar, T.C.A.; Naikan, V. Efficiency monitoring as a strategy for cost effective maintenance of induction motors for minimizing carbon emission and energy consumption. Reliab. Eng. Syst. Saf. 2019, 184, 193–201. [Google Scholar] [CrossRef]
  5. Chang, H.-C.; Jheng, Y.-M.; Kuo, C.-C.; Hsueh, Y.-M. Induction Motors Condition Monitoring System with Fault Diagnosis Using a Hybrid Approach. Energies 2019, 12, 1471. [Google Scholar] [CrossRef] [Green Version]
  6. Ojaghi, M.; Sabouri, M.; Faiz, J. Performance Analysis of Squirrel-Cage Induction Motors Under Broken Rotor Bar and Stator Inter-Turn Fault Conditions Using Analytical Modeling. IEEE Trans. Magn. 2018, 54, 1–5. [Google Scholar] [CrossRef]
  7. Morinigo-Sotelo, D.; Romero-Troncoso, R.D.J.; Panagiotou, P.A.; Antonino-Daviu, J.; Gyftakis, K. Reliable Detection of Rotor Bars Breakage in Induction Motors via MUSIC and ZSC. IEEE Trans. Ind. Appl. 2017, 54, 1224–1234. [Google Scholar] [CrossRef]
  8. Panagiotou, P.A.; Arvanitakis, I.; Lophitis, N.; Antonino-Daviu, J.; Gyftakis, K. A New Approach for Broken Rotor Bar Detection in Induction Motors Using Frequency Extraction in Stray Flux Signals. IEEE Trans. Ind. Appl. 2019, 55, 3501–3511. [Google Scholar] [CrossRef] [Green Version]
  9. Bessam, B.; Menacer, A.; Boumehraz, M.; Cherif, H. Detection of broken rotor bar faults in induction motor at low load using neural network. ISA Trans. 2016, 64, 241–246. [Google Scholar] [CrossRef]
  10. Filho, P.C.M.L.; Baccarini, L.M.R.; Batista, F.B.; Alves, D.A. Broken rotor bar detection using empirical demodulation and wavelet transform: Suitable for industrial application. Electr. Eng. 2018, 100, 2253–2260. [Google Scholar] [CrossRef]
  11. Zhen, D.; Wang, Z.; Li, H.; Zhang, H.; Yang, J.; Gu, F. An Improved Cyclic Modulation Spectral Analysis Based on the CWT and Its Application on Broken Rotor Bar Fault Diagnosis for Induction Motors. Appl. Sci. 2019, 9, 3902. [Google Scholar] [CrossRef] [Green Version]
  12. Pineda-Sanchez, M.; Puche-Panadero, R.; Martinez-Roman, J.; Sapena-Bano, A.; Riera-Guasp, M.; Perez-Cruz, J. Partial Inductance Model of Induction Machines for Fault Diagnosis. Sensors 2018, 18, 2340. [Google Scholar] [CrossRef] [PubMed] [Green Version]
  13. Quiroz, J.C.; Mariun, N.; Mehrjou, M.R.; Izadi, M.; Misron, N.; Radzi, M.M. Fault detection of broken rotor bar in LS-PMSM using random forests. Measurement 2018, 116, 273–280. [Google Scholar] [CrossRef]
  14. Cekic, Y.; Eren, L. Broken rotor bar detection via four-band wavelet packet decomposition of motor current. Electr. Eng. 2017, 100, 1957–1962. [Google Scholar] [CrossRef]
  15. Zolfaghari, S.; Noor, S.B.M.; Mehrjou, M.R.; Marhaban, M.H.; Mariun, N. Broken Rotor Bar Fault Detection and Classification Using Wavelet Packet Signature Analysis Based on Fourier Transform and Multi-Layer Perceptron Neural Network. Appl. Sci. 2017, 8, 25. [Google Scholar] [CrossRef] [Green Version]
  16. Garcia-Calva, T.A.; Morinigo-Sotelo, D.; Romero-Troncoso, R.D.J. Non-Uniform Time Resampling for Diagnosing Broken Rotor Bars in Inverter-Fed Induction Motors. IEEE Trans. Ind. Electron. 2016, 64, 2306–2315. [Google Scholar] [CrossRef]
  17. Kia, S.; Henao, H.; Capolino, G.-A. A High-Resolution Frequency Estimation Method for Three-Phase Induction Machine Fault Detection. IEEE Trans. Ind. Electron. 2007, 54, 2305–2314. [Google Scholar] [CrossRef]
  18. Delgado-Arredondo, P.A.; Morinigo-Sotelo, D.; Osornio-Rios, R.A.; Avina-Cervantes, J.G.; Rostro-Gonzalez, H.; Romero-Troncoso, R.D.J. Methodology for fault detection in induction motors via sound and vibration signals. Mech. Syst. Signal Process. 2017, 83, 568–589. [Google Scholar] [CrossRef]
  19. Saucedo-Dorantes, J.J.; Delgado-Prieto, M.; Osornio-Rios, R.A.; Romero-Troncoso, R.D.J. Multifault Diagnosis Method Applied to an Electric Machine Based on High-Dimensional Feature Reduction. IEEE Trans. Ind. Appl. 2017, 53, 3086–3097. [Google Scholar] [CrossRef] [Green Version]
  20. Moussa, M.A.; Boucherma, M.; Khezzar, A. A detection method for induction motor bar fault using sidelobes leakage phenomenon of the sliding discrete Fourier transform. IEEE Trans. Power Electron. 2016, 32, 5560–5572. [Google Scholar] [CrossRef]
  21. Cruz, S.M.A.; Stefani, A.; Filippetti, F.; Cardoso, A.J.M. Diagnosis of rotor faults in traction drives for railway applications. In Proceedings of the 2008 18th International Conference on Electrical Machines, Vilamoura, Portugal, 6–9 September 2008. [Google Scholar]
  22. Kim, J.; Shin, S.; Bin Lee, S.; Gyftakis, K.; Drif, M.; Cardoso, A.J.M. Power Spectrum-Based Detection of Induction Motor Rotor Faults for Immunity to False Alarms. IEEE Trans. Energy Convers. 2015, 30, 1123–1132. [Google Scholar] [CrossRef]
  23. Jiang, C.; Li, S.; Habetler, T.G. A review of condition monitoring of induction motors based on stray flux. In Proceedings of the 2017 IEEE Energy Conversion Congress and Exposition (ECCE), Cincinnati, OH, USA, 1–5 October 2017. [Google Scholar]
  24. Bacha, K.; Ben Salem, S.; Chaari, A. An improved combination of Hilbert and Park transforms for fault detection and identification in three-phase induction motors. Int. J. Electr. Power Energy Syst. 2012, 43, 1006–1016. [Google Scholar] [CrossRef]
  25. Puche-Panadero, R.; Pineda-Sanchez, M.; Riera-Guasp, M.; Roger-Folch, J.; Hurtado-Pérez, E.; Perez-Cruz, J. Improved Resolution of the MCSA Method Via Hilbert Transform, Enabling the Diagnosis of Rotor Asymmetries at Very Low Slip. IEEE Trans. Energy Convers. 2009, 24, 52–59. [Google Scholar] [CrossRef]
  26. Malekpour, M.; Phung, B.T.; Ambikairajah, E. An envelope-based method with second order generalized integrator adaptive notch filter for diagnosis of rotor bar breakage at very low slips. In Proceedings of the IEEE 11th International Symposium on Diagnostics for Electrical Machines, Power Electronics and Drives (SDEMPED), Tinos, Greece, 29 August–1 September 2017. [Google Scholar]
  27. Malekpour, M.; Phung, B.T.; Ambikairajah, E. Stator current envelope extraction for analysis of broken rotor bar in induction motors. In Proceedings of the IEEE 11th International Symposium on Diagnostics for Electrical Machines, Power Electronics and Drives (SDEMPED), Tinos, Greece, 29 August–1 September 2017. [Google Scholar]
  28. Ince, T. Real-time broken rotor bar fault detection and classification by shallow 1D convolutional neural networks. Electr. Eng. 2019, 101, 599–608. [Google Scholar] [CrossRef]
  29. Asad, B.; Vaimann, T.; Belahcen, A.; Kallaste, A.; Rassolkin, A.; Iqbal, M.N. Broken rotor bar fault detection of the grid and inverter-fed induction motor by effective attenuation of the fundamental component. IET Electr. Power Appl. 2019, 13, 2005–2014. [Google Scholar] [CrossRef]
  30. Pineda-Sanchez, M.; Puche-Panadero, R.; Riera-Guasp, M.; Perez-Cruz, J.; Roger_Folch, J.; Pons-Llinares, J.; Climente-Alarcon, V.; Antonino-Daviu, J.A. Application of the Teager–Kaiser Energy Operator to the Fault Diagnosis of Induction Motors. IEEE Trans. Energy Convers. 2013, 28, 1036–1044. [Google Scholar] [CrossRef]
  31. Laala, W.; Guedini, S.; Zouzou, S. Novel approach for diagnosis and detection of broken bar in induction motor at low slip using fuzzy logic. In Proceedings of the 8th IEEE Symposium on Diagnostics for Electrical Machines, Power Electronics & Drives, Bologna, Italy, 5–8 September 2011; pp. 511–516. [Google Scholar]
  32. Zhang, W.; Jia, M.; Zhu, L.; Yan, X. Comprehensive Overview on Computational Intelligence Techniques for Machinery Condition Monitoring and Fault Diagnosis. Chin. J. Mech. Eng. 2017, 30, 782–795. [Google Scholar] [CrossRef] [Green Version]
  33. Lee, J.-H.; Pack, J.-H.; Lee, I.-S. Fault Diagnosis of Induction Motor Using Convolutional Neural Network. Appl. Sci. 2019, 9, 2950. [Google Scholar] [CrossRef] [Green Version]
  34. Elvira-Ortiz, D.A.; Morinigo-Sotelo, D.; Zorita-Lamadrid, A.L.; Osornio-Rios, R.A.; Romero-Troncoso, R.J. Genetic Algorithm Methodology for Broken Bar Detection in Induction Motor at Low Frequency and Load Operation. In Proceedings of the 2019 IEEE 12th International Symposium on Diagnostics for Electrical Machines, Power Electronics and Drives (SDEMPED), Toulouse, France, 27–30 August 2019. [Google Scholar]
  35. Rao, S.S. Engineering Optimization Theory and Practice, 4th ed.; John Wiley & Sons Inc.: Hoboken, NJ, USA, 2009; pp. 694–702. [Google Scholar]
  36. Mojiri, M.; Karimi-Ghartemani, M.; Bakhshai, A. Estimation of Power System Frequency Using an Adaptive Notch Filter. IEEE Trans. Instrum. Meas. 2007, 56, 2470–2477. [Google Scholar] [CrossRef]
  37. Karimi, H.; Karimi-Ghartemani, M.; Iravani, M.R. Estimation of frequency and its rate of change for applications in power systems. IEEE T Power Deliver 2004, 19, 472–480. [Google Scholar] [CrossRef]
  38. Zhang, Y.; Martínez-García, M.; Kalawsky, R.S.; Latimer, A. Grey-box modelling of the swirl characteristics in gas turbine combustion system. Measurement 2020, 151, 107266. [Google Scholar] [CrossRef]
  39. Zhang, Y.; Martinez-Garcia, M.; Latimer, A. Selecting Optimal Features for Cross-Fleet Analysis and Fault Diagnosis of Industrial Gas Turbines. In ASME Turbo Expo 2018: Turbomachinery Technical Conference and Exposition; American Society of Mechanical Engineers Digital Collection: Oslo, Norway, 2018. [Google Scholar]
Figure 1. Flow diagram of the Genetic algorithm (GA).
Applsci 10 04160 g001
Figure 2. Block diagram of the proposed methodology.
Applsci 10 04160 g002
Figure 3. Spectrum for the motor current operating at 31 Hz using (a) Motor current signature analysis (MCSA) at high load, (b) MCSA at medium load, (c) MCSA at low load, (d) Notch filter (NF) and MCSA (NF-MCSA) at high load, (e) NF-MCSA at medium load, (f) NF-MCSA at low load, (g) Genetic algorithm (GA) and MCSA (GA-MCSA) at high load, (h) GA-MCSA at medium load, and (i) GA-MCSA at low.
Applsci 10 04160 g003
Figure 4. Boxplots for the amplitude results of the left side harmonic (LSH) at 31 Hz for the (a) common MCSA technique, (b) NF-MCSA technique, and (c) GA-MCSA technique.
Applsci 10 04160 g004
Figure 5. Spectrum for the motor current operating at 20 Hz using (a) MCSA at high load, (b) MCSA at medium load, (c) MCSA at low load, (d) NF-MCSA at high load, (e) NF-MCSA at medium load, (f) NF-MCSA at low load, (g) GA-MCSA at high load, (h) GA-MCSA at medium load, and (i) GA-MCSA at low load.
Applsci 10 04160 g005
Figure 6. Boxplots for the amplitude results of the LSH at 20 Hz for the (a) common MCSA technique, (b) NF-MCSA technique, and (c) GA-MCSA technique.
Applsci 10 04160 g006
Table 1. Intra-cluster distance for the amplitudes of the LSH.
Frequency D i n t r a   ( MCSA ) D i n t r a   ( NF - MCSA ) D i n t r a   ( GA - MCSA )
s = 2 % s = 4 % s = 6 % s = 2 % s = 4 % s = 6 % s = 2 % s = 4 % s = 6 %
31 Hz3.8 × 10−35.0 × 10−34.7 × 10−42.0 × 10−31.1 × 10−33.2 × 10−32.5 × 10−42.9 × 10−48.0 × 10−4
20 Hz1.8 × 10−33.0 × 10−31.2 × 10−23.6 × 10−32.4 × 10−31.7 × 10−41.7 × 10−31.6 × 10−32.4 × 10−4
Table 2. Inter-cluster distance for the amplitudes of the LSH.
Frequency(MCSA)(NF-MCSA)(GA-MCSA)
D 24 i n t e r D 46 i n t e r D 24 i n t e r D 46 i n t e r D 24 i n t e r D 46 i n t e r
31 Hz3.3 × 10−25.0 × 10−32.4 × 10−21.1 × 10−21.4 × 10−21.6 × 10⁻²
20 Hz7.1 × 10−24.6 × 10−33.0 × 10−33.9 × 10−31.1 × 10−29.6 × 10⁻³
Table 3. Computational cost and acquisition time comparison.
TechniqueComputational Cost (Seconds)Acquisition Time (Seconds)
MCSA1.00420
NF-MCSA1.52010
GA-MCSA10.75210

