Article

Use of Response Surface Methodology to Investigate the Effects of Sodium Chloride Substitution with Potassium Chloride on Dough’s Rheological Properties

by
Andreea Voinea
,
Silviu-Gabriel Stroe
* and
Georgiana Gabriela Codină
*
Faculty of Food Engineering, Stefan cel Mare University of Suceava, 720229 Suceava, Romania
*
Authors to whom correspondence should be addressed.
Appl. Sci. 2020, 10(11), 4039; https://doi.org/10.3390/app10114039
Submission received: 22 May 2020 / Revised: 4 June 2020 / Accepted: 8 June 2020 / Published: 11 June 2020

Abstract

:
Bakery products are one of the main sources of dietary sodium intake of the world’s population. During the last decade, sodium intake has increased worldwide and nowadays the World Health Organization recommends reducing sodium intake by up to 2 g Na/day. KCl is the leading substitute for reducing sodium in bakery products. Therefore, the main purpose of our study was to investigate the impact of sodium reduction on dough’s rheological properties by reformulating the dough recipe using two types of salts, namely NaCl and KCl, with different amounts added to wheat flour. In order to establish their combination for obtaining the optimum rheological properties of dough, the response surface methodology (RSM) by the Design Expert software was used. The effect of combined NaCl and KCl salts were made on mixing, viscometric and fermentation process by using Farinograph, Extensograph, Amylograph and Rheofermentometer devices. On dough’s rheological properties, KCl and NaCl presented a significant effect (p < 0.01) on water absorption, stability, energy, dough resistance to extension, falling number and all Rheofermentometer-analyzed values. Mathematical models were achieved between independent variables, the KCl and NaCl amounts, and the dependent ones, dough rheological values. The optimal values obtained through RSM for the KCl and NaCl salts were of 0.37 g KCl/100 g and 1.31 g NaCl/100 g wheat flour, which leads to a 22% replacement of NaCl in the dough recipe.

1. Introduction

A high dietary sodium intake may lead to cardiovascular, bone demineralization and cancer diseases [1,2]. According to the American Heart Association, the cardiovascular diseases are the leading cause of mortality globally [3]. The close association between hypertension values and sodium intake is an important issue from a public health perspective. Nowadays, the World Health Organization (WHO) recommends to not exceed a sodium consumption of 5 g per day [4] and wants to reduce sodium intake up to 2 g Na/day [5]. In addition to the beneficial effects on health, sodium reduction also contributes to an annual decrease of medical expenditures [6]. Bread is considered worldwide to be an essential food for human nutrition. However, it might represent an important source of sodium intake. The increased consumption of bakery products increases the risk of diseases associated with sodium consumption [7,8]. The sodium sources in bakery products are provided by ingredients such as sodium bicarbonate, a baking agent, widely used in baking and sodium chloride (NaCl) which is one of the main ingredients used in the bakery manufacturing process [9]. The sodium chloride additions in bakery recipe are very important from a technological point of view [10]. Its reduction may lead to negative effects on technological process of bakery products and the quality of the finished products [7,11,12,13]. From the technological point of view, the sodium chloride addition increases dough strength and stability, its capacity to retain gases and, at low levels, yeast activity [7,10]. To bakery products, NaCl increases the shelf-life, due to the inhibition effect on microbial growth, and it improves bread texture and its sensory properties [12,13]. Due to the effect of sodium chloride on the technological process and the quality of the bakery products, its substitution in order to reduce the sodium content from the bakery products it is a problematic issue. Previous studies have shown that the potassium chloride (KCl) is the leading substitute for reducing sodium in bakery products [9,10,14,15,16]. Potassium chloride is a natural ingredient obtained from rock and sea salts with extraction methods similar to those of sodium chloride. The effect of potassium chloride consumption in the human diet is associated with a low risk of high blood pressure and other diseases associated with it, the effect being contrary to the intake of sodium chloride [17,18]. It has a salty taste but with metallic and bitter after tastes when high levels are incorporated in bakery recipes [19]. Therefore, the complete replacement of sodium chloride in bakery products it is not recommended. Its use in food products may only be in combination with sodium chloride in order to obtain products of a high quality [10,15]. Reducing sodium by replacing it with potassium chloride has to be done gradually because of its influence on technological process and quality of the bakery products [4]. The Response Surface Methodology (RSM) has been used in several food-related papers and applications. In the literature, some applications of RSM to flour, dough and bread, demonstrate its effectiveness. In particular, Cappelli et al. (2020) developed optimization charts regarding the milling process of wheat and for flour characterization [20]. Moreover, Cappelli et al. (2018) published predictive models of the rheological properties of doughs specifically developed with RSM [21]. The aim of this study was to analyze the effect of partial sodium chloride substitution with potassium chloride on the technological process of the bakery products. For this purpose, we used KCl and NaCl in different combinations by using response surface methodology (RSM) in order to analyze their effect on dough’s rheological properties and to obtain their optimum formulation from the technological point of view.

2. Materials and Methods

2.1. Materials

Refined wheat flour (harvest 2019) was providing by the S.C Mopan S.A. (Suceava, Romania). The NaCl and KCl were purchased from the Romania market. A high-quality wheat flour was used. This is confirmed by the characteristics analyzed by the Romanian and international standard methods: 0.65 g/100 g ash (ICC 104/1), 14.0 g/100 g moisture (ICC 110/1), gluten deformation index 6 mm (SR 90:2007), 12.67 g/100 g protein (ICC 105/2), wet gluten 30 g/100 g (ICC106/1), falling number 442 s (ICC 107/1) [22].

2.2. Dough’s Rheological Properties during Mixing and Extension

In order to analyze dough rheological properties during mixing a Farinograph device (Brabender, Duigsburg, Germany, 300 g capacity) was used. The dough’s rheological properties during extension were analyzed using the Extensograph device (Brabender, Duigsburg, Germany). The Farinograph values analyzed through the ICC method 115/1 were water absorption (WA), dough stability (ST), dough development time (DDT) and degree of softening at 10 min (DS). The Extensograph values analyzed through the ICC method 114/1 were resistance to extension (R50), maximum resistance to extension (Rmax), energy (E) and ratio number (R/E) at a proving time of 135.

2.3. Dough Viscometric Rheological Properties

In order to analyze the dough viscometric rheological properties, Amylograph (Brabender OGH, Duisburg, Germany) and Falling Number (Perten Instruments AB, Sweden) devices were used. Amylograph trials were performed according to the ICC method 126/1: gelatinization temperature (Tg), temperature at peak viscosity (Tmax) and peak viscosity (PVmax). With respect to falling number trials, the ICC method 107/1 was applied.

2.4. Dough’sRheological Properties during Fermentation

The dough rheological properties during fermentation were determined by using a Rheofermentometer device (Chopin Rheo, type F3, Villeneuve-La-Garenne CEDEX, France). The fermentation parameters analyzed according to the AACC method 89-01.01. were maximum height of gaseous production (H’m), volume of the gas retained in the dough at the end of the test (VR), total CO2 volume production (VT) and retention coefficient (CR).

2.5. Experimental Design and Statistical Analysis

In order to analyze the simultaneous effects of the KCl and NaCl amounts on the rheological properties of the wheat flour dough, the response surfaces methodology (RSM) was used. RSM has important application in the design, development and formulation of new products, to optimize the formulations factors [23,24,25] or to determine the optimum conditions for the process [26], showing the effect of the factors on the responses. Results optimization by the RSM method involved three main steps: the statistical design of the experiment, determination of the mathematical model coefficients and finally, prediction of the responses and checking the adequacy of the mathematical model within the design of the experiment (DOE) using the Design Expert software, trial version 12 (Stat-Ease, Inc., Minneapolis, MN, USA). For this study, two independent variables were chosen as follows: the influence of the variations of the potassium chloride amount (A = X1) and sodium chloride (B = X2) on the rheological parameters (dependent variables) of wheat flour dough. The experimental designs, with the real and coded values of the independent variables, are shown in Table 1.
The rheological parameters determined by the Farinograph were WA—water absorption (Y1); DT—development time (Y2); ST—stability of dough (Y3); DS—degree of softening (Y4). The rheological parameters determined to Extensograph were: E—Energy (Y5); R50—resistance to extension up to 50 mm (Y6); Rmax—maximum resistance (Y7); R/E—(Y8). Moreover, the Falling Number index values (Y9) have been determined. The rheological parameters determined by the Amylograph were Tg—gelatinization temperature (Y10); PVmax—peak viscosity (Y11); Tmax—temperature at peak viscosity (Y12), H’m—height under constraint of dough at maximum development time (Y13), VT—total volume of CO2 produced during fermentation (Y14), VR—volume of the gas retained in the dough at the end of the test (Y15) and CR—retention coefficient (Y16). In order to minimize the measurement errors of the experimental data, the rheological values obtained for the wheat flour samples with different levels of KCl and NaCl addition according to our experimental design were carried out twice. In the statistical processing, their average values were used.
The predicted responses of the system (Y1n) (Equation (1)) in factorial screening experiments have been defined by a mathematical model:
Y = f ( X 1 , X 2 ) = β o + i = 1 n β i X i + i = 1 n 1 j = i + 1 n β i j X i X j + i = 1 n β i i X i 2 + ε
where βo is the constant coefficient; βi is the linear coefficient; βij is the interaction coefficient; βii is the quadratic coefficient; n is the number of factors studied and optimized in the experiment; Xi and Xj are the coded values of the independent variables and ε is the residual associated with the experiment. The residuals associated with the experiment were used to calculate the standard deviation values for each dependent variable. The significance of the model terms is evaluated by ANOVA, which performs a comparison of the variation in the response with the variation due to random error, at the probability value (p-value) of 95%. The suitability of the mathematical models has been checked by the F-tests and for the accuracy of the fitted polynomial equation was determined by adjusted coefficient of determination (Adjusted R2). The non-significant coefficients were eliminated from the polynomial equations. In order to illustrate the dependence between the dependent and the independent variables, the three-dimensional graphical representation of the response surfaces was made.

3. Results and Discussion

3.1. Fitting Models

Following the statistical processing of the experimental data regarding the effects of independent variables on the predictive models for dough’s rheological properties during the mixing of KCl–NaCl mixtures, the most fitting models (quadratic models)were obtained for the following parameters: water absorption (WA), dough development time (DT), dough stability (ST), degree of softening at 10 min (DS), the Falling Number value (FN), peak viscosity (PVmax), temperature at peak viscosity (Tmax), height under constraint of dough at maximum development time (H’m), total volume of CO2 produced during fermentation (VT), volume of the gas retained in the dough at the end of the test (VR) and retention coefficient (CR).

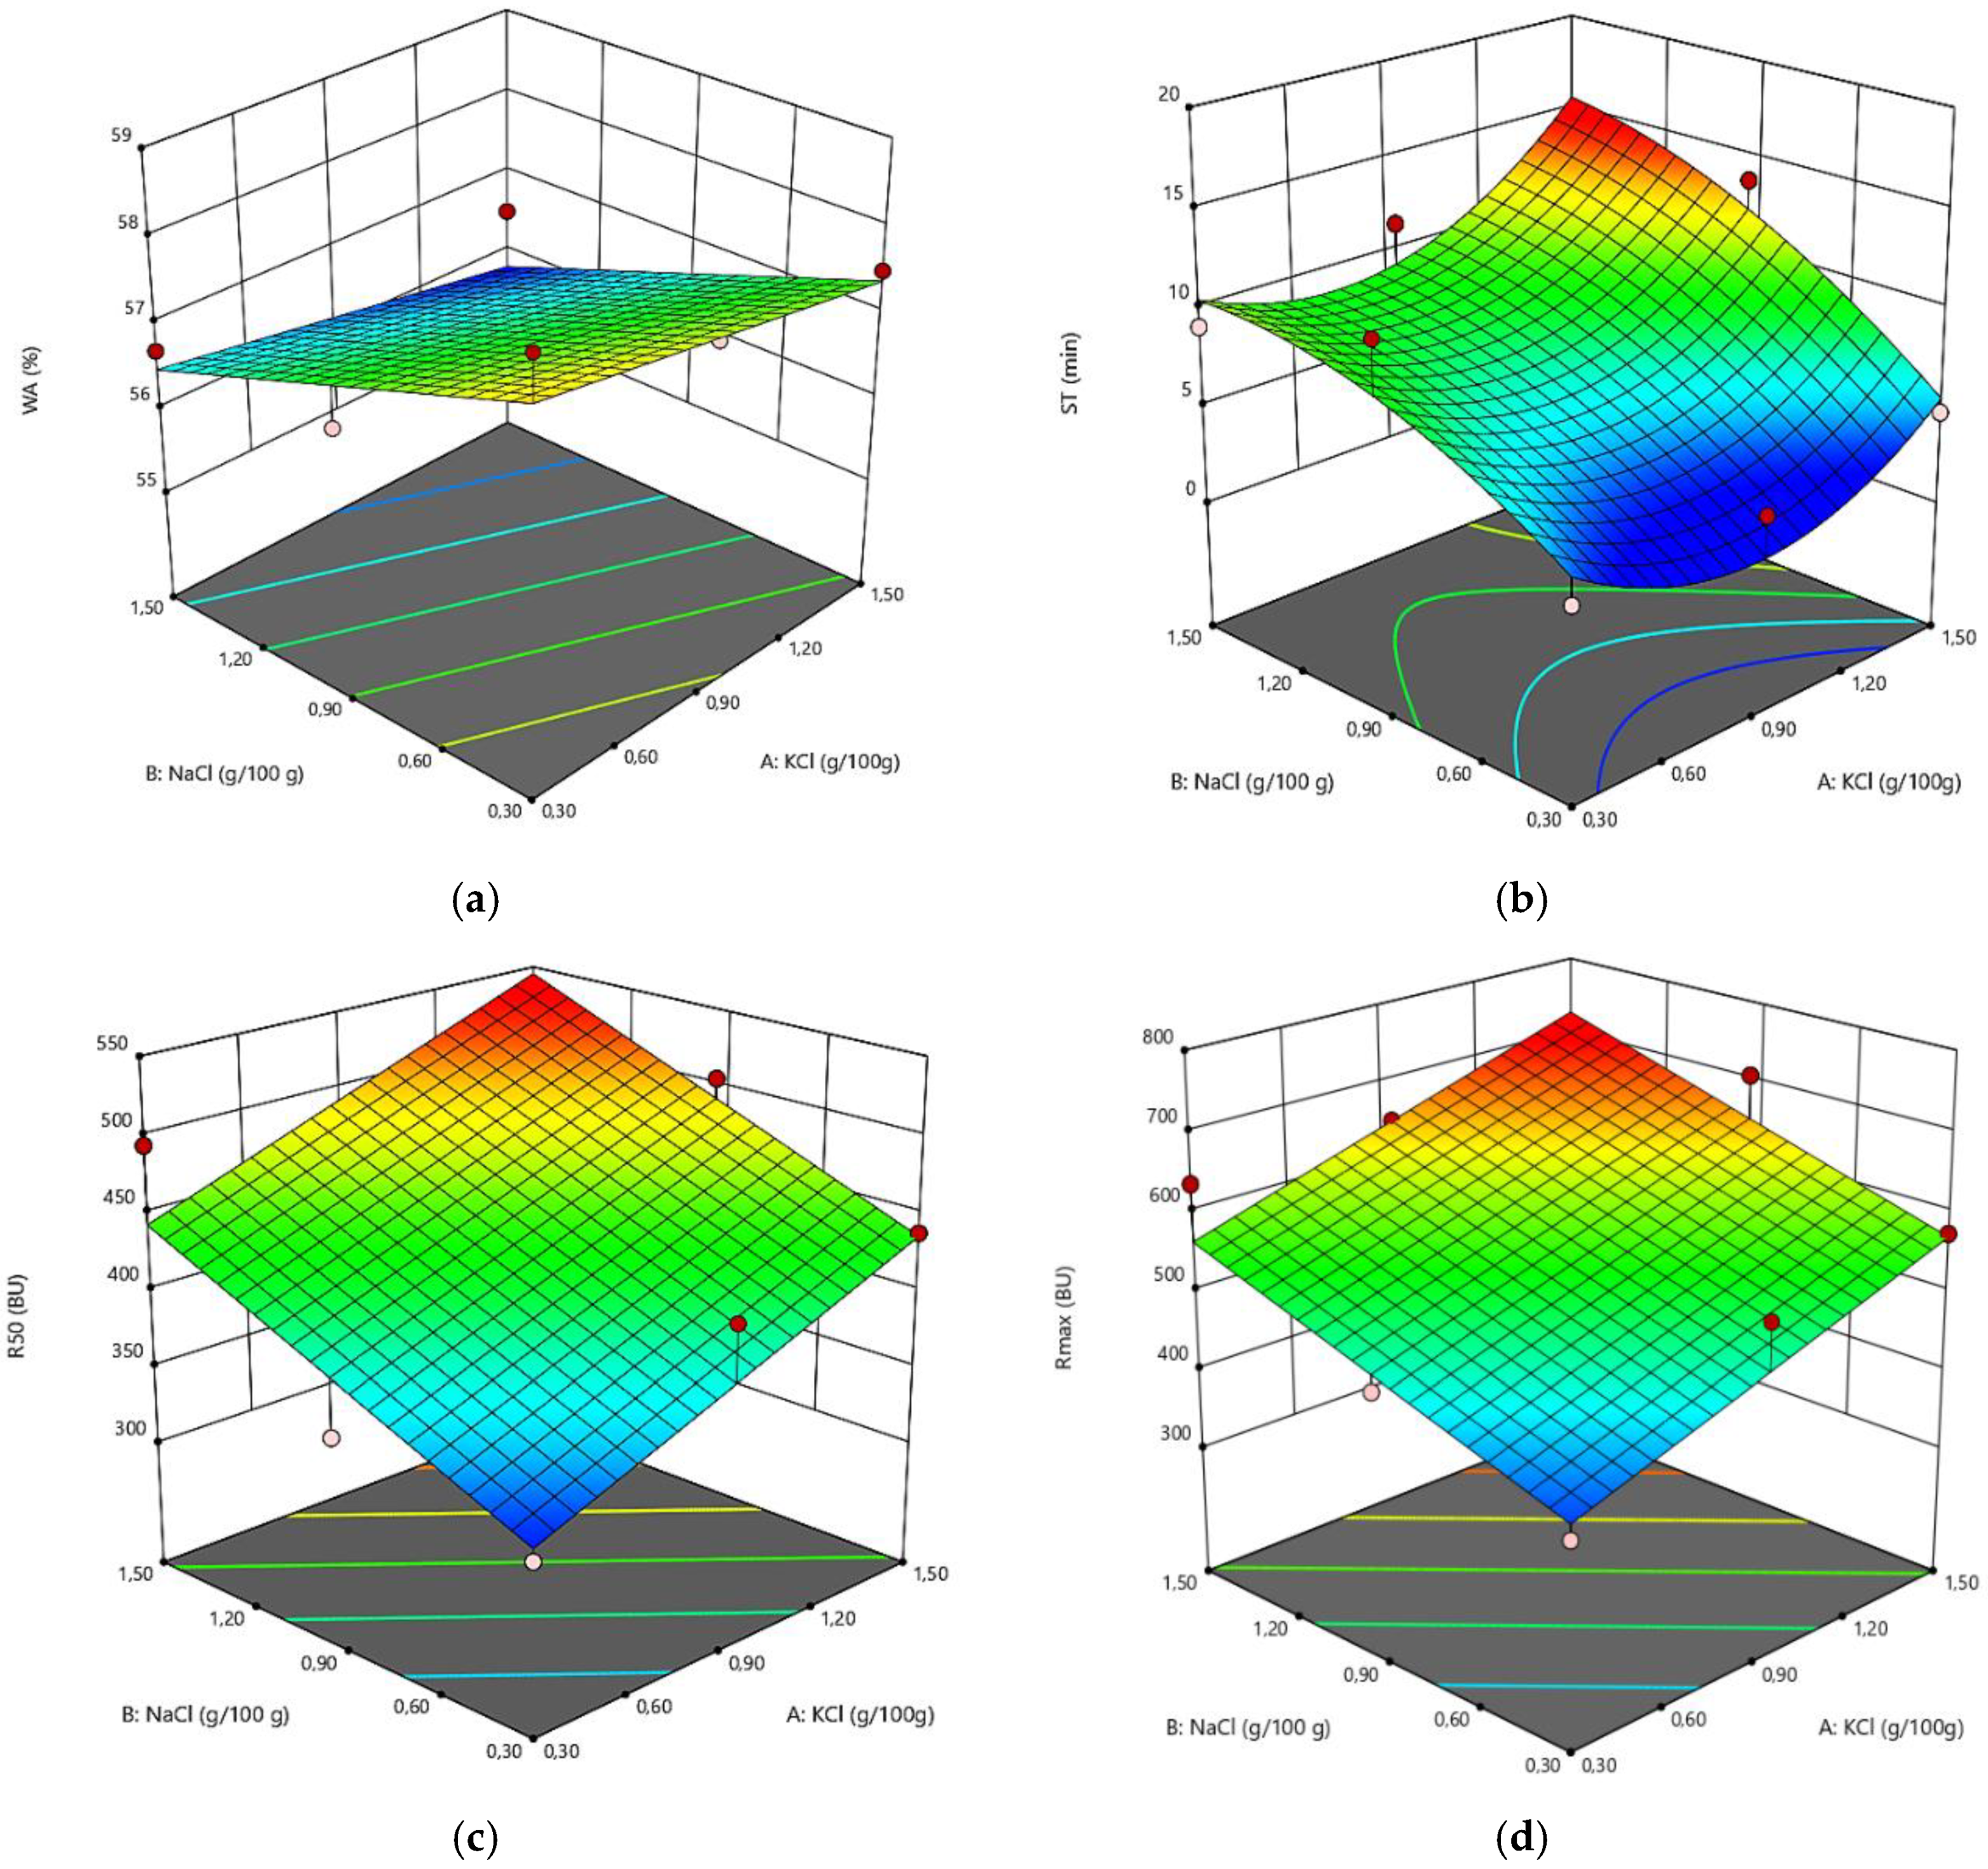
3.2. The Mixing and Extension Rheological Properties for the Mixes Samples

Applying the ANOVA method to the mixing and extension values, it was observed that KCl has a significant effect (p < 0.01) on the rheological parameters as E, R50, Rmax, R/E, Tg, H’m, VT, VR, CR, while NaCl has a significant effect (p < 0.01) on WA, ST, E, R50, Rmax, R/E, PVmax, H’m, VT, VR.
As seen Figure 1a, both types of salt led to a significantly decreased (p < 0.01) WA value. This may be due to the fact that, in the presence of salt ions, the electrostatic repulsions between gluten molecules are reduced as a consequence of their ability to partially shield the present charges between molecules. Thus, the gluten proteins aggregate in a higher extent due to the increased level of hydrophobic interactions between molecules fact that leads to a decrease of the water uptake ability [2].
From the two types of chloride salts it seems that NaCl presented a higher significant effect (p < 0.01) on WA value than KCl salt (p < 0.01). These results were similar with those reported by Tuhumury et al. [27] and Jeckle et al. [2], which concluded that the intensity of chloride salts on WA value depends on cation position in Hofmeister series K+ being positioned before Na+. A decrease of WA value with the increase of the salt level addition has also been reported by different researchers [5,9,28,29,30].
The graphical representation of the dough stability (ST) value in relation with the level of KCl and NaCl addition is shown in Figure 1b. This figure shows that there was a significant increase (p < 0.01) of this value with the addition of both independent variables. This indicates a strengthening effect of chloride salts on wheat dough. Gluten proteins present a surface hydrophobicity and contain almost 35% hydrophobic amino acids, which promotes a protein aggregation in a more extensive way when chloride salts are incorporated [9], leading to a higher dough stability. A significant increase of dough stability with the addition of chloride salts in wheat flour has also been reported by different researchers [2,11,31,32].
The effects of chloride salts on the Extenograph parameters curve are similar. According to Tuhumury et al. [27], this may be due to the fact that Na+ and K+ are situated nearby in the Hofmeister series and, that way, they exhibit similar effects on wheat dough properties. All the models for the Extenograph values were linear. Both independent variables presented a significant positive effect (p < 0.01) on energy (E), resistance to extension (R50), maximum resistance to extension (Rmax) and ratio number (R/E). The effects of chloride salts on Extensograph values are related to their effect on gluten proteins. Their strengthen effect on dough due to the increase amount of hydrophobic interactions between molecules conducted to an increase value of E, Rmax, R50 and R/E. These results were similar with those reported by McCann and Day [28], Miller and Hoseney [9], Tuhumury et al. [27], and Ortolan et al. [33], which concluded that chloride salts increased the resistance to extension, as seen in Figure 1c,d.

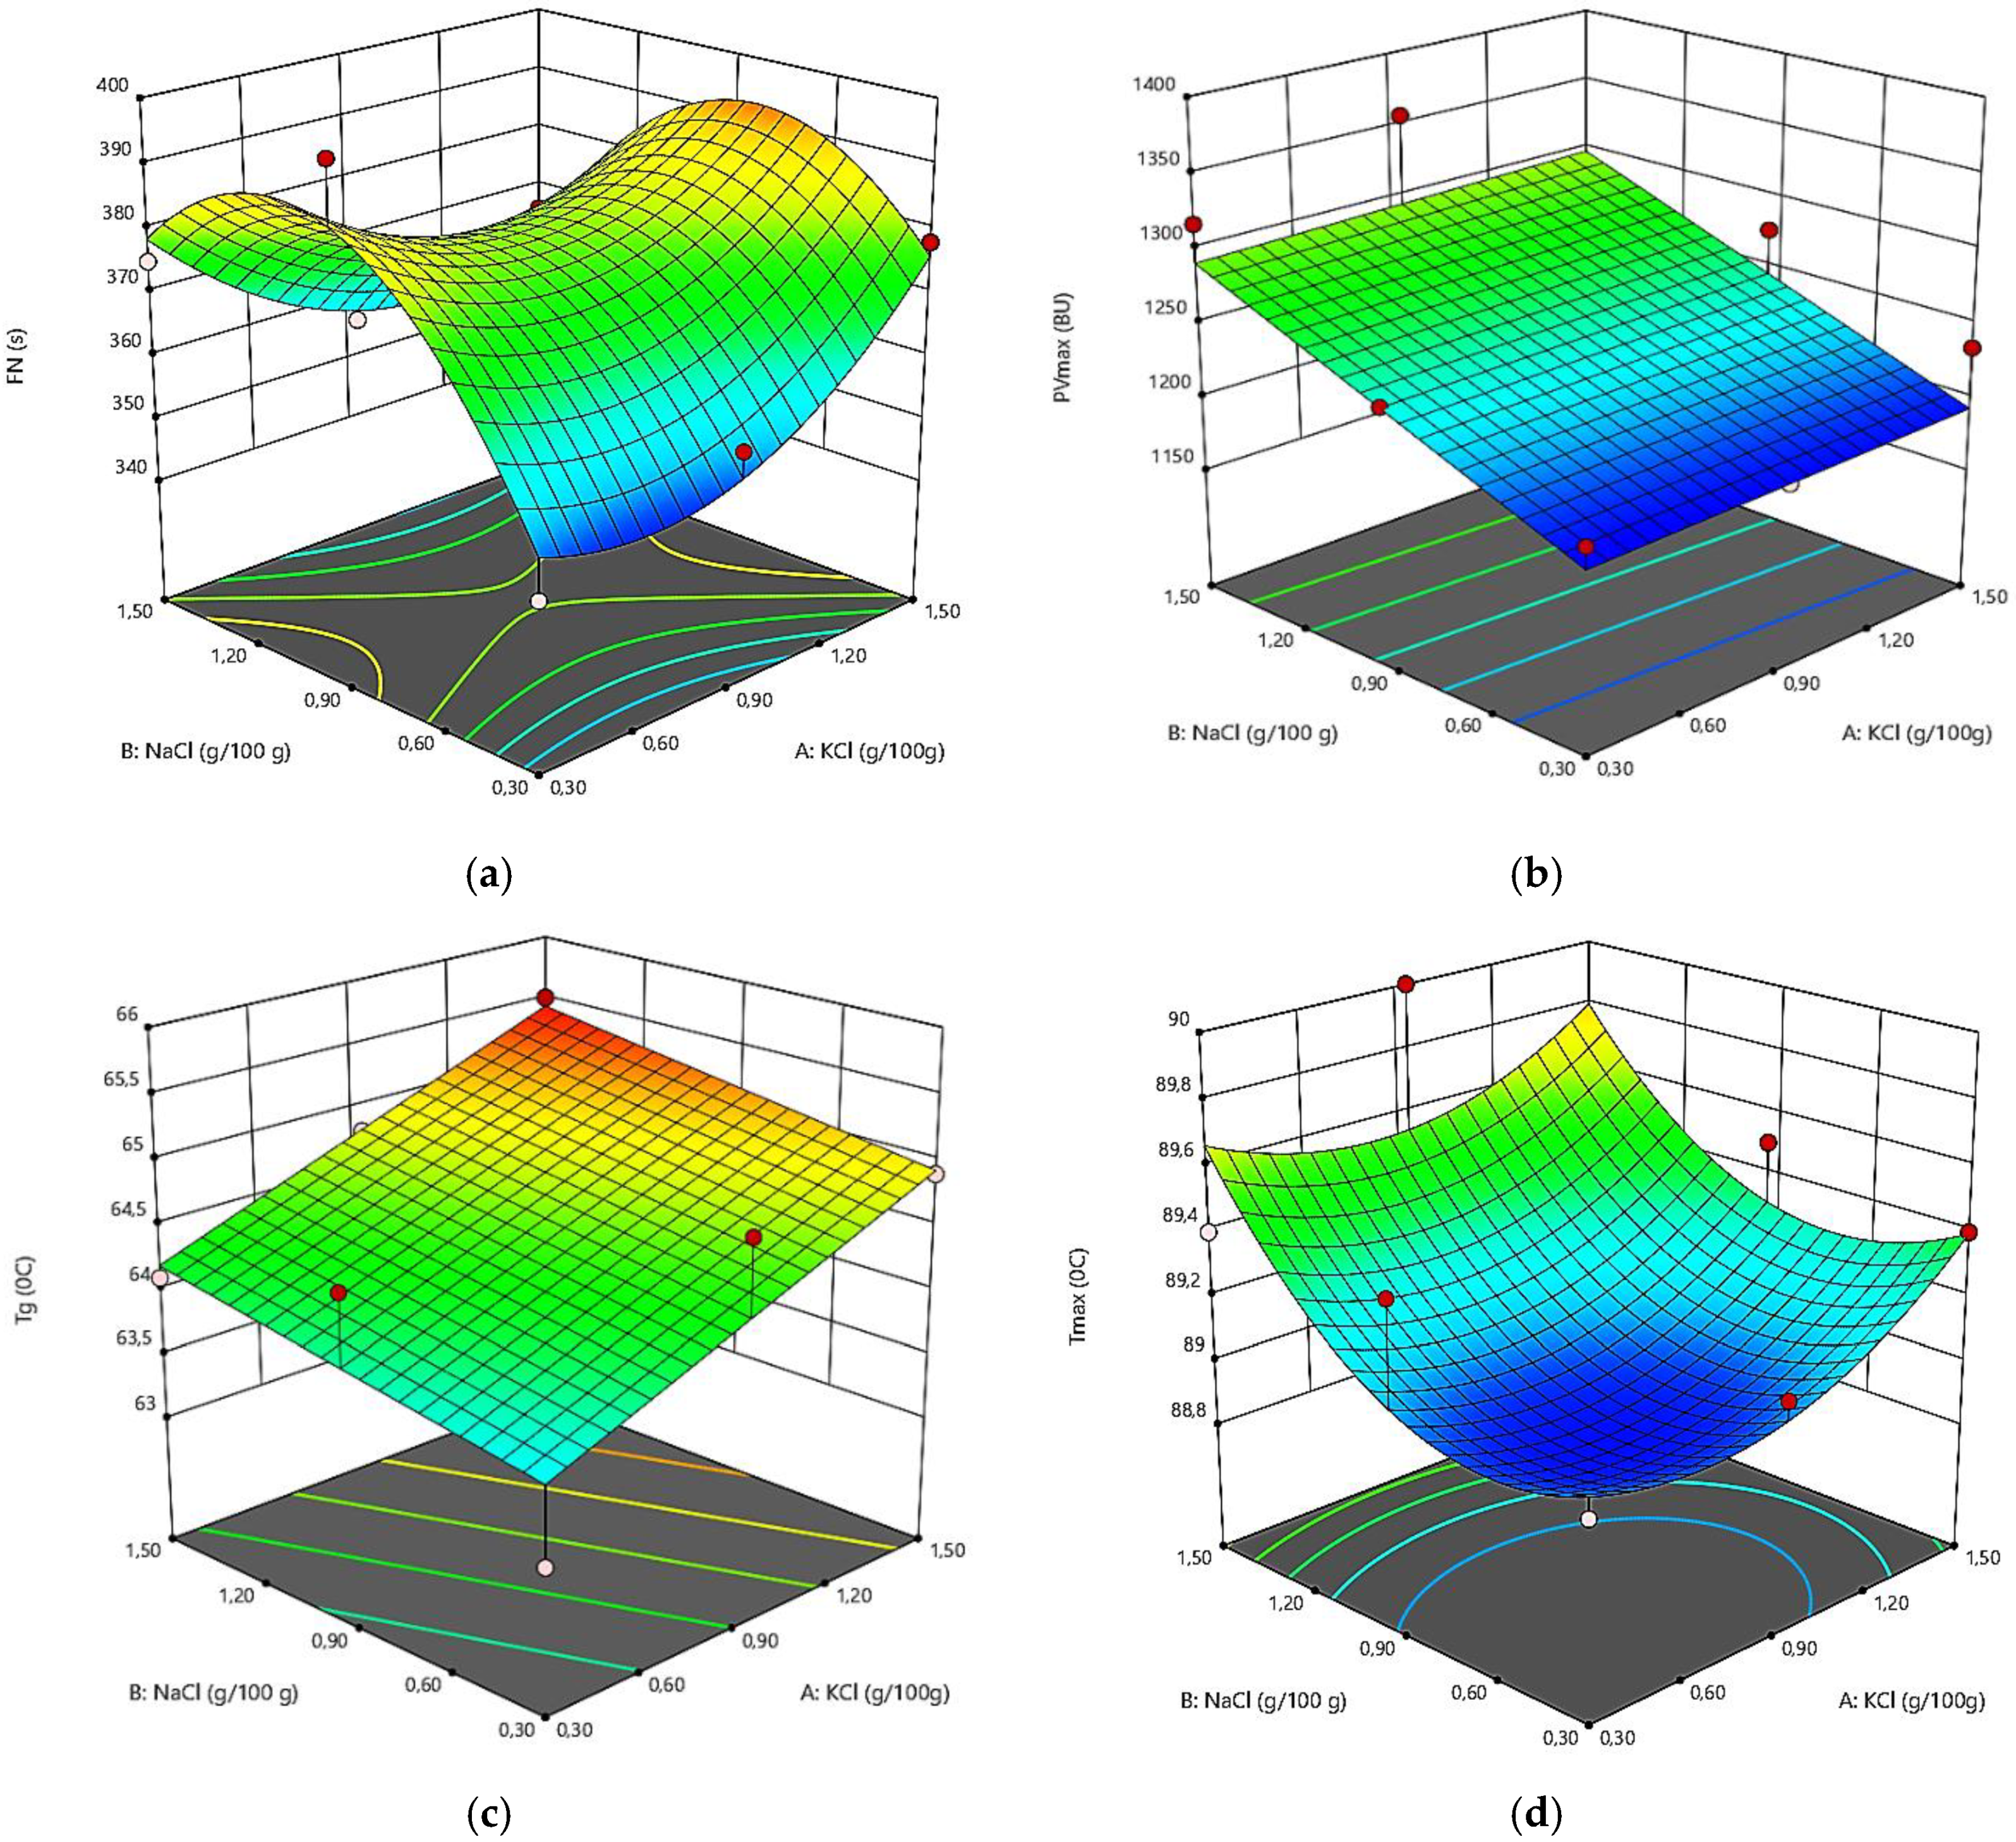
3.3. The Viscometricrheological Properties of the SampleMixes

The effect of NaCl and KCl addition in wheat flour on dough’s viscometric properties, expressed as their corresponding regression coefficients and models, are shown in Table 2. From model analysis, the most significant models were those for quadratic model (Adjusted R2 = 0.82), Falling Number value (FN), followed by those for quadratic model (Adjusted R2 = 0.63), peak viscosity (PVmax) and 2FI model (Adjusted R2 = 0.63) for gelatinization temperature (Tg) which was less significant (Table 3).
No significant model was obtained for Tmax. Similar results were reported by Samutsri and Suphantharika [34], who concluded that different types of chloride salts did not presented any significant effect on pasting temperature on starch from rice. A positive effect on all viscometric properties was provided by the linear regression coefficients, suggesting that the increase in levels of NaCl and KCl addition in wheat flour will lead to an increase in the viscometric values, as seen in Figure 2.
The increase of the FN and PVmax values with the increase of the NaCl and KCl addition (Figure 2a,b) may be due to the action of chloride salts on the protein part from the amylases structure. This fact reduces the activity of these enzymes with influence on the dough’s rheological properties.
Previous studies have shown that, in the optimal range of pH activity of amylases, the chloride salts favor their activity in dough system, whereas outside of the pH range, it reduced its activity due to the shielding effect of the reactive groups of enzymes by the ions from the system as H+, Na+, K+, Cl [35]. In general, wheat flour has a pH between 6.0–6.8, making its lightly acidic and even close to the neutral pH value. Chloride salts presents an alkaline pH. Therefore, a mix between chloride salts and wheat flour will lead to higher pH values. In Amylograph and Falling Number methods, wheat flour is mixed with distillated water with a pH value around 7.00 and different levels of chloride salts. Therefore, the mixes formed of wheat flour, distillated water and chloride salts will present pH values outside the optimal range of pH amylases activity which is around a value of 5.2 ÷ 5.4 [36]. Due to the alkaline pH of chloride salts, the pH mixes analyzed to Amylograph and Falling Number will be even more outside of the optimal range of amylase activity with the increase level of chloride salts addition. Therefore, the amylases activity from the mixes from wheat flour, distillated water and chloride salts will decrease with the increase level of chloride salts addition. This fact leads to an increase in PVmax to the Amylograph device and to FN value to the Falling Number device which expresses α-amylase activity [37,38].
For the Tg value, a positive effect was provided by KCl and NaCl, as seen in Figure 2c, these data being similar with those reported by different researchers [39,40,41]. This behavior is due to the fact that these types of chloride salts decreased solubility of hydrophobic chains and enhanced water structure. When NaCl and KCl are incorporated in wheat flour dough it decreases water activity and increases the energy for physical and chemical reactions which involves water, delaying the starch gelatinization process [5,40].

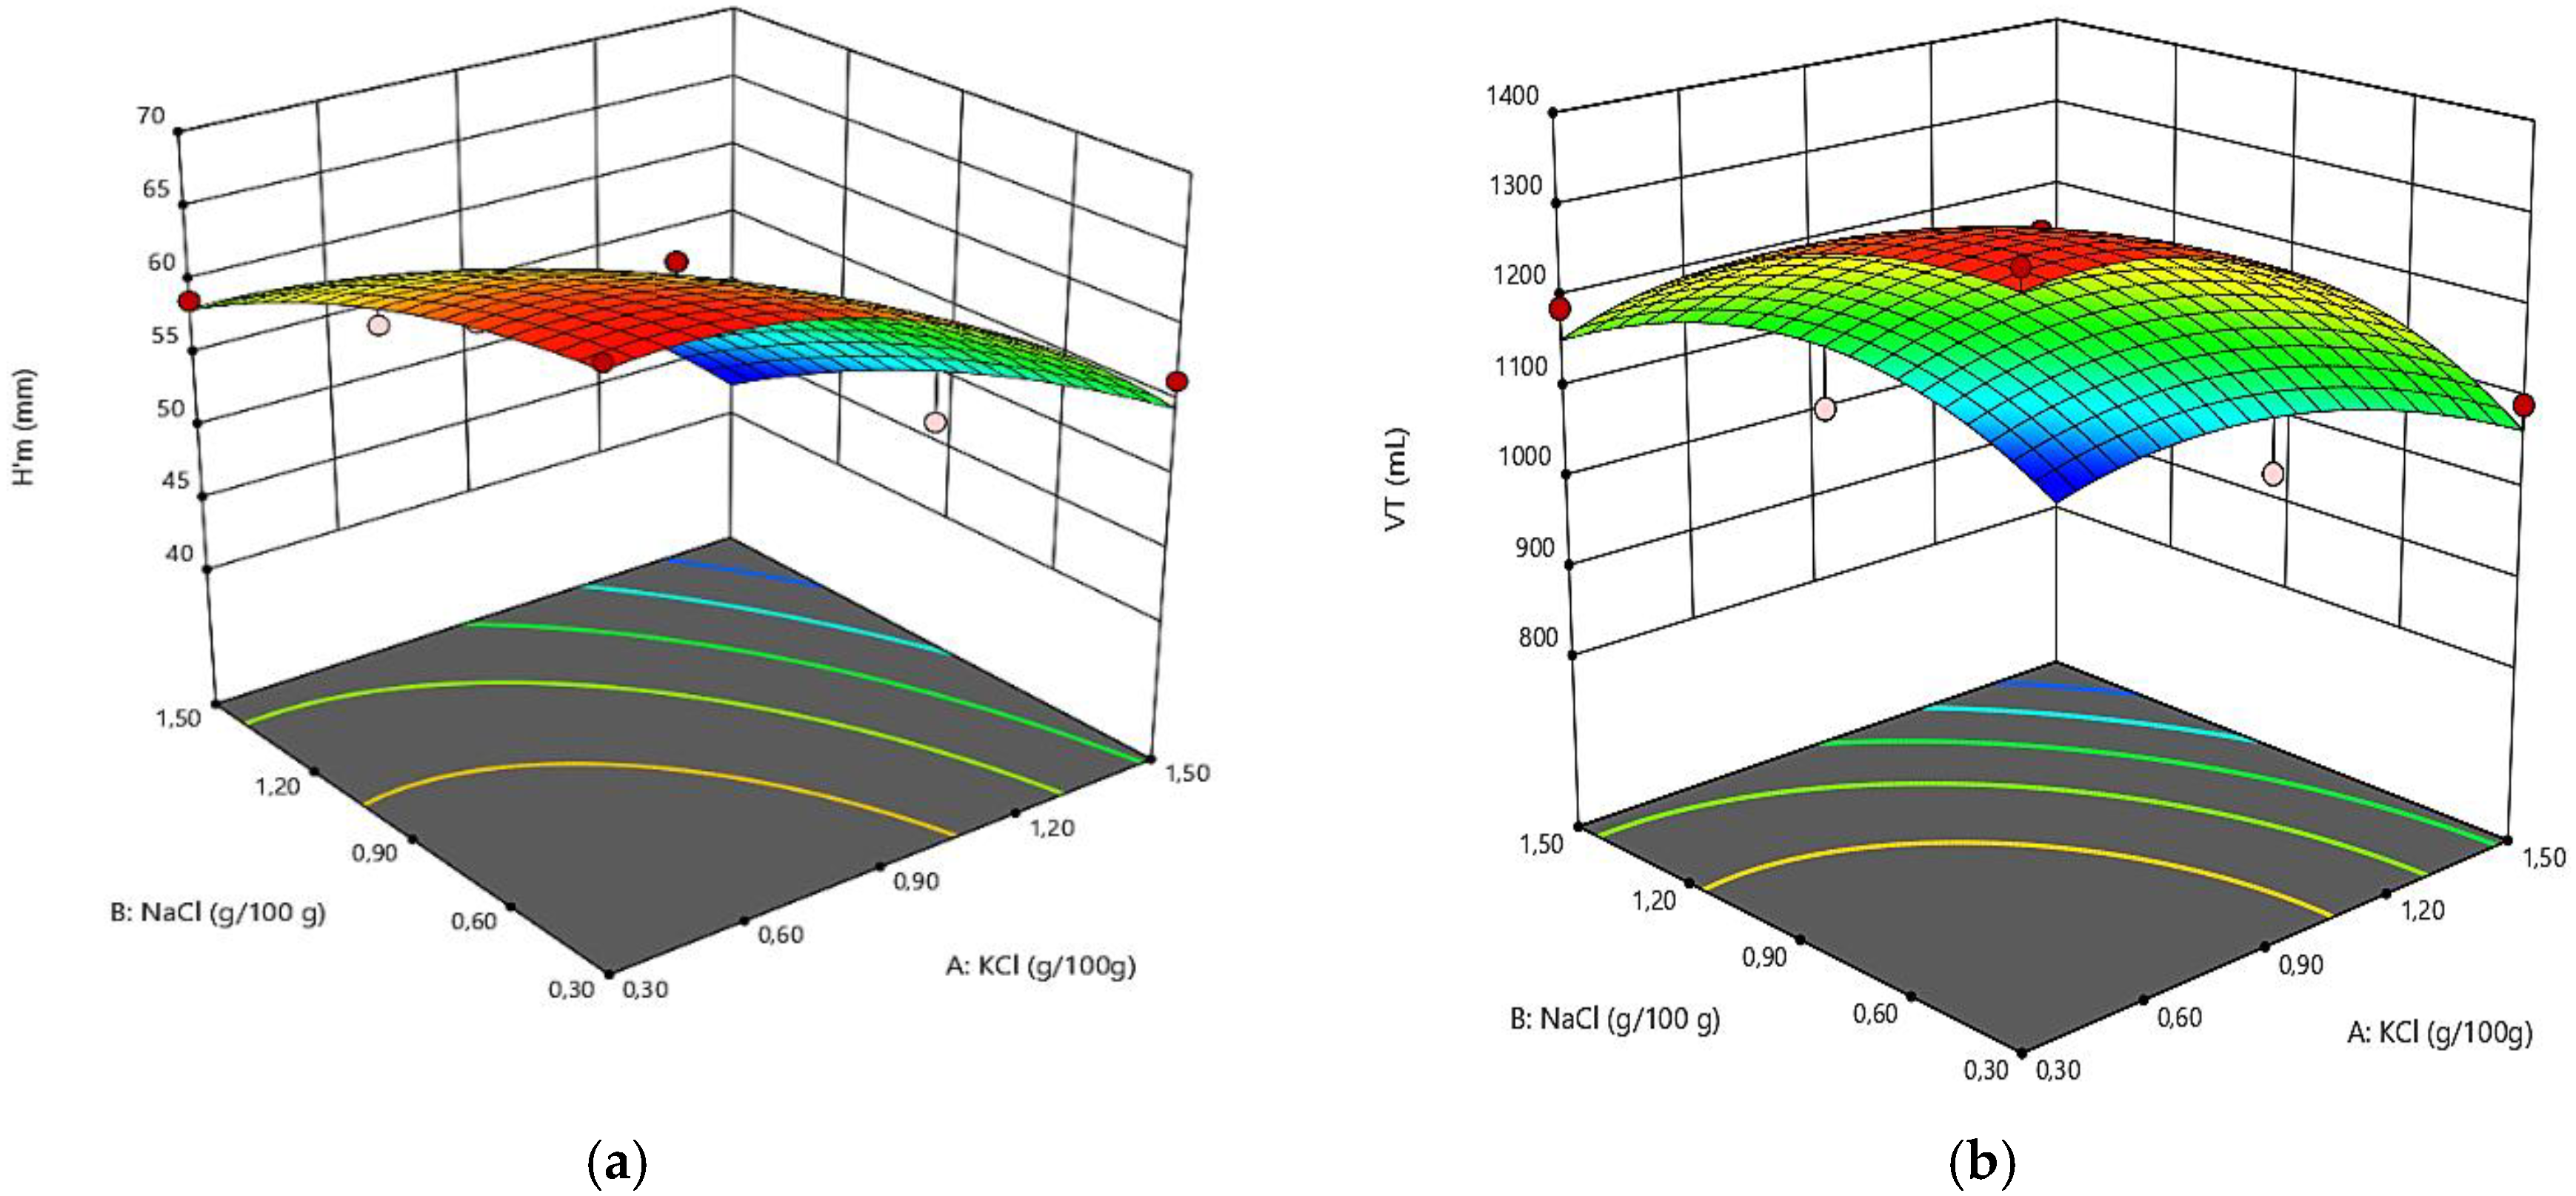
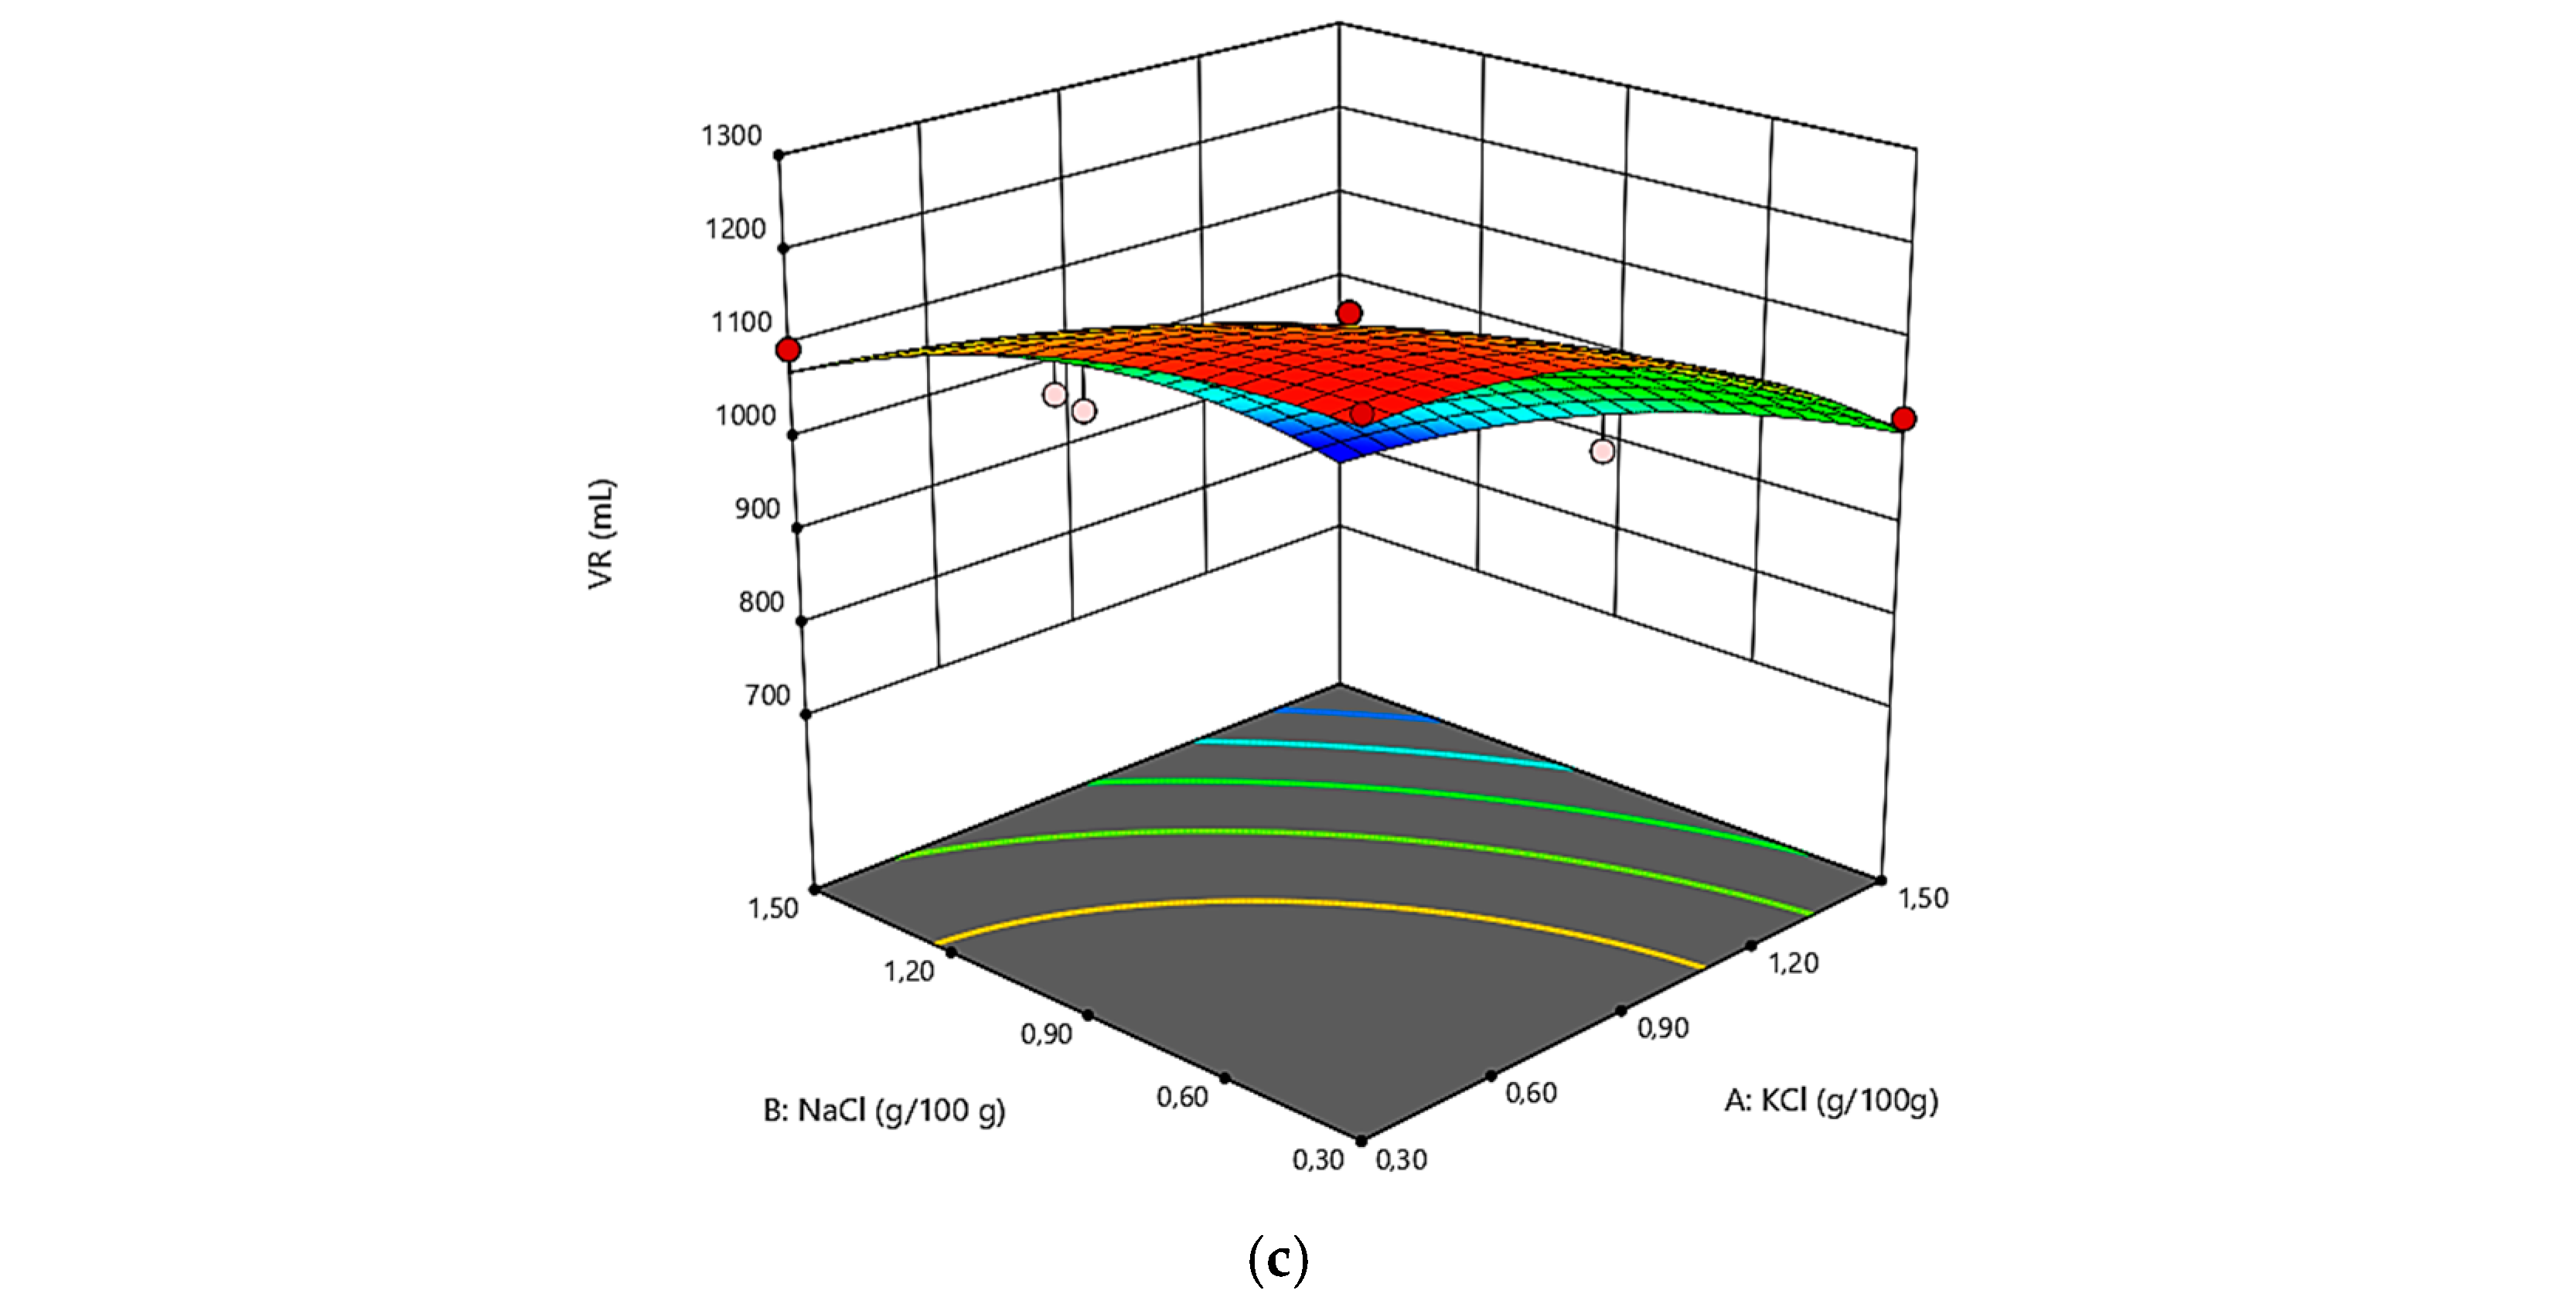
3.4. The Fermentation Rheological Properties of the Mixes Samples

All the dependent variables analyzed through Rheofermentometer parameters were significantly affected (p < 0.01) by the levels of NaCl and KCl addition in wheat flour. Quadratic models (Table 3) for Rheofermentometer values showed a significant effect of the linear terms of NaCl and KCl, with a highly coefficient of determination (R2) which varies mostly between 0.70 to 0.91.
The contour plots from Figure 3 for the Rheofermentometer values showed that the maximum height of gaseous production (H’m), total CO2volume production (VT) and volume of the gas retained in the dough at the end of the test (VR) significantly decreased (p < 0.01) with an increase in KCl and NaCl levels in wheat flour. The retention coefficient value (CR) increased with the level of KCl and NaCl addition in wheat flour.
H’m is strongly affected by the yeast fermentation and also by the dough structure [2,42]. Thus, by chloride salts’ addition, the gluten network becomes stronger and less extensible, leading to a lower dough expansion during fermentation. Additionally, chloride salts repress yeast activity by its osmotic pressure effect [12], leading to less CO2 production and lower H’m values, as seen in Figure 3a. The decrease of the H’m, together with the increased level of KCl and NaCl addition, is in agreement with many previously made studies which reported that the addition of any type of chloride salts decreased the values of Rheofermentometer parameters [2,9,12,29,43].
The repressing effect of salt on yeast leads also to lower VT values, as seen in Figure 3b and, as a consequence, to lower VR values [43]. However, contrary to the negative effect of NaCl and KCl on H’m, VT and VR values, it presented a significantly (p < 0.01) positive effect on CR value. This behavior is due to the gluten network improvement which becomes stronger by chloride salt addition and with a higher ability to retain the gas released by fermentation [43].

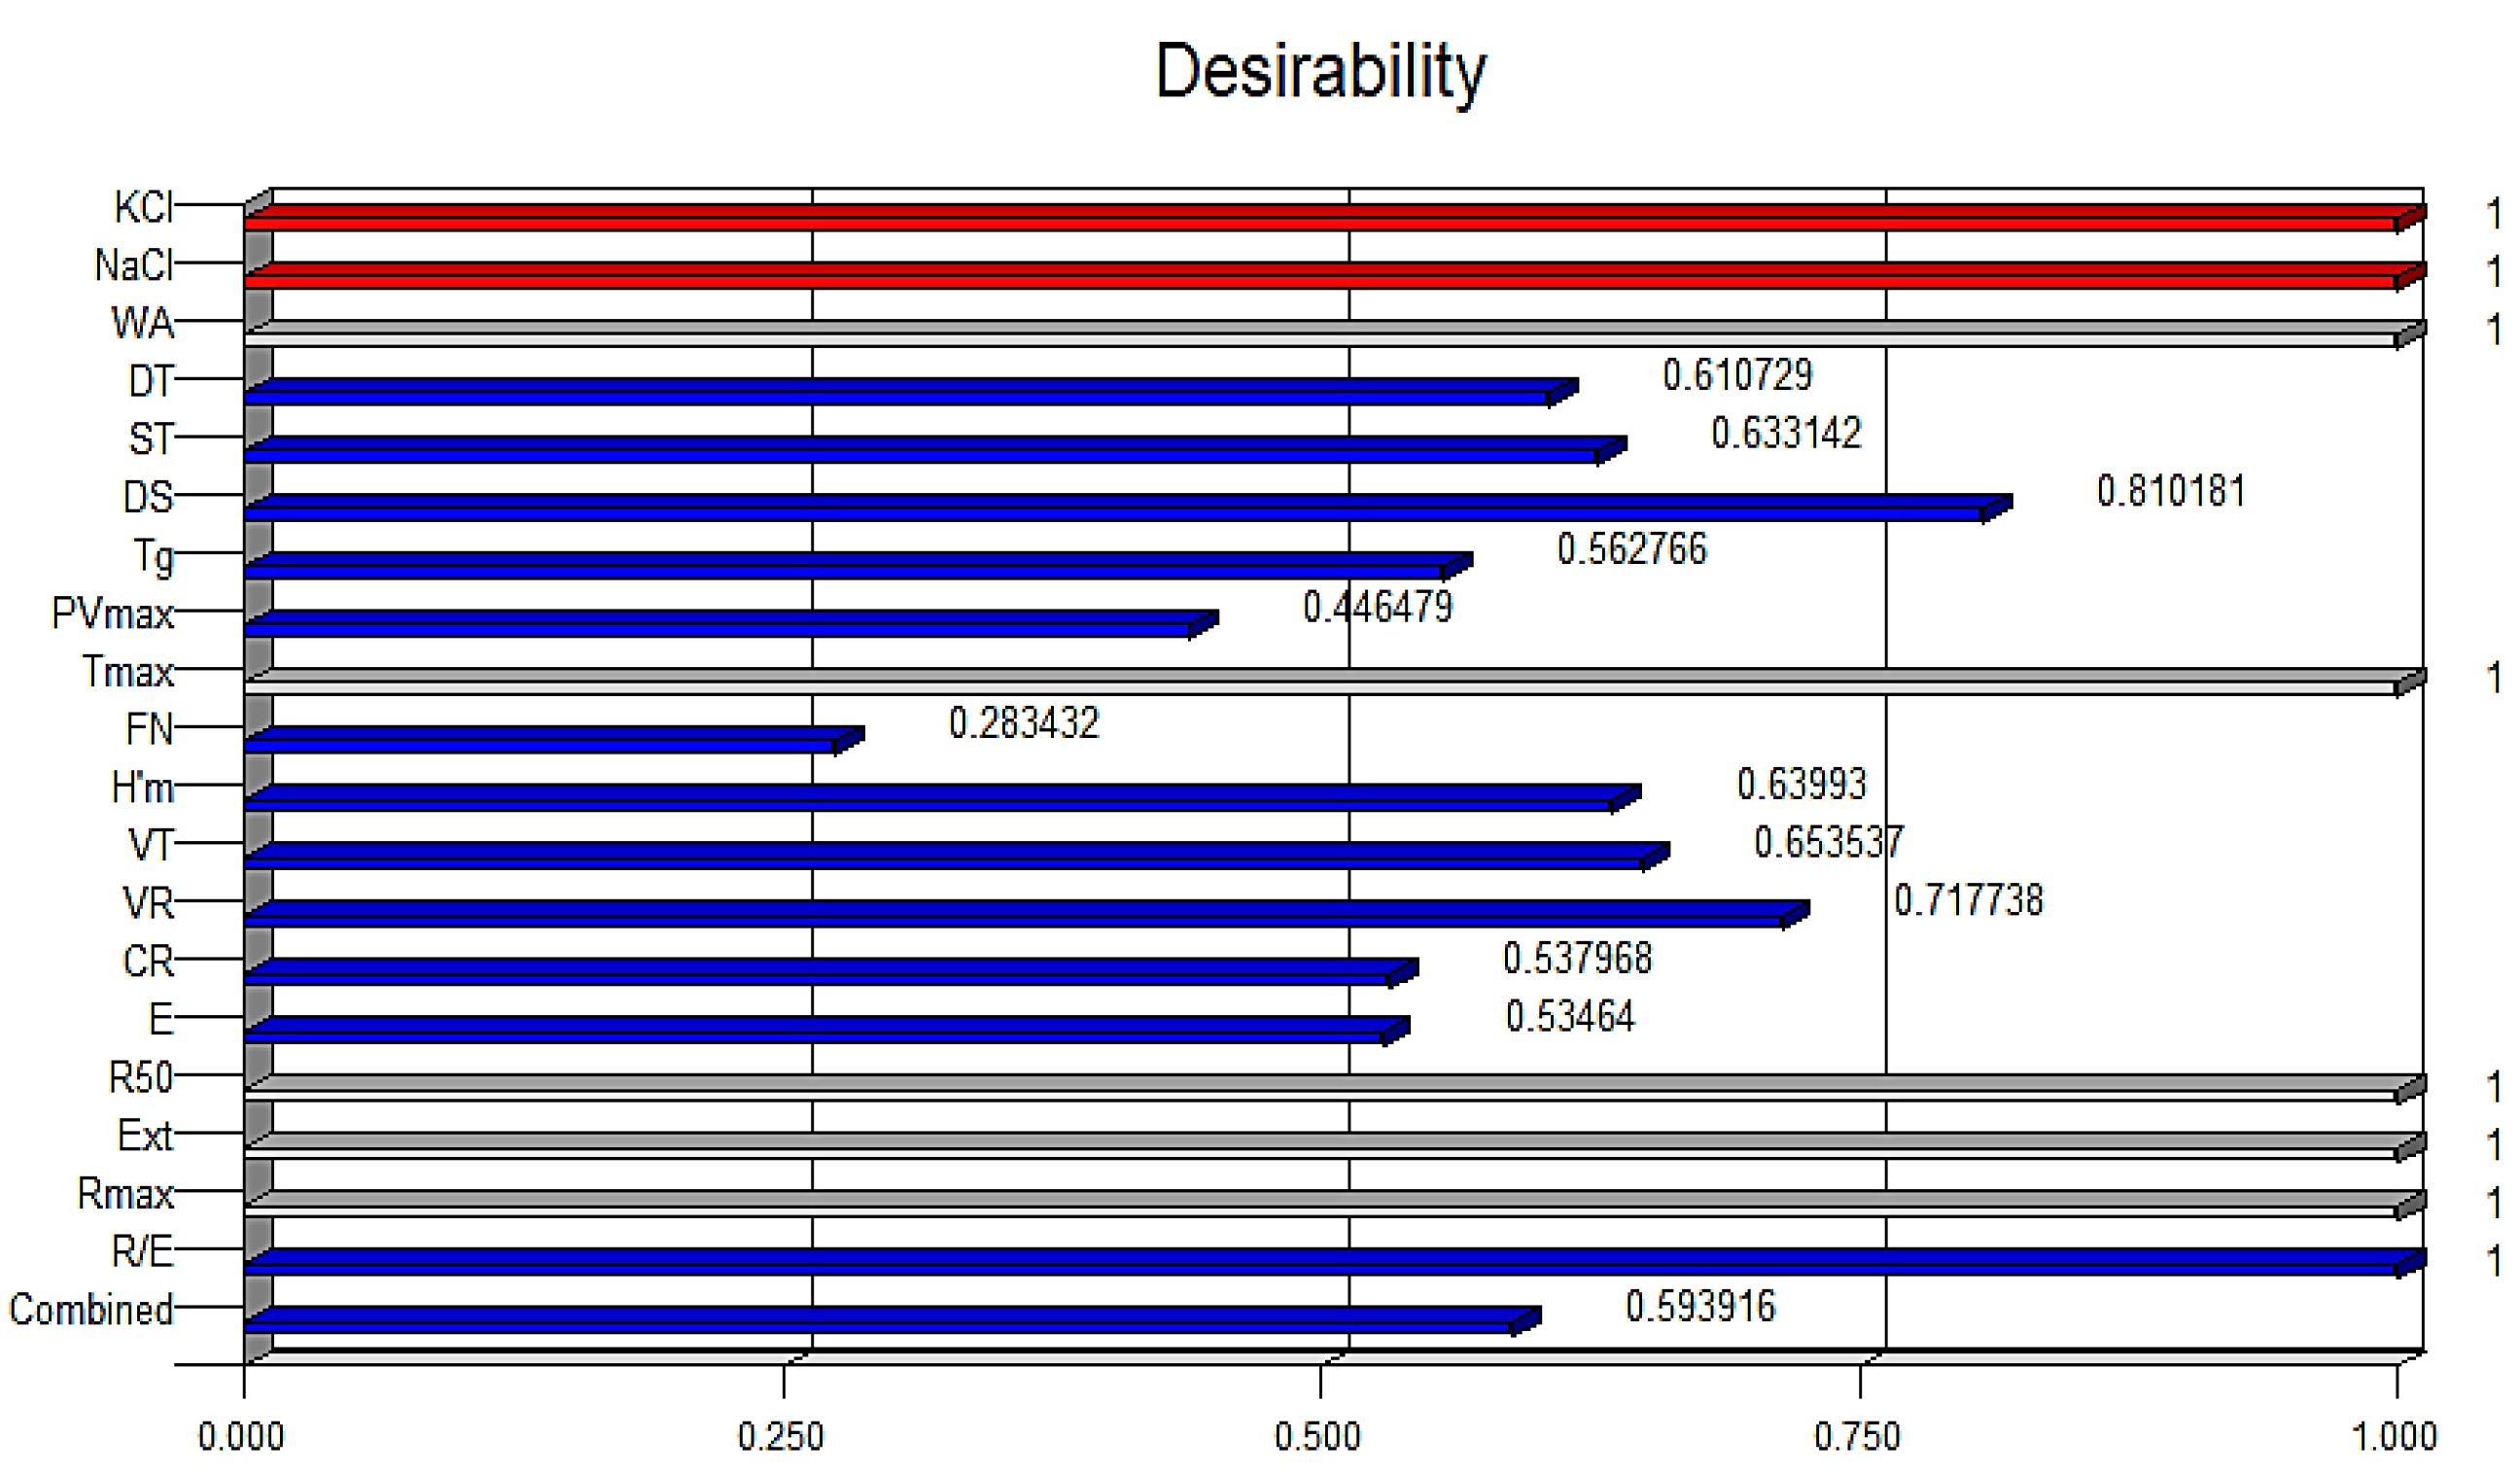
3.5. Optimization of the KCl and NaClFormulation

An important objective of this research was to calculate the optimal values of the rheological parameters of the dough. For this purpose, the Derringer desirability function (Equation (2)), a multi-criterion decision-making method, was used [44,45]. The optimization process using the numerical method by the Design-Expert was performed.
D = ( d 1 r 1 · d 2 r 2 · · d n r n ) 1 r i
where d1,d2,…, dn are the desirability indices for each dependent variables and r1,r2,…, ri are the relative importance of the dependent variables. A non-zero value of D from zero implies that all responses are in desirable range and, for a D value close to 1, the response values are close to the desirable values (Figure 4). By applying the desirable function methodology, the optimal values of the independent variables were obtained.
The optimum values of the amount of KCl are 0.37 g/100 g wheat flour, and the optimal amount of NaCl is 1.31 g/100 g wheat flour. For these optimal solutions, the optimal values for the dependent variables were obtained: WA—56.626%, DT—1.805 min, ST—10.471 min, DS—43.454 UB, Tg—64.149 °C, PVmax—1281.438 BU, Tmax—89.513 OC, FN—383.978 s, H’m—59.714 mm, VT—1192.988 mL, VR—1098.555 mL, CR—92.027%, E—104.475 cm2, R50—433.33 BU, Ext—138.923 mm, Rmax—549.359 BU and R/E—3.95 with a desirable function score of 0.594.

3.6. Strategy Approach for Bakery Products’ Reformulation for Sodium Amount Reduction Related to Our KCl–NaCl Optimum Values

Bakery products are one of the main dietary sources of salt in most European countries. It seems that the highest consumption of bakery products occurred in the Eastern and Central Europe. In Northern Europe, other products, such as those of animal origin, are the main dietary sources of salt intake. Nowadays the daily salt intake in most EU countries ranges from 7 to 13 g per day (with the lowest intake values in Northern Europe countries and the highest ones in Central and Eastern countries), exceeding the World Health Organization’s recommendation data [46]. Due to this, many European countries recommended food reformulation in order to reduce the salt content from its food, running many nutrition action plans for this purpose. For example, the Ministry of Health from some EU countries recommended reducing salt in bakery products by 15% up to 2015 in Austria, with 10% up to 2012 in Italy, with 20% up to 2014 in Spain, etc. [15]. The maximum target for the salt level that want to be achieved varies from one country to another. For example, of 2.35% for bread products from Hungary from 2019and of 1.4% for bakery products from Spain. These high differences between EU countries’ targets are related to the usual levels that normally exist in these countries’ bread products. For example, the level of salt from popular Hungarian bakery products is around of 3% [47], whereas in Spain the mean salt content from the bakery products is around 2% [48]. Besides the fact that salt reduction in bakery products affect its technological process, a fact developed in quite a large extent during this study, it also affects bakery products’ quality. According to our study, a 22% replacement of NaCl in a dough recipe through KCl is optimum in order to obtain bakery products of a very good quality. According to the data from the international literature, a 20% sodium reduction in bakery products did not affected bread quality from the sensory (including taste) point of view [46]. Regarding the use of KCl as a NaCl substitute, previous studies have shown that its addition up to 20–30% did not affected the taste of the bakery products. However, levels higher than 30% of KCl addition in wheat flour led to metallic and bitter aftertastes, a fact that is not recommended it in bread making [10]. Therefore, our results are favorable for obtaining very good bakery products from a technological and sensory point of view. As mentioned above, nowadays different countries are trying gradual reductions of sodium levels from different foodstuffs. But this reduction is limited due to the consumers’ acceptance, and those who are not willing to give up to their eating habits, especially from the sensory point of view. The use of KCl as an ingredient to reduce sodium in foodstuffs is expected to increase in the coming years [48]. This is in accordance with the many years of recommendations from the WHO, stating that people must reduce their Na intake and increase their K intake. Despite WHO’s rigorous recommendation very little progress is being made worldwide in this direction [49]. Our optimum values obtained through RSM methodology reduces 22% of the sodium content from the bread recipe and increases the K level through KCl addition to around 200 mg/100 g bread. Our study proposes a formulation which leads to bakery products of a good quality in accordance with WHO recommendations of sodium reduction intake from foodstuffs. Additionally, the proposed sodium reduction is by NaCl substitution with KCl, a natural ingredient which has also been agreed by the World Health Organization.

4. Conclusions

According to the obtained data, it seems that both chloride salts have a similar effect on dough rheological properties. With respect to mixing properties, both types of salts presented a positive effect on dough stability, to the energy, and to dough extensibility values. During heating, the chloride salts increased dough viscosity, reflecting in an increase of PVmax and FN values. During fermentation, both of the chloride salts decreased the H’m, VT, and VR Rheofermentometer values and increased the CR value. The mathematical models obtained for the response variables were significant with high values of Adjusted R2 > 0.70 (except for DS, PVmax and Tmax), p-value < 0.05 (except for Tmax) showing for most dependent variables no lack of fit. The optimum values, obtained with the numerical method, were for KCl—0.37 g/100 g wheat flour and for NaCl—1.31 g/100 g wheat flour. The use of the potassium chloride as a substitute of sodium chloride in bakery products has a double advantage, namely the reduction of sodium content as well the increase of potassium amount from the final products. Our optimum values obtained through RSM methodology lead to the best technological parameters and also reduced the amount of sodium from the bakery products by22%, a decreased level that, according to the data in the international literature, did not affect the sensory characteristics of the food products.

Author Contributions

A.V., S.-G.S. and G.G.C. contributed equally to the study design, collection of data, development of the sampling, analyses, interpretation of results, and preparation of the paper. All authors have read and agreed to the published version of the manuscript.

Funding

This research was funded by Ministry of Research and Innovation grant number [18PFE/16.10.2018].

Acknowledgments

This work was supported from contract no. 18PFE/16.10.2018 funded by Ministry of Research and Innovation within Program 1—Development of national research and development system, Subprogram 1.2—Institutional Performance—RDI excellence funding projects.

Conflicts of Interest

The authors declare no conflict of interest.

References

  1. de Wardener, H.E.; MacGregor, G.A. Harmful effects of dietary salt in addition to hypertension. J. Hum. Hypertens. 2002, 16, 213–223. [Google Scholar] [CrossRef] [PubMed] [Green Version]
  2. Jekle, M.; Necula, A.; Jekle, M.; Becker, T. Concentration dependent rate constants of sodium substitute functionalities during wheat dough development. Food Res. Int. 2019, 116, 346–353. [Google Scholar] [CrossRef] [PubMed]
  3. Mozaffarian, D.; Benjamin, E.J.; Go, A.S.; Arnett, D.K.; Blaha, M.J.; Cushman, M.; de Ferranti, S.; Després, J.-P.; Fullerton, H.J.; Howard, V.J.; et al. Executive Summary: Heart Disease and Stroke Statistics—2015 Update. Circulation 2015, 131, 434–441. [Google Scholar] [CrossRef]
  4. Zandstra, E.H.; Lion, R.; Newson, R.S. Salt reduction: Moving from consumer awareness to action. Food Qual. Prefer. 2016, 48, 376–381. [Google Scholar] [CrossRef]
  5. Lopes, M.; Cavaleiro, C.; Ramos, F. Sodium Reduction in Bread: A Role for Glasswort (Salicornia ramosissima J. Woods). Compr. Rev. Food Sci. Food Saf. 2017, 16, 1056–1071. [Google Scholar] [CrossRef] [Green Version]
  6. Bibbins-Domingo, K.; Chertow, G.M.; Coxson, P.G.; Moran, A.; Lightwood, J.M.; Pletcher, M.J.; Goldman, L. Projected effect of dietary salt reductions on future cardiovascular disease. N. Engl. J. Med. 2010, 362, 590–599. [Google Scholar] [CrossRef] [Green Version]
  7. Raffo, A.; Carcea, M.; Moneta, E.; Narducci, V.; Nicoli, S.; Peparaio, M.; Sinesio, F.; Turfani, V. Influence of different levels of sodium chloride and of a reduced-sodium salt substitute on volatiles formation and sensory quality of wheat bread. J. Cereal Sci. 2018, 79, 518–526. [Google Scholar] [CrossRef]
  8. Valerio, F.; Conte, A.; di Base, M.; Lattanzio, V.M.T.; Lonigro, S.L.; Padalino, L.; Pontonio, E.; Lavermicocca, P. Formulation of yeast-leavened bread with reduced salt content by using a Lactobacillus plantarum fermentation product. Food Chem. 2017, 221, 582–589. [Google Scholar] [CrossRef]
  9. Miller, M.W. Role of Salt in Baking. Cereal Foods World 2008, 53, 4–6. [Google Scholar] [CrossRef]
  10. Silow, C.; Axel, C.; Zannini, E.; Arendt, E.K. Current status of salt reduction in bread and bakery products—A review. J. Cereal Sci. 2016, 72, 135–145. [Google Scholar] [CrossRef]
  11. Diler, G.; leBail, A.; Chevallier, S. Salt reduction in sheeted dough: A successful technological approach. Food Res. Int. 2016, 88, 10–15. [Google Scholar] [CrossRef] [PubMed]
  12. Lynch, E.; Bello, F.D.; Sheehan, E.; Cashman, K.; Arendt, E.K. Fundamental studies on the reduction of salt on dough and bread characteristics. Food Res. Int. 2009, 42, 885–891. [Google Scholar] [CrossRef]
  13. Moreau, L.; Lagrange, J.; Bindzus, W.; Hill, S. Influence of sodium chloride on colour, residual volatiles and acrylamide formation in model systems and breakfast cereals. Int. J. Food Sci. Technol. 2009, 44, 2407–2416. [Google Scholar] [CrossRef]
  14. Belz, M.C.; Ryan, L.A.; Arendt, E.K. The Impact of Salt Reduction in Bread: A Review. Crit. Rev. Food Sci. Nutr. 2012, 52, 514–524. [Google Scholar] [CrossRef]
  15. Belc, N.; Smeu, I.; Macri, A.; Vallauri, D.; Flynn, K. Reformulating foods to meet current scientific knowledge about salt, sugar and fats. Trends Food Sci. Technol. 2019, 84, 25–28. [Google Scholar] [CrossRef]
  16. van Buren, L.; Dötsch-Klerk, M.; Seewi, G.; Newson, R.S. Dietary Impact of Adding Potassium Chloride to Foods as a Sodium Reduction Technique. Nutrients 2016, 8, 235. [Google Scholar] [CrossRef] [Green Version]
  17. Binia, A.; Jaeger, J.; Hu, Y.; Singh, A.; Zimmermann, D. Daily potassium intake and sodium-to-potassium ratio in the reduction of blood pressure: A meta-analysis of randomized controlled trials. J. Hypertens. 2015, 33, 1509–1520. [Google Scholar] [CrossRef]
  18. Aburto, N.J.; Hanson, S.; Gutierrez, H.; Hooper, L.; Elliott, P.; Cappuccio, F.P. Effect of increased potassium intake on cardiovascular risk factors and disease: Systematic review and meta-analyses. BMJ 2013, 346. [Google Scholar] [CrossRef] [Green Version]
  19. Braschi, A.; Gill, L.; Naismith, D.J. Partial substitution of sodium with potassium in white bread: Feasibility and bioavailability. Int. J. Food Sci. Nutr. 2009, 60, 507–521. [Google Scholar] [CrossRef]
  20. Cappelli, A.; Guerrini, L.; Parenti, A.; Palladino, G.; Cini, E. Effects of wheat tempering and stone rotational speed on particle size, dough rheology and bread characteristics for a stone-milled weak flour. J. Cereal Sci. 2020, 91, 102879. [Google Scholar] [CrossRef]
  21. Cappelli, A.; Cini, E.; Guerrini, L.; Masella, P.; Angeloni, G.; Parenti, A. Predictive models of the rheological properties and optimal water content in doughs: An application to ancient grain flours with different degrees of refining. J. Cereal Sci. 2018, 83, 229–235. [Google Scholar] [CrossRef]
  22. Popa, N.C.; Tamba-Berehoiu, R.; Popescu, S.; Varga, M.; Codină, G.G. Predictive model of the alveographic parameters in flours obtained from Romanian grains. Rom. Biotechnol. Lett. 2008, 14, 4234–4242. [Google Scholar]
  23. Mironeasa, S.; Iuga, M.; Zaharia, D.; Mironeasa, C. Optimization of grape peels particle size and flour substitution in white wheat flour dough. Scientific Study & Research. J. Food Proc. Eng. 2019, 20, 29–42. [Google Scholar]
  24. Codină, G.G.; Mironeasa, S. Use of response surface methodology to investigate the effects of brown and golden flaxseed on wheat flour dough microstructure and rheological properties. J. Food Sci. Technol. 2016, 53, 4149–4158. [Google Scholar] [CrossRef] [Green Version]
  25. Mironeasa, S.; Iuga, M.; Zaharia, D.; Mironeasa, C. Optimization of White Wheat Flour Dough Rheological Properties with Different Levels of Grape Peels Flour Addition. Bull. Univ. Agric. Sci. Vet. Med. Cluj-Napoca Food Sci. Technol. 2019, 76, 27–39. [Google Scholar] [CrossRef] [Green Version]
  26. Wang, Y.; Gao, Y.; Ding, H.; Liu, S.; Han, X.; Gui, J.Z.; Liu, D. Subcritical ethanol extraction of flavonoids from Moringaoleifera leaf and evaluation of antioxidant activity. Food Chem. 2017, 218, 152–158. [Google Scholar] [CrossRef]
  27. Tuhumury, H.; Small, D.; Day, L. Effects of Hofmeister salt series on gluten network formation: Part I. Cation series. Food Chem. 2016, 212, 789–797. [Google Scholar] [CrossRef]
  28. McCann, T.; Day, L. Effect of sodium chloride on gluten network formation, dough microstructure and rheology in relation to breadmaking. J. Cereal Sci. 2013, 57, 444–452. [Google Scholar] [CrossRef]
  29. Beck, M.; Jekle, M.; Becker, T. Impact of sodium chloride on wheat flour dough for yeast-leavened products. I. Rheological attributes. J. Food Sci. Agric. 2012, 92, 585–592. [Google Scholar] [CrossRef]
  30. Uthayakumaran, S.; Batey, I.L.; Day, L.; Wrigley, C.W. Salt reduction in wheat-based foods-technical challenges and opportunities. Food Aust. 2011, 63, 137–140. [Google Scholar]
  31. Voinea, A.; Stroe, S.-G.; Codină, G.G. The Effect of Sodium Reduction by Sea Salt and Dry Sourdough Addition on the Wheat Flour Dough Rheological Properties. Foods 2020, 9, 610. [Google Scholar] [CrossRef]
  32. Bernklau, I.; NeußFer, C.; Moroni, A.V.; Gysler, C.; Spagnolello, A.; Chung, W.; Jekle, M.; Becker, T. Structural, textual and sensory impactof sodium reduction on long fermented pizza. Food Chem. 2017, 234, 398–407. [Google Scholar] [CrossRef]
  33. Ortolan, F.; Corrêa, G.P.; Cunha, R.L.; Steel, C.J. Rheological properties of vital wheat glutens with water or sodium chloride. LWT 2017, 79, 647–654. [Google Scholar] [CrossRef]
  34. Samutsri, W.; Suphantharika, M. Effect of salts on pasting, thermal, and rheological properties of rice starch in the presence of non-ionic and ionic hydrocolloids. Carbohydr. Polym. 2012, 87, 1559–1568. [Google Scholar] [CrossRef]
  35. Cordeiro, C.A.M.; Martins, M.L.L.; Luciano, A.B. Production and properties of α-amylase from termophilicBacillussp. Braz. J. Microbiol. 2002, 33, 57–61. [Google Scholar] [CrossRef] [Green Version]
  36. Sinani, A.; Sana, M.; Seferi, E.; Sheahaj, M. The effect of α-amylase in rheology features of some wheat cultivars and their harmonization for producing baking according to customer requirements. Glob. J. Biol. Agric. Health Sci. 2014, 4, 58–64. [Google Scholar]
  37. Struyf, N.; Verspreet, J.; Courtin, C. The effect of amylolytic activity and substrate availability on sugar release in non-yeasted dough. J. Cereal Sci. 2016, 69, 111–118. [Google Scholar] [CrossRef]
  38. Codină, G.G.; Dabija, A.; Oroian, M. Prediction of Pasting Properties of Dough from Mixolab Measurements Using Artificial Neuronal Networks. Foods 2019, 8, 447. [Google Scholar] [CrossRef] [Green Version]
  39. Nicol, T.W.; Isobe, N.; Clark, J.H.; Matubayasi, N.; Shimizu, S. The mechanism of salt effects on starch gelatinization from a statistical thermodynamic perspective. Food Hydrocoll. 2019, 87, 593–601. [Google Scholar] [CrossRef]
  40. Moreira, R.; Chenlo, F.; Torres, M. Effect of sodium chloride, sucrose and chestnut starch on rheological properties of chestnut flour doughs. Food Hydrocoll. 2011, 25, 1041–1050. [Google Scholar] [CrossRef]
  41. Salvador, A.; Sanz, T.; Fiszman, S.M. Dynamic rheological characteristics of wheat flour-water doughs. Effect of adding NaCl, sucrose and yeast. Food Hydrocoll. 2006, 20, 780–786. [Google Scholar] [CrossRef]
  42. Codină, G.G.; Voica, D. The influence of different forms of bakery yeast Saccharomyces cerevisie type strain on the concentration of individual sugars and their utilization during fermentation. Rom. Biotechnol. Lett. 2010, 15, 5417–5422. [Google Scholar]
  43. Pasqualone, A.; Caponio, F.; Pagani, M.A.; Paradiso, V.M.; Paradiso, V.M. Effect of salt reduction on quality and acceptability of durum wheat bread. Food Chem. 2019, 289, 575–581. [Google Scholar] [CrossRef]
  44. Badwaik, L.S.; Prasad, K.; Seth, D. Optimization of ingredient levels for the development of peanut based fiber rich pasta. J. Food Sci. Technol. 2012, 51, 2713–2719. [Google Scholar] [CrossRef] [Green Version]
  45. Candioti, L.V.; de Zan, M.M.; Cámara, M.S.; Goicoechea, H.C. Experimental design and multiple response optimization. Using the desirability function in analytical methods development. Talanta 2014, 124, 123–138. [Google Scholar] [CrossRef]
  46. Kloss, L.; Meyer, J.D.; Graeve, L.; Vetter, W. Sodium intake and its reduction by food reformulation in the European Union—A review. NFS J. 2015, 1, 9–19. [Google Scholar] [CrossRef] [Green Version]
  47. Lásztity, R. The Chemistry of Cereal Proteins; CRC Press: Boca Raton, FL, USA, 1995. [Google Scholar]
  48. Farinós, N.P. Salt content in bread in Spain, 2014. Nutr. Hospital. 2018, 35, 650–654. [Google Scholar] [CrossRef]
  49. Iwahori, T.; Miura, K.; Ueshima, H. Time to Consider Use of the Sodium-to-Potassium Ratio for Practical Sodium Reduction and Potassium Increase. Nutrients 2017, 9, 700. [Google Scholar] [CrossRef]
Figure 1. The graphical representations of the Farinograph and Extenograph parameters: (a) water absorption (WA); (b) stability of dough (ST); (c) resistance to extension up to 50 mm (R50); (d) maximum resistance to extension (Rmax).
Applsci 10 04039 g001
Figure 2. The graphical representations of the Falling Number and Amylograph parameters: (a) Falling Number value (FN); (b) peak viscosity (PVmax); (c) gelatinization temperature (Tg); (d) temperature at peak viscosity (Tmax).
Applsci 10 04039 g002
Figure 3. The graphical representations of the Rheofermentometer parameters: (a) maximum height of gaseous production (H’m); (b) total CO2 volume production (VT); (c) volume of the gas retained in the dough at the end of the test (VR).
Applsci 10 04039 g003aApplsci 10 04039 g003b
Figure 4. Desirability function scores for the independent variables and the studied dependent variables.
Applsci 10 04039 g004
Table 1. Real and coded values of independent variables used in the experimental design.
RunReal ValueCoded Value
KCl 1 (g/100 g)NaCl 1 (g/100 g)X1X2
10.30.3−1−1
21.50.31−1
30.31.5−11
40.90.900
50.90.900
60.90.900
71.50.910
80.90.900
91.51.511
100.91.501
110.90.900
120.90.30−1
130.30.9−10
1 KCl—potassium chloride; NaCl—sodium chloride.
Table 2. Effects of independent variables, expressed as their corresponding coefficients on the predictive models for dough rheological properties during the mixing of KCl–NaCl mixtures.
Factors bParameters
FarinographExtensograph (Proving Time 135 min)
WA (%)DT (min)ST (min)DS (UB)E (cm2)R50 (BU)Rmax (BU)R/E
Constant56.751.556.8554.86106.54439.62566.854.11
A−0.35 **0.01671.55 *0.66614.33 ***51.00 ***81.83 ***0.57 ***
B−0.80 ***−0.054.07 ***−5.67 **15.00 ***54.67 ***78.67 ***0.50 ***
A × B0.220.0251.004.00----
A20.0190.319 ***3.78 **−10.52 **----
B20.370.019−1.6711.48 **----
Adjusted R20.760.700.750.600.740.820.790.79
p-value a0.0072 ***0.031 **0.0079 ***0.0355 **0.0005 ***<0.0001 ***0.0002 ***0.0005 ***
a Significant at p < 0.01 ***, at p < 0.05 **, at p < 0.1 *. b A—KCl (g/100 g); B—NaCl (g/100 g); Adj. R2 is measure of fit of the model. WA—water absorption; DT—development time; ST—dough stability; DS—degree of softening; E—Energy; R50—resistance to extension up to 50 mm; Rmax—maximum resistance, R/E—ratio number.
Table 3. Effects of independent variables, expressed as their corresponding coefficients on the predictive models for dough rheological properties during fermentation, gelatinization properties and α-amylase activity of KCl-NaCl mixtures.
Factors bParameters
FN (s)Tg (°C)PVmax (BU)Tmax (°C)H’m (mm)VT (mL)VR (mL)CR (%)
Constant378.5264.561221.6689.0061.951251.931117.0789.28
A1.500.62 ***3.330.1167−7.35 ***−159.50 ***−124.00 ***2.12 ***
B2.830.25 *52.67 ***0.25−5.58 ***−115.33 ***−88.00 ***1.62 **
A × B−10.25 **−0.1−21.25−0.05−0.6750−15.25−24.00−0.45
A212.19 **-14.210.1879−4.38 **−95.26 **−63.24 **2.22 **
B2−23.81 ***-29.210.2879−1.78−61.76−40.241.42
Adjusted R20.820.630.6330.400.900.870.910.75
p-value a0.0028 ***0.0071 ***0.0143 **0.11930.0004 ***0.0008 ***0.0003 ***0.0073 ***
a Significant at p < 0.01 ***, at p < 0.05 **, at p < 0.1 *. b A—KCl (g/100 g); B—NaCl (g/100 g); Adj. R2 is measure of fit of the model. FN—Falling Number; Tg—gelatinization temperature; PVmax—peak viscosity; Tmax—temperature at peak viscosity; H’m—height under constraint of dough at maximum development time; VT—total volume of CO2 produced during fermentation; VR—volume of the gas retained in the dough at the end of the test; CR—retention coefficient.

