1. Introduction
Steel tapes with certain symbols (rasters, special markings, etc.) generated on their surface are often used for metrological and technological purposes, for example, to measure displacement. These symbols are generated by contact movement of a steel tape and a light source beam acting on either the tape surface or its special coatings. Usually, the tape moving between feed and reception points in conveyor devices has a fixed axial tension and a constant movement velocity, stabilizing the tape at the guide rails from the bottom and the sides [
1,
2,
3,
4]. The smoothness of the movement of a moving precision tape and the stability of the tape area where symbols are generated are very important factors that affect the quality parameters of a generated tape. One of the most important characteristics of the raster generation device is the smoothness of the stretching of the tape, which is important for the overall operation of the system. The smoothness of the stretching of the tape affects errors in the position of the raster element being generated and the control of activation of the laser beam. Determining not only the amplitude, but also the frequency of the belt stretching oscillations is important [
5].
Adverse deviations in the position or the shape of symbols being generated that way depend on uncontrolled deviations of parameters of the said movement of the tape and the light beam from the set parameter values [
6]. Tape vibrations forming as a result of the system tape movement mechanism and other internal and external sources of excitation of vibrations are one of the most important components of such deviations [
7,
8,
9] They affect the occurring uncontrollable changes in tape’s position, the displacement velocity and tape deformations that have an adverse impact on the quality of the structures being generated, also affecting the accuracy and reliability of active process control done in real time [
10]. This impact on the system of defined parameters depends on vibration parameters—frequencies, amplitudes and other statistical characteristics. Knowing these parameters is important for developing the structure and optimizing the processes of formation of the structure and the symbols [
2,
11,
12,
13].
Lateral movement of the tape, which can be caused by a roller tilt, tape defects, roller unevenness and other factors is one of the most important factors [
14,
15]. Lateral movement of the tape can be suppressed to a certain extent by using flanged rollers, but they can deform the edge of the tape and cause high frequency low amplitude tape vibrations. On the other hand, the use of flangeless rollers can eliminate the above problems but can enhance low frequency lateral tape movement [
16,
17,
18,
19]. Modeling the tape movement process can be one of the key factors that help to understand the effects of deficiencies of the lateral tape dynamics [
20].
The presented research analyses the tape movement system consisting of electromechanical tape pulling and its constant stretching mechanisms as well as a tape deflection mechanism, which operates in a sliding friction [
21]. This system was mounted on a massive granite base placed on a foundation using passive vibration insulation supports. A research, a data processing method and the results of experimental research of a mock-up system were developed. The article examines the raster generation method and the generation device. This method may be used to produce a precision metrological scale on a stainless steel tape. The generation process takes place in the dynamic mode because both the steel tape and the laser raster generation head are constantly moving during the process.
The main aim of the research is to develop a system for measuring the displacement of the tape in the raster generation device, to examine the model of that system and to evaluate the possible impact of external and internal factors on raster generation in the dynamic mode.
Since a large number of impulses is generated with a tape moving through the angle transducer due to a very high resolution, information may be lost due to a limited speed of electric elements, which would be an essential cause of errors in the position of raster elements [
22,
23,
24,
25].
The article examines experimental research results of one of the main components (a tape displacement measuring unit) of the new precision raster generation system and possibilities for analytical modeling.
2. Research Object
The study analyses the raster generation and control system. The system was designed to have a constant linear relationship between the rotation angle of the drum and the linear displacement of the bar. This was achieved by minimizing the kinematic and geometric errors of the measuring system and the tape, which directly affects errors of the raster generation system. A focused laser beam raster is formed based on the number of pulses in the angle measuring system.
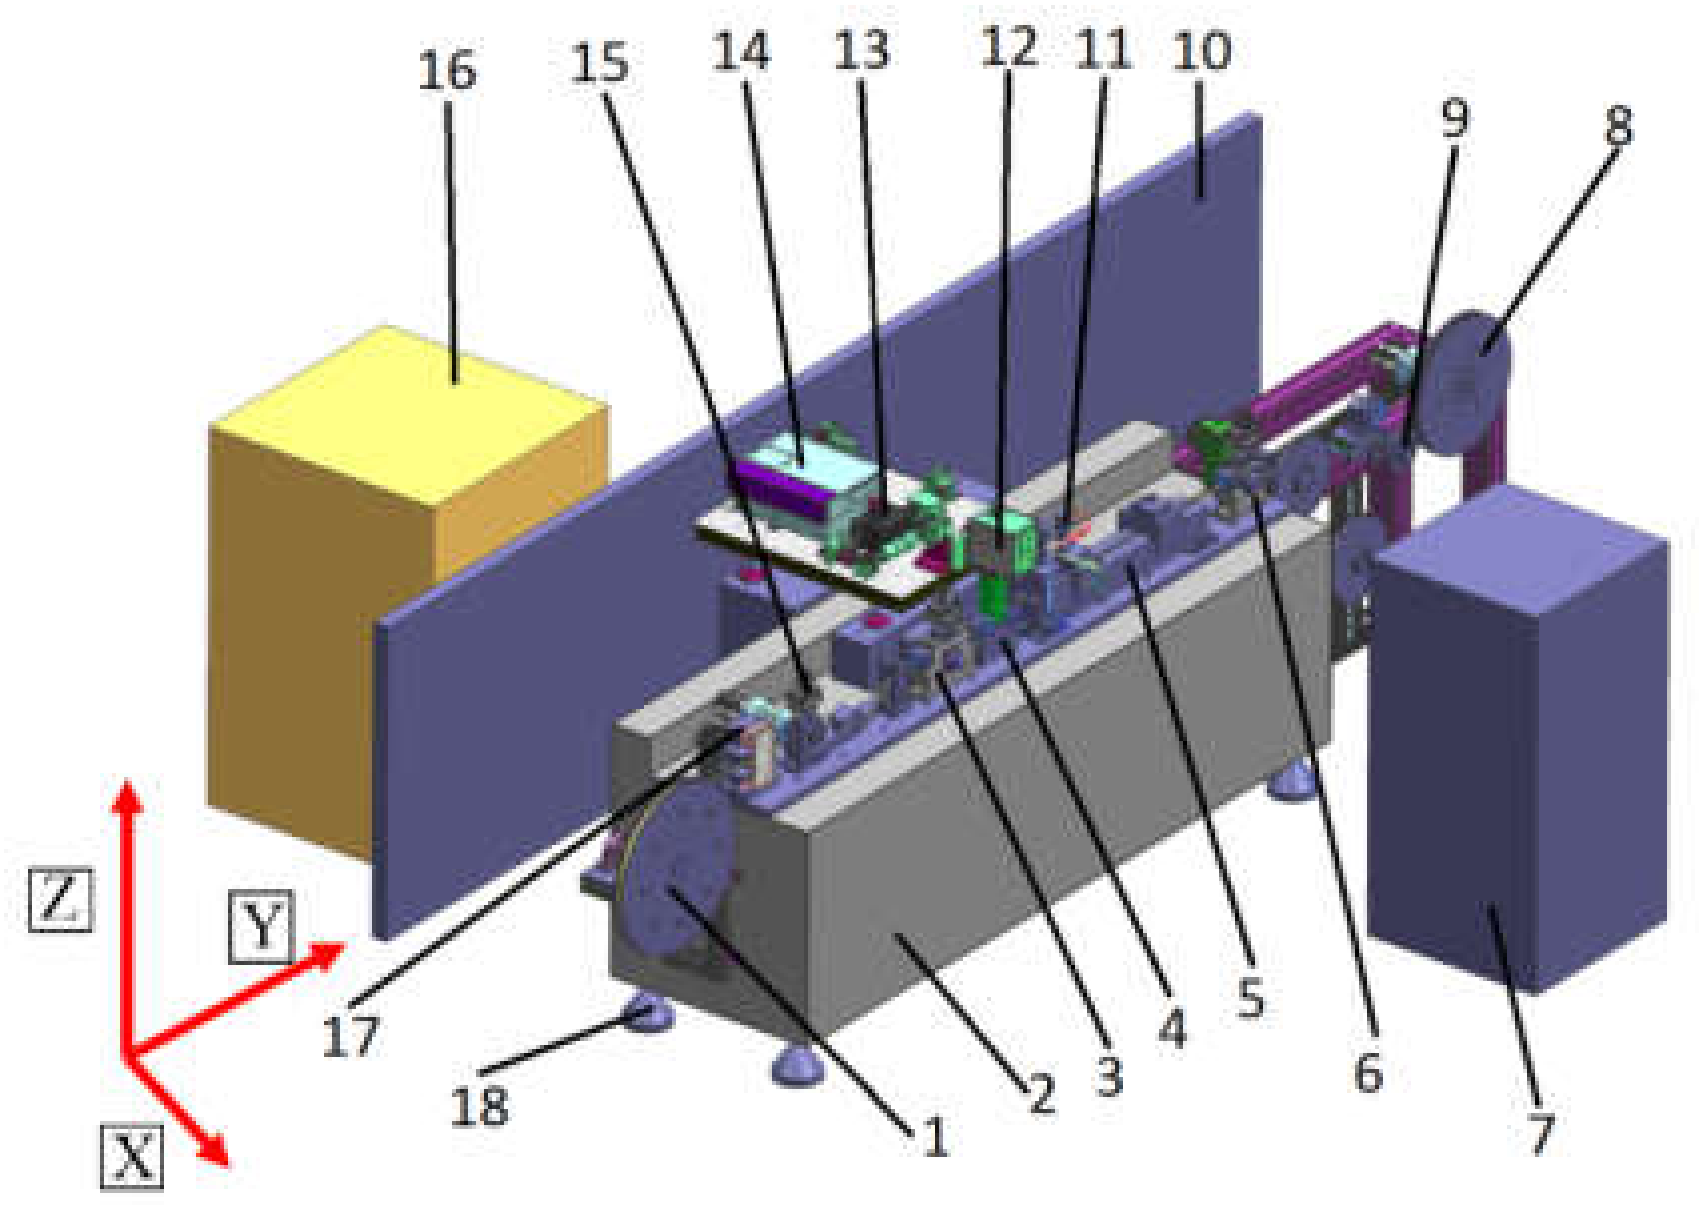
The raster generation bench consists of a massive fine-structured granite base and the tape movement devices mounted thereon presented in
Figure 1, the laser raster generation components and the raster scale error management system components.
Figure 1 illustrates the raster generation bench: 1—tape unwinding mechanism, 2—granite base, 3—tape displacement using angle measuring system, 4—deflection node, 5—error monitoring unit, 6—pulling—stretching system, 7—control panel, 8—tape winding mechanism, 9—mechanism for covering tape in a protective band, 10—indoor partition, 11—microscopes with CCD camera, 12—scanner, 13—optical laser beam deflection system, 14—laser, 15—constant belt tension mechanism, 16—device computing control set and laser and scanner freezer, 17—tape stretch control and management system, 18—vibration isolation supports. The length of the granite base is 2 m in the Y direction.
The main factors that adversely affect the accuracy of the dynamic calibration process are vibrations from external and internal sources. Vibrations from external sources—technological devices, vehicles, fans, etc. are usually transmitted through the floor. Internal sources of vibration include motors, reducers, rotary motion transmitter and laser system scanners.
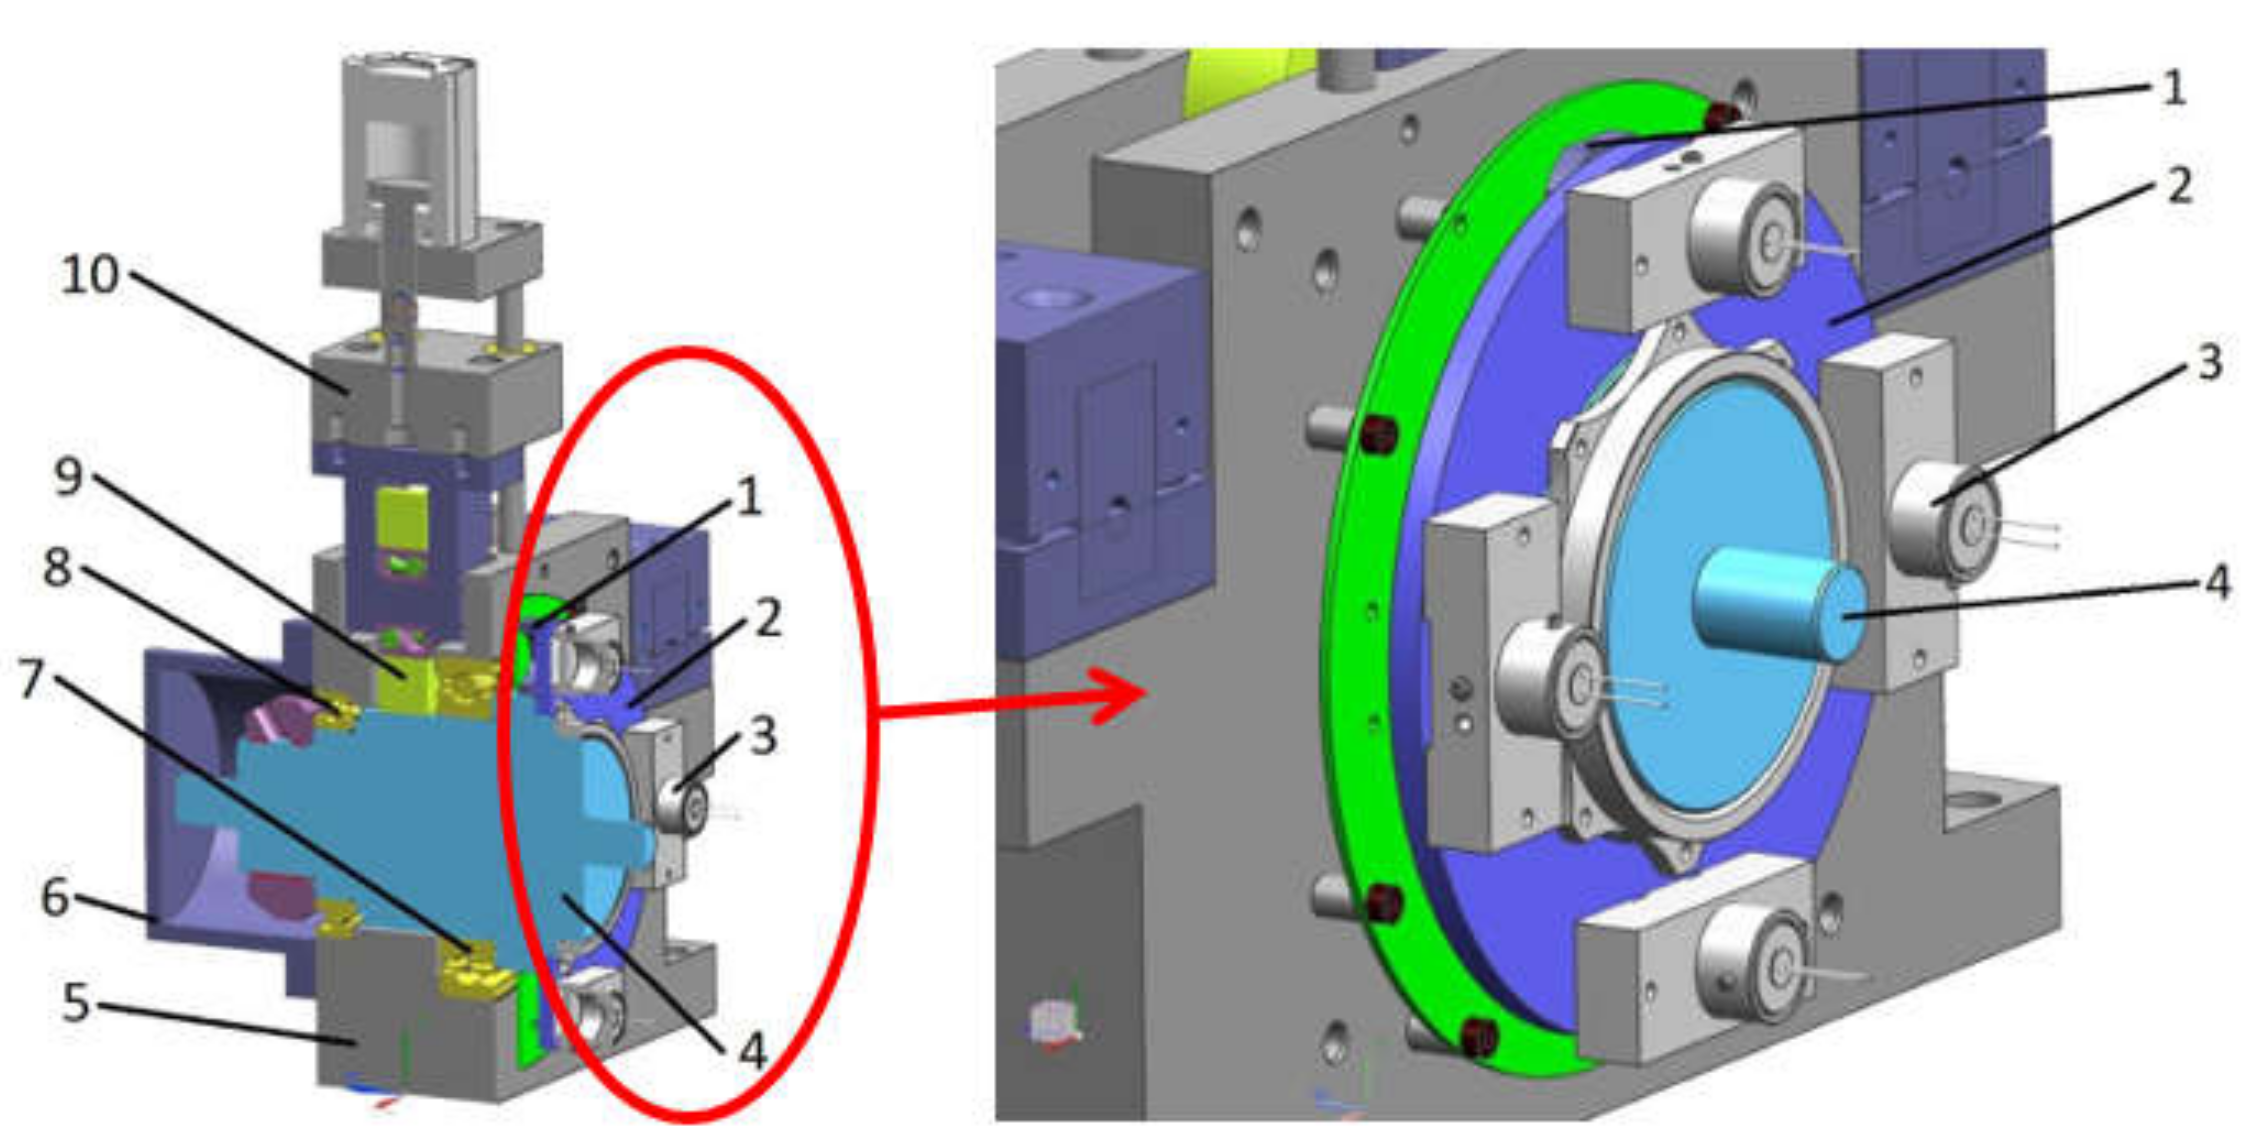
One of the most important components of the device is the tape displacement measuring system (Position 3 in
Figure 1).
Figure 2 presents its 3D images in cross-sections: 1—angle transducer base, 2—angle transducer limbo, 3—optical angle transducer heads, 4—precision tape displacement measurement shaft, 5—system base, 6—hood, 7,8—rotary system bearings, 9—tape clamping shaft, 10—tape clamping mechanism. The circumference of the steel band tape measured in the precision tape displacement measurement shaft is 200 mm. Accordingly, the diameter of this shaft at the point of contact with the tape is 63.662 mm.
Tape displacement measuring errors have a high frequency harmonic component. One of the reasons causing such errors is the so-called internal step error of the angle measurement transducer. The latter, in turn, depends on deviations in the primary electrical signals from the regular sine and cosine form, which are substantially affected by deviations in the shape of the limbo workpiece where a raster track is generated. In order to minimize this error, workpieces were specially polished at high precision till the maximum possible accuracy under Lithuanian manufacturing conditions was achieved. Maximum precision was also pursued by moving the limbo raster drawing from the original onto a product. A limbo raster drawing error was calibrated.
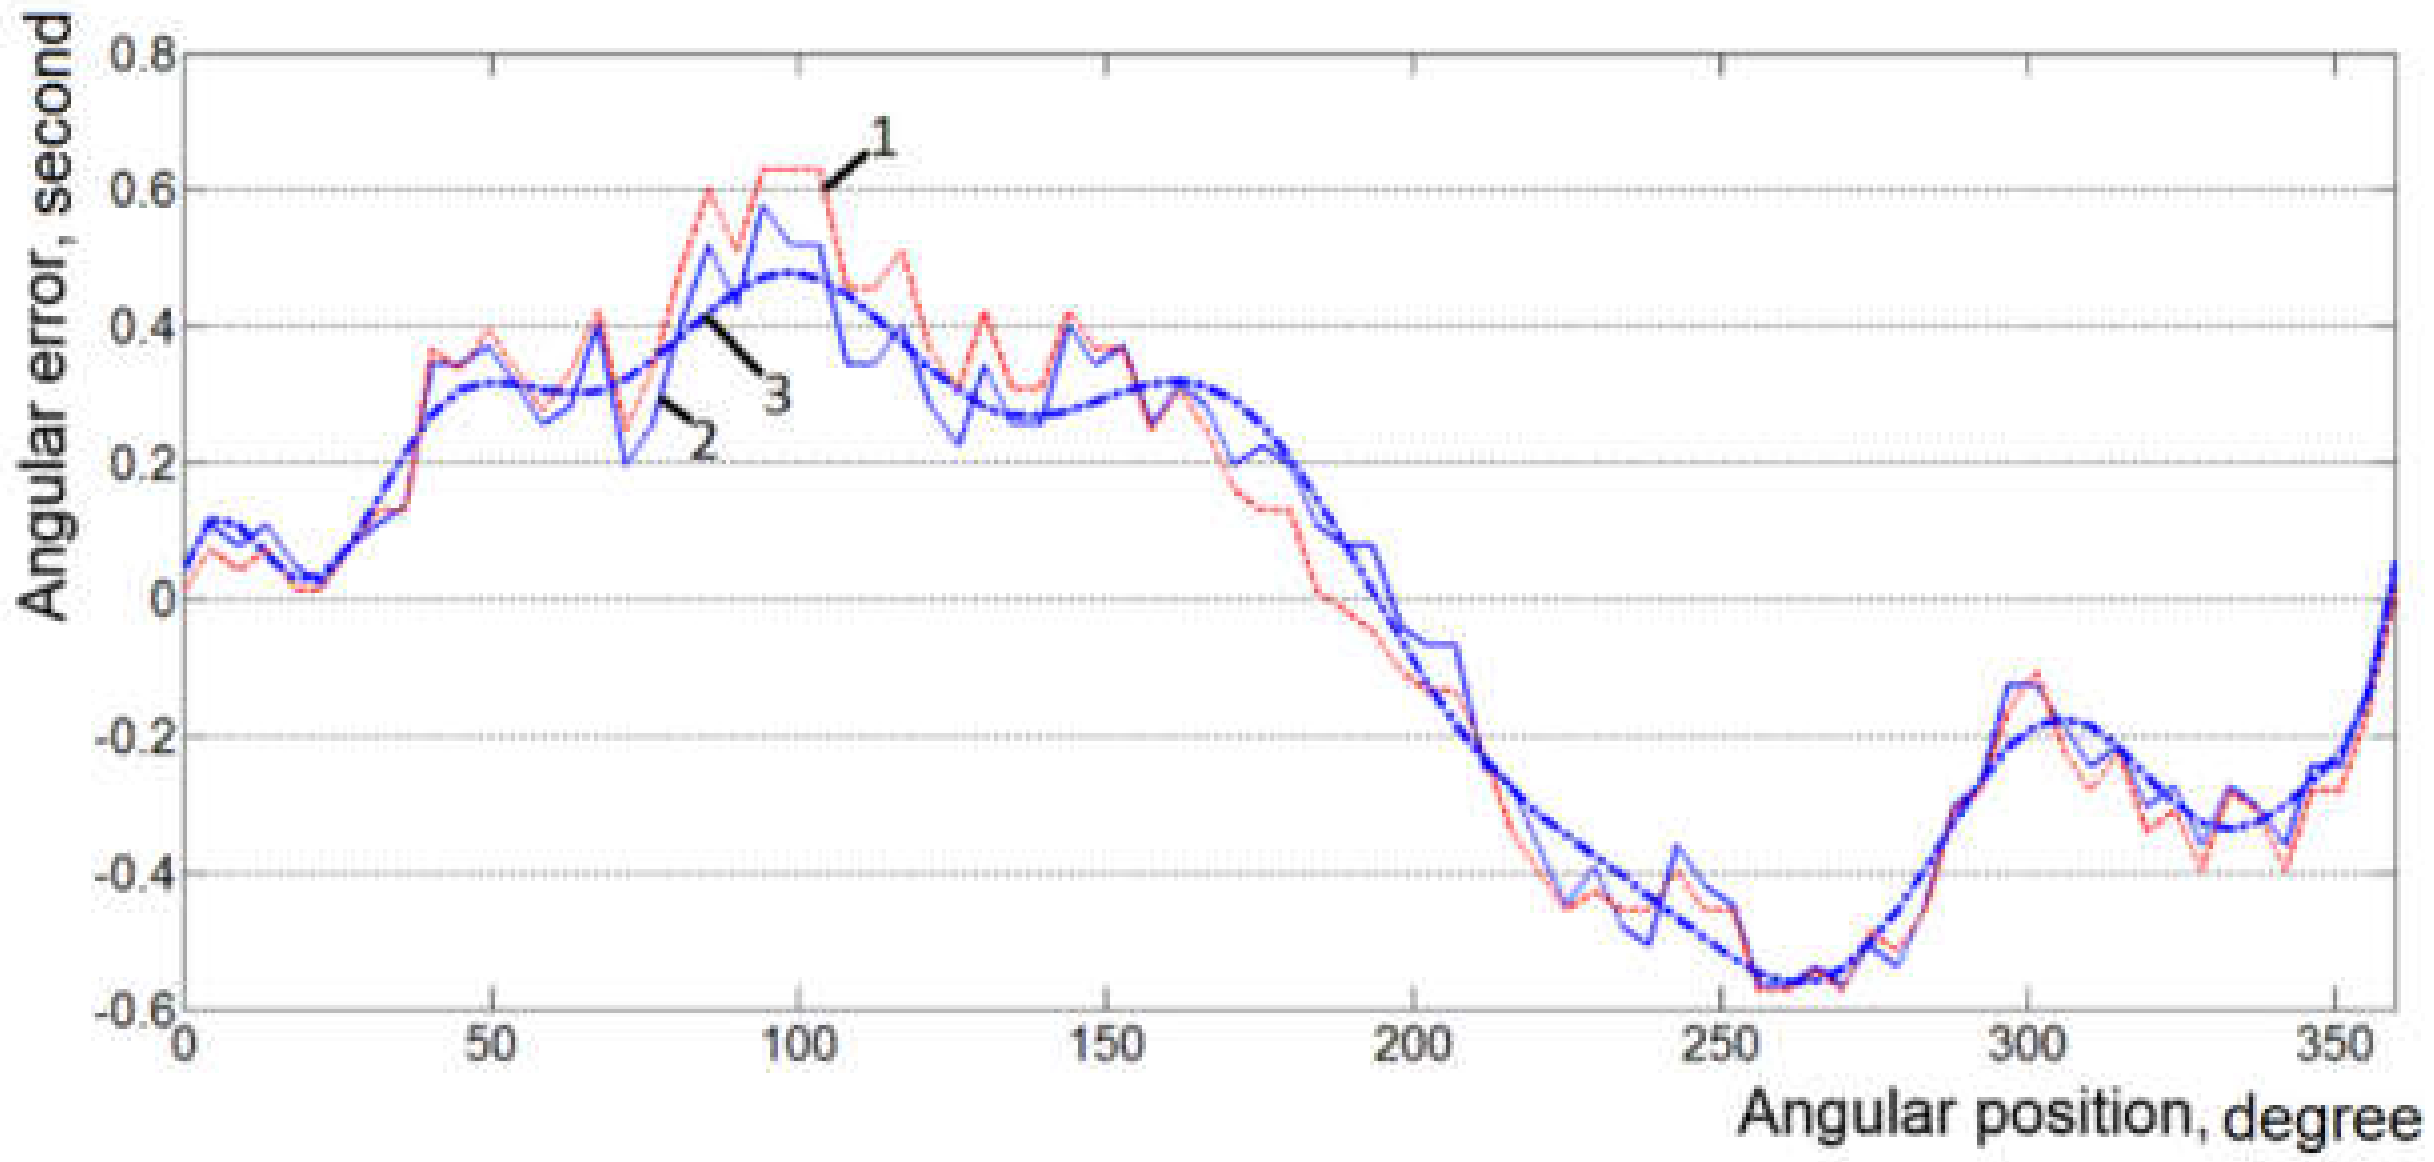
Figure 3 presents a graphical illustration of a parametric function of its two realizations of the tape displacement using the angle measuring system error and approximation of its means. 6 measurements were made, and 6 realizations were obtained;
Figure 3 presents error graphs of 2 realizations and an approximation of the means of the 6 realizations.
The value of the standard deviation with respect to the means of dissemination of calibration results of the 6 realizations is SD = 0.087 (see Formula 2). In pursuit of the maximum accuracy, a shaft was mounted in special, extra-high-precision bearings, using the method of four-head primary electrical signal generation. Calibration was performed autonomously by attaching a polygon to the tape displacement using an angle measuring system (polygon calibrated with PTB and its known errors), measuring it using an autocollimator, and entering an error correction.
3. Experimental Research of the Tape-Displacement Measuring System
Tape displacement measuring systems is a major part of the raster generation and control system, which directly affect the accuracy of the scales being produced. A bench was developed for the study of dynamic processes of the tape displacement measuring system.
Maintaining constant velocity is very important while working. For the purpose of this experiment, fluctuating velocity of the tape point was measured as absolute vibro-velocity.
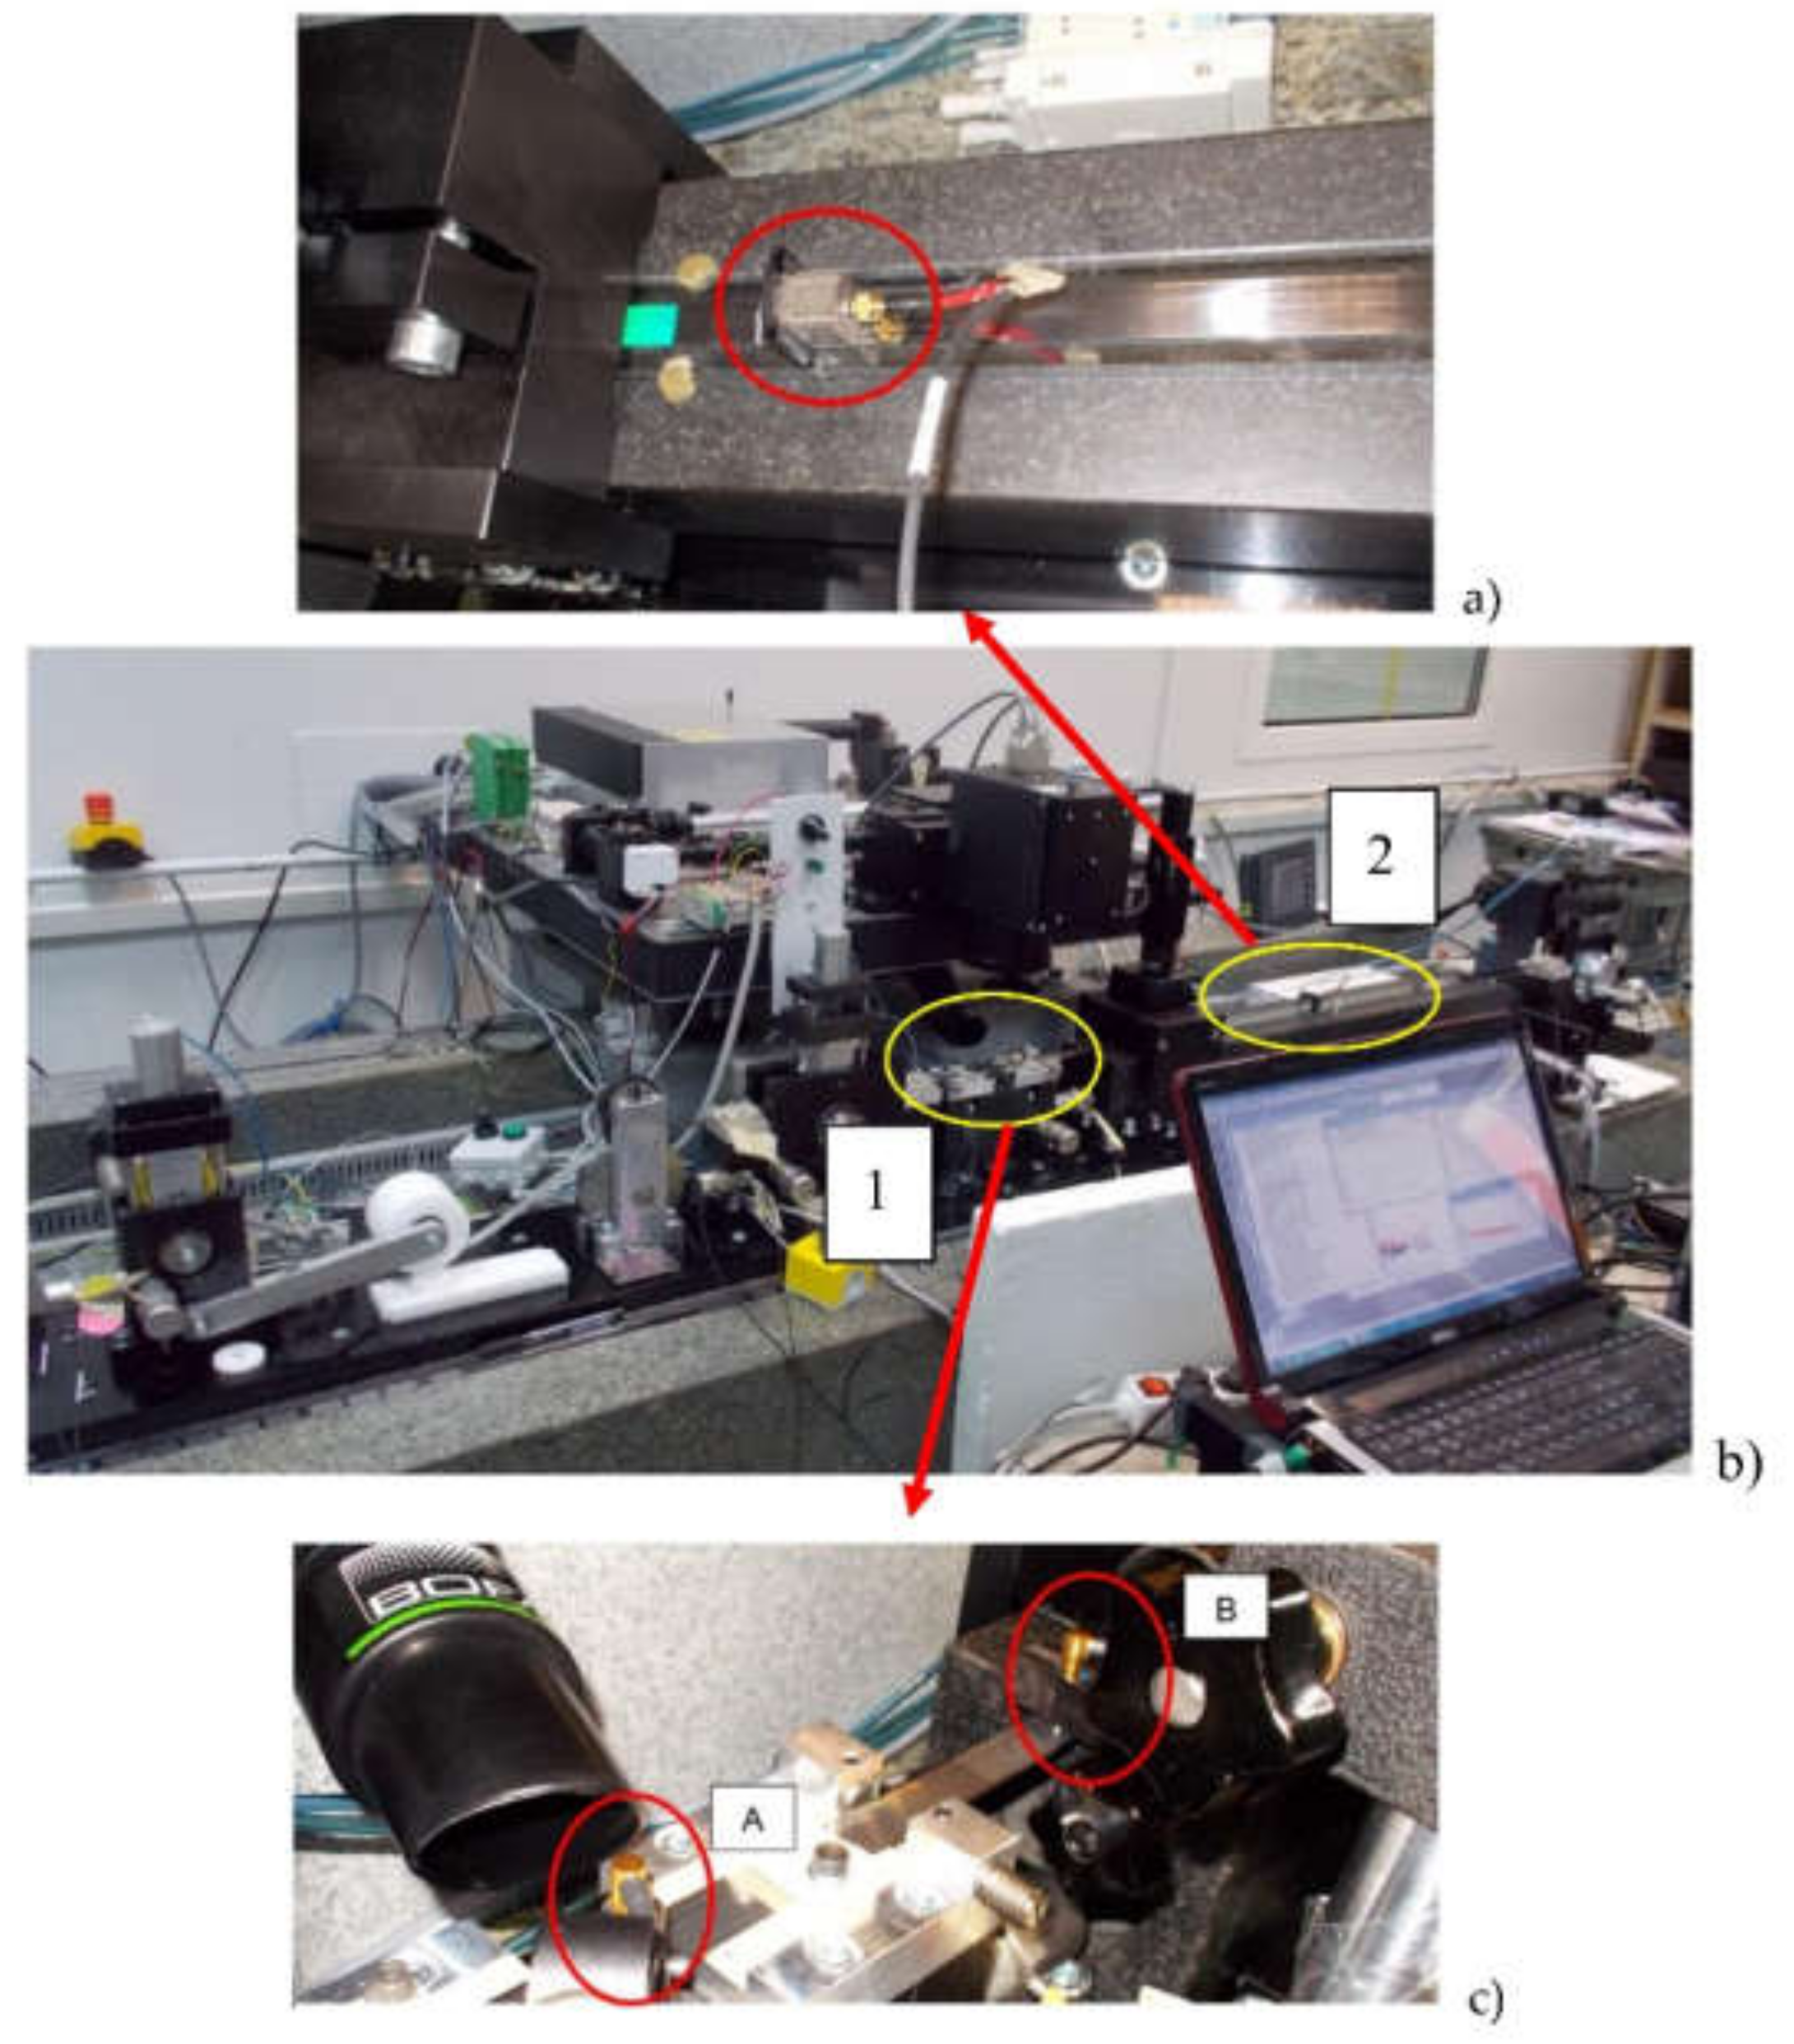
Three parameters were measured when determining dynamic properties of the research object (
Figure 4b): 1—displacement of the steel tape in the vertical direction Z (
Figure 4c); 2—velocity of the steel tape in the longitudinal direction Y (
Figure 4a); 3—displacement of the tape–angle transducer contact point was derived from angle sensor results. Capacitive displacement sensors CS02 were used to measure vertical displacements, measuring displacements at two points (A and B) of the tape (
Figure 4c). Point A was at the raster generation point (there was an additional support under the tape) and point B—on the tape between supports.
Figure 4a presents the image of the measurement of absolute steel tape vibrations (variation of point velocity) in longitudinal direction Y.
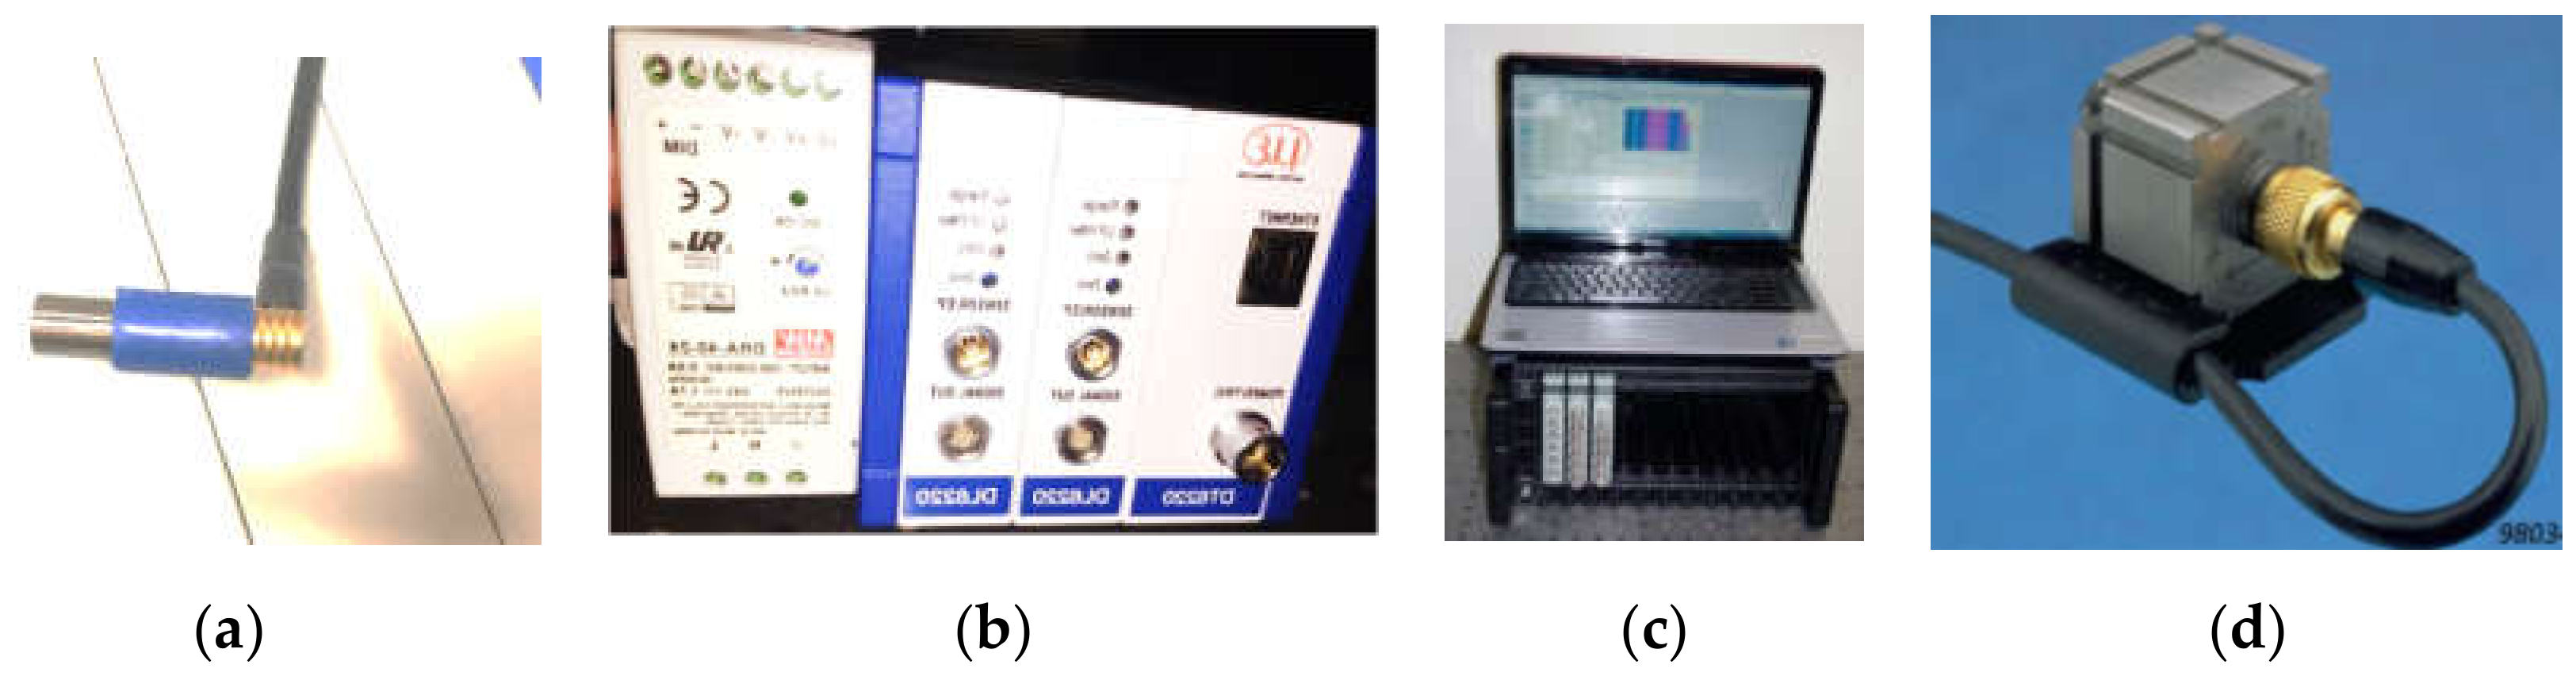
Brüel & Kjær vibration meters were used to measure vibration parameters and Micro-Epsilon meters were used to measure displacement. Displacement meters (
Figure 5a,b): a capacitive displacement sensors CS02; b controller DT6220 and demodulator DL6220.Vibration meters (
Figure 5c,d): c portable metering result processing, storage and control equipment 3660-D; d triaxial accelerometers 4506.
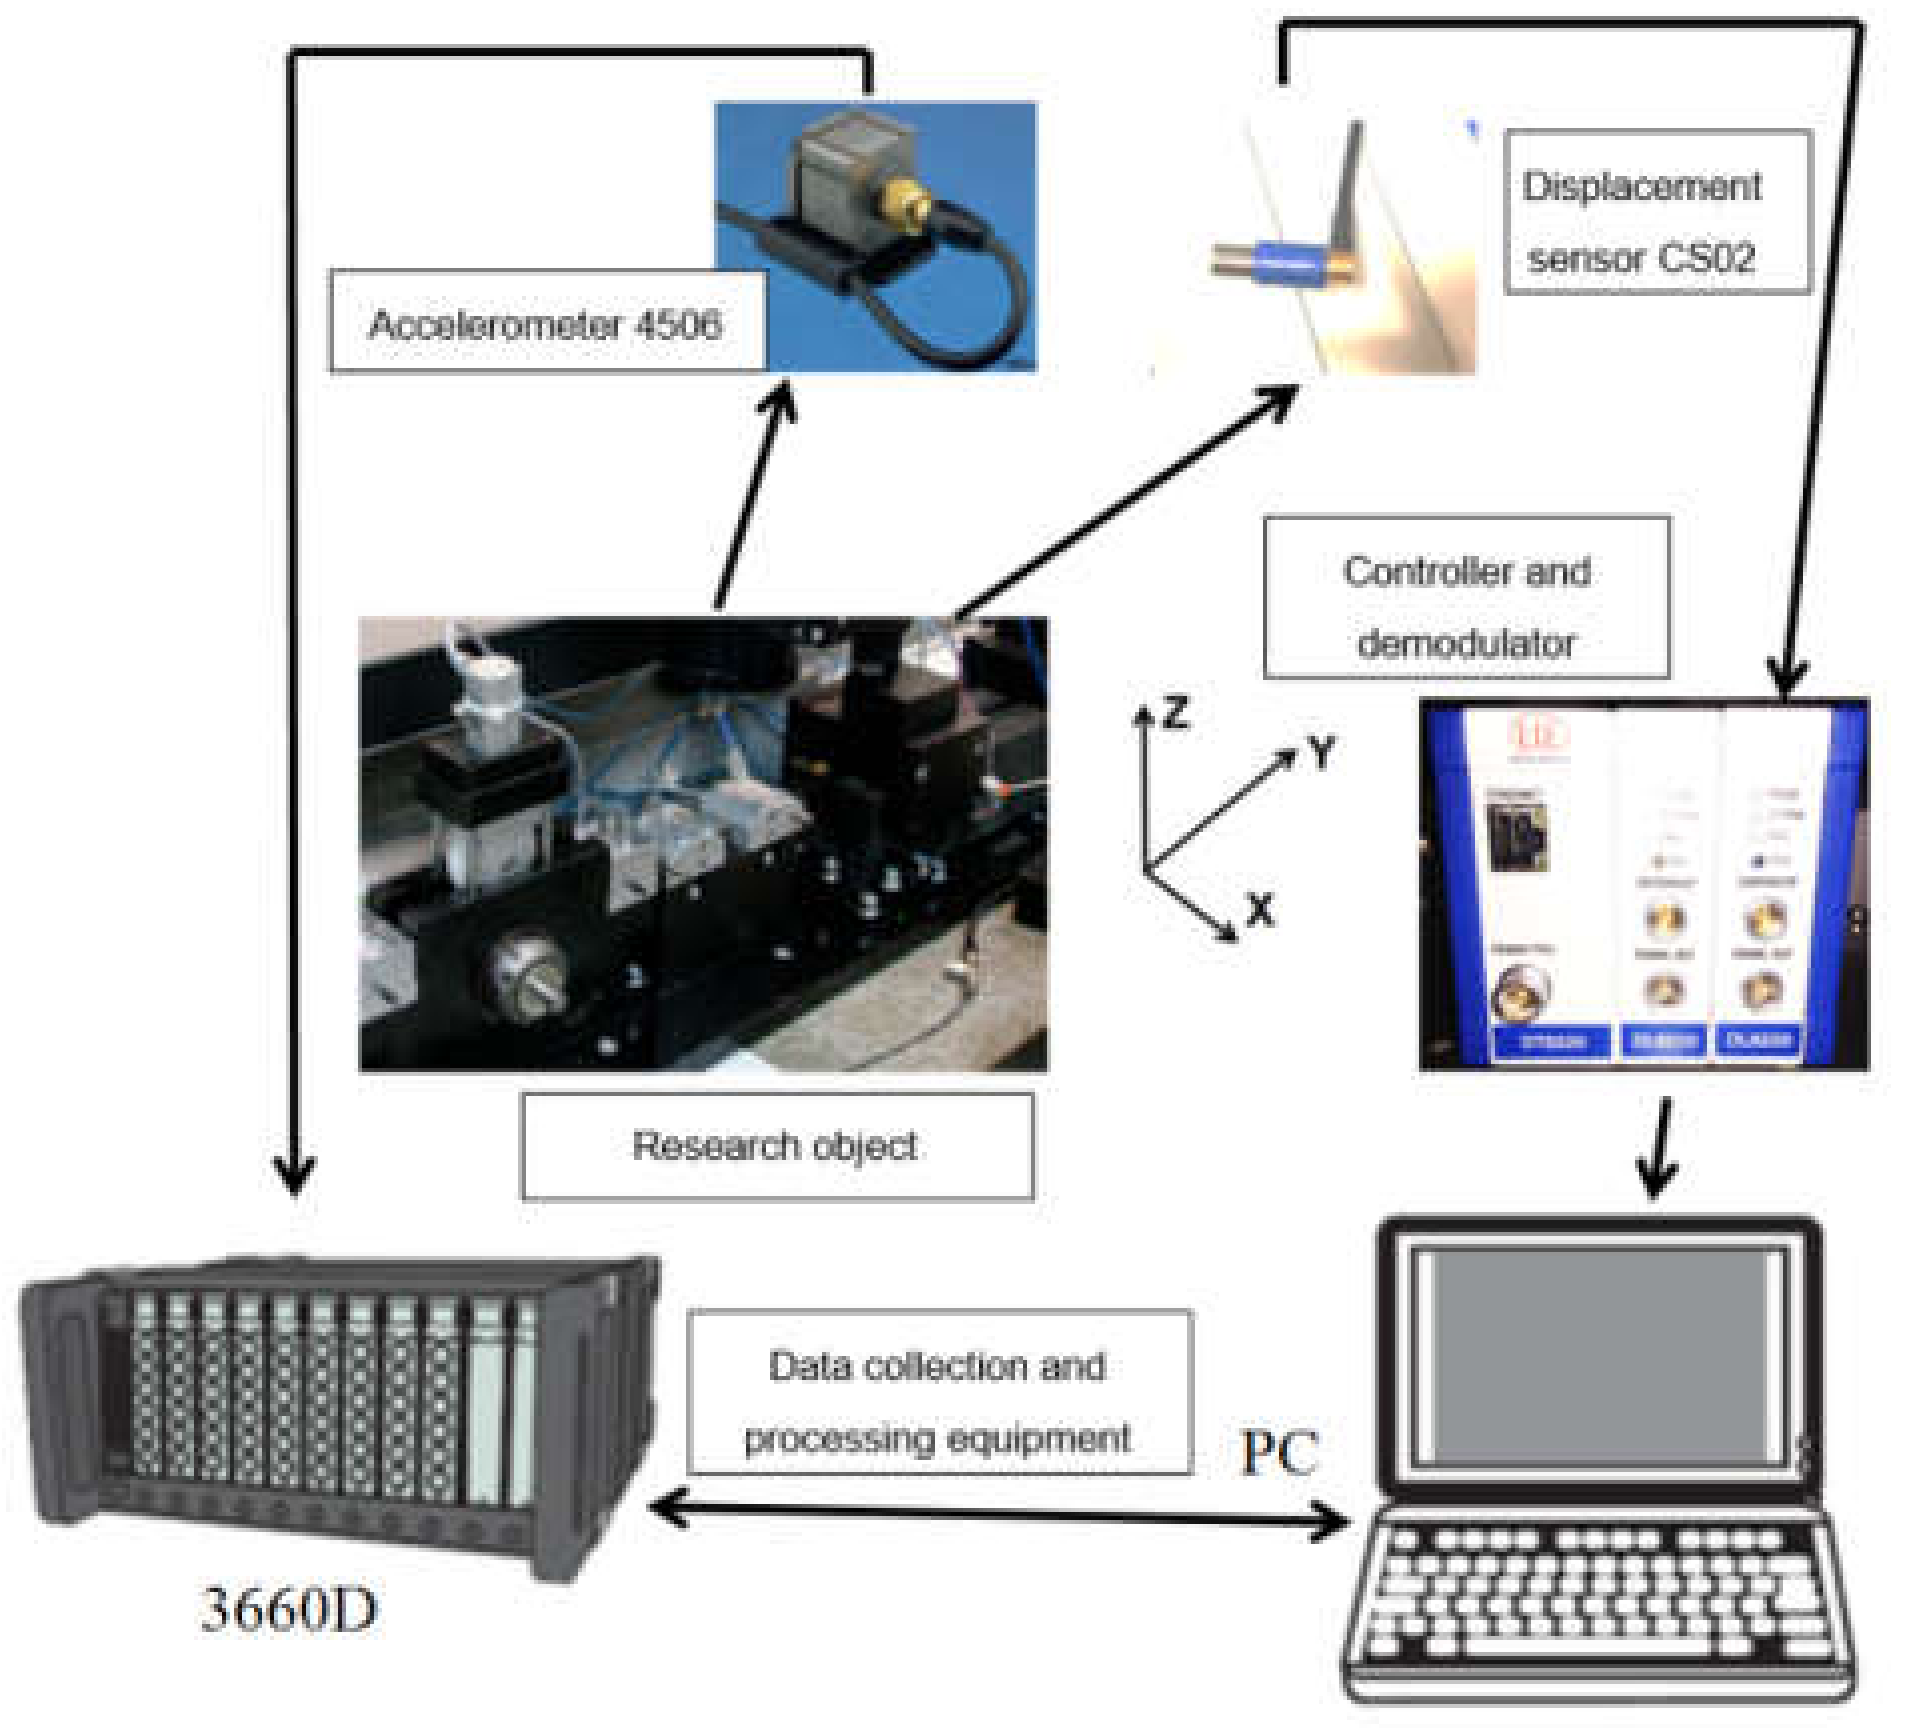
Figure 6 illustrates the block diagram of the research equipment and its relation to the research object (tape displacement measurement system).
The obtained measurement results were processed using the software package Origin, also calculating statistical parameters:
arithmetic average:
standard deviation:
range
where
n is the number of measurement results, x
i–measurement result
i.
The received measurement results are presented in
Figure 7,
Figure 8 and
Figure 9.
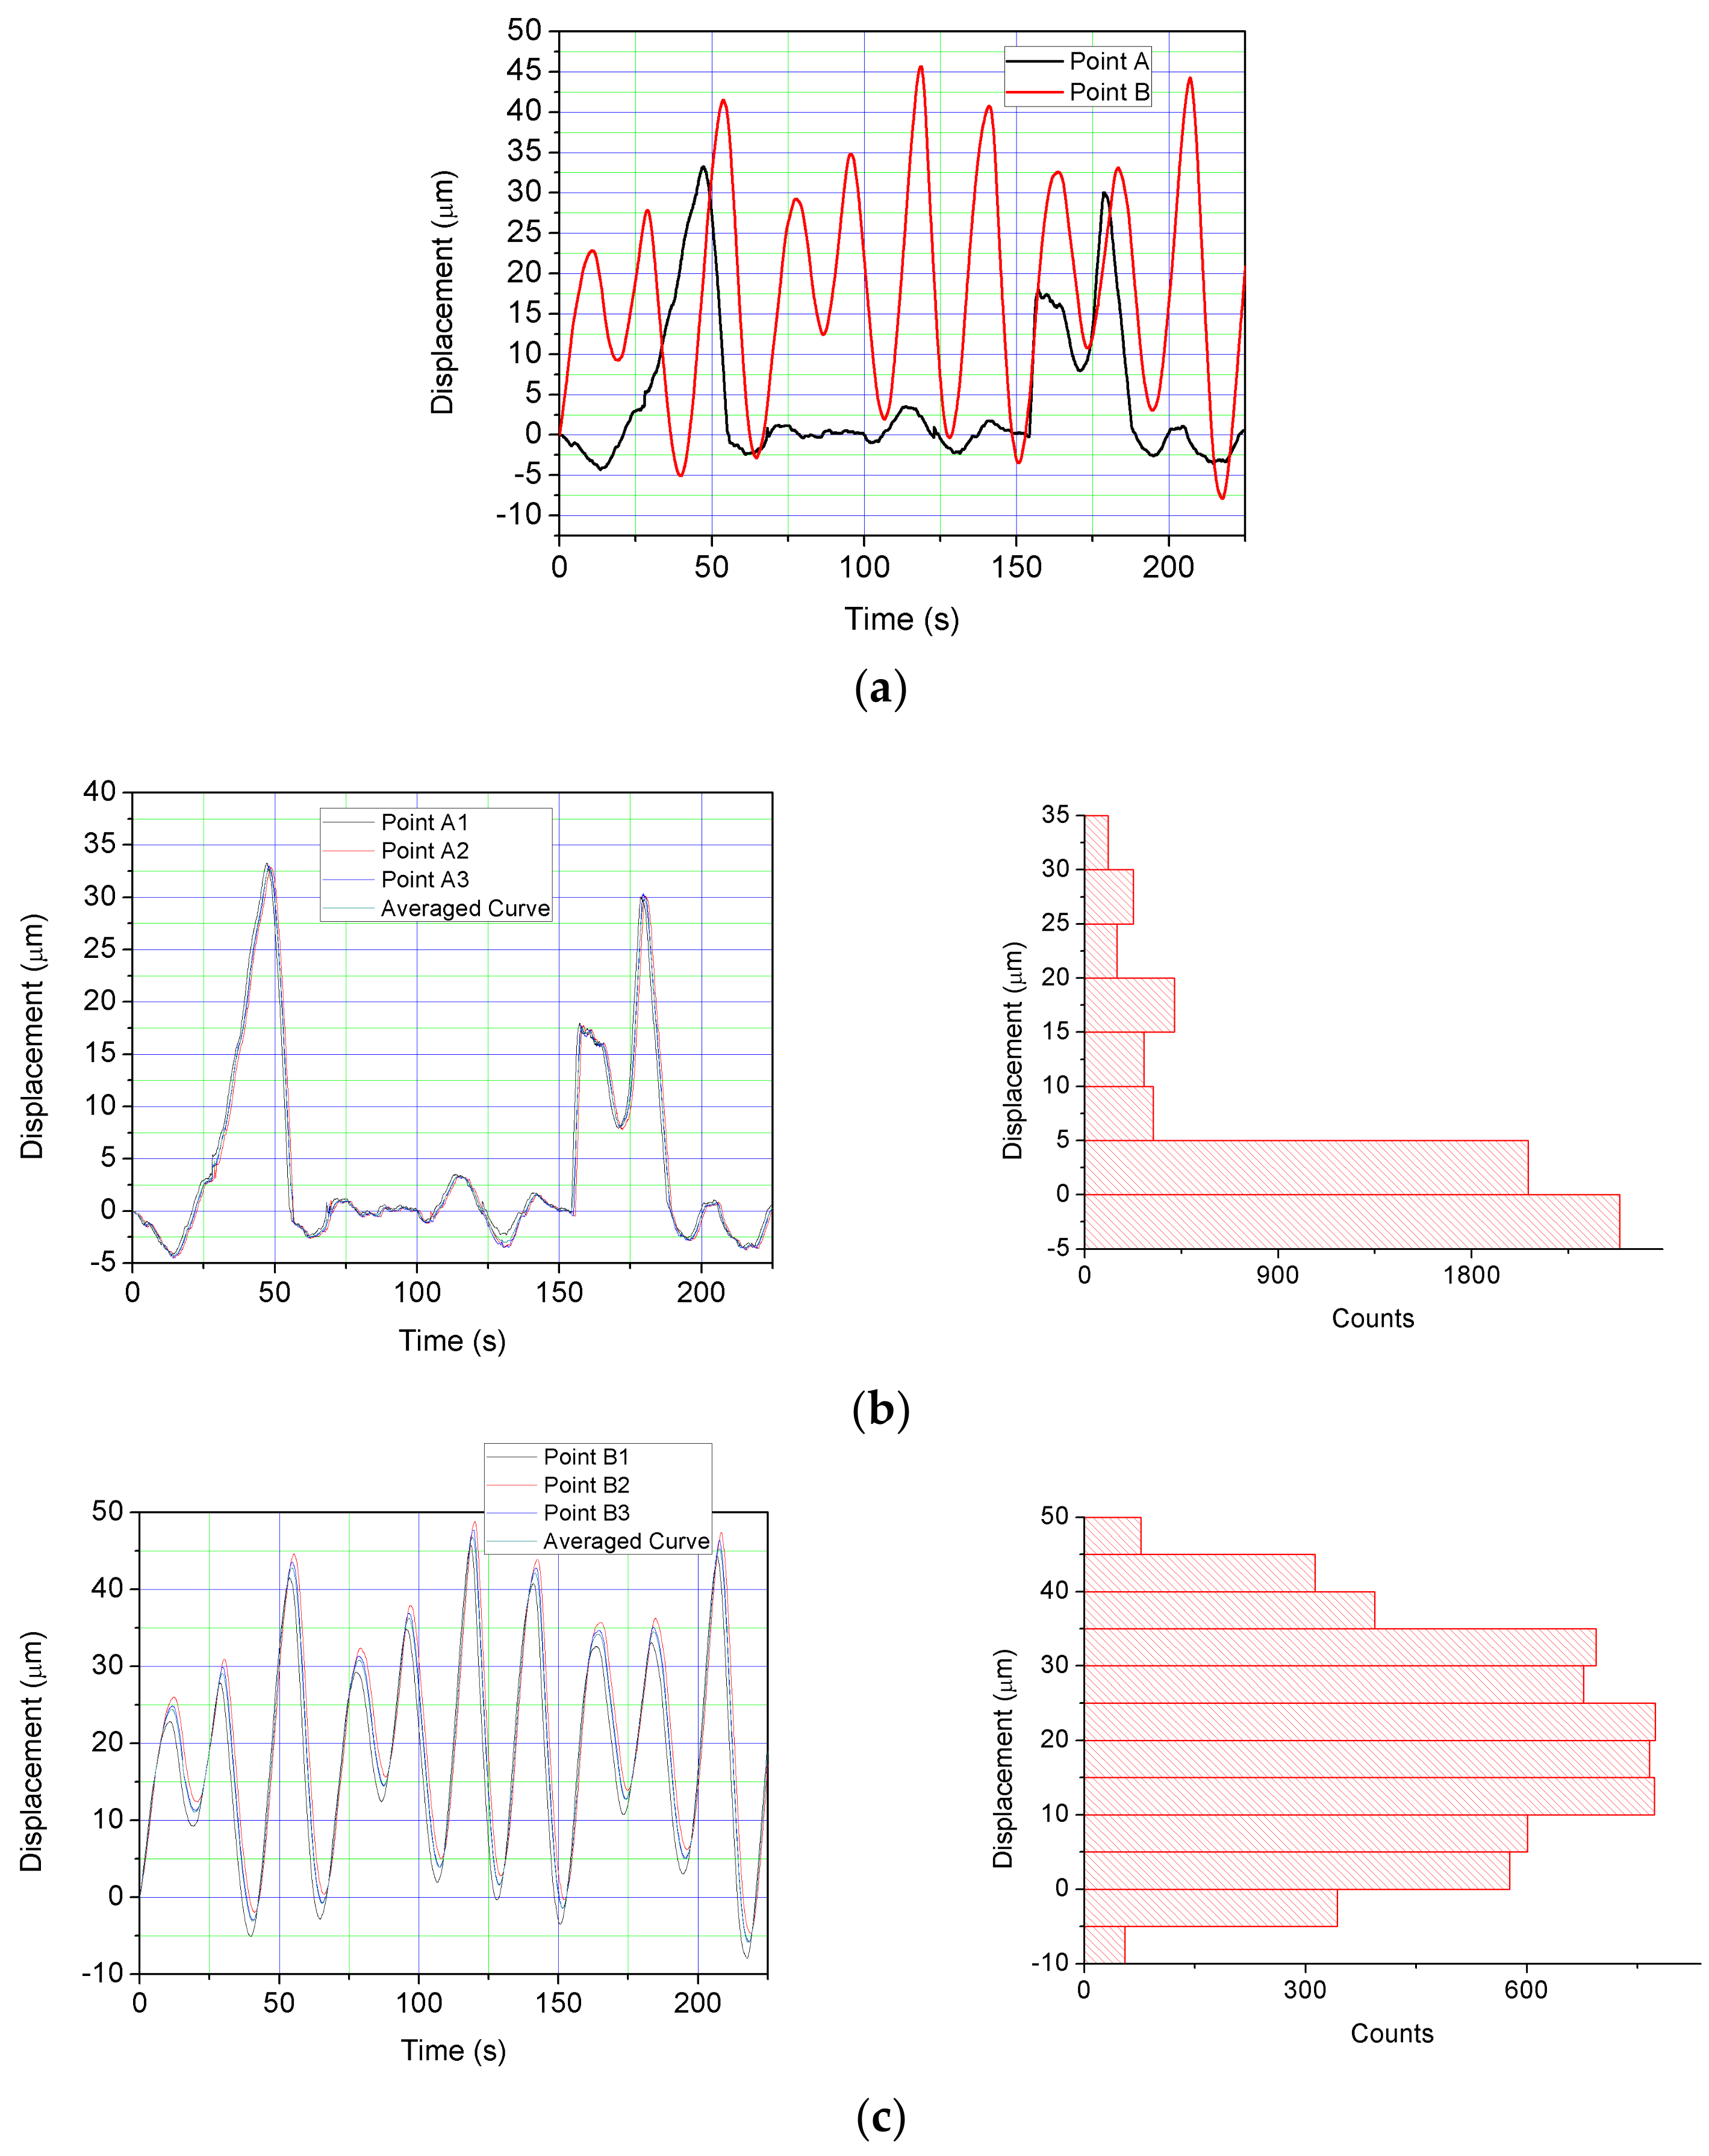
Figure 7 illustrates results of vertical displacements of the two points (A and B) (also see
Figure 4c) of the tape.
Figure 7a presents displacement results of points A and B (also see
Figure 4c) in operation (a generated raster distance of 500 mm), and
Figure 7b,c illustrates the curve and mean of three realizations, additionally presenting histograms of the mean.
Table 1 presents statistical parameters of three realizations of the displacement (A1, A2 and A3 and B1, B2 and B3) of points A and B (also see
Figure 4c).
The analysis of the results presented in
Figure 7 and
Table 1 allowed determining that the value of the displacement of tape point A in vertical direction varies by about 37.5 µm, and the value of the displacement of tape point B varies by about 53.5 µm. The value of displacement of point B is greater because the lower tape part of point B is not supported. The frequency of tape oscillations is very low (0.04 Hz), and oscillations of such frequency are likely to have been caused by deviations in the shape of the tape.
Table 1 presents the analysis of the results where the standard deviation of the measurements ranges between 0.09% and 0.87%.
Errors in the displacement measuring system directly affect the accuracy of raster formation on steel tape. Vertical displacements (see
Figure 7) up to 50 µm of significant steel tape points (points A and B (also see
Figure 4c)) were observed when stretching the tape. The analysis of vertical displacements of point B revealed that they have a periodic shape and vertical displacements of point A have three peaks at 48, 161 and 180 s. Points of support of the tape affect such a change of vertical displacements of the significant points A and B.
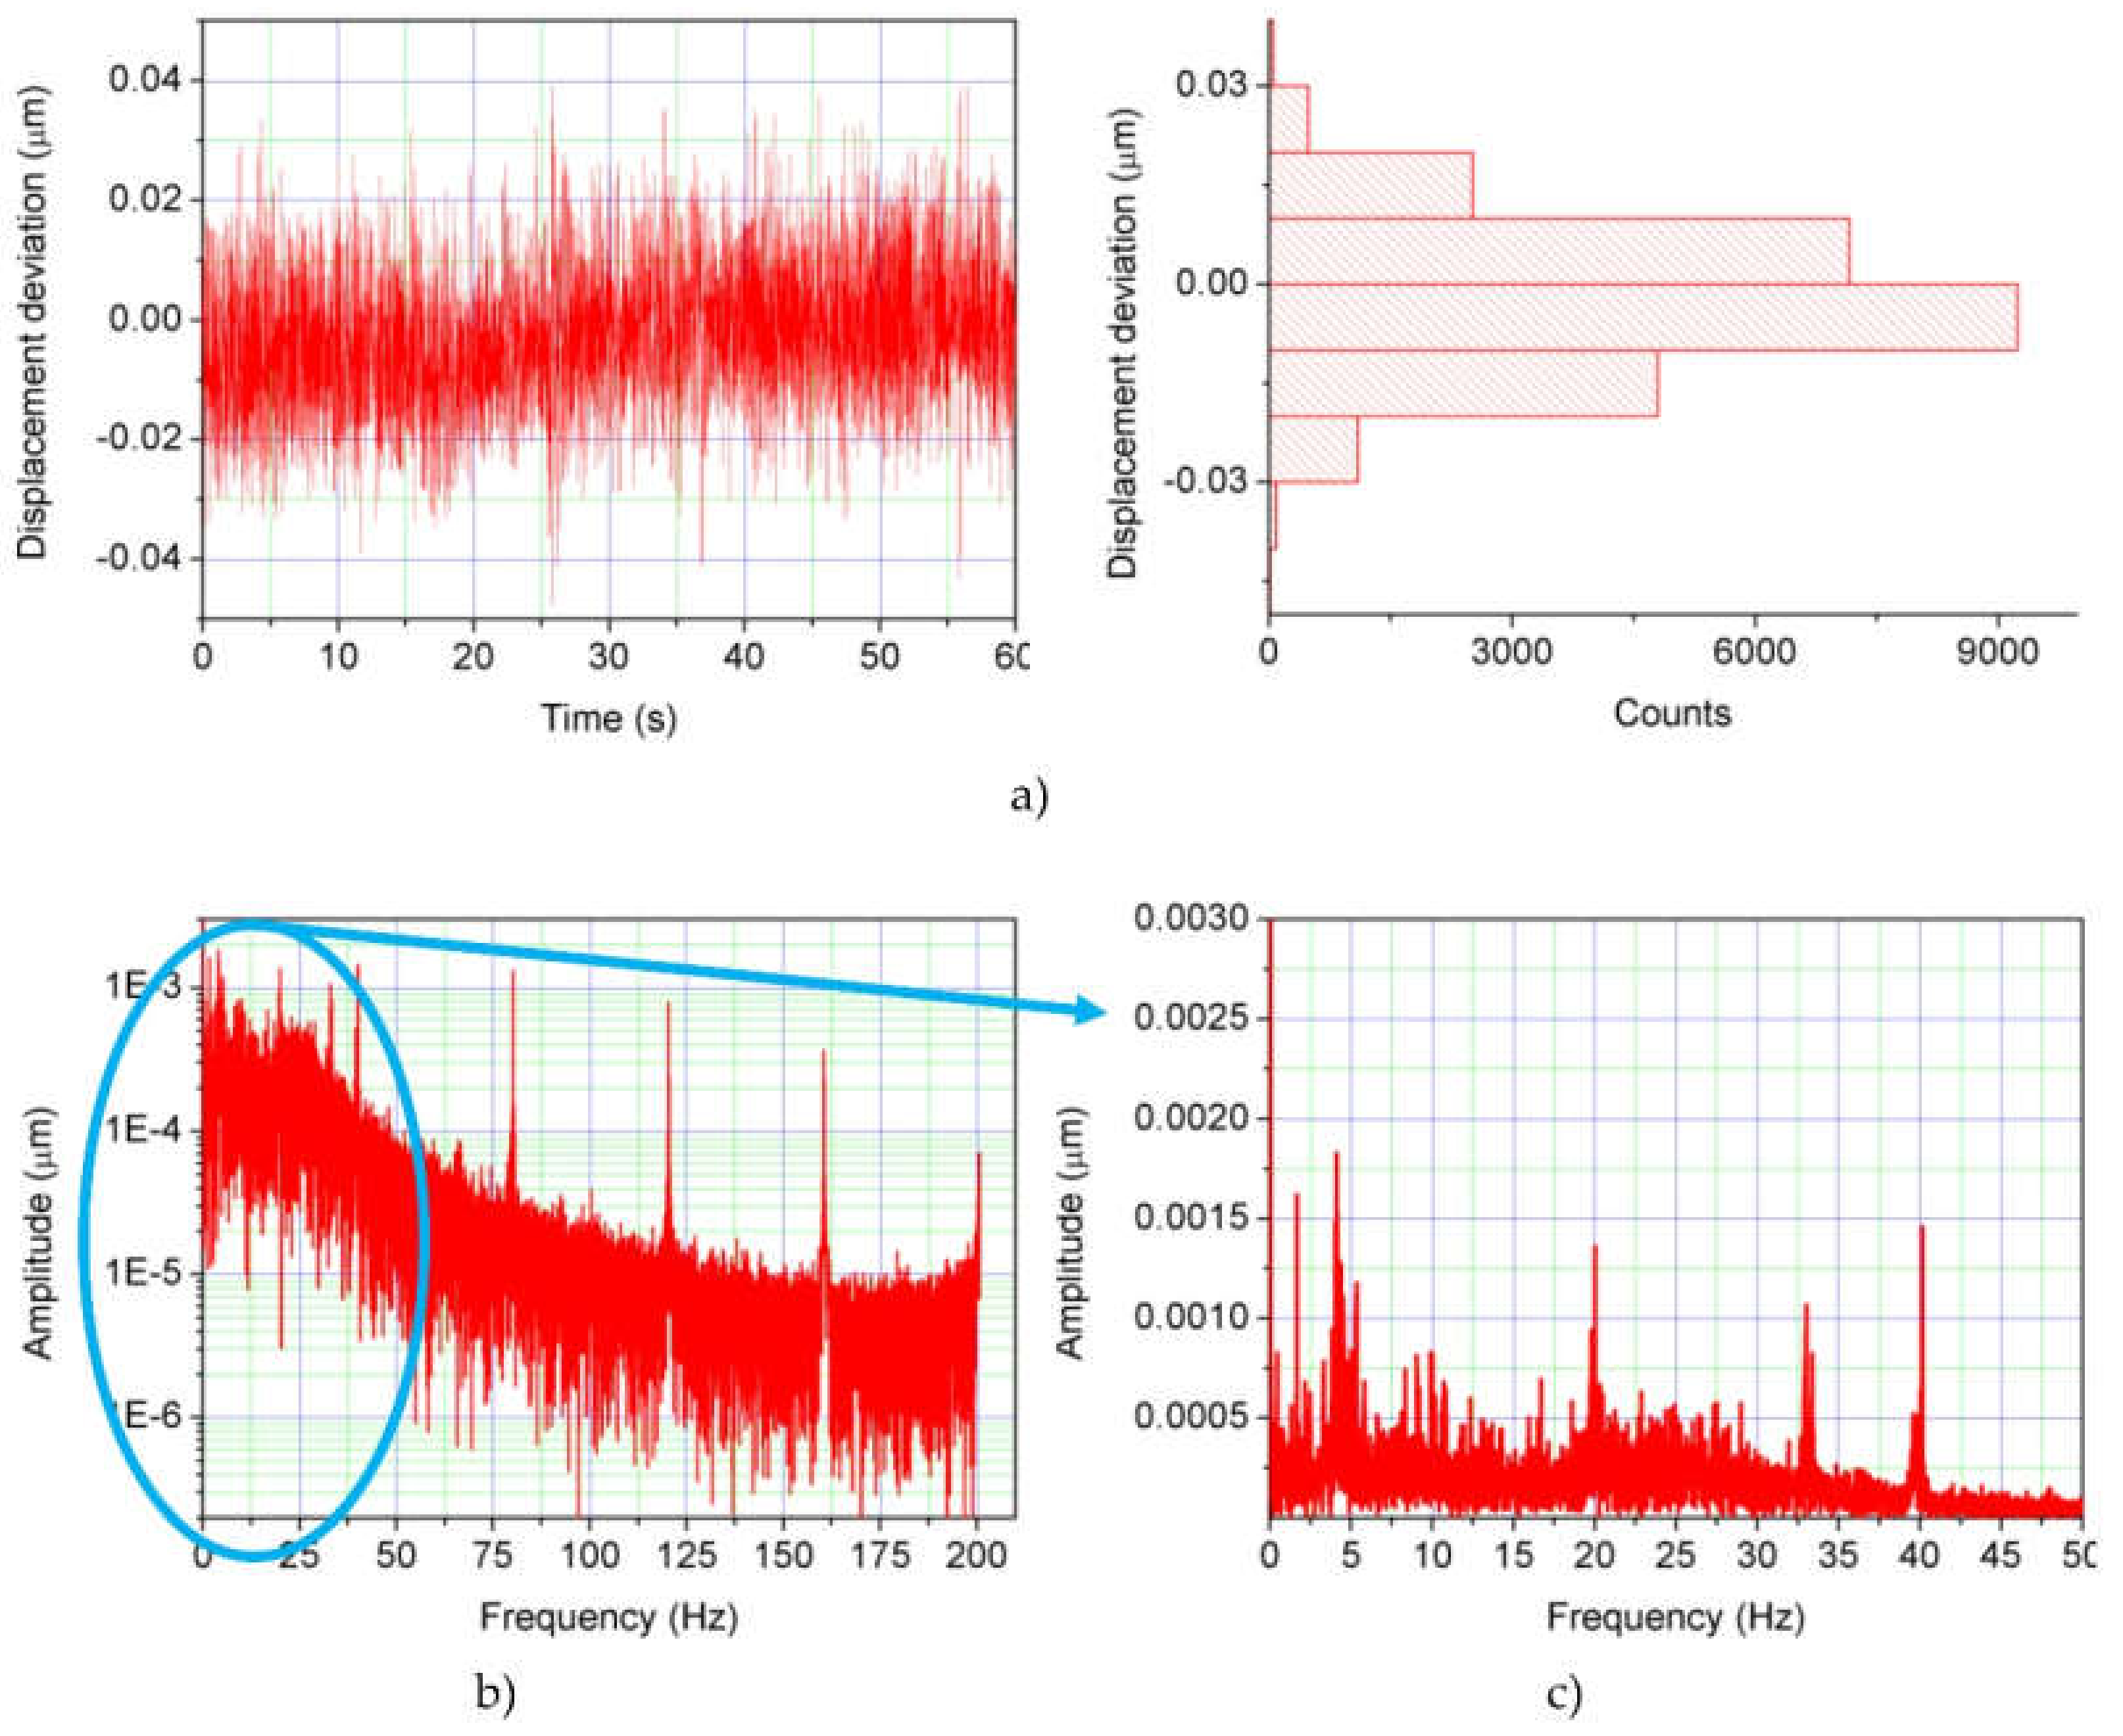
Figure 8 presents the results of the measurement of the displacement of the tape–angle transducer contact point, which is calculated using the results of the angle sensor.
Figure 8a illustrates the time graph and the histogram,
Figure 8b presents the spectral density graph and
Figure 8c—the spectral graph part expanded to 50 Hz.
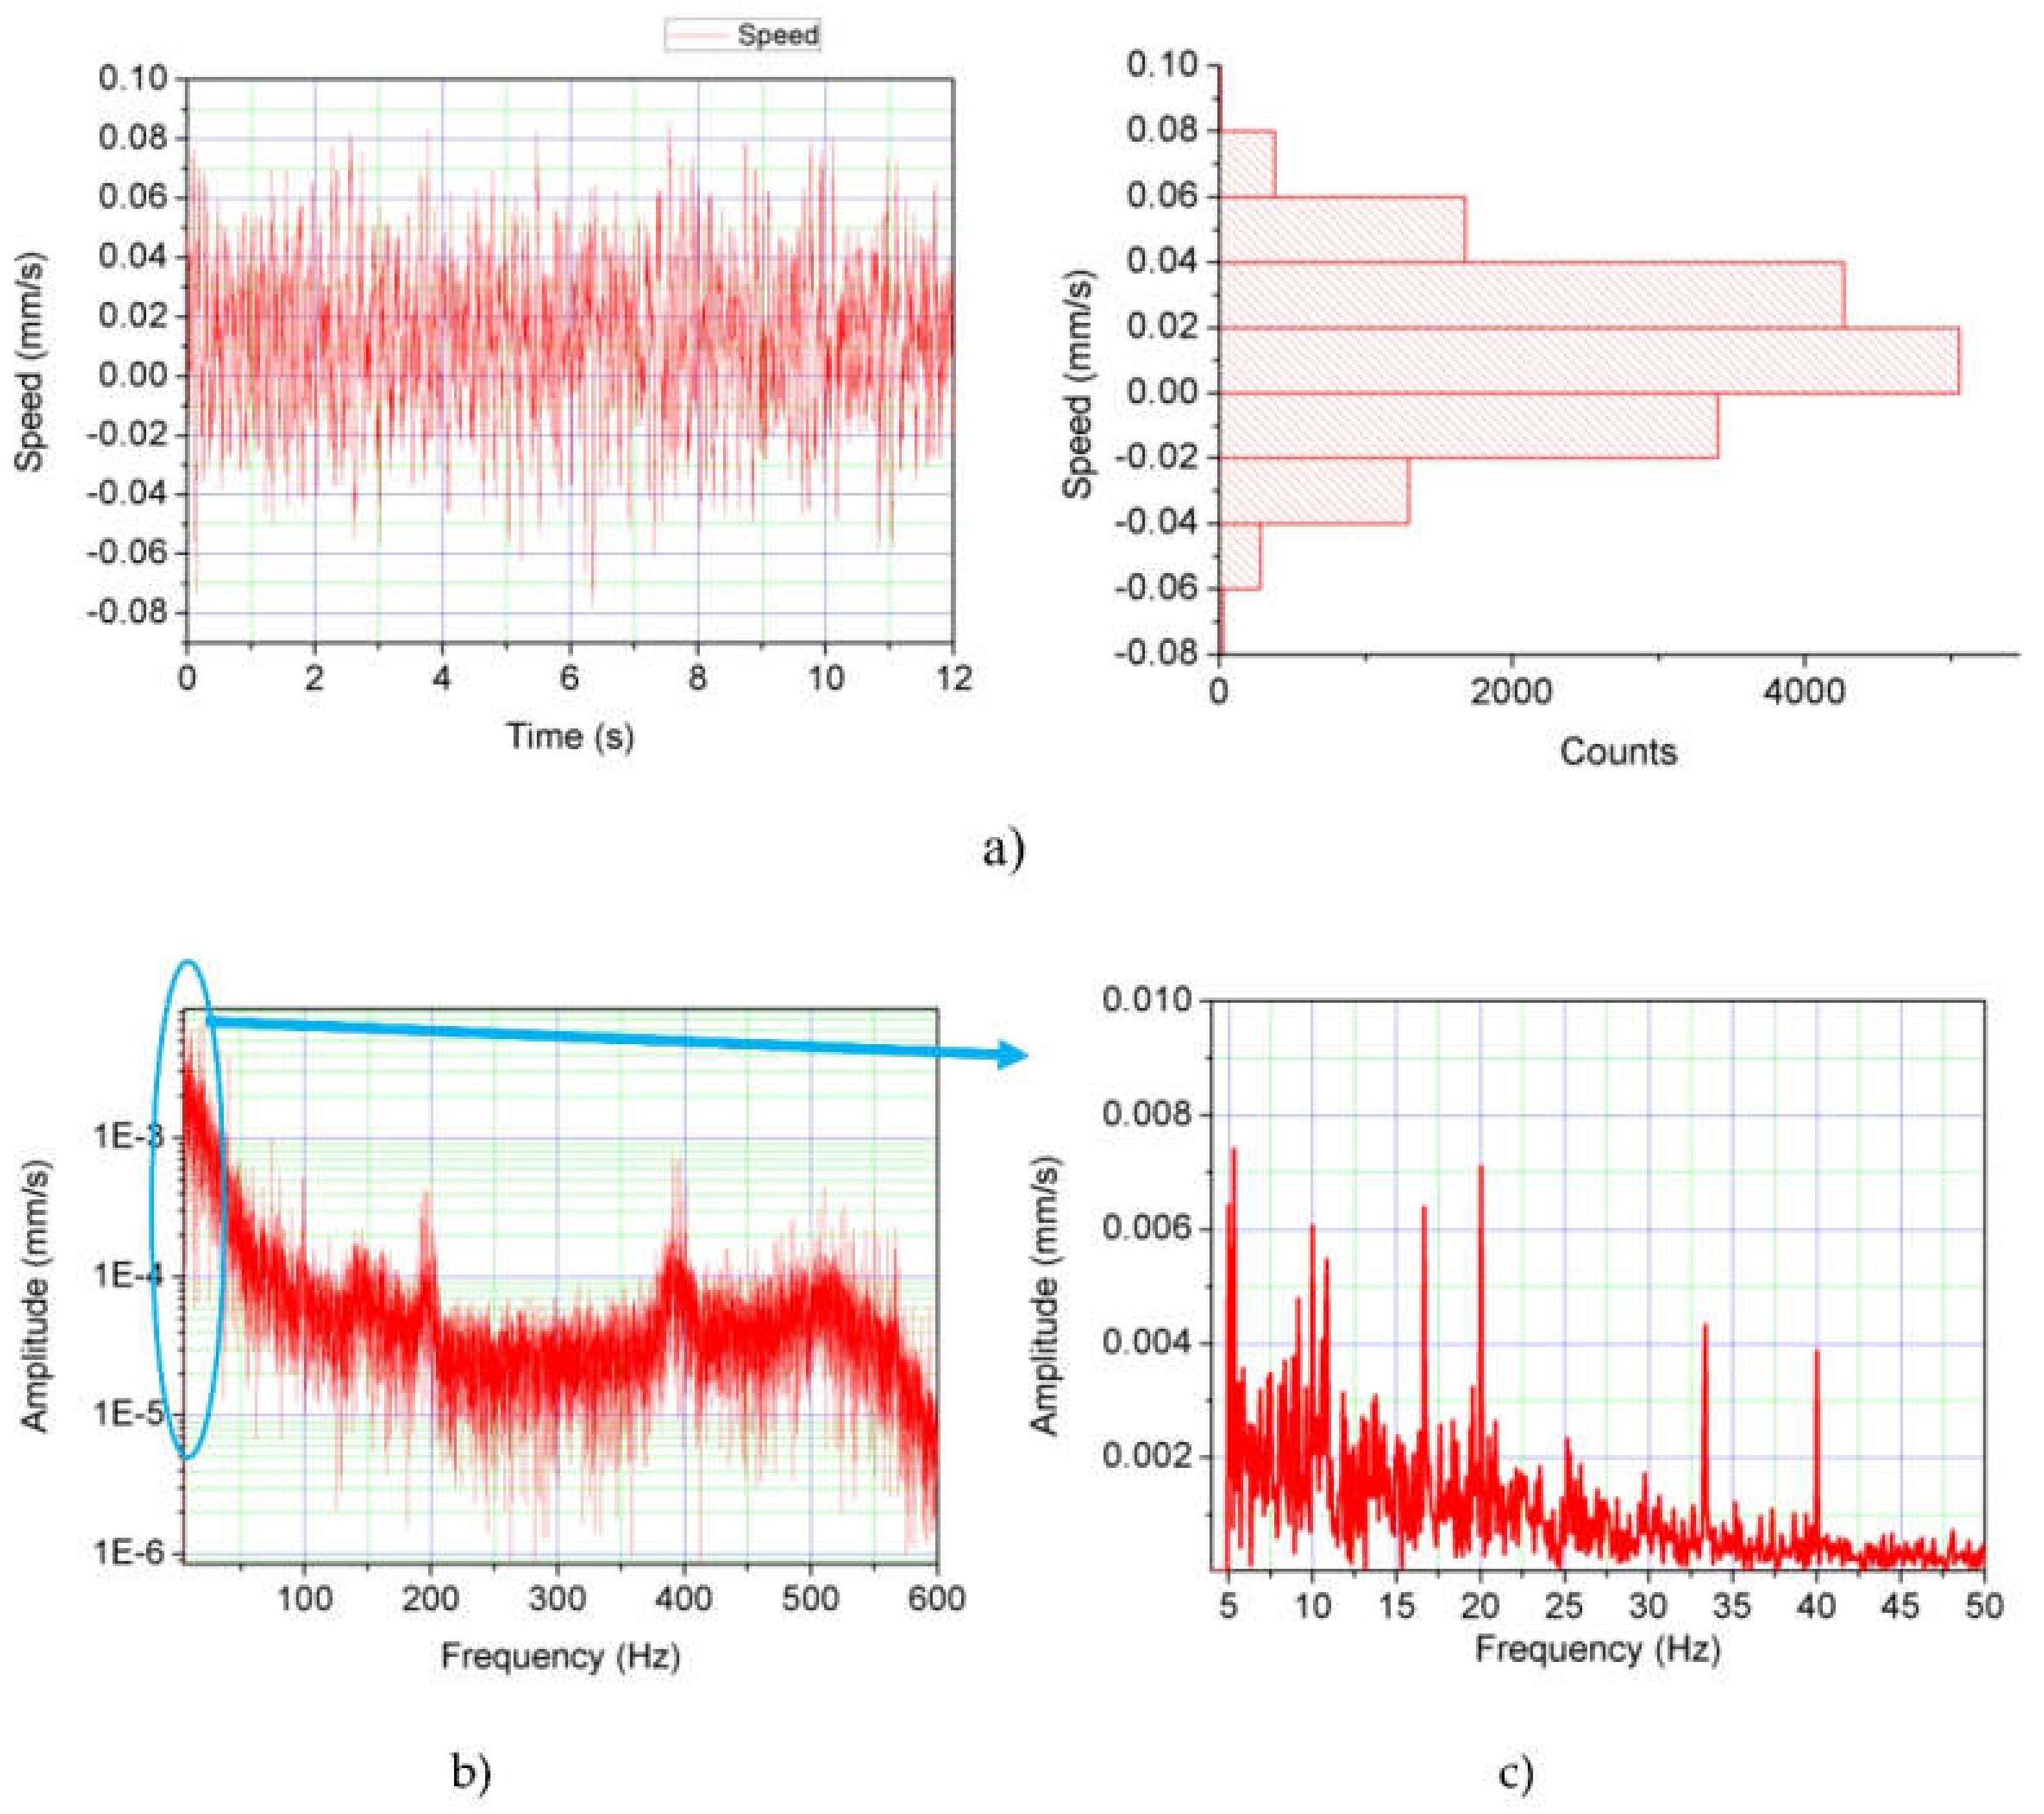
Figure 9 illustrates the results of the measurement of the steel tape velocity (i.e., speed mismatch at 2 mm/s) in the longitudinal direction Y.
Figure 9a presents the time graph and the histogram,
Figure 9b—the spectral density graph and
Figure 9c—the spectral graph part expanded to 50 Hz.
Table 2 presents statistical parameters of the results of the measurement of the displacement of the tape–angle transducer contact point and velocity in the longitudinal direction Y.
The assessment of the results of the displacement of the tape–angle transducer contact point (
Figure 8 and
Table 2) revealed that the value of the displacement of tape–angle transducer contact point varies by about 0.086 µm. The analysis of the received spectral density results revealed that the the following frequencies appeared in the tape displacement graphs: 1.67; 4.04; 19.9; 32.7; 40; 80.1; 120.9 and 160 Hz.
The assessment of the tape velocity results (
Figure 9 and
Table 2) revealed that the tape velocity value varies by about 0.163 mm/s. The analysis of the obtained spectral density results showed that the following frequencies appeared in the tape displacement graphs: 6.17; 10.04; 17.1 19.9; 32.7; 40; 80.1; 120.9 and 160 Hz.
The analysis of the received results showed that frequencies appearing in tape displacement and velocity frequency graphs in
Figure 8 and
Figure 9 were very close, and the assessment of the tape slip in respect of the angle transducer allows stated that there was no slip in the frequency range from 0 to 200 Hz.
The analysis of graphs in
Figure 8c and
Figure 9c revealed that the displacement and velocity amplitudes at the same frequencies dominated (examining the frequency range up to 50 Hz), which indicated that the band motion patterns were transmitted to the tape–gauge roll assembly and there was no slip between the tape and gauge rolls.
4. Numerical Investigation of Tape Displacement
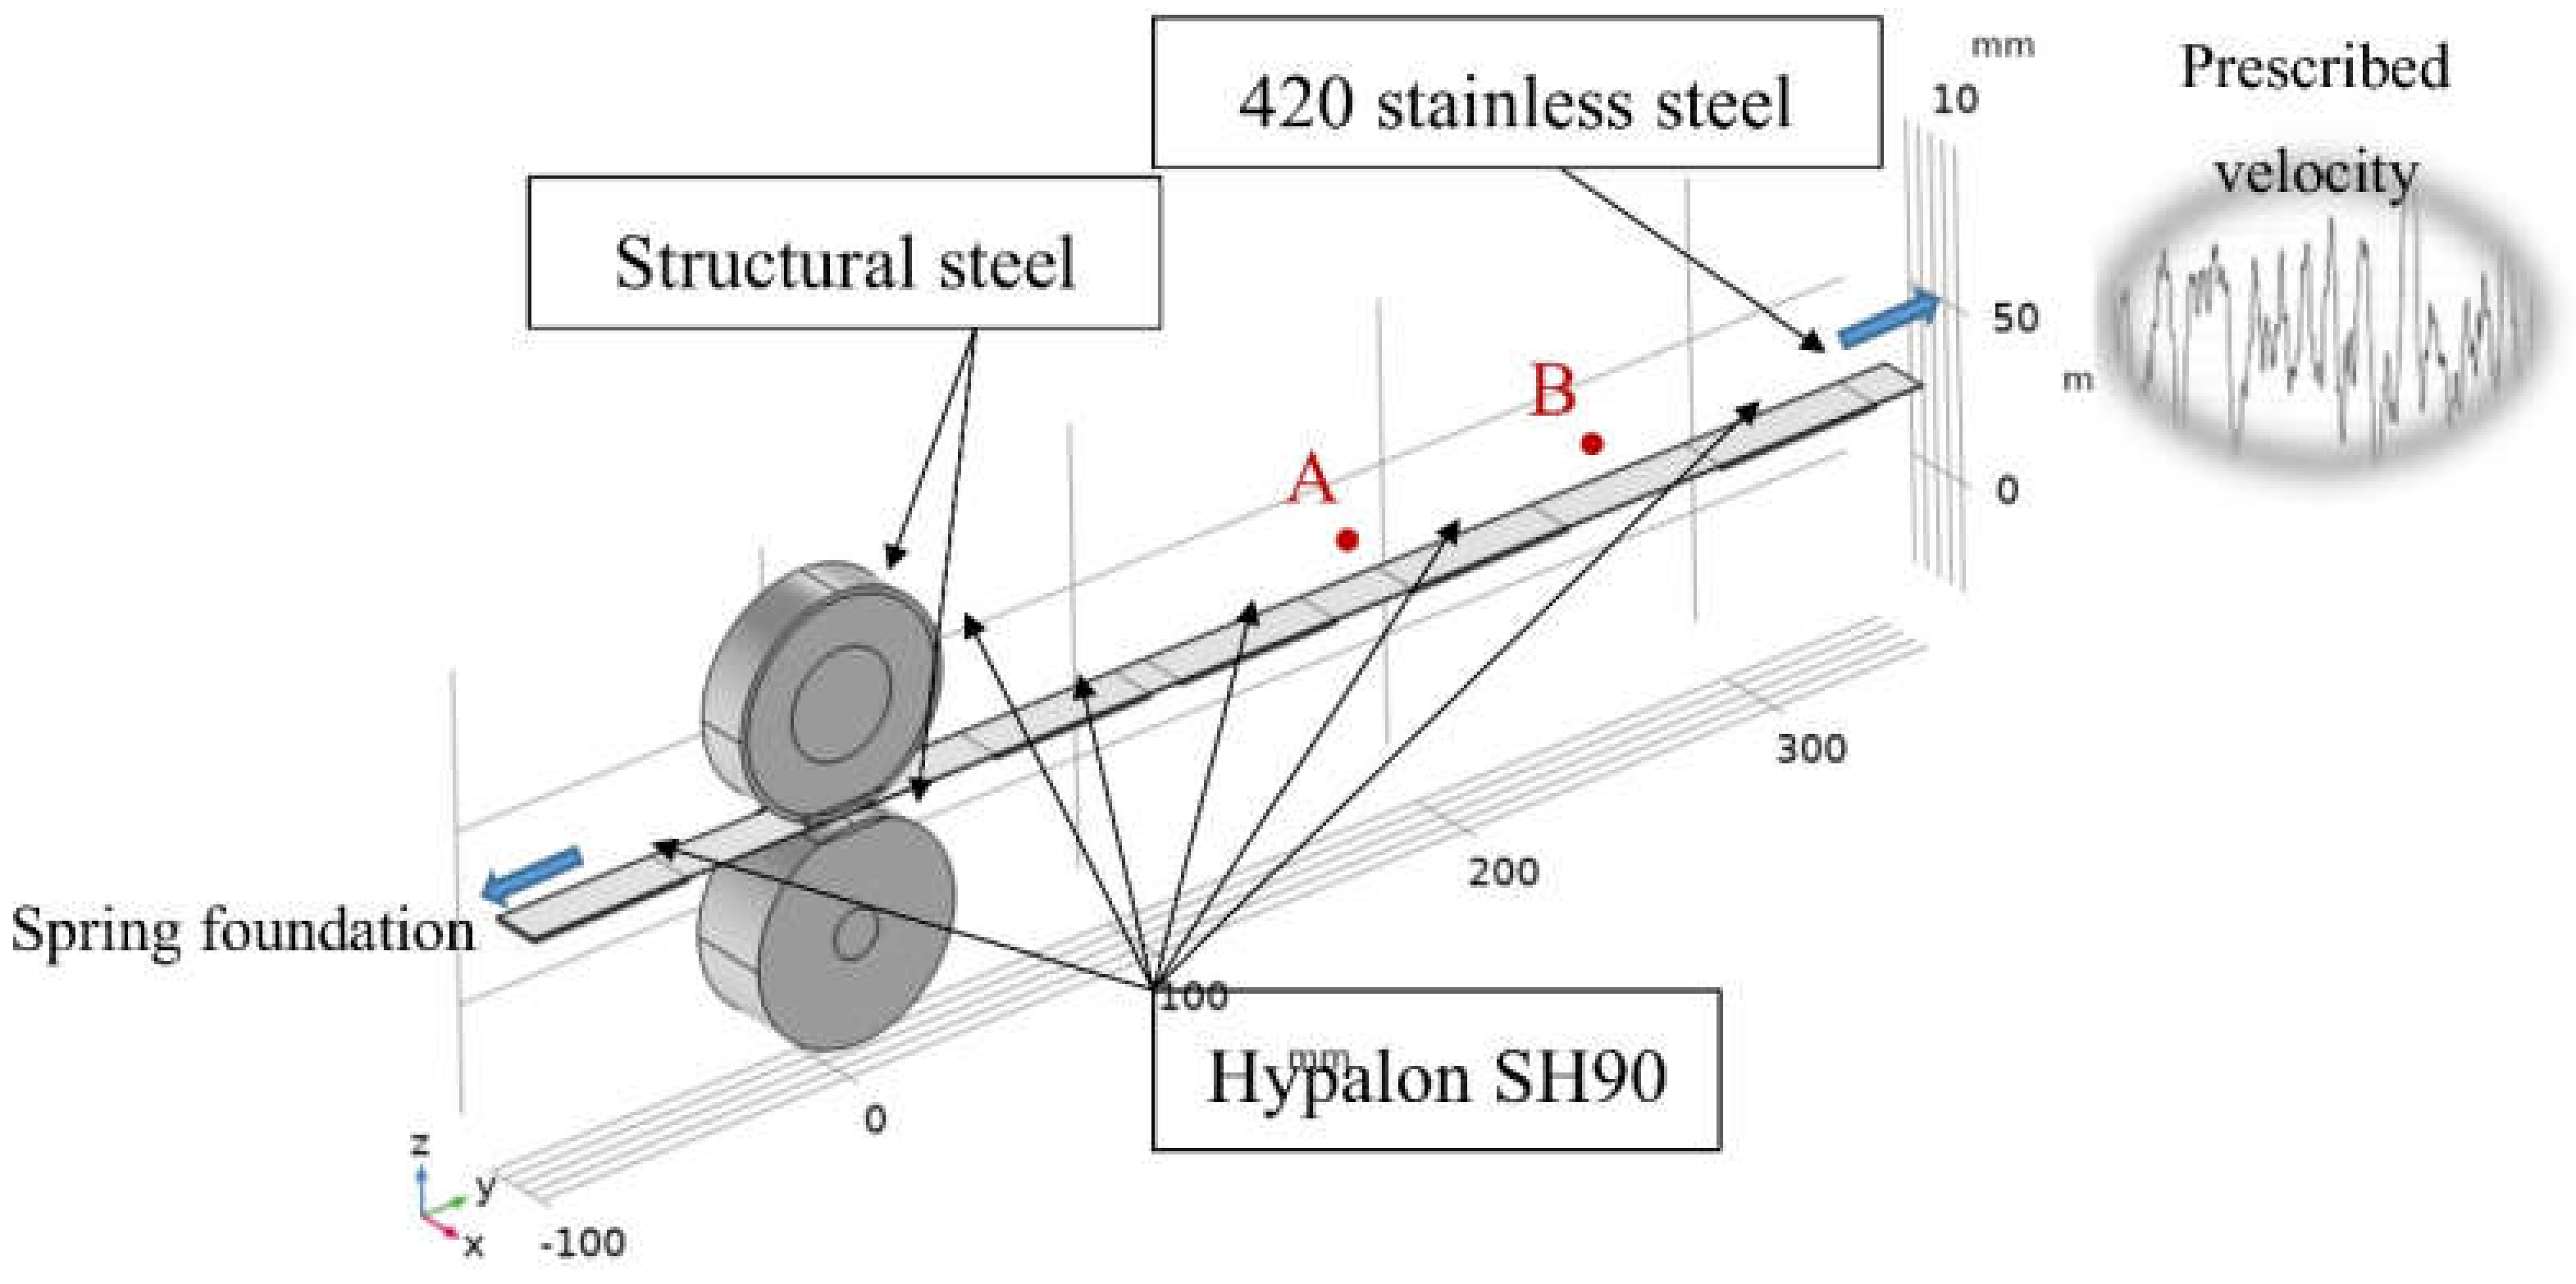
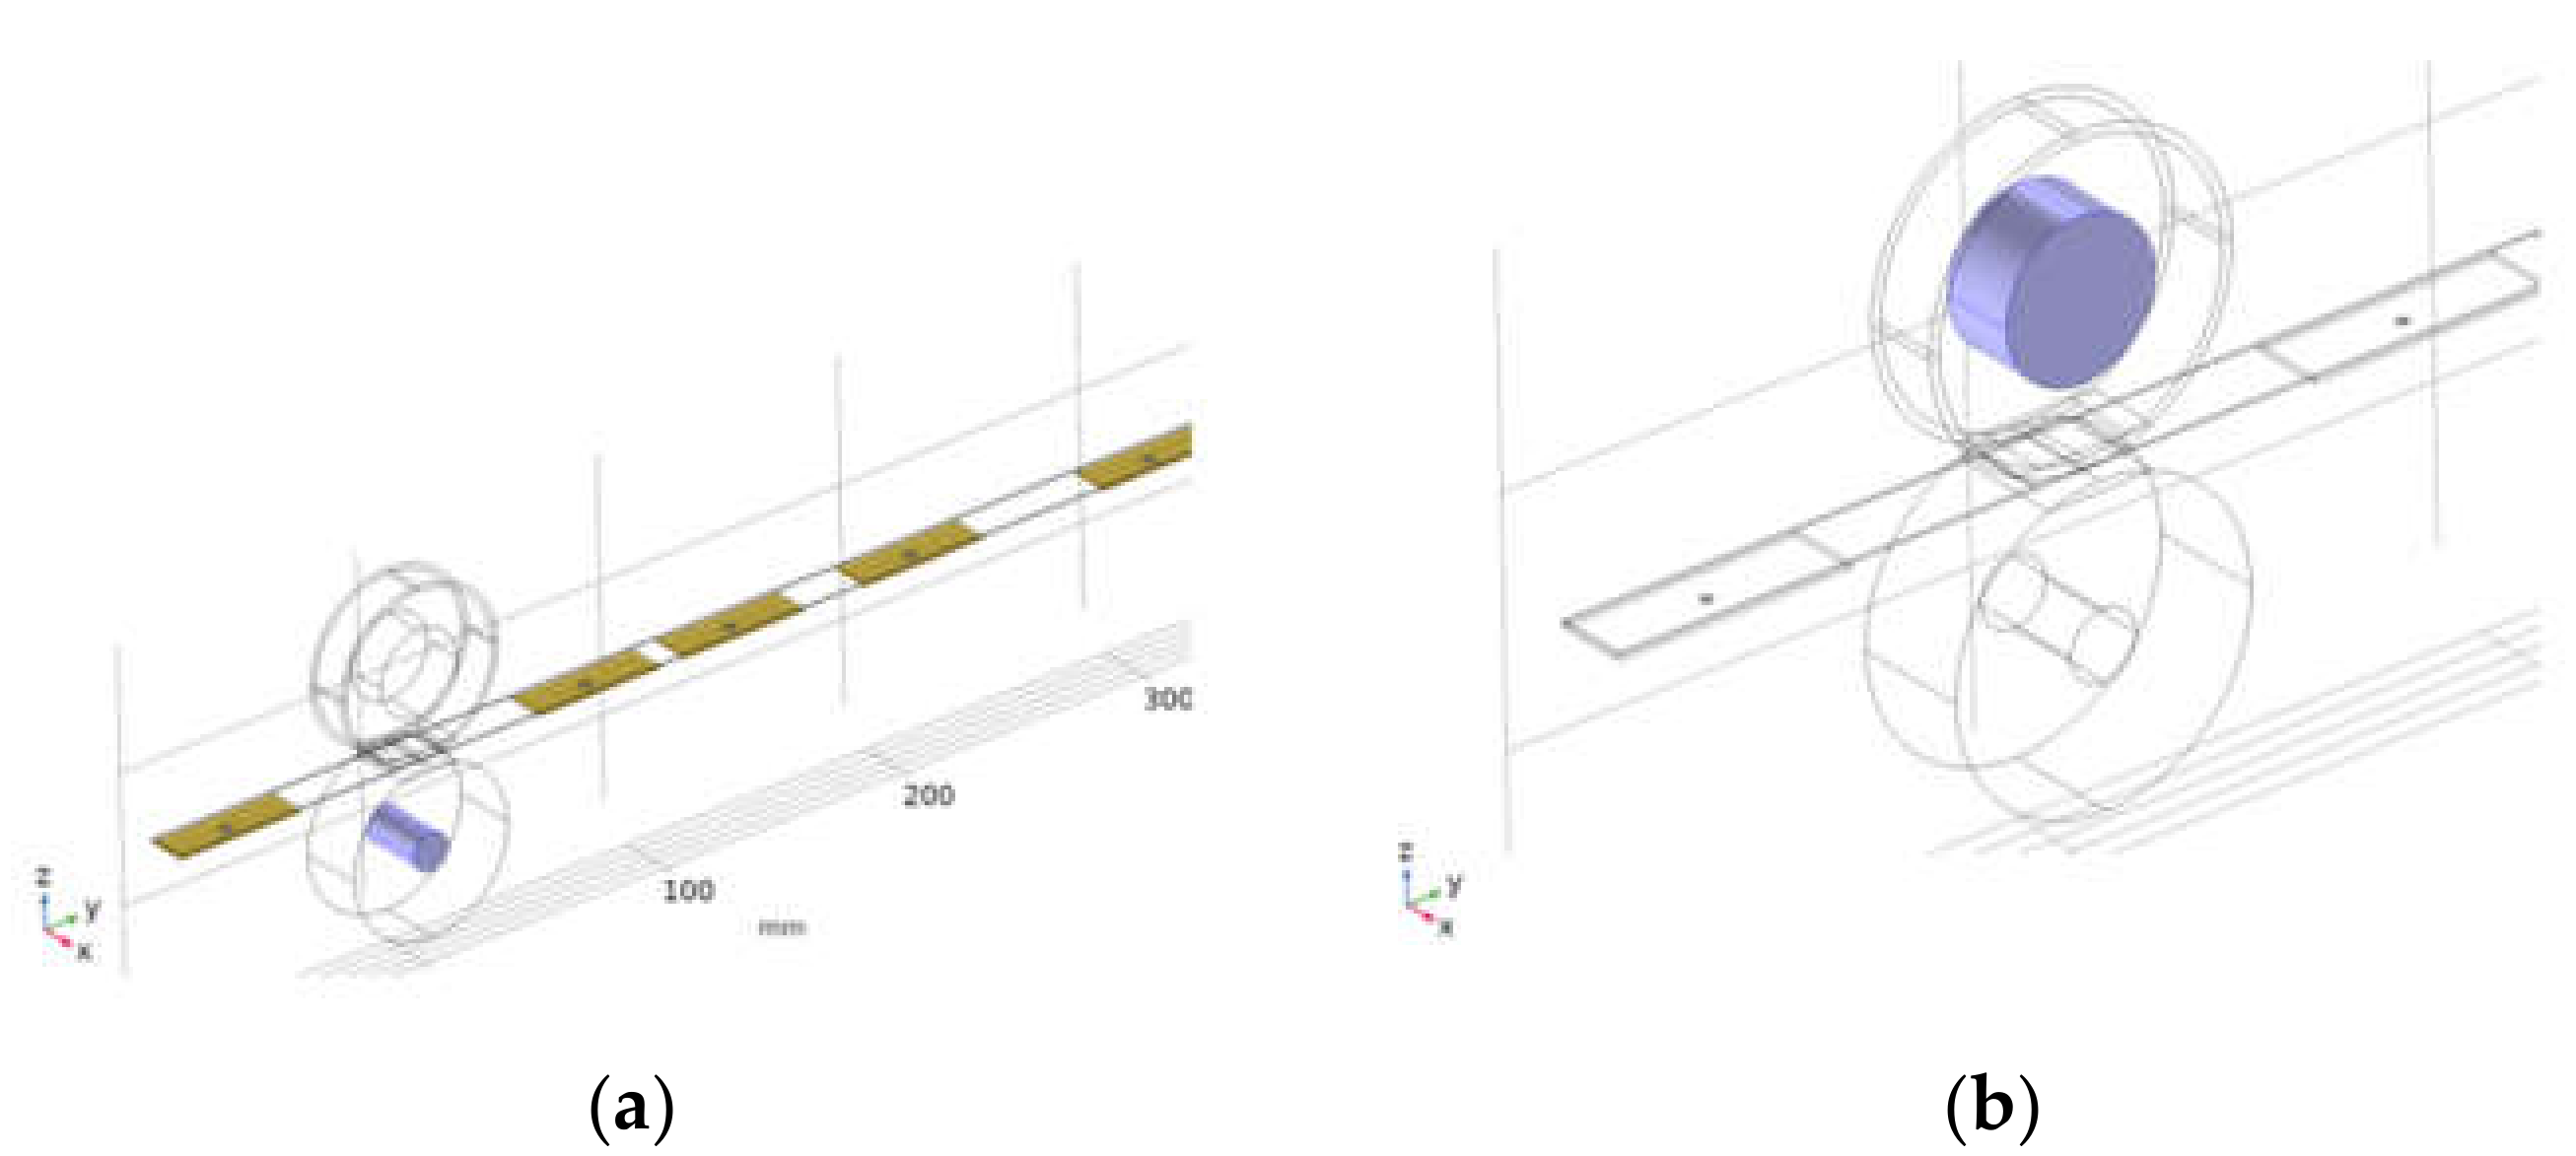
A model for calculating mechanical properties (
Figure 10) was developed for the tape displacement measurement system, which was one of the most important components of a raster generation device. It should be noted that the numerical simulation model presents one very important node in the experimental setup illustrated in
Figure 4c.
Five Hypalon plates were affixed to the bottom and top of the steel tape. Both top and bottom contact pairs were monitored during simulation.
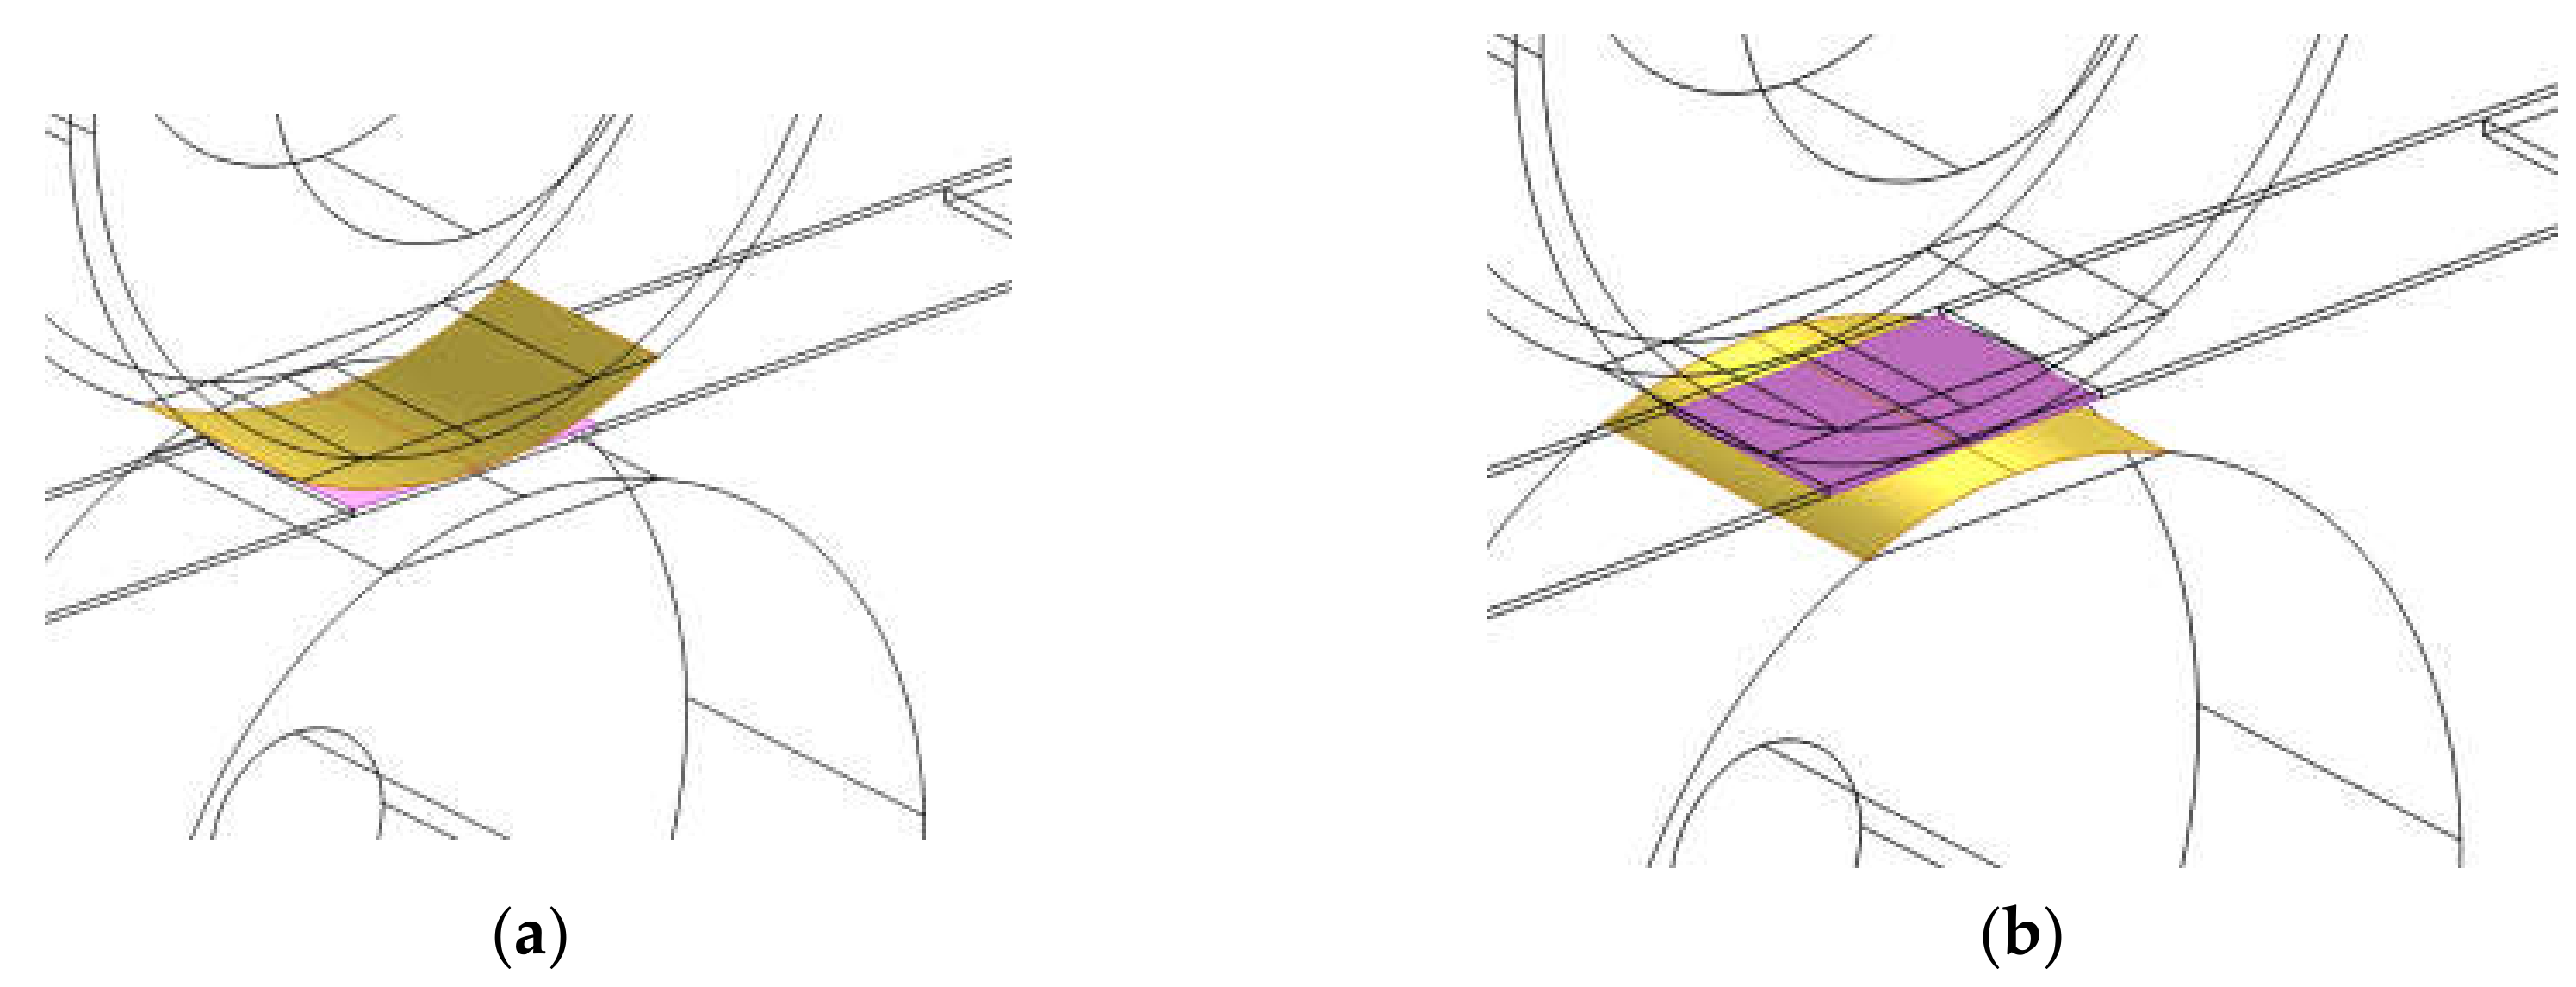
Figure 11 illustrates the contact pairs. The iterative solution method was selected. Two selections of boundaries that could not penetrate each other under deformation were chosen for the analysis of the contact pair boundary condition.
The contact pairs defined boundaries for parts that could come into contact as shown in
Figure 11a,b, for upside and downside contacts, respectively. The augmented Lagrangian was selected as the algorithm for computing contact in the normal direction. Characteristic stiffness in current simulation was equivalent to Young’s modulus. Penalty factor controls the stability and stiffness of the interface surface during iterations. Moreover, an additional control over solver cutbacks, such as trigger cutback criterion in numerical simulation, was not used because there was no destination boundary movement history. The exponential dynamic Coulomb friction model using both static and dynamic friction coefficients were included in the time dependent study for both contact pairs (
Figure 11).
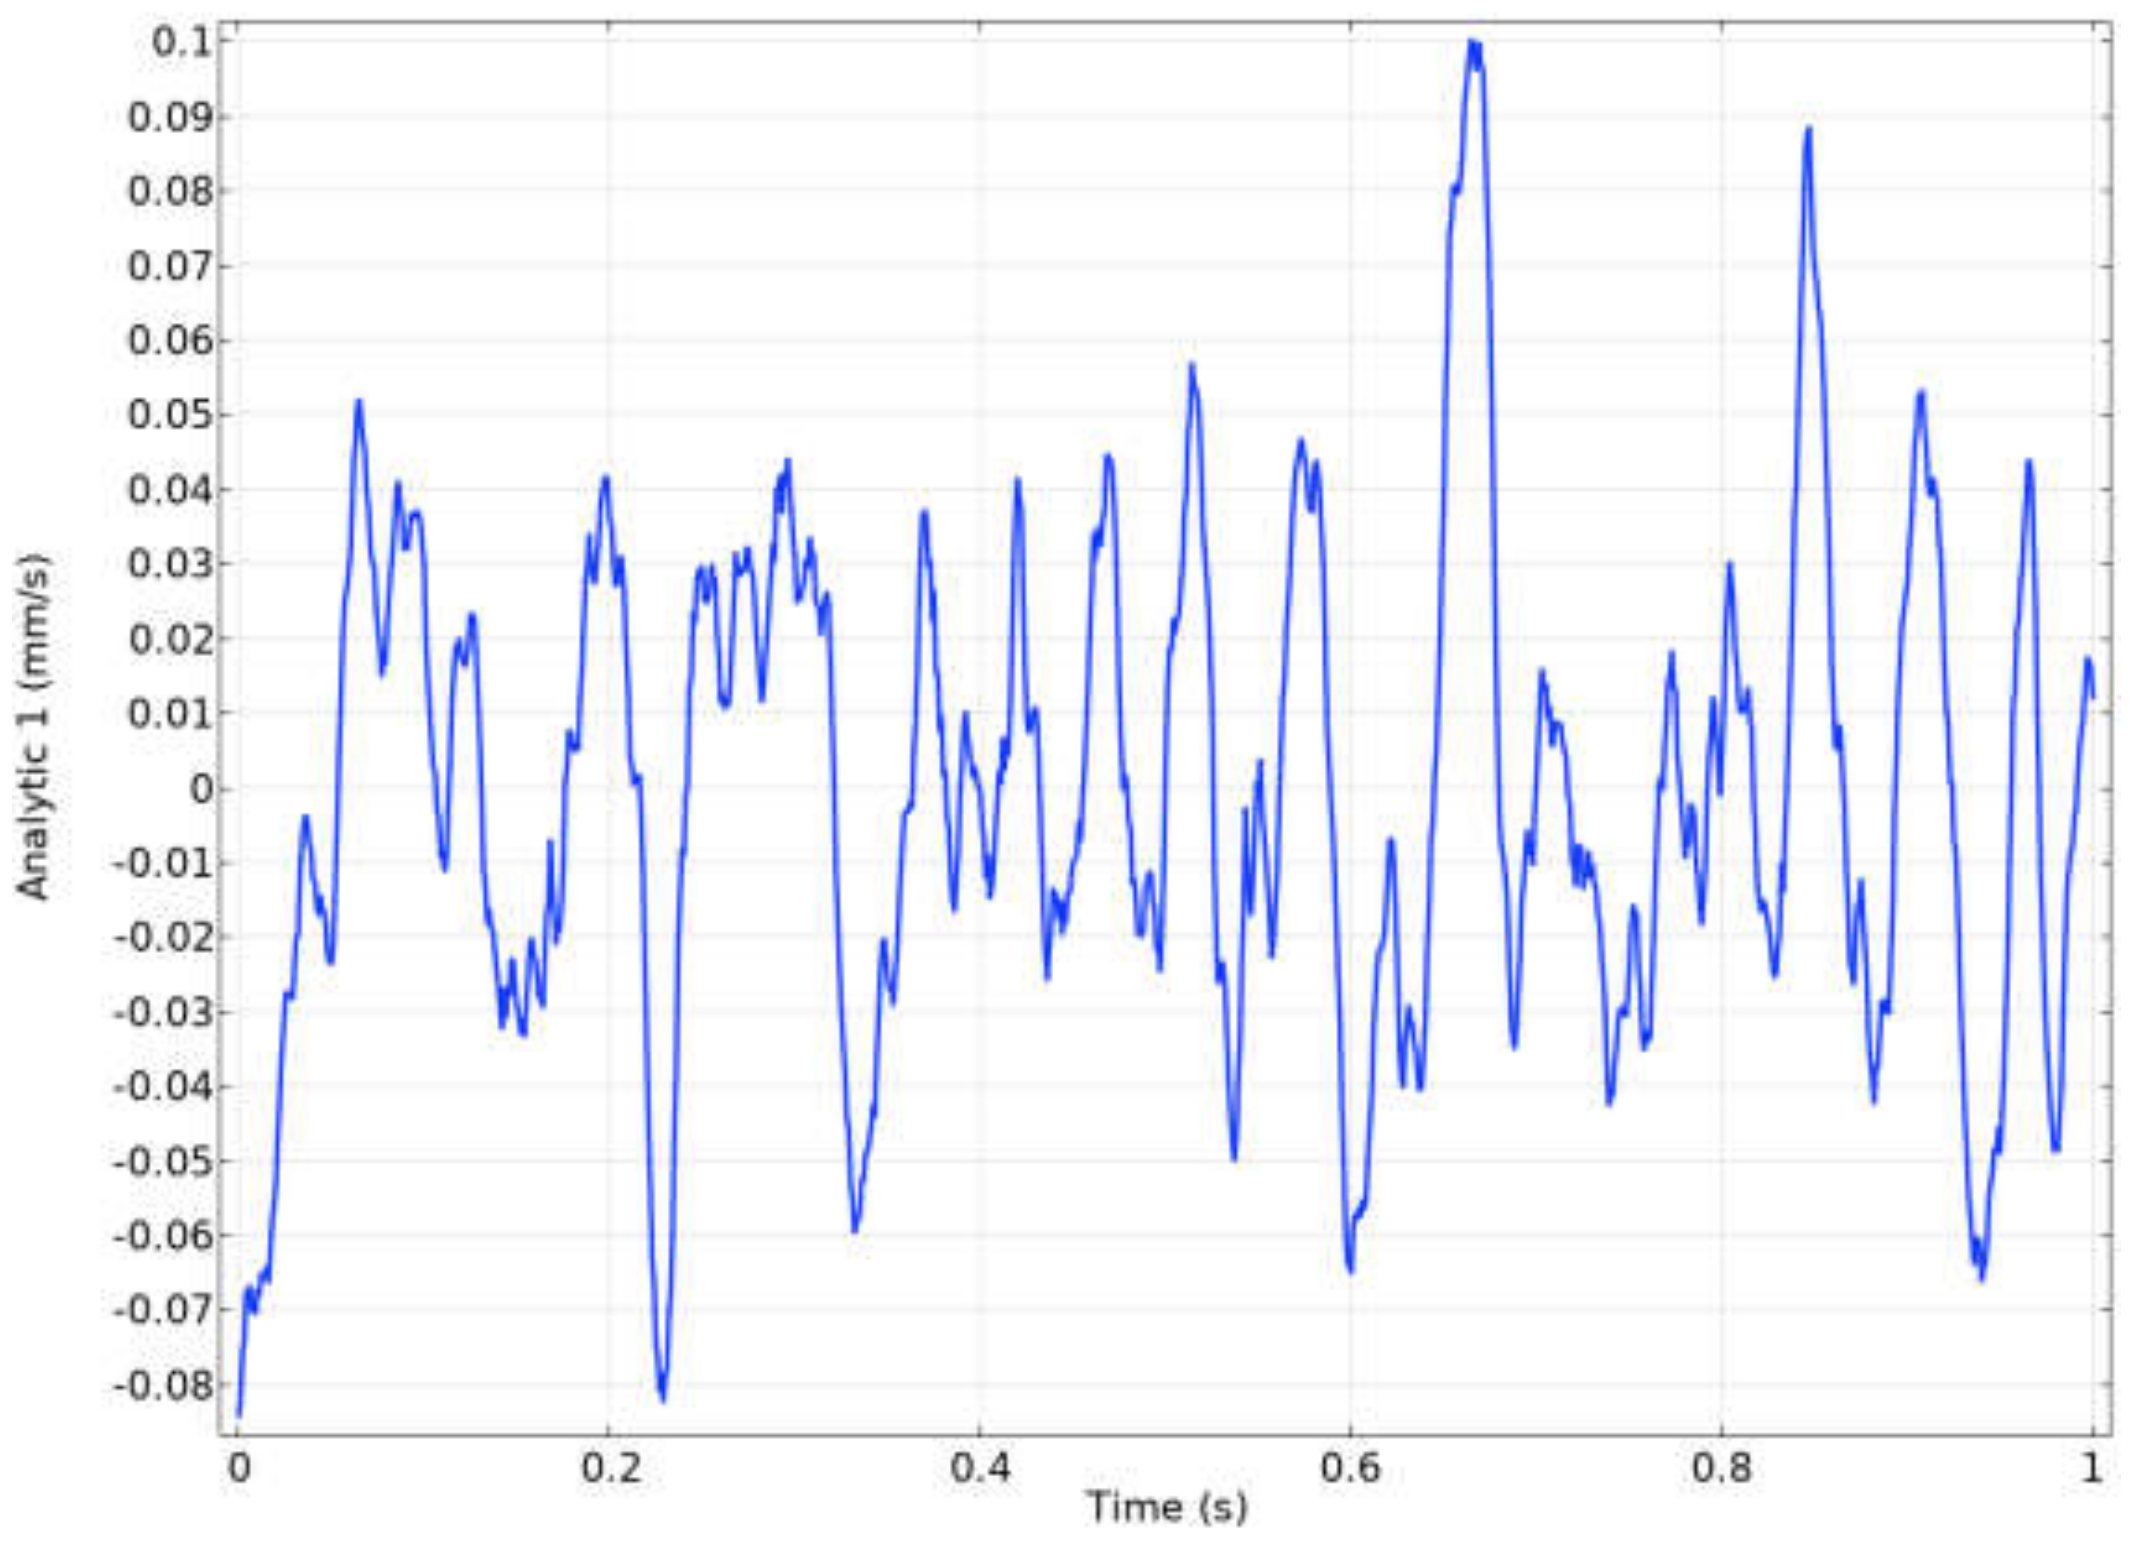
In addition, the steel tape had a spring foundation condition from the left boundary and uploaded velocity from the opposite boundary as shown in
Figure 10. Experimental measurement tape velocity data were used us a set velocity boundary condition in simulation as shown in
Figure 12. The analytic velocity function of steel tape’s end from the experiment (
Figure 12) was used for the set velocity as one of boundary conditions for simulation as shown in
Figure 10.
Two-point probes similar to the experimental setup sensor position (
Figure 4c) were chosen for postprocessor analysis after simulation. They are illustrated in
Figure 10 as points A and B.
Figure 13 illustrates fixed constraints and the body load of the current model. Five contact zones between the steel tape and support from Hypalon material are presented in
Figure 13a. Dynamic friction and gravity of these contact pairs only were taken into consideration during simulation. DOF (Degree of Freedom) by
z and
x axes in contact zones was restricted. Two coordinated restrict the set velocity (
Figure 10), and the steel tape had a freedom of movement along the length only. Gravity was also included in the simulation. The simulation was based on the parametric sweep of the top roller preload by–
z axes (
Figure 13b) and a change from 10 to 40 N with 10-N steps. This range was chosen based on the experimental 30-N preload setup.
Mechanical properties of materials used in numerical simulation are presented in
Table 3.
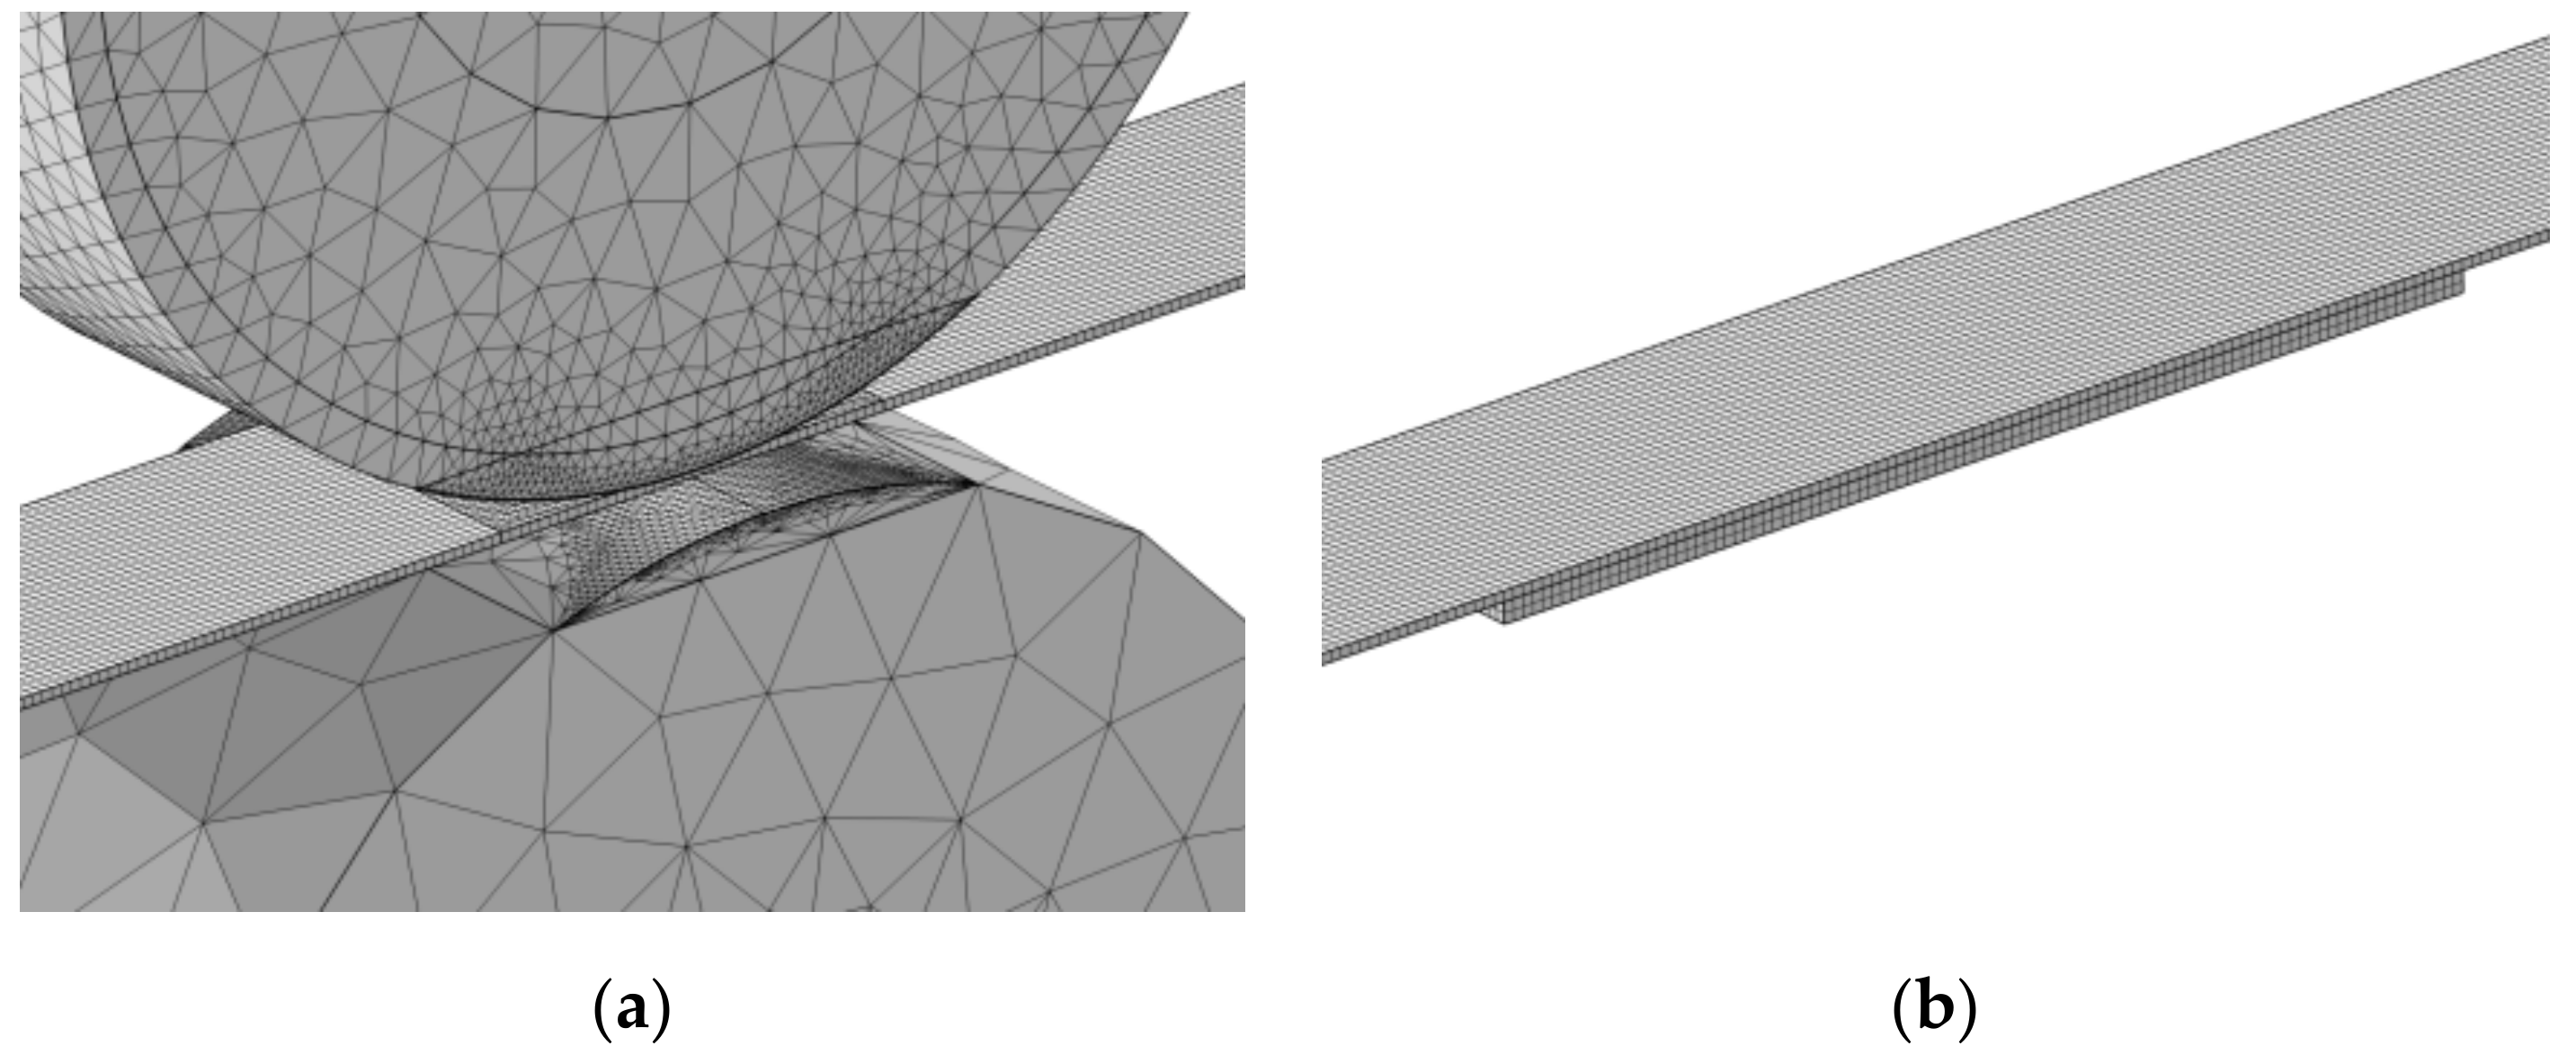
Figure 14 below presents a compiled mesh of finite elements. The steel tape unit was modeled using COMSOL Multiphysics software. The quality of mesh elements maximizes in the contact zone. In the simulation, 0.48 and 0.93, respectively, were the minimum and the average element qualities.
Having generated the finite element mesh for geometric model, the next step was modeling the problem solution. In order to model the problem solution, equation system type and solution method were selected for the steel tape unit. A time-dependent solution type was chosen, then solving the contact and dynamic movement problems.
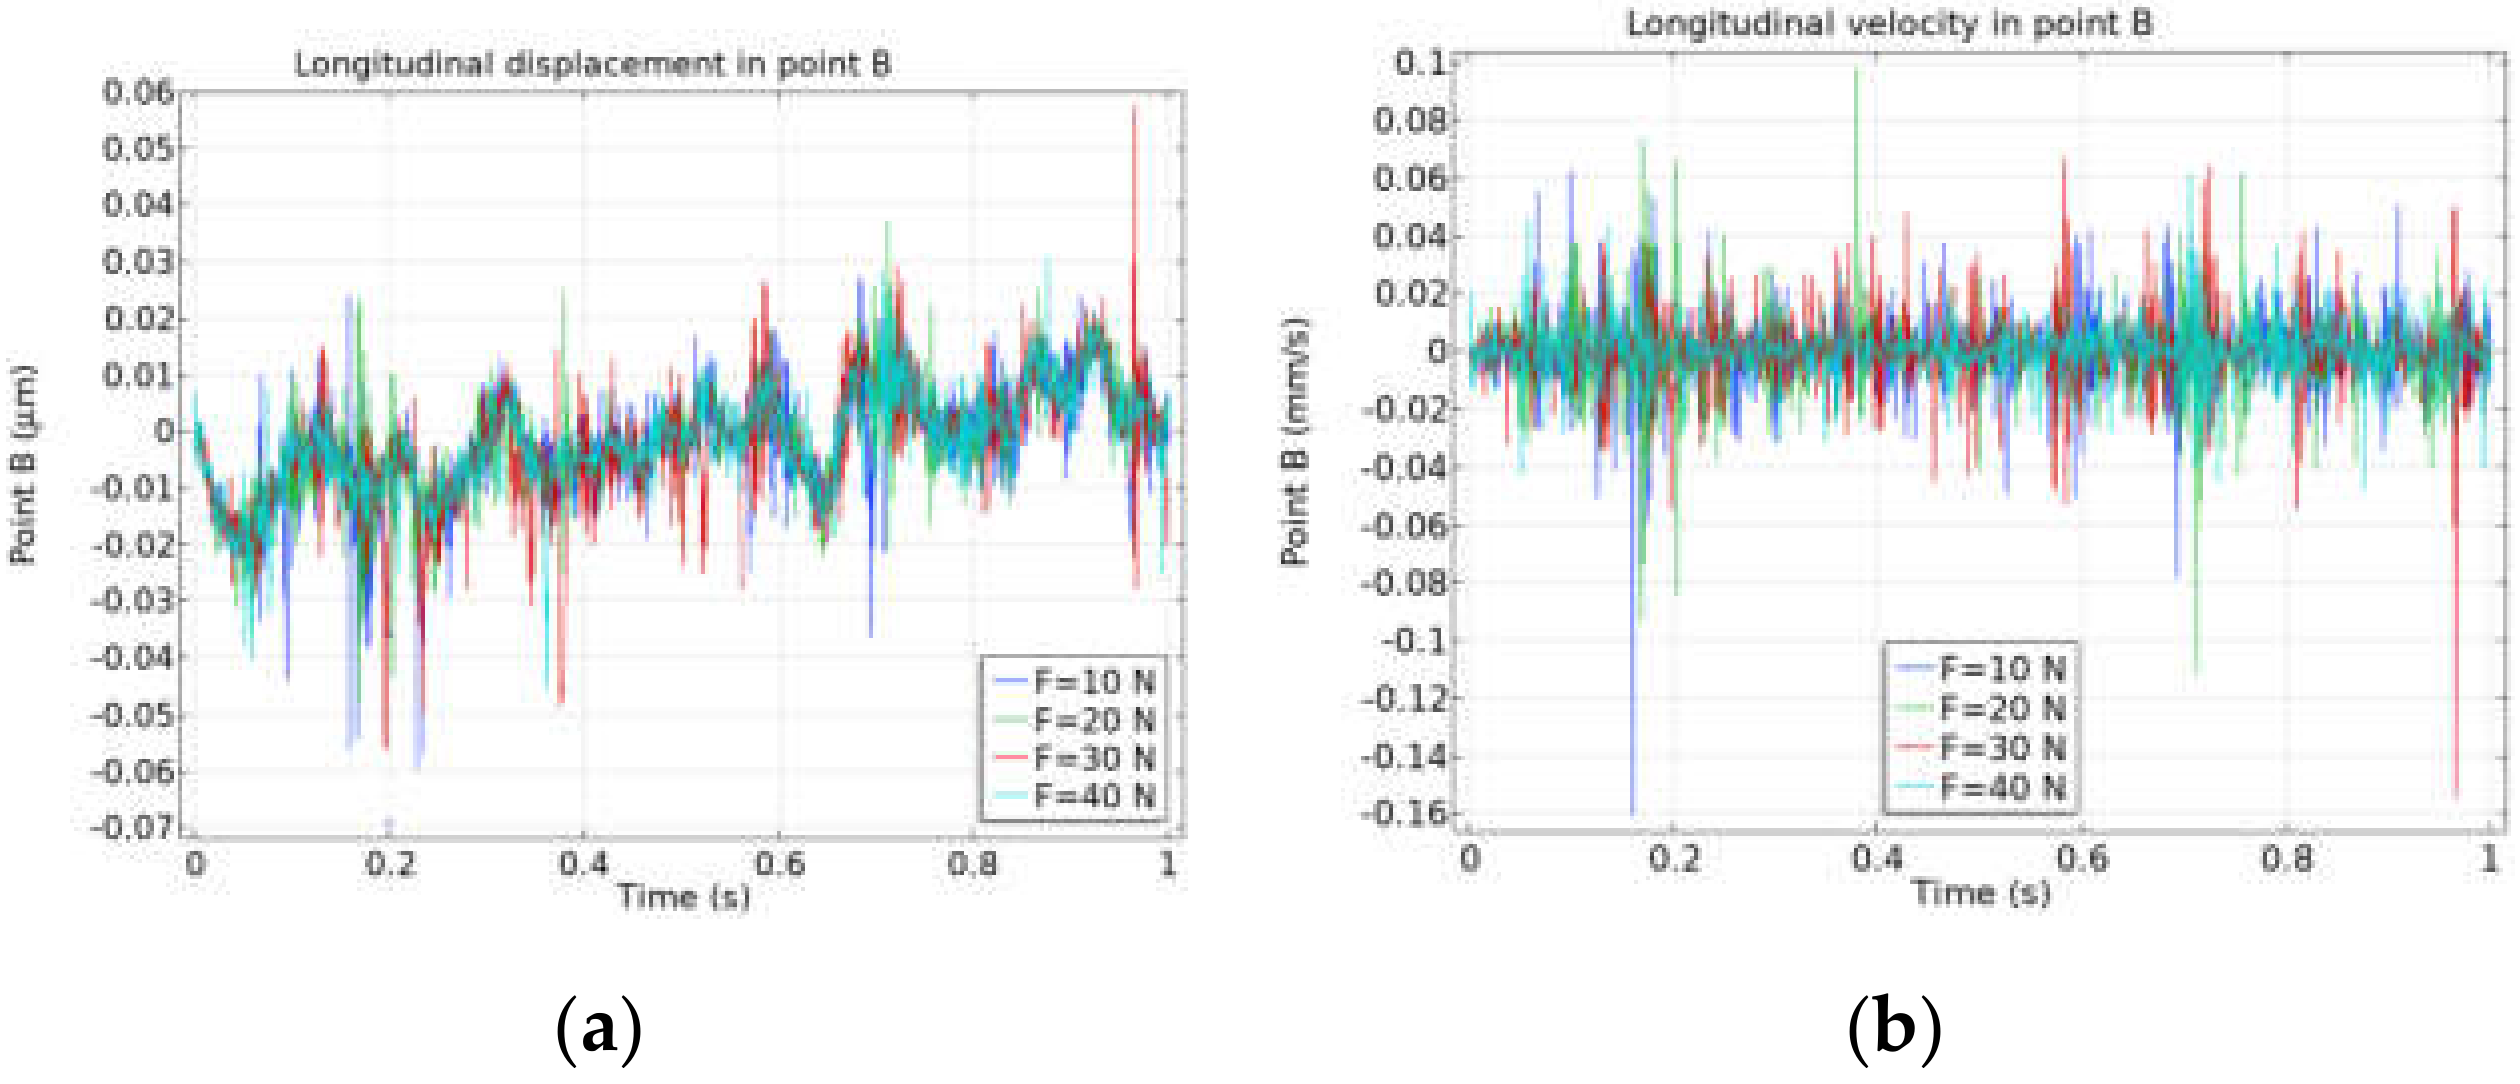
The time-dependent study was limited to 1 second because of the calculation time and data storage limitation. The longitudinal displacement and velocity in point B (
Figure 10) under different preloads between the top roller and the steel tape are presented in
Figure 15, respectively. Dependences confirmed the feasibility of the simulation model and the experimental results of the measurement point B displacement and velocity (
Figure 8a,
Figure 9a and
Figure 15).
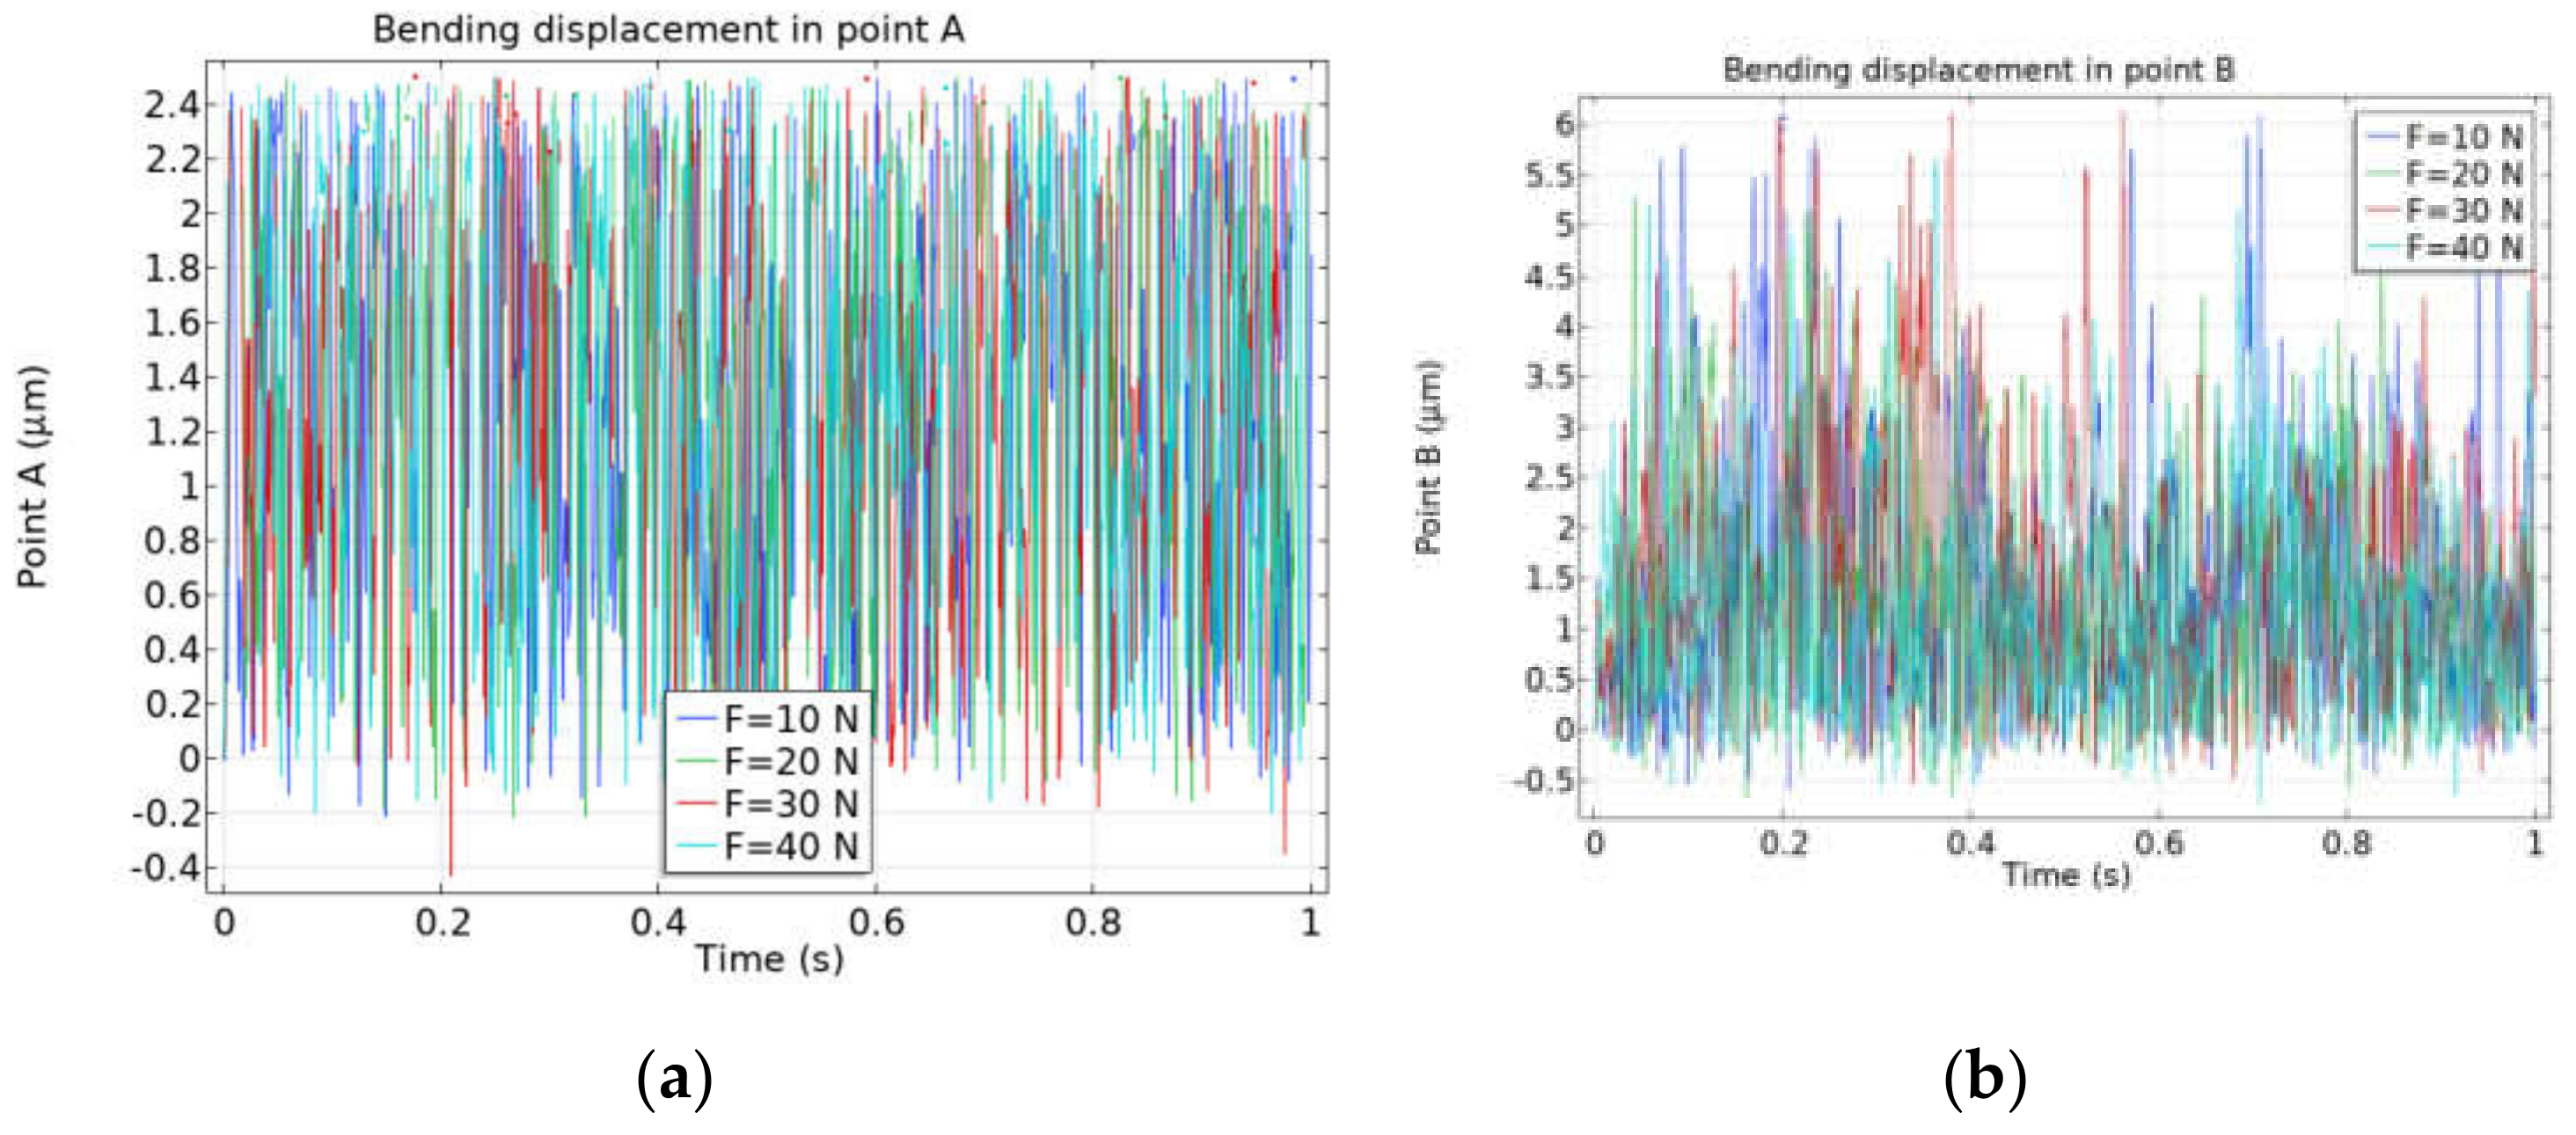
Of course, the longitudinal parasitic vibration of the steel tape had a greater impact on the pitch formation precision, however, we believe that the taping vibration of the steel tape should also be taken into account.
Figure 16 illustrates the taping displacement of points A and B (left and right). Displacement values were much higher than those in the longitudinal direction, and the effect on pitch precision was the sum of the three coordinates of the total parasitic vibration of the steel tape.
The received results show that the roller-tape contact pressure responded to the dynamic reaction of the steel tape during movement and must be choosen carefully.
5. Conclusions
The article examines analytical modeling of one of the main components of the raster generation system (tape displacement measurement unit) and presents the experimental research carried out.
A mechanical model of the steel tape and rollers subjected to loads was developed in the article. The article presents the modeling, which defines deformation of a steel tape model under preloads with the variable boundary conditions.
The measurements of the moving tape of the precision raster generation system in the vertical and longitudinal directions revealed that the value of the displacement of tape point when the tape was supported from the bottom varied by about 37.5 µm during operation, and ranged to about 53.5 µm when the tape was not supported from the bottom. The frequency of tape oscillations was very low (0.04 Hz) and came as a result of deviations in the shape of the tape.
The main parameters that affected parasitic longitudinal and vertical displacements of the mesh were the number and the position of mesh supports and the tensile and clamping forces of the mesh.

 ,
, 


