Article

Transcriptome Analysis of Breast Muscle Reveals Pathways Related to Protein Deposition in High Feed Efficiency of Native Turkeys

by
Zahra Pezeshkian
1,
Seyed Ziaeddin Mirhoseini
1,*,
Shahrokh Ghovvati
1 and
Esmaeil Ebrahimie
2,3,4,*
1
Department of Animal Sciences, Faculty of Agriculture, University of Guilan, Rasht 41635-1314, Guilan, Iran
2
Genomics Research Platform, School of Agriculture, Biomedicine and Environment, La Trobe University, Melbourne, VIC 3086, Australia
3
School of Animal and Veterinary Sciences, The University of Adelaide, Adelaide, SA 5371, Australia
4
School of BioSciences, The University of Melbourne, Melbourne, VIC 3010, Australia
*
Authors to whom correspondence should be addressed.
Animals 2022, 12(10), 1240; https://doi.org/10.3390/ani12101240
Submission received: 11 April 2022 / Revised: 7 May 2022 / Accepted: 9 May 2022 / Published: 11 May 2022

Abstract

:

Simple Summary

Due to the high cost of feed in the poultry production system, improving feed efficiency can reduce production costs. This study aimed to investigate the transcriptome of breast muscle tissue of native male turkeys that have been phenotyped for high and low feed efficiency. After the rearing period, the most efficient and the least efficient male turkeys were selected and slaughtered for RNA-Seq. Genes with different expressions in muscle tissue were identified between high feed efficiency turkeys compared to low feed efficiency turkeys. The results showed that high feed efficiency birds increased the expression of genes related to amino acid biosynthesis and low feed efficiency birds increased the expression of genes related to the immune response. Eleven key genes associated with the phenotypic expression of feed efficiency were selected that may be good potential candidates for biomarkers of feed efficiency in genetic selection in turkeys. This study provides new insights into the differences in transcripts between breast muscle tissues between turkeys with high and low feeding efficiencies.

Abstract

Feed efficiency is important due to the high cost of food, which accounts for about 70% of the total cost of a turkey breeding system. Native poultry are an important genetic resource in poultry breeding programs. This study aimed to conduct a global transcriptome analysis of native male turkeys which have been phenotyped for high and low feed efficiency. Feed efficiency traits were recorded during the experimental period. After slaughter, the three most efficient and three least efficient male turkeys were selected for RNA-Seq analysis. A total of 365 genes with different expressions in muscle tissue were identified between turkeys with a high feed efficiency compared to turkeys with a low feed efficiency. In the pathway analysis of up-regulated genes, major pathways included the “metabolism of glycine, serine, and threonine”; the “adipocytokine signaling pathway” and the “biosynthesis of amino acids”. In the pathway analysis of down-regulated genes, the major pathways included “dorso-ventral axis formation” and “actin cytoskeleton regulation”. In addition, gene set enrichment analyses were performed, which showed that high feed efficiency birds exhibit an increased expression of genes related to the biosynthesis of amino acids and low feed efficiency birds an increased expression of genes related to the immune response. Furthermore, functional analysis and protein network interaction analysis revealed that genes including GATM, PSAT1, PSPH, PHGDH, VCAM1, CD44, KRAS, SRC, CAV3, NEDD9, and PTPRQ were key genes for feed efficiency. These key genes may be good potential candidates for biomarkers of feed efficiency in genetic selection in turkeys.

1. Introduction

Feed cost is an important component of poultry production which accounts for 70% of the total production costs [1,2]. Therefore, feed efficiency (FE) is one of the most important issues in poultry breeding programs. Improving feed efficiency may decrease feed intake, production cost, waste products, and environmental emissions [3,4]. As a result of genetic progress, larger birds need more feed. By improving feed efficiency, birds that eat the same amount of feed as other birds have higher body weight or weight gain [1]. The turkey is an important agricultural species used for meat production. Global data from the turkey industry show that turkey consumption has increased in recent years [4]. Willems et al. (2013) evaluated different feed efficiency measurements in turkeys [2].
Understanding the fundamental basis for a bird to have the optimal ability to convert feed into high-quality meat protein is important to feed the human population and to maintain healthy and sustainable animals in the future [5].
Many biochemical and functional differences related to the expression of feed efficiency exist within a single line of poultry [6]. Insights into the biological basis of differences in poultry feed efficiency are required to develop more efficient and sustainable selection strategies. With the rapid development of next-generation sequencing technologies, RNA sequencing (RNA-Seq) has been replacing microarray technology for transcriptome-wide gene expression analysis. Avoiding the technical issues inherent to the microarray technique such as cross-hybridization and narrow ranges of signal detection, RNA-Seq can provide more accurate and comprehensive information regarding changes in gene expression between different conditions or different phenotypes [7].
Many studies have examined the global gene expression of feed efficiency in different animals such as chickens using microarray and RNA-Seq technology [5,7,8,9,10,11]. Moreover, the RNA-Seq method has attracted considerable interest and achieved great success concerning many economic traits in livestock [11,12]. An RNA-Seq analysis of abdominal fat revealed differences between high and low commercial broiler chickens. One of the important pathways implicated was the pathway of amino acid metabolism [13]. The key genes and signaling pathways associated with feed efficiency in native chickens have been studied, and it has been reported that the metabolic pathways are significantly different in one of the modules of the gene network [14].
Therefore, a global gene expression study using RNA-Seq is necessary for a better understanding of the molecular basis of FE in turkeys. However, to our knowledge, there are no reports on global gene expression associated with feed efficiency in turkeys. This study aimed to conduct a transcriptome analysis of domestic turkeys that were individually phenotyped for feed efficiency. Our findings will allow a better understanding of the underlying mechanisms of feed efficiency and help to optimize the current breeding strategies.

2. Materials and Methods

2.1. Ethical Approval Statements

This research was conducted under the ethical standards of the University of Guilan. All animal work was approved by Vice Presidency for Research and Technology of the University of Guilan (Number: 25433/p15). Before sampling, birds were humanely slaughtered by cervical dislocation. Every effort was made to minimize their suffering.

2.2. Selecting Animals and Sampling

In this research, Iranian native turkeys of the Tatar Turkey Research Center were used. Five hundred male turkeys were raised until 20 weeks of age under a standard production protocol, which included a standard diet and housing in groups with common drinkers and feeders. Out of this group of 500 turkeys, 75 were randomly selected and moved to the farm of the University of Guilan. They were placed into individual cages from week 20 to 24 of age with feed and water ad libitum. A lighting regimen of 16 h of light and 8 h of darkness was used.
Body weight was evaluated at the beginning (20 weeks of age) and the end of the experiment (24 weeks of age). Feed consumption was recorded by measuring the weight of the food added to each feeder daily and weighing the residual feed weekly until the end of the experiment. Feed conversion ratio (FCR) was computed as:
FCR = FI ( g ) WG   ( g )
where FI is the total feed intake during the trial and WG is the body weight gain during this time.
Turkeys were ranked by FCR and the 3 lowest and 3 highest FCR-ranked toms were assigned as high feed efficiency (HFE) and low feed efficiency (LFE), respectively, and used for RNA-Seq. After slaughter, breast muscle tissues were harvested immediately, frozen in liquid nitrogen, and then stored at −80 °C until further processing.

2.3. RNA Extraction and Sequencing

The total RNA was isolated using the RNeasy Midi kit (Qiagen, Hilden, Germany, Cat. # 75144). The RNA quantity was evaluated by measuring the absorbance at 260, 280, and 230 nm using a spectrophotometer (EPOCH 2, Biotek Instruments Inc., Winooski, VT, USA). The reference 260/280 ratio and 260/230 ratio for the RNA sample were 1.8 to 2.0 and 1.8 to 2.2, respectively. The quality of RNA samples was checked using 1% agarose gels. The RNA integrity number (RIN) was accessed using a Agilent Bioanalyzer 2100 system (Agilent Technologies, Santa Clara, CA, USA). Only RNA integrity numbers equal to or higher than 7.0 were used for the next analysis. RNA library preparation and Illumina sequencing were performed by Novogene Biotechnology Co. Ltd. (Beijing, China). The library was prepared with TruSeq RNA Sample Prep Kit v2 (Illumina, San Diego, CA, USA). Illumina HiSeq 2500 system technology was applied for RNA sequencing, and the length of the paired-end short reads was 150 bp.

2.4. RNA-Seq Analysis

Quality control and adaptor trimming were performed on the RNA sequence raw data FASTQ files using CLC Genomic Workbench software (20.0.4). The reference genome and annotations were downloaded from the Ensembl database. Data were mapped to the turkey genome (Meleagris Gallopavo) using CLC Genomic Workbench software (20.0.4). Differential expression analysis was performed using CLC Genomic Workbench to distinguish differentially expressed genes (DEGs) between the HFE and LFE groups. Finally, the DEGs were declared at a significant level of |(fold change)| > 2, raw p-value < 0.05, and FDR < 0.05.

2.5. Identification of Differently Expressed Genes (DEGs) and Function Annotation Analysis

Gene ontology (GO) terms and the Kyoto Encyclopedia of Genes and Genomes (KEGG) pathways were studied through the Database for Annotation, Visualization, and Integrated Discovery (DAVID) (version 6.8, https://david.ncifcrf.gov/, accessed on 1 August 2020) (p-value < 0.05). The Search Tool for the Retrieval of Interacting Genes (STRING) database was applied to construct the protein-protein interaction (PPI) network. Then, Cytoscape was used for visualizing the PPI network (http://cytoscape.org/, accessed on 1 August 2020). The CytoHubba application in Cytoscape was used to investigate the hub genes using four centrality methods, including maximal clique centrality (MCC), degree, maximum neighborhood component (MNC), and closeness.
The Molecular Complex Detection (MCODE) application in Cytoscape was applied to investigate the modules of the PPI network. The criteria settings of MCODE are as follows: degree cutoff = 2, node score cutoff = 0.2, k-core = 2, maximum depth = 100. Additionally, pathway and function enrichment analyses were conducted for genes in the modules using the ClueGO application of Cytoscape.

2.6. Gene Set Enrichment Analysis (GSEA)

All the expressed genes were used for GSEA analysis. Gene set analyses were performed using GSEA software (http://software.broadinstitute.org/gsea/index.jsp, accessed on 25 August 2020) based on the KEGG gene set collections (MSigDB v7.0, broad institute, Cambridge, MA, USA). This software sorted all the expressed genes based on the significance of differential gene expression between the two groups. A normalized enriched score (NES) was calculated for each gene set. The significant enrichment of the gene set was selected based on the absolute values of NES > 1, the nominal p-value of NES ≤ 0.05, and the false discovery rate (FDR) ≤ 0.25.

2.7. Quantitative RT-PCR Confirmations

A quantitative reverse transcription PCR (qRT-PCR) assay was used for confirming the differential expression results of 20 DEGs that were randomly selected. The primers were designed using Primer Premier Software (version 5) and synthesized by the Cinaclone Co. (Tehran, Iran). The total RNA was used for first-strand cDNA synthesis using a RevertAid First Strand cDNA Synthesis kit (Thermo Scientific, Waltham, MA, USA, #K1621) according to standard protocols. All qRT-PCR reactions were performed in triplicate via a LightCycler detection assay (Roche Diagnostics Corporation, Indianapolis, IND, USA) using SinaSYBERBlue HS-qPCRMix. The thermal cycle conditions were as follows: 1 cycle of pre-incubation at 94 °C for 3 min, 40 cycles of amplification (95 °C for 30 s, 59 °C for 30 s, and 72 °C for 30 s). The relative gene expressions of DEGs were calculated as
Fold change = 2−ΔΔCt
The primer sequences of all the genes including the target genes and three housekeeping genes are presented in Table 1. Selecting proper reference genes is one of the most important points in qPCR data analysis and plays a crucial role in the correct assessment of gene expression. Stable reference genes for the qPCR method were determined among three housekeeping genes (RPS7, 18 S, and GADPH) using the GeNorm algorithm [15].

3. Results

Gene Expression Profile

Breast muscle samples of HFE (n = 3) and LFE (n = 3) native turkeys were used for RNA-Seq analysis. The results of the quality control indicated that short reads were sequenced based on an appropriate form. Trimming was carried out according to the Phred score and the nucleotide contribution. An average of 78.5 million clean reads per sample were mapped back to the Meleagris gallopavo reference genome with a mean of 73.97% mapping efficiency. Detailed information on the data quality and mapping statistics is presented in Table 2. The classification of the HFE and LFE turkeys according to the results of PCA is presented in Figure 1. The figure shows that the HFE and LFE groups were very different from each other; HFE and LFE turkeys can be separated into two different groups.
Differential gene expression analysis was applied to analyze the transcriptional variations between the HFE and LFE groups. In total, 365 significant DEGs (based on |(fold change)| > 2, p-value < 0.05, and FDR < 0.05) were found in response to divergent FE. Of these genes, 127 were up-regulated and 238 were down-regulated in the HFE group. A volcano plot reporting −log (false discovery rate) against log (fold change) is presented in Figure 2.
An analysis of gene ontology (GO) enrichment was conducted for all DEGs (Figure 3). The bubble plot shows the GO enrichment of differentially expressed genes in five biological process terms including “skeletal muscle cell differentiation”, “negative regulation of transcription from RNA polymerase II promoter”, “positive regulation of peptidyl-tyrosine phosphorylation”, “L-serine biosynthetic process” and “positive regulation of mitotic cell cycle”. The GO analysis showed one term in molecular functions, “transcriptional repressor activity”.
To identify the potential functional classes of DEGs, a functional enrichment analysis including pathway enrichment and analysis of GO enrichment was conducted on the up-regulated and down-regulated DEGs separately. Out of 127 overexpressed genes, 96 genes were identified in pathway analysis. Major pathways including the “glycine, serine, and threonine metabolism”; “biosynthesis of amino acids”, “adipocytokine signaling pathway”, and “metabolic pathways” were statistically significant. In the pathway analysis of down-regulated DEGs, the major significant pathways were “dorso-ventral axis formation” and “regulation of actin cytoskeleton” (Table 3).
Moreover, the significantly enriched GO terms were analyzed in three terms: Biological process (BP), Cellular component (CC), and Molecular function (MF). The most important part of the ontology of up-regulated genes in the BP term was related to the “L-serine biosynthetic process” (GO: 0006564). The most significant ontology in CC term was related to “extracellular space” (GO: 0005615). In the MF term, the only significant ontology was related to “phosphomannomutase activity” (GO: 0004615) (Table 4).
The most significant part of the ontology of the down-regulated genes in the BP term was related to “skeletal muscle cell differentiation” (GO: 0035914). The most significant ontology in the CC term was related to “nucleus” (GO: 0005634). In the MF term, the most significant ontology was related to “transcriptional repressor activity, RNA polymerase II core promoter proximal region sequence-specific binding” (GO: 0001078) (Table 5).
For revealing the interaction information and for further analysis of the DEGs, the PPI network of the DEGs was investigated. This PPI network, created by the STRING database and visualized through Cytoscape software, included 301 nodes and 412 edges.
Using four centrality algorithms of CytoHubba (MCC, MNC, degree, and closeness), 15 hub genes were evaluated and visualized. (Figure 4). The intersections of these four methods were calculated and seven hub genes, including CD44, VCAM1, KRAS, NEDD9, SRC, PTPRQ, and CAV3 were identified (Figure 5).
The six significant modules with an MCODE score of higher than three were identified including module one (MCODE score = 5) and module two to module six (MCODE score = 3.333), which were created using MCODE (Figure 6). Then, biological functional enrichment analysis of the genes of each module was conducted using ClueGO. Only module one showed significant results. The most important biological processes of this module were the alpha-amino acid biosynthetic process and the L-serine biosynthetic process.
The total gene expression levels between the HFE and LFE groups were investigated by GSEA, which was performed using a KEGG-based list including 41 gene sets. Only 1 gene set was identified as significantly enriched in HFE, and 14 gene sets were enriched in LFE (FDR ≤ 0.25). Usually however, an FDR of less than 0.25 can be considered a significant gene set in GSEA results (Table 6). The enrichment plot of the most significantly expressed genes in HFE and LFE birds is presented in Figure 7.
To validate the RNA-Seq expression results, twenty genes were randomly selected. A statistical analysis of gene expression stability was performed using the GeNorm algorithm (Figure 8). The results showed that the expression stability of the three reference genes from high to low was RPS7, GAPDH, and 18S. Therefore, RPS7 was used as a reference gene for qPCR experiments.
The comparative outcomes of the fold changes predicted by RNA-Seq and qRT-PCR were represented in Figure 9. Approximately all of the selected genes showed concordant expression patterns between the RNA-Seq and qRT-PCR results.
The results of real-time PCR also showed a similar expression pattern to the analysis results from RNA sequencing. Therefore, there was a good agreement between the real-time PCR and RNA-Seq results (Figure 10).

4. Discussion

In this research, breast muscle transcriptome data were analyzed and DEGs obtained from native male turkeys individually phenotyped for feed efficiency using RNA-Seq technology. Functional annotation, investigation of the PPI network, and module analysis were conducted (see Methods). Following a key nodes analysis of the PPI network, the hub genes were found. In addition, a functional enrichment of all the expressed genes was performed between HFE and LFE turkeys.
A list of DEGs was generated using differential expression analysis which needed further analysis to create an overview of the differences between the two groups. In total, 365 significant DEGs (127 up-regulated and 238 down-regulated) were found in response to divergent FE.
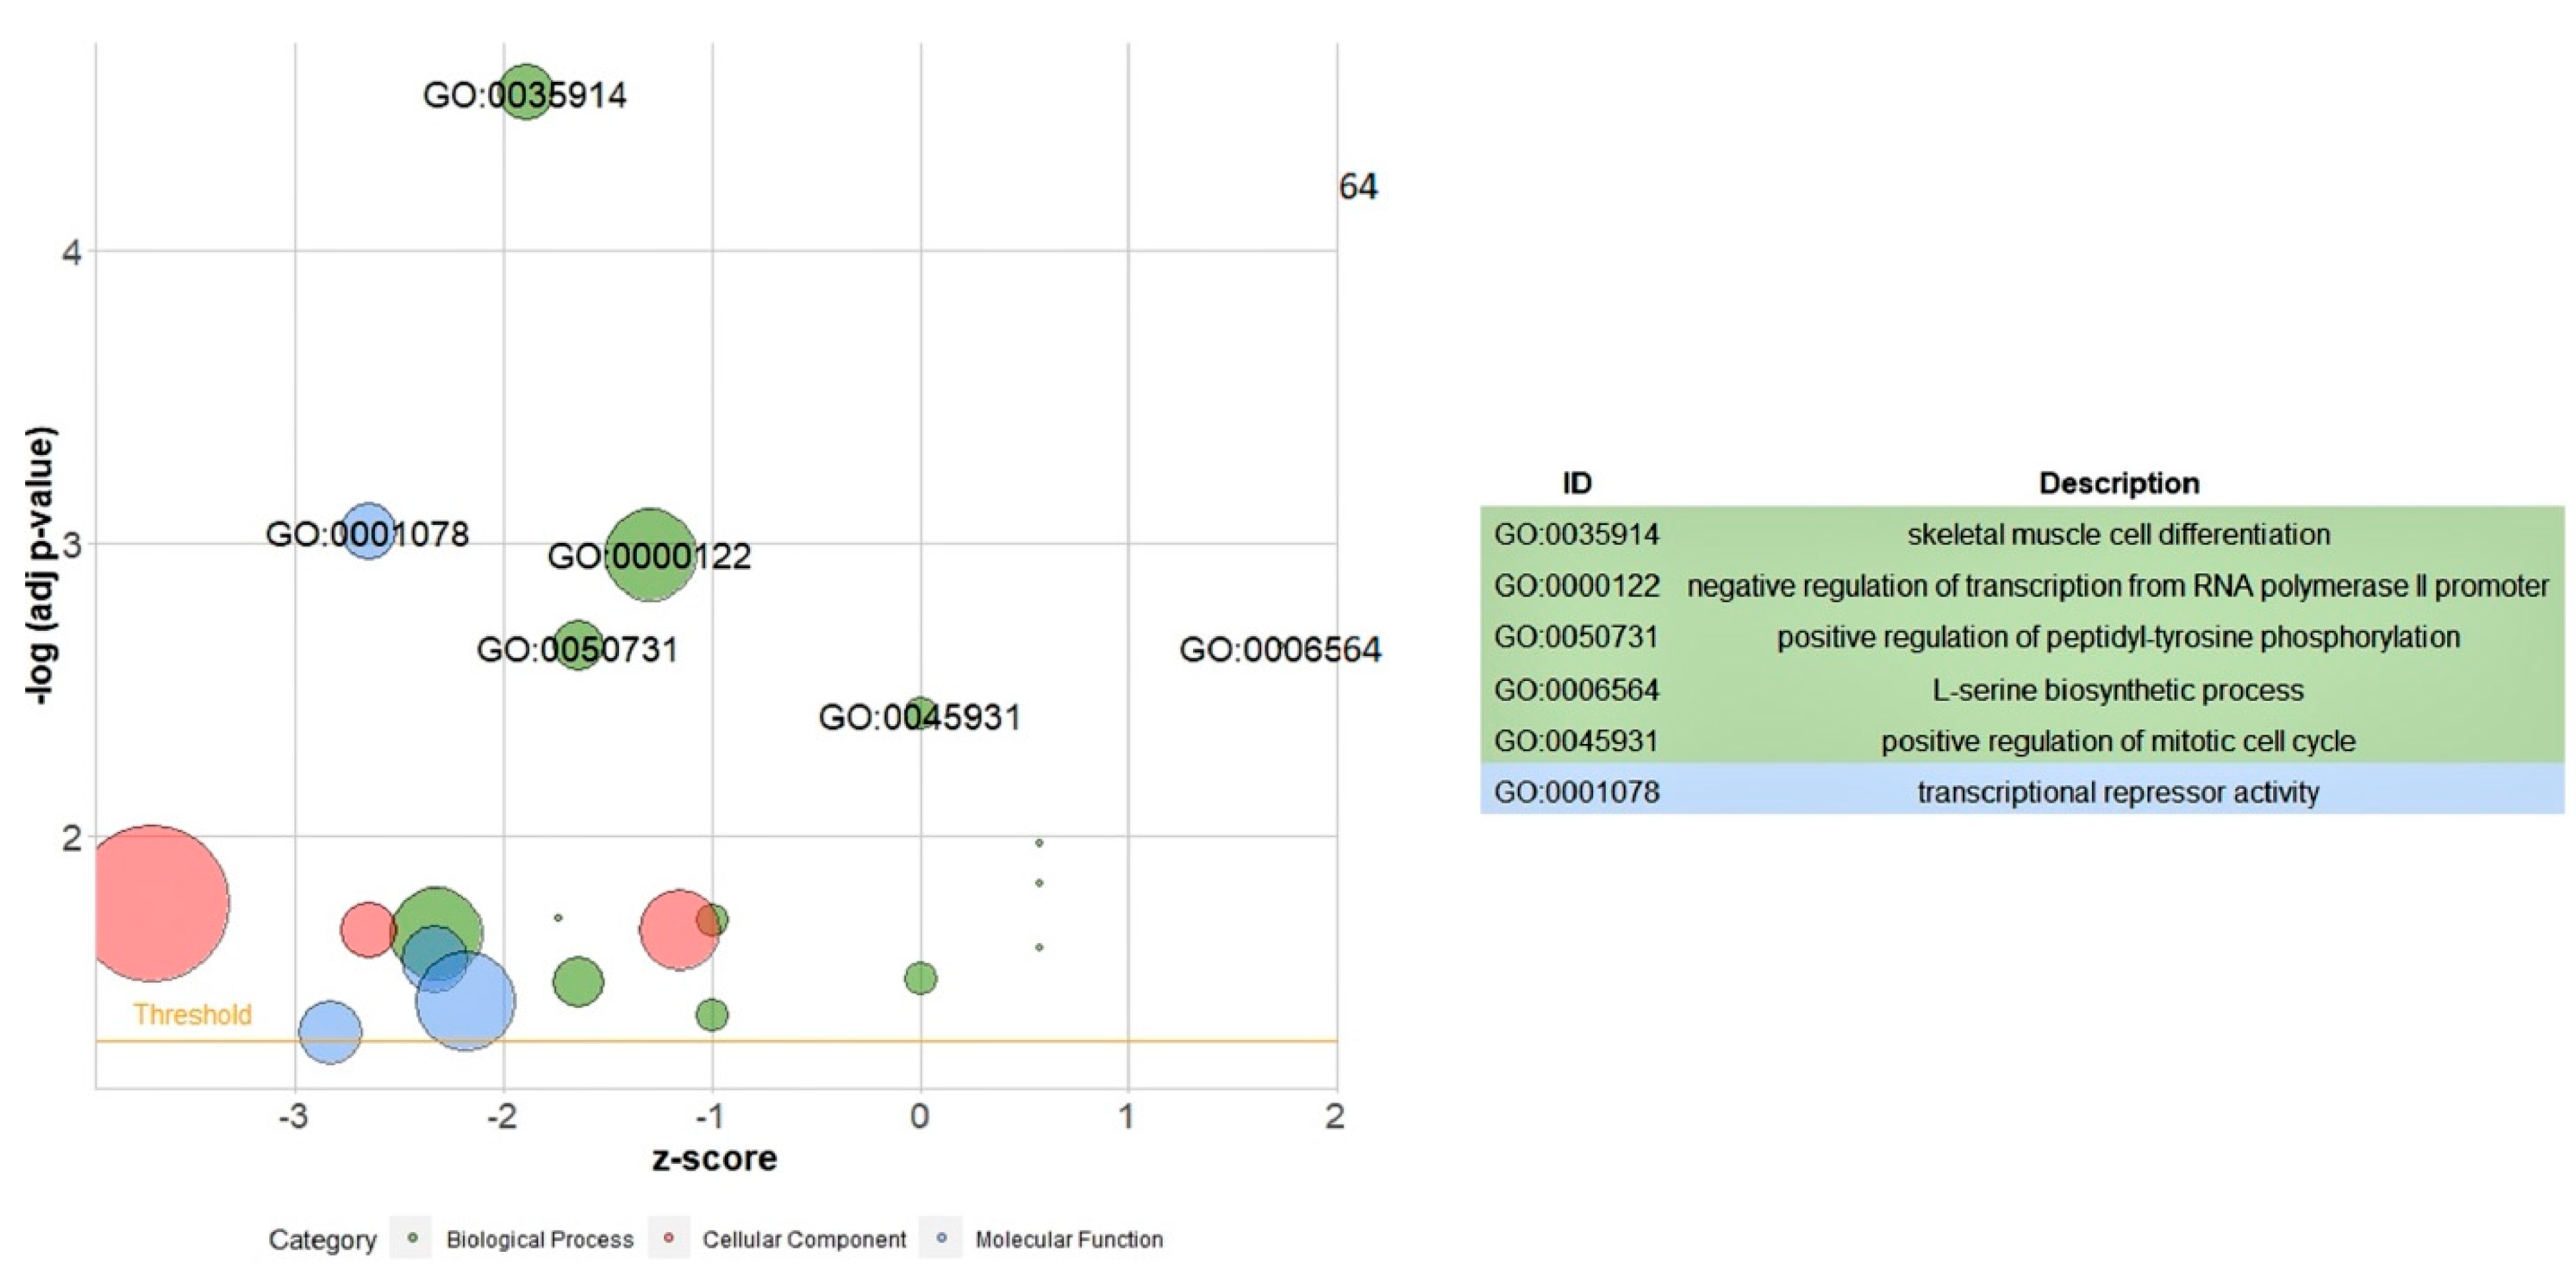
An ontology annotation of all the DEGs revealed some GO terms indicating that the most significantly enriched GOs were related to skeletal muscle cell differentiation, negative regulation of transcription from the RNA polymerase II promoter, positive regulation of peptidyl-tyrosine phosphorylation, the L-serine biosynthetic process, and positive regulation of the mitotic cell cycle in the BP term; and transcriptional repressor activity in the MF term. Therefore, most GO terms of all the DEGs were enriched in the metabolic process and cell differentiation, both of which are important in growth and feed efficiency traits. A pathway enrichment was conducted on the up-regulated DEGs. Major pathways including “glycine, serine, and threonine metabolism”, “biosynthesis of amino acids”, “adipocytokine signaling pathway”, and “metabolic pathways” were statistically significant.
Kong et al. (2011) reported that there was a down-regulation of cytoskeletal organization genes in the HFE phenotype [5]. The glycine, serine, and threonine metabolism pathway is one of the metabolic pathways that was significant in the duodenum and adipose tissue in cattle with divergent feed efficiency on several tissues [16]. The glycine, serine, and threonine metabolism pathway was reported to be one of the significant metabolic pathways in Holstein and Jersey dairy cows with high and low feed efficiencies [17]. Yang et al. (2017) reported that the glycine, serine, and threonine metabolism pathway had higher abundances in HFE pigs [18].
Glucose is the main source of metabolic energy in the body. When glucose enters the cell, glycolysis starts in the cytoplasm. The glycolysis pathway provides an intermediate metabolite, 3-phosphoglycerate, which is catalyzed into serine by PHGDH, PSAT1, and PSPH [19]. Then, serine can be converted into glycine. Additionally, glycine can be converted to threonine. This pathway provides precursors for purine biosynthesis and the tricarboxylic acid (TCA) cycle [20]. The TCA cycle generates ATP for protein production. It has been reported that HFE pigs accumulate more muscle mass in comparison to LFE pigs in their breast muscle [21]. Thus, the results of the present study in turkeys suggest that the HFE animals may consume more glucose in the muscle compared to LFE birds to produce ATP for protein deposition.
On the other hand, glycine can be converted to creatine by GATM which was over-expressed (or up-regulated) in the HFE turkey phenotype. Creatine has some anti-inflammatory and anti-oxidant characteristics, increases insulin sensitivity, and creatine metabolism and GATM has an important role in energy expenditure and defense against diet-induced obesity [22]. The entirety of this process is more active in HFE birds. Therefore, HFE turkeys may have better glucose absorption and have more active glycolysis or gluconeogenesis pathways. Additionally, the biosynthesis of amino acids provides a situation for producing more protein. Therefore, increasing this pathway in the breast muscle of birds results in heavier breast muscles in HFE turkeys (Figure 11).
Fonseca et al. (2019) found metabolic pathways related to feed efficiency in beef cattle using liver proteomics. They revealed that the biosynthesis of amino acids is one of the main pathways associated with FE [23].
The adipocytokine signaling pathway was another of the significant pathways. Adiponectin production (a protein encoded by the ADIPOQ gene) is negatively associated with increasing the volume and number of adipocytes. In circulation, adiponectin increases the transport of plasma fatty acids and glucose into cells. It is involved in the control of fat metabolism and has anti-inflammatory activities. Adiponectin also induces AMPK activation, which stimulates skeletal muscle glucose uptake and fatty acid oxidation. It also induces gluconeogenesis through the inhibition of the PEPCK and G6PC proteins. Therefore, these processes in HFE turkeys result in better glucose absorption and fat metabolism. The fatty acid translocase gene CD36 is a membrane receptor that facilitates the uptake of long-chain fatty acids. It is also involved in the adipocytokine signaling pathway. Finally, it provides precursors of acetyl-CoA for the TCA cycle. Therefore, a better uptake of fatty acids, stimulating gluconeogenesis and increasing insulin sensitivity, occurs through the adipocytokine signaling pathway in HFE turkeys [24]. The results of a study on Holstein cows showed that the adipocytokine signaling pathway is one of the significant pathways in Holstein cows with high and low feed efficiencies [25]. In addition, Lassiter et al. (2006) reported an increased expression of AMPK in the HFE phenotype of pedigree male broilers [26].
A pathway analysis of the down-regulated DEGs in the current study showed that the major significant pathways were “dorso-ventral axis formation” and “regulation of actin cytoskeleton”. Moreover, Yang et al. (2020) found that one of the significant modules in which the DEGs of native chickens were enriched was the regulation of the actin cytoskeleton that is involved in the regulation of cell motility [14].
Apparent metabolizable energy is a method to assess energy utilization for feed efficiency. Pezeshkian et al. (2020) investigated the apparent metabolizable energy of chickens and showed that down-regulated genes were enriched in some pathways including regulation of the actin cytoskeleton [27].
The ontology annotation of the DEGs revealed several biological events mostly associated with the biosynthesis of amino acids process and growth. They include the L-serine biosynthetic process, the GDP-mannose biosynthetic process, skeletal muscle tissue growth, amyloid fibril formation, the regulation of cardiac muscle contraction by regulation of the release of sequestered calcium ions, and the negative regulation of heart rate. “Low-density lipoprotein particle” refers to a process in which a low-density lipoprotein particle is removed from the blood. “Protein homotetramerization” is the process of forming protein homotetramers, which consist of four identical subunits of proteins. Protein and lipid metabolisms are important factors in feed efficiency [28]. Therefore, the higher expression of genes of these processes in HFE-phenotyped male native turkeys can be interpreted.
Some genes were involved in multiple pathways and GO terms. Among the DEGs, GATM was the most highly expressed gene. The glycine aminotransferase (GATM) gene is involved in glycine, serine, and threonine metabolism and other metabolic pathways. This enzyme converts glycine to arginine by guanidino acetate. Moreover, it was involved in the gene set of glycine, serine, and threonine metabolism in GSEA analysis. This gene was reported as a gene with different expression in a study that investigated the molecular basis of feed efficiency in broilers [29]. Mckenna (2018) investigated the molecular control of feed efficiency in beef cattle, and the GATM gene was introduced as a gene with different expression in muscle tissue between animals with a high and low feed efficiency [30].
Phosphoglycerate dehydrogenase (PHGDH), phosphoserine aminotransferase 1 (PSAT1), and phosphoserine phosphatase (PSPH) are genes in the serine biosynthesis process [31]. Fonseca et al. (2019) performed liver proteomics which elucidated the metabolic pathways associated with feed efficiency in beef cattle, and the PSAT1 gene was identified as a DEG involved in different metabolic pathways [23]. The PSPH gene is known as a DEG between cows with high and low residual feed intake [32]. Keogh et al. (2016) showed that the PSPH gene was up-regulated in HFE animals and was therefore introduced as a marker for feed efficiency [33].
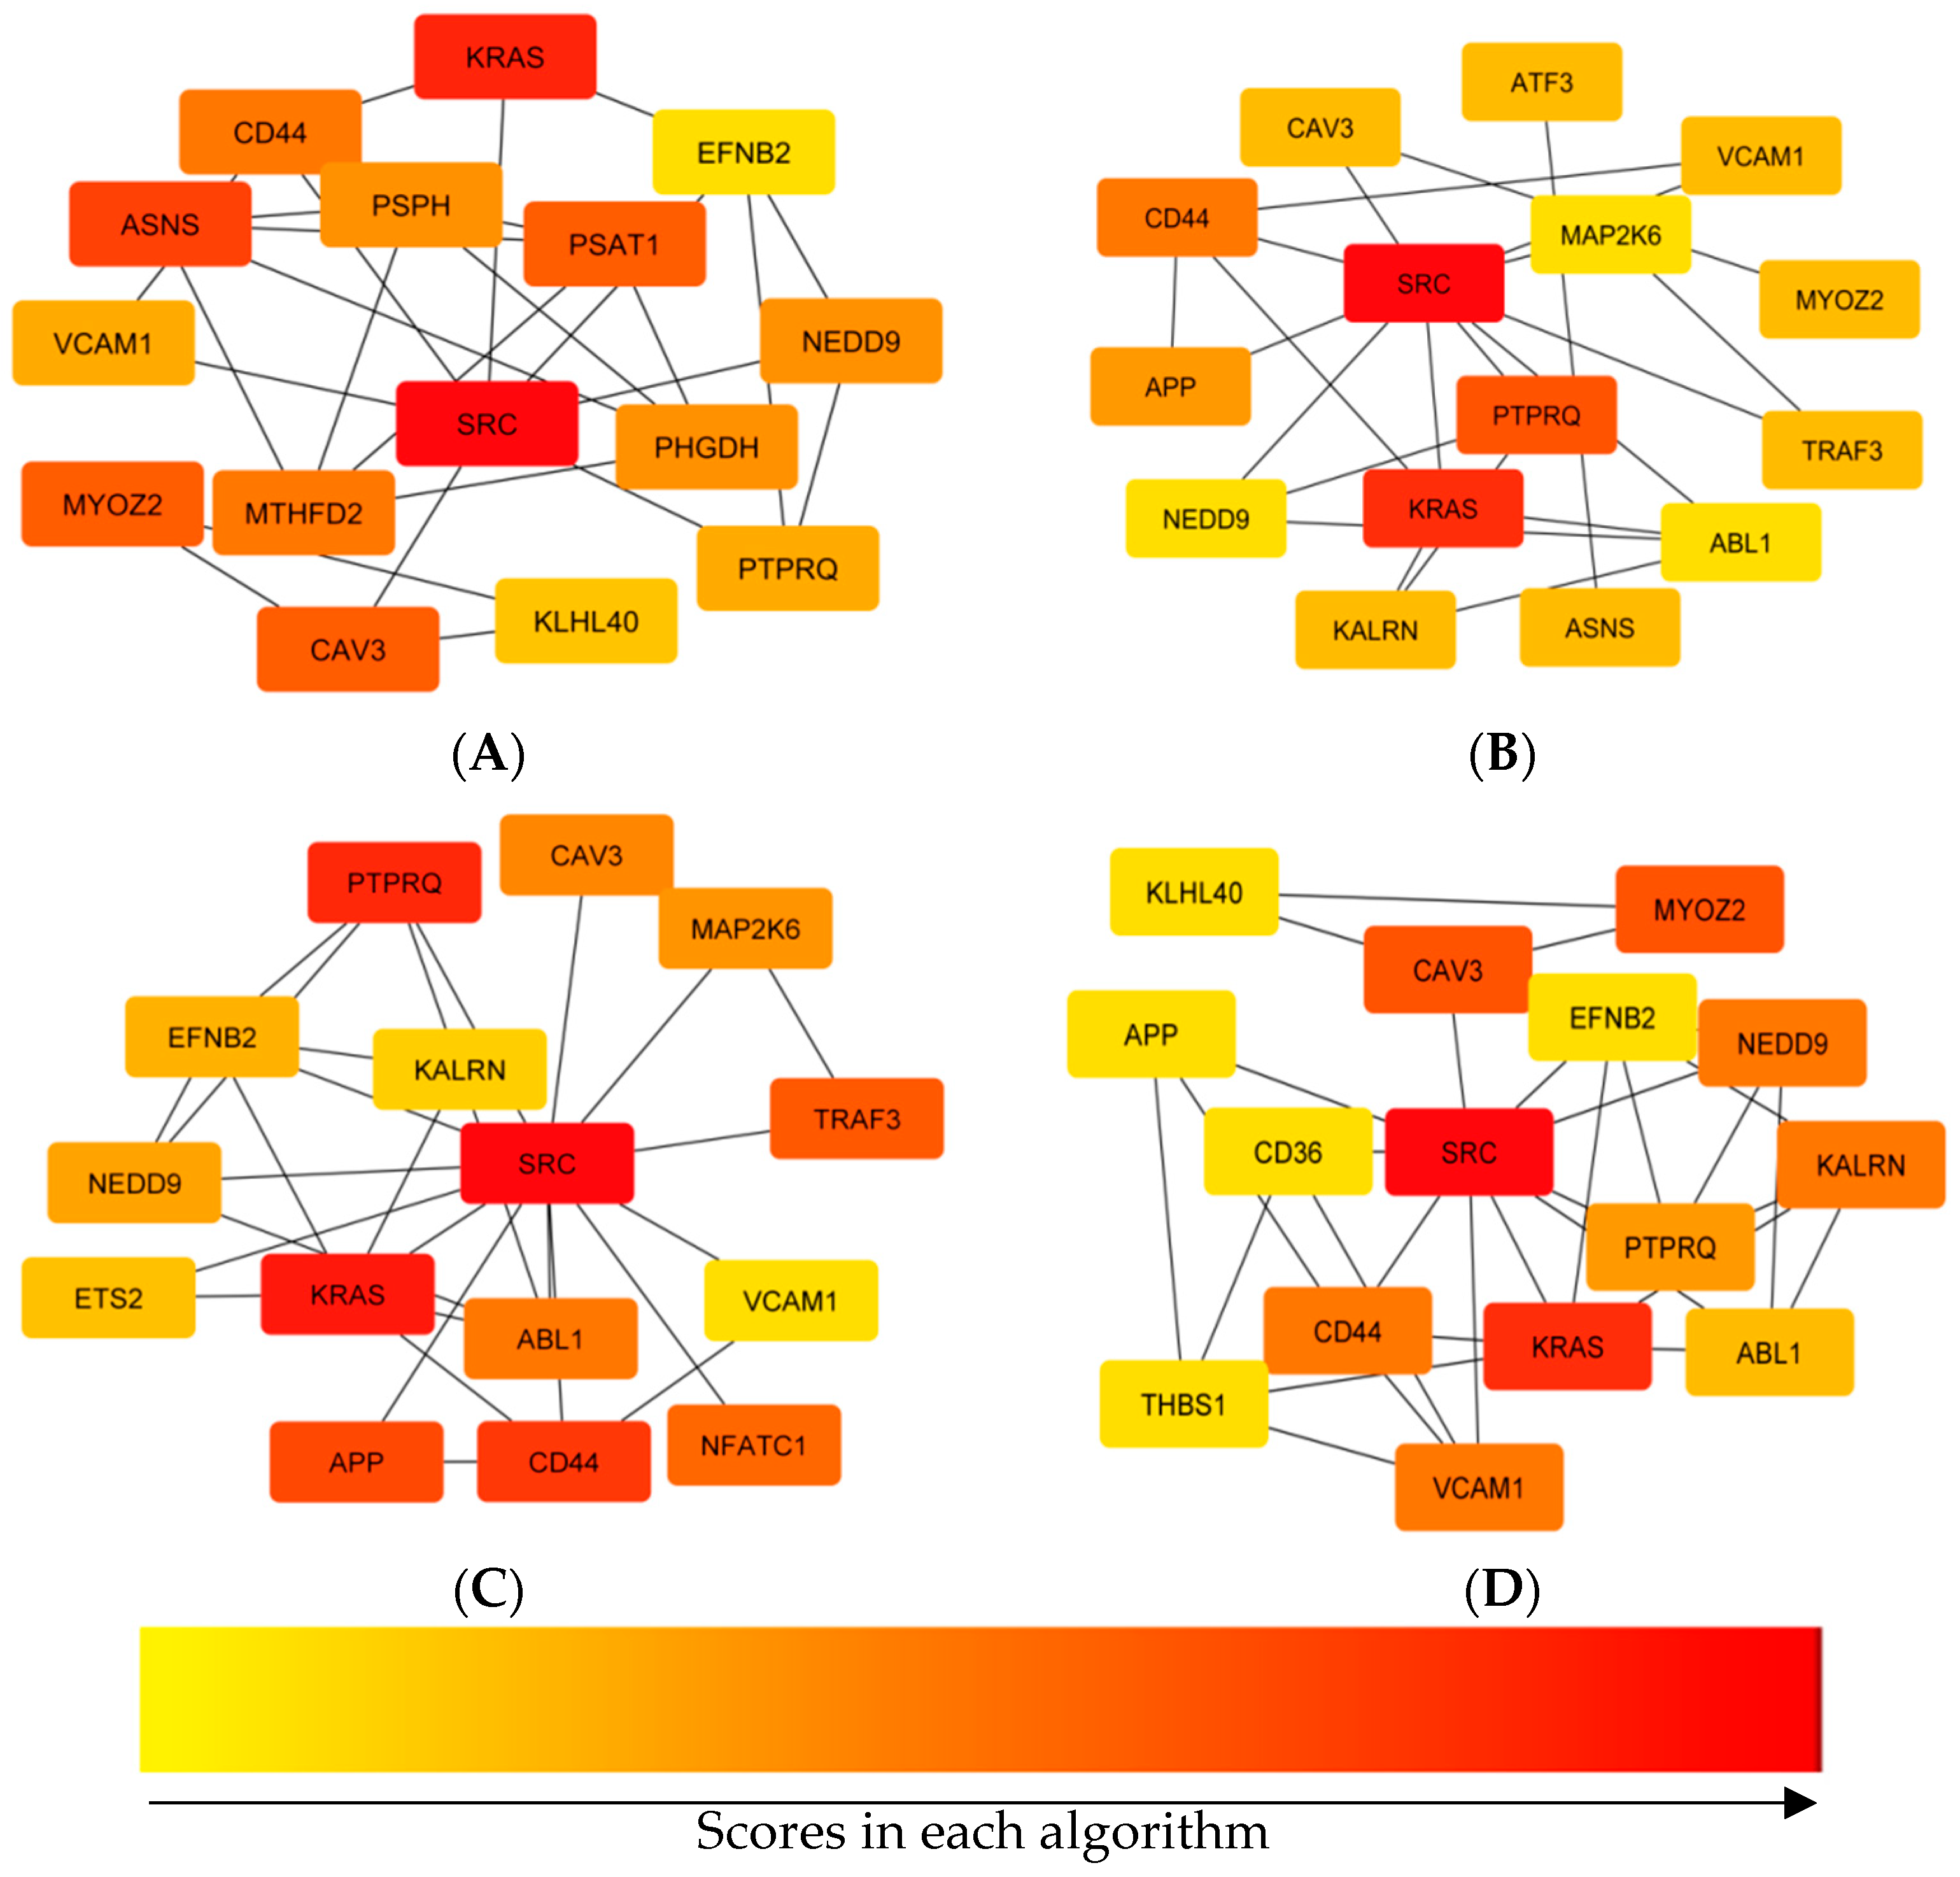
To further evaluate the intrinsic relationship between DEGs, mapping of the PPI networks was performed. Analyzing PPI networks is essential for understanding the molecular basis for complex traits. In the current study, after construction of the PPI network, the top centrality hub genes were achieved through four centrality algorithms. Finally, seven hub genes, including CD44, VCAM1, KRAS, NEDD9, SRC, PTPRQ, and CAV3 were identified.
During inflammation, vascular cell adhesion molecule 1 (VCAM1) is mainly expressed in endothelial cells and causes vascular inflammation [34]. VCAM1 was reported as a key gene related to the feed efficiency of native chickens [14]. KRAS plays an important role in regulating cell proliferation and was down-regulated in HFE turkeys in the current study. In a RNA-Seq transcriptomics and pathway analysis study on dairy cattle with a high and low residual feed intake, one of the genes with a significantly different expression was KRAS gene [35]. Zarek et al. (2017) investigated gene expression related to weight gain and feed intake in liver tissue and showed that the KRAS gene was one of the DEGs between groups with a different phenotype of weight gain and feed intake [36]. Mukherjee et al. (2020) found that the phosphatidylinositol phosphatase (PTPRQ) gene was up-regulated in low growth bovines. This gene can regulate cell survival and proliferation [37]. The caveolin 3 gene (CAV3) is a member of the caveolin family and acts as a specific muscle isoform of the caveolin protein. Lassiter et al. (2019) showed that the CAV3 and MYOZ2 genes were among the DEGs that were involved in muscle development and differentiation in broilers with a high and low feed efficiency [38]. The SRC gene encodes protein tyrosine kinases. Lam et al. (2021) used RNA-Seq to identify that the SRC gene is among the most important genes with different expression in a group of animals with low feed efficiency [39]. Bottje et al. (2017) investigated broilers with divergent feed efficiency and one of the top enrichment down-regulated genes in the HFE group was CD44 [40]. Onteru et al. (2013) found that NEDD9 (neural precursor cell expressed, developmentally down-regulated 9) was one of the significant single nucleotide polymorphisms between pigs with a low and high residual feed intake (RFI) [41].
To further analyze the PPI network, we investigated the significant modules and found six modules with an MCODE score of higher than three. Both KEGG pathway and GO analyses were performed using the ClueGO plugin, and only the first module (including PSPH, PHGDH, PSAT1, MTHFD2, and ASNS) showed significant enrichment terms. The most important of these enrichment analyses were the alpha-amino acid biosynthetic process and the L-serine biosynthetic process. As mentioned before, the amino acid and protein biosynthetic process has a significant effect on the feed efficiency of animals.
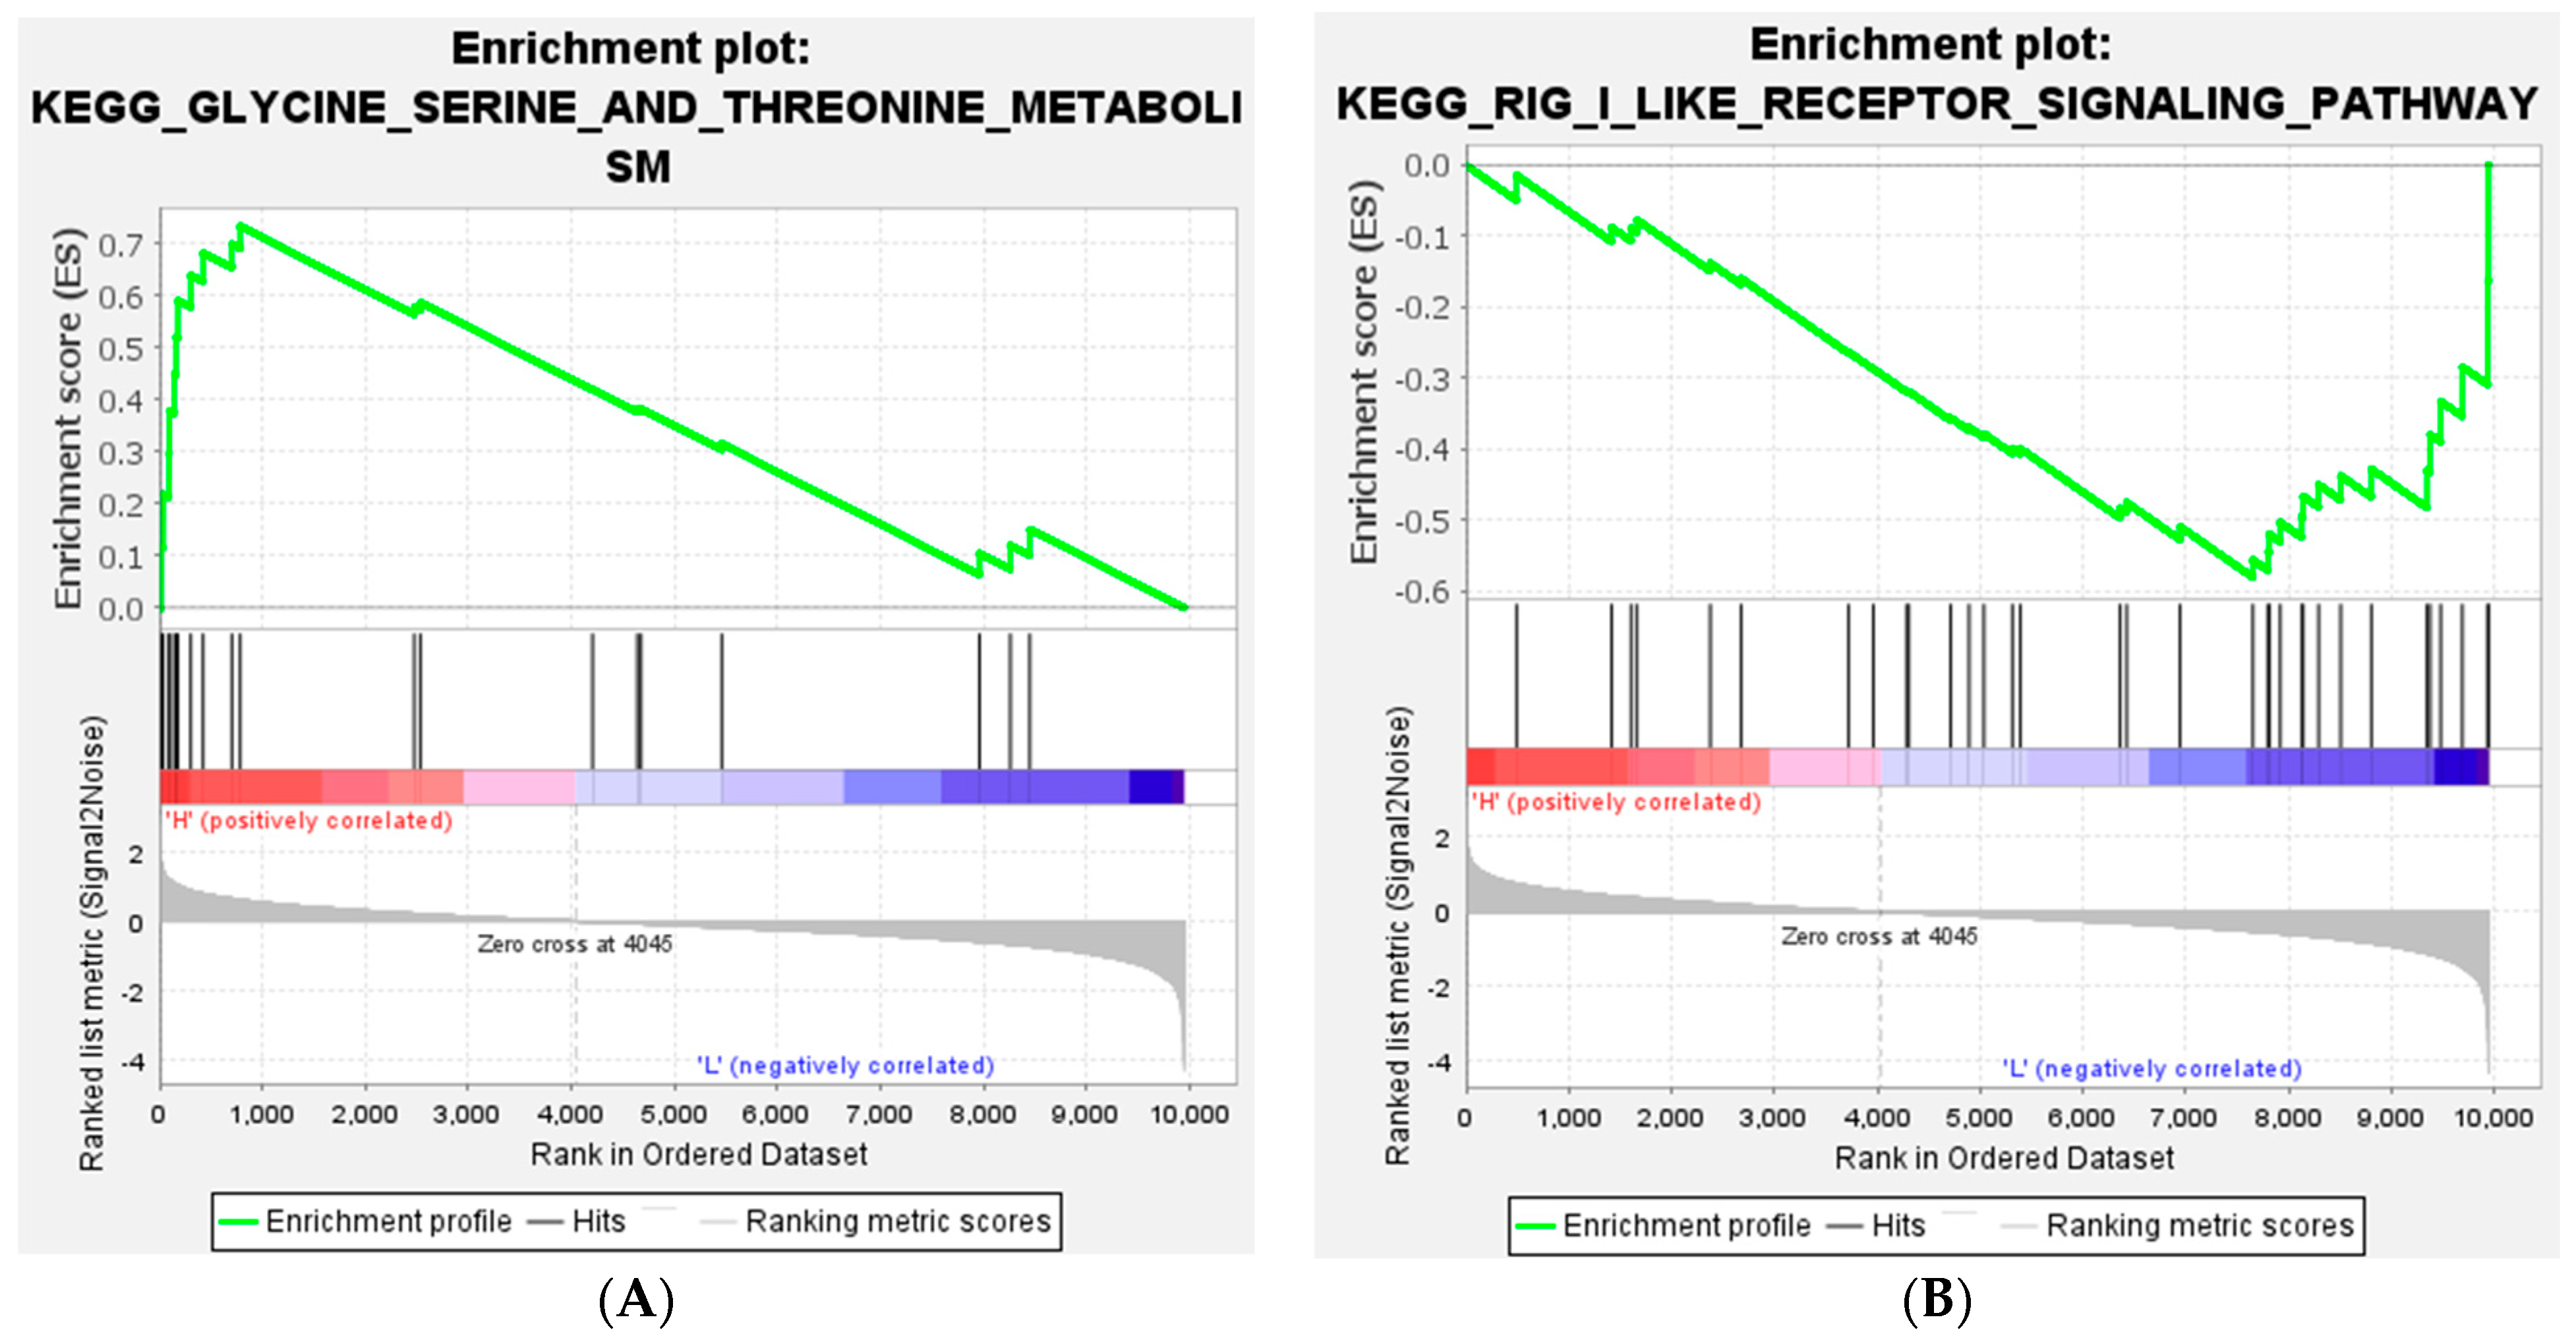
In the current study, we applied the GSEA method to change the RNA-Seq data into biological interpretations. Therefore, there are not any limitations and thresholds for the expressed genes to perform function analysis. In addition, GSEA can reliably identify gene sets with biological significance [42]. As a result, the most significant gene set that was highly expressed in HFE was glycine, serine, and threonine metabolism. As mentioned before, amino acid metabolism has a key effect on feed efficiency. On the other hand, the most significant gene lists in the LFE group were the RIG-I-like receptor signaling pathway and the Jak-STAT signaling pathway. Both of these pathways are related to the inflammatory response and the immune response. This might suggest increased oxidative stress in the LFE phenotype which agrees with findings in the muscle [43], intestines [44], liver [45], and heart [46] and those of the study of Lassiter et al. (2006) on high and low FE broilers [24]. It has been reported that the high production of pro-inflammatory agents may cause damage to the intestinal integrity and decrease feed efficiency [47]. These results showed that pathways associated with the inflammatory and immune responses are related to feed efficiency. The study of Yang et al. (2020) reported an overexpression of genes related to the Jak-STAT signaling pathway in native chickens with a high RFI [14].
To confirm the putative results from RNA-Seq, we randomly selected a subset of DEGs for qRT-PCR assays. Overall, there was an excellent agreement and high concordance between the computational and experimental results, which revealed a good detection sensitivity and accuracy.

5. Conclusions

This study provided new insights into the differences in the transcriptomes of breast muscle tissue between high and low feed efficiency native male turkeys. In the pathway analysis of up-regulated genes, major pathways included the “metabolism of glycine, serine, and threonine”; the “adipocytokine signaling pathway” and the “biosynthesis of amino acids”. In the pathway analysis of down-regulated genes, the major pathways included “dorso-ventral axis formation” and “actin cytoskeleton regulation”. Our results showed that feed efficiency is associated with metabolic pathways, especially with the metabolism of various amino acids and protein deposition. Furthermore, functional analysis and protein network interaction analysis revealed that genes including GATM, PSAT1, PSPH, PHGDH, VCAM1, CD44, KRAS, SRC, CAV3, NEDD9, and PTPRQ were key genes for feed efficiency. The key genes introduced in the current study can be used as biomarkers to perform breeding work in the native turkey population of Iran. In addition, this study is the first study to examine transcripts related to feed efficiency in turkey species. The results of this study can be compared with the results of other poultry such as broilers and can be used to explain the comprehensive atlas of genes involved in poultry feed efficiency.

Author Contributions

Conceptualization, Z.P. and S.Z.M.; data curation, Z.P. and S.G.; formal analysis, Z.P. and E.E.; funding acquisition, S.Z.M.; investigation, Z.P. and S.G.; methodology, Z.P.; project administration, S.Z.M.; resources, Z.P.; software, Z.P. and E.E.; supervision, S.Z.M.; validation, S.Z.M., S.G. and E.E.; visualization, S.Z.M., S.G. and E.E.; writing—original draft, Z.P.; writing—review and editing, S.Z.M. and S.G. All authors have read and agreed to the published version of the manuscript.

Funding

This research was funded by the Iran National Science Foundation, grant number 95836611 and by of the Biotechnology Development Council of the Islamic Republic of Iran, grant number 980304.

Institutional Review Board Statement

This animal study protocol was approved by the Ethics Committee of University of Guilan (protocol code 25433/p15 and date of approval 6 September 2021).

Informed Consent Statement

Not applicable.

Data Availability Statement

Not applicable.

Acknowledgments

The authors would like to thank Walter G. Bottje for reviewing and editing the manuscript.

Conflicts of Interest

The authors declare no conflict of interest.

References

  1. Case, L.A.; Wood, B.J.; Miller, S.P. The genetic parameters of feed efficiency and its component traits in the turkey (Meleagris gallopavo). Genet. Sel. Evol. 2012, 44, 2. [Google Scholar] [CrossRef] [PubMed] [Green Version]
  2. Willems, O.W.; Miller, S.P.; Wood, B.J. Assessment of residual body weight gain and residual intake and body weight gain as feed efficiency traits in the turkey (Meleagris gallopavo). Genet. Sel. Evol. 2013, 45, 26. [Google Scholar] [CrossRef] [PubMed] [Green Version]
  3. Aggrey, S.E.; Karnuah, A.B.; Sebastian, B.; Anthony, N.B. Genetic properties of feed efficiency parameters in meat-type chickens. Genet. Sel. Evol. 2010, 42, 25. [Google Scholar] [CrossRef] [PubMed] [Green Version]
  4. Willems, O.W. Evaluation Methods and Technologies for Improving Feed Efficiency in the Turkey (Meleagris gallopavo). Ph.D. Thesis, The University of Guelph, Guelph, ON, Canada, 2014. [Google Scholar]
  5. Kong, B.W.; Song, J.J.; Lee, J.Y.; Hargis, B.M.; Wing, T.; Lassiter, K.; Bottje, W. Gene expression in breast muscle associated with feed efficiency in a single male broiler line using a chicken 44K oligo microarray. I. Top differentially expressed genes. Poult. Sci. 2011, 90, 2535–2547. [Google Scholar] [CrossRef] [PubMed]
  6. Bottje, W.; Carstens, G. Association of mitochondrial function and feed efficiency in poultry and livestock species. J. Anim. Sci. 2009, 87, E48–E63. [Google Scholar] [CrossRef] [PubMed] [Green Version]
  7. Zhou, N.; Lee, W.R.; Abasht, B. Messenger RNA sequencing and pathway analysis provide novel insights into the biological basis of chickens’ feed efficiency. BMC Genom. 2015, 16, 195. [Google Scholar] [CrossRef] [Green Version]
  8. Lee, J.; Aggrey, S. Transcriptomic differences of genes in the avian target of rapamycin (avTOR) pathway in a divergent line of meat-type chickens selected for feed efficiency. Genet. Mol. Res. 2016, 15. [Google Scholar] [CrossRef]
  9. Metzler-Zebeli, B.U.; Magowan, E.; Hollmann, M.; Ball, M.E.E.; Molnar, A.; Witter, K.; Ertl, R.; Hawken, R.J.; Lawlor, P.G.; O’Connell, N.E.; et al. Differences in intestinal size, structure, and function contributing to feed efficiency in broiler chickens reared at geographically distant locations. Poult. Sci. 2018, 97, 578–591. [Google Scholar] [CrossRef]
  10. Yang, L.; Wang, X.; He, T.; Xiong, F.; Chen, X.; Chen, X.; Jin, S.; Geng, Z. Association of residual feed intake with growth performance, carcass traits, meat quality, and blood variables in native chickens. J. Anim. Sci. 2020, 98, skaa121. [Google Scholar] [CrossRef]
  11. Yi, G.; Yuan, J.; Bi, H.; Yan, W.; Yang, N.; Qu, L. In-Depth Duodenal Transcriptome Survey in Chickens with Divergent Feed Efficiency Using RNA-Seq. PLoS ONE 2015, 10, e0136765. [Google Scholar] [CrossRef] [Green Version]
  12. Coble, D.J.; Fleming, D.; Persia, M.E.; Ashwell, C.M.; Rothschild, M.F.; Schmidt, C.J.; Lamont, S.J. RNA-Seq analysis of broiler liver transcriptome reveals novel responses to high ambient temperature. BMC Genom. 2014, 15, 7. [Google Scholar] [CrossRef] [Green Version]
  13. Zhuo, Z.; Lamont, S.J.; Lee, W.R.; Abasht, B. RNA-Seq analysis of abdominal fat reveals differences between modern commercial broiler chickens with high and low feed efficiencies. PLoS ONE 2015, 10, e0135810. [Google Scholar] [CrossRef] [Green Version]
  14. Yang, L.; He, T.; Xiong, F.; Chen, X.; Fan, X.; Jin, S.; Geng, Z. Identification of key genes and pathways associated with feed efficiency of native chickens based on transcriptome data via bioinformatics analysis. BMC Genom. 2020, 21, 292. [Google Scholar] [CrossRef] [PubMed] [Green Version]
  15. Vandesompele, J.; De Preter, K.; Pattyn, F.; Poppe, B.; Van Roy, N.; De Paepe, A.; Speleman, F. Accurate normalization of real-time quantitative RT-PCR data by geometric averaging of multiple internal control genes. Genom. Biol. 2002, 3, research0034.1. [Google Scholar] [CrossRef] [Green Version]
  16. Artegoitia, V.M.; Foote, A.P.; Lewis, R.M.; Freetly, H.C. Metabolomics profile and targeted lipidomics in multiple tissues associated with feed efficiency in beef steers. ACS Omega 2019, 4, 3973–3982. [Google Scholar] [CrossRef] [Green Version]
  17. Wang, X.; Kadarmideen, H.N. Metabolomics analyses in high-low feed efficient dairy cows reveal novel biochemical mechanisms and predictive biomarkers. Metabolites 2019, 9, 151. [Google Scholar] [CrossRef] [PubMed] [Green Version]
  18. Yang, H.; Huang, X.; Fang, S.; He, M.; Zhao, Y.; Wu, Z.; Yang, M.; Zhang, Z.; Chen, C.; Huang, L. Unraveling the fecal microbiota and metagenomic functional capacity associated with feed efficiency in pigs. Front. Microbiol. 2017, 8, 1555. [Google Scholar] [CrossRef] [PubMed] [Green Version]
  19. Pan, S.; Fan, M.; Liu, Z.; Li, X.; Wang, H. Serine, glycine and one-carbon metabolism in cancer. Int. J. Oncol. 2021, 58, 158–170. [Google Scholar] [CrossRef]
  20. Kim, H.; Park, Y.J. Links between serine biosynthesis pathway and epigenetics in cancer metabolism. Clin. Nutr. Res. 2018, 7, 153–160. [Google Scholar] [CrossRef] [Green Version]
  21. Xu, C.; Wang, X.; Zhuang, Z.; Wu, J.; Zhou, S.; Quan, J.; Ding, R.; Ye, Y.; Peng, L.; Wu, Z. A transcriptome analysis reveals that hepatic glycolysis and lipid synthesis are negatively associated with feed efficiency in DLY pigs. Sci. Rep. 2020, 10, 9874. [Google Scholar] [CrossRef]
  22. Kazak, L.; Chouchani, E.T.; Lu, G.Z.; Jedrychowski, M.P.; Bare, C.J.; Mina, A.I.; Kumari, M.; Zhang, S.; Vuckovic, I.; Laznik-Bogoslavski, D.; et al. Genetic depletion of adipocyte creatine metabolism inhibits diet-induced thermogenesis and drives obesity. Cell. Metab. 2017, 26, 660–671. [Google Scholar] [CrossRef] [PubMed] [Green Version]
  23. Fonseca, L.D.; Eler, J.P.; Pereira, M.A.; Rosa, A.F.; Alexandre, P.A.; Moncau, C.T.; Salvato, F.; Rosa-Fernandes, L.; Palmisano, G.; Ferraz, J.; et al. Liver proteomics unravel the metabolic pathways related to feed efficiency in beef cattle. Sci. Rep. 2019, 9, 5364. [Google Scholar] [CrossRef] [PubMed] [Green Version]
  24. Koonen, D.P.; Glatz, J.F.; Bonen, A.; Luiken, J.J. Long-chain fatty acid uptake and FAT/CD36 translocation in heart and skeletal muscle. Biochim. Biophys. Acta (BBA)-Mol. Cell Biol. Lipids 2005, 1736, 163–180. [Google Scholar] [CrossRef] [PubMed]
  25. Xi, Y.M.; Yang, Z.; Wu, F.; Han, Z.Y.; Wang, G.L. Gene expression profiling of hormonal regulation related to the residual feed intake of Holstein cattle. Biochem. Biophys. Res. Commun. 2015, 465, 19–25. [Google Scholar] [CrossRef] [PubMed]
  26. Lassiter, K.; Ojano-Dirain, C.; Iqbal, M.; Pumford, N.R.; Tinsley, N.; Lay, J.; Liyanage, R.; Wing, T.; Cooper, M.; Bottje, W. Differential expression of mitochondrial and extramitochondrial proteins in lymphocytes of male broilers with low and high feed efficiency. Poult. Sci. 2006, 85, 2251–2259. [Google Scholar] [CrossRef] [PubMed]
  27. Pezeshkian, Z.; Mirhoseini, S.Z.; Ghovvati, S. Identification of hub genes involved in apparent metabolizable energy of chickens. Anim. Biotechnol. 2020, 33, 242–249. [Google Scholar] [CrossRef]
  28. Dibner, J.; Buttin, P. Use of organic acids as a model to study the impact of gut microflora on nutrition and metabolism. J. Appl. Poult. Res. 2002, 11, 453–463. [Google Scholar] [CrossRef]
  29. Lee, J. Molecular Basis of Feed Efficiency in Meat-Type Chickens. Ph.D. Thesis, University of Georgia, Athens, GA, USA, 2012. [Google Scholar]
  30. Mckenna, C. An Examination of the Molecular Control of Feed Efficiency in Beef Cattle. Ph.D. Thesis, Trinity College Dublin, Dublin, Ireland, 2018. [Google Scholar]
  31. Brearley, M.C.; Li, C.; Daniel, Z.C.; Loughna, P.T.; Parr, T.; Brameld, J.M. Changes in expression of serine biosynthesis and integrated stress response genes during myogenic differentiation of C2C12 cells. Biochem. Biophys. Rep. 2019, 20, 100694. [Google Scholar] [CrossRef]
  32. Chen, Y.; Gondro, C.; Quinn, K.; Herd, R.M.; Parnell, P.F.; Vanselow, B. Global gene expression profiling reveals genes expressed differentially in cattle with high and low residual feed intake. Anim. Genet. 2011, 42, 475–490. [Google Scholar] [CrossRef]
  33. Keogh, K.; Kenny, D.A.; Cormican, P.; Kelly, A.K.; Waters, S.M. Effect of dietary restriction and subsequent re-alimentation on the transcriptional profile of hepatic tissue in cattle. BMC Genom. 2016, 17, 244. [Google Scholar] [CrossRef] [Green Version]
  34. Cook-Mills, J.M.; Marchese, M.E.; Abdala-Valencia, H. Vascular cell adhesion molecule-1 expression and signaling during disease: Regulation by reactive oxygen species and antioxidants. Antioxid. Redox Signal. 2011, 15, 1607–1638. [Google Scholar] [CrossRef] [PubMed] [Green Version]
  35. Salleh, M.S.; Mazzoni, G.; Höglund, J.K.; Olijhoek, D.W.; Lund, P.; Løvendahl, P.; Kadarmideen, H.N. RNA-Seq transcriptomics and pathway analyses reveal potential regulatory genes and molecular mechanisms in high-and low-residual feed intake in Nordic dairy cattle. BMC Genom. 2017, 18, 258. [Google Scholar] [CrossRef] [PubMed] [Green Version]
  36. Zarek, C.M.; Lindholm-Perry, A.K.; Kuehn, L.A.; Freetly, H.C. Differential expression of genes related to gain and intake in the liver of beef cattle. BMC Res. Notes 2017, 10, 581. [Google Scholar] [CrossRef] [Green Version]
  37. Mukherjee, S.; Mukherjee, A.; Jasrotia, R.S.; Jaiswal, S.; Iquebal, M.A.; Longkumer, I.; Mech, M.; Vüpru, K.; Khate, K.; Rajkhowa, C.; et al. Muscle transcriptome signature and gene regulatory network analysis in two divergent lines of a hilly bovine species Mithun (Bos frontalis). Genomics 2020, 112, 252–262. [Google Scholar] [CrossRef] [PubMed]
  38. Lassiter, K.; Kong, B.C.; Piekarski-Welsher, A.; Dridi, S.; Bottje, W.G. Gene expression essential for myostatin signaling and skeletal muscle development is associated with divergent feed efficiency in pedigree male broilers. Front. Physiol. 2019, 10, 126. [Google Scholar] [CrossRef] [PubMed]
  39. Lam, S.; Miglior, F.; Fonseca, P.A.S.; Gómez-Redondo, I.; Zeidan, J.; Suárez-Vega, A.; Schenkel, F.; Guan, L.L.; Waters, S.; Stothard, P.; et al. Identification of functional candidate variants and genes for feed efficiency in Holstein and Jersey cattle breeds using RNA-Sequencing. J. Dairy Sci. 2021, 104, 1928–1950. [Google Scholar] [CrossRef]
  40. Bottje, W.; Kong, B.W.; Reverter, A.; Waardenberg, A.J.; Lassiter, K.; Hudson, N.J. Progesterone signalling in broiler skeletal muscle is associated with divergent feed efficiency. BMC Syst. Biol. 2017, 11, 29. [Google Scholar] [CrossRef] [Green Version]
  41. Onteru, S.K.; Gorbach, D.M.; Young, J.M.; Garrick, D.J.; Dekkers, J.C.; Rothschild, M.F. Whole genome association studies of residual feed intake and related traits in the pig. PLoS ONE 2013, 8, e61756. [Google Scholar] [CrossRef] [Green Version]
  42. Wang, X.; Cairns, M.J. Gene set enrichment analysis of RNA-Seq data: Integrating differential expression and splicing. BMC Bioinform. 2013, 14, S16. [Google Scholar] [CrossRef] [Green Version]
  43. Bottje, W.; Iqbal, M.; Tang, Z.X.; Cawthon, D.; Okimoto, R.; Wing, T.; Cooper, M. Association of mitochondrial function with feed efficiency within a single genetic line of male broilers. Poult. Sci. 2002, 81, 546–555. [Google Scholar] [CrossRef]
  44. Ojano-Dirain, C.; Iqbal, M.; Wing, T.; Cooper, M.; Bottje, W. Glutathione and respiratory chain complex activity in duodenal mitochondria of broilers with low and high feed efficiency. Poult. Sci. 2005, 84, 782–788. [Google Scholar] [CrossRef] [PubMed]
  45. Iqbal, M.; Pumford, N.R.; Tang, Z.X.; Lassiter, K.; Ojano-Dirain, C.; Wing, T.; Cooper, M.; Bottje, W. Compromised liver mitochondrial function and complex activity in low feed efficient broilers are associated with higher oxidative stress and differential protein expression. Poult. Sci. 2005, 84, 933–941. [Google Scholar] [CrossRef] [PubMed]
  46. Tinsley, N.; Iqbal, M.; Pumford, N.R.; Lassiter, K.; Ojano-Dirain, C.; Wing, T.; Bottje, W. Investigation of mitochondrial protein expression and oxidation in heart muscle in low and high feed efficient male broilers in a single genetic line. Poult. Sci. 2010, 89, 349–352. [Google Scholar] [CrossRef] [PubMed]
  47. McKay, D.; Baird, A. Cytokine regulation of epithelial permeability and ion transport. Gut 1999, 44, 283–289. [Google Scholar] [CrossRef] [PubMed] [Green Version]
Figure 1. Classification of HFE and LFE turkeys according to the results of multiple corresponding analyses. The results show that HFE and LFE turkeys can be divided into two groups.
Animals 12 01240 g001
Figure 2. The volcano plot indicates the −log10 (p-value) for genome-wide genes (y-axis) plotted against their respective log2 (fold change) (x-axis). Red dots represent up-regulated genes and green dots represent down-regulated genes.
Animals 12 01240 g002
Figure 3. Gene ontology analysis of all DEGs. The bubble plot shows the GO enrichment of differentially expressed genes in five biological process terms and one molecular function.
Animals 12 01240 g003
Figure 4. Comparing hub genes that were identified using four centrality algorithms of CytoHubba. (A) MCC, (B) degree, (C) closeness, (D) MNC.
Animals 12 01240 g004
Figure 5. Venn plot to identify significant hub genes created by four centrality algorithms. Areas with different colors are related to different methods. The cross areas show the common DEGs. There are seven genes in concurrent areas.
Animals 12 01240 g005
Figure 6. The significant modules of the DEGs PPI network. (AF): Modules 1–6. (red nodes: up-regulated genes, green nodes: down-regulated genes). (G): Functional enrichment analysis of module 1. The two green spectra represent two different gene ontologies in which the genes of this module are involved (L-serine biosynthetic process and alpha-amino acid biosynthetic process).
Animals 12 01240 g006
Figure 7. Gene set enrichment analysis (GSEA). The enrichment plot of most significant expressed in (A) HFE (glycine, serine, and threonine metabolism) and (B) LFE (RIG-I-like receptor signaling pathway) birds.
Animals 12 01240 g007
Figure 8. Expression stability analysis of reference genes in breast muscle tissue of turkeys. The most stably expressed genes have lower M values.
Animals 12 01240 g008
Figure 9. The results of qRT-PCR confirmation for 20 selected differentially expressed genes. The X-axis shows 20 selected genes for qRT-PCR assays, and the Y-axis demonstrates the log2 (fold change) derived from RNA-Seq and qRT-PCR.
Animals 12 01240 g009
Figure 10. Quantitative real-time PCR (qRT-PCR) validation and linear regression analysis of RNA sequencing of selected DEGs.
Animals 12 01240 g010
Figure 11. Three important pathways which were significant in HFE turkeys, including glycine, serine, and threonine metabolism, the adipocytokine signaling pathway, and the biosynthesis of amino acids (created with BioRender.com, accessed on 10 April 2022).
Animals 12 01240 g011
Table 1. The primer sequences of target genes and housekeeping genes used in this study.
Gene NameAccession Number Sequence of Primers (5′ → 3′) *Product Length (bp)
GATMXM_019619468ForwardCGTTTAATATCATTGGACCTGG216
ReverseTTGAAGTCTCATTGGCATCG
GNMTXM_010706618ForwardCTGGAGCAGGACCTGGAGAAG246
ReverseCTTGGTCAGGTCGCTCTTGTAG
KRASNM_001303223ForwardCTGAAGATGTCCCAATGGTGCT182
ReverseGTGTTTTCTGATTCTCGAACTAATG
MAT1AXM_003207784ForwardATGCCAAAGTTGCTTGTGAGAC192
ReverseGTGATTGCTGTTCCAGTGCCA
CAV3XM_003210208ForwardCAAAGCGGATCAACGAAGAC200
ReverseGATGAGGGCGAAGAGGAAGC
MYOZ2XM_003205713ForwardCACAACGAAACAGTACGCAAGG196
ReverseTGGGTGAGACTCAATACAATGAG
MUSKXM_010726142ForwardGAATATAACCAGGACTTGCTACAG164
ReverseCAGTAATTCTCAGCATCAGACAG
SMTNXM_010720500ForwardGACAGGCAGCATCTTTGACC135
ReverseCTGTGAGGTTGATGTCTTGGG
MAP2K6XM_010721466ForwardTTTAGCAACCGAGTCAACGA105
ReverseTTTAGCAACCGAGTCAACGA
ALG6XM_003208901ForwardCAAGAAGGGACTGAAAGGAAAGG169
ReverseCTACTTTATCCTCAAACAAGCCTC
MTHFD2XM_003206271ForwardTCATAAAGAGAACAGGCATCCCA154
ReverseTAACGGTGTGATATTGTGACTGTG
CD36XM_010726962ForwardCCAGGAAGCTCTGTTTACAGG121
ReverseTATCGCACCCTATATGTGTAAGGT
APPXM_010722443ForwardGAAGTTGTCAGAGTCCCTACC173
ReverseTTCTGCCTCCTCCCATTCTC
AGO2XM_031552935ForwardTGGAAGAGATAAAGTGGAGTGGA156
ReverseCTGGATGGTTTCAAATGGGAC
ACAT2XM_003204090ForwardAGGAAAGCTATTGACAAAGCCA186
ReverseCAAGGATGCGACAACCAGAG
DLL1XM_031552428ForwardCTTGTGCTAATGGAGCCCAG196
ReverseGCAGTTCTTCCCGTTGTATCC
WIPI1XM_010721504ForwardCAGGTTATTCGGAGGATGGT118
ReverseACGGCACAAGATTATAGGAGGA
ASNSXM_019616348ForwardATATTTCCATAAGGCACCATCTCC159
ReverseGTAAGAAGTAAGCGATGATCCAG
SRCXM_003211956ForwardCAGCAAGAGCAAACCCAAAGA103
ReverseCTTGTTGGGGGTCTGCGAG
EIF2AK3XM_010710584ForwardGAGTCAAGACCCTGAGCGATGT178
ReverseGGTTTGGCTGGGAGTTCCA
18SAJ419877ForwardCTGCCCTATCAACTTTCGATGG171
ReverseGGATGTGGTAGCCGTTTCTCA
GAPDHNM_001303179ForwardCCCAGAACATCATCCCAGCAT137
ReverseACGGCAGGTCAGGTCAACAAC
RPS7NM_001285787ForwardTGAAGTAGGTGGTGGCAGGAA165
ReverseCTCGTTGGCTTGGGCAGAA
* All primers were designed specifically for the current study.
Table 2. A summary of short reads before and after trimming and mapped reads which were aligned against the reference genome for HFE and LFE turkeys.
SampleRaw ReadsTrimmed ReadsMapped Ratio (%)
H171,407,39071,397,08274.56
H281,000,06280,986,08672.76
H380,467,68680,451,47874.25
L193,253,47293,235,60274.56
L275,960,34275,946,33873.1
L369,196,19069,186,02674.63
Table 3. Pathway analysis of DEGs in HFE compared to LFE turkeys (genes with red font color represent up-regulated genes, and genes with green font color represent down-regulated genes).
TermBiological ProcessCountp-ValueGenes
Up-regulated
mgp00260Glycine, serine, and threonine metabolism61.64 × 10−5GATM, PHGDH, GNMT, PSPH, PSAT1, LOC100550886
mgp01230Biosynthesis of amino acids50.001MAT1A, PHGDH, PSPH, PSAT1, LOC100550886
mgp04920Adipocytokine signaling pathway50.0022CD36, ACSBG2, AMPK, ACC2, ADIPOQ
mgp01100Metabolic pathways170.021POLR3H, GATM, ACSBG2, ASNS, ALG6, ACC2, PSPH, ACAT2, PMM2, PMM1, MTHFD2, MAT1A, PHGDH, PSAT1, DCXR, DHCR24, LOC100550886
Down-regulated
mgp04320Dorso-ventral axis formation40.002KRAS, CPEB3, ETS2, CPEB4
mgp04810Regulation of actin cytoskeleton70.022ENAH, PIKFYVE, MRAS, SRC, MSN, KRAS, NCKAP1L
Table 4. Ontology analysis of up-regulated genes in HFE compared to LFE turkeys.
TermBiological ProcessCountp-ValueGenes
GO:0006564L-serine biosynthetic process33.09 × 10−4PHGDH, PSPH, PSAT1
GO:0009298GDP-mannose biosynthetic process20.03PMM2, PMM1
GO:0048630skeletal muscle tissue growth20.03DLL1, CHRND
GO:1990000amyloid fibril formation20.03APP, CD36
GO:0034383low-density lipoprotein particle clearance20.03CD36, ADIPOQ
GO:0010881regulation of cardiac muscle contraction by regulation of the release of sequestered calcium ion20.03PLN, FKBP1B
GO:0051289protein homotetramerization30.033GNMT, ACC2, DCXR
GO:0010459negative regulation of heart rate20.04PLN, FKBP1B
Cellular component
GO:0005615extracellular space90.033CPNE9, MTHFD2, APP, CD36, IGFBP7, ANGPTL1, SPON2, ADIPOQ, ANGPT4
GO:0033017sarcoplasmic reticulum membrane20.039PLN, FKBP1B
GO:0070062extracellular exosome210.046CPNE9, SPON2, APP, SLC20A2, DCXR, PMM2, ADIPOQ, ACOT11, SEMA3G, SLC1A4, ACAT2, MYLK, GATM, TP53I3, BAIAP2L1, LOC100551072, PSAT1, PHGDH, IGFBP7, ANGPTL1, DDR2
GO:0030018Z disc30.0498ITGB1BP2, MYOZ2, FKBP1B
Molecular function
GO:0004615phosphomannomutase activity20.02PMM2, PMM1
Table 5. Ontology analysis of down-regulated genes in HFE compared to LFE turkeys.
TermBiological ProcessCountp-ValueGenes
GO:0035914skeletal muscle cell differentiation64.41× 10−5BTG2, MYF6, HIVEP3, FOXN2, ATF3, BCL9L
GO:0050731positive regulation of peptidyl-tyrosine phosphorylation50.003CD74, SRC, ABL1, ENPP2, RICTOR
GO:0060213positive regulation of nuclear-transcribed mRNA poly(A) tail shortening30.0083BTG2, AGO2, CPEB3
GO:0000122negative regulation of transcription from RNA polymerase II promoter100.0086PLK3, ZFHX3, MYOCD, NR4A3, TRPS1, NRIP1, OTUD7B, CPEB3, HDAC9, BARX2
GO:0045944positive regulation of transcription from RNA polymerase II promoter120.0106RPS6KA3, MLLT10, SBNO2, ATXN7, NRIP1, AGO2, TET2, NFATC1, ETS2, BCL9L, ARNTL, FOSL2
GO:0048536spleen development30.0252TET2, ABL1, JARID2
GO:0070374positive regulation of ERK1 and ERK2 cascade50.0273CD74, SRC, ABL1, RAPGEF2, NOX4
GO:0048008platelet-derived growth factor receptor signaling pathway30.0287CSRNP1, ZFAND5, ARID5B
GO:0009791post-embryonic development40.03CSRNP1, AGO2, TET2, ARID5B
GO:0030968endoplasmic reticulum unfolded protein response30.04STC2, EIF2AK3, ATF3
GO:0048705skeletal system morphogenesis30.049CSRNP1, ZFAND5, ARID5B
TermCellular Component
GO:0005634Nucleus310.001CSRNP1, CCNJ, SRC, NAB1, CELF2, NEDD9, TNFAIP3, OTUD7B, ABHD5, UACA, BACH1, BARX2, NR3C2, NFIL3, SERTAD2, NFKBIZ, HIVEP3, SKIL, MYOCD, ARID5B, MSN, BTBD7, FOXN2, PISD, NR4A3, ALOX5AP, AGO2, MYF6, NOX4, CPEB3, CPEB4
GO:0005667transcription factor complex70.0025ZFHX3, NR4A3, HDAC9, SKIL, BARX2, ETS2, ARNTL
GO:0005730Nucleolus130.013PLK3, ZFHX3, DDX24, NUP153, STON2, PPM1E, BTBD10, NOL6, NRIP1, ABL1, KDM7A, ATF3, BCL9L
TermMolecular function
GO:0001078transcriptional repressor activity, RNA polymerase II core promoter proximal region sequence-specific binding79.69E-05NFIL3, AEBP2, ZNF536, BACH1, SKIL, ATF3, ETS2
GO:0043565sequence-specific DNA binding80.0059CSRNP1, ZFHX3, TRPS1, FOXN2, SKIL, ETS2, CREB5, NR3C2
GO:0000978RNA polymerase II core promoter proximal region sequence-specific DNA binding80.009ELF1, NR4A3, AEBP2, IRF1, ZNF536, SKIL, ATF3, ETS2
GO:0003713transcription coactivator activity60.01MYOCD, MAML1, SERTAD2, JMY, NRIP1, ARID5B
GO:0008270zinc ion binding180.02ZFHX3, ANKIB1, ZFAND5, TET2, TNFAIP3, OTUD7B, NUP153, NR3C2, MLLT10, PIKFYVE, NR4A3, TRAF3, TRPS1, DHX58, ENPP2, HIVEP3, LONRF2, KDM7A
GO:0046872metal ion binding130.028ZBTB21, ZBTB44, PPM1E, HDAC9, ZC3H12C, PDE10A, PDP2, AEBP2, MB, ZNF536, PRKCQ, ZNF644, PDE7B
GO:0003700transcription factor activity, sequence-specific DNA binding70.035TRPS1, NFATC1, FOXN2, CREB5, ARNTL, FOSL2, NR3C2
Table 6. List of all gene sets with an FDR ≤ 0.25.
KEGG SetSIZENESp-ValueFDR Q-ValueHigher Expression
KEGG_GLYCINE_SERINE_AND_THREONINE_METABOLISM201.6600.194HFE
KEGG_RIG_I_LIKE_RECEPTOR_SIGNALING_PATHWAY33−1.8539500.046LFE
KEGG_JAK_STAT_SIGNALING_PATHWAY70−1.5145100.188488LFE
KEGG_DORSO_VENTRAL_AXIS_FORMATION15−1.4677100.19519LFE
KEGG_NOD_LIKE_RECEPTOR_SIGNALING_PATHWAY30−1.4230900.200888LFE
KEGG_WNT_SIGNALING_PATHWAY96−1.468500.202649LFE
KEGG_NATURAL_KILLER_CELL_MEDIATED_CYTOTOXICITY54−1.4328900.205478LFE
KEGG_NEUROTROPHIN_SIGNALING_PATHWAY92−1.488600.205977LFE
KEGG_PROGESTERONE_MEDIATED_OOCYTE_MATURATION57−1.4839800.206473LFE
KEGG_FC_EPSILON_RI_SIGNALING_PATHWAY49−1.4962200.210286LFE
KEGG_MAPK_SIGNALING_PATHWAY163−1.5162800.212236LFE
KEGG_HEDGEHOG_SIGNALING_PATHWAY33−1.4431200.215766LFE
KEGG_TOLL_LIKE_RECEPTOR_SIGNALING_PATHWAY51−1.5237800.238885LFE
KEGG_B_CELL_RECEPTOR_SIGNALING_PATHWAY48−1.5191900.241404LFE
KEGG_GNRH_SIGNALING_PATHWAY61−1.3862500.246314LFE
Publisher’s Note: MDPI stays neutral with regard to jurisdictional claims in published maps and institutional affiliations.

