

Antigen-Induced IL-1RA Production Discriminates Active and Latent Tuberculosis Infection
 , , and
Abstract
:1. Background
2. Patients and Methods
2.1. Human Subjects
2.2. Antigens
2.3. PBMC Isolation and Peptide Stimulation
2.4. Luminex Cytokine Detection
2.5. Statistical Analysis
2.5.1. Normality Test
2.5.2. Bivariate and Multivariate Analysis
2.5.3. The Area under the Curve (AUC)
3. Results
4. Discussion
5. Conclusions
Author Contributions
Funding
Institutional Review Board Statement
Informed Consent Statement
Data Availability Statement
Acknowledgments
Conflicts of Interest
References
- Cohen, A.; Mathiasen, V.D.; Schön, T.; Wejse, C. The global prevalence of latent tuberculosis: A systematic review and meta-analysis. Eur. Respir. J. 2019, 54, 1900655. Available online: https://pubmed.ncbi.nlm.nih.gov/31221810/ (accessed on 26 October 2021). [CrossRef] [PubMed]
- Global TB Report. 2020. Available online: https://www.who.int/publications/i/item/9789240013131 (accessed on 26 October 2021).
- TB Profile. Available online: https://worldhealthorg.shinyapps.io/tb_profiles/?_inputs_&entity_type=%22country%22&lan=%22EN%22&iso2=%22PE%22 (accessed on 26 October 2021).
- Houben, R.M.G.J.; Dodd, P.J. The Global Burden of Latent Tuberculosis Infection: A Re-estimation Using Mathematical Modelling. PLoS Med. 2016, 13, e1002152. [Google Scholar] [CrossRef] [PubMed]
- Carranza, C.; Pedraza-Sanchez, S.; de Oyarzabal-Mendez, E.; Torres, M. Diagnosis for latent tuberculosis infection: New alternatives. Front. Immunol. 2020, 11, 2006. Available online: https://pubmed.ncbi.nlm.nih.gov/33013856/ (accessed on 26 October 2021). [CrossRef] [PubMed]
- Lee, S.H. Tuberculosis Infection and Latent Tuberculosis. Tuberc. Respir. Dis. 2016, 79, 201–206. Available online: https://pubmed.ncbi.nlm.nih.gov/27790271/ (accessed on 26 October 2021). [CrossRef] [PubMed]
- Pai, M.; Behr, M.A.; Dowdy, D.; Dheda, K.; Divangahi, M.; Boehme, C.C.; Ginsberg, A.; Swaminathan, S.; Spigelman, M.; Getahun, H. Tuberculosis. Nat. Rev. Dis. Prim. 2016, 2, 16076. Available online: https://pubmed.ncbi.nlm.nih.gov/27784885/ (accessed on 26 October 2021). [CrossRef] [PubMed]
- Yang, H.; Kruh-Garcia, N.A.; Dobos, K.M. Purified protein derivatives of tuberculin-past, present, and future. FEMS Immunol. Med. Microbiol. 2012, 66, 273–280. Available online: https://pubmed.ncbi.nlm.nih.gov/22762692/ (accessed on 26 October 2021). [CrossRef]
- Pai, M.; Denkinger, C.M.; Kik, S.V.; Rangaka, M.X.; Zwerling, A.; Oxlade, O.; Metcalfe, J.Z.; Cattamanchi, A.; Dowdy, D.W.; Dheda, K.; et al. Gamma Interferon Release Assays for Detection of Mycobacterium tuberculosis Infection. Clin. Microbiol. Rev. 2014, 27, 3–20. [Google Scholar] [CrossRef]
- Rustad, T.R.; Sherrid, A.M.; Minch, K.J.; Sherman, D.R. Hypoxia: A window into Mycobacterium tuberculosis latency. Cell. Microbiol. 2009, 11, 1151–1159. Available online: https://pubmed.ncbi.nlm.nih.gov/19388905/ (accessed on 26 October 2021). [CrossRef]
- Torres, M.; García-García, L.; Cruz-Hervert, P.; Guio, H.; Carranza, C.; Ferreyra-Reyes, L.; Canizales, S.; Molina, S.; Ferreira-Guerrero, E.; Téllez, N. Effect of isoniazid on antigen-specific interferon-γ secretion in latent tuberculosis. Eur. Respir. J. 2015, 45, 473–482. Available online: https://pubmed.ncbi.nlm.nih.gov/25359354/ (accessed on 26 October 2021). [CrossRef]
- Ji, D.X.; Yamashiro, L.H.; Chen, K.J.; Mukaida, N.; Kramnik, I.; Darwin, K.H.; Vance, R.E. Type I interferon-driven susceptibility to Mycobacterium tuberculosis is mediated by IL-1Ra. Nat. Microbiol. 2019, 4, 2128–2135. Available online: https://pubmed.ncbi.nlm.nih.gov/31611644/ (accessed on 26 October 2021). [CrossRef]
- Zhang, H.; Cao, X.; Xin, H.; Liu, J.; Pan, S.; Guan, L.; Shen, F.; Liu, Z.; Wang, D.; Guan, X. Serum level of IL-1ra was associated with the treatment of latent tuberculosis infection in a Chinese population. BMC Infect. Dis. 2020, 20, 330. Available online: https://pubmed.ncbi.nlm.nih.gov/32384874/ (accessed on 26 October 2021). [CrossRef] [PubMed]
- Juffermans, N.P.; Verbon, A.; van Deventer, S.J.H.; van Deutekom, H.; Speelman, P.; van der Poll, T. Tumor Necrosis Factor and Interleukin-1 Inhibitors as Markers of Disease Activity of Tuberculosis. Am. J. Respir. Crit. Care Med. 1998, 157, 1328–1331. [Google Scholar] [CrossRef] [PubMed]
- Juffermans, N.P.; Florquin, S.; Camoglio, L.; Verbon, A.; Kolk, A.H.; Speelman, P.; van Deventer, S.J.H.; van der Poll, T. Interleukin-1 Signaling Is Essential for Host Defense during Murine Pulmonary Tuberculosis. J. Infect. Dis. 2000, 182, 902–908. [Google Scholar] [CrossRef] [PubMed]
- Silvério, D.; Gonçalves, R.; Appelberg, R.; Saraiva, M. Advances on the Role and Applications of Interleukin-1 in Tuberculosis. mBio 2021, 12, e03134-21. [Google Scholar] [CrossRef] [PubMed]
- Akashi, S.; Suzukawa, M.; Takeda, K.; Asari, I.; Kawashima, M.; Ohshima, N.; Inoue, E.; Sato, R.; Shimada, M.; Suzuki, J. IL-1RA in the supernatant of QuantiFERON-TB Gold In-Tube and QuantiFERON-TB Gold Plus is useful for discriminating active tuberculosis from latent infection. J. Infect. Chemother. 2021, 27, 617–624. Available online: https://pubmed.ncbi.nlm.nih.gov/33317988/ (accessed on 26 October 2021). [CrossRef] [PubMed]
- Abdallah, A.M.; Verboom, T.; Weerdenburg, E.M.; Gey van Pittius, N.C.; Mahasha, P.W.; Jiménez, C.; Parra, M.; Cadieux, N.; Brennan, M.J. PPE and PE_PGRS proteins of Mycobacterium marinum are transported via the type VII secretion system ESX-5. Mol. Microbiol. 2009, 73, 329–340. [Google Scholar] [CrossRef] [PubMed]
- Sakthi, S.; Narayanan, S. The lpqS knockout mutant of Mycobacterium tuberculosis is attenuated in Macrophages. Microbiol. Res. 2013, 168, 407–414. [Google Scholar] [CrossRef] [PubMed]
- Gideon, H.P.; Wilkinson, K.A.; Rustad, T.R.; Oni, T.; Guio, H.; Sherman, D.R.; Vordermeier, H.M.; Robertson, B.D.; Young, D.B.; Wilkinson, R.J. Bioinformatic and Empirical Analysis of Novel Hypoxia-Inducible Targets of the Human Antituberculosis T Cell Response. J. Immunol. 2010, 185, 7247–7257. [Google Scholar] [CrossRef]
- Pethe, K.; Alonso, S.; Biet, F.; Delogu, G.; Brennan, M.J.; Locht, C.; Menozzi, F.D. The heparin-binding haemagglutinin of M. tuberculosis is required for extrapulmonary dissemination. Nature 2001, 412, 190–194. [Google Scholar] [CrossRef]
- Pajon, R.; Yero, D.; Lage, A.; Llanes, A.; Borroto, C.J. Computational identification of β-barrel outer-membrane proteins in Mycobacterium tuberculosis predicted proteomes as putative vaccine candidates. Tuberculosis 2006, 86, 290–302. [Google Scholar] [CrossRef]
- Wu, J.; Wang, W.; Zhang, H.; Zhou, M.; Gao, Y.; Huang, M. Mycobacterium tuberculosis Rv2693 modulates host macrophage defense by manipulating IL-10 and P38 MAPK signaling. Microbes Infect. 2016, 18, 14–22. [Google Scholar]
- Martins, C.D.P.; Carvalho, F.R.; Faustino, R.; Medeiros, T.; Rosário, N.F.D.; Schmidt, C.M.; Barbosa, A.P.; dos Santos, A.P.Q.; Costa, C.P.D.; dos Santos, H.H.K.; et al. Vascular endothelial growth factor (VEGF) and interleukin-1 receptor antagonist (IL-1Ra) as promising biomarkers for distinguishing active from latent tuberculosis in children and adolescents. Tuberculosis 2022, 134, 102205. [Google Scholar] [CrossRef] [PubMed]
- Djoba Siawaya, J.F.; Beyers, N.; van Helden, P.; Walzl, G. Differential cytokine secretion and early treatment response in patients with pulmonary tuberculosis. Clin. Exp. Immunol. 2008, 152, 277–284. [Google Scholar] [CrossRef]
- Gupta, R.K.; Turner, C.T.; Venturini, C.; Esmail, H.; Rangaka, M.X.; Copas, A.; Lipman, M.; Abubakar, I.; Noursadeghi, M. Concise whole blood transcriptional signatures for incipient tuberculosis: A systematic review and patient-level pooled meta-analysis. Lancet Respir. Med. 2020, 8, 395–406. [Google Scholar] [CrossRef] [PubMed]
- Walzl, G.; McNerney, R.; du Plessis, N.; Bates, M.; McHugh, T.D.; Chegou, N.N.; Zumla, A. Tuberculosis: Advances and challenges in development of new diagnostics and biomarkers. Lancet Infect. Dis. 2018, 18, e199–e210. [Google Scholar] [CrossRef] [PubMed]
- Wu, J.; Wang, S.; Lu, C.; Shao, L.; Gao, Y.; Zhou, Z.; Huang, H.; Zhang, Y.; Zhang, W. Multiple cytokine responses in discriminating between active tuberculosis and latent tuberculosis infection. Tuberculosis 2017, 102, 68–75. [Google Scholar] [CrossRef] [PubMed]
- Dorman, S.E.; Schumacher, S.G.; Alland, D.; Nabeta, P.; Armstrong, D.T.; King, B.; Hall, S.L.; Chakravorty, S.; Cirillo, D.M.; Tukvadze, N.; et al. Xpert MTB/RIF Ultra for detection of Mycobacterium tuberculosis and rifampicin resistance: A prospective multicentre diagnostic accuracy study. Lancet Infect. Dis. 2017, 18, 76–84. [Google Scholar] [CrossRef] [PubMed]
- Nicolaou, L.; Steinberg, A.; Carrillo-Larco, R.M.; Hartinger, S.; Lescano, A.G.; Checkley, W. Living at High Altitude and COVID-19 Mortality in Peru. High Alt. Med. Biol. 2022, 23, 146–158. [Google Scholar] [CrossRef]
- Adekambi, T.; Ibegbu, C.C.; Kalokhe, A.S.; Yu, T.; Ray, S.M.; Rengarajan, J. Distinct Effector Memory CD4+ T Cell Signatures in Latent Mycobacterium tuberculosis Infection, BCG Vaccination and Clinically Resolved Tuberculosis. PLoS ONE 2012, 7, e36046. [Google Scholar] [CrossRef] [PubMed]


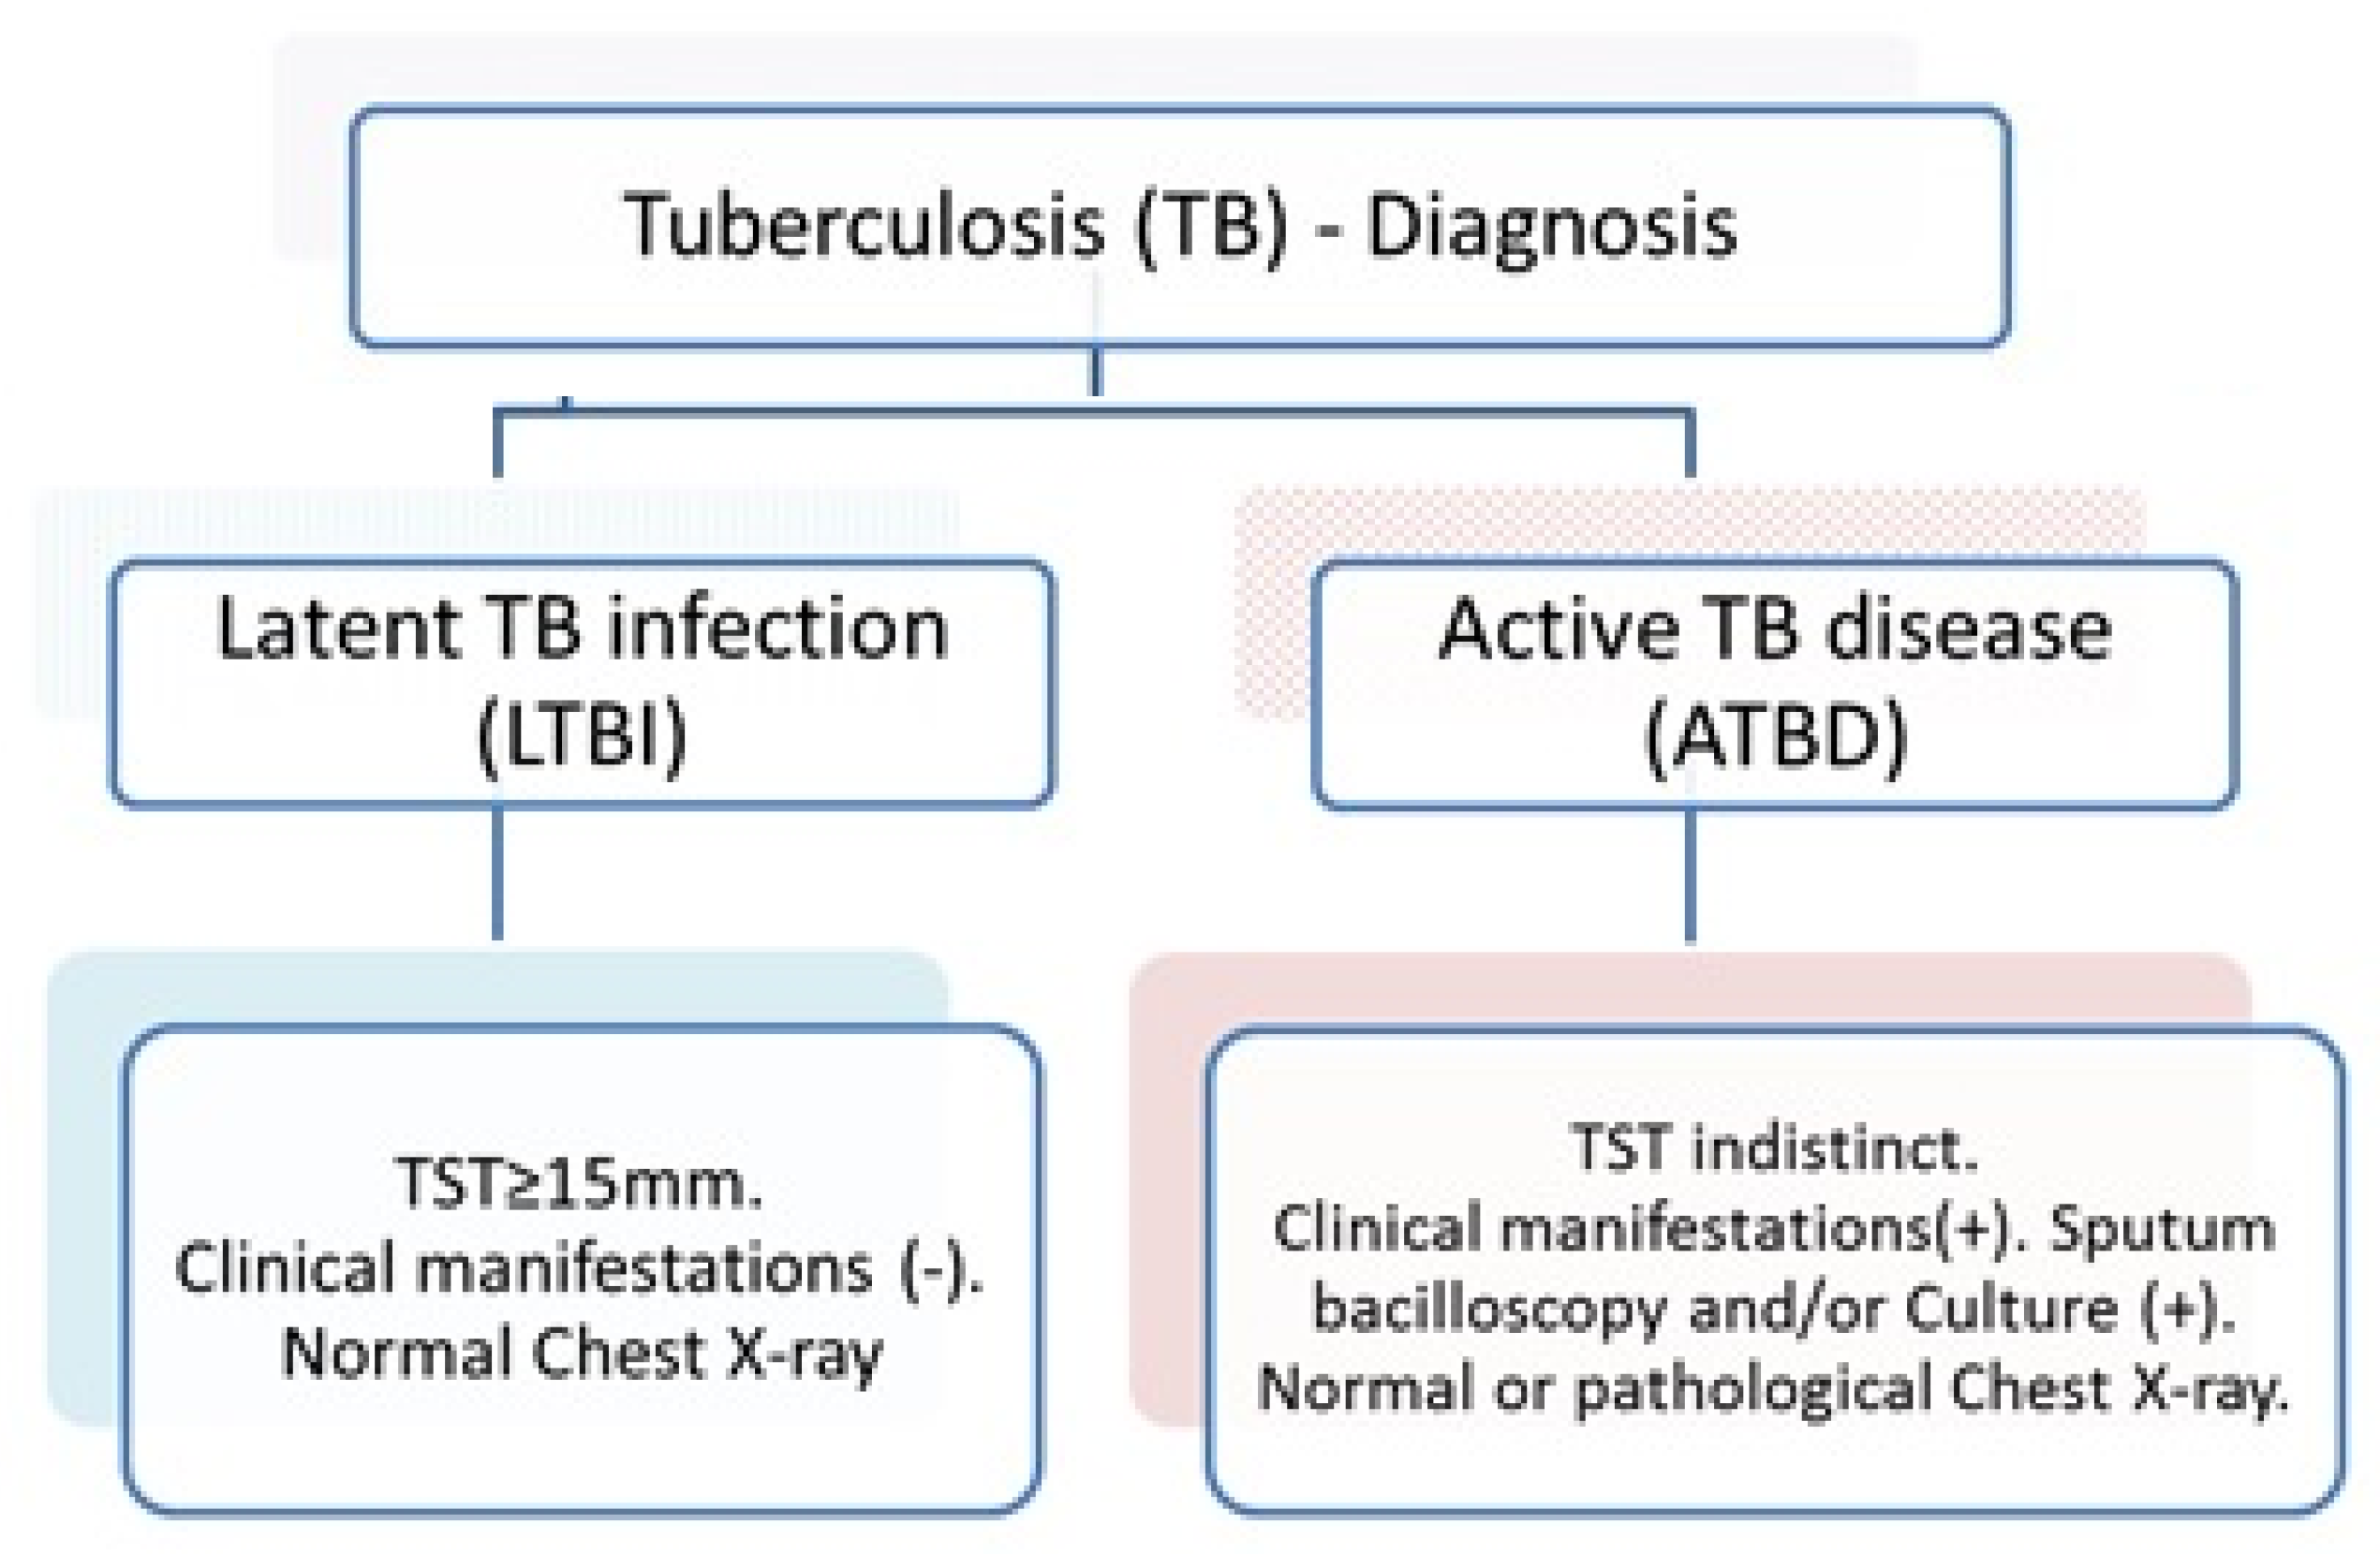
| Characteristics | ATBD (%) | LTBI (%) | Total n | p-Value |
|---|---|---|---|---|
| Gender | ||||
| Male | 73 (77.7) | 21 (22.3) | 94 | 0.051 † |
| Female | 46 (63.9) | 26 (36.1) | 72 | |
| Age | ||||
| 12–17 years | 1 (50) | 1 (50) | 2 | <0.001 ‡ |
| 18–29 years | 76 (87.4) | 11 (12.6) | 87 | |
| 30 or more years | 42 (54.5) | 35 (45.5) | 77 | |
| Ethnicity | ||||
| Caucasian | 6 (75.0) | 2 (25.0) | 8 | 1.000 ‡ |
| Mestizo | 113 (71.5) | 45 (28.5) | 158 | |
| Marital status | ||||
| Single | 63 (82.9) | 13 (17.1) | 76 | 0.008 ‡ |
| Married | 17 (54.8) | 14 (45.2) | 31 | |
| Cohabiting | 0 (0.0) | 1 (100) | 1 | |
| Separated | 2 (66.7) | 1 (33.3) | 3 | |
| Divorced | 37 (67.3) | 18 (32.7) | 55 | |
| Education | ||||
| None | 1 (100) | 0 (0.0) | 1 | <0.001 ‡ |
| Primary | 7 (70.0) | 3 (30.0) | 10 | |
| High school | 99 (83.9) | 19 (16.1) | 118 | |
| Technical | 9 (34.6) | 17 (65.4) | 26 | |
| University degree | 3 (27.3) | 8 (72.7) | 11 | |
| Work | ||||
| Unemployed | 2 (100) | 0 (0.0) | 2 | <0.001 ‡ |
| Student | 13 (72.2) | 5 (27.8) | 18 | |
| House worker | 29 (90.6) | 3 (9.4) | 32 | |
| Temporal worker | 7 (70.0) | 3 (30.0) | 10 | |
| Health care worker | 2 (11.1) | 16 (88.9) | 18 | |
| Public/private worker | 42 (80.8) | 10 (19.2) | 52 | |
| Independent worker | 24 (70.6) | 10 (29.4) | 34 | |
| Comorbidities | ||||
| None | 80 (71.4) | 32 (28.6) | 112 | 1.000 ‡ |
| Yes | 39 (72.2) | 15 (27.8) | 54 | |
| Total | 119 (71.7) | 47 (28.3) | 166 |
| Cytokines and Peptides Combined | LTBI | ATBD | p-Value * |
|---|---|---|---|
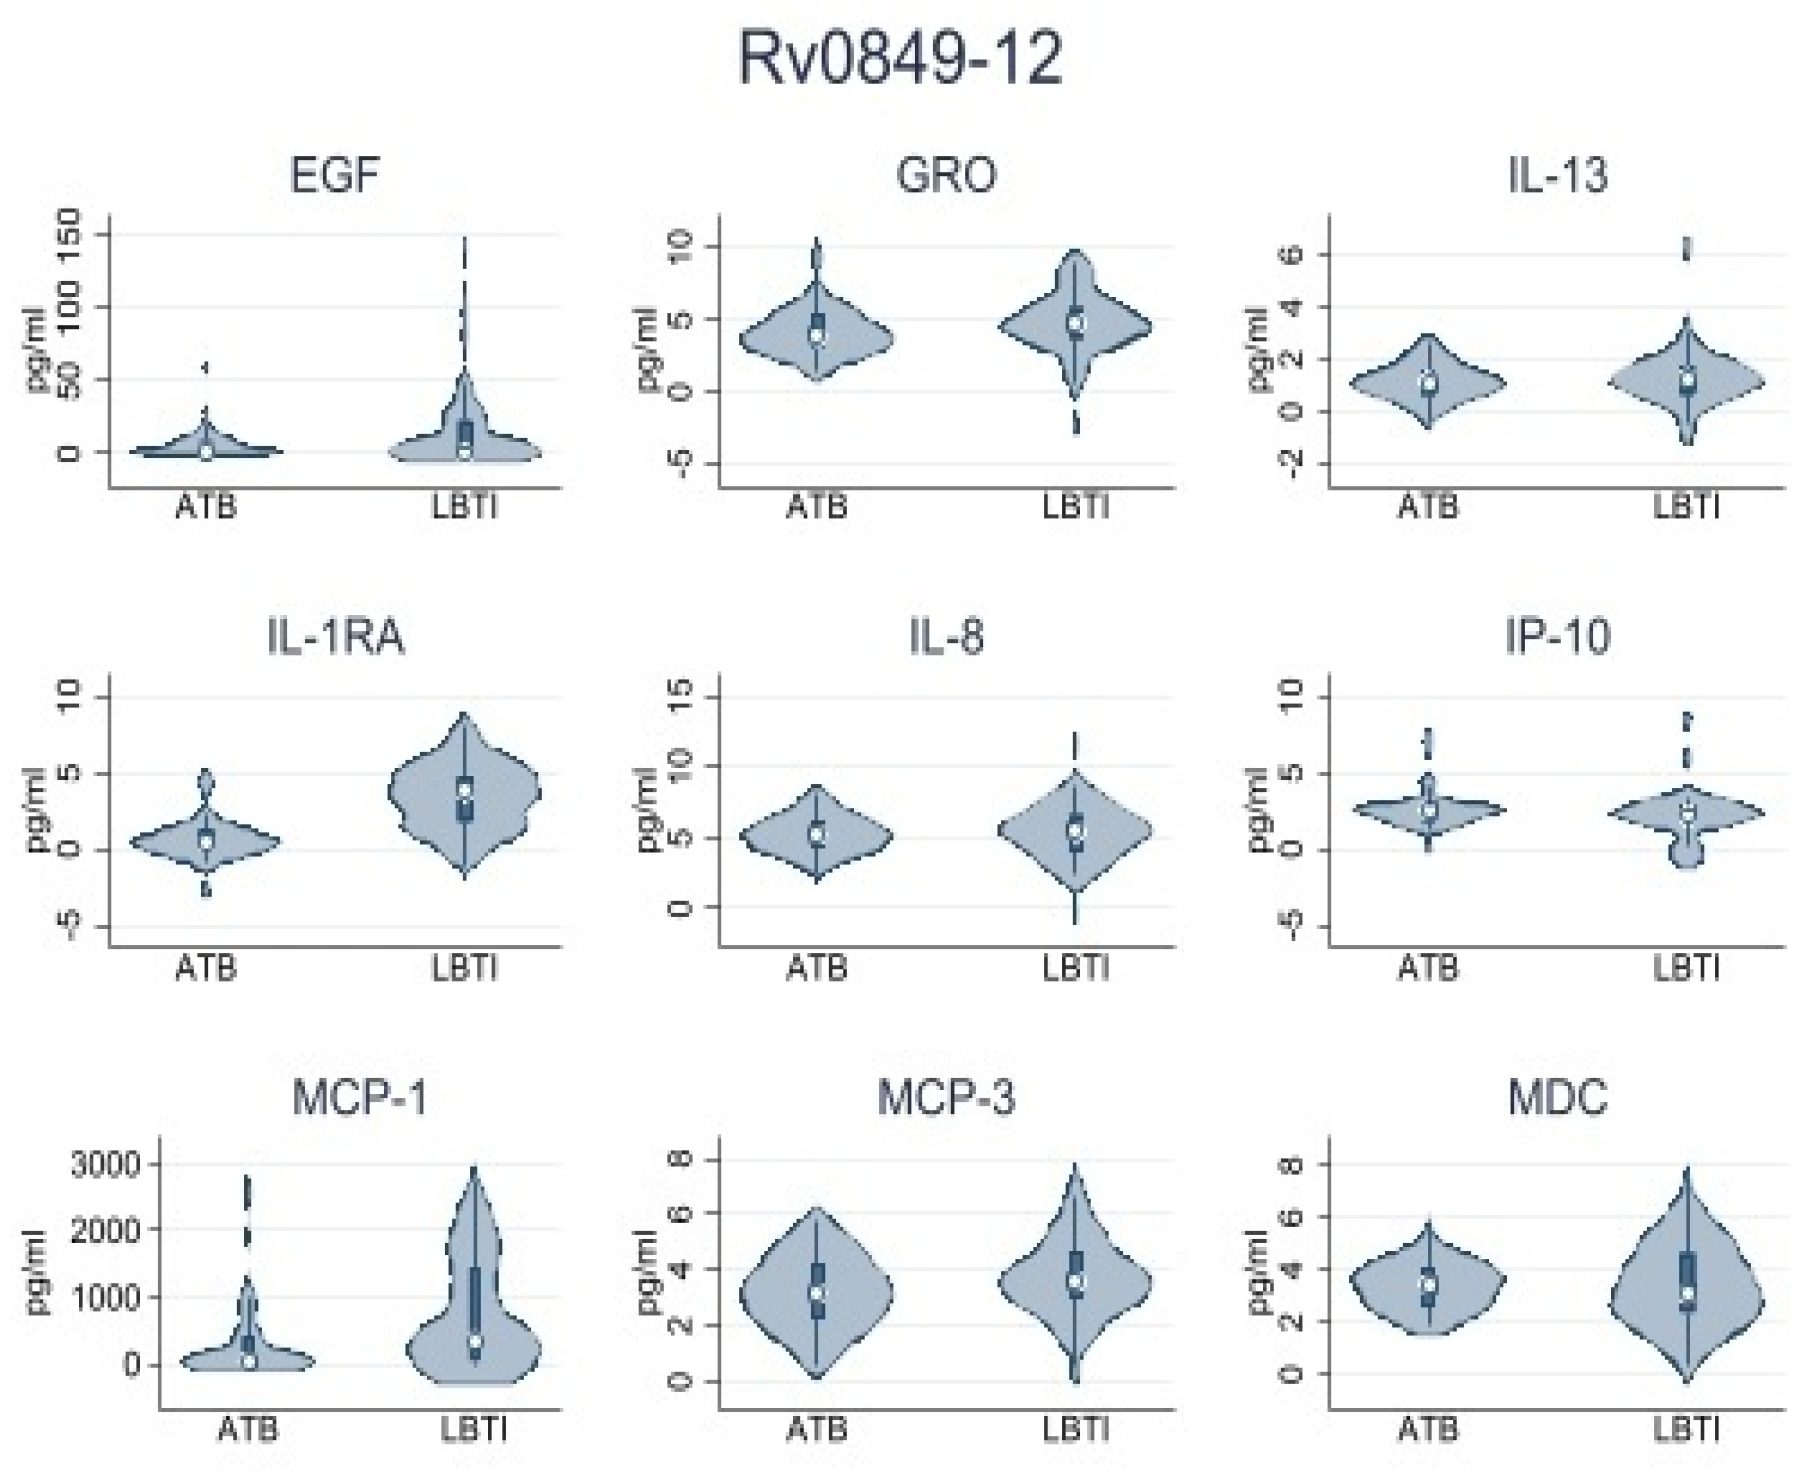
| Rv0849-12 | |||
| IL-1RA | 0.48 (0.0–1.87) | 5.57 (0.0–84.45) | 0.001 |
| IP-10 | 8.72 (0.0–15.01) | 1.09 (0.0–10.60) | 0.054 |
| MCP-1 | 46.87 (0.0–408.52) | 361.73 (48.60–1447.92) | 0.003 |
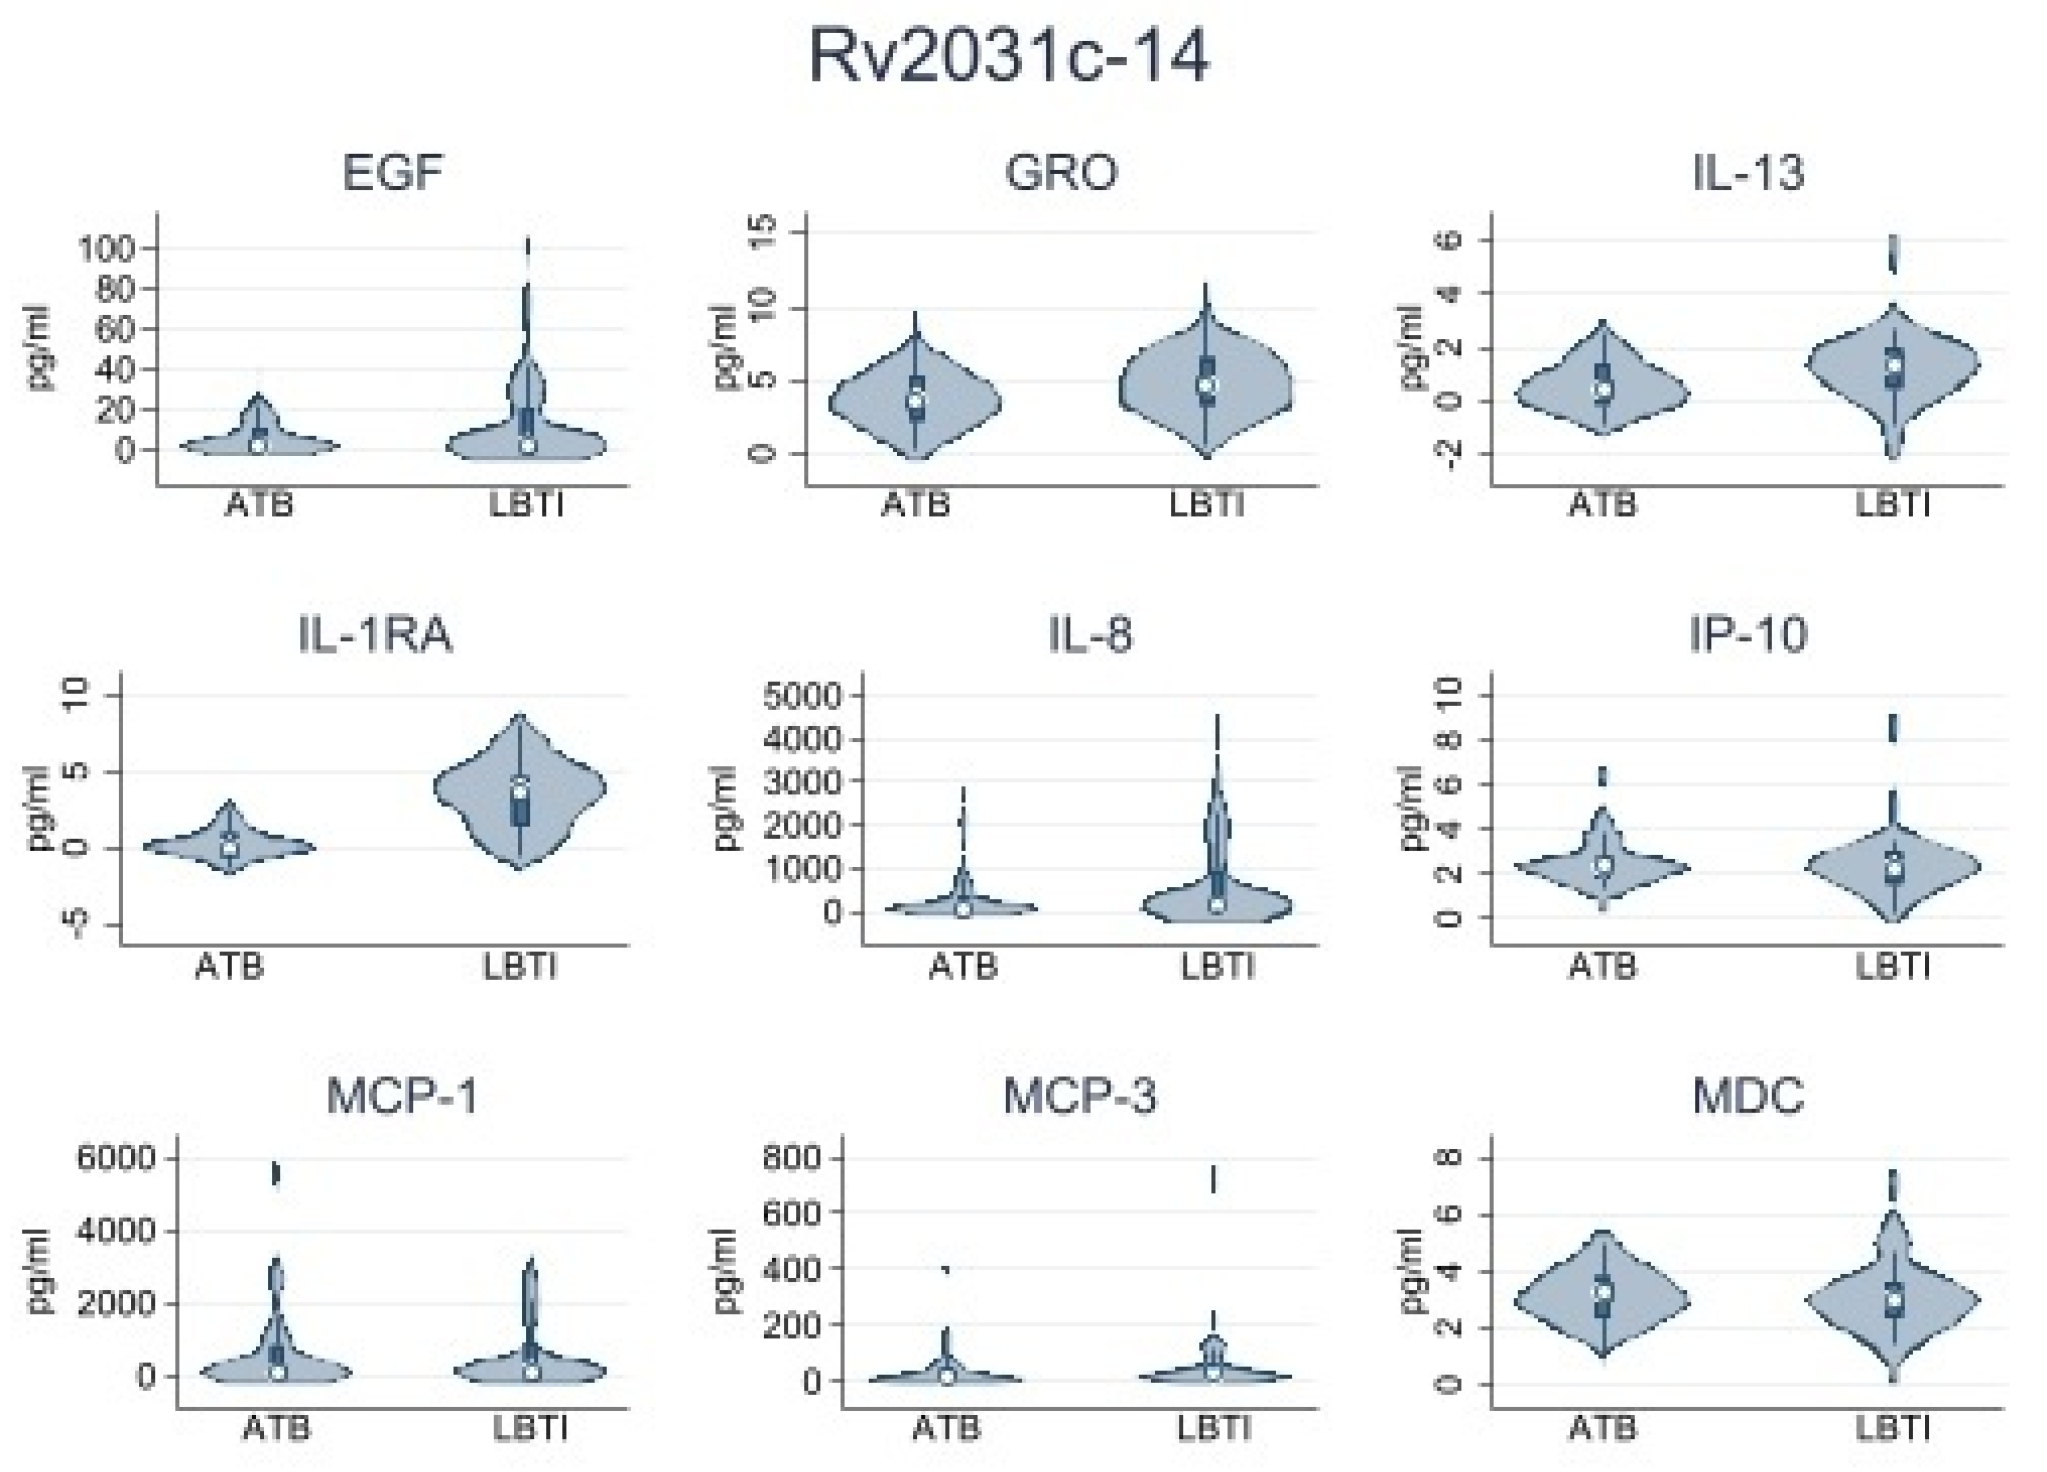
| Rv2031c-14 | |||
| IL-1RA | 0.51 (0.0–1.18) | 13.55 (0.26–73.2) | 0.001 |
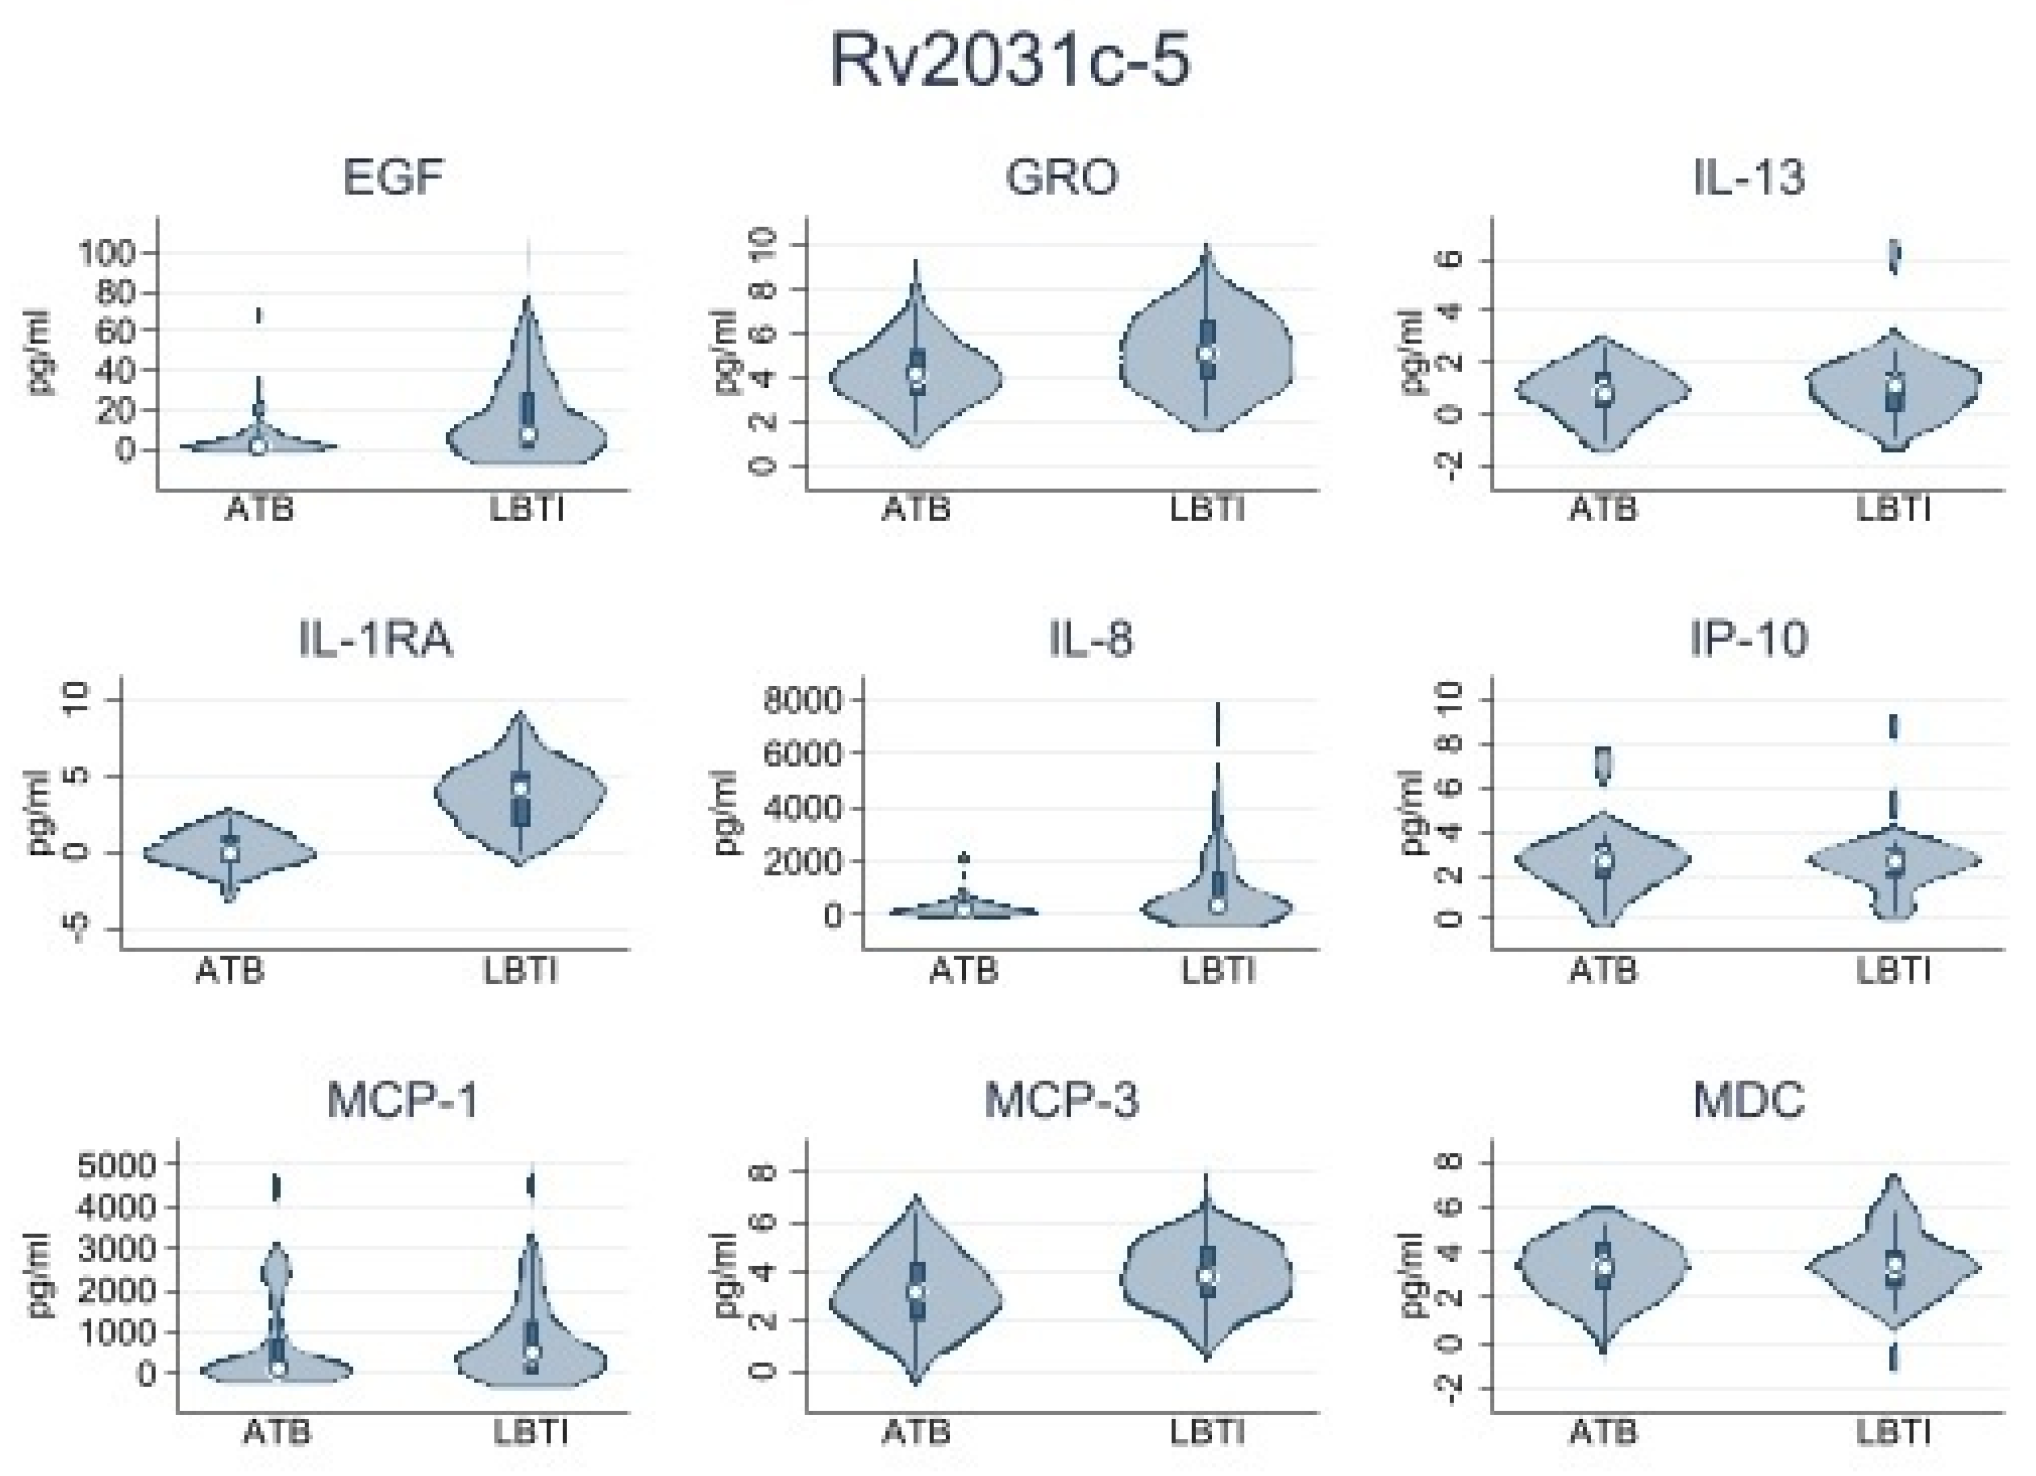
| Rv2031c-5 | |||
| IL-1RA | 0.47 (0.0–1.42) | 4.51 (0.0–84.50) | 0.006 |
| IL-8 | 189.6 (26.91–441.22) | 368.65 (92.22–1611.75) | 0.041 |
| MCP-3 | 14.13 (2.23–45.15) | 30.53 (9.46–132.49) | 0.033 |
| GRO | 45.57 (8.05–139.76) | 105.35 (21.05–579.55) | 0.017 |
| EGF | 1.57 (0.0–6.71) | 7.78 (0.0–28.99) | 0.030 |
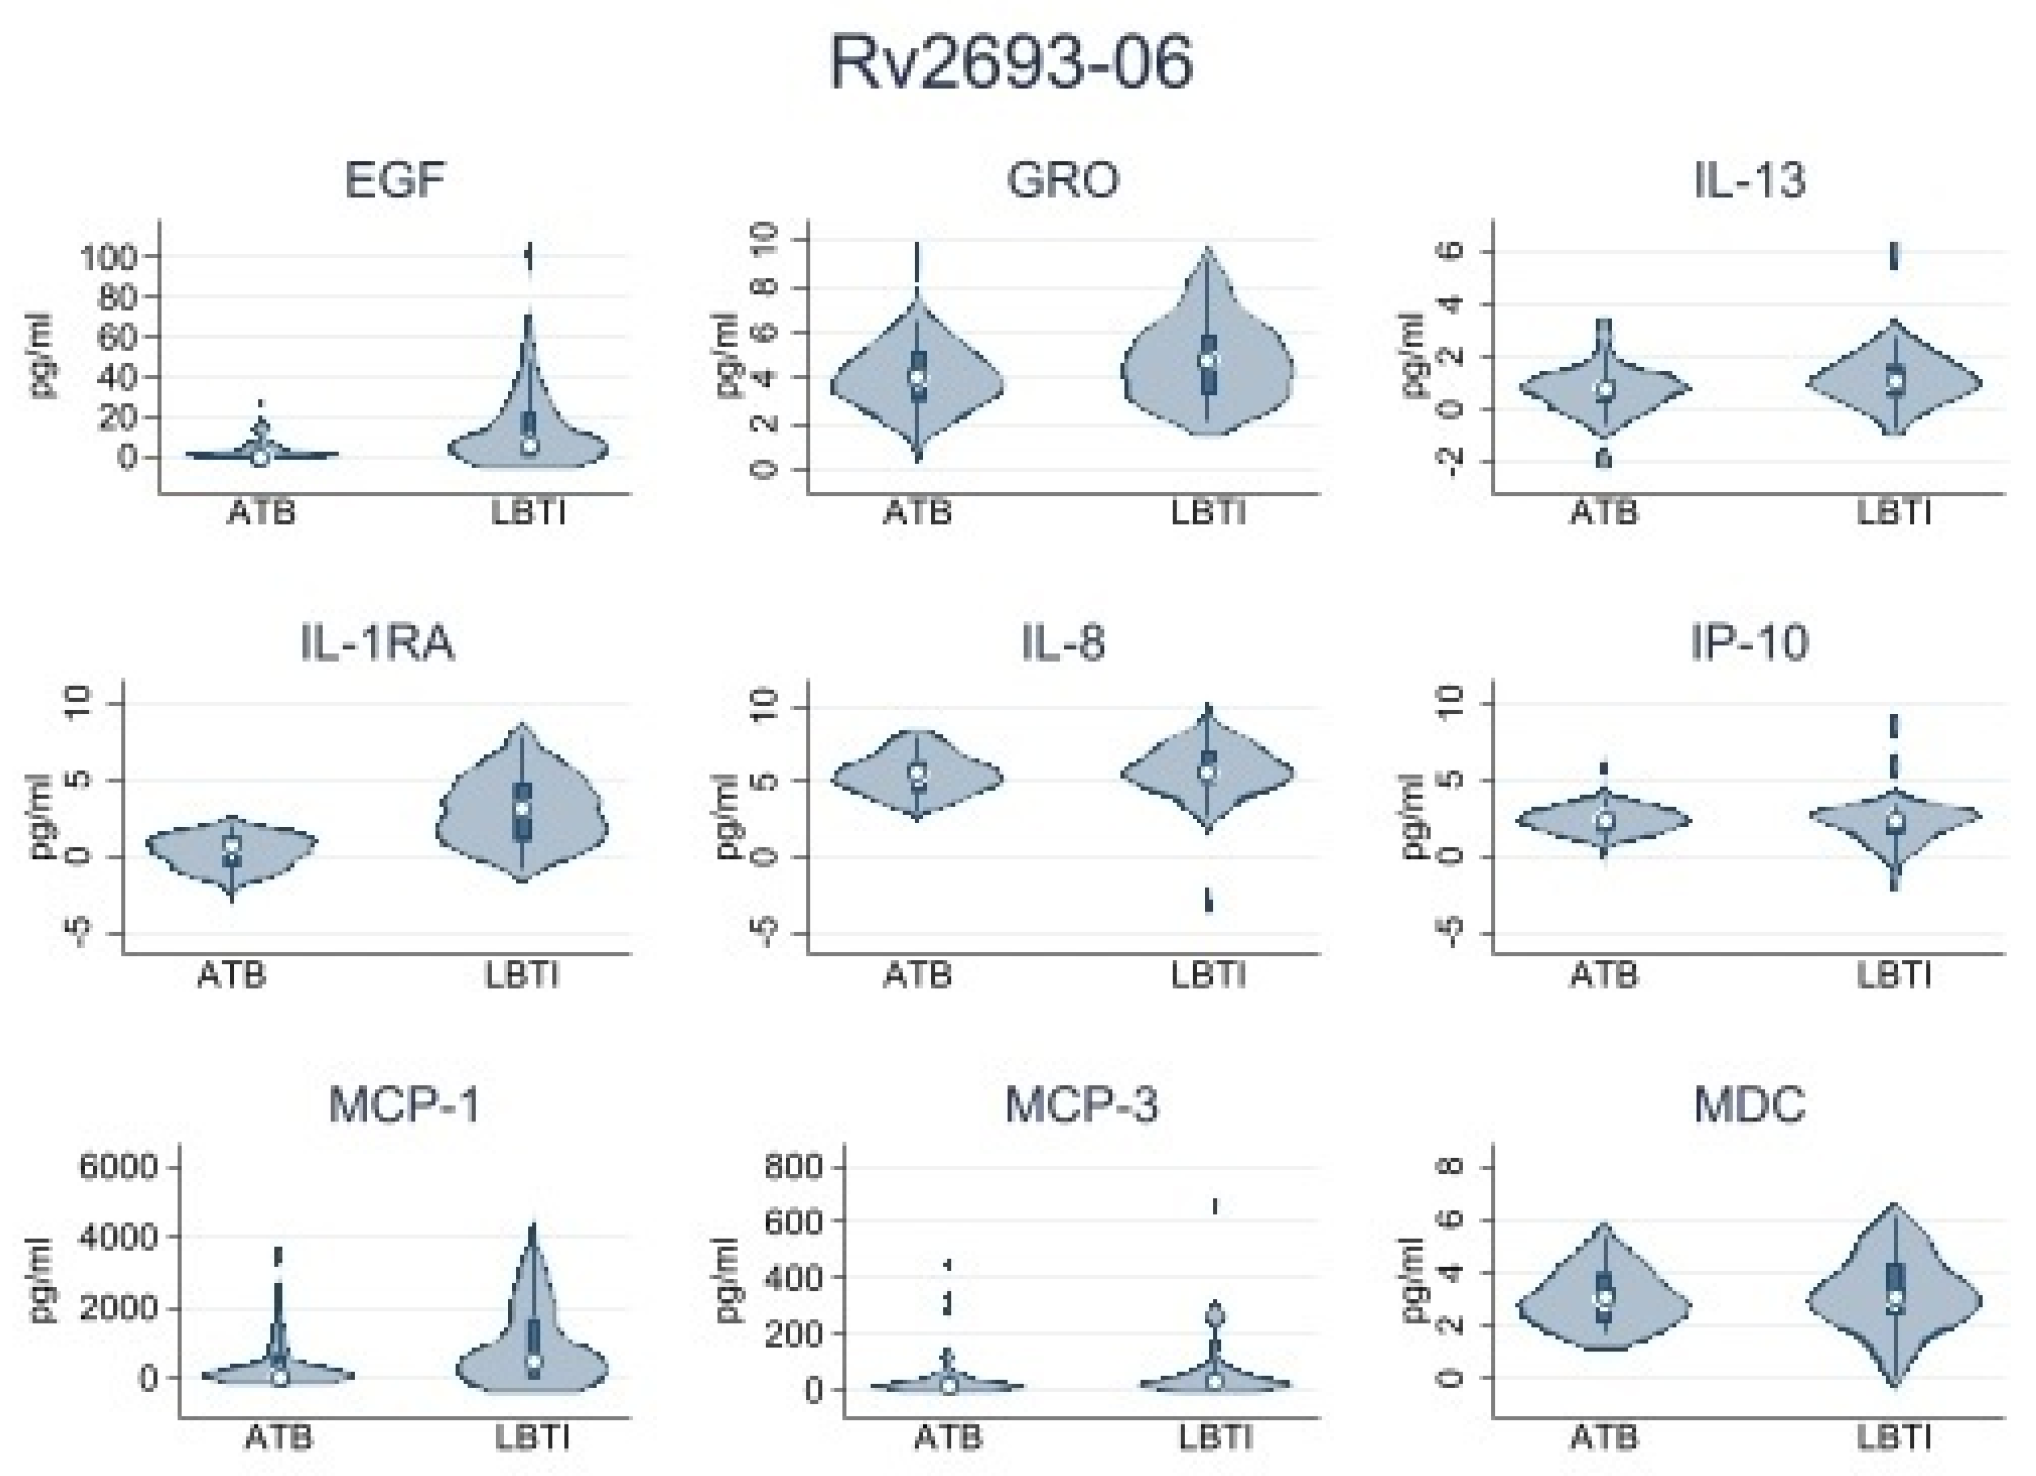
| Rv2693-06 | |||
| IL-1RA | 0.06 (0.0–1.87) | 4.78 (0.0–69.27) | 0.001 |
| IL-8 | 168.23 (43.61–368.22) | 266.01 (123.42–1031.04) | 0.038 |
| MCP-1 | 42.15 (0.0–656.25) | 468.47 (0.0–1689.57) | 0.029 |
| GRO | 33.11 (9.28–94.95) | 77.50 (21.21–259.76) | 0.036 |
| EGF | 0 (0.0–4.95) | 6.17 (0.0–22.15) | 0.001 |
| MDC | 0 (0.0–7.26) | 6.80 (0.0–27.95) | 0.002 |
| IL-13 | 0 (0.0–2.08) | 1.68 (0.0–3.94) | 0.022 |
| Rv0849-13 | Rv2031c-6 | Rv2031c-15 | Rv2693-07 | |||||||||
|---|---|---|---|---|---|---|---|---|---|---|---|---|
| LTBI | ATBD | p * | LTBI | ATBD | p * | LTBI | ATBD | p * | LTBI | ATBD | p * | |
| EGF | 1.65 (0.0–9.04) | 0 (0.0–22.73) | 0.504 | 1.57 (0.0–6.71) | 7.78 (0.0–28.99) | 0.030 | 1.76 (0.0–10.53) | 2.47 (0.0–20.19) | 0.554 | 0 (0.0–4.95) | 6.17 (0.0–22.15) | 0.001 |
| EOTAXIN | 0 (0.0–3.29) | 0 (0.0–2.53) | 0.513 | 0.49 (0.0–3.31) | 0 (0.0–3.29) | 0.362 | 0.74 (0.0–2.6) | 0 (0.0–3.41) | 0.630 | 0.49 (0.0–1.7) | 0 (0.0–3.29) | 0.821 |
| FGF-2 | 0.0 (0.0–0.0) | 0 (0.0–1.96) | 0.409 | 0.0 (0.0–0.0) | 0 (0.0–1.75) | 0.682 | 0 (0.0–1.16) | 0 (0.0–2.37) | 0.650 | 0.0 (0.0–0.0) | 0.0 (0.0–0.0) | 0.984 |
| Flt | 0 (0.0–1.21) | 0 (0.0–1.22) | 0.546 | 0 (0.0–0.72) | 0 (0.0–1.56) | 0.307 | 0 (0.0–1.21) | 0 (0.0–1.12) | 0.593 | 0 (0.0–1.02) | 0 (0.0–0.73) | 0.331 |
| Fractalkine | 11.77 (0.0–21.35) | 0 (0.0–13.07) | 0.113 | 10.96 (0.0–19.53) | 8.04 (0.0–18.30) | 0.549 | 10.39 (0.0–13.07) | 0 (0.0–13.07) | 0.248 | 11.77 (0.0–19.53) | 0 (0.0–14.27) | 0.081 |
| G-CSF | 0 (0.0–2.14) | 0.41 (0.0–0.86) | 0.117 | 0.41 (0.0–2.37) | 0 (0.0–2.14) | 0.170 | 0 (0.0–2.14) | 0 (0.0–1.88) | 0.673 | 0 (0.0–1.89) | 0.0 (0.0–0.0) | 0.072 |
| GM-CSF | 0.2 (0.0–0.92) | 0.12 (0.0–1.17) | 0.761 | 0.1 (0.0–1.22) | 0.34 (0.0–1.53) | 0.602 | 0.04 (0.0–0.89) | 0.19 (0.0–1.7) | 0.422 | 0.2 (0.0–1.33) | 0.37 (0.0–1.19) | 0.894 |
| GRO | 32.21 (9.47–153.24) | 60.57 (1.08–230.83) | 0.563 | 45.57 (8.05–139.76) | 105.35 (21.05–579.55) | 0.017 | 21.05 (1.52–78.48) | 37.51 (3.05–466.44) | 0.136 | 33.11 (9.28–94.95) | 77.50 (21.21–259.76) | 0.036 |
| IFNa2 | 0.54 (0.0–2.05) | 0 (0.0–2.11) | 0.716 | 0 (0.0–1.23) | 0.53 (0.0–2.27) | 0.307 | 0 (0.0–1.23) | 0.27 (0.0–1.94) | 0.599 | 0 (0.0–1.23) | 0 (0.0–1.20) | 0.707 |
| IFNg | 0.0 (0.0–0.0) | 0 (0.0–0.23) | 0.262 | 0.0 (0.0–0.0) | 0.0 (0.0–0.0) | 0.763 | 0.0 (0.0–0.0) | 0.0 (0.0–0.0) | 0.528 | 0 (0.0–0.37) | 0.0 (0.0–0.0) | 0.166 |
| IL-10 | 0 (0.0–12.43) | 2.55 (0.0–16.13) | 0.384 | 1.7 (0.0–17.37) | 2.84 (0.0–13.55) | 0.929 | 1.26 (0.0–13.42) | 0.31 (0.0–12.79) | 0.833 | 2.71 (0.0–18.44) | 2.78 (6.08–61.70) | 0.932 |
| IL-12p40 | 0 (0.0–0.84) | 0 (0.0–0.09) | 0.043 | 0 (0.0–1.47) | 0 (0.0–0.70) | 0.123 | 0 (0.0–0.76) | 0 (0.0–0.78) | 0.786 | 0 (0.0–0.63) | 0.0 (0.0–0.0) | 0.425 |
| IL-12p70 | 0 (0.0–0.37) | 0 (0.0–0.60) | 0.173 | 0 (0.0–0.48) | 0.21 (0.0–0.96) | 0.050 | 0 (0.0–0.49) | 0.53 (0.0–1.47) | 0.029 | 0 (0.0–0.33) | 0.27 (0.0–1.28) | 0.023 |
| IL-13 | 0.63 (0.0–3.11) | 1.42 (0.0–4.22) | 0.428 | 1.04 (0.0–3.14) | 0.39 (0.0–3.25) | 0.348 | 0 (0.0–1.33) | 0.60 (0.0–4.23) | 0.117 | 0 (0.0–2.08) | 1.68 (0.0–3.94) | 0.022 |
| IL-15 | 0.0 (0.0–0.0) | 0.0 (0.0–0.0) | 1.000 | 0.0 (0.0–0.0) | 0.0 (0.0–0.0) | 1.000 | 0.0 (0.0–0.0) | 0.0 (0.0–0.0) | 1.000 | 0.0 (0.0–0.0) | 0.0 (0.0–0.0) | 0.370 |
| IL-17 | 0.0 (0.0–0.0) | 0.0 (0.0–0.0) | 0.849 | 0.0 (0.0–0.0) | 0.0 (0.0–0.0) | 0.710 | 0.0 (0.0–0.0) | 0.0 (0.0–0.0) | 0.293 | 0.0 (0.0–0.0) | 0.0 (0.0–0.0) | 0.442 |
| IL-1a | 0.0 (0.0–0.0) | 0.0 (0.0–0.0) | 0.071 | 0.0 (0.0–0.0) | 0.0 (0.0–0.0) | 0.029 | 0.0 (0.0–0.0) | 0.0 (0.0–0.0) | 0.029 | 0.0 (0.0–0.0) | 0.0 (0.0–0.0) | 0.006 |
| IL-1B | 0.0 (0.0–0.0) | 0 (0.0–0.59) | 0.408 | 0.0 (0.0–0.0) | 0 (0.0–1.34) | 0.121 | 0.0 (0.0–0.0) | 0 (0.0–0.65) | 0.015 | 0.0 (0.0–0.0) | 0 (0.0–0.32) | 0.025 |
| IL-1RA | 0.48 (0.0–1.87) | 5.57 (0.0–84.45) | 0.001 | 0.47 (0.0–1.42) | 4.51 (0.0–84.50) | 0.006 | 0.51 (0.0–1.18) | 13.55 (0.26–73.2) | 0.001 | 0.06 (0.0–1.87) | 4.78 (0.0–69.27) | 0.001 |
| IL-2 | 0.0 (0.0–0.0) | 0.0 (0.0–0.0) | 0.426 | 0.0 (0.0–0.0) | 0.0 (0.0–0.0) | 0.649 | 0.0 (0.0–0.0) | 0.0 (0.0–0.0) | 0.373 | 0.0 (0.0–0.0) | 0.0 (0.0–0.0) | 0.937 |
| IL-22 | 0.0 (0.0–0.0) | 0.0 (0.0–0.0) | 1.000 | 0.0 (0.0–0.0) | 0.0 (0.0–0.0) | 1.000 | 0.0 (0.0–0.0) | 0.0 (0.0–0.0) | 1.000 | 0.0 (0.0–0.0) | 0.0 (0.0–0.0) | 1.000 |
| IL-3 | 0.0 (0.0–0.0) | 0.0 (0.0–0.0) | 0.265 | 0.0 (0.0–0.0) | 0.0 (0.0–0.0) | 1.000 | 0.0 (0.0–0.0) | 0.0 (0.0–0.0) | 1.000 | 0.0 (0.0–0.0) | 0.0 (0.0–0.0) | 1.000 |
| IL-4 | 0 (0.0–6.05) | 3.58 (0.0–8.24) | 0.349 | 0 (0.0–6.05) | 2.47 (0.0–13.55) | 0.129 | 0 (0.0–8.15) | 0.28 (0.0–8.73) | 0.469 | 0.28 (0.0–6.05) | 2.61 (0.0–8.45) | 0.392 |
| IL-5 | 0 (0.0–0.05) | 0 (0.0–0.10) | 0.479 | 0 (0.0–0.05) | 0 (0.0–0.08) | 0.435 | 0 (0.0–0.05) | 0 (0.0–0.05) | 0.194 | 0 (0.0–0.05) | 0 (0.0–0.05) | 0.621 |
| IL-6 | 0 (0.0–1.1) | 0 (0.0–0.72) | 0.917 | 0 (0.0–3.46) | 0.14 (0.0–4.77) | 0.540 | 0 (0.0–0.57) | 0 (0.0–4.06) | 0.127 | 0 (0.0–1.11) | 0 (0.0–2.02) | 0.950 |
| IL-7 | 1.52 (0.0–3.39) | 0.72 (0.0–3.85) | 0.369 | 1.66 (0.0–2.89) | 1.46 (0.0–4.32) | 0.952 | 1 (0.0–2.55) | 0.95 (0.0–3.23) | 0.838 | 1.03 (0.0–1.96) | 1.52 (0.0–3.16) | 0.930 |
| IL-8 | 114.04 (30.14–404.76) | 182.12 (16.62–600.10) | 0.396 | 189.6 (26.91–441.22) | 368.65 (92.22–1611.75) | 0.041 | 66.98 (0.0–371.87) | 141.5 (30.32–954.13) | 0.059 | 168.23 (43.61–368.22) | 266.01 (123.42–1031.04) | 0.038 |
| IL-9 | 0 (0.0–1.32) | 0.92 (0.0–2.41) | 0.158 | 0.1 (0.0–1.15) | 0.63 (0.0–2.51) | 0.269 | 0 (0.0–1.02) | 0.26 (0.0–1.75) | 0.267 | 0.59 (0.0–1.93) | 0.23 (0.0–2.14) | 0.691 |
| IP-10 | 8.72 (0.0–15.01) | 1.09 (0.0–10.60) | 0.054 | 7.65 (1.15–20.67) | 6.39 (0.0–17.13) | 0.193 | 7.97 (0.0–12.31) | 3.44 (0.0–10.50) | 0.114 | 5.8 (0.0–16.68) | 3.58 (0.0–13.96) | 0.300 |
| MCP-1 | 46.87 (0.0–408.52) | 361.73 (48.60–1447.92) | 0.003 | 77.6 (0.0–815.13) | 465.28 (11.51–1267.78) | 0.105 | 82.22 (0.0–819.08) | 120.37 (0.0–882.54) | 0.989 | 42.15 (0.0–656.25) | 468.47 (0.0–1689.57) | 0.029 |
| MCP-2 | 0.64 (0.0–2.31) | 1.23 (0.0–3.02) | 0.517 | 0.94 (0.0–3.23) | 1.22 (0.0–4.38) | 0.961 | 0.64 (0.0–1.64) | 1.08 (0.0–3.72) | 0.540 | 0.53 (0.0–1.91) | 0.38 (0.0–1.79) | 0.683 |
| MCP-3 | 14.93 (3.59–48) | 27.65 (6.29–79.52) | 0.268 | 14.13 (2.23–45.15) | 30.53 (9.46–132.49) | 0.033 | 10.89 (0.0–43.31) | 26.33 (8.84–52.16) | 0.078 | 12.92 (0.0–40.57) | 28.2 (6.08–61.70) | 0.079 |
| MDC | 9.66 (0.0–38.23) | 9.35 (0.0–54.15) | 0.474 | 5.48 (0.0–36.56) | 20.46 (2.31–48.27) | 0.091 | 2.68 (0.0–25.66) | 7.05 (0.0–25.16) | 0.512 | 0 (0.0–7.26) | 6.80 (0.0–27.95) | 0.002 |
| MIP-1a | 0.91 (0.0–11.17) | 1 (0.0–12.01) | 0.843 | 4.56 (0.0–12.92) | 11.42 (0.0–27.52) | 0.663 | 0 (0.0–3.85) | 1.03 (0.0–11.36) | 0.105 | 0 (0.0–3.09) | 0 (0.0–6.49) | 0.302 |
| MIP-1B | 0.71 (0.0–8.36) | | | 0.965 | 7.09 (0.0–13.81) | 8.99 (0.0–18.61) | 0.547 | 0 (0.0–4.74) | 0 (0.0–7.98) | 0.502 | 0 (0.0–3.64) | 0 (0.0–7.52) | 0.621 |
| sCD40L | 3.305 (0.0–6.54) | 3.71 (0.0–13.14) | 0.386 | 2.48 (0.0–4.19) | 2.94 (0.0–13.81) | 0.242 | 1.45 (0.0–4.63) | 2.52 (0.0–9.94) | 0.355 | 0.78 (0.0–3.49) | 2.88 (0.0–10.37) | 0.141 |
| TGF a | 0.0 (0.0–0.0) | 0.0 (0.0–0.0) | 0.113 | 0.0 (0.0–0.0) | 0.0 (0.0–0.0) | 0.113 | 0.0 (0.0–0.0) | 0.0 (0.0–0.0) | 0.113 | 0.0 (0.0–0.0) | 0.0 (0.0–0.0) | 0.113 |
| TNF B | 0.06 (0.0–0.12) | 0.06 (0.0–0.12) | 0.696 | 0 (0.0–0.06) | 0.06 (0.0–0.13) | 0.064 | 0 (0.0–0.06) | 0.06 (0.0–0.13) | 0.029 | 0 (0.0–0.06) | 0 (0.0–0.12) | 0.361 |
| TNFa | 0.6 (0.0–4.28) | 0.33 (0.0–4.01) | 0.986 | 1 (0.0–3.61) | 1.04 (0.0–3.50) | 0.681 | 0 (0.0–1.65) | 0.06 (0.0–1.87) | 0.453 | 0.84 (0.0–4.42) | 0.04 (0.0–2.23) | 0.290 |
| VEGF | 1.48 (0.0–4.26) | 0.33 (0.0–6.45) | 0.795 | 0 (0.0–4.78) | 0.88 (0.0–7.52) | 0.345 | 1.14 (0.0–4.86) | 0 (0.0–5.75) | 0.764 | 1.33 (0.0–4.49) | 1.02 (0.0–6.07) | 0.857 |
Disclaimer/Publisher’s Note: The statements, opinions and data contained in all publications are solely those of the individual author(s) and contributor(s) and not of MDPI and/or the editor(s). MDPI and/or the editor(s) disclaim responsibility for any injury to people or property resulting from any ideas, methods, instructions or products referred to in the content. |
© 2023 by the authors. Licensee MDPI, Basel, Switzerland. This article is an open access article distributed under the terms and conditions of the Creative Commons Attribution (CC BY) license (https://creativecommons.org/licenses/by/4.0/).
Share and Cite
Sanchez, C.; Jaramillo-Valverde, L.; Capristano, S.; Solis, G.; Soto, A.; Valdivia-Silva, J.; Poterico, J.A.; Guio, H. Antigen-Induced IL-1RA Production Discriminates Active and Latent Tuberculosis Infection. Microorganisms 2023, 11, 1385. https://doi.org/10.3390/microorganisms11061385
Sanchez C, Jaramillo-Valverde L, Capristano S, Solis G, Soto A, Valdivia-Silva J, Poterico JA, Guio H. Antigen-Induced IL-1RA Production Discriminates Active and Latent Tuberculosis Infection. Microorganisms. 2023; 11(6):1385. https://doi.org/10.3390/microorganisms11061385
Chicago/Turabian StyleSanchez, Cesar, Luis Jaramillo-Valverde, Silvia Capristano, Gilmer Solis, Alonso Soto, Julio Valdivia-Silva, Julio A. Poterico, and Heinner Guio. 2023. "Antigen-Induced IL-1RA Production Discriminates Active and Latent Tuberculosis Infection" Microorganisms 11, no. 6: 1385. https://doi.org/10.3390/microorganisms11061385