
Mechanisms Underlying the Virulence Regulation of Vibrio alginolyticus ND-01 pstS and pstB with a Transcriptomic Analysis
 , , , , ,
Abstract
:1. Introduction
2. Materials and Methods
2.1. Bacterial Strains and Culture Conditions
2.2. Stable Gene Silencing
2.3. DNA Isolation
2.4. RNA Isolation
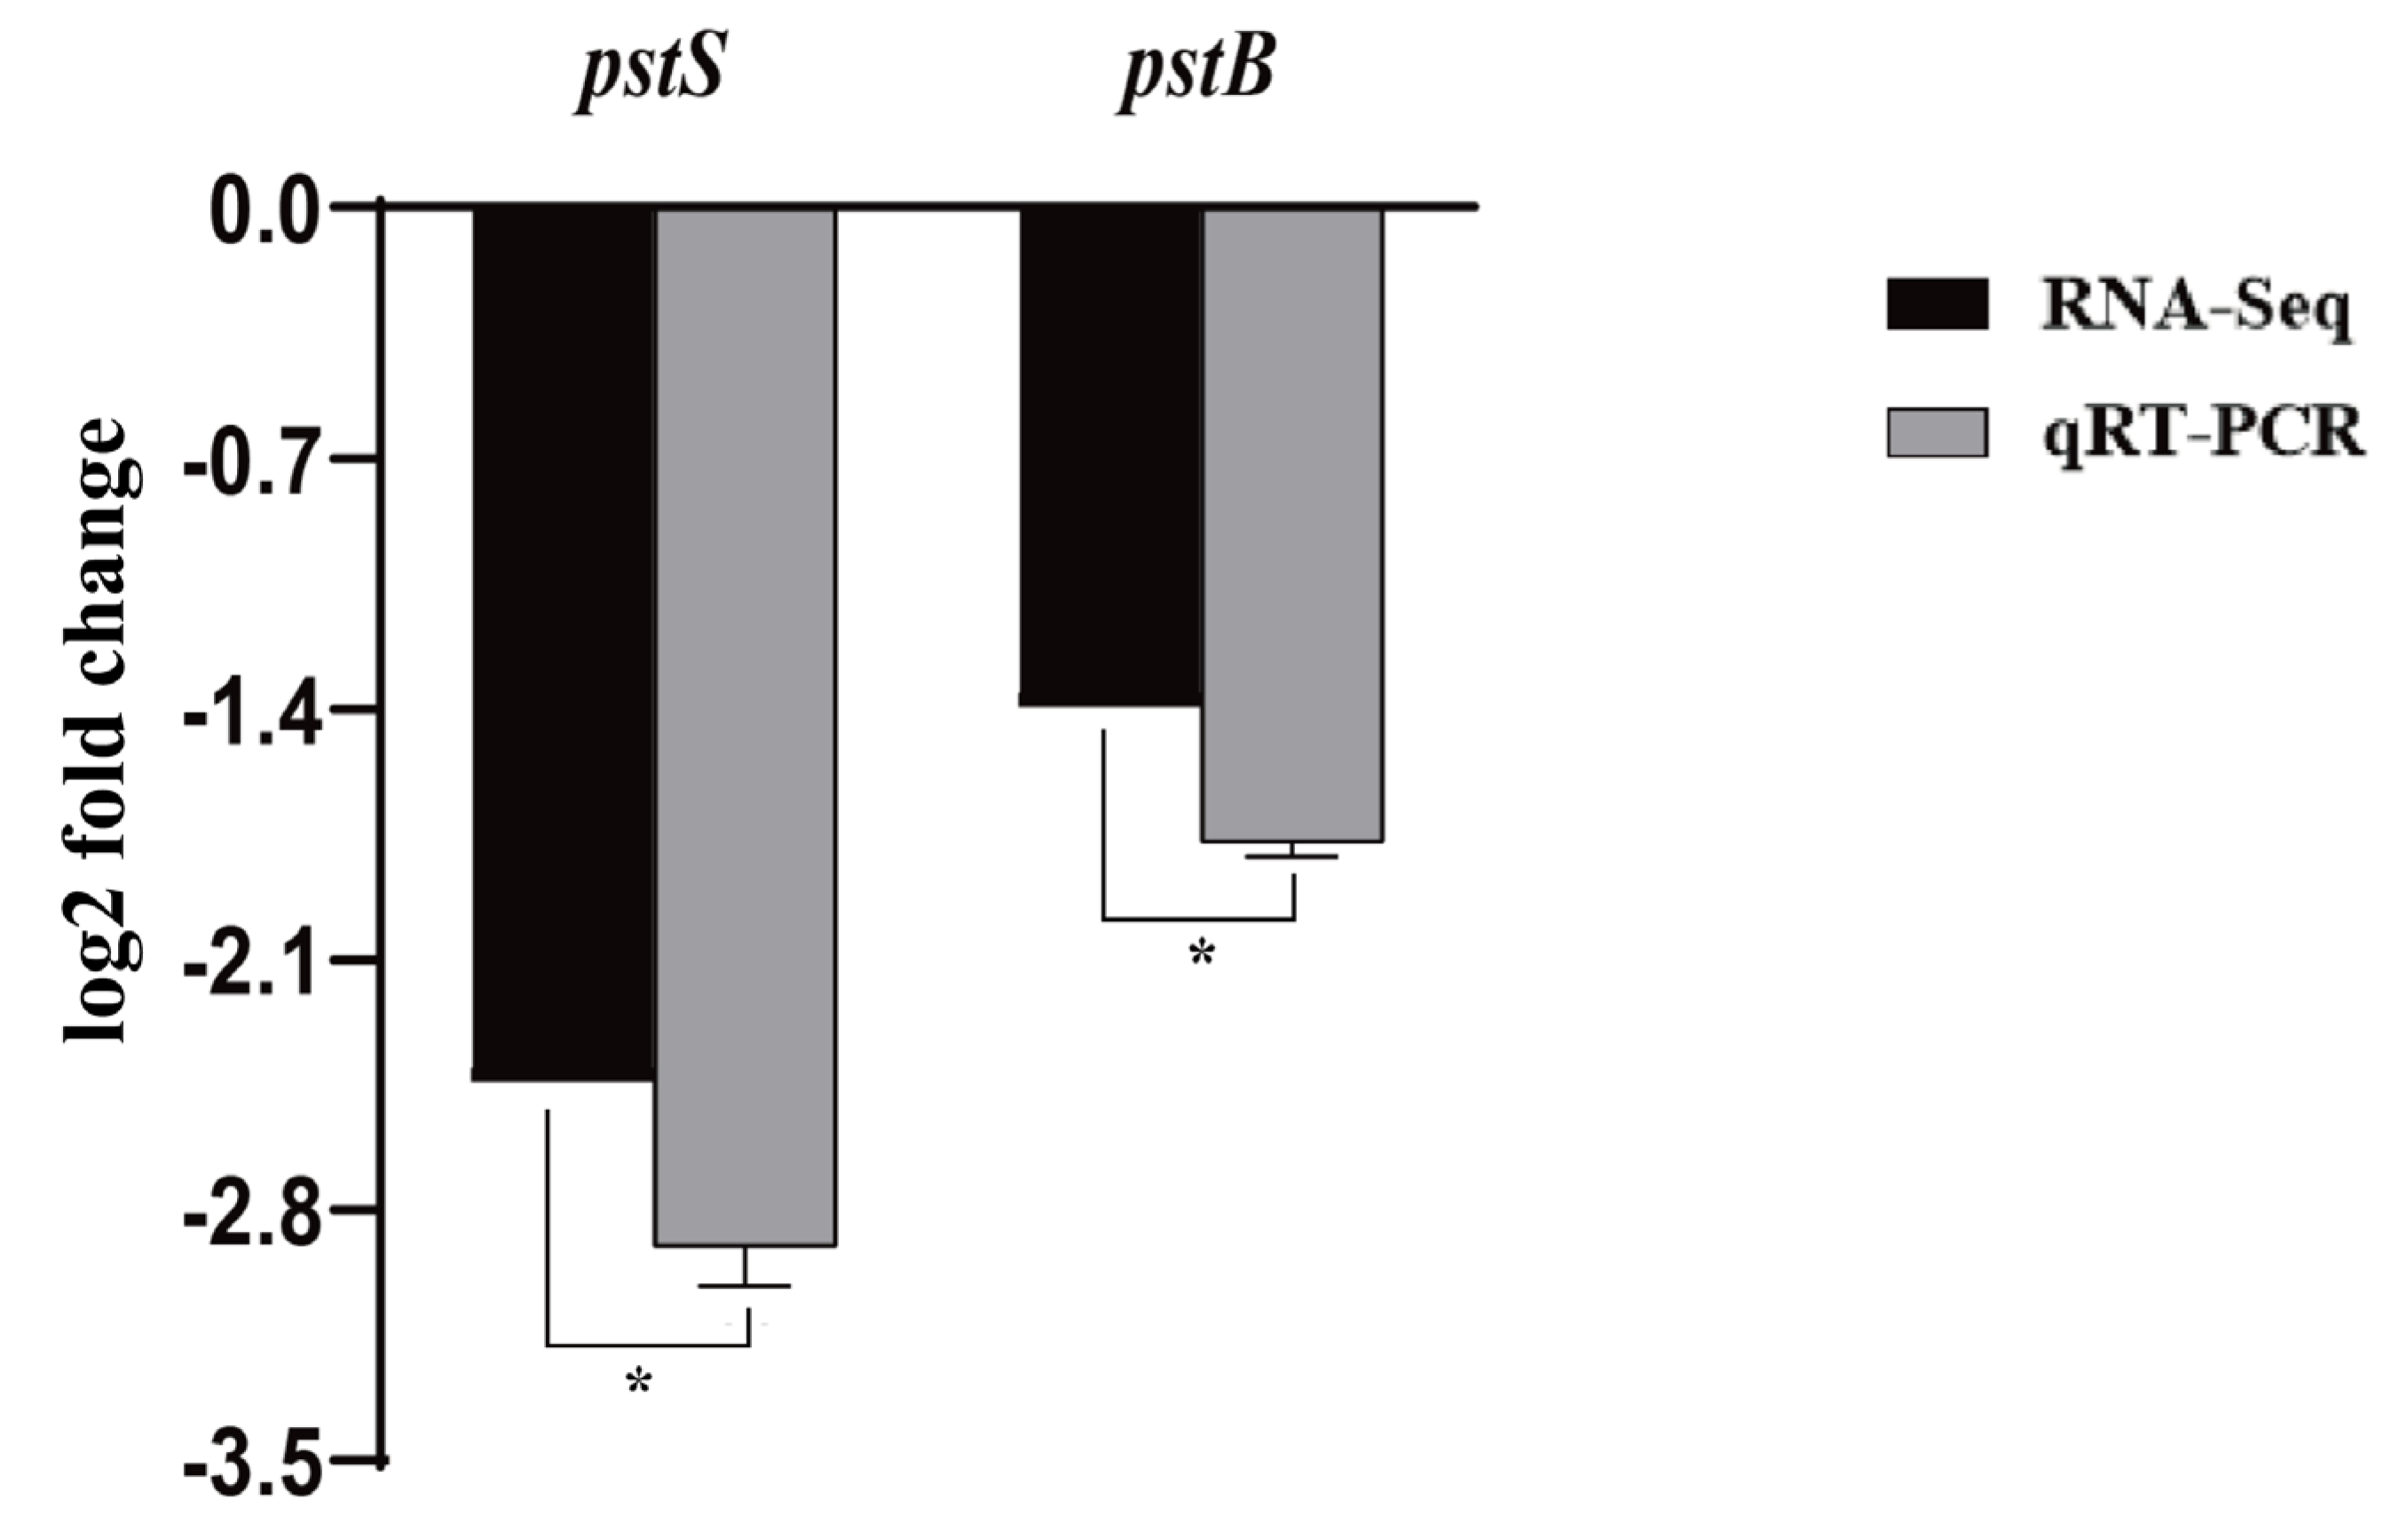
2.5. qRT-PCR
2.6. Growth Curve
2.7. Soft Agar Plate Motility Assay
2.8. In Vitro Adhesion Assay
2.9. Biofilm Formation Assay
2.10. Capillary Assay
2.11. Sequence Alignment and Homology Analysis
2.12. Prediction of Protein Secondary Structure Models
2.13. Statistical Analysis
2.14. Data Access
3. Results
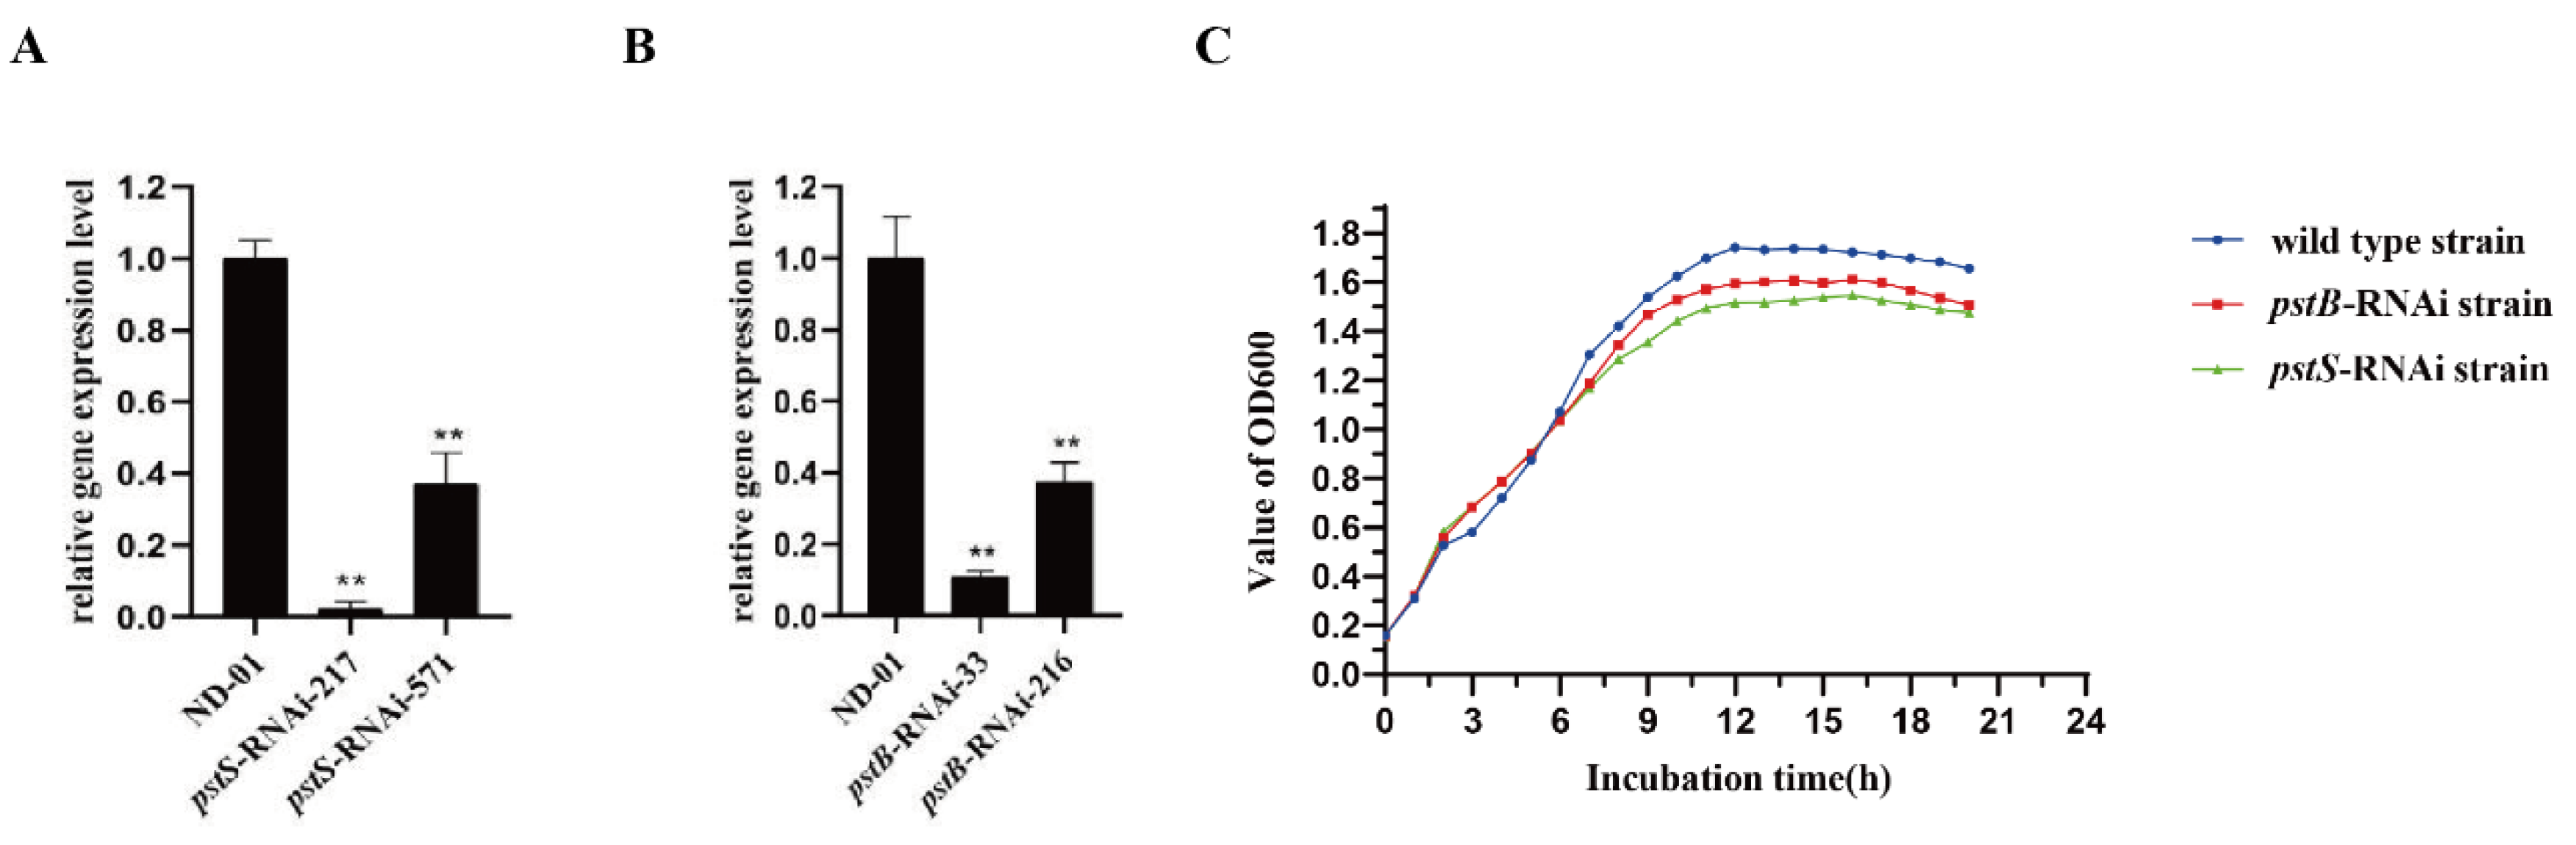
3.1. Isolation and Identification of Mutants
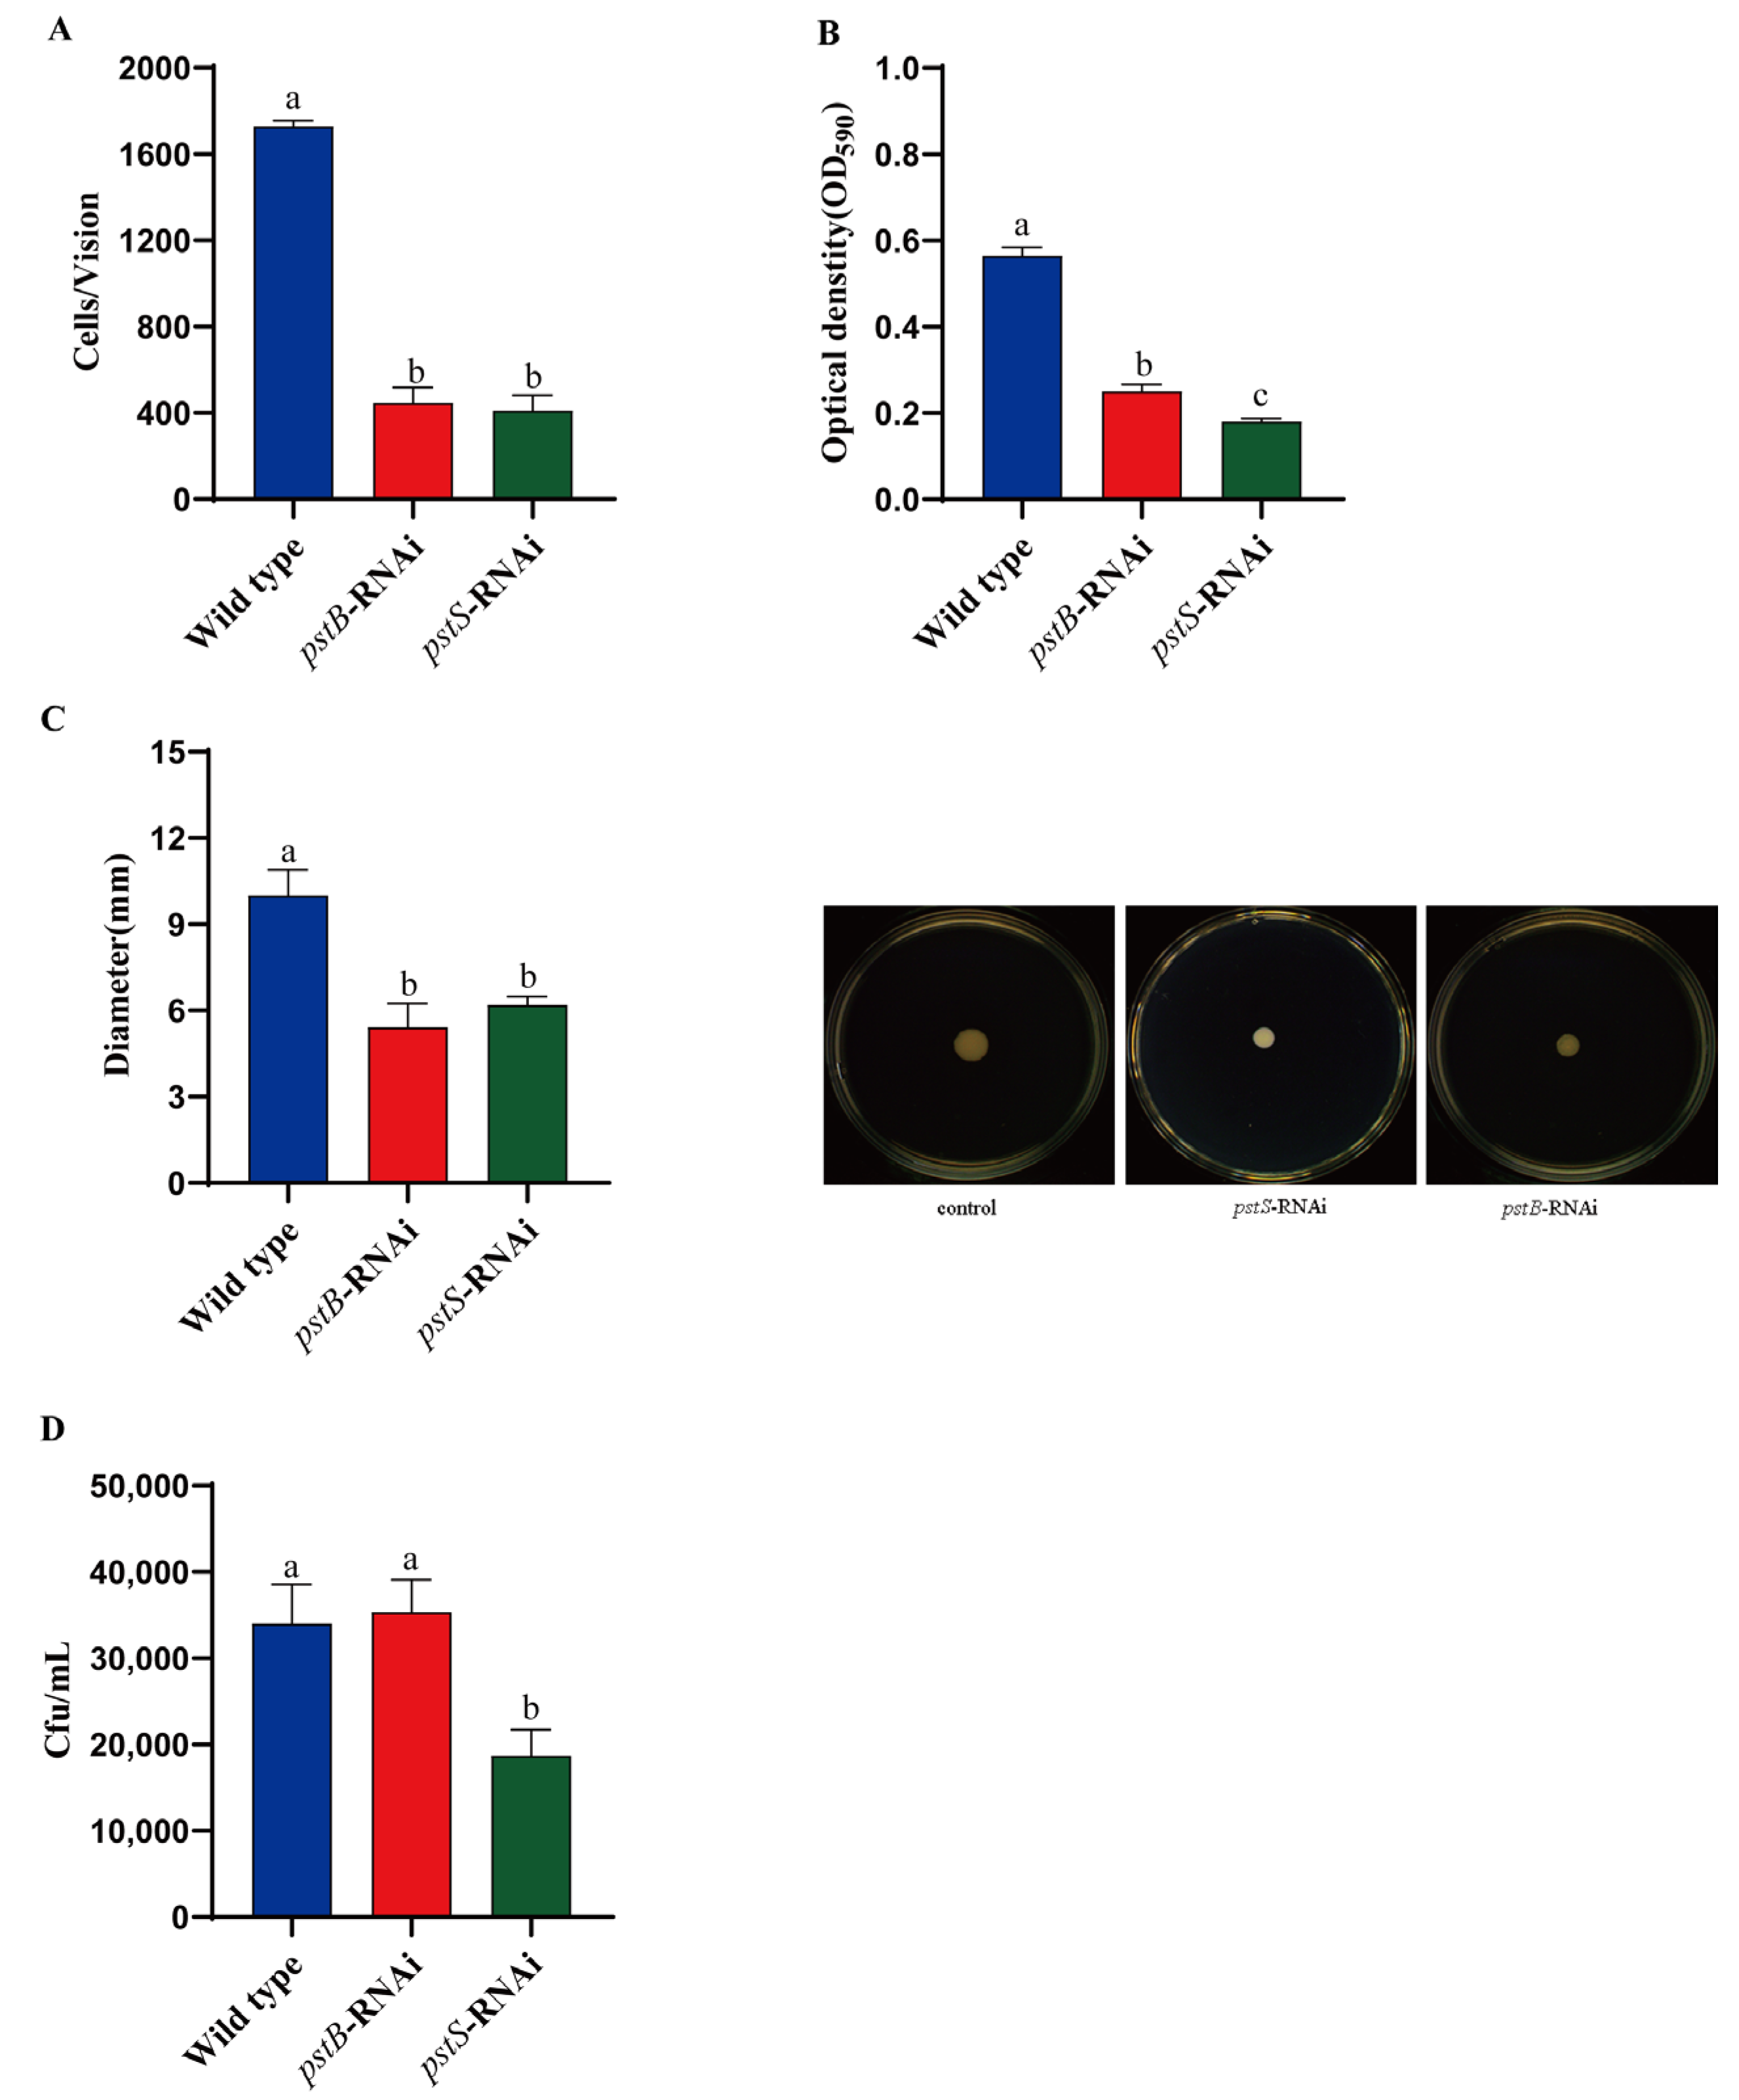
3.2. Biological Characteristics of pstS-RNAi and pstB-RNAi Strains
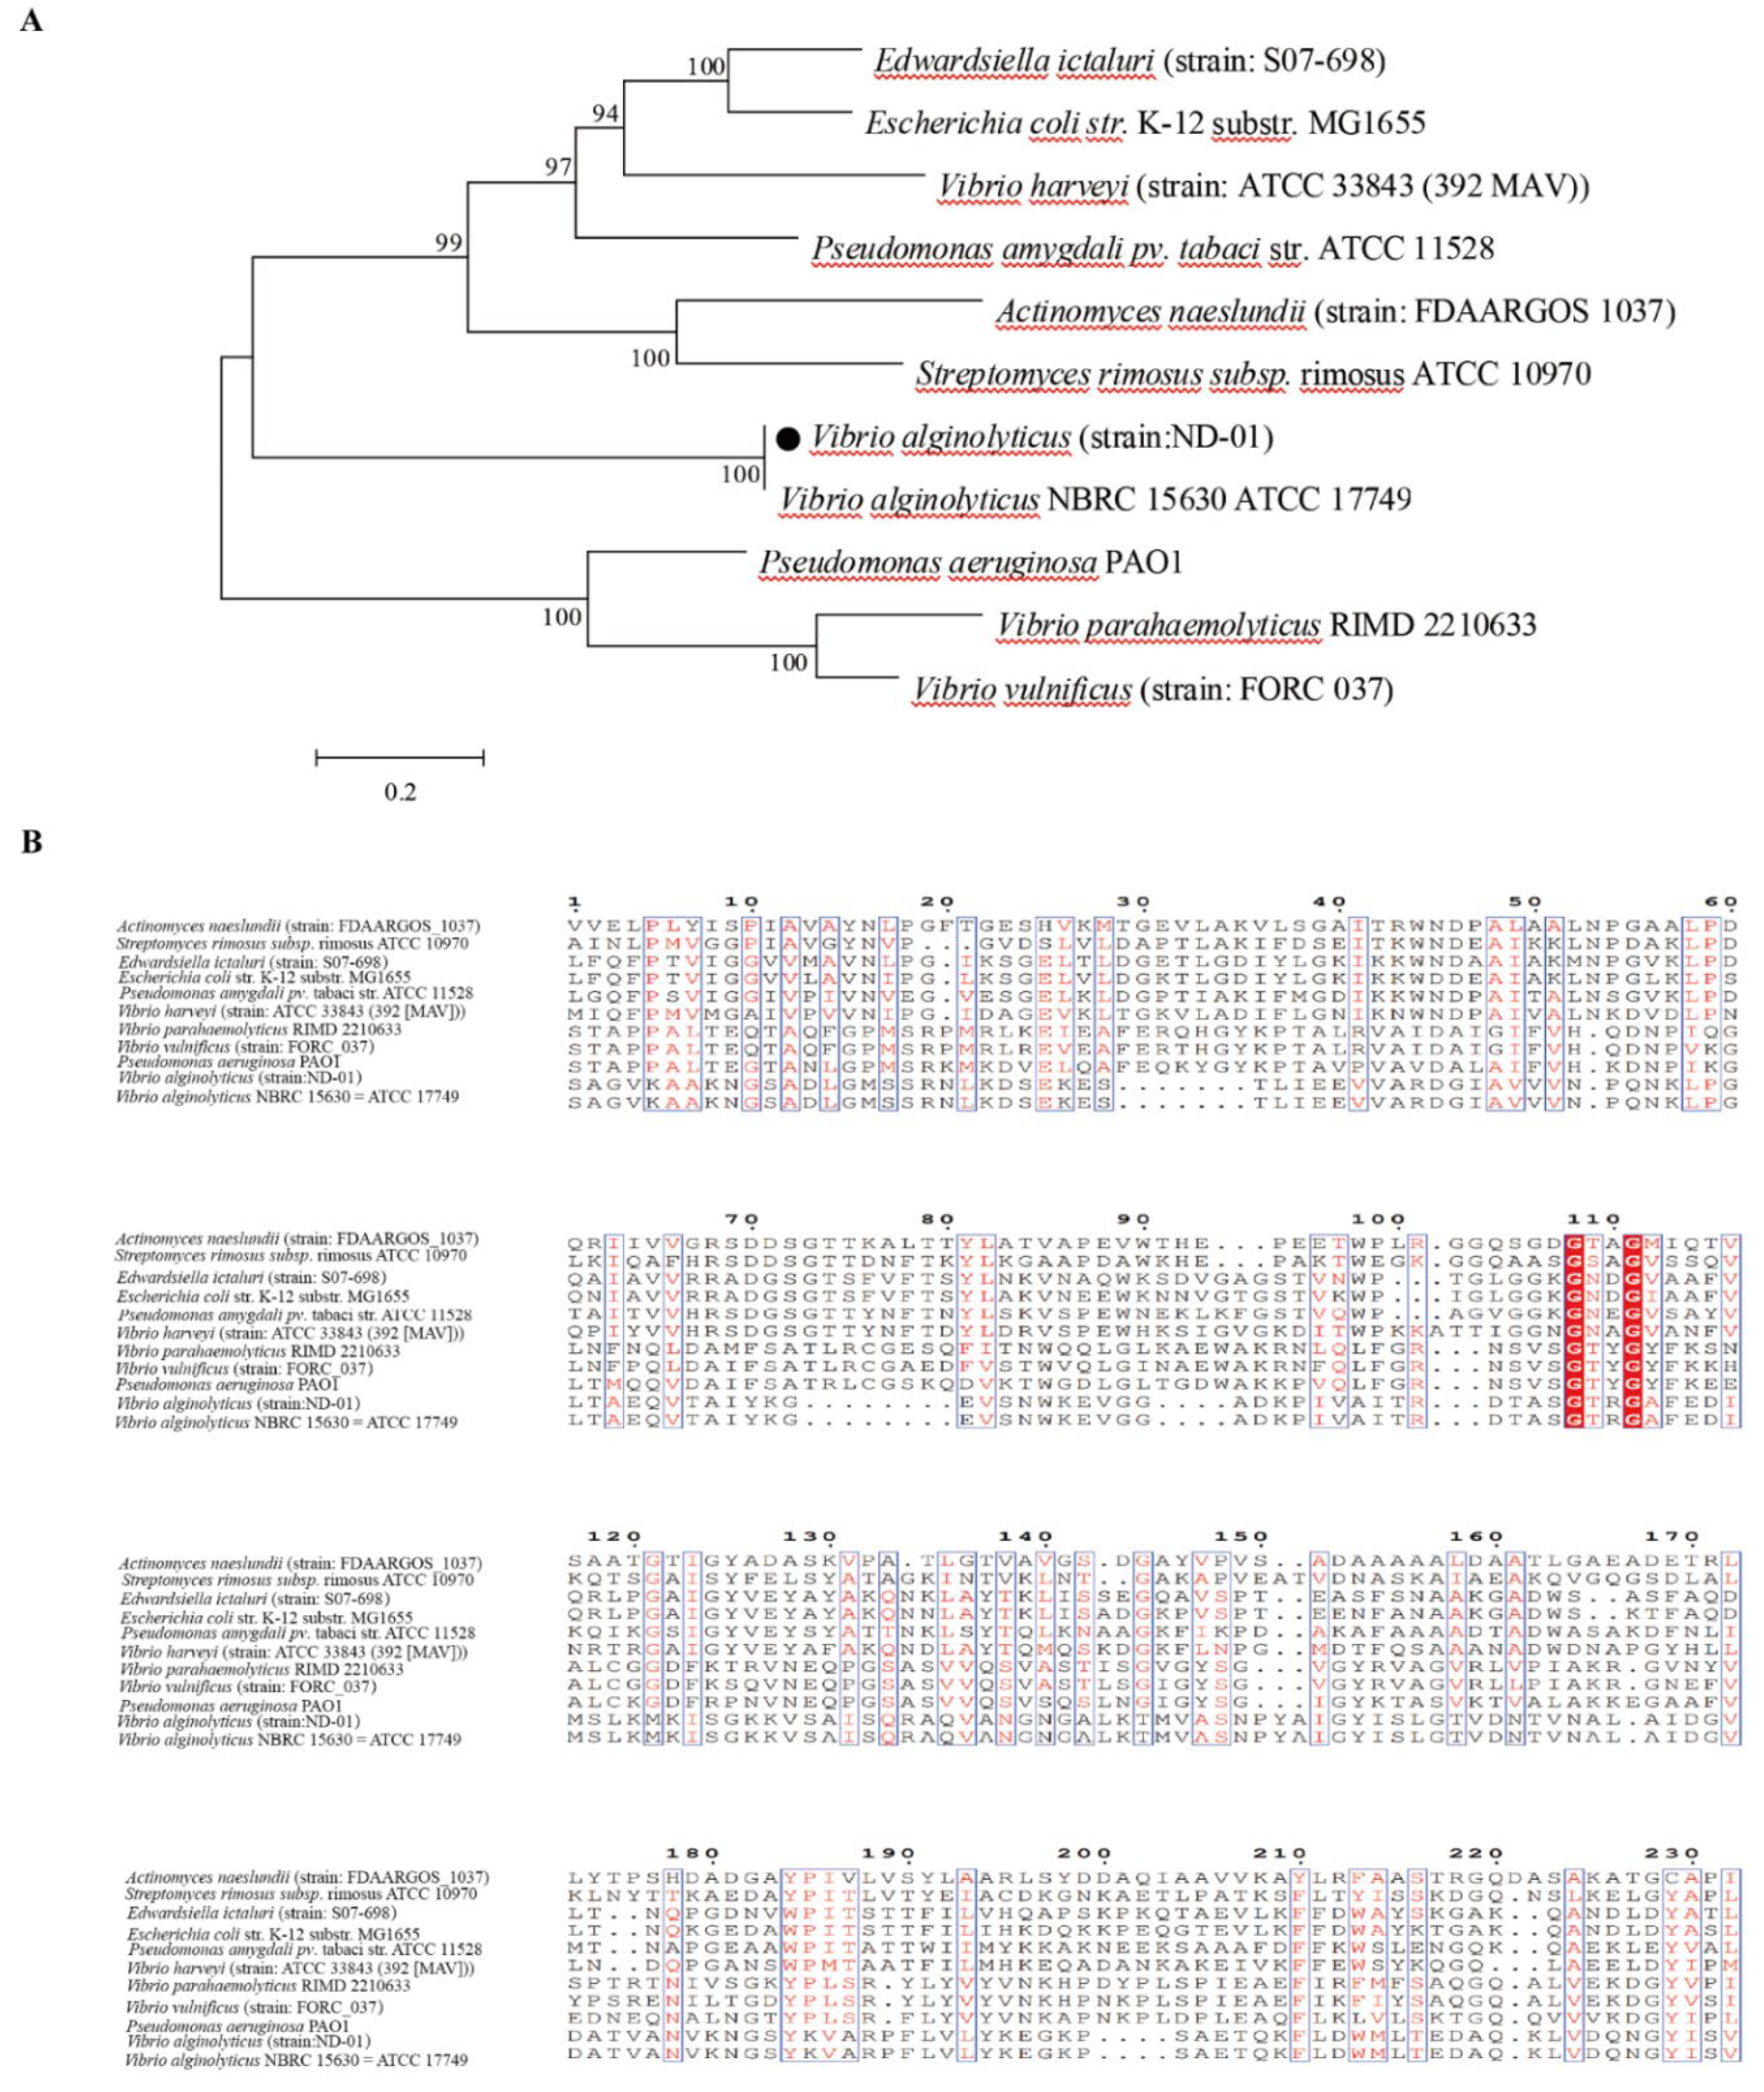
3.3. Amino Acid Sequence Homology Analysis of Virulence Genes
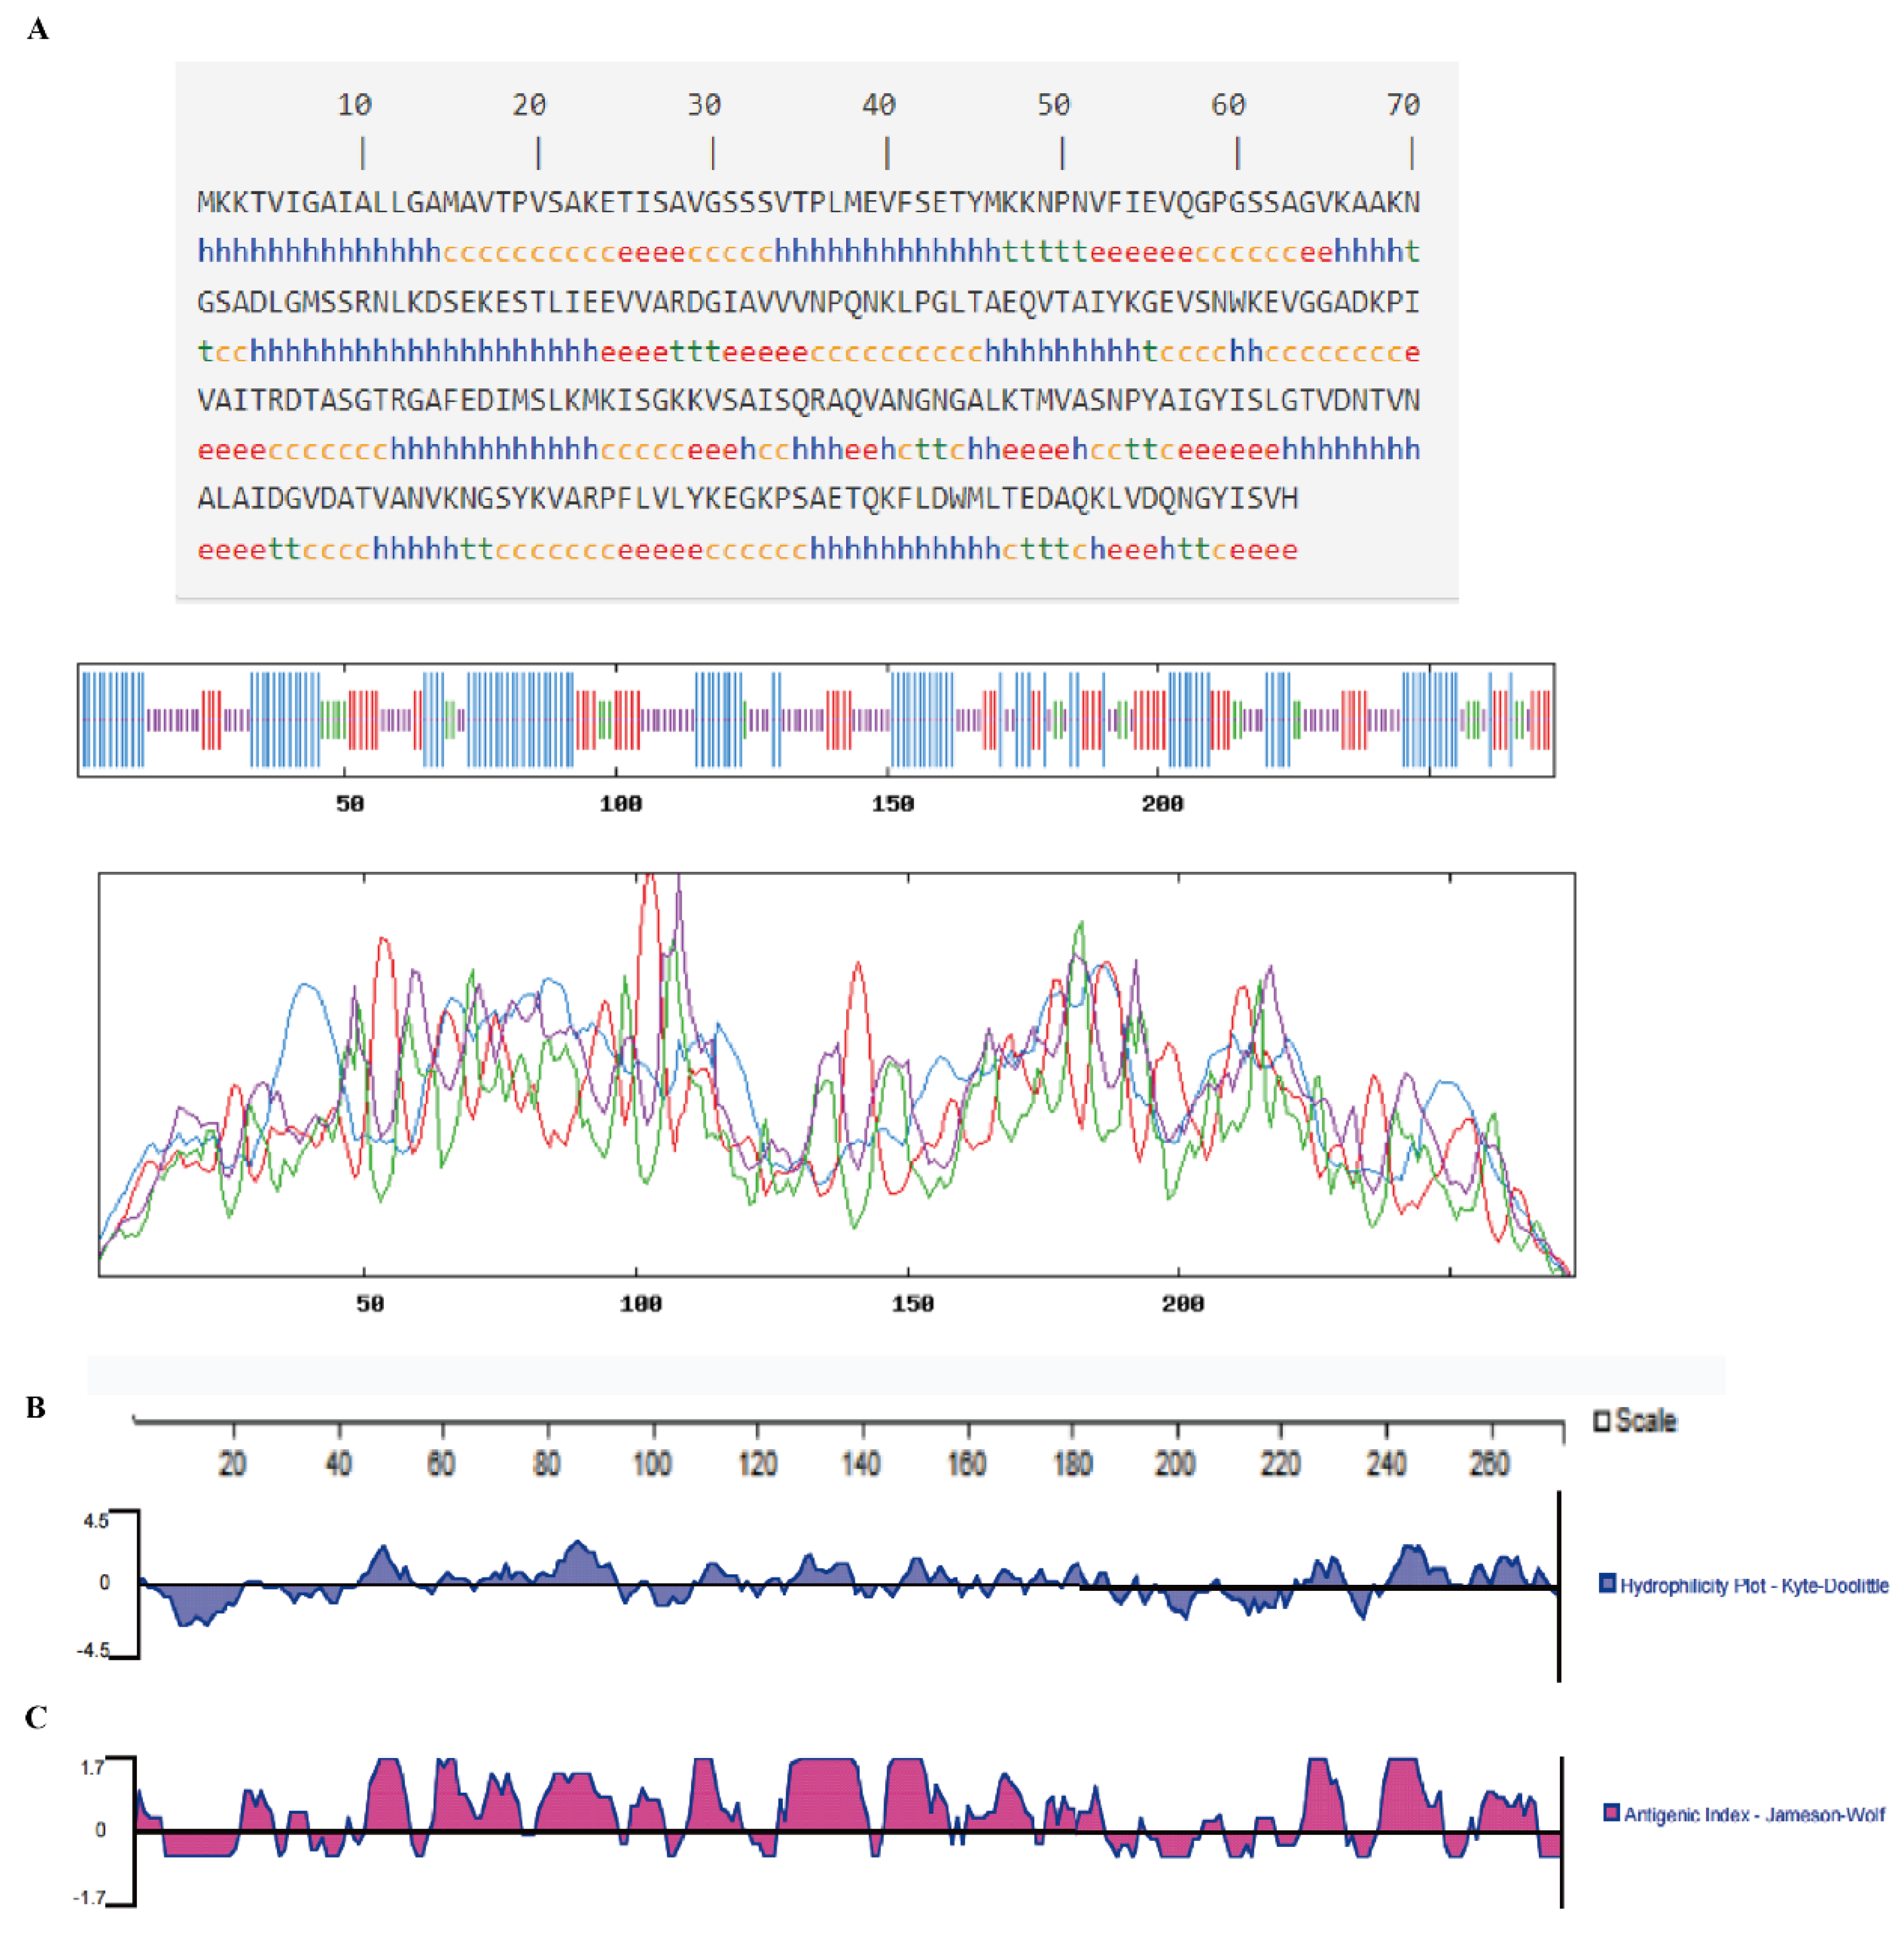
3.4. Prediction of Protein Secondary Structure Models
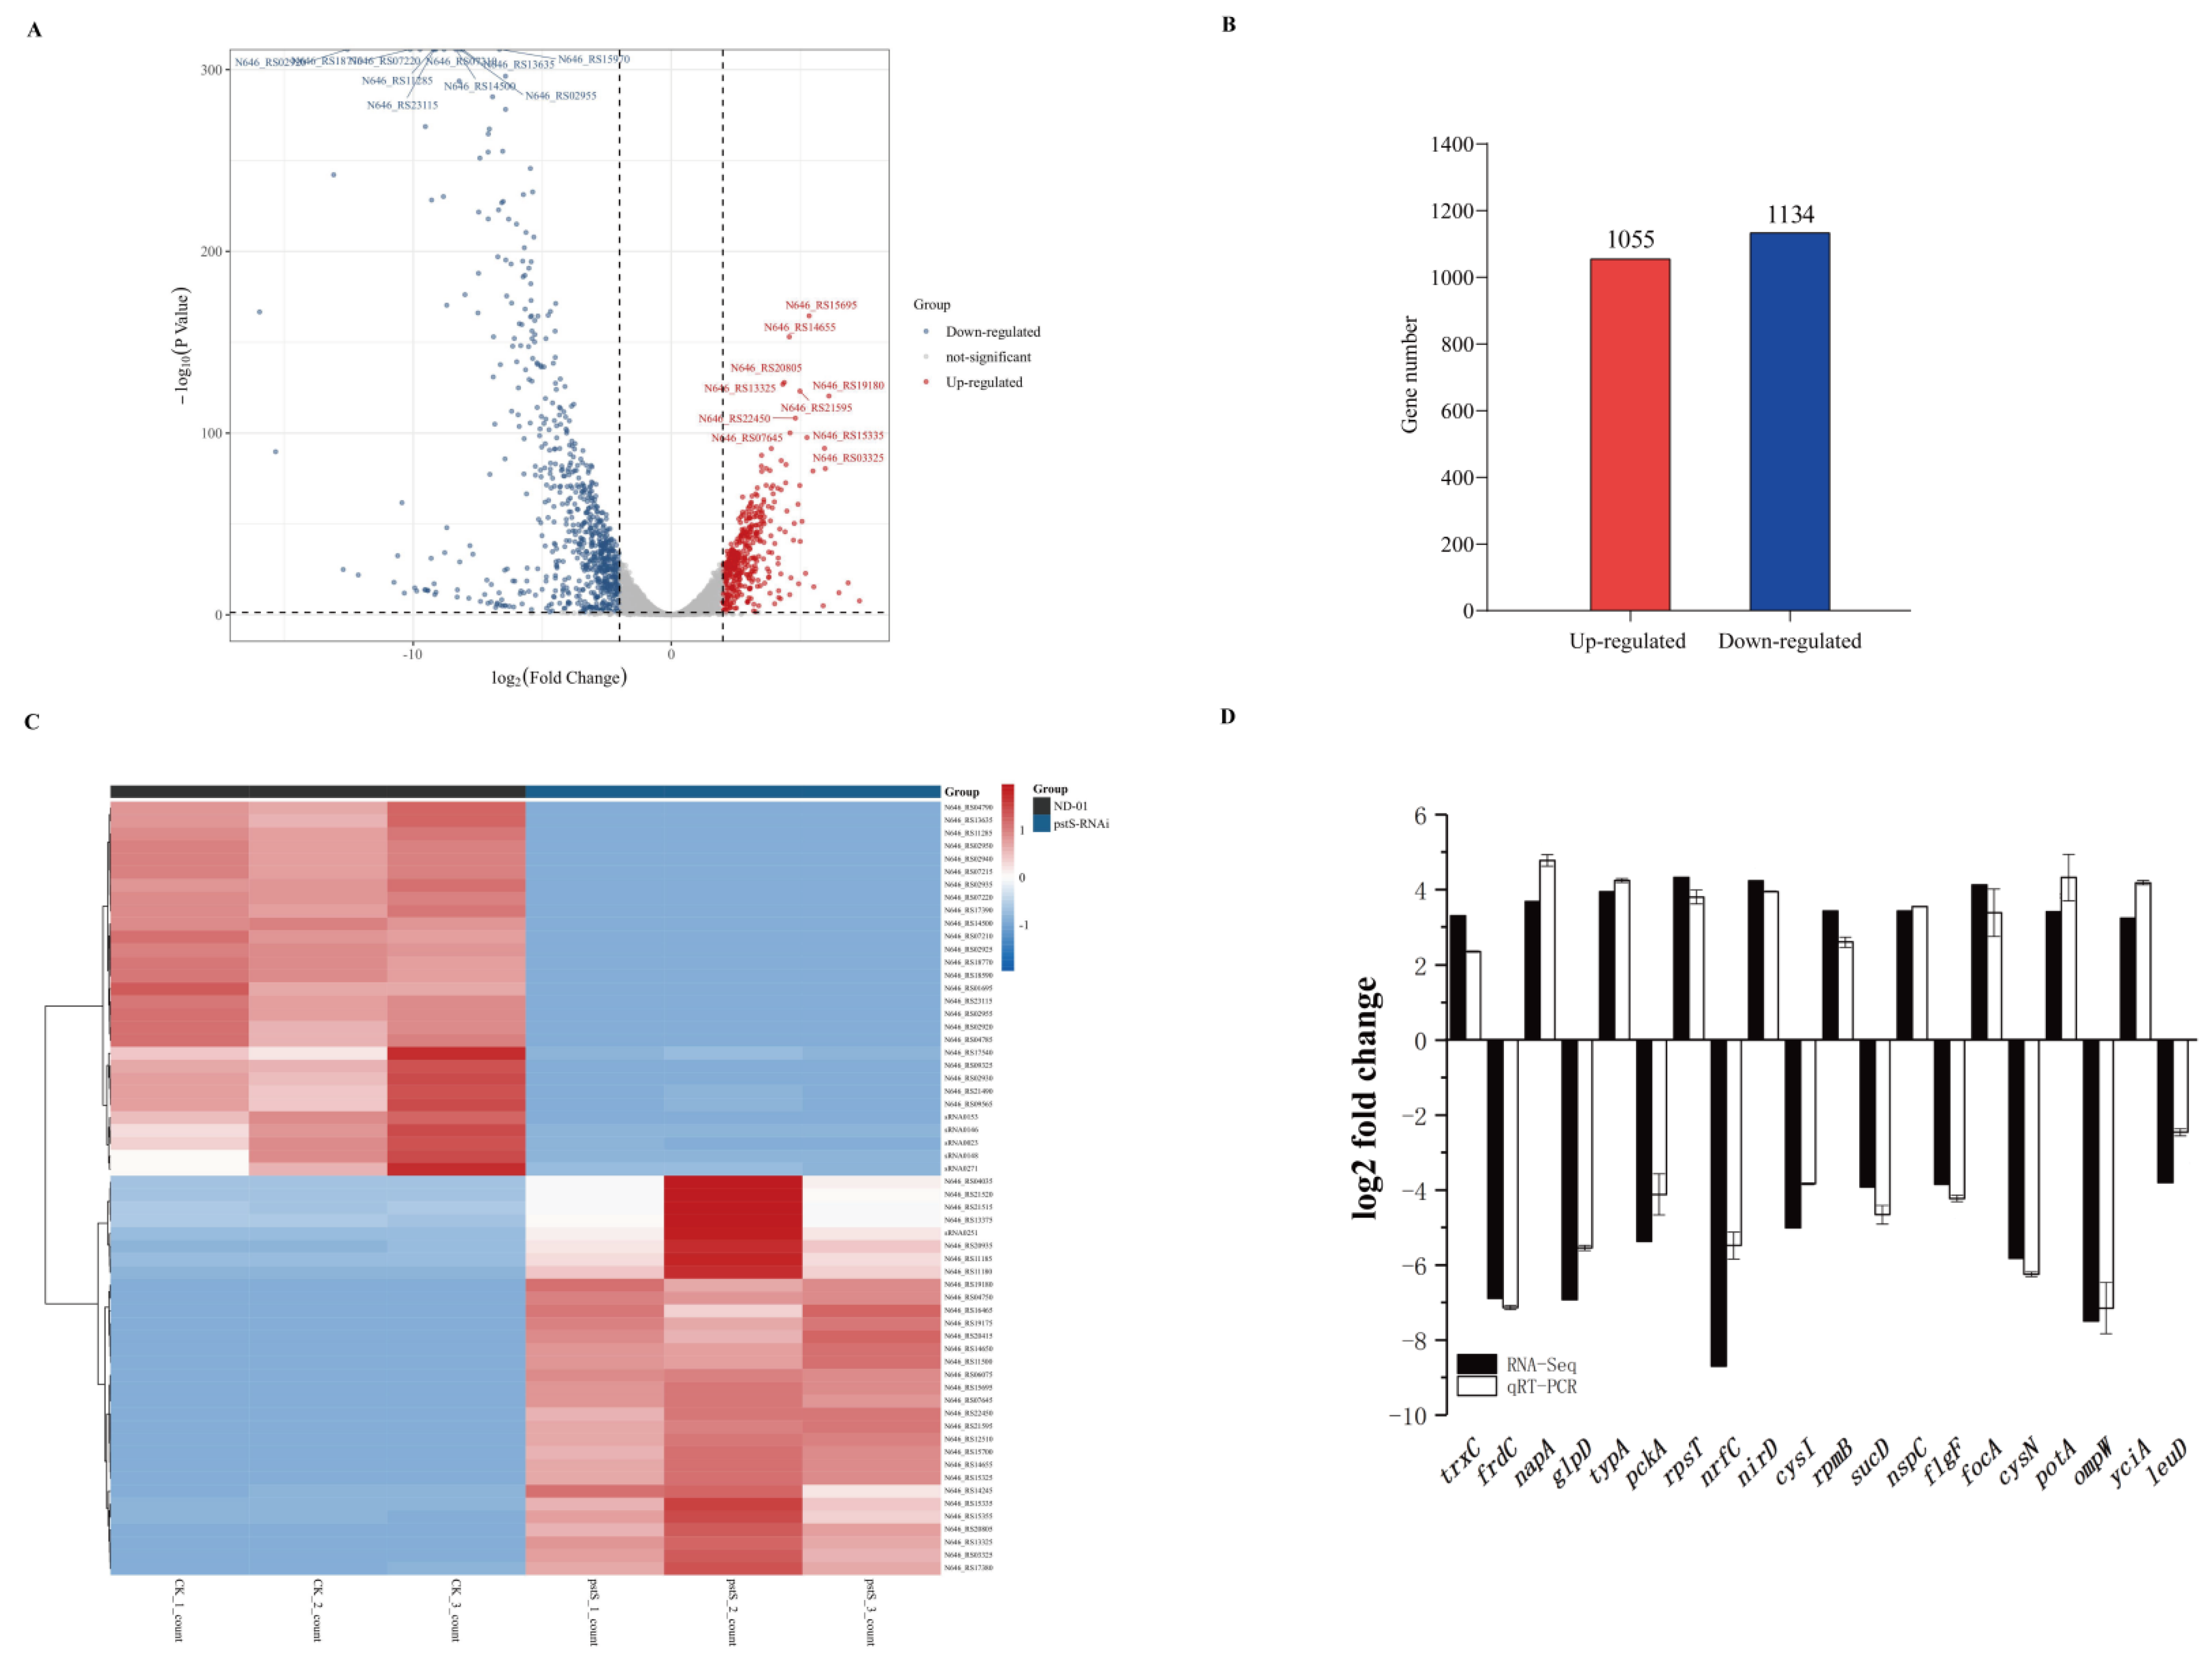
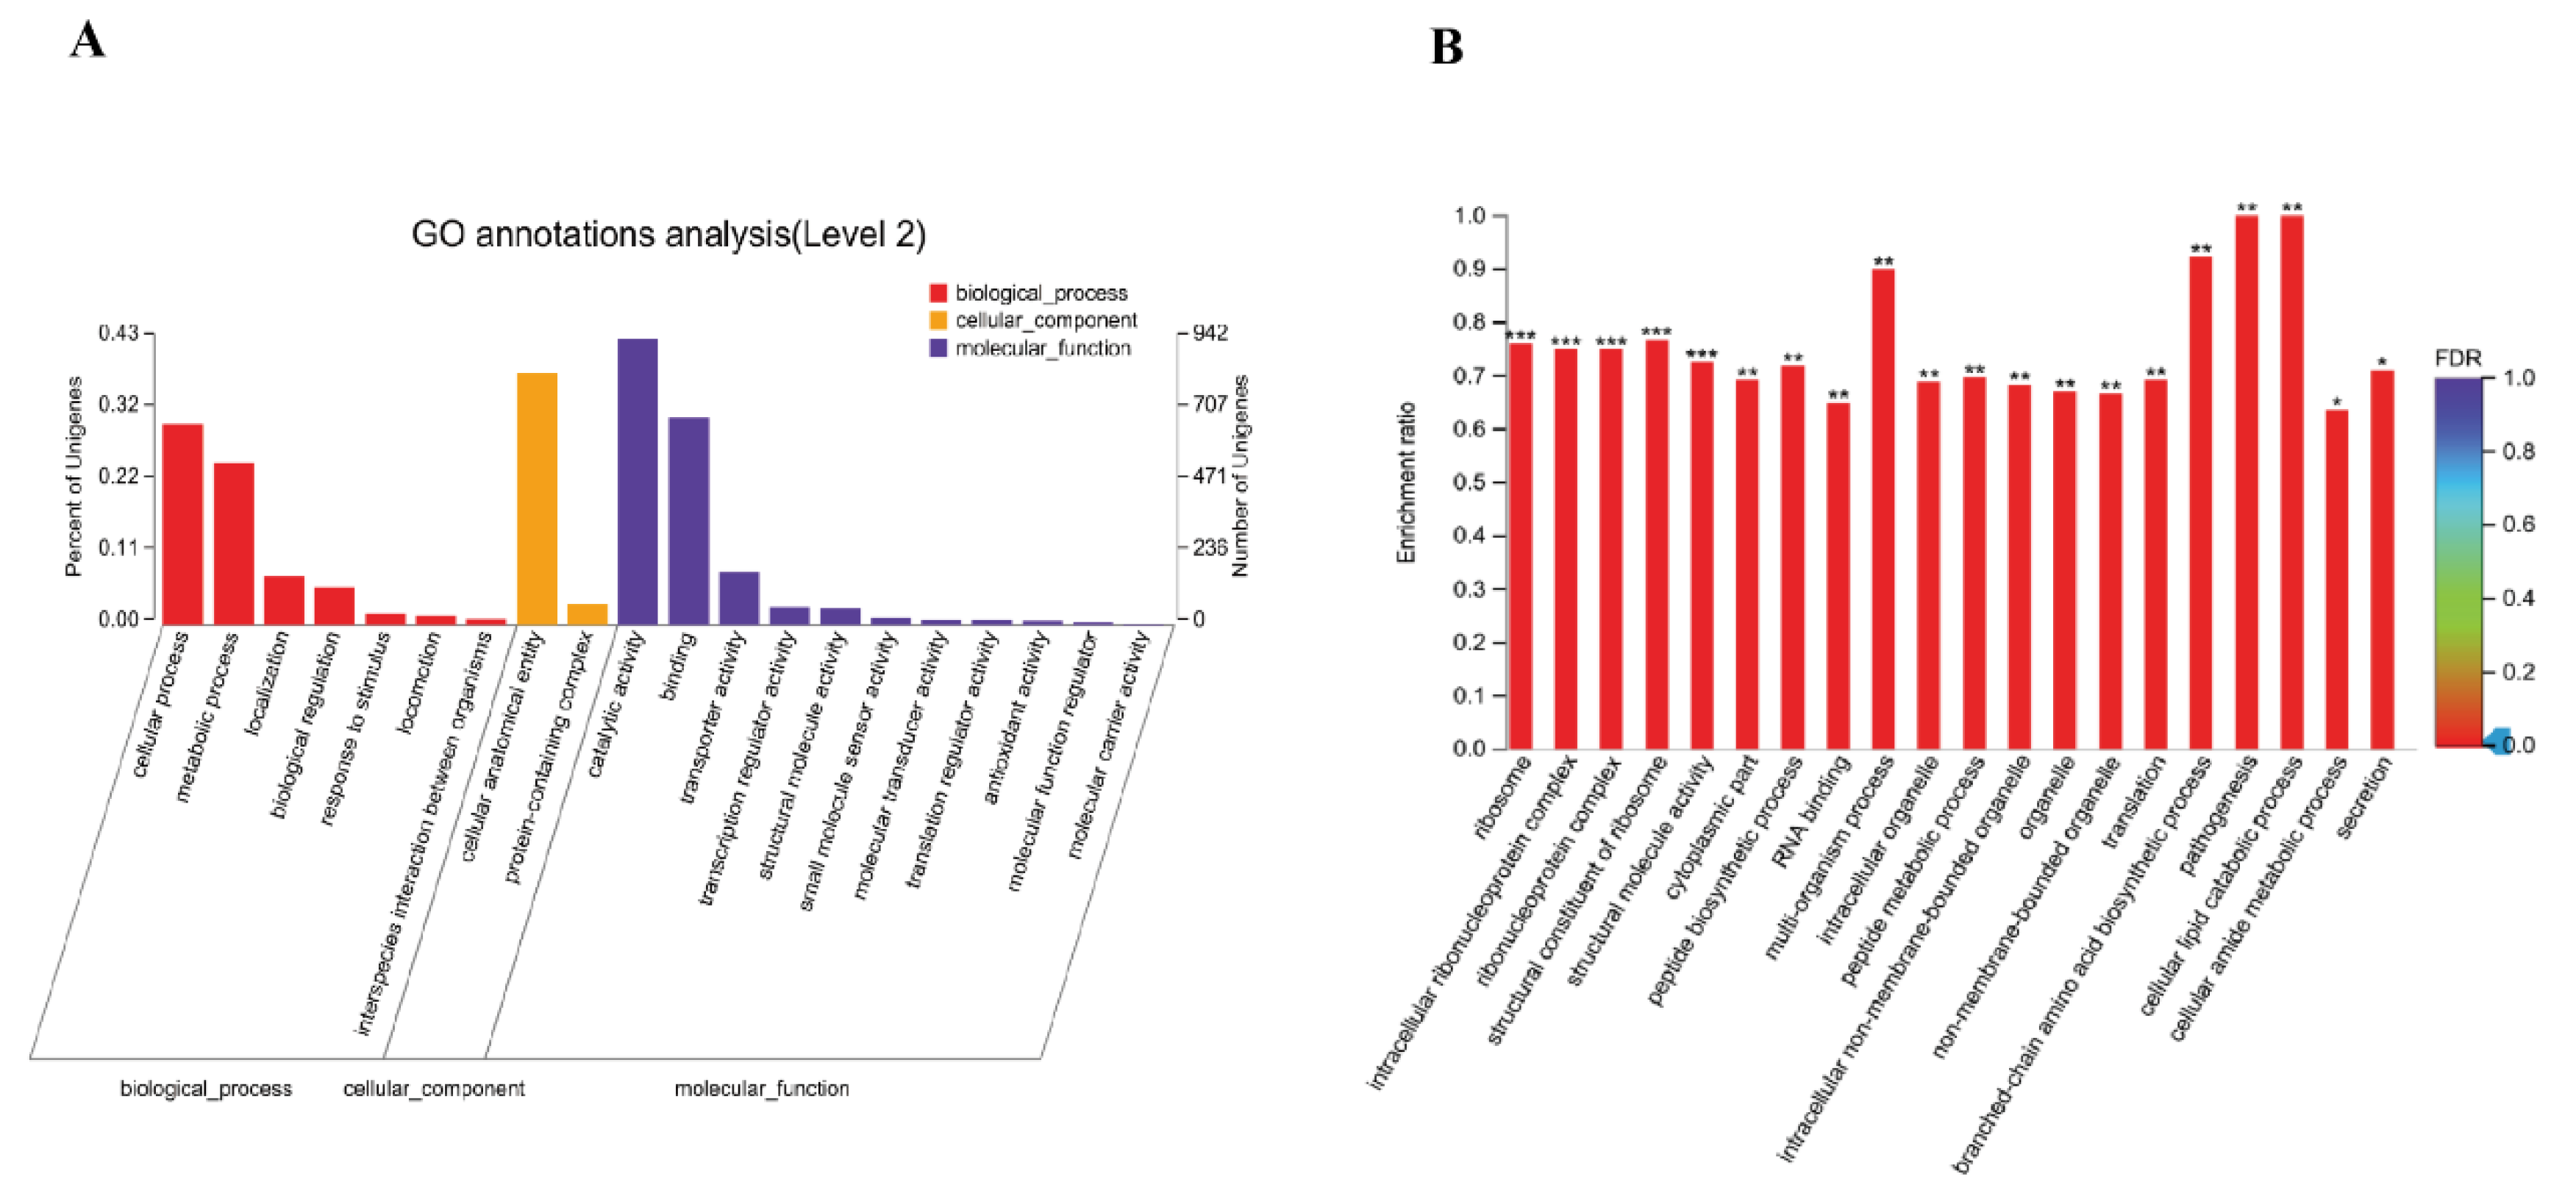
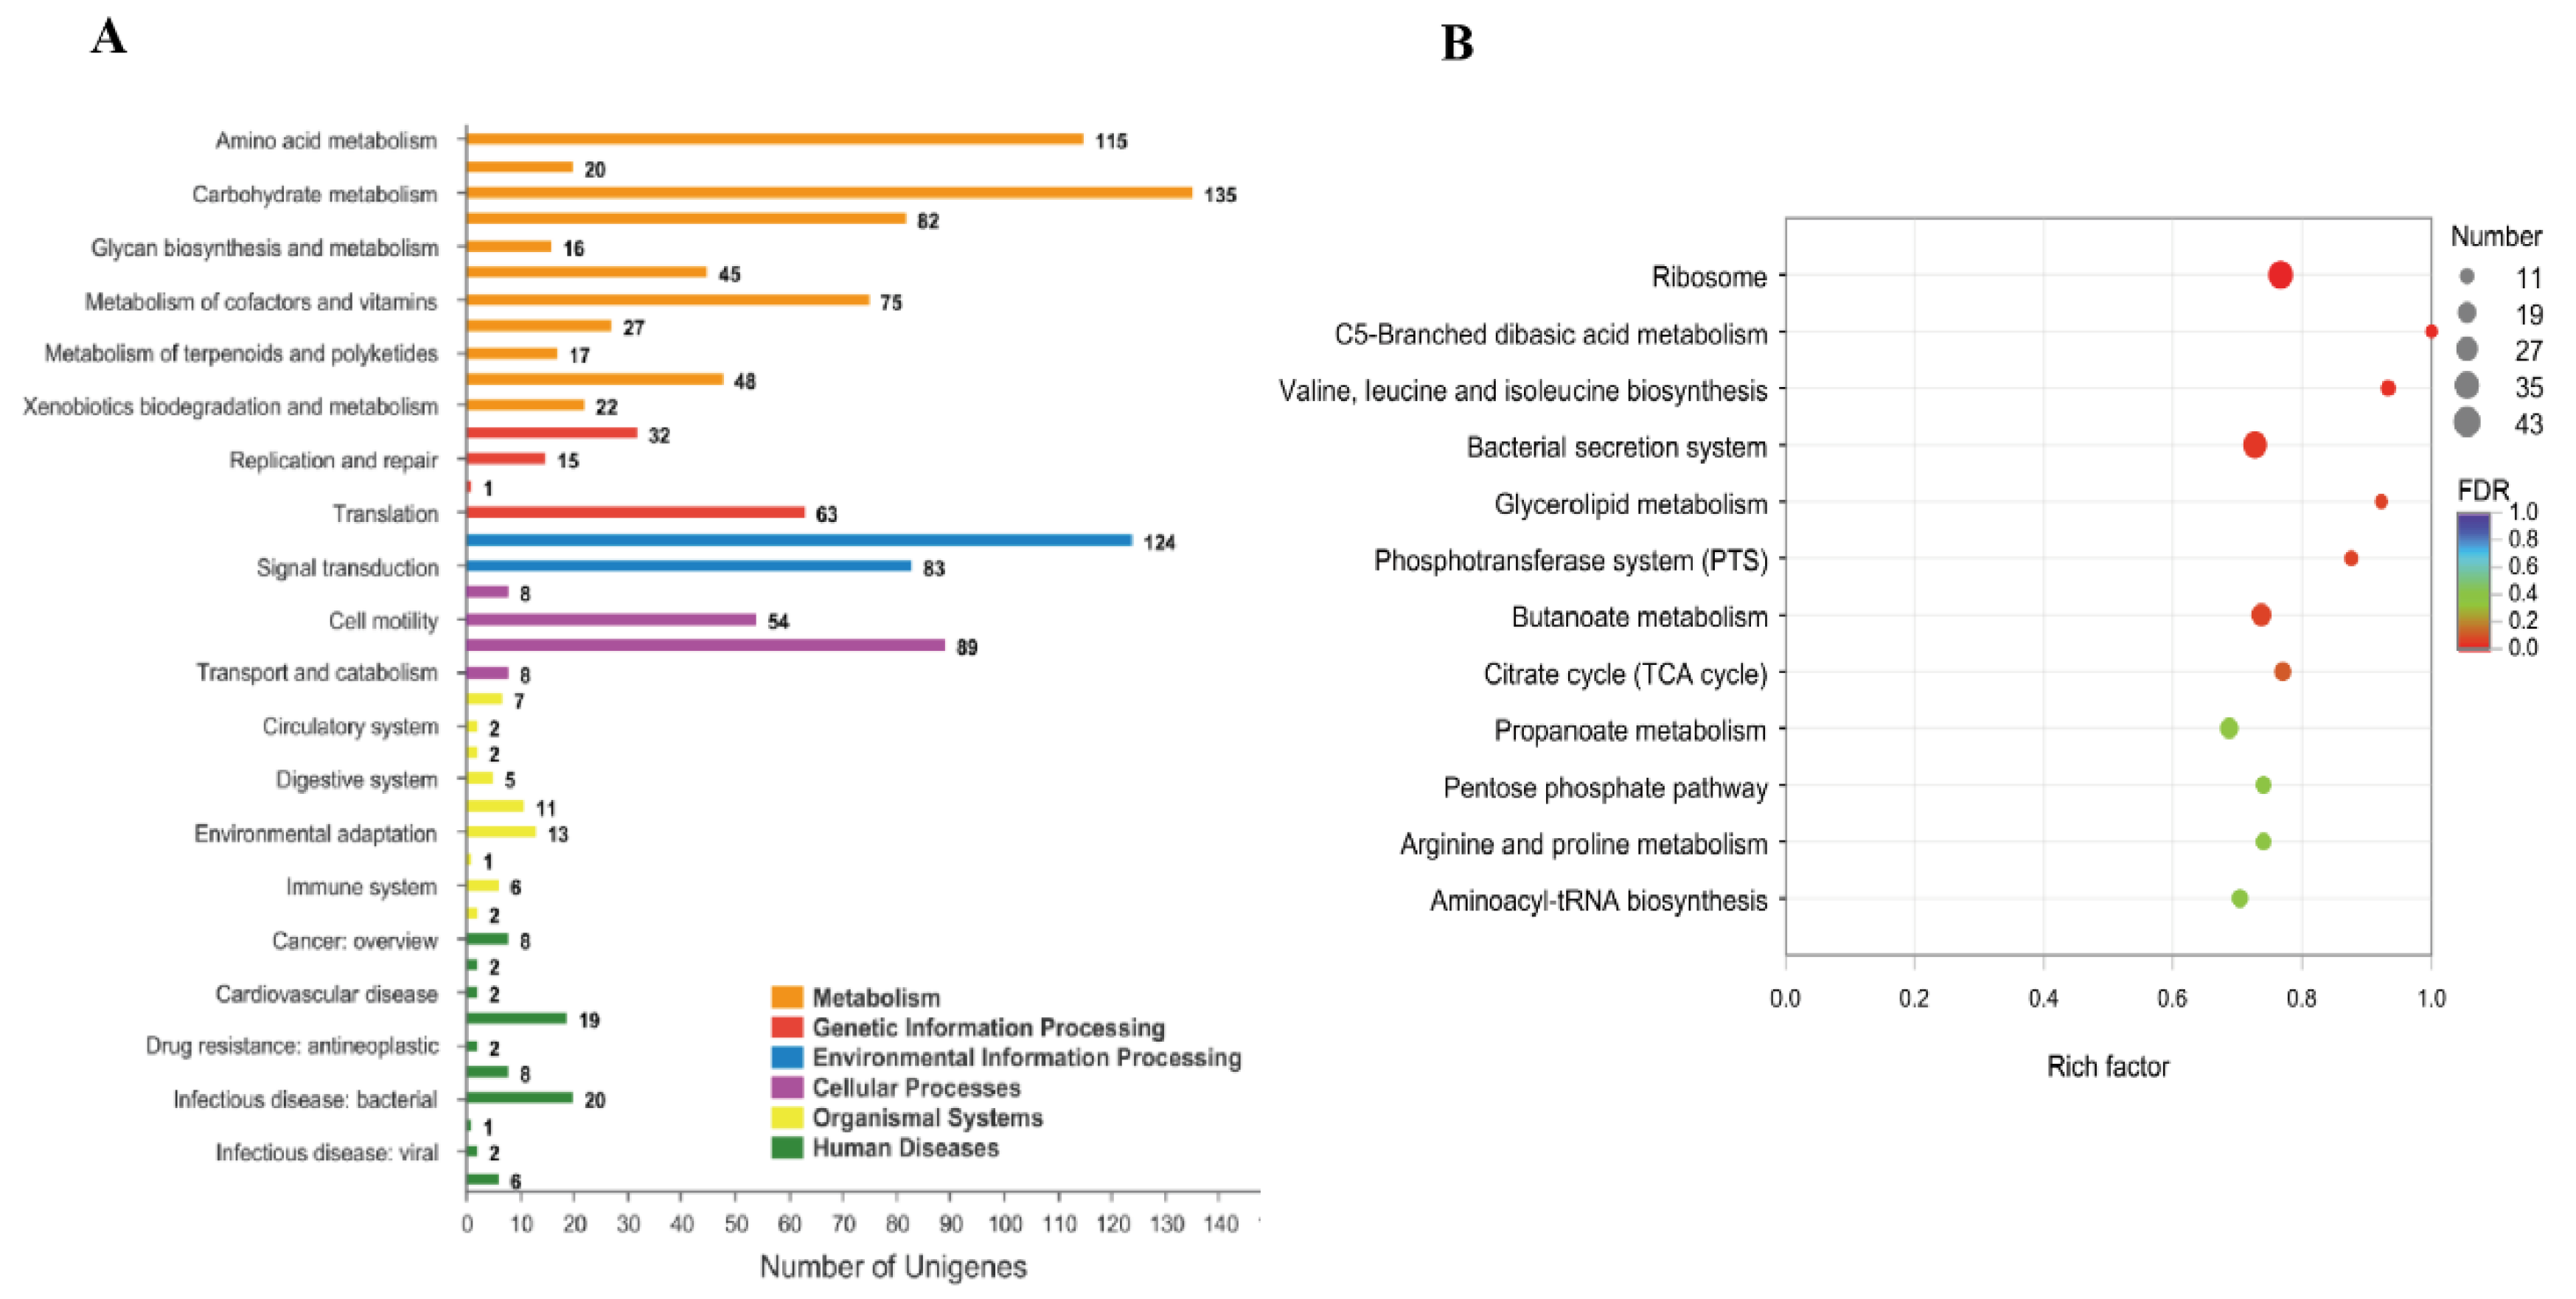
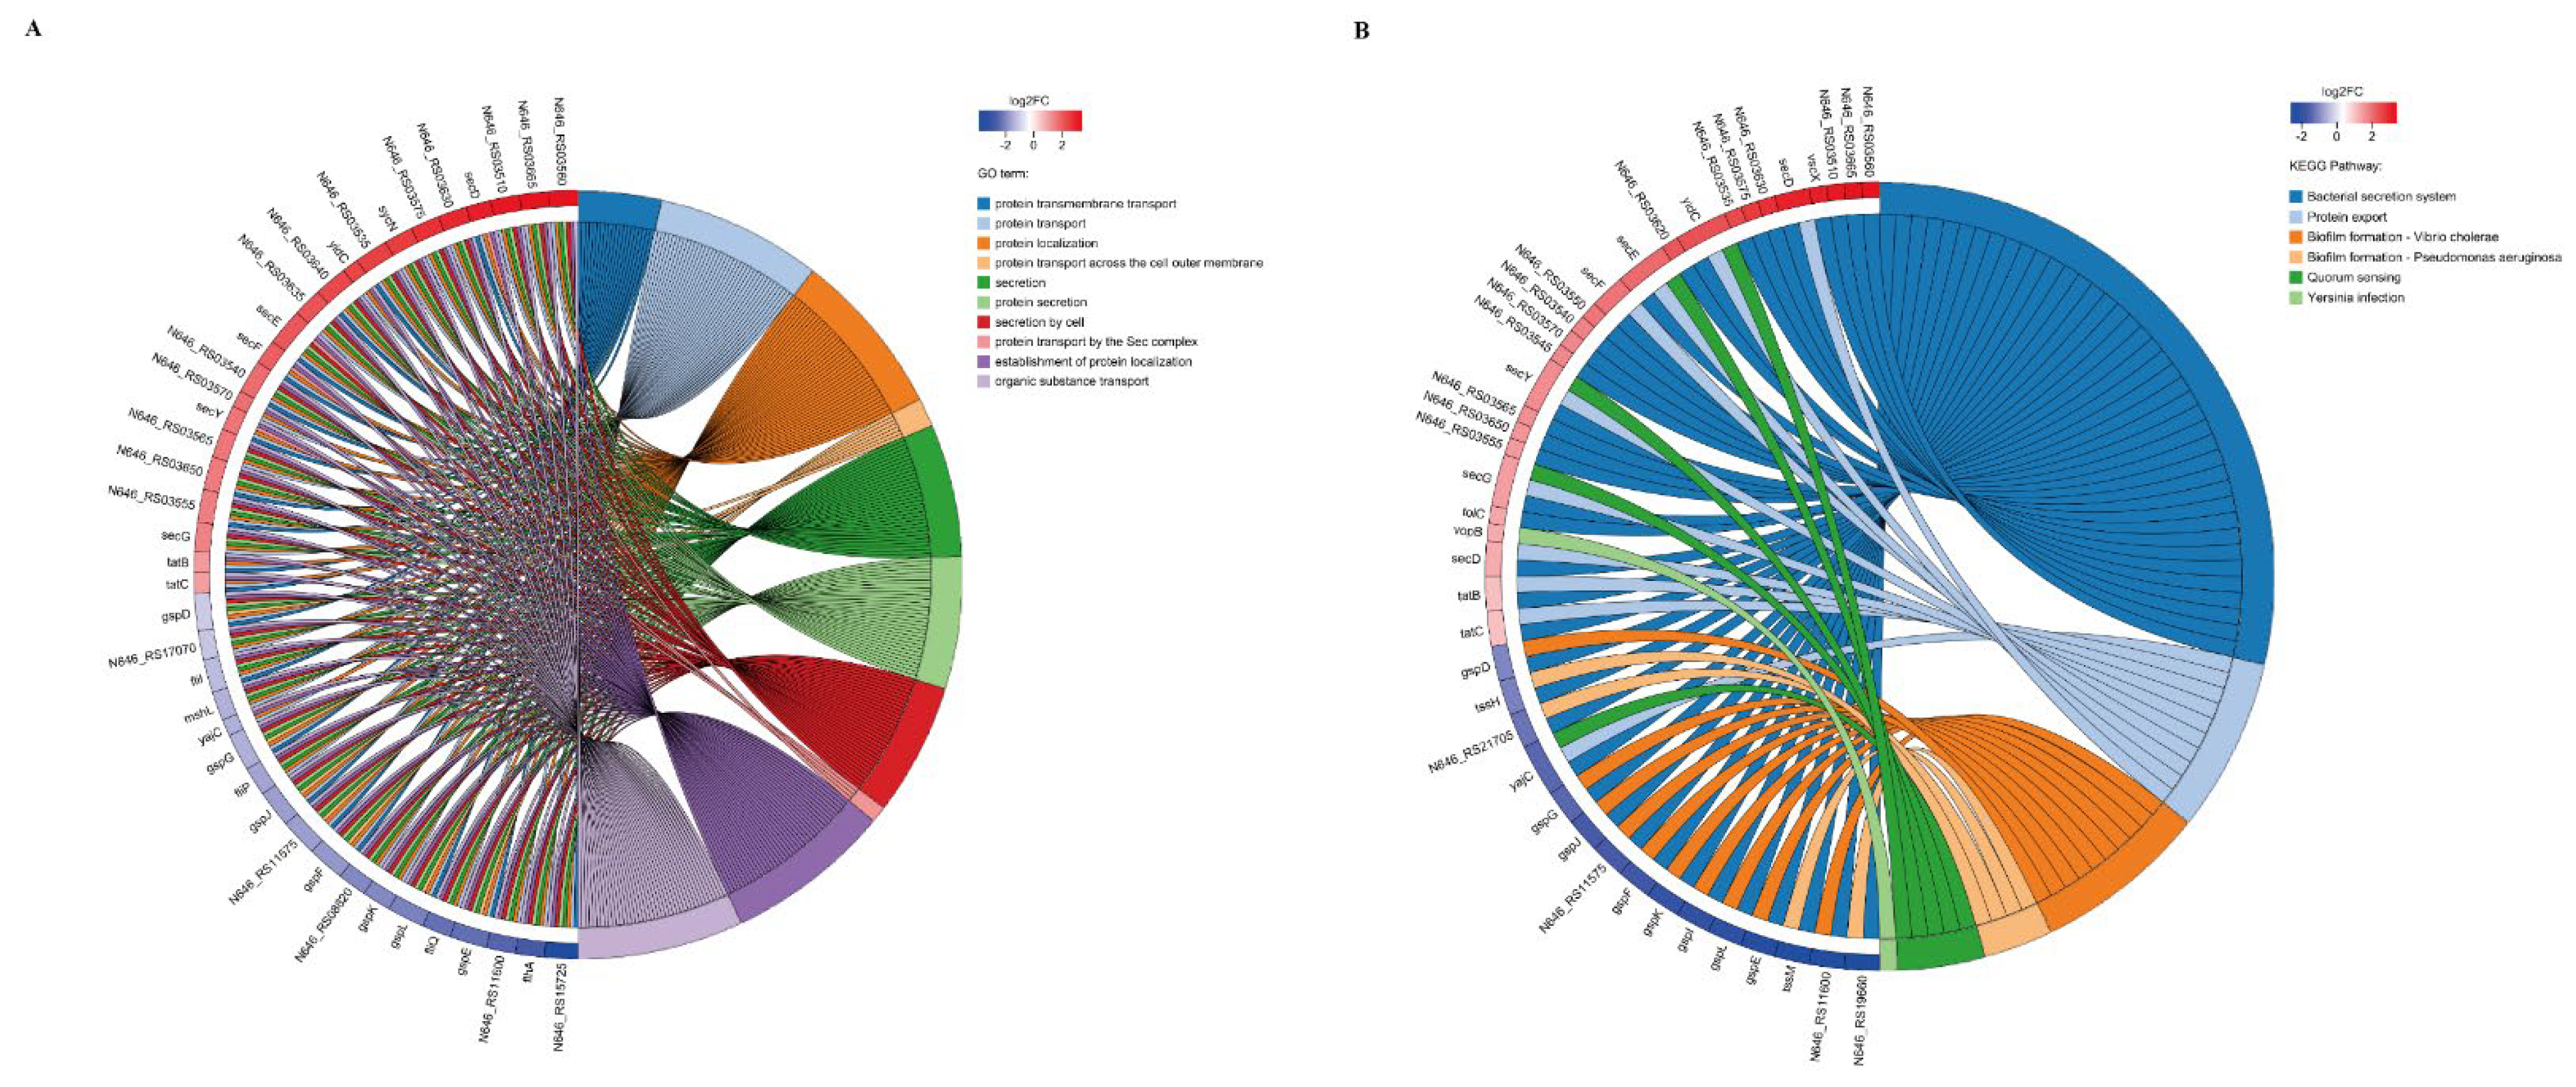
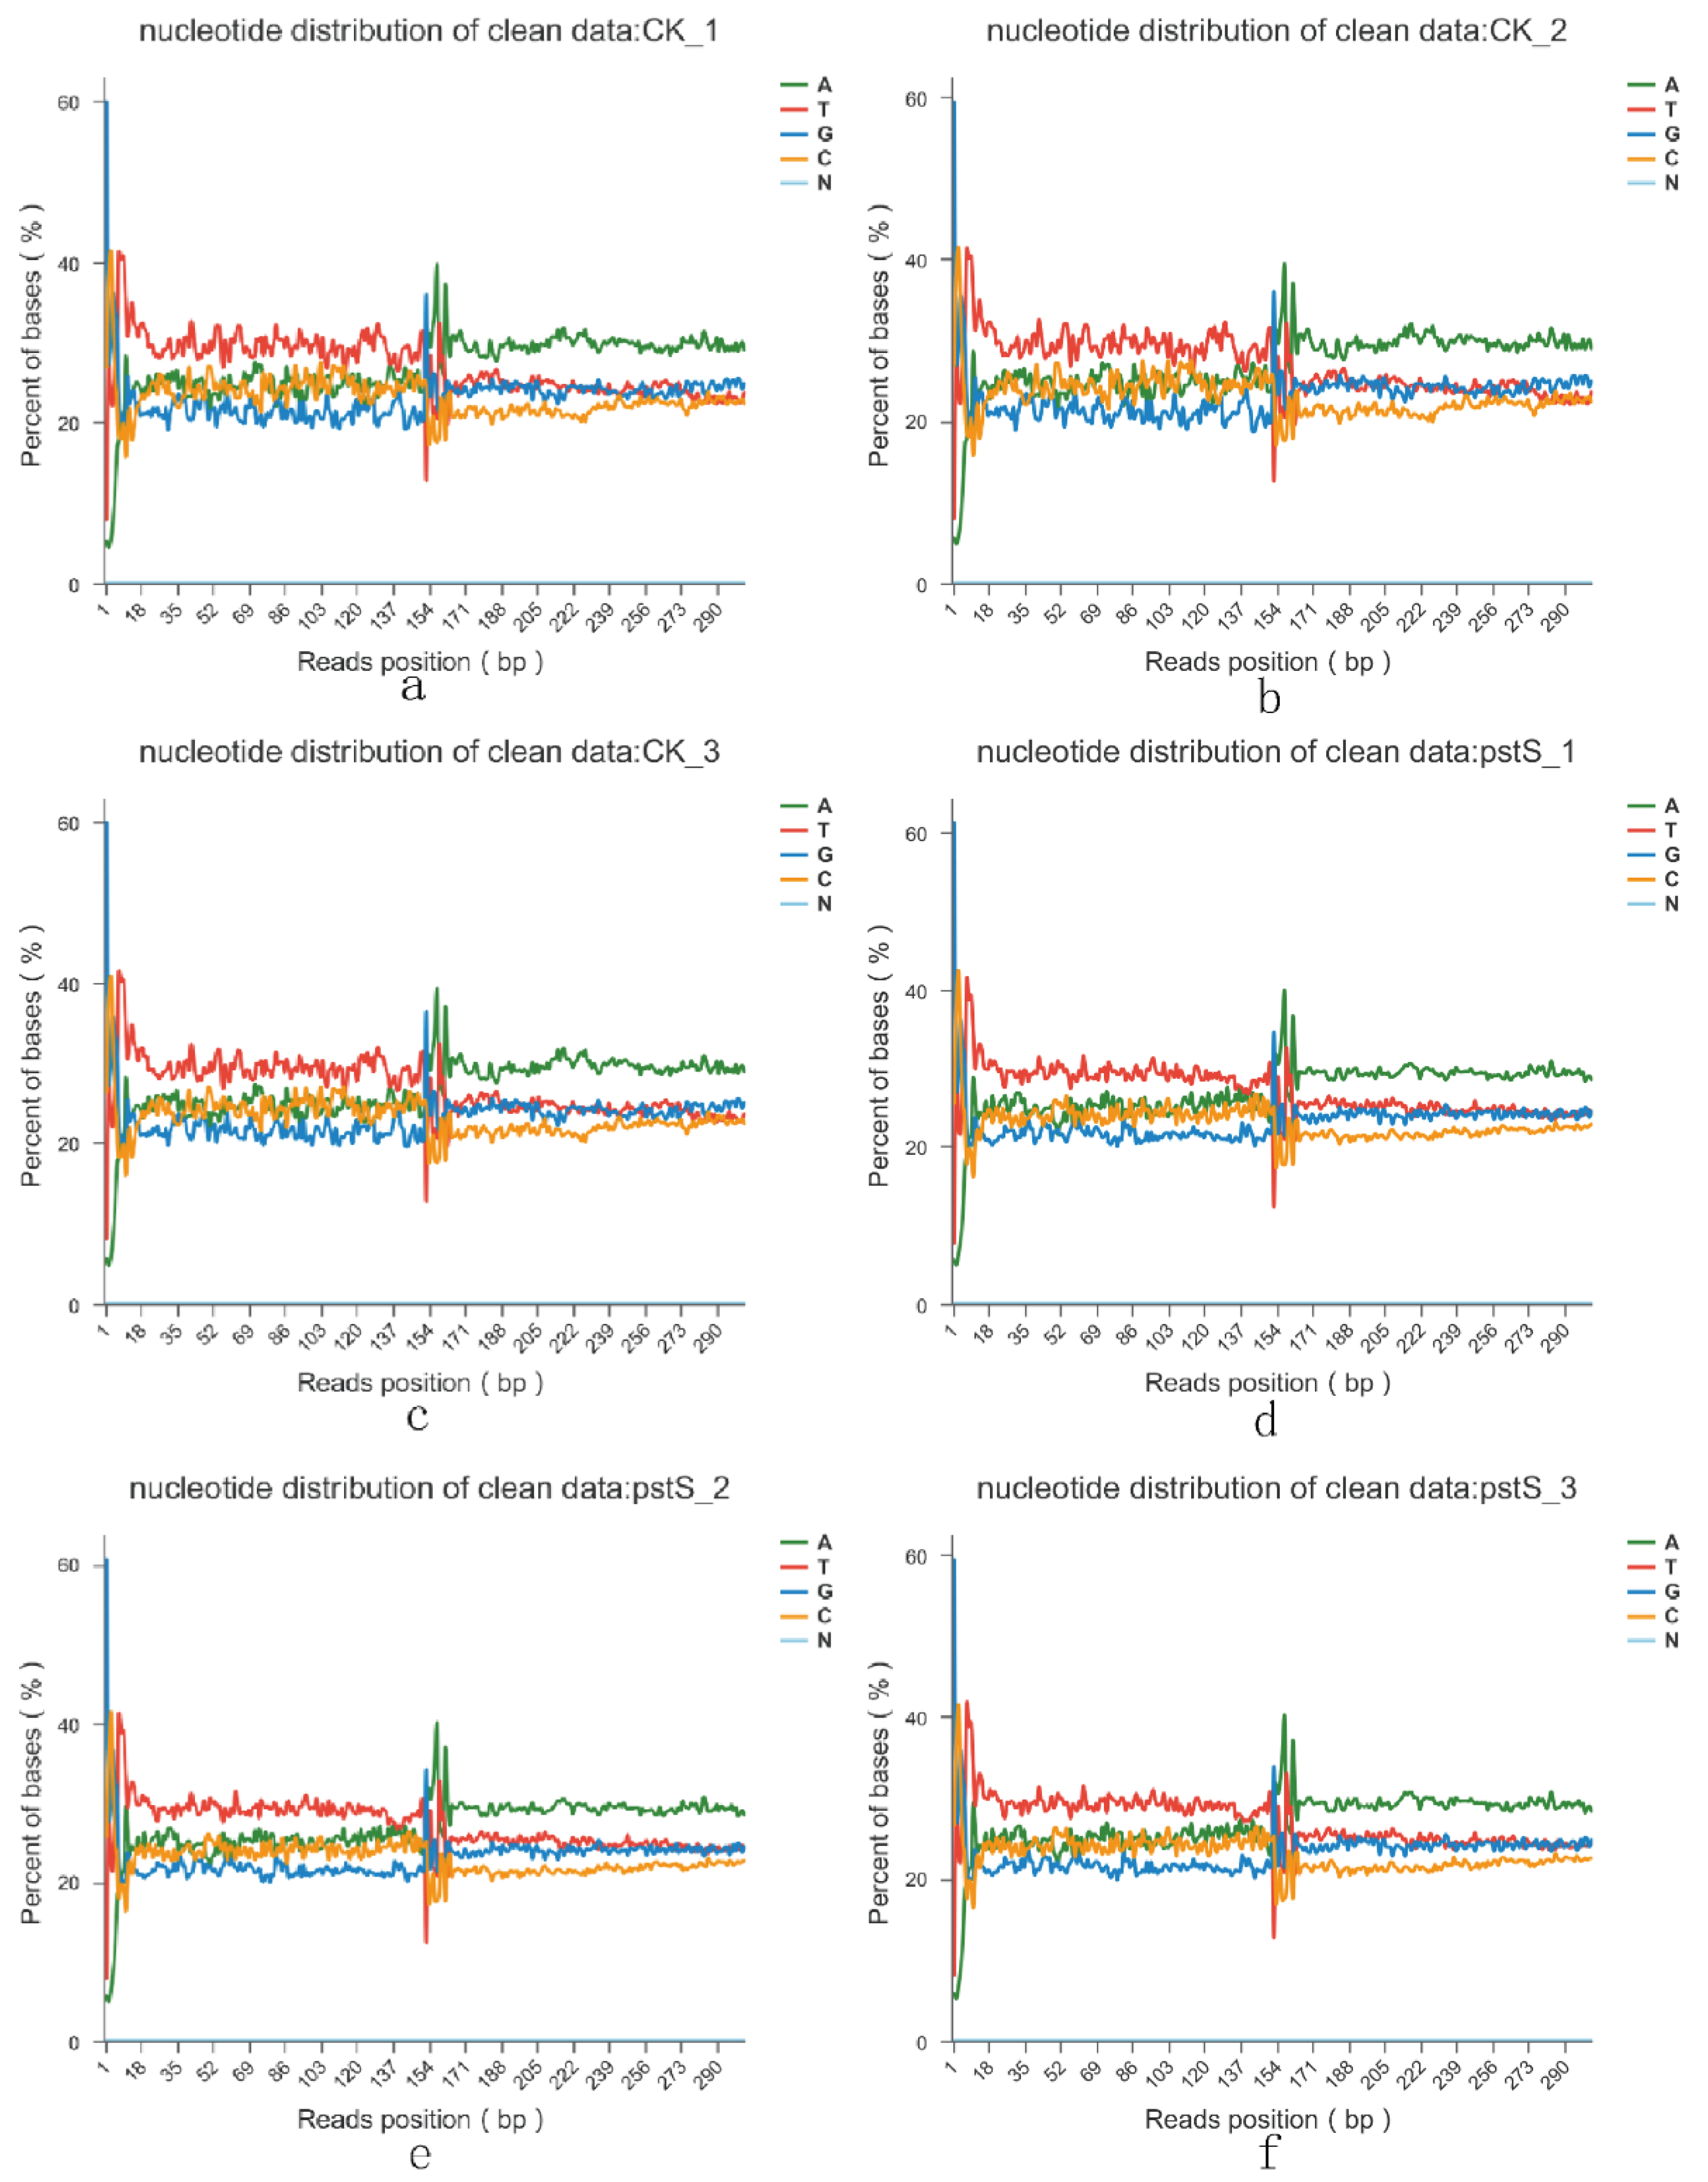
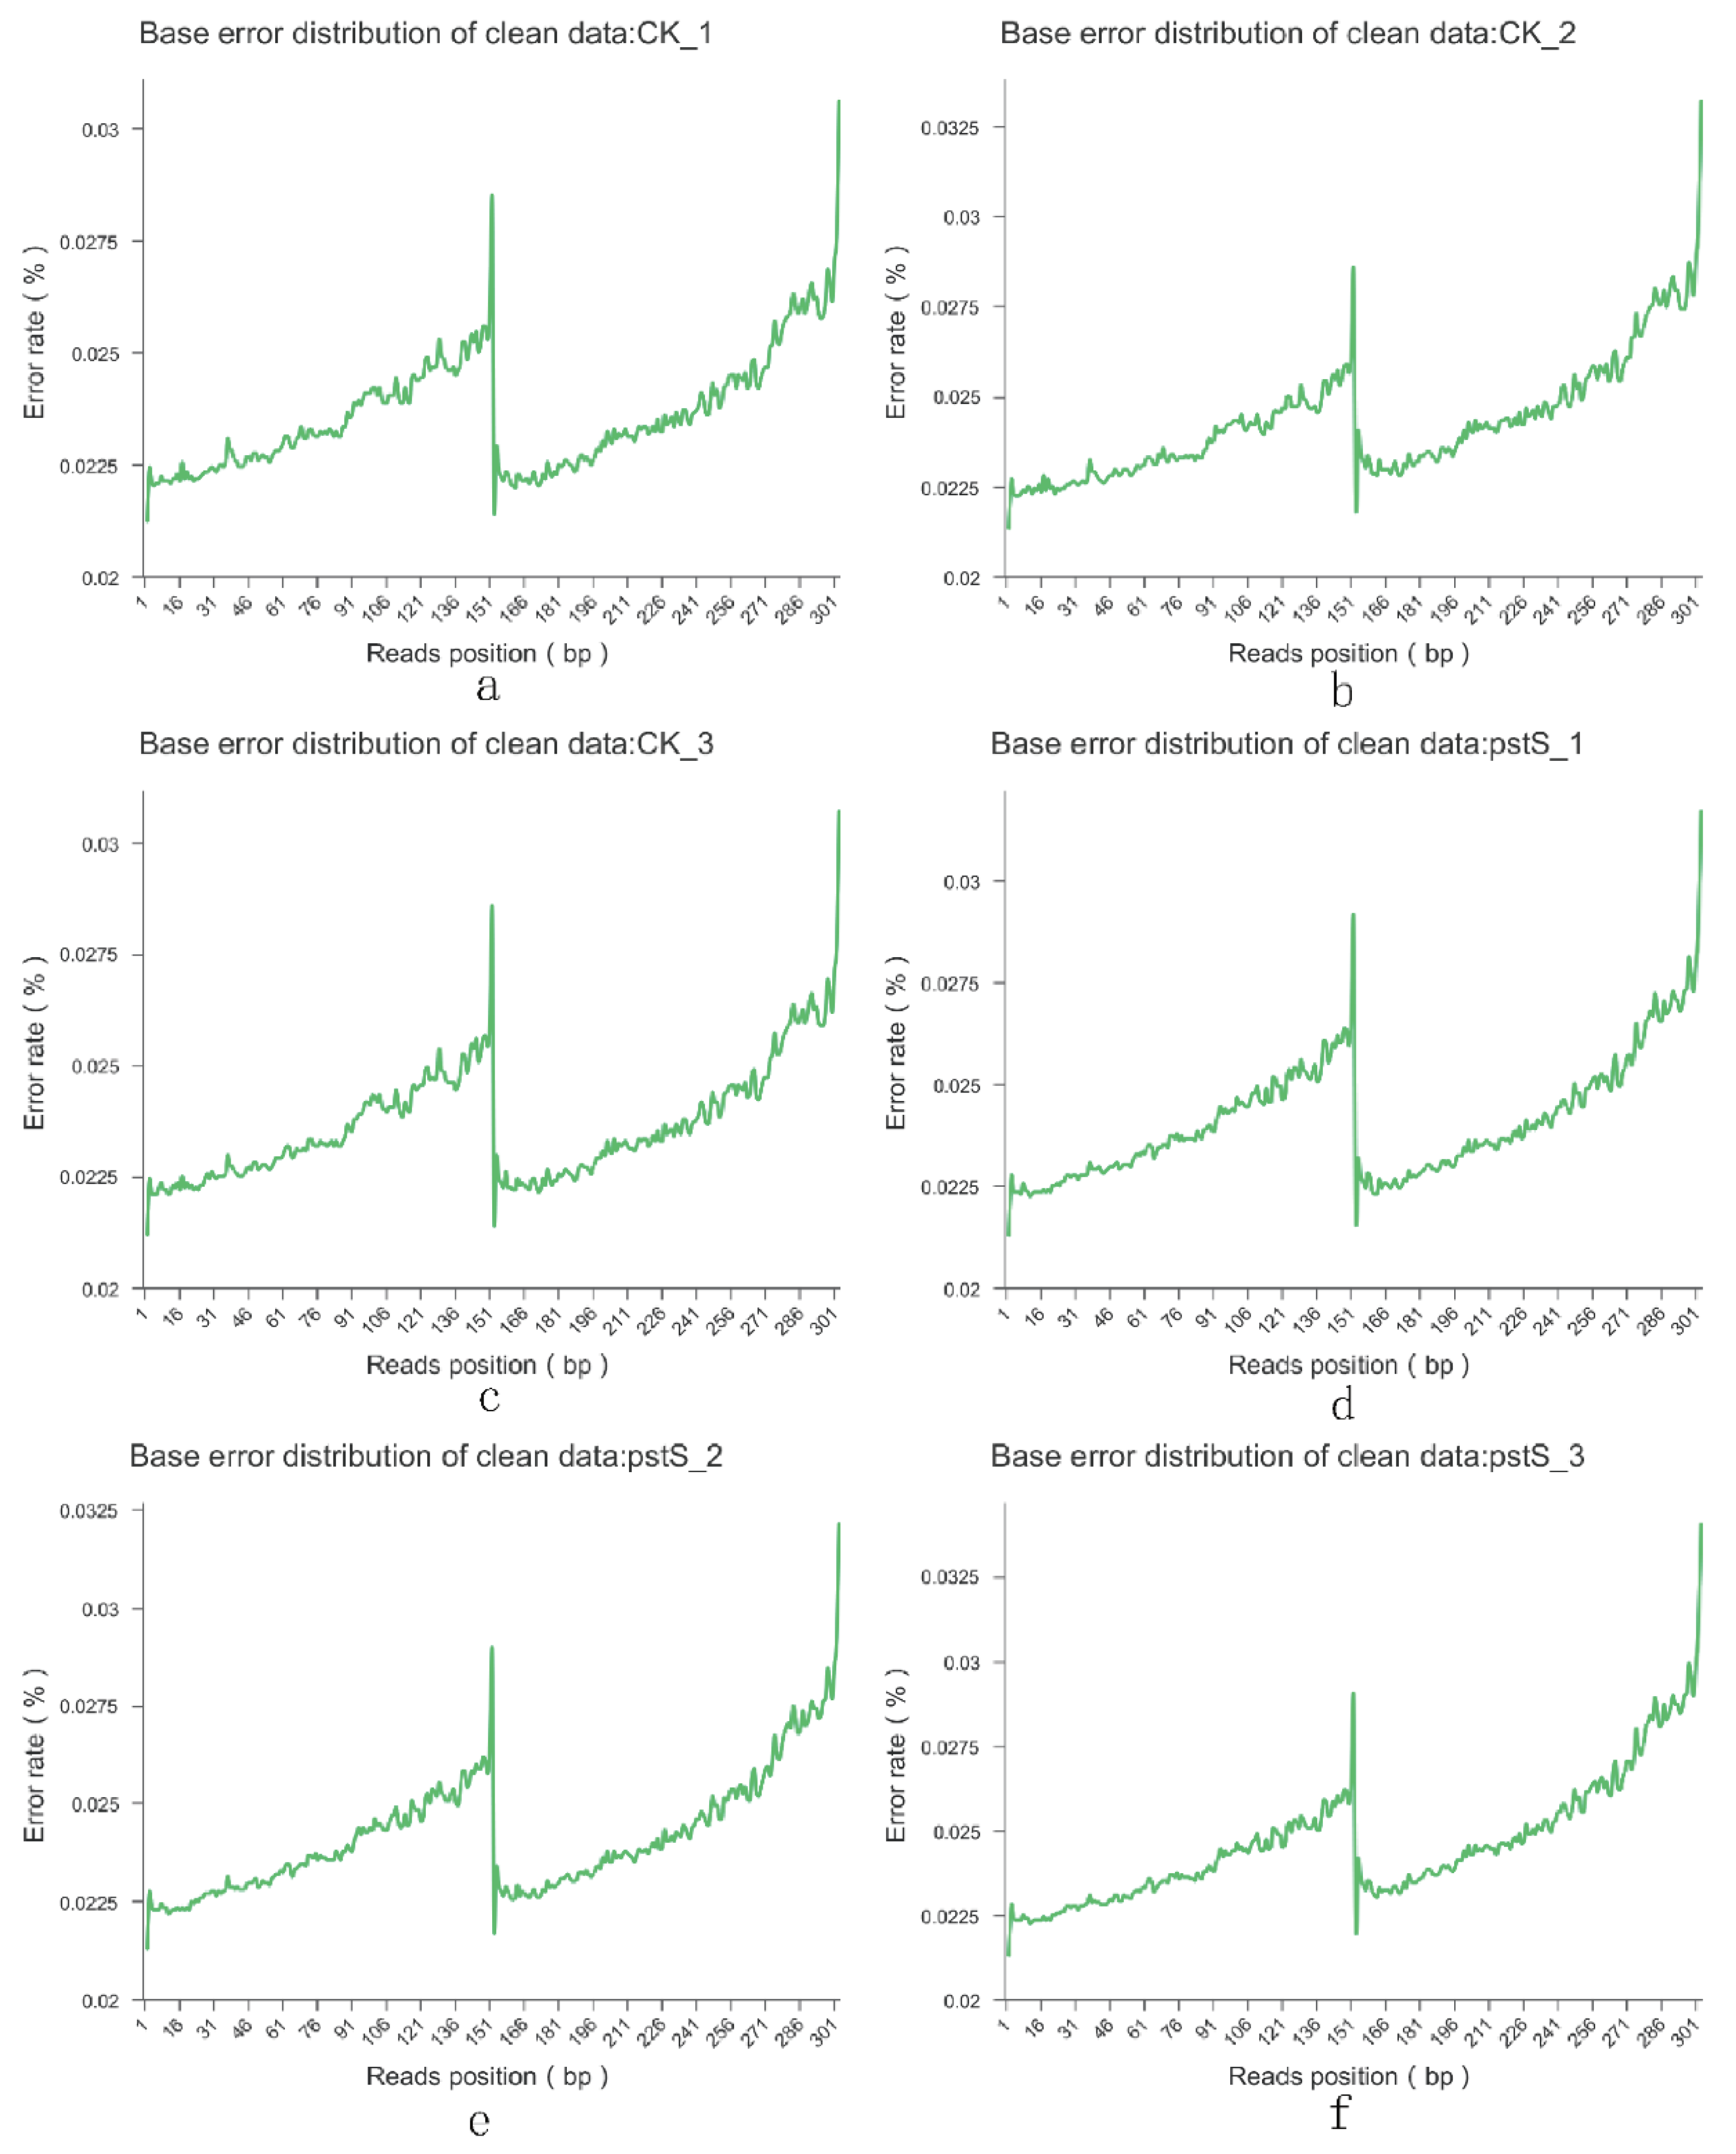
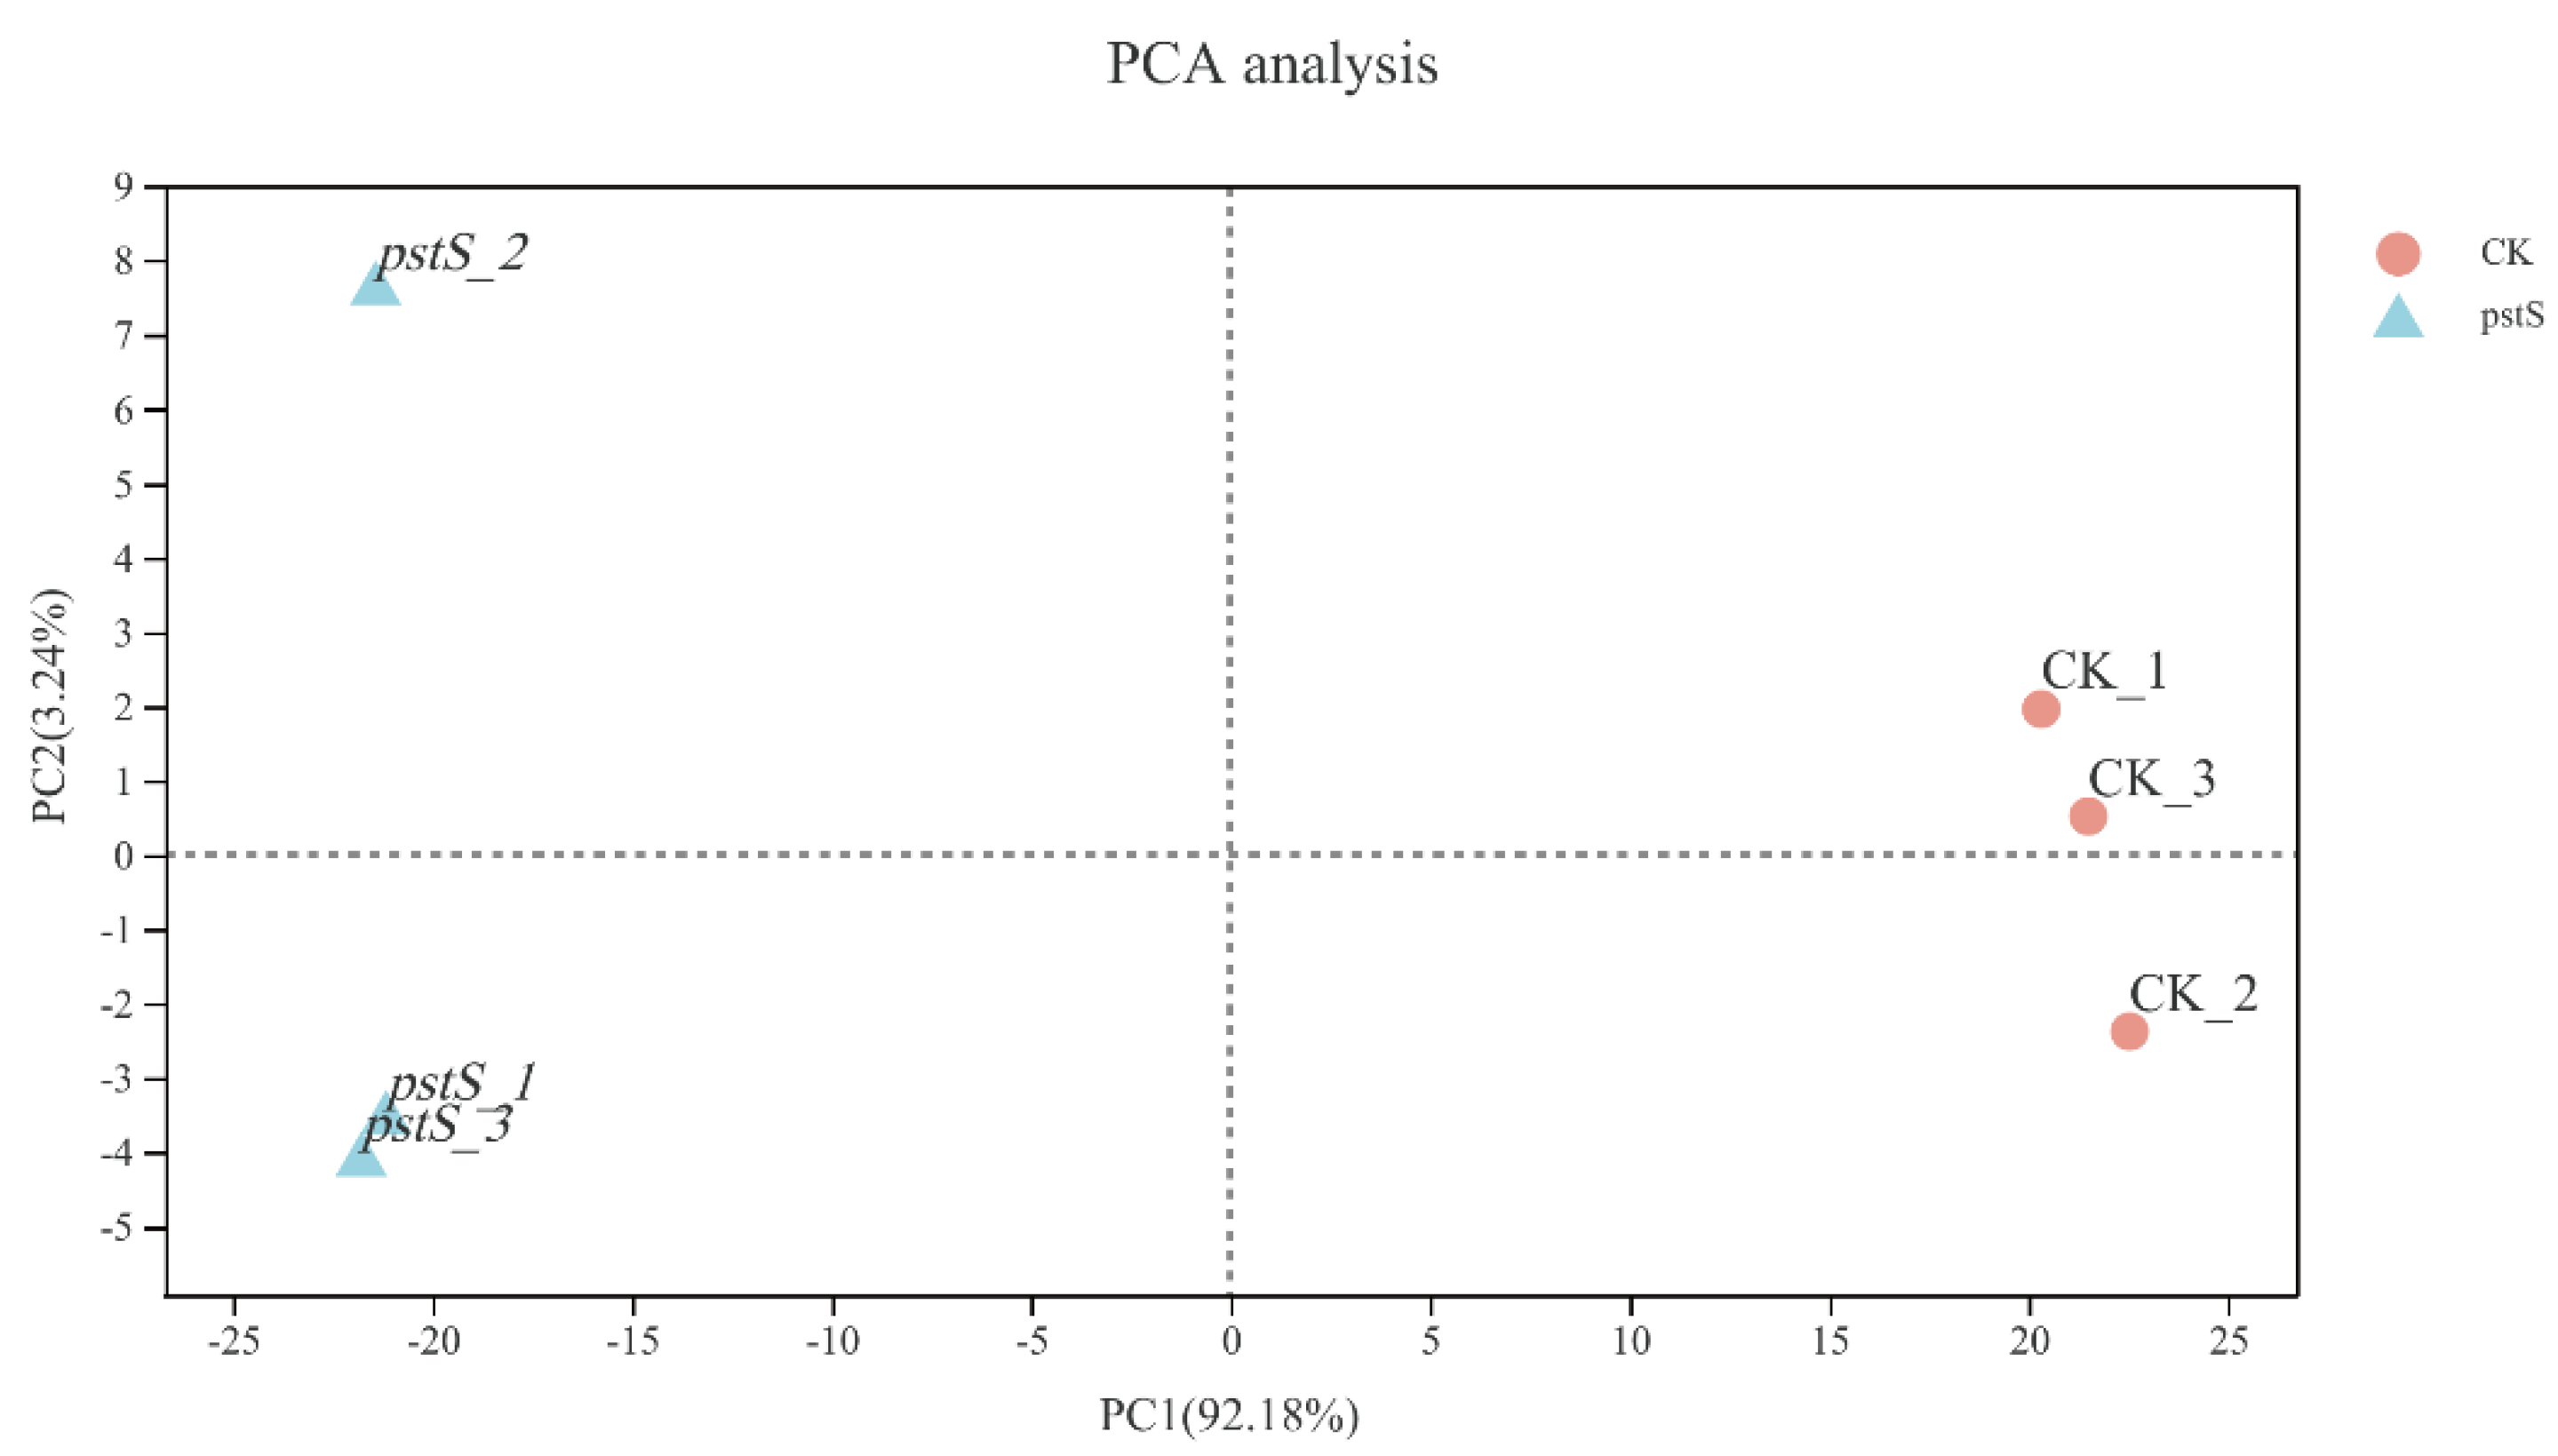
3.5. Effect of pstS Gene RANi on RNA-seq Sequence Data
4. Discussion
5. Conclusions
Author Contributions
Funding
Institutional Review Board Statement
Informed Consent Statement
Data Availability Statement
Conflicts of Interest
Appendix A


References
- Reilly, G.D.; Reilly, C.A.; Smith, E.G.; Baker-Austin, C. Vibrio alginolyticus-associated wound infection acquired in British waters, Guernsey, July 2011. Eurosurveillance 2011, 16, 19994. [Google Scholar] [CrossRef] [PubMed]
- Xie, J.; Bu, L.; Jin, S.; Wang, X.; Zhao, Q.; Zhou, S.; Xu, Y. Outbreak of vibriosis caused by Vibrio harveyi and Vibrio alginolyticus in farmed seahorse Hippocampus kuda in China. Aquaculture 2020, 523, 735168. [Google Scholar] [CrossRef]
- Darwinata, A.E.; Gotoh, K.; Mima, T.; Yamamoto, Y.; Yokota, K.; Matsushita, O. Vibrio alginolyticus VepA Induces Lysosomal Membrane Permeability and Cathepsin-Independent Cell Death. Acta Med. Okayama 2018, 72, 231–239. [Google Scholar] [PubMed]
- Duan, Q.; Zhou, M.; Zhu, L.; Zhu, G. Flagella and bacterial pathogenicity. J. Basic Microbiol. 2013, 53, 1–8. [Google Scholar] [CrossRef] [PubMed]
- Kopustinskiene, D.M.; Bernatoniene, J. Antioxidant effects of Schisandra chinensis fruits and their active constituents. Antioxidants 2021, 10, 620. [Google Scholar] [CrossRef]
- Yi, H.; Chen, Y.; Liu, J.; Zhang, J.; Guo, W.; Xiao, W.; Yao, Y. Extraction and separation of active ingredients in Schisandra chinensis (Turcz.) Baill and the study of their antifungal effects. PLoS ONE 2016, 11, e0154731. [Google Scholar]
- Huang, L.X.; Xu, X.J.; Ma, Y.F.; Li, H.Y.; Qi, X.; Chen, Y.N.; LÜ, H.L.; Yan, Q.P. In vitro bacteriostasis of 49 kinds of Chinese herbs, antibiotics and their compound prescriptions against Vibrio alginolyticus. J. Guangdong Ocean. Univ. 2019, 39, 30–38. [Google Scholar]
- Awad, E.; Awaad, A. Role of medicinal plants on growth performance and immune status in fish. Fish Shellfish Immunol. 2017, 67, 40–54. [Google Scholar] [CrossRef]
- Chekabab, S.M.; Harel, J.; Dozois, C.M. Interplay between genetic regulation of phosphate homeostasis and bacterial virulence. Virulence 2014, 5, 786–793. [Google Scholar] [CrossRef] [Green Version]
- Gil-Marqués, M.L.; Labrador Herrera, G.; Miró Canturri, A.; Pachón, J.; Smani, Y.; Pachón-Ibáñez, M.E. Role of PstS in the pathogenesis of Acinetobacter baumannii under microaerobiosis and normoxia. J. Infect. Dis. 2020, 222, 1204–1212. [Google Scholar] [CrossRef]
- Rao, P.S.S.; Lim, T.M.; Leung, K.Y. Functional Genomics Approach to the Identification of Virulence Genes Involved in Edwardsiella tarda Pathogenesis. Infect. Immun. 2003, 71, 1343–1351. [Google Scholar]
- Dewalt, B.R.; Vergne, P.; Hardin, M. Shrimp aquaculture development and the environment: People, mangroves and fisheries on the Gulf of Fonseca, Honduras. World Dev. 1996, 24, 1193–1208. [Google Scholar] [CrossRef]
- Guo, L.; Huang, L.; Su, Y.; Qin, Y.; Zhao, L.; Yan, Q. secA, secD, secF, yajC, and yidC contribute to the adhesion regulation of Vibrio alginolyticus. MicrobiologyOpen 2018, 7, e00551. [Google Scholar] [CrossRef]
- Huang, L.; Wang, L.; Lin, X.; Su, Y.; Qin, Y.; Kong, W.; Zhao, L.; Xu, X.; Yan, Q. mcp, aer, cheB, and cheV contribute to the regulation of Vibrio alginolyticus (ND-01) adhesion under gradients of environmental factors. MicrobiologyOpen 2017, 6, e00517. [Google Scholar] [CrossRef]
- Liu, W.; Huang, L.; Su, Y.; Qin, Y.; Zhao, L.; Yan, Q. Contributions of the oligopeptide permeases in multistep of Vibrio alginolyticus pathogenesis. MicrobiologyOpen 2017, 6, e00511. [Google Scholar] [CrossRef]
- Luo, G.; Xu, X.; Zhao, L.; Qin, Y.; Huang, L.; Su, Y.; Yan, Q. clpV is a key virulence gene during in vivo Pseudomonas plecoglossicida infection. J. Fish Dis. 2019, 42, 991–1000. [Google Scholar] [CrossRef]
- Huang, L.; Zhao, L.; Liu, W.; Xu, X.; Su, Y.; Qin, Y.; Yan, Q. Dual RNA-Seq unveils Pseudomonas plecoglossicida htpG gene functions during host-pathogen interactions with Epinephelus coioides. Front. Immunol. 2019, 10, 984. [Google Scholar] [CrossRef]
- Rodriguez, F.; Rouse, S.L.; Tait, C.E.; Harmer, J.; De Riso, A.; Timmel, C.R.; Sansom, M.S.; Berks, B.C.; Schnell, J.R. Structural model for the protein-translocating element of the twin-arginine transport system. Proc. Natl. Acad. Sci. USA 2013, 110, E1092–E1101. [Google Scholar] [CrossRef] [Green Version]
- He, R.; Wang, J.; Lin, M.; Tian, J.; Wu, B.; Tan, X.; Zhou, J.; Zhang, J.; Yan, Q.; Huang, L. Effect of Ferredoxin Receptor FusA on the Virulence Mechanism of Pseudomonas plecoglossicida. Front. Cell. Infect. Microbiol. 2022, 12, 255. [Google Scholar] [CrossRef]
- Zhang, B.; Luo, G.; Zhao, L.; Huang, L.; Qin, Y.; Su, Y.; Yan, Q. Integration of RNAi and RNA-seq uncovers the immune responses of Epinephelus coioides to L321_RS19110 gene of Pseudomonas plecoglossicida. Fish Shellfish Immunol. 2018, 81, 121–129. [Google Scholar] [CrossRef]
- Song, H.-C.; Kang, Y.-H.; Zhang, D.-X.; Chen, L.; Qian, A.-D.; Shan, X.-F.; Li, Y. Great effect of porin (aha) in bacterial adhesion and virulence regulation in Aeromonas veronii. Microb. Pathog. 2019, 126, 269–278. [Google Scholar] [CrossRef] [PubMed]
- Huang, L.; Liu, W.; Jiang, Q.; Zuo, Y.; Su, Y.; Zhao, L.; Qin, Y.; Yan, Q. Integration of transcriptomic and proteomic approaches reveals the temperature-dependent virulence of Pseudomonas plecoglossicida. Front. Cell. Infect. Microbiol. 2018, 8, 207. [Google Scholar] [CrossRef] [PubMed] [Green Version]
- Luo, G.; Huang, L.; Su, Y.; Qin, Y.; Xu, X.; Zhao, L.; Yan, Q. flrA, flrB and flrC regulate adhesion by controlling the expression of critical virulence genes in Vibrio alginolyticus. Emerg. Microbes Infect. 2016, 5, 1–11. [Google Scholar] [CrossRef] [PubMed]
- Zhang, Z.; Mao, L.; Qin, Y.; Zhao, L.; Huang, L.; Xu, X.; Yan, Q. Comparative transcriptome analysis revealed the role and mechanism of a FeoC-like LuxR-type regulator in intracellular survival of Aeromonas hydrophila. Aquaculture 2022, 556, 738287. [Google Scholar] [CrossRef]
- Xiao, W.; Wang, X.; Jiang, Y.; Sun, M.; Chang, Y.; Qu, Y.; Yao, X.; Jing, M.; Xu, Q. Characteristics of plasmids in KPC-2-producing Serratia marcescens. Chin. J. Microbiol. Immunol. 2020, 12, 757–762. [Google Scholar]
- Abedulhussein, T.M.; Saadedin, M.; Karkosh, A.S.A.; Almaali, H.M.A.; Sattar, R.J. In silico Designing of Biofilm-associated Protein (Bap) producing of Acinetobacter baumannii. Int. J. Nat. Eng. Sci. 2019, 13, 79–82. [Google Scholar]
- Le, H.; LiHua, D.; JianJun, F.; Peng, L.; SongLin, G. Immunogenicity study of an expressed outer membrane protein U of Vibrio vulnificus in Japanese eel (Anguilla japonica). J. Appl. Microbiol. 2018, 125, 1642–1654. [Google Scholar] [CrossRef]
- Xin, G.; Wang, F.; Zhao, L.; Qin, Y.; Huang, L.; Yan, Q. Integration of RNA-seq and RNAi provides a novel insight into the effect of pvdE gene to the pathogenic of Pseudomonas plecoglossicida and on the immune responses of orange-spotted grouper (Epinephelus coioides). Aquaculture 2020, 529, 735695. [Google Scholar] [CrossRef]
- Cai, S.; Cheng, H.; Pang, H.; Lu, Y.; Jian, J. Role of the toxR Gene from Fish Pathogen Vibiro alginolyticus in the Physiology and Virulence. Indian J. Microbiol. 2017, 57, 477–484. [Google Scholar] [CrossRef]
- Hori, K.; Matsumoto, S. Bacterial adhesion: From mechanism to control. Biochem. Eng. J. 2010, 48, 424–434. [Google Scholar] [CrossRef]
- Esparza, M.; Palomares, B.; García, T.; Espinosa, P.; Zenteno, E.; Mancilla, R. PstS-1, the 38-kDa Mycobacterium tuberculosis Glycoprotein, is an Adhesin, Which Binds the Macrophage Mannose Receptor and Promotes Phagocytosis. Scand. J. Immunol. 2015, 81, 46–55. [Google Scholar] [CrossRef]
- Ferreira, G.M.; Spira, B. The pst operon of enteropathogenic Escherichia coli enhances bacterial adherence to epithelial cells. Microbiology 2008, 154, 2025–2036. [Google Scholar] [CrossRef] [Green Version]
- Huang, L.; Huang, L.; Zhao, L.; Qin, Y.; Su, Y.; Yan, Q. The regulation of oxidative phosphorylation pathway on Vibrio alginolyticus adhesion under adversities. MicrobiologyOpen 2019, 8, e00805. [Google Scholar] [CrossRef] [Green Version]
- Mudrak, B.; Tamayo, R. The Vibrio cholerae Pst2 Phosphate Transport System Is Upregulated in Biofilms and Contributes to Biofilm-Induced Hyperinfectivity. Infect. Immun. 2012, 80, 1794–1802. [Google Scholar] [CrossRef] [Green Version]
- Neznansky, A.; Blus-Kadosh, I.; Yerushalmi, G.; Banin, E.; Opatowsky, Y. The Pseudomonas aeruginosa phosphate transport protein PstS plays a phosphate-independent role in biofilm formation. FASEB J. 2014, 28, 5223–5233. [Google Scholar] [CrossRef]
- Blus-Kadosh, I.; Zilka, A.; Yerushalmi, G.; Banin, E. The effect of pstS and phoB on quorum sensing and swarming motility in Pseudomonas aeruginosa. PLoS ONE 2013, 8, e74444. [Google Scholar] [CrossRef]
- Xue, C. Macroscopic equations for bacterial chemotaxis: Integration of detailed biochemistry of cell signaling. J. Math. Biol. 2015, 70, 1–44. [Google Scholar] [CrossRef]
- Rico-Jiménez, M.; Reyes-Darias, J.A.; Ortega, Á.; Díez Peña, A.I.; Morel, B.; Krell, T. Two different mechanisms mediate chemotaxis to inorganic phosphate in Pseudomonas aeruginosa. Sci. Rep. 2016, 6, 28967. [Google Scholar] [CrossRef]
- Trapnell, C.; Roberts, A.; Goff, L.; Pertea, G.; Kim, D.; Kelley, D.R.; Pimentel, H.; Salzberg, S.L.; Rinn, J.L.; Pachter, L. Differential gene and transcript expression analysis of RNA-seq experiments with TopHat and Cufflinks. Nat. Protoc. 2012, 7, 562–578. [Google Scholar] [CrossRef] [Green Version]
- Linares, D.; Jean, N.; Van Overtvelt, P.; Ouidir, T.; Hardouin, J.; Blache, Y.; Molmeret, M. The marine bacteria Shewanella frigidimarina NCIMB400 upregulates the type VI secretion system during early biofilm formation. Environ. Microbiol. Rep. 2016, 8, 110–121. [Google Scholar] [CrossRef]
- Tang, Y.; Sun, Y.; Zhao, L.; Xu, X.; Huang, L.; Qin, Y.; Su, Y.; Yi, G.; Yan, Q. Mechanistic insight into the roles of Pseudomonas plecoglossicida clpV gene in host-pathogen interactions with Larimichthys crocea by dual RNA-seq. Fish Shellfish Immunol. 2019, 93, 344–353. [Google Scholar] [CrossRef] [PubMed]
- Xu, X.; Li, H.; Qi, X.; Chen, Y.; Qin, Y.; Zheng, J.; Jiang, X. cheA, cheB, cheR, cheV, and cheY are involved in regulating the adhesion of Vibrio harveyi. Front. Cell. Infect. Microbiol. 2021, 10, 591751. [Google Scholar] [CrossRef] [PubMed]
- Lamarche, M.G.; Wanner, B.L.; Crépin, S.; Harel, J. The phosphate regulon and bacterial virulence: A regulatory network connecting phosphate homeostasis and pathogenesis. FEMS Microbiol. Rev. 2008, 32, 461–473. [Google Scholar] [CrossRef] [PubMed] [Green Version]
- Kong, W.; Huang, L.; Su, Y.; Qin, Y.; Ma, Y.; Xu, X.; Lin, M.; Zheng, J.; Yan, Q. Investigation of possible molecular mechanisms underlying the regulation of adhesion in Vibrio alginolyticus with comparative transcriptome analysis. Antonie Van Leeuwenhoek 2015, 107, 1197–1206. [Google Scholar] [CrossRef] [Green Version]
- Cianciotto, N.P.; White, R.C. Expanding Role of Type II Secretion in Bacterial Pathogenesis and Beyond. Infect. Immun. 2017, 85, e00014-17. [Google Scholar] [CrossRef]


| shRNA | Sequences (5′–3′) |
|---|---|
| R:5′ -CAAAAAAGCACAGTTAAGTGGTTCAACGTCTCTTGAACGTTGAACCACTTAACTGTGCG-3′ | |
| ShRNA-pstS217 | F:5′ -GATCCGCAGACCTTGGTATGTCTTCTTTCAAGAGAAGAAGACATACCAAGGTCTGCTTTTTTGCATG-3′ |
| R:5′ -CAAAAAAGCAGACCTTGGTATGTCTTCTTCTCTTGAAAGAAGACATACCAAGGTCTGCG-3′ | |
| ShRNA-pstS571 | F:5′ -GATCCGCATCTAACCCATACGCAATCTTCAAGAGAGATTGCGTATGGGTTAGATGCTTTTTTGCATG-3′ |
| R:5′ -CAAAAAAGCATCTAACCCATACGCAATCTCTCTTGAAGATT GCGTATGGGTTAGATGCG-3′ | |
| ShRNA-pstB33 | F:5′ -GATCCGCCACCATTGGACGTTCATAATTCAAGAGATTATGAACGTCCAATGGTGGCTTTTTTGCATG-3′ |
| R:5′ -CAAAAAAGCCACCATTGGACGTTCATAATCTCTTGAATTATGAACGTCCAATGGTGGCG-3′ | |
| ShRNA-pstB216 | F:5′ -GATCCGCGTCTACATGGCAAGAATGTTTCAAGAGAACATTCTTGCCATGTAGACGCTTTTTTGCATG-3′ |
| R:5′ -CAAAAAAGCGTCTACATGGCAAGAATGTTCTCTTGAAACATTCTTGCCATGTAGACGCG-3′ |
| Target Gene | Primers Sequence for Gene Overexpression |
|---|---|
| 16S-R | 5′-CCTACGGGAGGCAGCAG-3′ |
| 16S-F | 5′-ATTACCGCGGCTGCTGG-3′ |
| pstS-R | 5′-GAAATGTAGCCGATTGCGTAT-3′ |
| pstS-F | 5′-AGGCGAAGTATCAAACTGGAA-3′ |
| pstB-R | 5′-TGACTCGACACCCTTCCACTA-3′ |
| pstB-F | 5′-AACGGATGAACAAACAGCAAT-3′ |
| Primer Name | Sequences (5′–3′) |
|---|---|
| trxC-R | 5′-AAGTGATACGCCTGTTGTCG-3′ |
| trxC-F | 5′-CCATGATGGTCGGAATGCT-3′ |
| frdC-R | 5′-CATCCTTTCTACCGCTTCT-3′ |
| frdC-F | 5′-ATGTTGATTGCGACTACGA-3′ |
| napA-R | 5′-AGCAATACGCCAATCCAAAT-3′ |
| napA-F | 5′-TGGTTGACCCGTTAGTGAGA-3′ |
| glpD-R | 5′-AGCGGTGTTCGTCCTTTAT-3′ |
| glpD-F | 5′-CGTCCAGTCTTTACCCATTT-3′ |
| typA-R | 5′-GGCACAGTAATGGGCTACCT-3′ |
| typA-F | 5′-CCTTCTTTACCAGCGAATGG-3′ |
| pckA-R | 5′-CGTAGCGGTATTCTTTGGTC-3′ |
| pckA-F | 5′-GCTTCTTTCGATAGCTTGATG-3′ |
| rpsT-F | 5′-TGAGAAACGTCGTCAGCACA-3′ |
| rpsT-R | 5′-CAGCGAAACGAGACTTATGG-3′ |
| nrfC-R | 5′-TAAATAAAGTCCCTGAAGGC-3′ |
| nrfC-F | 5′-CAGCAAGGCAATAACCAC-3′ |
| nirD-R | 5′-TGTCGCGTTATTCTACATTCC-3′ |
| nirD-F | 5′-TCTTCCAAACACTGCCCACT-3′ |
| cysI-R | 5′-TCAGTGAACACCTGCTTCC-3′ |
| cysI-F | 5′-AACCAACTTGCCGTTATCC-3′ |
| rpmB-R | 5′-AAGCGTCCAGTAACGGGTAA-3′ |
| rpmB-F | 5′-CACGCATGTCTGCAAGAACA-3′ |
| sucD-R | 5′-CAATCCCAGGTTCAAACTTCA-3′ |
| sucD-F | 5′-ATACGTTTACCAGGAGGAGCA-3′ |
| nspC-R | 5′-GAGAAACACGGCGTACAAAT-3′ |
| nspC-F | 5′-AAACAAGAGCACGATCCAAT-3′ |
| flgF-R | 5′-ACCAACTCTGCCTCAACGC-3′ |
| flgF-F | 5′-CCAAGAACAGGGAAACCATT-3′ |
| focA-R | 5′-TGTTCGTGTCGGCAGGTT-3′ |
| focA-F | 5′-ACCGCCACCAATGATGTT-3′ |
| cysN-R | 5′-CGTTAATCGTCCTAACCTCG-3′ |
| cysN-F | 5′-TCATCGCTTAGCGTCAGAGT-3′ |
| Sample | Clean Reads Total (Article) | Clean Bases (bp) | Clean Q20 (%) |
|---|---|---|---|
| CK-1 | 31,287,296 | 4,082,632,980 | 98.8 |
| CK-2 | 27,625,534 | 3,622,870,442 | 98.53 |
| CK-3 | 32,966,152 | 4,384,526,078 | 98.77 |
| pstS-RNAi-1 | 24,686,362 | 3,446,598,515 | 98.57 |
| pstS -RNAi-2 | 32,052,740 | 4,492,123,947 | 98.54 |
| pstS -RNAi-3 | 26,844,948 | 3,765,247,071 | 98.37 |
| Sample | Clean Reads Total (Article) | Total Number of Clean Reads Aligned to the Genome (Article) | Percentage (%) |
|---|---|---|---|
| CK-1 | 31,287,296 | 30,800,326 | 98.44 |
| CK-2 | 27,625,534 | 27,002,352 | 97.74 |
| CK-3 | 32,966,152 | 32,531,309 | 98.68 |
| pstS-RNAi-1 | 24,686,362 | 23,869,166 | 96.69 |
| pstS -RNAi-2 | 32,052,740 | 30,971,033 | 96.63 |
| pstS -RNAi-3 | 26,844,948 | 25,876,114 | 96.39 |
Publisher’s Note: MDPI stays neutral with regard to jurisdictional claims in published maps and institutional affiliations. |
© 2022 by the authors. Licensee MDPI, Basel, Switzerland. This article is an open access article distributed under the terms and conditions of the Creative Commons Attribution (CC BY) license (https://creativecommons.org/licenses/by/4.0/).
Share and Cite
Yi, X.; Xu, X.; Qi, X.; Chen, Y.; Zhu, Z.; Xu, G.; Li, H.; Kraco, E.-K.; Shen, H.; Lin, M.; et al. Mechanisms Underlying the Virulence Regulation of Vibrio alginolyticus ND-01 pstS and pstB with a Transcriptomic Analysis. Microorganisms 2022, 10, 2093. https://doi.org/10.3390/microorganisms10112093
Yi X, Xu X, Qi X, Chen Y, Zhu Z, Xu G, Li H, Kraco E-K, Shen H, Lin M, et al. Mechanisms Underlying the Virulence Regulation of Vibrio alginolyticus ND-01 pstS and pstB with a Transcriptomic Analysis. Microorganisms. 2022; 10(11):2093. https://doi.org/10.3390/microorganisms10112093
Chicago/Turabian StyleYi, Xin, Xiaojin Xu, Xin Qi, Yunong Chen, Zhiqin Zhu, Genhuang Xu, Huiyao Li, Emma-Katharine Kraco, Haoyang Shen, Mao Lin, and et al. 2022. "Mechanisms Underlying the Virulence Regulation of Vibrio alginolyticus ND-01 pstS and pstB with a Transcriptomic Analysis" Microorganisms 10, no. 11: 2093. https://doi.org/10.3390/microorganisms10112093