

Malaria Detection Accelerated: Combing a High-Throughput NanoZoomer Platform with a ParasiteMacro Algorithm
 , and
, and
Abstract
:1. Introduction
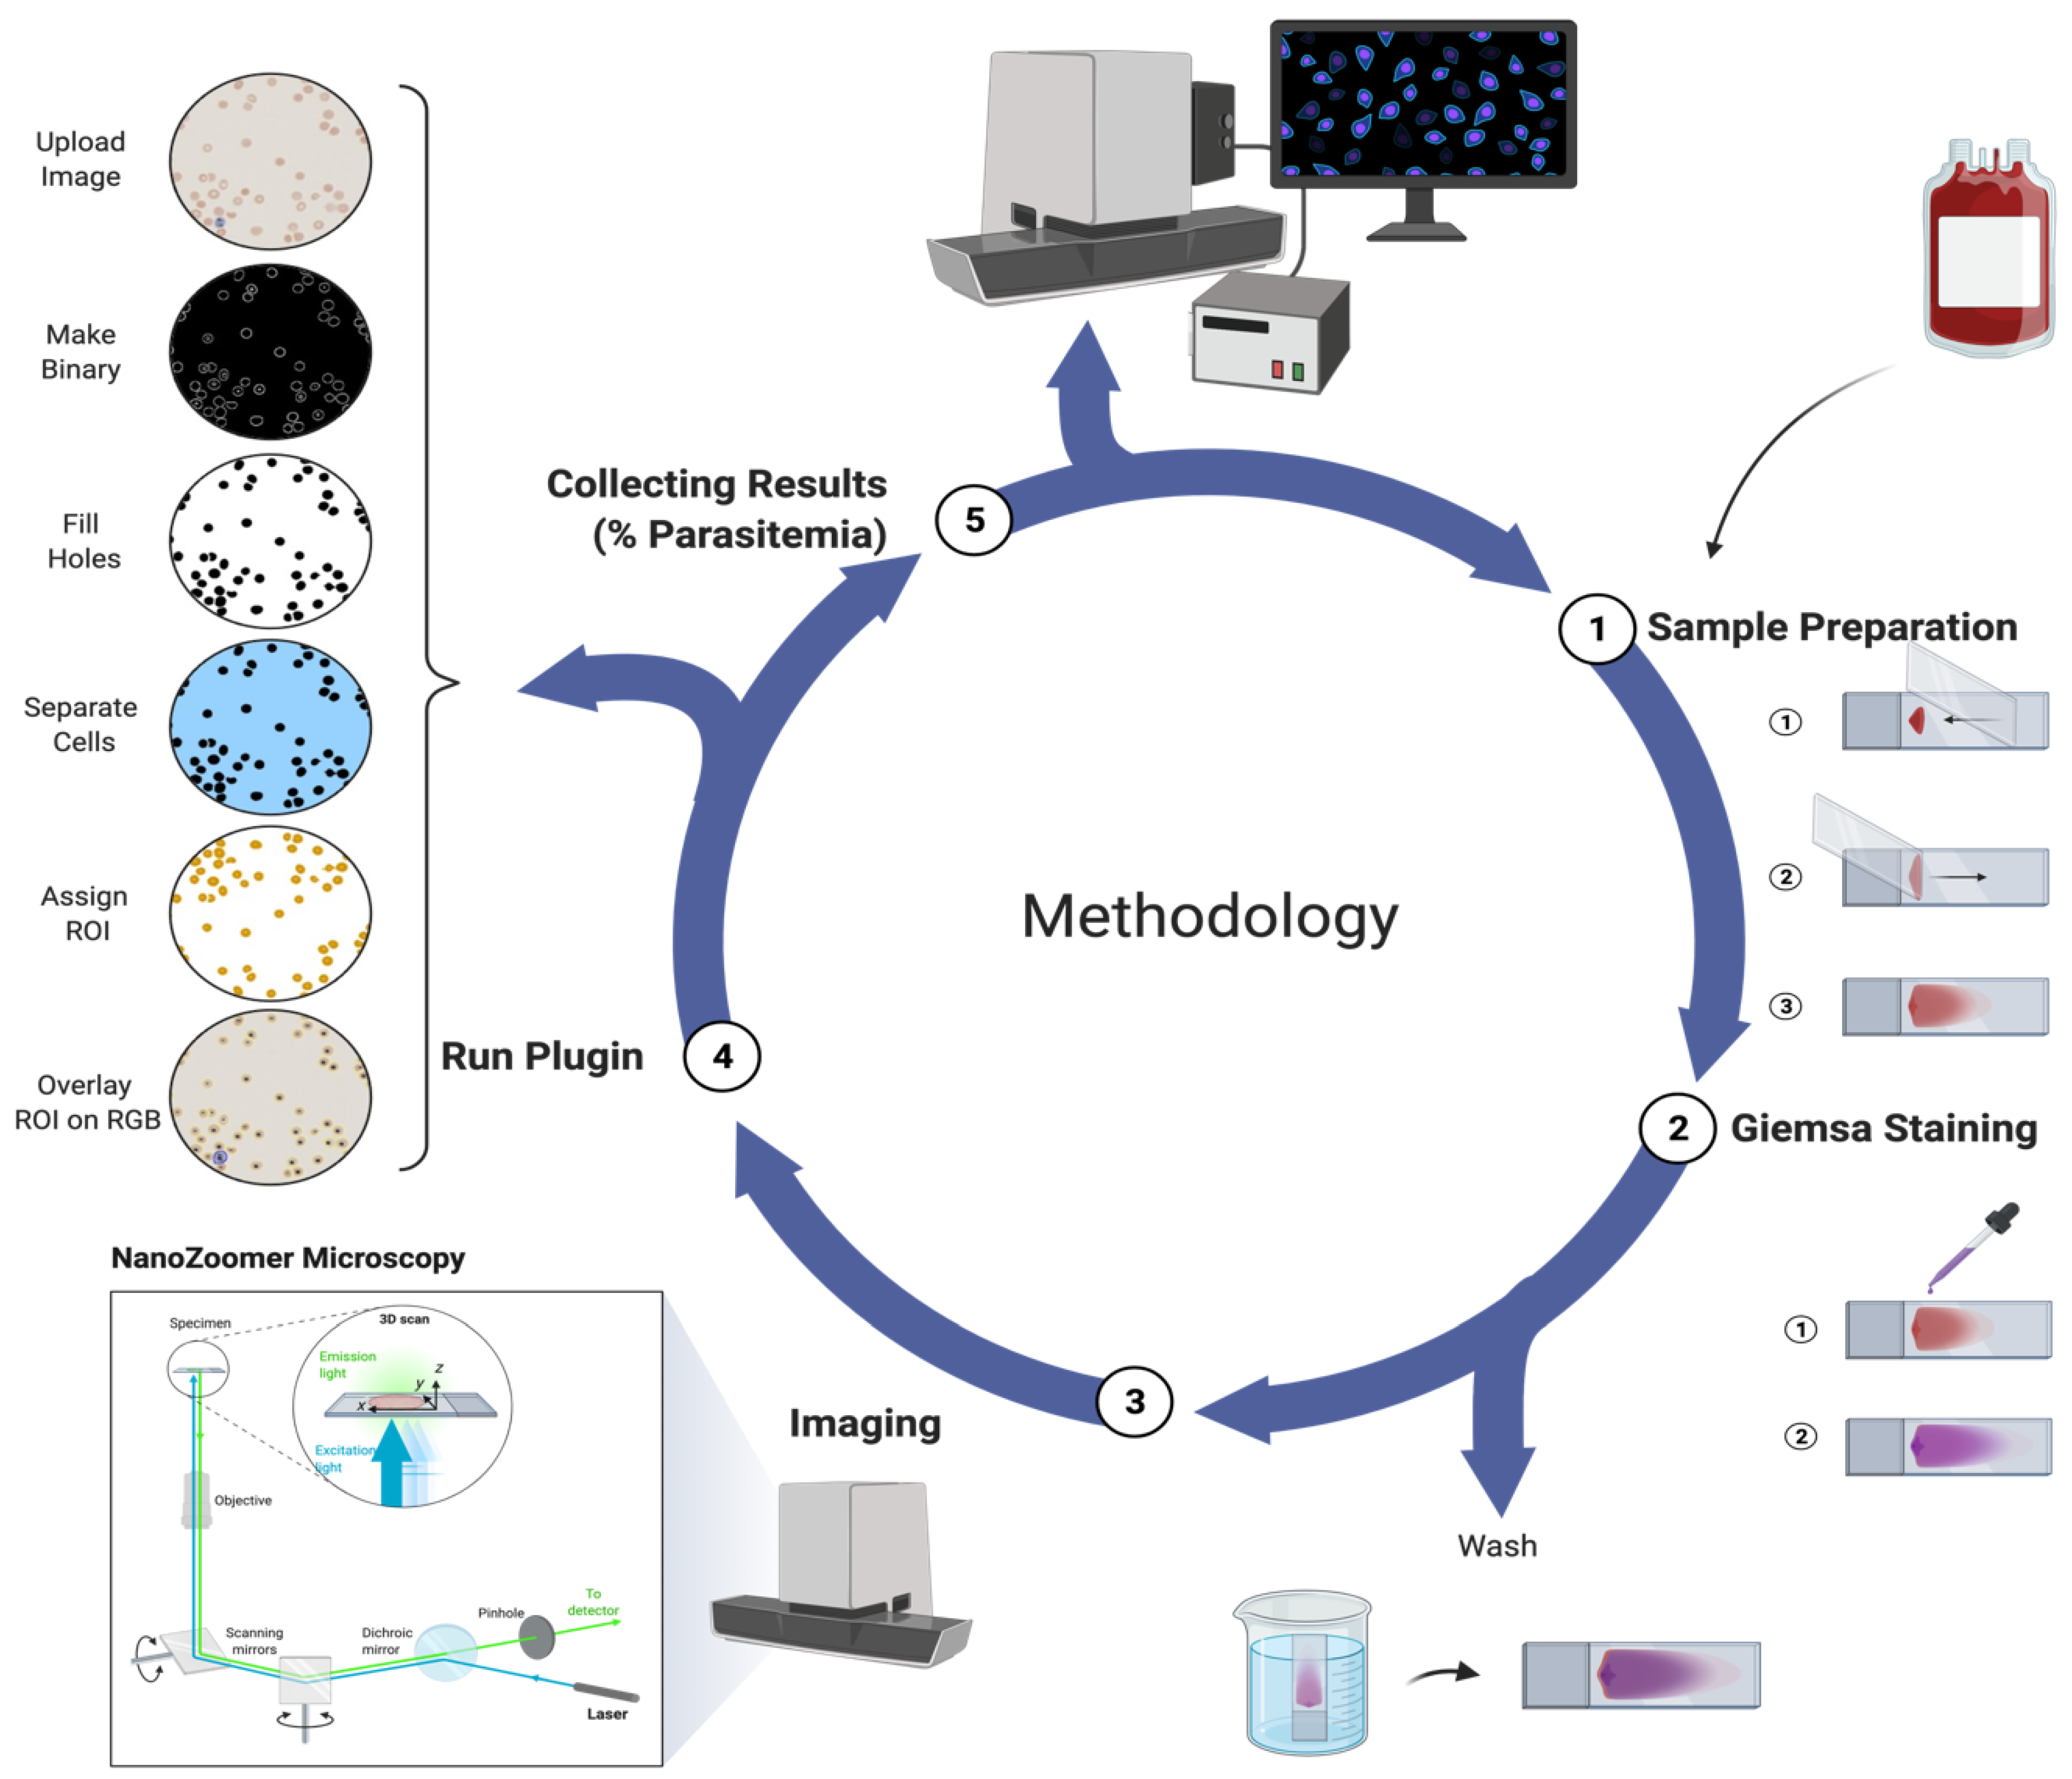
2. Methods
2.1. Parasite Culture
2.2. NanoZoomer Imaging
2.3. Proof-of-Principle Testing—Malaria Counter (ParasiteMacro)
2.3.1. ImageJ Setup
2.3.2. ImageJ Code
2.4. Statistical Analysis
3. Results
3.1. In Vitro Malaria Culture and Counting
3.2. Sensitivity, Specificity, Negative and Positive Predictive Values
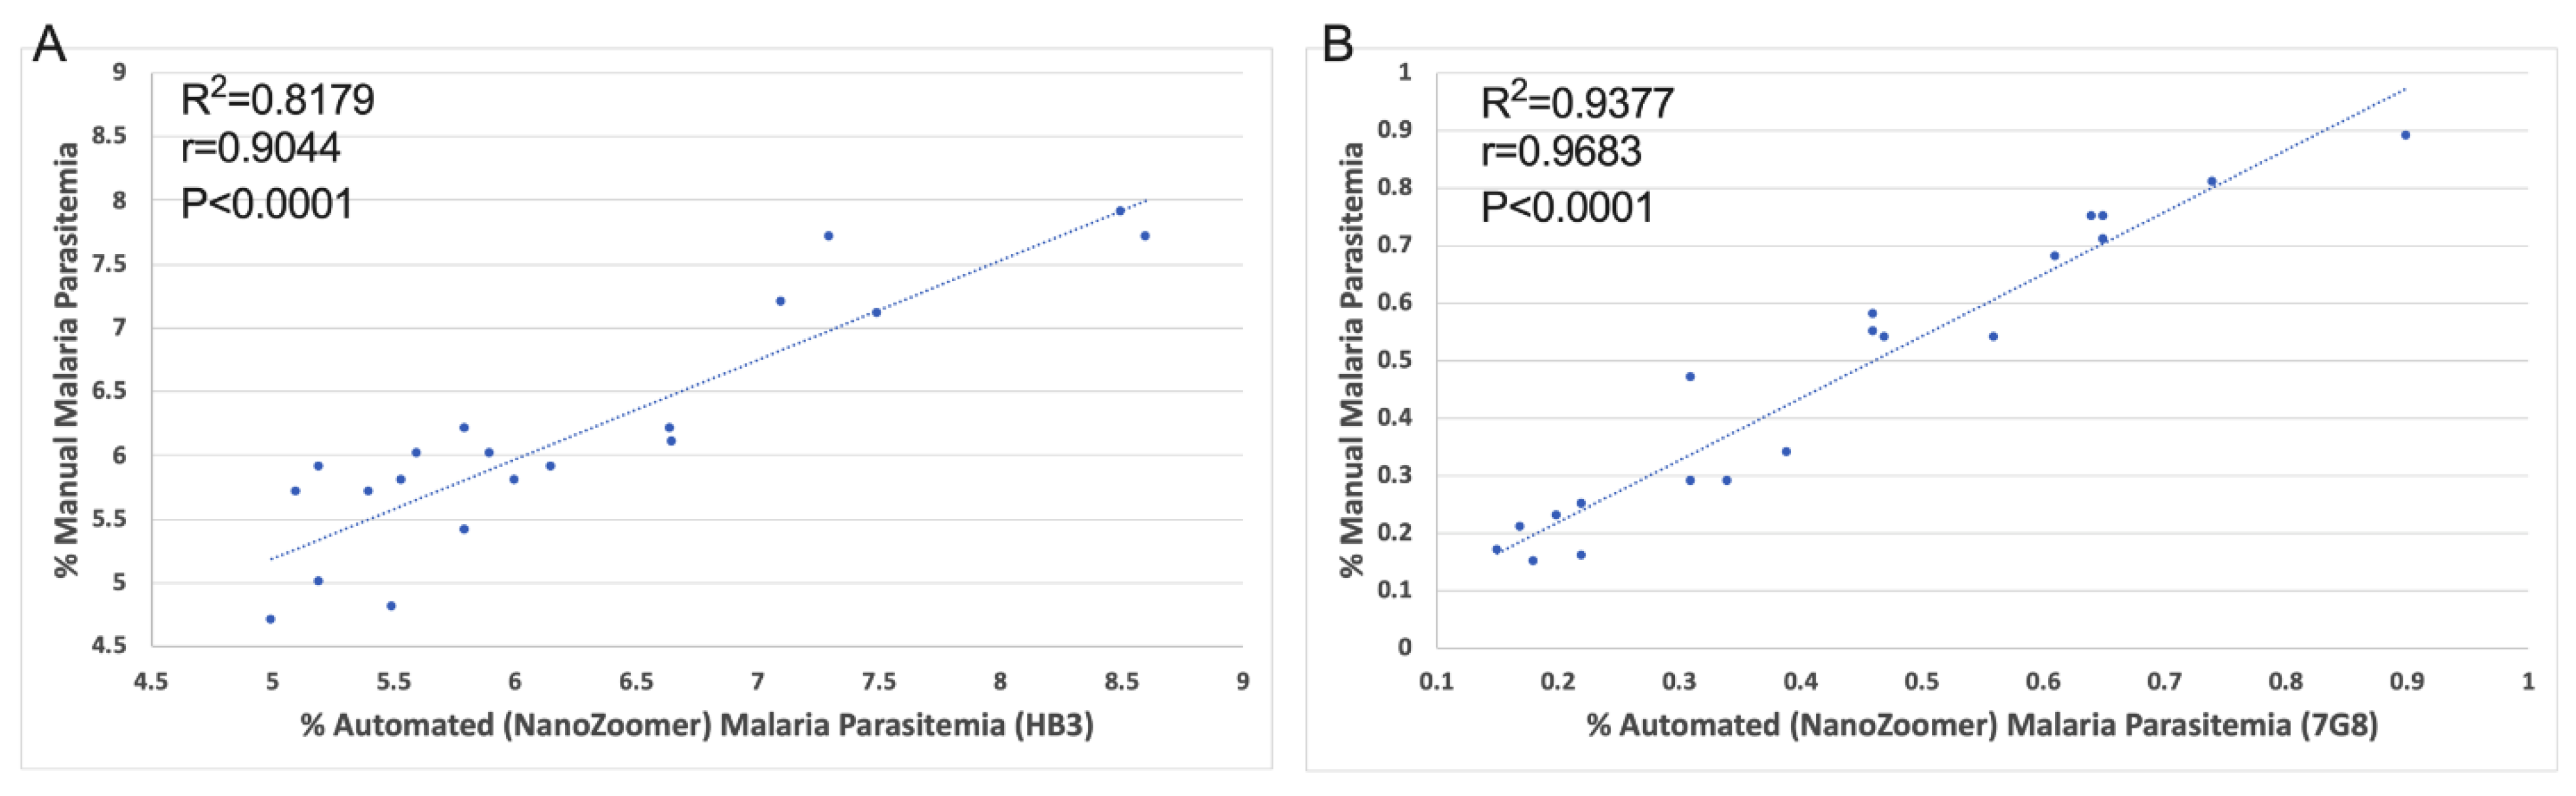
3.3. Comparison of the Automated NanoZoomer ParasiteMacro versus Manual Microscopy
3.4. Automated versus Manual Parasitemia Error Estimation
4. Discussion
5. Conclusions
Author Contributions
Funding
Data Availability Statement
Acknowledgments
Conflicts of Interest
Ethics Approval
Abbreviations
References
- Favuzza, P.; de Lera Ruiz, M.; Thompson, J.K.; Triglia, T.; Ngo, A.; Steel, R.W.; Vavrek, M.; Christensen, J.; Healer, J.; Boyce, C. Dual plasmepsin-targeting antimalarial agents disrupt multiple stages of the malaria parasite life cycle. Cell Host Microbe 2020, 27, 642–658.e12. [Google Scholar] [CrossRef] [PubMed]
- World Health Organization. Global Malaria Programme. In World Malaria Report; WHO Press: Geneva, Switzerland, 2013; pp. 11–13. [Google Scholar]
- WHO. 20 years of global progress and challenges. In World Malaria Report 2020; World Health Organization: Geneva, Switzerland, 2020; pp. 1–151. [Google Scholar]
- Schellenberg, D.; Menendez, C.; Kahigwa, E.; Font, F.; Galindo, C.; Acosta, C.; Schellenberg, J.A.; Aponte, J.J.; Kimario, J.; Urassa, H. African children with malaria in an area of intense Plasmodium falciparum transmission: Features on admission to the hospital and risk factors for death. Am. J. Trop. Med. Hyg. 1999, 61, 431–438. [Google Scholar] [CrossRef] [Green Version]
- Poostchi, M.; Silamut, K.; Maude, R.J.; Jaeger, S.; Thoma, G. Image analysis and machine learning for detecting malaria. Transl. Res. 2018, 194, 36–55. [Google Scholar] [CrossRef] [PubMed] [Green Version]
- Purwar, Y.; Shah, S.L.; Clarke, G.; Almugairi, A.; Muehlenbachs, A. Automated and unsupervised detection of malarial parasites in microscopic images. Malar. J. 2011, 10, 364. [Google Scholar] [CrossRef] [PubMed] [Green Version]
- Ashraf, S.; Agyapong, J.; Rohrbach, P.; Hasan, T. OPD (Online Plasmodium Diagnosis): An ALA-PpIX based functional assay to predict active malaria. Photodiagn. Photodyn. Ther. 2021, 36, 102510. [Google Scholar] [CrossRef] [PubMed]
- Ashraf, S.; Khalid, A.; Kuriakose, J.; Palanisami, A.; Feng, Y.; Hasan, T. REAP (Rapid Elimination of Active Plasmodium): A photodynamic strategy exploiting intrinsic kinetics of the parasite to combat severe malaria. J. Photochem. Photobiol. B Biol. 2021, 223, 112286. [Google Scholar] [CrossRef]
- Griffith, K.S.; Lewis, L.S.; Mali, S.; Parise, M.E. Treatment of malaria in the United States: A systematic review. JAMA 2007, 297, 2264–2277. [Google Scholar] [CrossRef] [Green Version]
- Gonçalves, B.P.; Huang, C.Y.; Morrison, R.; Holte, S.; Kabyemela, E.; Prevots, D.R.; Fried, M.; Duffy, P.E. Parasite burden and severity of malaria in Tanzanian children. N. Eng. J. Med. 2014, 370, 1799–1808. [Google Scholar] [CrossRef] [PubMed] [Green Version]
- Perandin, F.; Manca, N.; Calderaro, A.; Piccolo, G.; Galati, L.; Ricci, L.; Medici, M.; Arcangeletti, M.; Snounou, G.; Dettori, G. Development of a real-time PCR assay for detection of Plasmodium falciparum, Plasmodium vivax, and Plasmodium ovale for routine clinical diagnosis. J. Clin. Microbiol. 2004, 42, 1214–1219. [Google Scholar] [CrossRef] [PubMed] [Green Version]
- Tedla, M. A focus on improving molecular diagnostic approaches to malaria control and elimination in low transmission settings. Parasite Epidemiol. Control. 2019, 6, e00107. [Google Scholar] [CrossRef] [PubMed]
- Berzosa, P.; de Lucio, A.; Romay-Barja, M.; Herrador, Z.; González, V.; García, L.; Fernández-Martínez, A.; Santana-Morales, M.; Ncogo, P.; Valladares, B. Comparison of three diagnostic methods (microscopy, RDT, and PCR) for the detection of malaria parasites in representative samples from Equatorial Guinea. Malar. J. 2018, 17, 333. [Google Scholar] [CrossRef]
- Talapko, J.; Škrlec, I.; Alebić, T.; Jukić, M.; Včev, A. Malaria: The past and the present. Microorganisms 2019, 7, 179. [Google Scholar] [CrossRef] [Green Version]
- Dowling, M.A.; Shute, G.T. A comparative study of thick and thin blood films in the diagnosis of scanty malaria parasitaemia. Bull. World Health Organ. 1966, 34, 249–267. [Google Scholar] [PubMed]
- Ruas, R.; Pinto, A.; Nuak, J.; Sarmento, A.; Abreu, C. Non-falciparum malaria imported mainly from Africa: A review from a Portuguese hospital. Malar. J. 2017, 16, 298. [Google Scholar] [CrossRef] [PubMed]
- Moody, A. Rapid diagnostic tests for malaria parasites. Clin. Microbiol. Rev. 2002, 15, 66–78. [Google Scholar] [CrossRef] [Green Version]
- Wangai, L.N.; Karau, M.G.; Njiruh, P.N.; Sabah, O.; Kimani, F.T.; Magoma, G.; Kiambo, N. Sensitivity of microscopy compared to molecular diagnosis of P. falciparum: Implications on malaria treatment in epidemic areas in Kenya. Afr. J. Infect. Dis. 2011, 5, 1–6. [Google Scholar] [CrossRef] [Green Version]
- Cordray, M.S.; Richards-Kortum, R.R. Emerging nucleic acid–based tests for point-of-care detection of malaria. Am. J. Trop. Med. Hyg. 2012, 87, 223–230. [Google Scholar] [CrossRef] [PubMed] [Green Version]
- Wahab, A.; Shaukat, A.; Ali, Q.; Hussain, M.; Khan, T.A.; Khan, M.A.U.; Rashid, I.; Saleem, M.A.; Evans, M.; Sargison, N.D. A novel metabarcoded 18S ribosomal DNA sequencing tool for the detection of Plasmodium species in malaria positive patients. Infect. Genet. Evol. 2020, 82, 104305. [Google Scholar] [CrossRef] [PubMed]
- Jelinek, T.; Proll, S.; Hess, F.; Kabagambe, G.; Von Sonnenburg, F.; Loscher, T.; Kilian, A. Geographic differences in the sensitivity of a polymerase chain reaction for the detection of Plasmodium falciparum infection. Am. J. Trop. Med. Hyg. 1996, 55, 647–651. [Google Scholar] [CrossRef]
- Genis, M.Y.; Remez, A.I.; Untesco, M.I.; Zhakota, D.A. Testing of actual scanner performance in a high-loaded UNIM laboratory environment. J. Pathol. Inform. 2021, 12, 39. [Google Scholar] [CrossRef] [PubMed]
- Eshel, Y.; Houri-Yafin, A.; Benkuzari, H.; Lezmy, N.; Soni, M.; Charles, M.; Swaminathan, J.; Solomon, H.; Sampathkumar, P.; Premji, Z. Evaluation of the Parasight platform for malaria diagnosis. J. Clin. Microbiol. 2017, 55, 768–775. [Google Scholar] [CrossRef] [PubMed] [Green Version]
- Mitiku, K.; Mengistu, G.; Gelaw, B. The reliability of blood film examination for malaria at the peripheral health unit. Ethiop. J. Health Dev. 2003, 17, 197–204. [Google Scholar]
- Das, D.K.; Ghosh, M.; Pal, M.; Maiti, A.K.; Chakraborty, C. Machine learning approach for automated screening of malaria parasite using light microscopic images. Micron 2013, 45, 97–106. [Google Scholar] [CrossRef] [PubMed]
- Linder, N.; Turkki, R.; Walliander, M.; Mårtensson, A.; Diwan, V.; Rahtu, E.; Pietikäinen, M.; Lundin, M.; Lundin, J. A malaria diagnostic tool based on computer vision screening and visualization of Plasmodium falciparum candidate areas in digitized blood smears. PLoS ONE 2014, 9, e104855. [Google Scholar] [CrossRef] [Green Version]
- Yoon, J.; Jang, W.S.; Nam, J.; Mihn, D.-C.; Lim, C.S. An Automated Microscopic Malaria Parasite Detection System Using Digital Image Analysis. Diagnostics 2021, 11, 527. [Google Scholar] [CrossRef]
- Molestina, R.E.; Stedman, T.T. Update on BEI Resources for Parasitology and Arthropod Vector Research. Trends Parasitol. 2020, 36, 321–324. [Google Scholar] [CrossRef] [PubMed]
- Trager, W.; Jensen, J.B. Cultivation of erythrocytic and exoerythrocytic stages of plasmodia. In Pathology, Vector Studies, and Culture; Elsevier: Amsterdam, The Netherlands, 1980; pp. 271–319. [Google Scholar]
- Trager, W.; Jensen, J.B. Human malaria parasites in continuous culture. Science 1976, 193, 673–675. [Google Scholar] [CrossRef] [PubMed]
- Alves-Junior, E.R.; Gomes, L.T.; Ribatski-Silva, D.; Mendes, C.R.J.; Leal-Santos, F.A.; Simoes, L.R.; Mello, M.B.C.; Fontes, C.J.F. Assumed white blood cell count of 8,000 cells/μL overestimates malaria parasite density in the Brazilian Amazon. PLoS ONE 2014, 9, e94193. [Google Scholar] [CrossRef]
- Rojo, M.G.; García, G.B.; Mateos, C.P.; García, J.G.; Vicente, M.C. Critical comparison of 31 commercially available digital slide systems in pathology. Int. J. Surg. Pathol. 2006, 14, 285–305. [Google Scholar] [CrossRef] [PubMed]
- Lahrmann, B.; Valous, N.A.; Eisenmann, U.; Wentzensen, N.; Grabe, N. Semantic focusing allows fully automated single-layer slide scanning of cervical cytology slides. PLoS ONE 2013, 8, e61441. [Google Scholar] [CrossRef] [PubMed] [Green Version]
- Mallidi, S.; Watanabe, K.; Timerman, D.; Schoenfeld, D.; Hasan, T. Prediction of tumor recurrence and therapy monitoring using ultrasound-guided photoacoustic imaging. Theranostics 2015, 5, 289–301. [Google Scholar] [CrossRef]
- Collins, T.J. ImageJ for microscopy. Biotechniques 2007, 43, S25–S30. [Google Scholar] [CrossRef]
- Trevethan, R. Sensitivity, specificity, and predictive values: Foundations, pliabilities, and pitfalls in research and practice. Front. Public Health 2017, 5, 307. [Google Scholar] [CrossRef]
- Mathison, B.A.; Pritt, B.S. Update on malaria diagnostics and test utilization. J. Clin. Microbiol. 2017, 55, 2009–2017. [Google Scholar] [CrossRef] [Green Version]
- Breslauer, D.N.; Maamari, R.N.; Switz, N.A.; Lam, W.A.; Fletcher, D.A. Mobile phone based clinical microscopy for global health applications. PLoS ONE 2009, 4, e6320. [Google Scholar] [CrossRef] [Green Version]
- Rosado, L.; Da Costa, J.M.C.; Elias, D.; Cardoso, J.S. Automated detection of malaria parasites on thick blood smears via mobile devices. Procedia Comput. Sci. 2016, 90, 138–144. [Google Scholar] [CrossRef]
- Pirnstill, C.W.; Coté, G.L. Malaria diagnosis using a mobile phone polarized microscope. Sci. Rep. 2015, 5, 13368. [Google Scholar] [CrossRef] [Green Version]
- Dong, Y.; Jiang, Z.; Shen, H.; Pan, W.D.; Williams, L.A.; Reddy, V.V.; Benjamin, W.H.; Bryan, A.W. Evaluations of deep convolutional neural networks for automatic identification of malaria infected cells. In Proceedings of the 2017 IEEE EMBS International Conference On Biomedical & Health Informatics (BHI), Orland, FL, USA, 16–19 February 2017; pp. 101–104. [Google Scholar]
- Gopakumar, G.P.; Swetha, M.; Sai Siva, G.; Sai Subrahmanyam, G.R.K. Convolutional neural network-based malaria diagnosis from focus stack of blood smear images acquired using custom-built slide scanner. J. Biophotonics 2018, 11, e201700003. [Google Scholar] [CrossRef]


| Parameter | Number |
|---|---|
| Total slides (n) | 60 |
| True positives (Tp) | 40 |
| False positives (Fp) | 3 |
| False negatives (Fn) | 0 |
| True negatives (Tn) | 20 |
| Sensitivity% | 100 |
| Specificity% | 87 |
| Negative predictive value (NPV)% | 100 |
| Positive predictive value (PPV)% | 93 |
| Slide Name | Automated Count (NanoZoomer) ParasiteMacro | Manual Count | Error (Automated vs. Manual) |
|---|---|---|---|
| HB3 5 × 1 | 8.6 | 7.7 | 0.9 |
| HB3 5 × 2 | 8.5 | 7.9 | 0.6 |
| HB3 5 × 3 | 6.64 | 6.2 | 0.44 |
| HB3 5 × 4 | 7.3 | 7.7 | −0.4 |
| HB3 5 × 5 | 7.5 | 7.1 | 0.4 |
| HB3 10 × 1 | 6.65 | 6.1 | 0.55 |
| HB3 10 × 2 | 6.15 | 5.9 | 0.25 |
| HB3 10 × 3 | 5 | 4.7 | 0.3 |
| HB3 10 × 4 | 6 | 5.8 | 0.2 |
| HB3 10 × 5 | 5.2 | 5 | 0.2 |
| HB3 20 × 1 | 5.5 | 4.8 | 0.7 |
| HB3 20 × 2 | 5.6 | 6 | −0.4 |
| HB3 20 × 3 | 5.8 | 5.4 | 0.4 |
| HB3 20 × 4 | 5.1 | 5.7 | −0.6 |
| HB3 20 × 5 | 5.2 | 5.9 | −0.7 |
| HB3 40 × 1 | 7.1 | 7.2 | 0.1 |
| HB3 40 × 2 | 5.4 | 5.7 | −0.3 |
| HB3 40 × 3 | 5.54 | 5.8 | −0.26 |
| HB3 40 × 4 | 5.8 | 6.2 | −0.4 |
| HB3 40 × 5 | 5.9 | 6 | −0.1 |
| Slide Name | Automated Count (NanoZoomer) ParasiteMacro | Manual Count Percentage | Error (Automated vs. Manual) |
|---|---|---|---|
| 7G8 5 × 1 | 0.17 | 0.21 | −0.04 |
| 7G8 5 × 2 | 0.18 | 0.15 | 0.03 |
| 7G8 5 × 3 | 0.15 | 0.17 | −0.02 |
| 7G8 5 × 4 | 0.22 | 0.25 | −0.03 |
| 7G8 5 × 5 | 0.2 | 0.23 | −0.03 |
| 7G8 10 × 1 | 0.34 | 0.29 | 0.05 |
| 7G8 10 × 2 | 0.56 | 0.54 | 0.02 |
| 7G8 10 × 3 | 0.65 | 0.75 | −0.1 |
| 7G8 10 × 4 | 0.31 | 0.47 | −0.16 |
| 7G8 10 × 5 | 0.64 | 0.75 | −0.11 |
| 7G8 20 × 1 | 0.9 | 0.89 | 0.01 |
| 7G8 20 × 2 | 0.74 | 0.81 | −0.07 |
| 7G8 20 × 3 | 0.46 | 0.58 | −0.12 |
| 7G8 20 × 4 | 0.47 | 0.54 | −0.07 |
| 7G8 20 × 5 | 0.61 | 0.68 | −0.07 |
| 7G8 40 × 1 | 0.65 | 0.71 | −0.06 |
| 7G8 40 × 2 | 0.22 | 0.16 | 0.06 |
| 7G8 40 × 3 | 0.39 | 0.34 | 0.05 |
| 7G8 40 × 4 | 0.46 | 0.55 | −0.09 |
| 7G8 40 × 5 | 0.31 | 0.29 | 0.02 |
| Slide Name | Automated Count (NanoZoomer) ParasiteMacro | Manual Count Percentage | Error (Automated vs. Manual) |
|---|---|---|---|
| RBC 5 × 1 | 0.17 | 0 | 0.17 |
| RBC 5 × 2 | 0 | 0 | 0 |
| RBC 5 × 3 | 0.09 | 0 | 0.09 |
| RBC 5 × 4 | 0 | 0 | 0 |
| RBC 5 × 5 | 0 | 0 | 0 |
| RBC 10 × 1 | 0 | 0 | 0 |
| RBC 10 × 2 | 0.1 | 0 | 0.1 |
| RBC 10 × 3 | 0 | 0 | 0 |
| RBC 10 × 4 | 0 | 0 | 0 |
| RBC 10 × 5 | 0 | 0 | 0 |
| RBC 20 × 1 | 0 | 0 | 0 |
| RBC 20 × 2 | 0 | 0 | 0 |
| RBC 20 × 3 | 0 | 0 | 0 |
| RBC 20 × 4 | 0 | 0 | 0 |
| RBC 20 × 5 | 0 | 0 | 0 |
| RBC 40 × 1 | 0 | 0 | 0 |
| RBC 40 × 2 | 0 | 0 | 0 |
| RBC 40 × 3 | 0 | 0 | 0 |
| RBC 40 × 4 | 0 | 0 | 0 |
| RBC 40 × 5 | 0 | 0 | 0 |
Publisher’s Note: MDPI stays neutral with regard to jurisdictional claims in published maps and institutional affiliations. |
© 2022 by the authors. Licensee MDPI, Basel, Switzerland. This article is an open access article distributed under the terms and conditions of the Creative Commons Attribution (CC BY) license (https://creativecommons.org/licenses/by/4.0/).
Share and Cite
Ashraf, S.; Khalid, A.; de Vos, A.L.; Feng, Y.; Rohrbach, P.; Hasan, T. Malaria Detection Accelerated: Combing a High-Throughput NanoZoomer Platform with a ParasiteMacro Algorithm. Pathogens 2022, 11, 1182. https://doi.org/10.3390/pathogens11101182
Ashraf S, Khalid A, de Vos AL, Feng Y, Rohrbach P, Hasan T. Malaria Detection Accelerated: Combing a High-Throughput NanoZoomer Platform with a ParasiteMacro Algorithm. Pathogens. 2022; 11(10):1182. https://doi.org/10.3390/pathogens11101182
Chicago/Turabian StyleAshraf, Shoaib, Areeba Khalid, Arend L. de Vos, Yanfang Feng, Petra Rohrbach, and Tayyaba Hasan. 2022. "Malaria Detection Accelerated: Combing a High-Throughput NanoZoomer Platform with a ParasiteMacro Algorithm" Pathogens 11, no. 10: 1182. https://doi.org/10.3390/pathogens11101182