

A GIS-Based Top-Down Approach to Support Energy Retrofitting for Smart Urban Neighborhoods


Abstract
:1. Introduction
- Municipality: General information of building including age, location, owner, building type, etc.;
- Contractor: Construction details of the buildings including envelope system, window type, etc.;
- Energy Provider: Energy usage of the buildings including energy usage by Heating Ventilation and Air Conditioning (HVAC) and other systems, including data obtained from smart meters;
- Homeowners: Occupancy-based behavior pattern of end users.
- Develop a GIS-based model for energy retrofitting of residential buildings in Saudi Arabia;
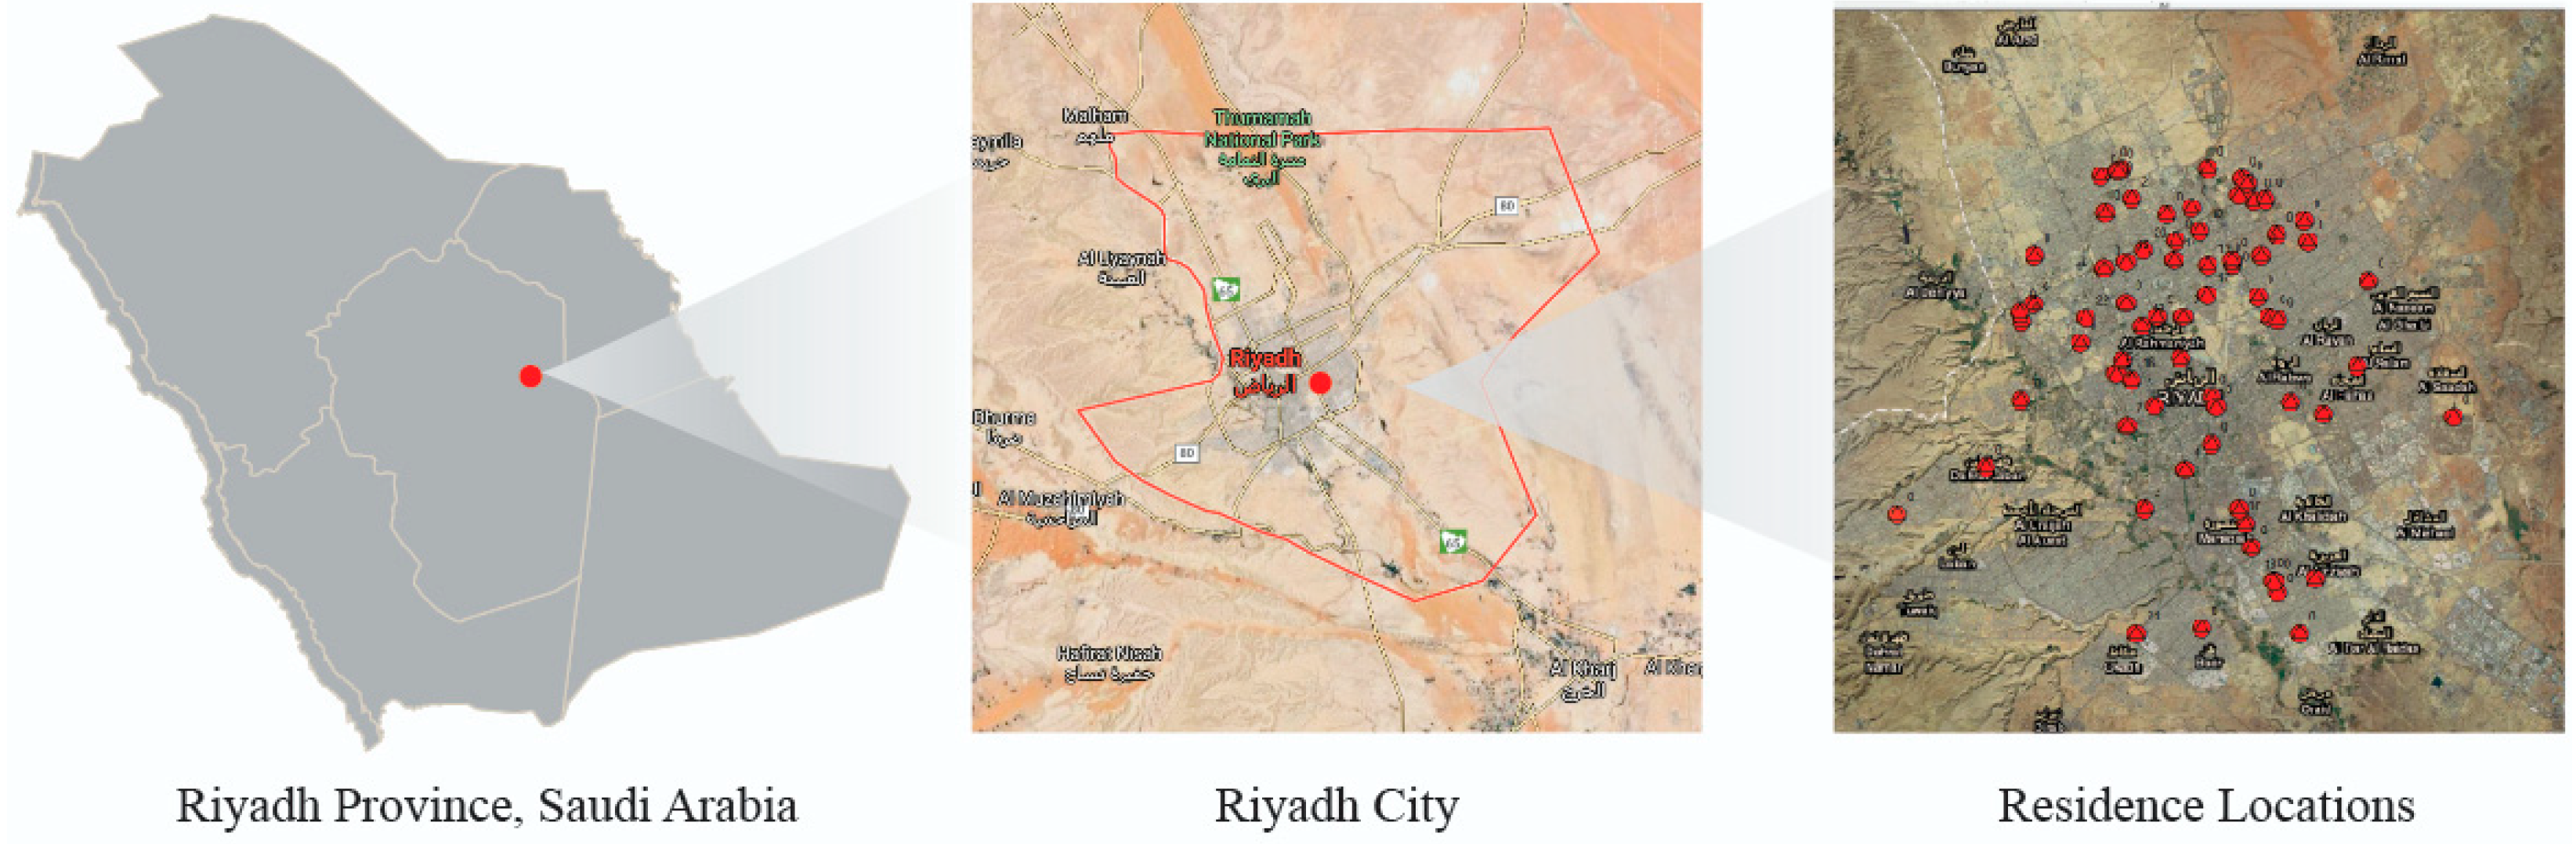
- Apply the developed GIS-based model on selected residential buildings in a neighborhood of Riyadh City in Saudi Arabia as a case study;
- Demonstrate the benefit of the developed GIS-based model for supporting cost effective energy retrofitting policies in Saudi Arabia.
2. Application of GIS for Energy Retrofitting
3. Energy Retrofitting and Smart Neighborhoods
4. GIS-Based Model
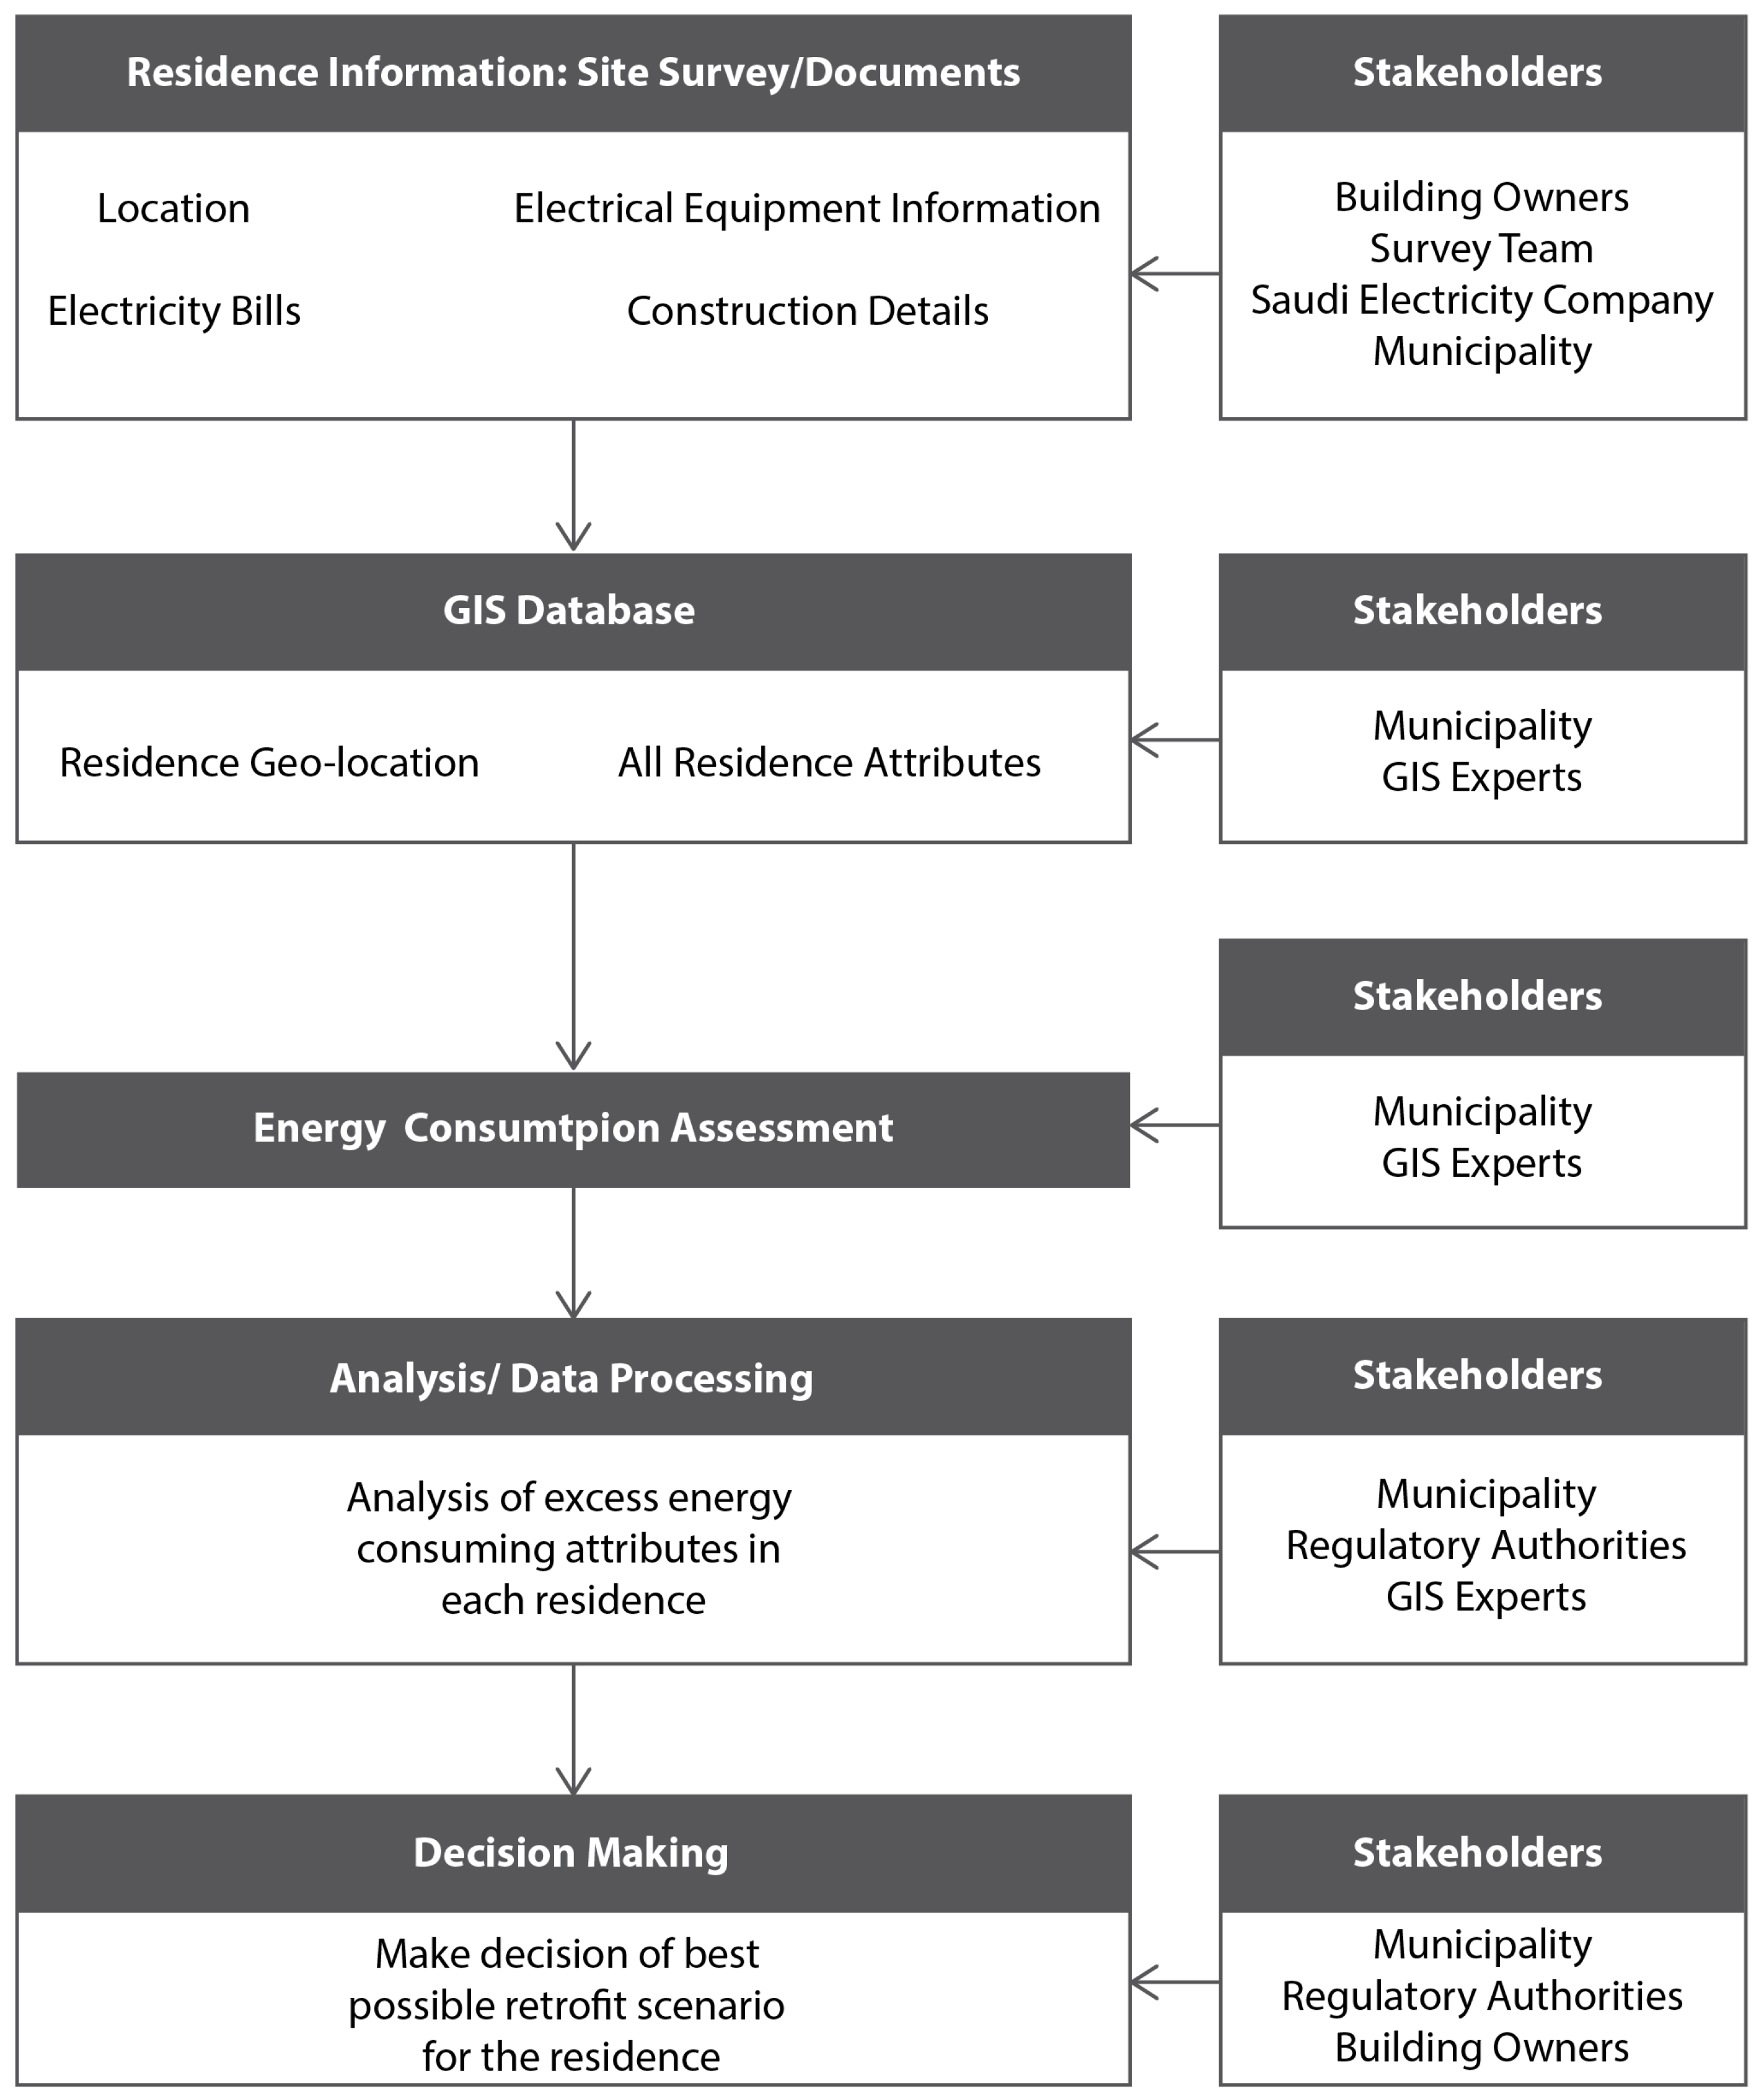
5. Methodology
- Case study data collection;
- GIS database development;
- Analysis and proposal of best retrofit measures for case studies selected in Riyadh.
5.1. Case Study
5.1.1. Description
5.1.2. Data Collection
5.2. GIS Database
5.3. Analysis Methods
6. Results
6.1. General and Descriptive Analysis
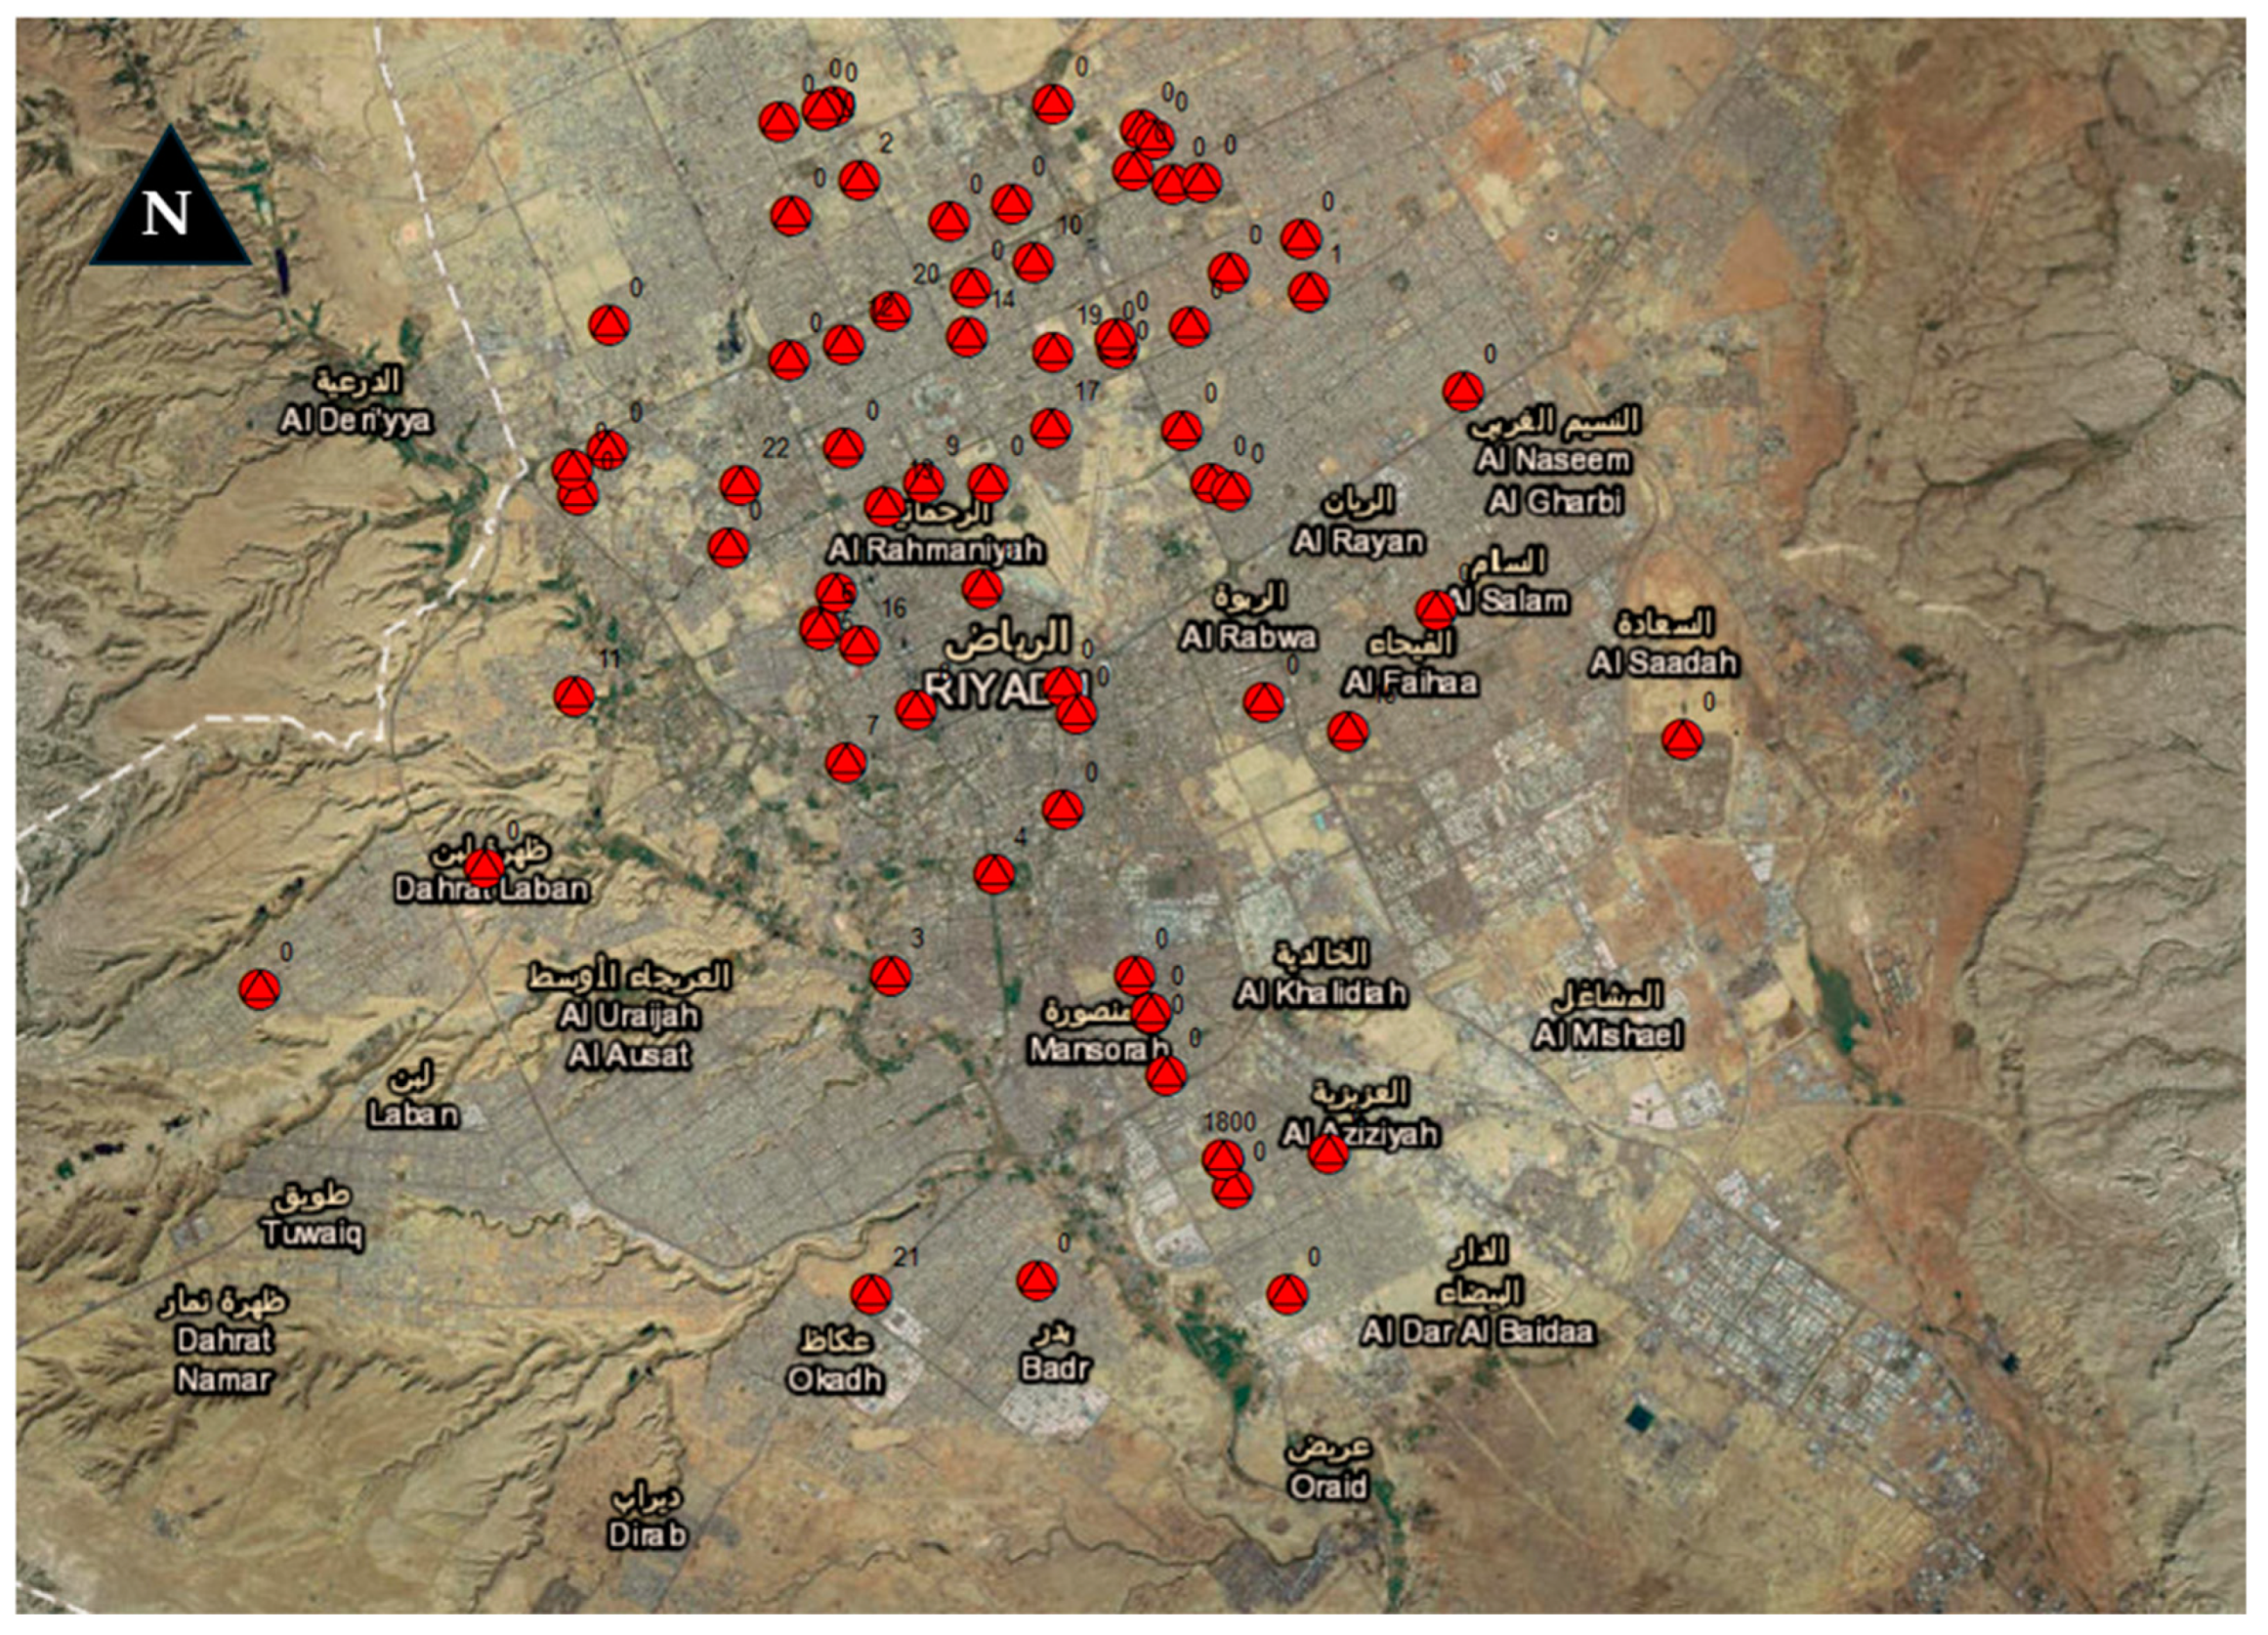
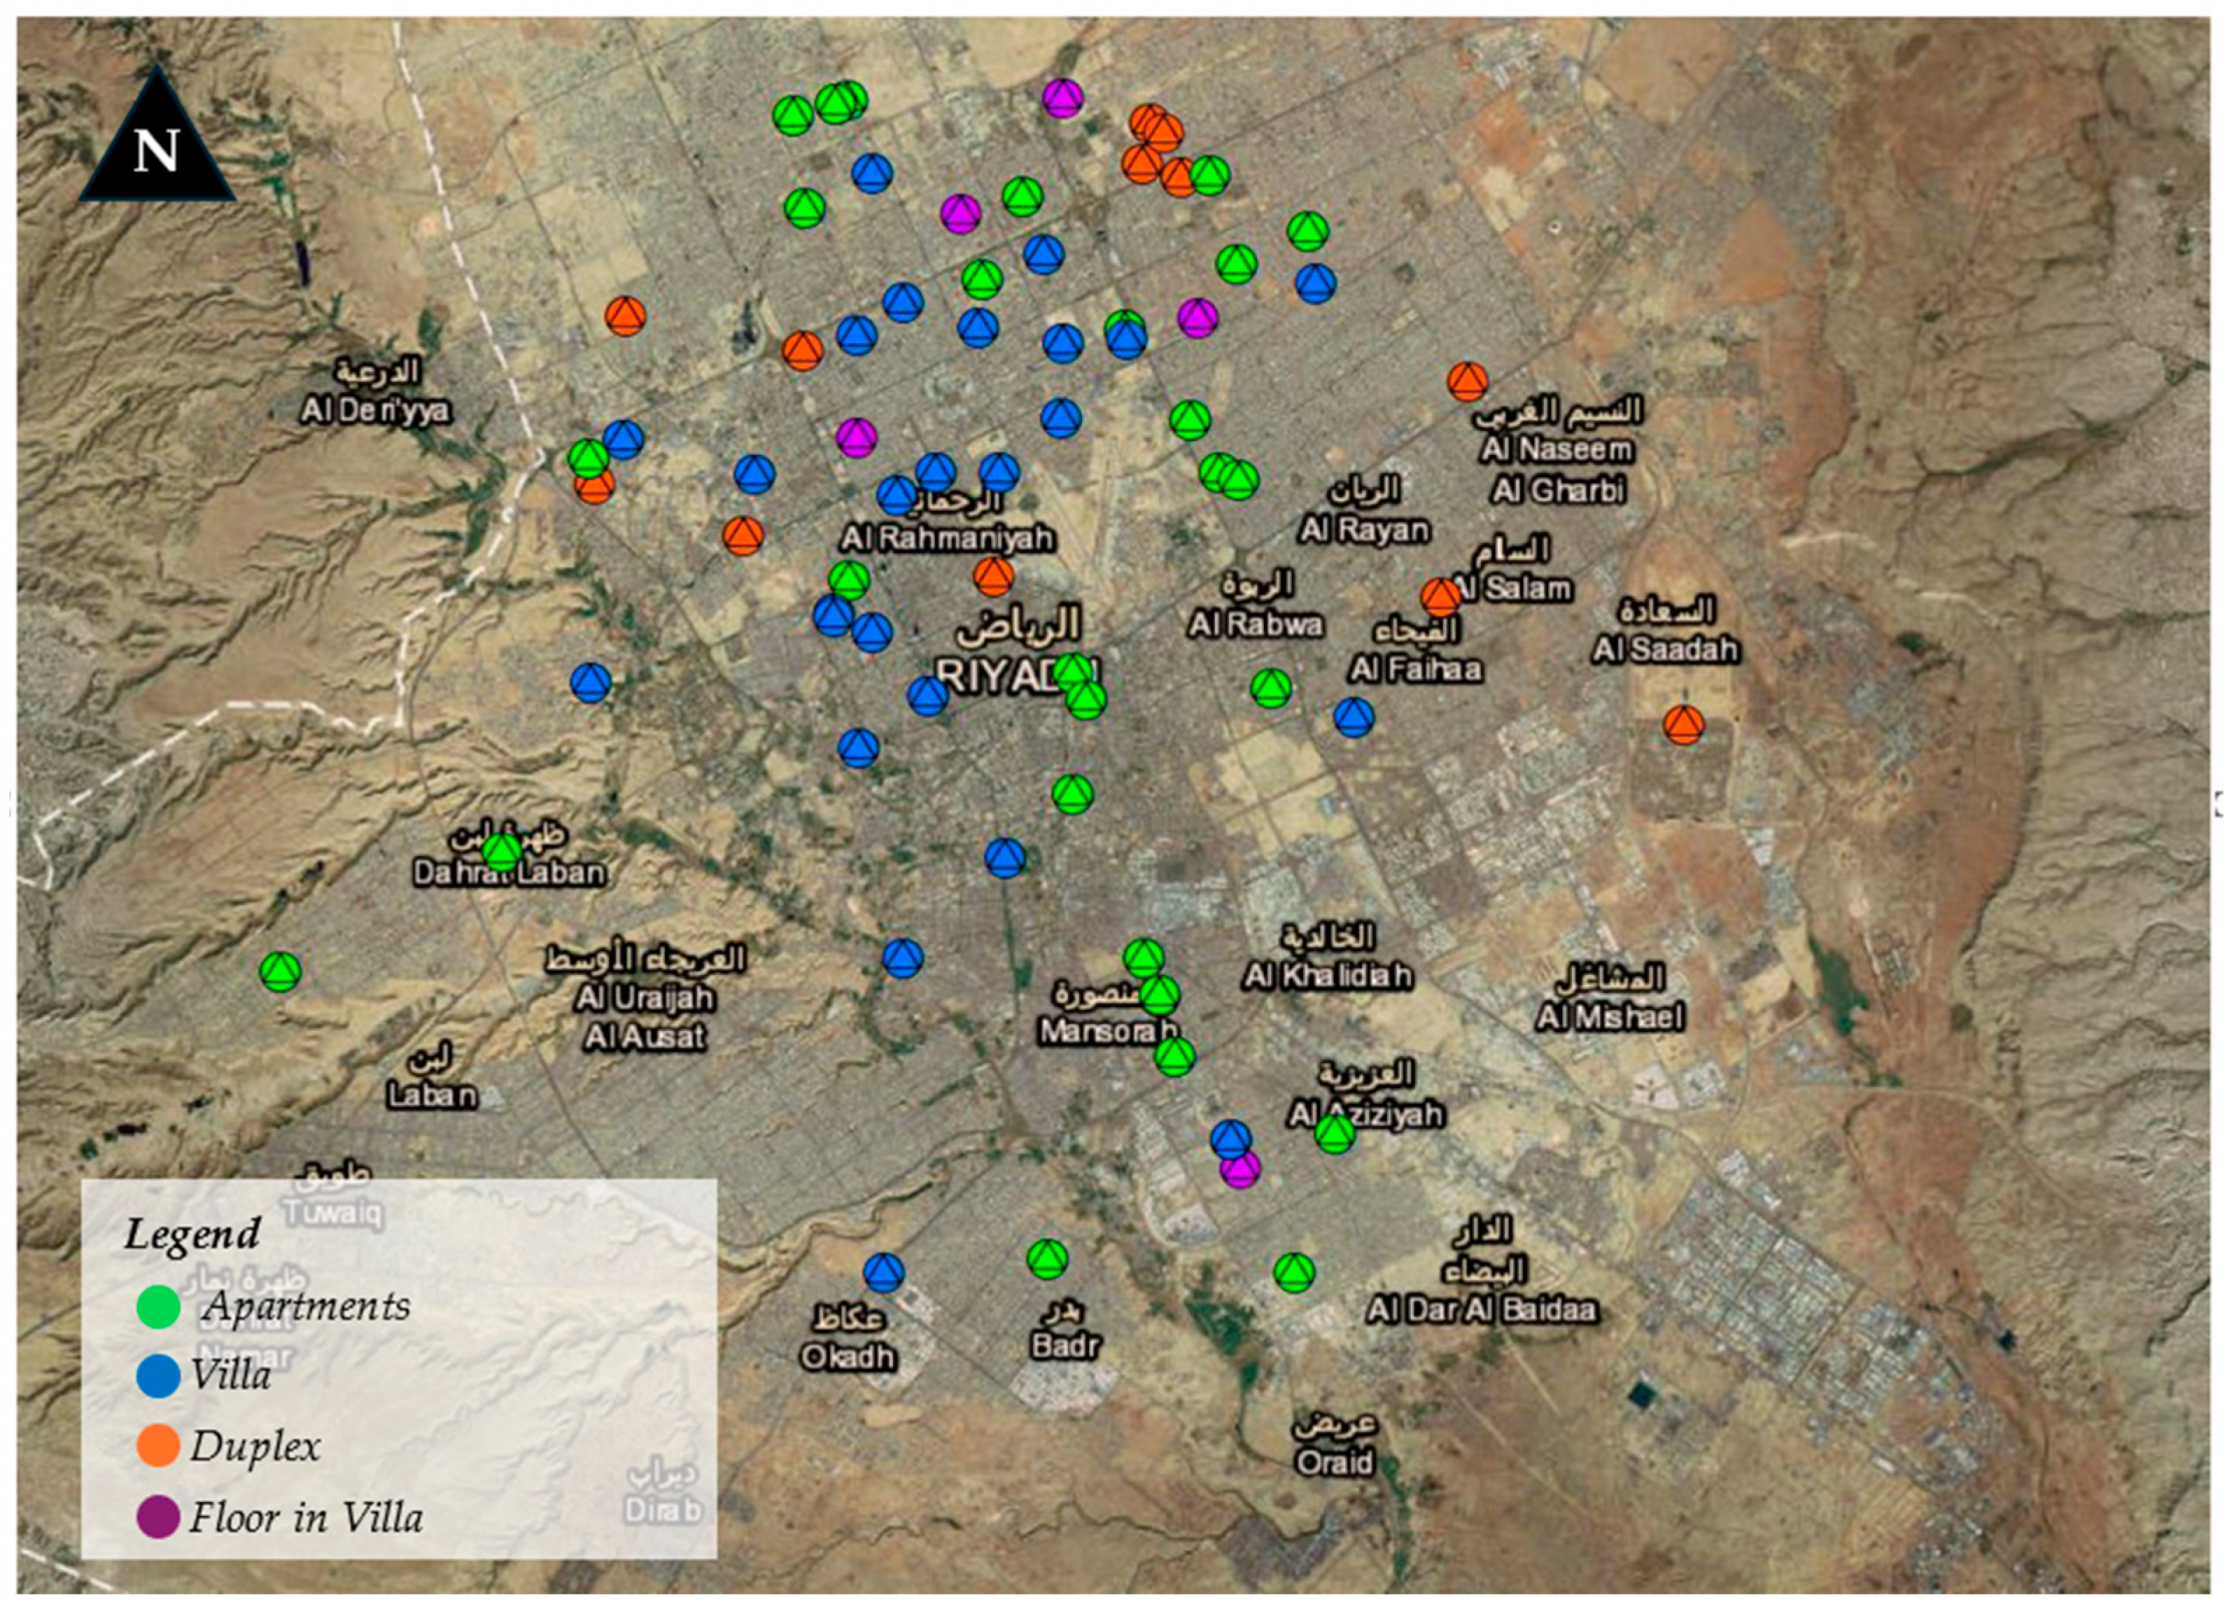
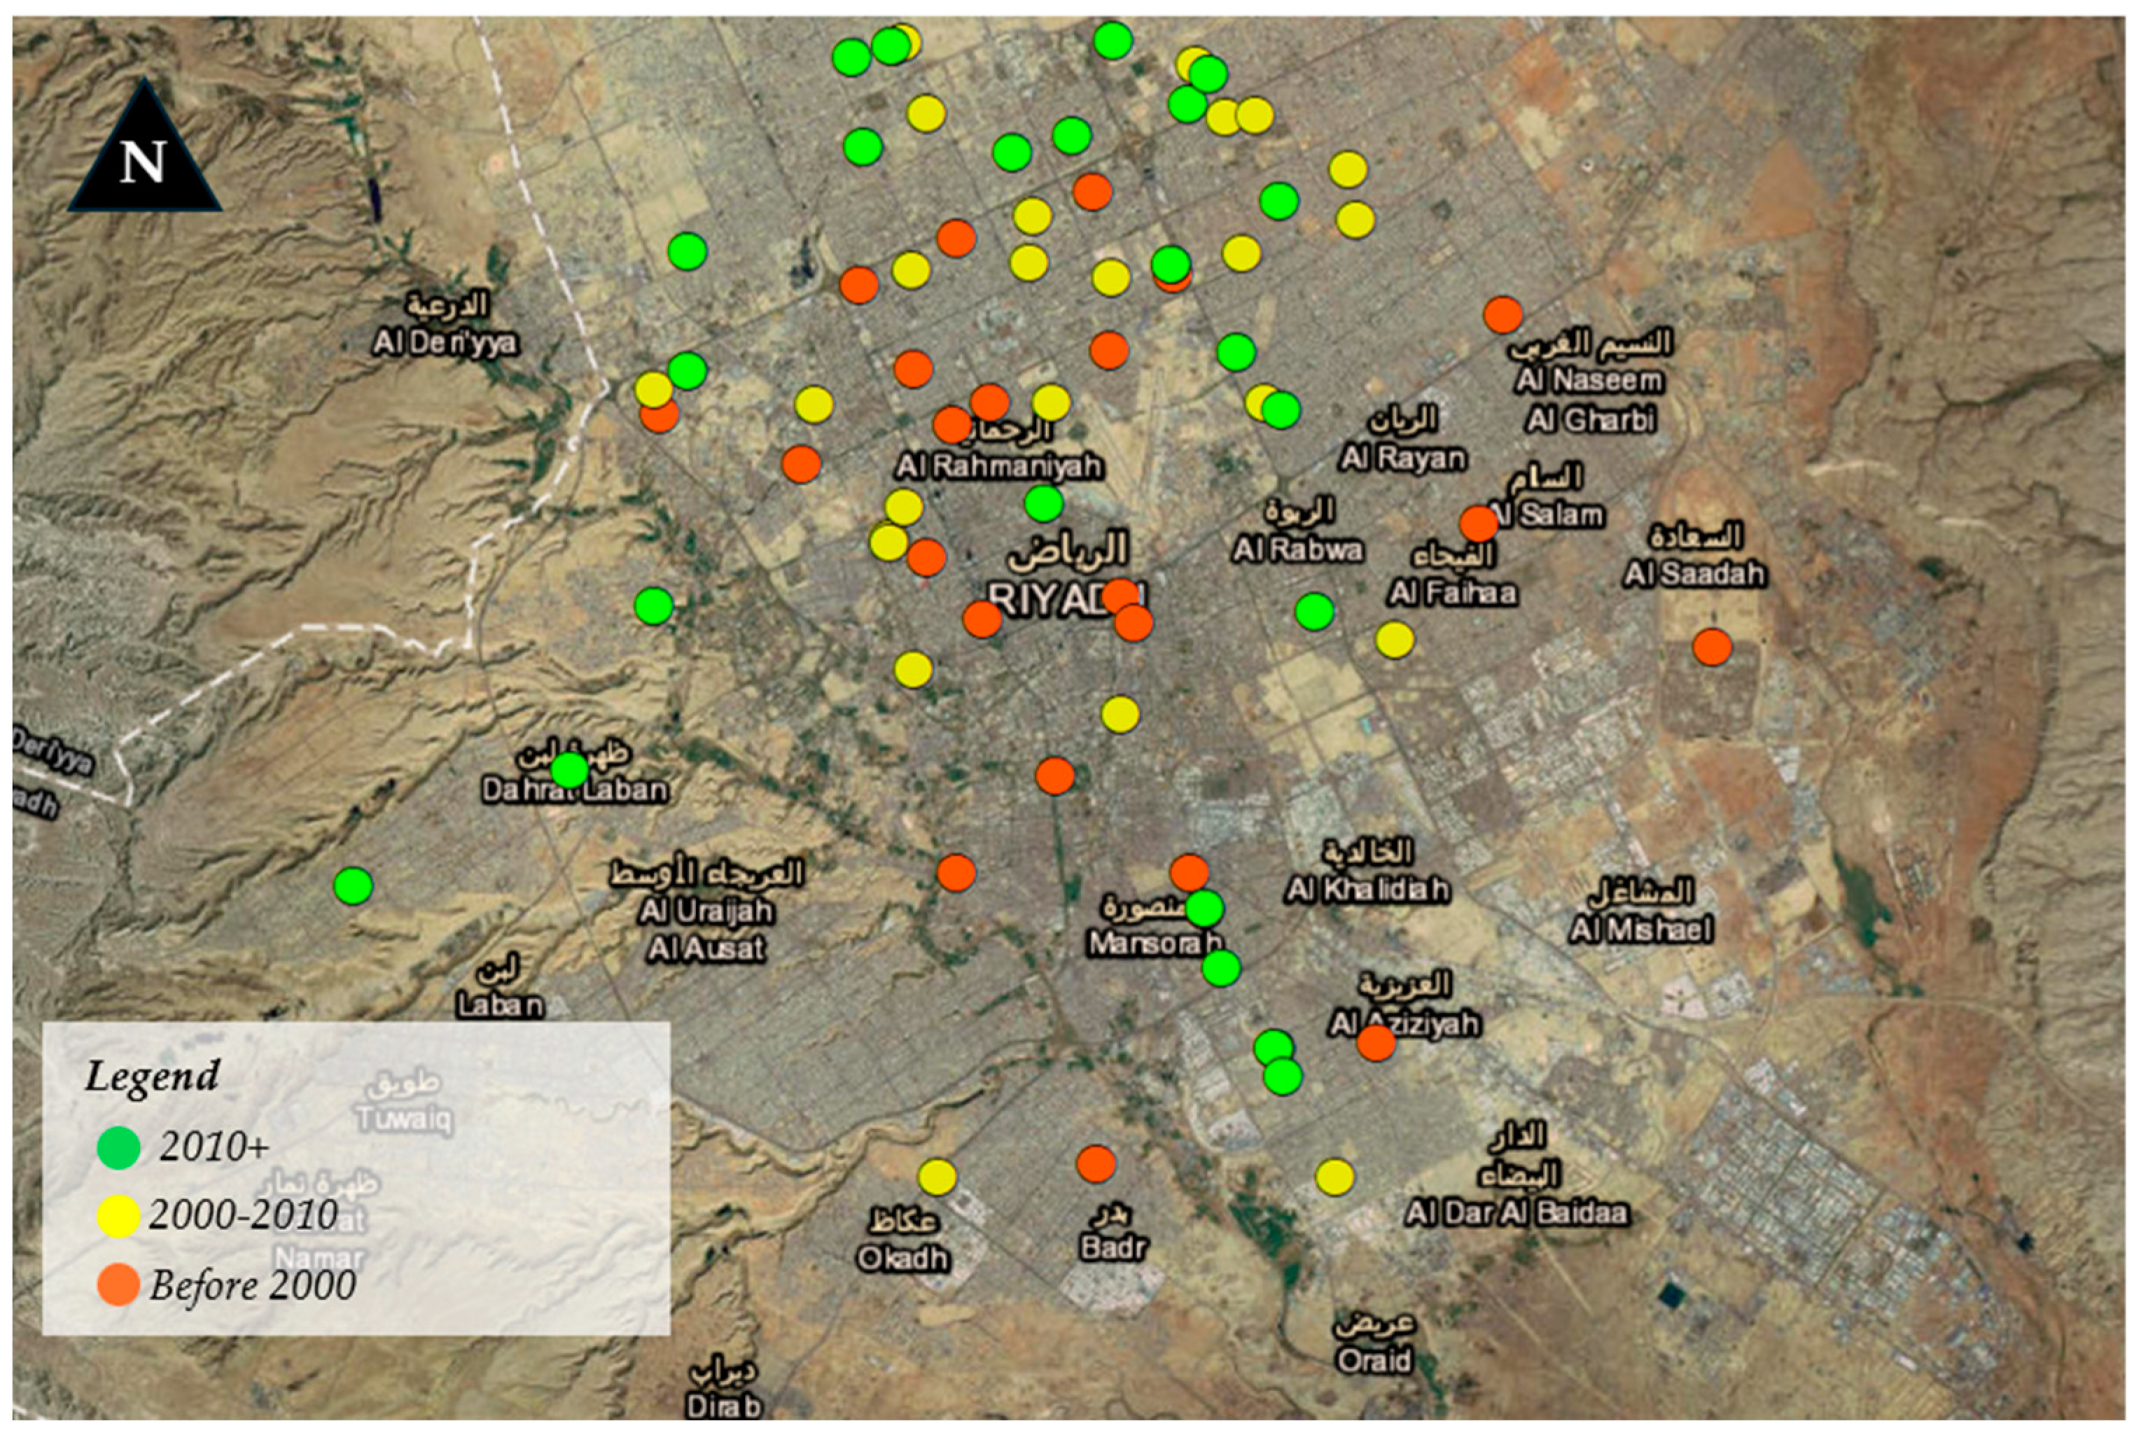
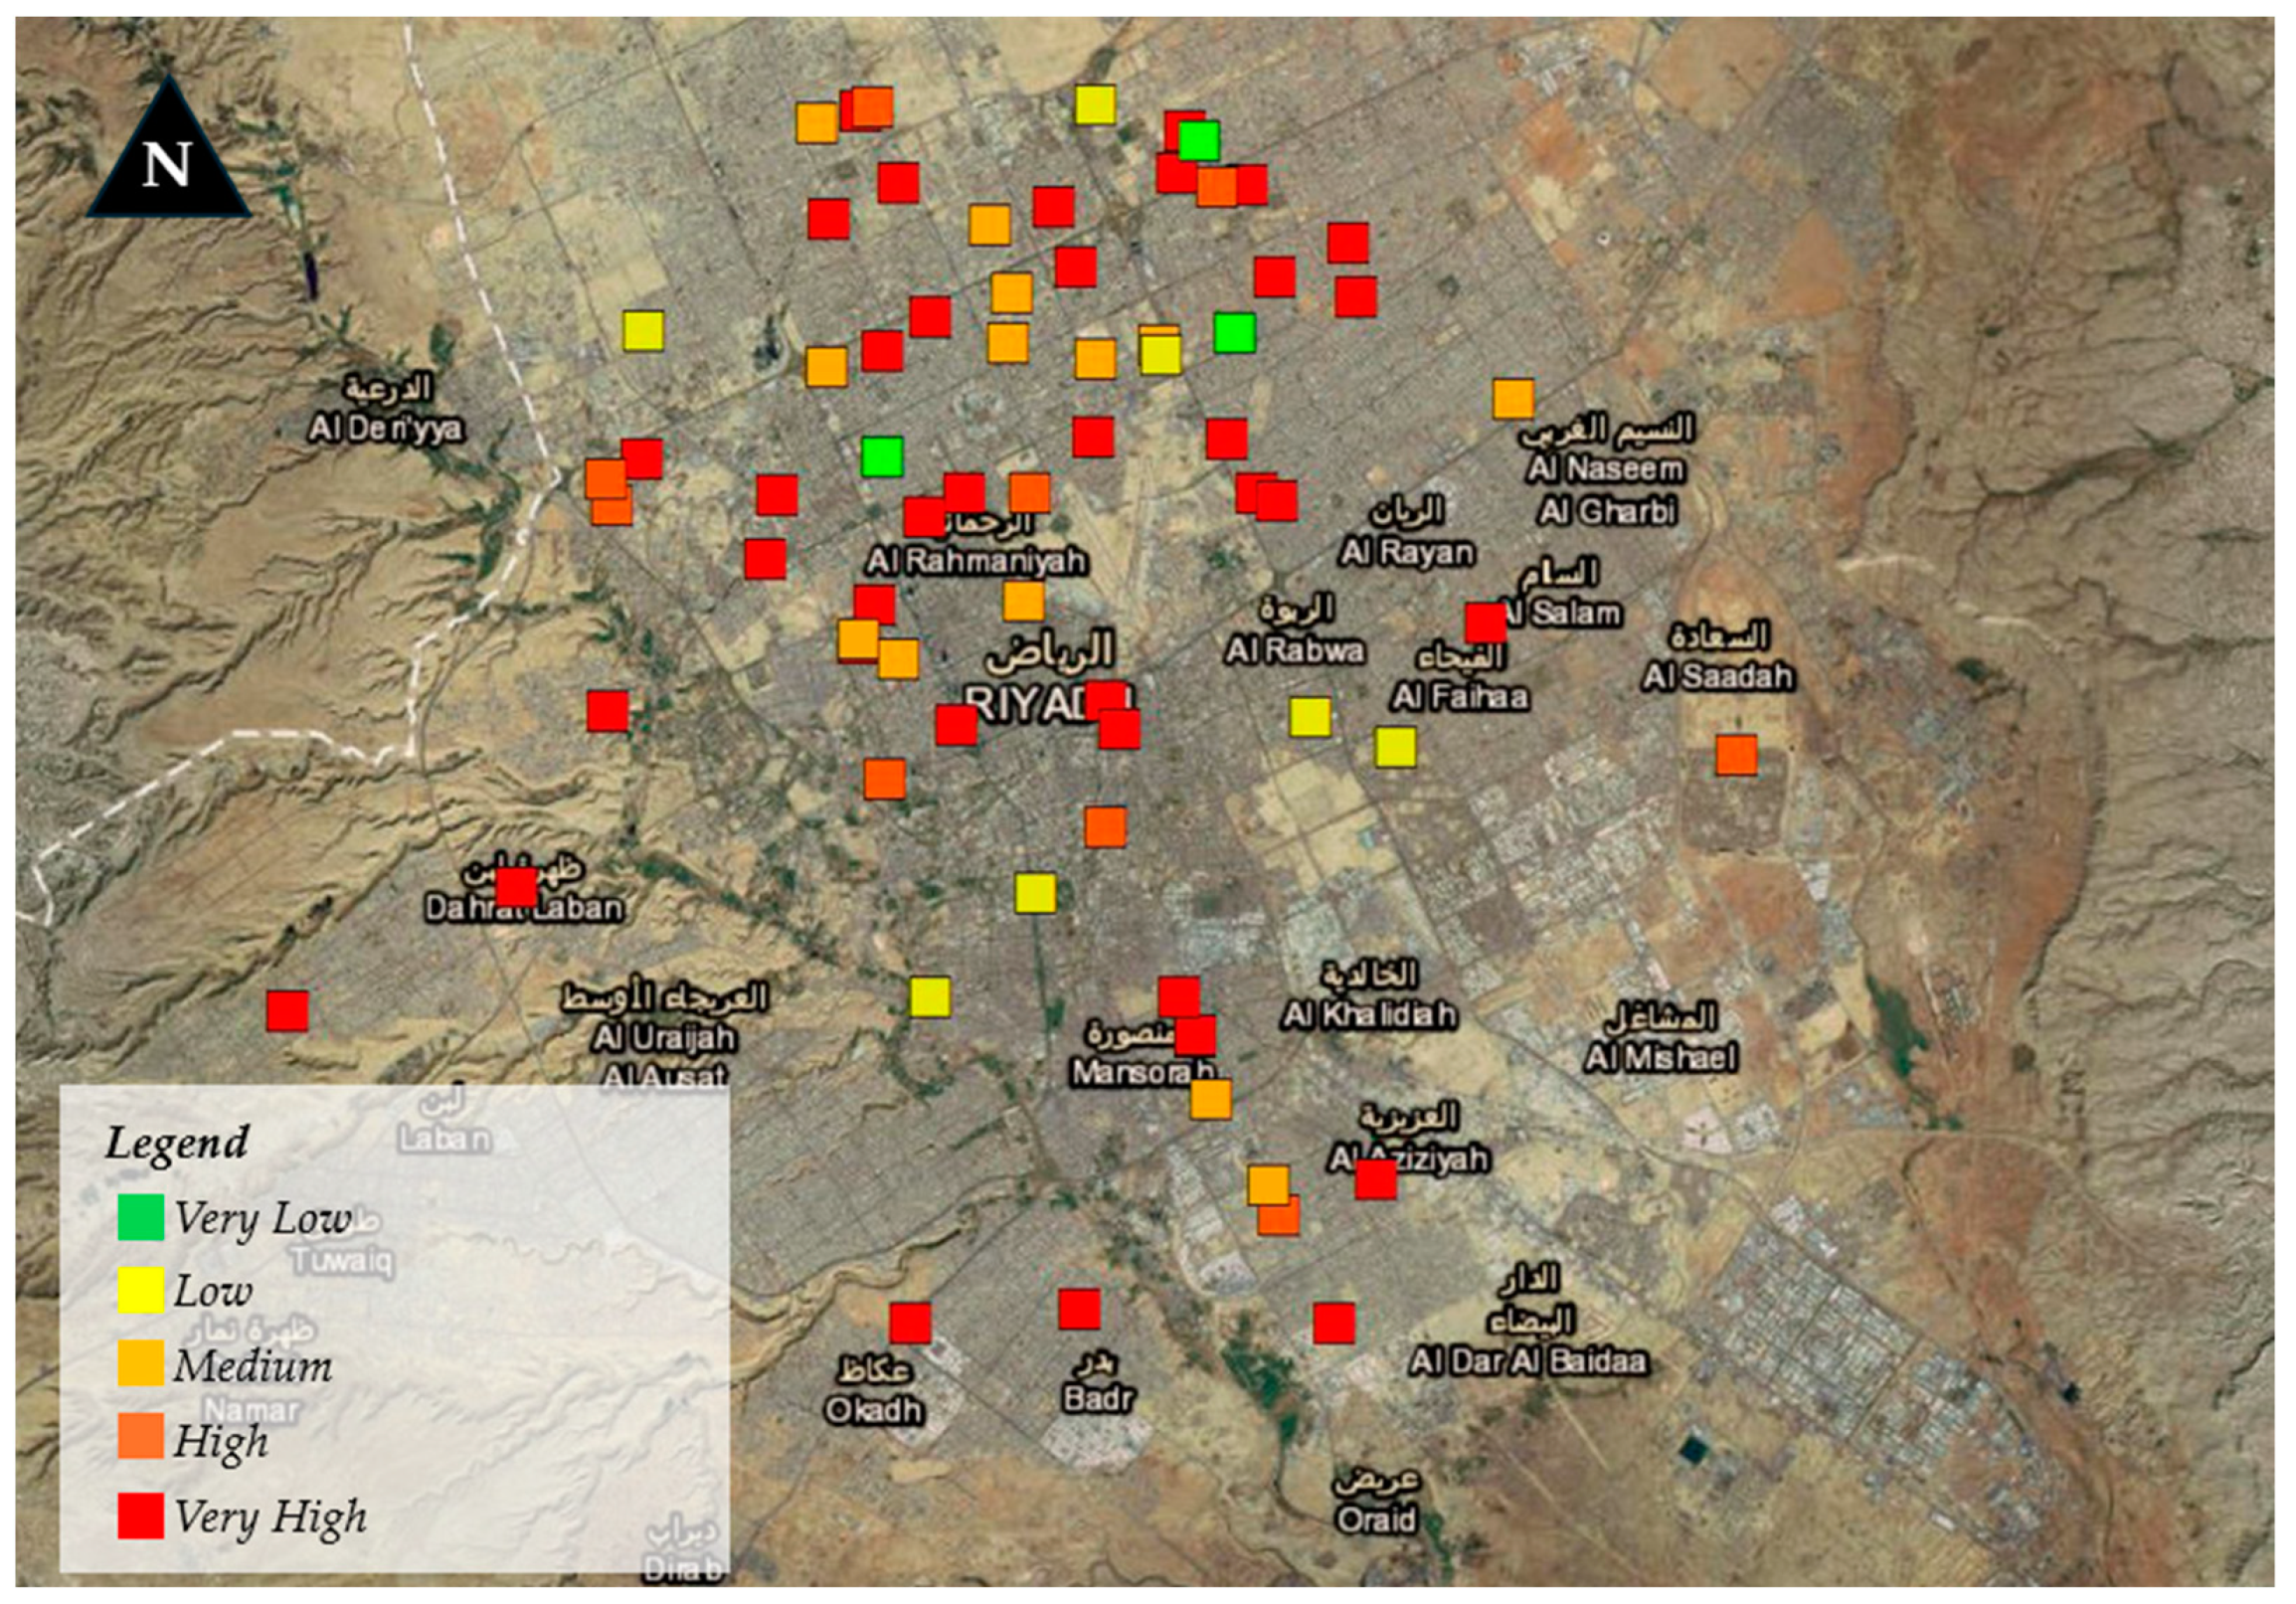
6.2. GIS-Based Analysis
- House-by-house;
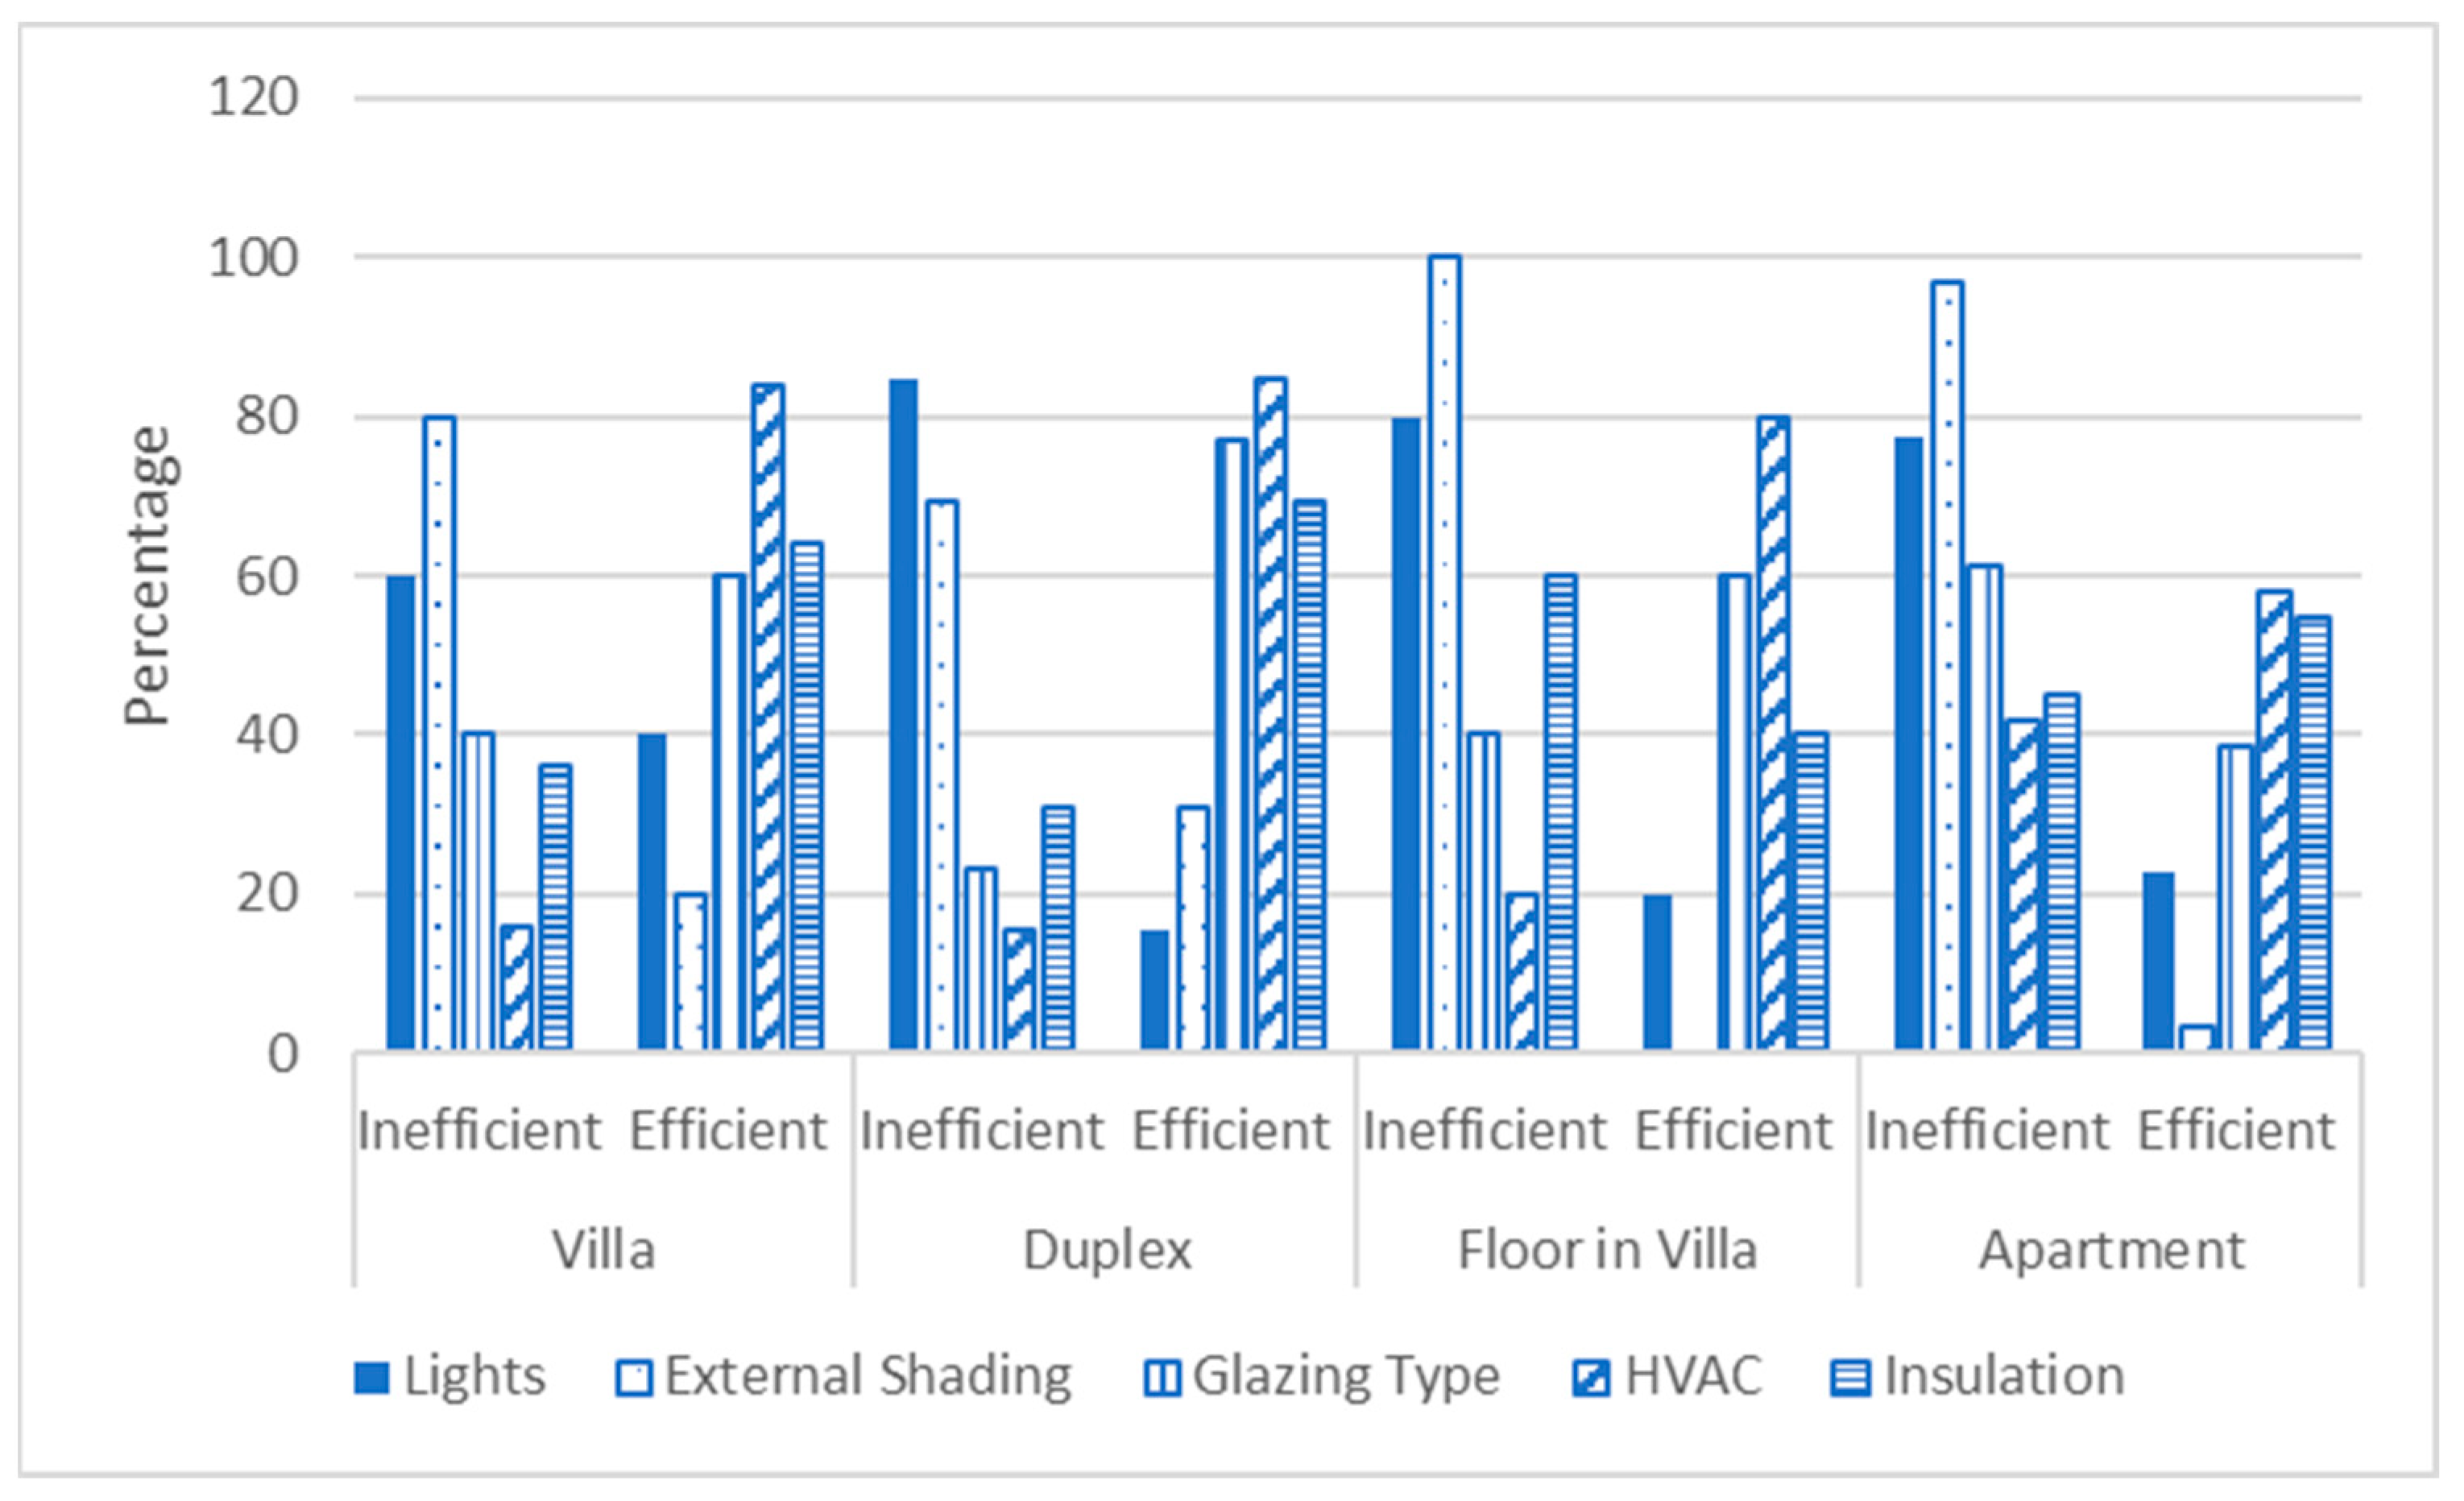
- Type of house;
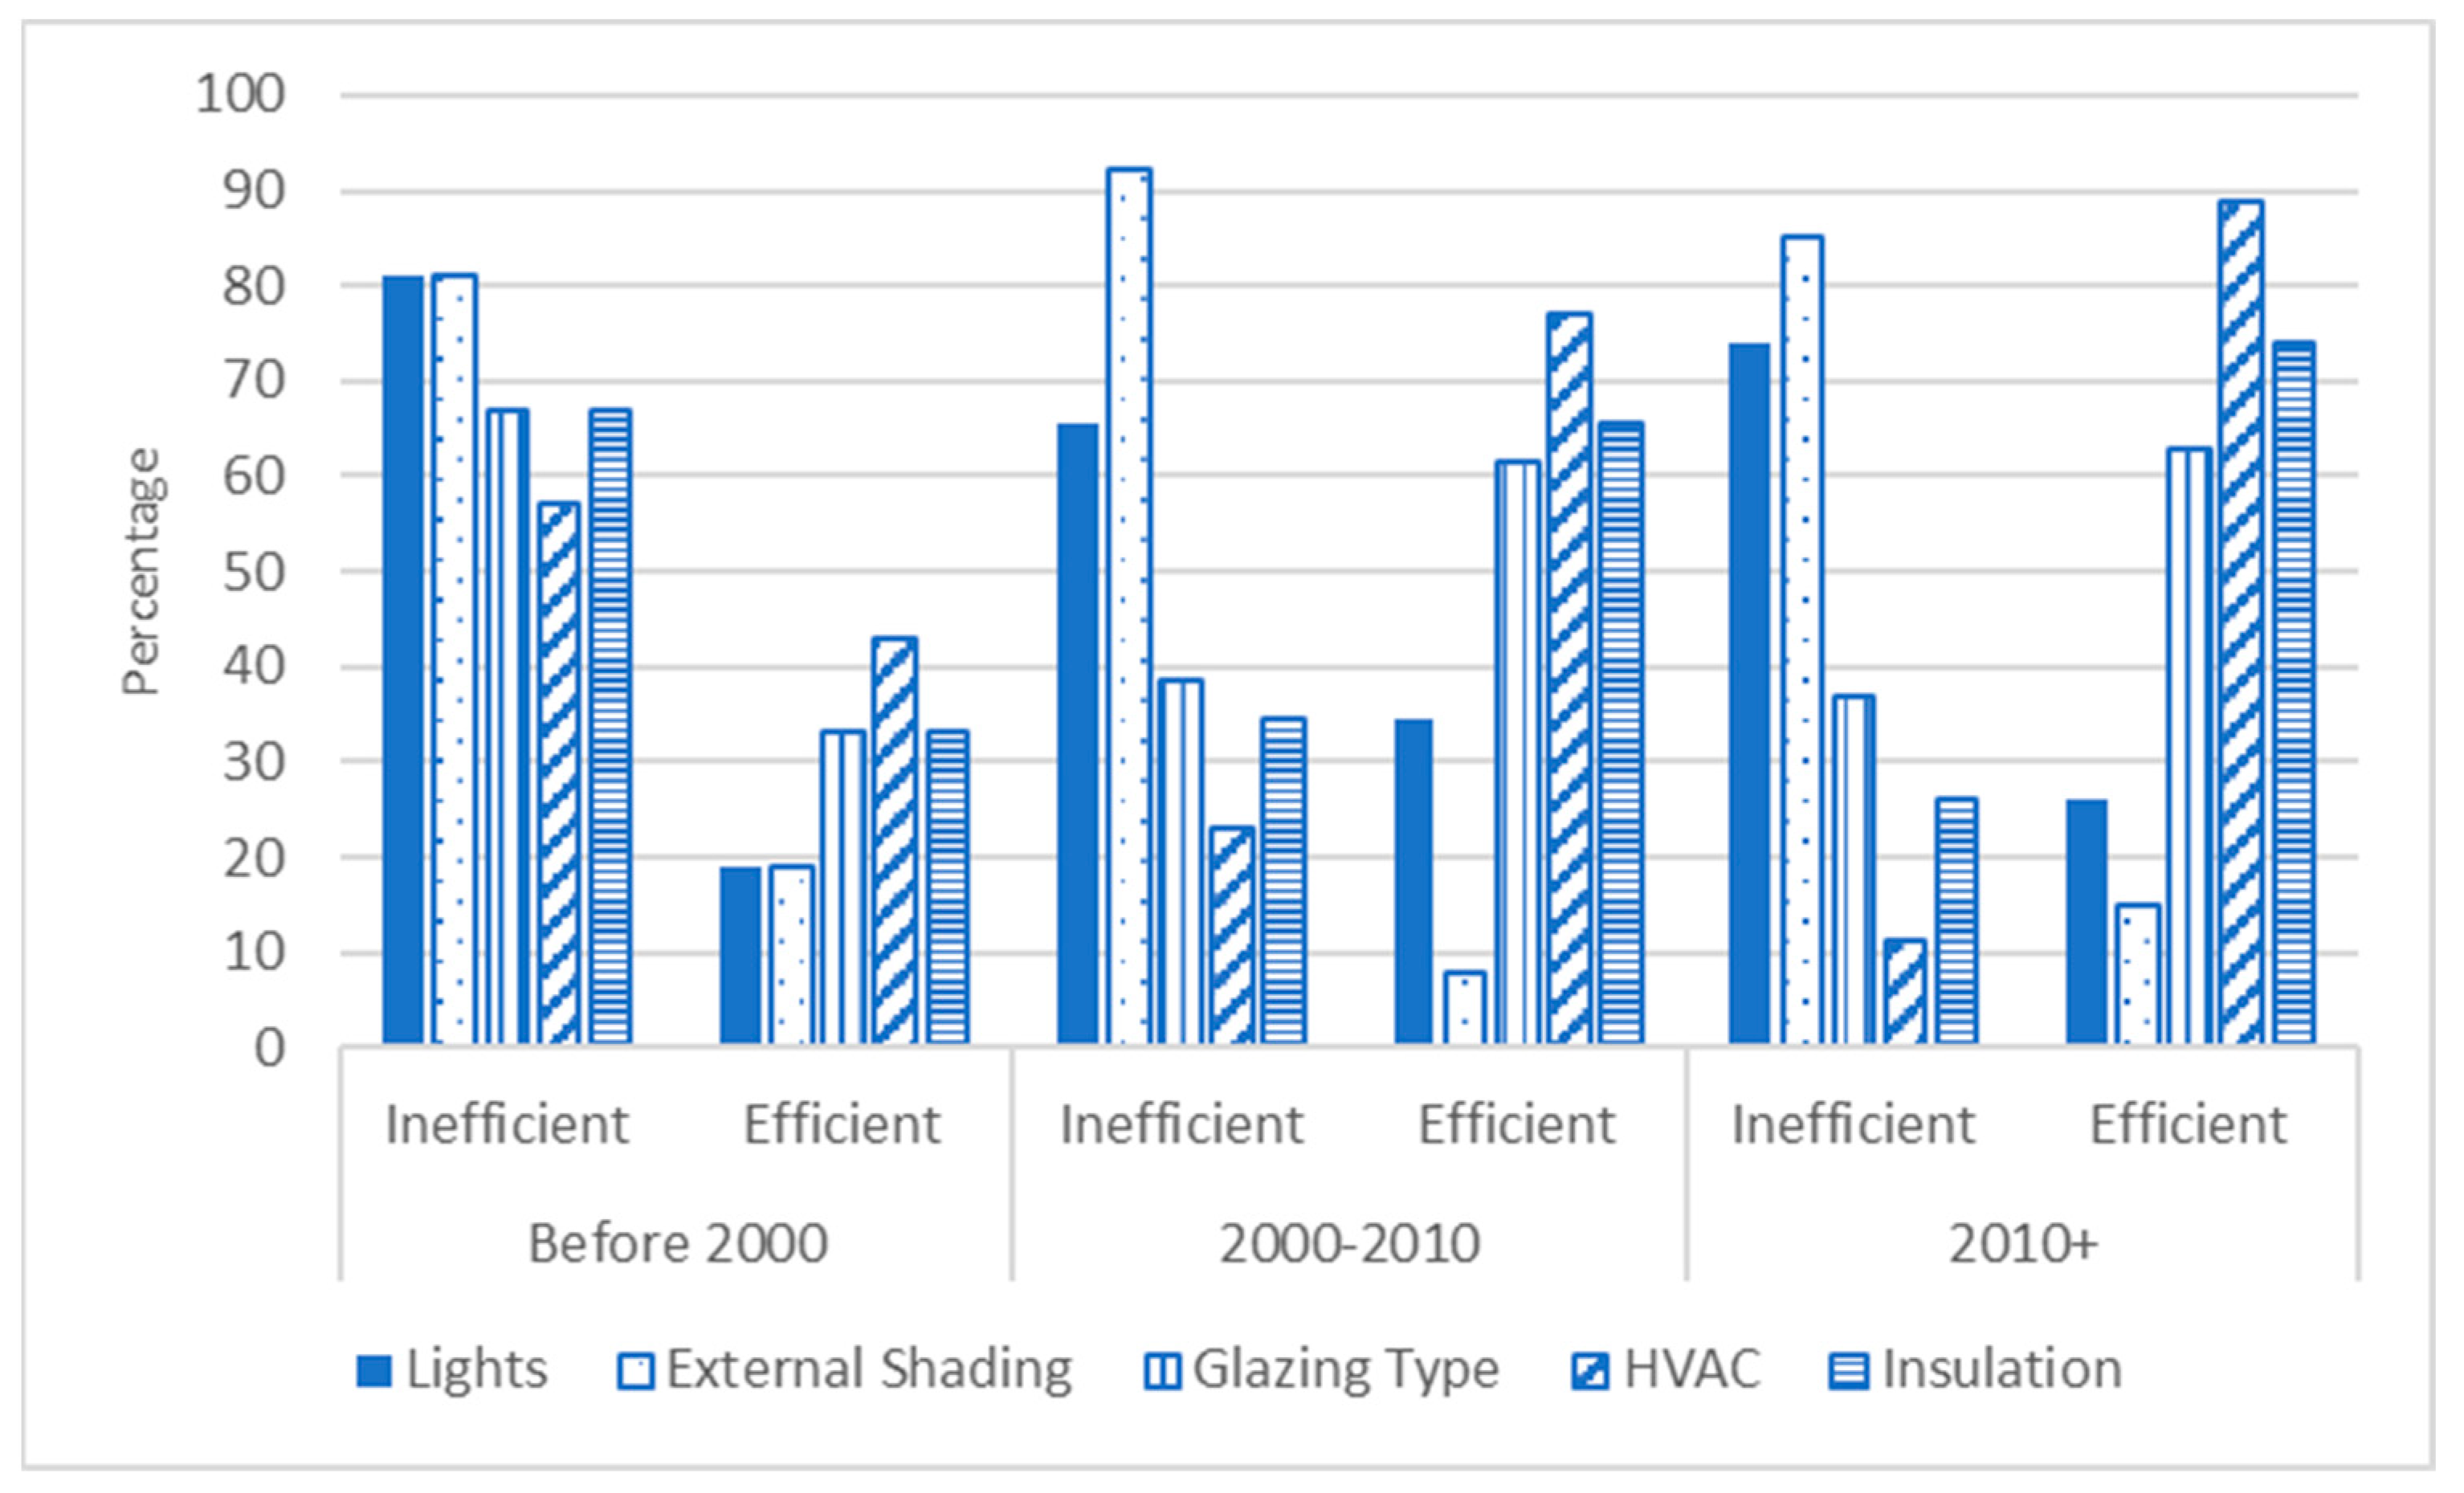
- Year of construction.
6.3. Inferential Statistical Analysis of the Dwellings
7. Discussion and Future Works
8. Conclusions
- Change lighting type to LED;
- Construct external window shading;
- Change glazing type to double glazing;
- Use an HVAC system with higher EER;
- Apply envelope insulation.
- Change lighting type to LED;
- Construct external window shading.
Author Contributions
Funding
Data Availability Statement
Acknowledgments
Conflicts of Interest
References
- Asif, M. (Ed.) Energy and Environmental Security in Developing Countries, 1st ed.; Springer: Berlin/Heidelberg, Germany, 2021. [Google Scholar] [CrossRef]
- Qudrat-Ullah, H.; Asif, M. (Eds.) Dynamics of Energy, Environment, and Economy; A Sustainability Perspective, 1st ed.; Springer: Berlin/Heidelberg, Germany, 2020. [Google Scholar] [CrossRef]
- Shi, W.; Wang, S.; Yang, Q. Climate change and global warming. Rev. Environ. Sci. Bio/Technol. 2010, 9, 99–102. [Google Scholar] [CrossRef]
- WGBC. The Sustainable Transition Depends on Scaling Positive Change Now! WorldGBC Announces #BuildingTheTransition for World Green Building Week. Available online: https://worldgbc.org/article/buildingthetransition-world-green-building-week-2023/ (accessed on 28 February 2024).
- IEA. Key World Energy Statistics 2020. 2020. Available online: https://www.iea.org/reports/key-world-energy-statistics-2020 (accessed on 30 September 2021).
- Wang, H.; Chen, W.; Shi, J. Low carbon transition of global building sector under 2- and 1.5-degree targets. Appl. Energy 2018, 222, 148–157. [Google Scholar] [CrossRef]
- IEA. Electric Power Consumption (kWh Per Capita)|Data. 2014. Available online: https://data.worldbank.org/indicator/EG.USE.ELEC.KH.PC (accessed on 18 November 2017).
- Alyousef, Y.; Abu-Ebid, M. Energy Efficiency Initiatives for Saudi Arabia on Supply and Demand Sides; INTECH: Chula Vista, CA, USA, 2012; Volume 3, Available online: http://www.intechopen.com/books/energy-efficiency-a-bridge-to-low-carbon-economy (accessed on 18 November 2017).
- KAPSARC. Data Portal—Electricity Consumption by Sectors. 2016. Available online: https://datasource.kapsarc.org/explore/dataset/electricity-consumption-by-sectors/ (accessed on 18 November 2017).
- Sidawi, B. Hindrances to the Financing of Affordable Housing in Kingdom of Saudi Arabia. Emir. J. Eng. Res. 2009, 14, 73–82. Available online: http://citeseerx.ist.psu.edu/viewdoc/download;jsessionid=9C038727D0D4E941224CFFF80D0C7A62?doi=10.1.1.304.5712&rep=rep1&type=pdf (accessed on 18 November 2017).
- Ahmed, W.; Asif, M.; Alrashed, F. Application of Building Performance Simulation to Design Energy-Efficient Homes: Case Study from Saudi Arabia. Sustainability 2019, 11, 6048. [Google Scholar] [CrossRef]
- Martinez, A. Facade Retrofit: Enhancing Energy Performance in Existing Buildings; University of Southern California: Los Angeles, CA, USA, 2012; Available online: http://digitallibrary.usc.edu/cdm/ref/collection/p15799coll3/id/352554 (accessed on 18 November 2017).
- Alrashed, F.; Asif, M. Trends in Residential Energy Consumption in Saudi Arabia with Particular Reference to the Eastern Province. J. Sustain. Dev. Energy Water Environ. Syst. 2014, 2, 376–387. [Google Scholar] [CrossRef]
- Amran, Y.A.; Amran, Y.M.; Alyousef, R.; Alabduljabbar, H. Renewable and sustainable energy production in Saudi Arabia according to Saudi Vision 2030; Current status and future prospects. J. Clean. Prod. 2020, 247, 119602. [Google Scholar] [CrossRef]
- Jubran, A.; Peter, B. Reducing high energy demand associated with air-conditioning needs in Saudi Arabia. Energies 2019, 12, 87. [Google Scholar] [CrossRef]
- Abd-ur-Rehman, H.M.; Al-Sulaiman, F.A.; Mehmood, A.; Shakir, S.; Umer, M. The potential of energy savings and the prospects of cleaner energy production by solar energy integration in the residential buildings of Saudi Arabia. J. Clean. Prod. 2018, 183, 1122–1130. [Google Scholar] [CrossRef]
- Ahmed, W.; Asif, M. BIM-based techno-economic assessment of energy retrofitting residential buildings in hot humid climate. Energy Build. 2020, 227, 110406. [Google Scholar] [CrossRef]
- Krarti, M.; Aldubyan, M.; Williams, E. Residential building stock model for evaluating energy retrofit programs in Saudi Arabia. Energy 2020, 195, 116980. [Google Scholar] [CrossRef]
- Algarni, S. Potential for cooling load reduction in residential buildings using cool roofs in the harsh climate of Saudi Arabia. Energy Environ. 2019, 30, 235–253. [Google Scholar] [CrossRef]
- Krarti, M.; Howarth, N. Transitioning to high efficiency air conditioning in Saudi Arabia: A benefit cost analysis for residential buildings. J. Build. Eng. 2020, 31, 101457. [Google Scholar] [CrossRef]
- Ahmed, W.; Asif, M. A critical review of energy retrofitting trends in residential buildings with particular focus on the GCC countries. Renew. Sustain. Energy Rev. 2021, 144, 111000. [Google Scholar] [CrossRef]
- Mason, M. Sustainability and GIS|EnvironmentalScience.org. Available online: https://www.environmentalscience.org/sustainability-gis (accessed on 13 November 2017).
- Saretta, E.; Caputo, P.; Frontini, F. An integrated 3D GIS-based method for estimating the urban potential of BIPV retrofit of façades. Sustain. Cities Soc. 2020, 62, 102410. [Google Scholar] [CrossRef]
- Shu, L.; Zhao, D. Decision-Making Approach to Urban Energy Retrofit—A Comprehensive Review. Buildings 2023, 13, 1425. [Google Scholar] [CrossRef]
- Mutani, G.; Todeschi, V. GIS-based urban energy modelling and energy efficiency scenarios using the energy performance certificate database. Energy Effic. 2021, 14, 47. [Google Scholar] [CrossRef]
- Tornberg, J.; Thuvander, L. A GIS Energy Model for the Building Stock of Goteborg. Available online: http://citeseerx.ist.psu.edu/viewdoc/download?doi=10.1.1.594.4049&rep=rep1&type=pdf (accessed on 13 November 2017).
- Dall’O’, G.; Galante, A.; Torri, M. A methodology for the energy performance classification of residential building stock on an urban scale. Energy Build. 2012, 48, 211–219. [Google Scholar] [CrossRef]
- Caputo, P.; Costa, G.; Ferrari, S. A supporting method for defining energy strategies in the building sector at urban scale. Energy Policy 2013, 55, 261–270. [Google Scholar] [CrossRef]
- Buffat, R.; Schmid, L.; Heeren, N.; Froemelt, A.; Raubal, M.; Hellweg, S. GIS-based Decision Support System for Building Retrofit. Energy Procedia 2017, 122, 403–408. [Google Scholar] [CrossRef]
- Fabbri, K.; Zuppiroli, M.; Ambrogio, K. Heritage buildings and energy performance: Mapping with GIS tools. Energy Build. 2012, 48, 137–145. [Google Scholar] [CrossRef]
- Caputo, P.; Pasetti, G. Boosting the energy renovation rate of the private building stock in Italy: Policies and innovative GIS-based tools. Sustain. Cities Soc. 2017, 34, 394–404. [Google Scholar] [CrossRef]
- Caputo, P.; Pasetti, G. GIS tools towards a renovation of the building heritage. Energy Procedia 2017, 133, 435–443. [Google Scholar] [CrossRef]
- Gupta, R.; Gregg, M. Targeting and modelling urban energy retrofits using a city-scale energy mapping approach. J. Clean. Prod. 2018, 174, 401–412. [Google Scholar] [CrossRef]
- Mastrucci, A.; Baume, O.; Stazi, F.; Leopolda, U. Estimating energy savings for the residential building stock of an entire city: A GIS-based statistical downscaling approach applied to Rotterdam. Energy Build. 2014, 75, 358–367. [Google Scholar] [CrossRef]
- Buffat, R.; Froemelt, A.; Heeren, N.; Raubal, M.; Hellweg, S. Big data GIS analysis for novel approaches in building stock modelling. Appl. Energy 2017, 208, 277–290. [Google Scholar] [CrossRef]
- Li, C.; Hong, T.; Yan, D. An insight into actual energy use and its drivers in high-performance buildings. Appl. Energy 2014, 131, 394–410. [Google Scholar] [CrossRef]
- Zhou, Z.; Zhang, S.; Wang, C.; Zuo, J.; He, Q.; Rameezdeen, R. Achieving energy efficient buildings via retrofitting of existing buildings: A case study. J. Clean. Prod. 2016, 112, 3605–3615. [Google Scholar] [CrossRef]
- Ali, U.; Shamsi, M.H.; Bohacek, M.; Purcell, K.; Hoare, C.; O’Donnell, J. GIS-based multi-scale residential building energy modeling using a data-driven approach. In Building Simulation; IBPSA: Las Cruces, NM, USA, 2021; Volume 17, pp. 1115–1122. [Google Scholar]
- Paiho, S.; Kiljander, J.; Sarala, R.; Siikavirta, H.; Kilkki, O.; Bajpai, A.; Duchon, M.; Pahl, M.-O.; Wüstrich, L.; Lübben, C.; et al. Towards cross-commodity energy-sharing communities—A review of the market, regulatory, and technical situation. Renew. Sustain. Energy Rev. 2021, 151, 111568. [Google Scholar] [CrossRef]
- Alhamwi, A.; Medjroubi, W.; Vogt, T.; Agert, C. GIS-based urban energy systems models and tools: Introducing a model for the optimisation of flexibilisation technologies in urban areas. Appl. Energy 2017, 191, 1–9. [Google Scholar] [CrossRef]
- Lai, C.S.; Jia, Y.; Dong, Z.; Wang, D.; Tao, Y.; Lai, Q.H.; Wong, R.T.; Zobaa, A.F.; Wu, R.; Lai, L.L. A review of technical standards for smart cities. Clean Technol. 2020, 2, 290–310. [Google Scholar] [CrossRef]
- Martins, F.; Patrão, C.; Moura, P.; de Almeida, A.T. A Review of Energy Modeling Tools for Energy Efficiency in Smart Cities. Smart Cities 2021, 4, 1420–1436. [Google Scholar] [CrossRef]
- Mahapatra, C.; Moharana, A.K.; Leung, V.C. Energy management in smart cities based on internet of things: Peak demand reduction and energy savings. Sensors 2017, 17, 2812. [Google Scholar] [CrossRef]
- de Santoli, L.; Mancini, F.; Garcia, D.A. A GIS-based model to assess electric energy consumptions and usable renewable energy potential in Lazio region at municipality scale. Sustain. Cities Soc. 2019, 46, 101413. [Google Scholar] [CrossRef]
- Azeroual, O.; Saake, G.; Abuosba, M. ETL best practices for data quality checks in RIS databases. Informatics 2019, 6, 10. [Google Scholar] [CrossRef]
- Breunig, M.; Bradley, P.E.; Jahn, M.; Kuper, P.; Mazroob, N.; Rösch, N.; Al-Doori, M.; Stefanakis, E.; Jadidi, M. Geospatial data management research: Progress and future directions. ISPRS Int. J. Geo-Inf. 2020, 9, 95. [Google Scholar] [CrossRef]
- Mujeebu, M.; Al Shamrani, O. Prospects of energy conservation and management in buildings—The Saudi Arabian scenario versus global trends. Renew. Sustain. Energy Rev. 2016, 58, 1647–1663. [Google Scholar] [CrossRef]
- Mutani, G.; Alehasin, M.; Yang, H.; Zhang, X.; Felmer, G. Urban Building Energy Modeling to Support Climate-Sensitive Planning in the Suburban Areas of Santiago de Chile. Buildings 2024, 14, 185. [Google Scholar] [CrossRef]
- Congiu, E.; Desogus, G.; Frau, C.; Gatto, G.; Pili, S. Web-Based Management of Public Buildings: A Workflow Based on Integration of BIM and IoT Sensors with a Web–GIS Portal. Buildings 2023, 13, 1327. [Google Scholar] [CrossRef]
- Krarti, M.; Dubey, K.; Howarth, N. Evaluation of Building Energy Efficiency Investment Options for the Kingdom of Saudi Arabia. Energy 2017, 134, 595–610. [Google Scholar] [CrossRef]
- Ahmed, W.; Fardan, H.; Asif, M. Integration of Building Energy Modeling in the Design Process to Improve Sustainability Standards in the Residential Sector—Case Study of the Eastern Province of Saudi Arabia. In Proceedings of the IEEE International Conference on Smart Energy Grid Engineering (SEGE), Oshawa, ON, Canada, 14–17 August 2017; pp. 309–314. [Google Scholar]
- Hamida, M.B.; Ahmed, W.; Asif, M.; Almaziad, F.A. Techno-Economic Assessment of Energy Retrofitting Educational Buildings: A Case Study in Saudi Arabia. Sustainability 2021, 13, 179. [Google Scholar] [CrossRef]
- Asif, M.; Ahmed, W.; Alazazmeh, A. Energy Performance Assessment of a Post-Retrofit Office Building Using Measurement and Verification Protocol: A Case Study from KSA. Energy Rep. 2023, 9, 1366–1379. [Google Scholar] [CrossRef]
- Graziuso, G.; Grimaldi, M.; Giordano, C. A GIS-BIM Approach for the Evaluation of Retrofit Actions in Urban Planning. In A Methodological Proposal, Proceedings of the New Metropolitan Perspectives, Reggio Calabria, Italy, 24 May 2022; Calabrò, F., Della Spina, L., Piñeira Mantiñán, M.J., Eds.; Springer: Cham, Switzerland, 2022; pp. 1328–1336. [Google Scholar]


| Category | Subcategory | Description |
|---|---|---|
| General Information | Reference | Number |
| Type | ||
| Coordinates | LAT | |
| LON | ||
| Address | Community | |
| PO. Box | ||
| PO. Code | ||
| Age | Year of Construction | |
| Year of Renovation | ||
| Occupants | Total Number of Occupants | |
| Construction Details | Dimensions/Areas | Length |
| Width | ||
| Total Built-up Area (m2) | ||
| Covered Area (m2) | ||
| Exterior Annex (Majlis), Air-Conditioned (if any) | ||
| Area (m2) | ||
| Number of Floors | ||
| Floor Height (m) | ||
| Total Building Height (m) | ||
| Shape | Unit Orientation (long Façade facing) | |
| Building Shape | ||
| Other Areas | Basement | |
| Approx. Area (m2) | ||
| Double-Height Areas | ||
| Approx. Area (m2) | ||
| Wall Details | Type of Structure | |
| Type of Exterior Wall | ||
| Exterior Wall Insulation | ||
| Type of Insulation (if known) | ||
| North | ||
| East | ||
| South | ||
| West | ||
| Roof Details | Roof Type | |
| Roof Insulation | ||
| Type of Insulation (if known) | ||
| Parapet Wall | ||
| Height (m) | ||
| North | ||
| Number | ||
| Area | ||
| East | ||
| Number | ||
| Area | ||
| South | ||
| Number | ||
| Area | ||
| West | ||
| Number | ||
| Area | ||
| Green Roof | ||
| Opening in Roof—Skylights | ||
| Approx. Area (m2) | ||
| Glazing Details | Type of Window Material | |
| Type of Glazing | ||
| Type of Internal Shading | ||
| External Shading | ||
| North | ||
| Number | ||
| Area | ||
| Type | ||
| East | ||
| Number | ||
| Area | ||
| Type | ||
| South | ||
| Number | ||
| Area | ||
| Type | ||
| West | ||
| Number | ||
| Area | ||
| Type | ||
| Appliances | HVAC | HVAC System |
| Type of HVAC | ||
| C-H-Both | ||
| Number | ||
| Fan | ||
| Fan Type | ||
| Number | ||
| Heating System | ||
| Heating System Type | ||
| Number | ||
| Other Equipment | Domestic Hot Water (DHW) | |
| DHW Type | ||
| Water Pump Type | ||
| Dominate Lighting Type | ||
| House Elec. Voltage | ||
| Cooking Oven(s) | ||
| Oven/Stove Type | ||
| Refrigerator | ||
| Washing Machine | ||
| Clothes Dryer | ||
| Dishwasher | ||
| Microwave | ||
| TV(s) | ||
| Computer(s) | ||
| Ironing | ||
| Vacuum Cleaner | ||
| Air Purification | ||
| Humidifier | ||
| Tea Kettle | ||
| Food Blender | ||
| Play-Station | ||
| Others | ||
| Bills and EUI | Aver Electricity Bill/Month (SR) | |
| Aver Gas Bill/Month (SR) | ||
| Energy Use Index (EUI) |
| Lighting Type | Ext. Window Shading | Glazing Type | HVAC System Type | Envelope Insulation |
|---|---|---|---|---|
| LED | Yes | Double | Split AC | Yes |
| Incandescent | No | Single | Window | No |
| Fluorescent | Central | |||
| CFL |
| No. | Type | EUI (kWh/m2/yr.) | Energy Consumption | Total No. of Occupants | Lights | External Shading | Glazing Type | HVAC | Insulation | Recommendation(s) |
|---|---|---|---|---|---|---|---|---|---|---|
| 0 | Villa | 230.40 | High | 10 | X | O | X | X | X | Construct external window shading |
| 1 | Villa | 240.00 | High | 5 | X | O | O | X | O | Construct external window shading Change glazing type to double glazing Apply envelope insulation |
| 2 | Villa | 75.00 | Low | 10 | O | O | O | X | O | Use an HVAC system with higher EER |
| 3 | Villa | 70.13 | Low | 4 | O | O | O | O | O | Change lighting type to LED Construct external window shading Change glazing type to double glazing Use an HVAC system with higher EER Apply envelope insulation |
| 4 | Villa | 144.00 | High | 12 | O | O | X | X | X | Change lighting type to LED Construct external window shading |
| 5 | Villa | 360.00 | High | 11 | O | O | X | X | X | Change lighting type to LED Construct external window shading |
| 25 | Duplex | 175.14 | High | 6 | X | O | X | X | X | Change lighting type to LED Change glazing type to double glazing Use an HVAC system with higher EER Apply envelope insulation |
| 26 | Duplex | 240.00 | High | 6 | O | O | X | X | X | Change glazing type to double glazing Use an HVAC system with higher EER Apply envelope insulation |
| 27 | Duplex | 447.34 | High | 4 | O | O | O | X | O | Change lighting type to LED Construct external window shading Change glazing type to double glazing Apply envelope insulation |
| 28 | Duplex | 135.00 | High | 8 | O | O | X | X | X | Change lighting type to LED Construct external window shading |
| 29 | Duplex | 225.39 | High | 6 | O | X | O | X | O | Change lighting type to LED Change glazing type to double glazing Apply envelope insulation |
| 38 | Floor in Villa | 43.20 | Low | 4 | O | O | O | O | O | Change lighting type to LED Construct external window shading Change glazing type to double glazing Use an HVAC system with higher EER Apply envelope insulation |
| 39 | Floor in Villa | 42.63 | Low | 3 | O | O | X | X | X | Change lighting type to LED Construct external window shading |
| 40 | Floor in Villa | 152.83 | High | 5 | O | O | O | X | O | Change lighting type to LED Construct external window shading Change glazing type to double glazing Apply envelope insulation |
| 41 | Floor in Villa | 101.89 | High | 3 | X | O | X | X | X | Construct external window shading |
| 42 | Floor in Villa | 54.00 | Low | 3 | O | O | X | X | O | Change lighting type to LED Construct external window shading Apply envelope insulation |
| 43 | Apartment | 216.00 | High | 5 | O | O | O | O | O | Change lighting type to LED Construct external window shading Change glazing type to double glazing Use an HVAC system with higher EER Apply envelope insulation |
| 44 | Apartment | 246.86 | High | 4 | X | O | O | X | X | Construct external window shading Change glazing type to double glazing |
| 45 | Apartment | 332.31 | High | 4 | O | O | O | O | O | Change lighting type to LED Construct external window shading Change glazing type to double glazing Use an HVAC system with higher EER Apply envelope insulation |
| 46 | Apartment | 270.00 | High | 6 | O | O | O | O | X | Change lighting type to LED Construct external window shading Change glazing type to double glazing Use an HVAC system with higher EER |
| 47 | Apartment | 144.00 | High | 4 | O | O | O | X | X | Change lighting type to LED Construct external window shading Change glazing type to double glazing |
| 67 | Apartment | 72.00 | Low | 2 | O | O | O | X | X | Change lighting type to LED Construct external window shading Change glazing type to double glazing |
| 68 | Apartment | 204.00 | High | 5 | O | O | X | X | X | Change lighting type to LED Construct external window shading |
| 69 | Apartment | 154.29 | High | 4 | O | X | X | X | X | Change lighting type to LED |
| Coefficients a | ||||||
|---|---|---|---|---|---|---|
| Model | Unstandardized Coefficients | Standardized Coefficients | t | Sig. | ||
| B | Std. Error | Beta | ||||
| 1 | (Constant) | 1224.373 | 7697.302 | 0.159 | 0.874 | |
| Type | −103.696 | 49.323 | −0.274 | −2.102 | 0.038 | |
| Year of Construction | −0.518 | 3.881 | −0.012 | −0.134 | 0.894 | |
| Total Building Height (m) | 12.713 | 19.177 | 0.064 | 0.663 | 0.509 | |
| Total Number of Occupants | 7.05 | 22.1 | 0.034 | 0.319 | 0.75 | |
| Average Usage (m/y): | −77.577 | 90.006 | −0.071 | −0.862 | 0.391 | |
| Total household Appliances | 24.214 | 7.82 | 0.394 | 3.096 | 0.003 | |
| Oven/Stove Type | 15.044 | 83.615 | 0.015 | 0.18 | 0.858 | |
| Type | Total Number of Occupants | Average Usage (m/y): | Total Household Appliances | Avg. Electricity Bill/Month (SR) | Aver Gas Bill/Month (SR) | Total Building Height (m) | |
|---|---|---|---|---|---|---|---|
| Type | |||||||
| Total Number of Occupants | −0.544 ** | ||||||
| Average Usage (m/y): | −0.02 | 0.049 | |||||
| Total Household Appliances | −0.715 ** | 0.606 ** | −0.114 | ||||
| Avg Electricity Bill/Month (SR) | −0.547 ** | 0.413 ** | −0.103 | 0.608 ** | |||
| Avg. Gas Bill/Month (SR) | −0.594 ** | 0.476 ** | −0.064 | 0.631 ** | 0.643 ** | ||
| Total Building Height (m) | 0.396 ** | −0.157 | −0.04 | −0.154 | −0.135 | −0.215 |
| Levene’s Test for Equality of Variances | t-Test for Equality of Means | |||||||||
|---|---|---|---|---|---|---|---|---|---|---|
| F | Sig. | t | df | Sig. (Two-Tailed) | Mean Difference | Std. Error Difference | 95% Confidence Interval of the Difference | |||
| Lower | Upper | |||||||||
| Average Gas Bill/Month (SR) | Equal variances assumed | 4.828 | 0.031 | 0.535 | 69 | 0.595 | 2.445 | 4.573 | −6.679 | 11.568 |
| Equal variances not assumed | 0.468 | 32.008 | 0.643 | 2.445 | 5.227 | −8.203 | 13.092 | |||
Disclaimer/Publisher’s Note: The statements, opinions and data contained in all publications are solely those of the individual author(s) and contributor(s) and not of MDPI and/or the editor(s). MDPI and/or the editor(s) disclaim responsibility for any injury to people or property resulting from any ideas, methods, instructions or products referred to in the content. |
© 2024 by the authors. Licensee MDPI, Basel, Switzerland. This article is an open access article distributed under the terms and conditions of the Creative Commons Attribution (CC BY) license (https://creativecommons.org/licenses/by/4.0/).
Share and Cite
Ahmed, W.; Al-Ramadan, B.; Asif, M.; Adamu, Z. A GIS-Based Top-Down Approach to Support Energy Retrofitting for Smart Urban Neighborhoods. Buildings 2024, 14, 809. https://doi.org/10.3390/buildings14030809
Ahmed W, Al-Ramadan B, Asif M, Adamu Z. A GIS-Based Top-Down Approach to Support Energy Retrofitting for Smart Urban Neighborhoods. Buildings. 2024; 14(3):809. https://doi.org/10.3390/buildings14030809
Chicago/Turabian StyleAhmed, Wahhaj, Baqer Al-Ramadan, Muhammad Asif, and Zulfikar Adamu. 2024. "A GIS-Based Top-Down Approach to Support Energy Retrofitting for Smart Urban Neighborhoods" Buildings 14, no. 3: 809. https://doi.org/10.3390/buildings14030809