
Smart Fire Safety Management System (SFSMS) Connected with Energy Management for Sustainable Service in Smart Building Infrastructures
 , , , , ,
Abstract
:1. Introduction
1.1. Core Digital Technology of Smart Building: Internet of Things, Big Data, and AI
1.2. Necessity of Building Safety Management System Based on Digital Technology
1.3. Safety, Energy Efficiency, and User Convenience in Buildings
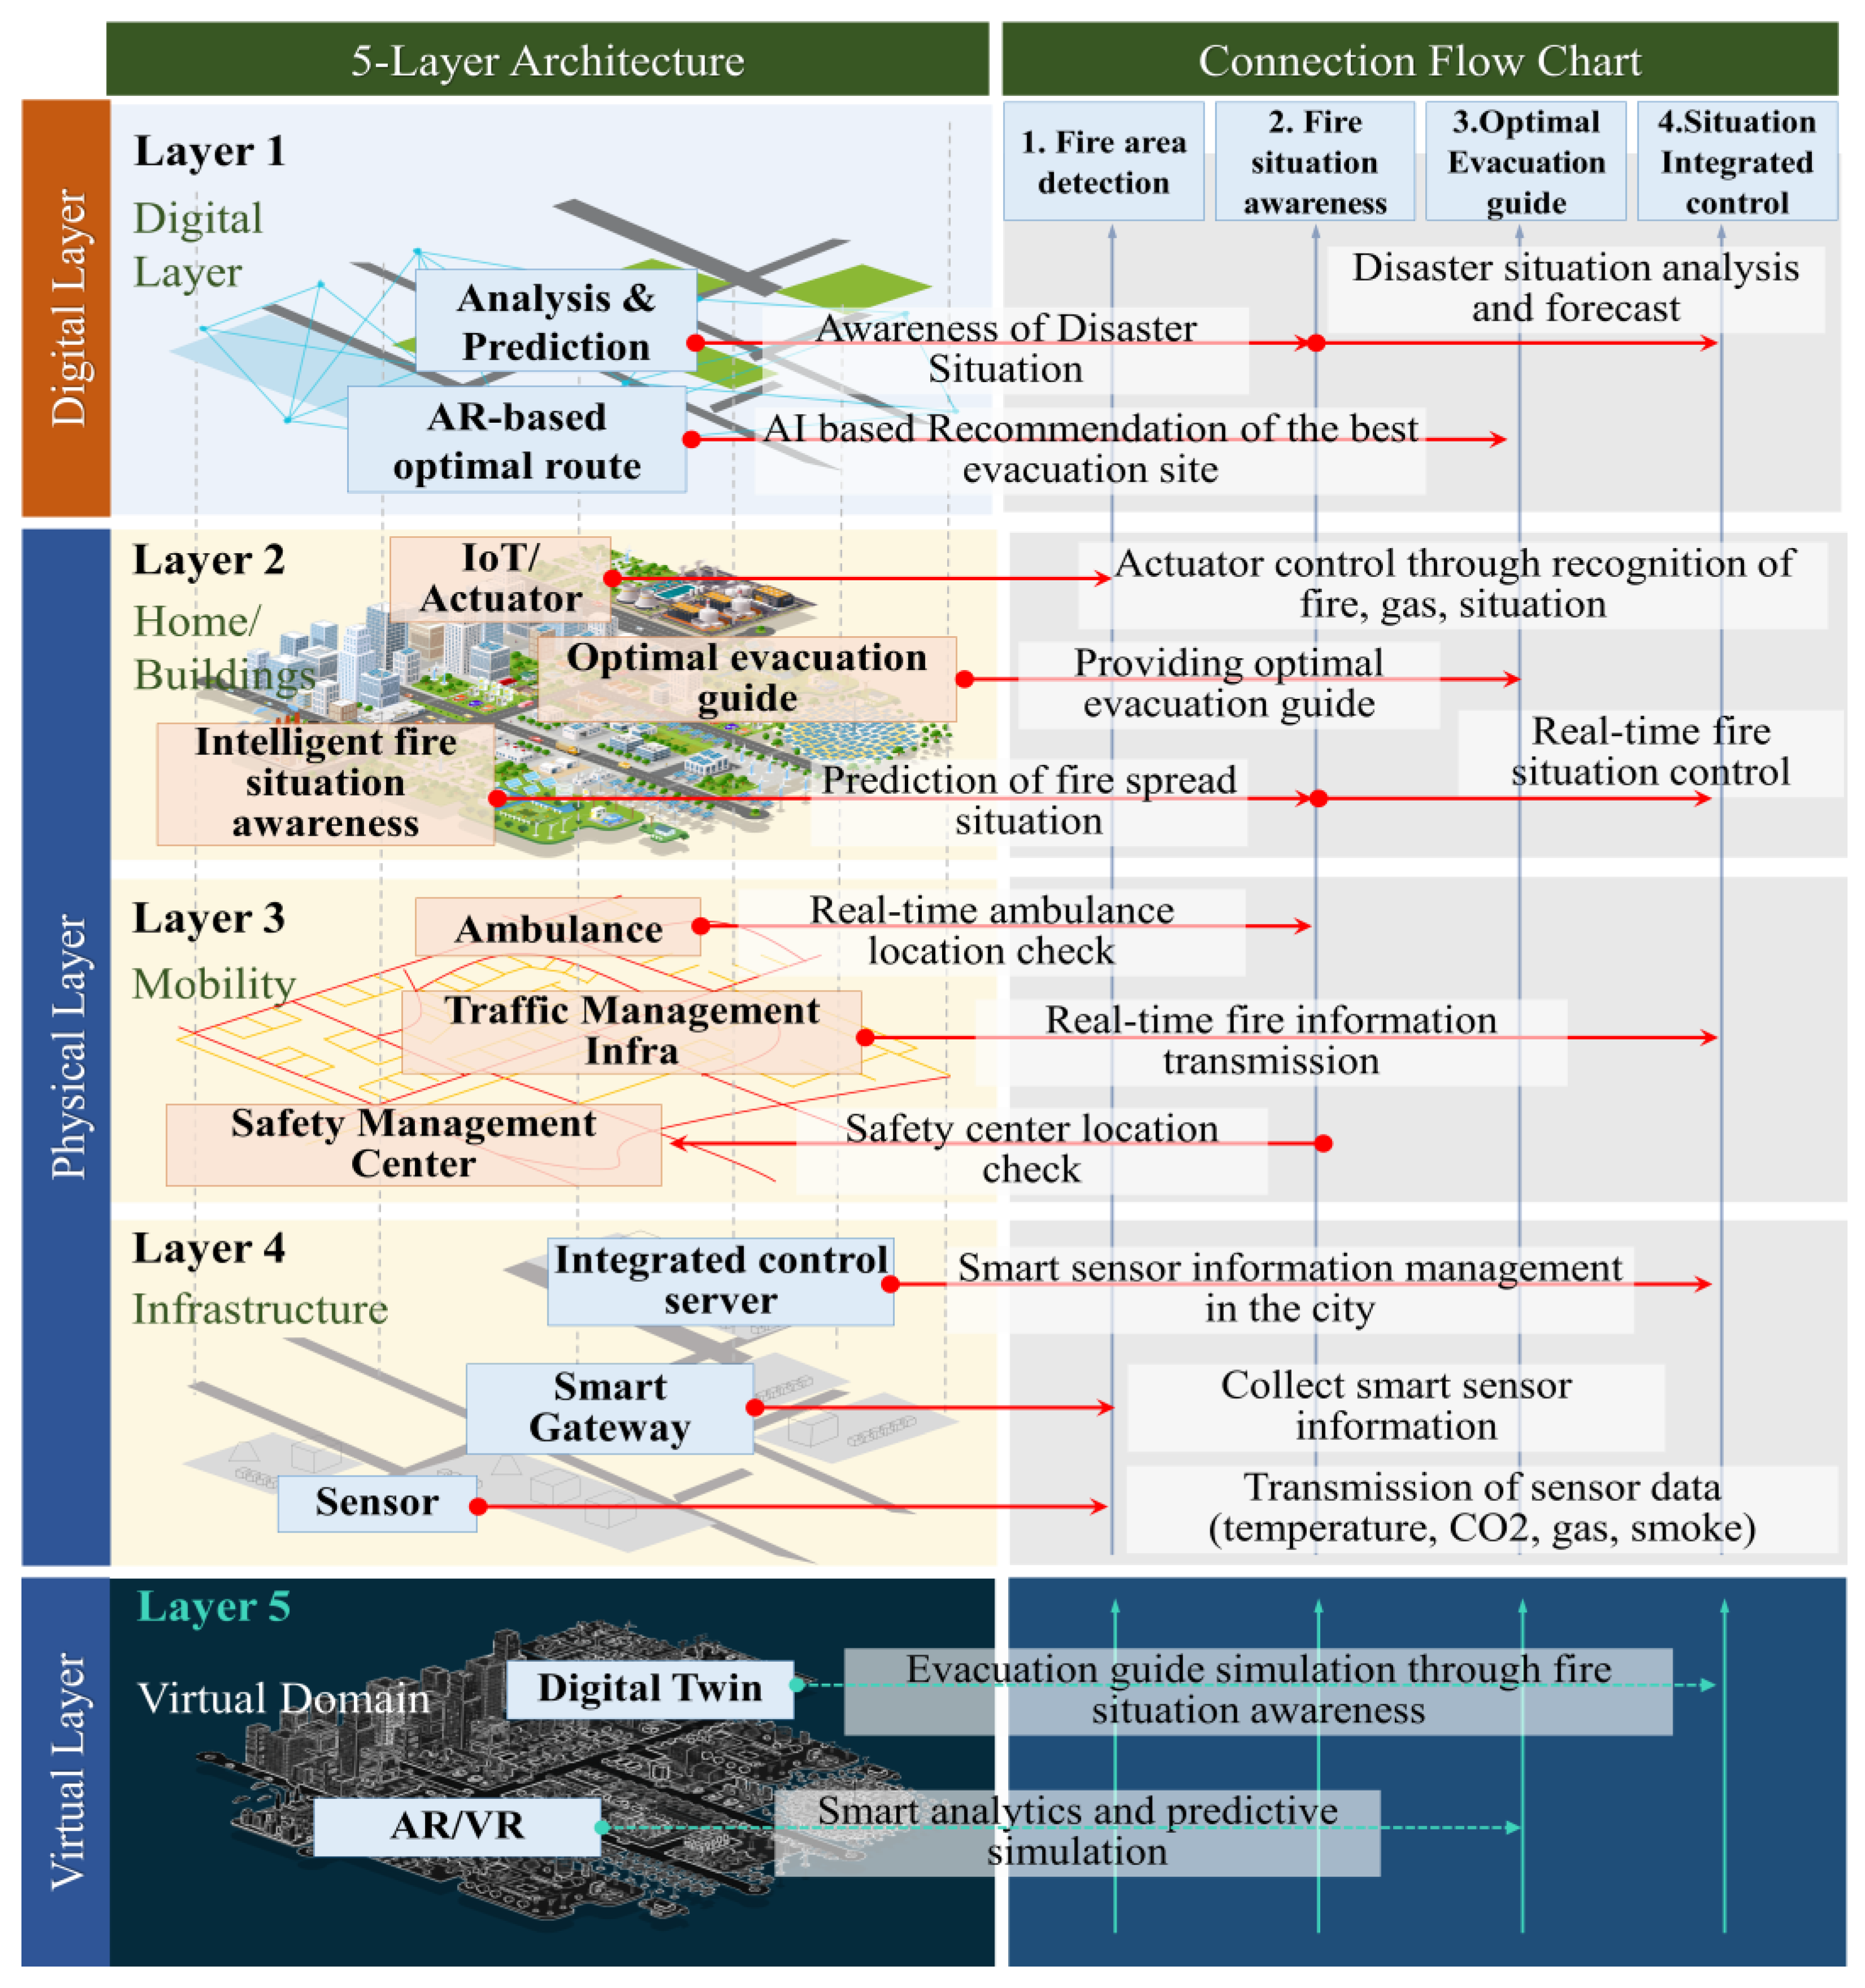
- In Section 3, we introduce the city-based five-layer architecture and present the connectivity of safety management strategy through the five-layer connection method.
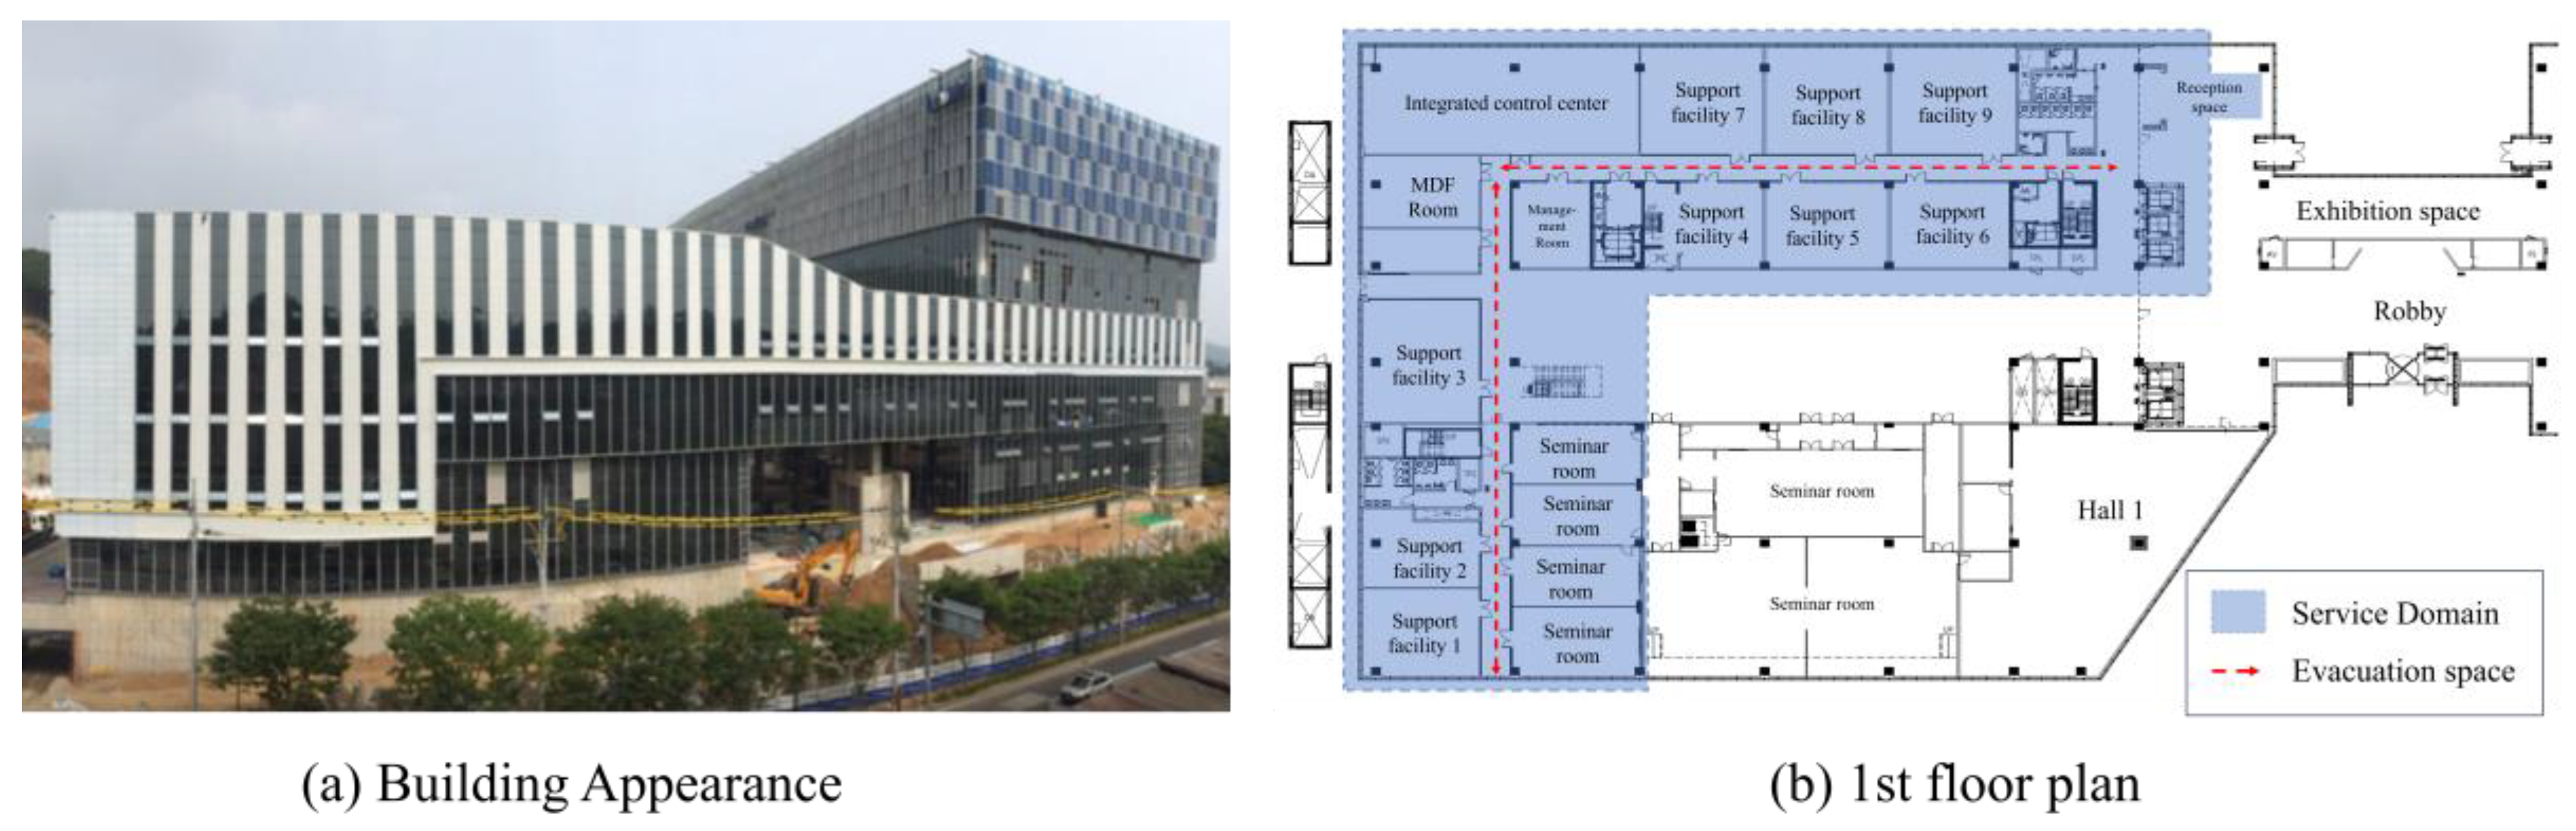
- We design a smart fire safety management system (SFSMS) and propose a mobile/web-type application service for an optimal evacuation location in the A building in Korea.
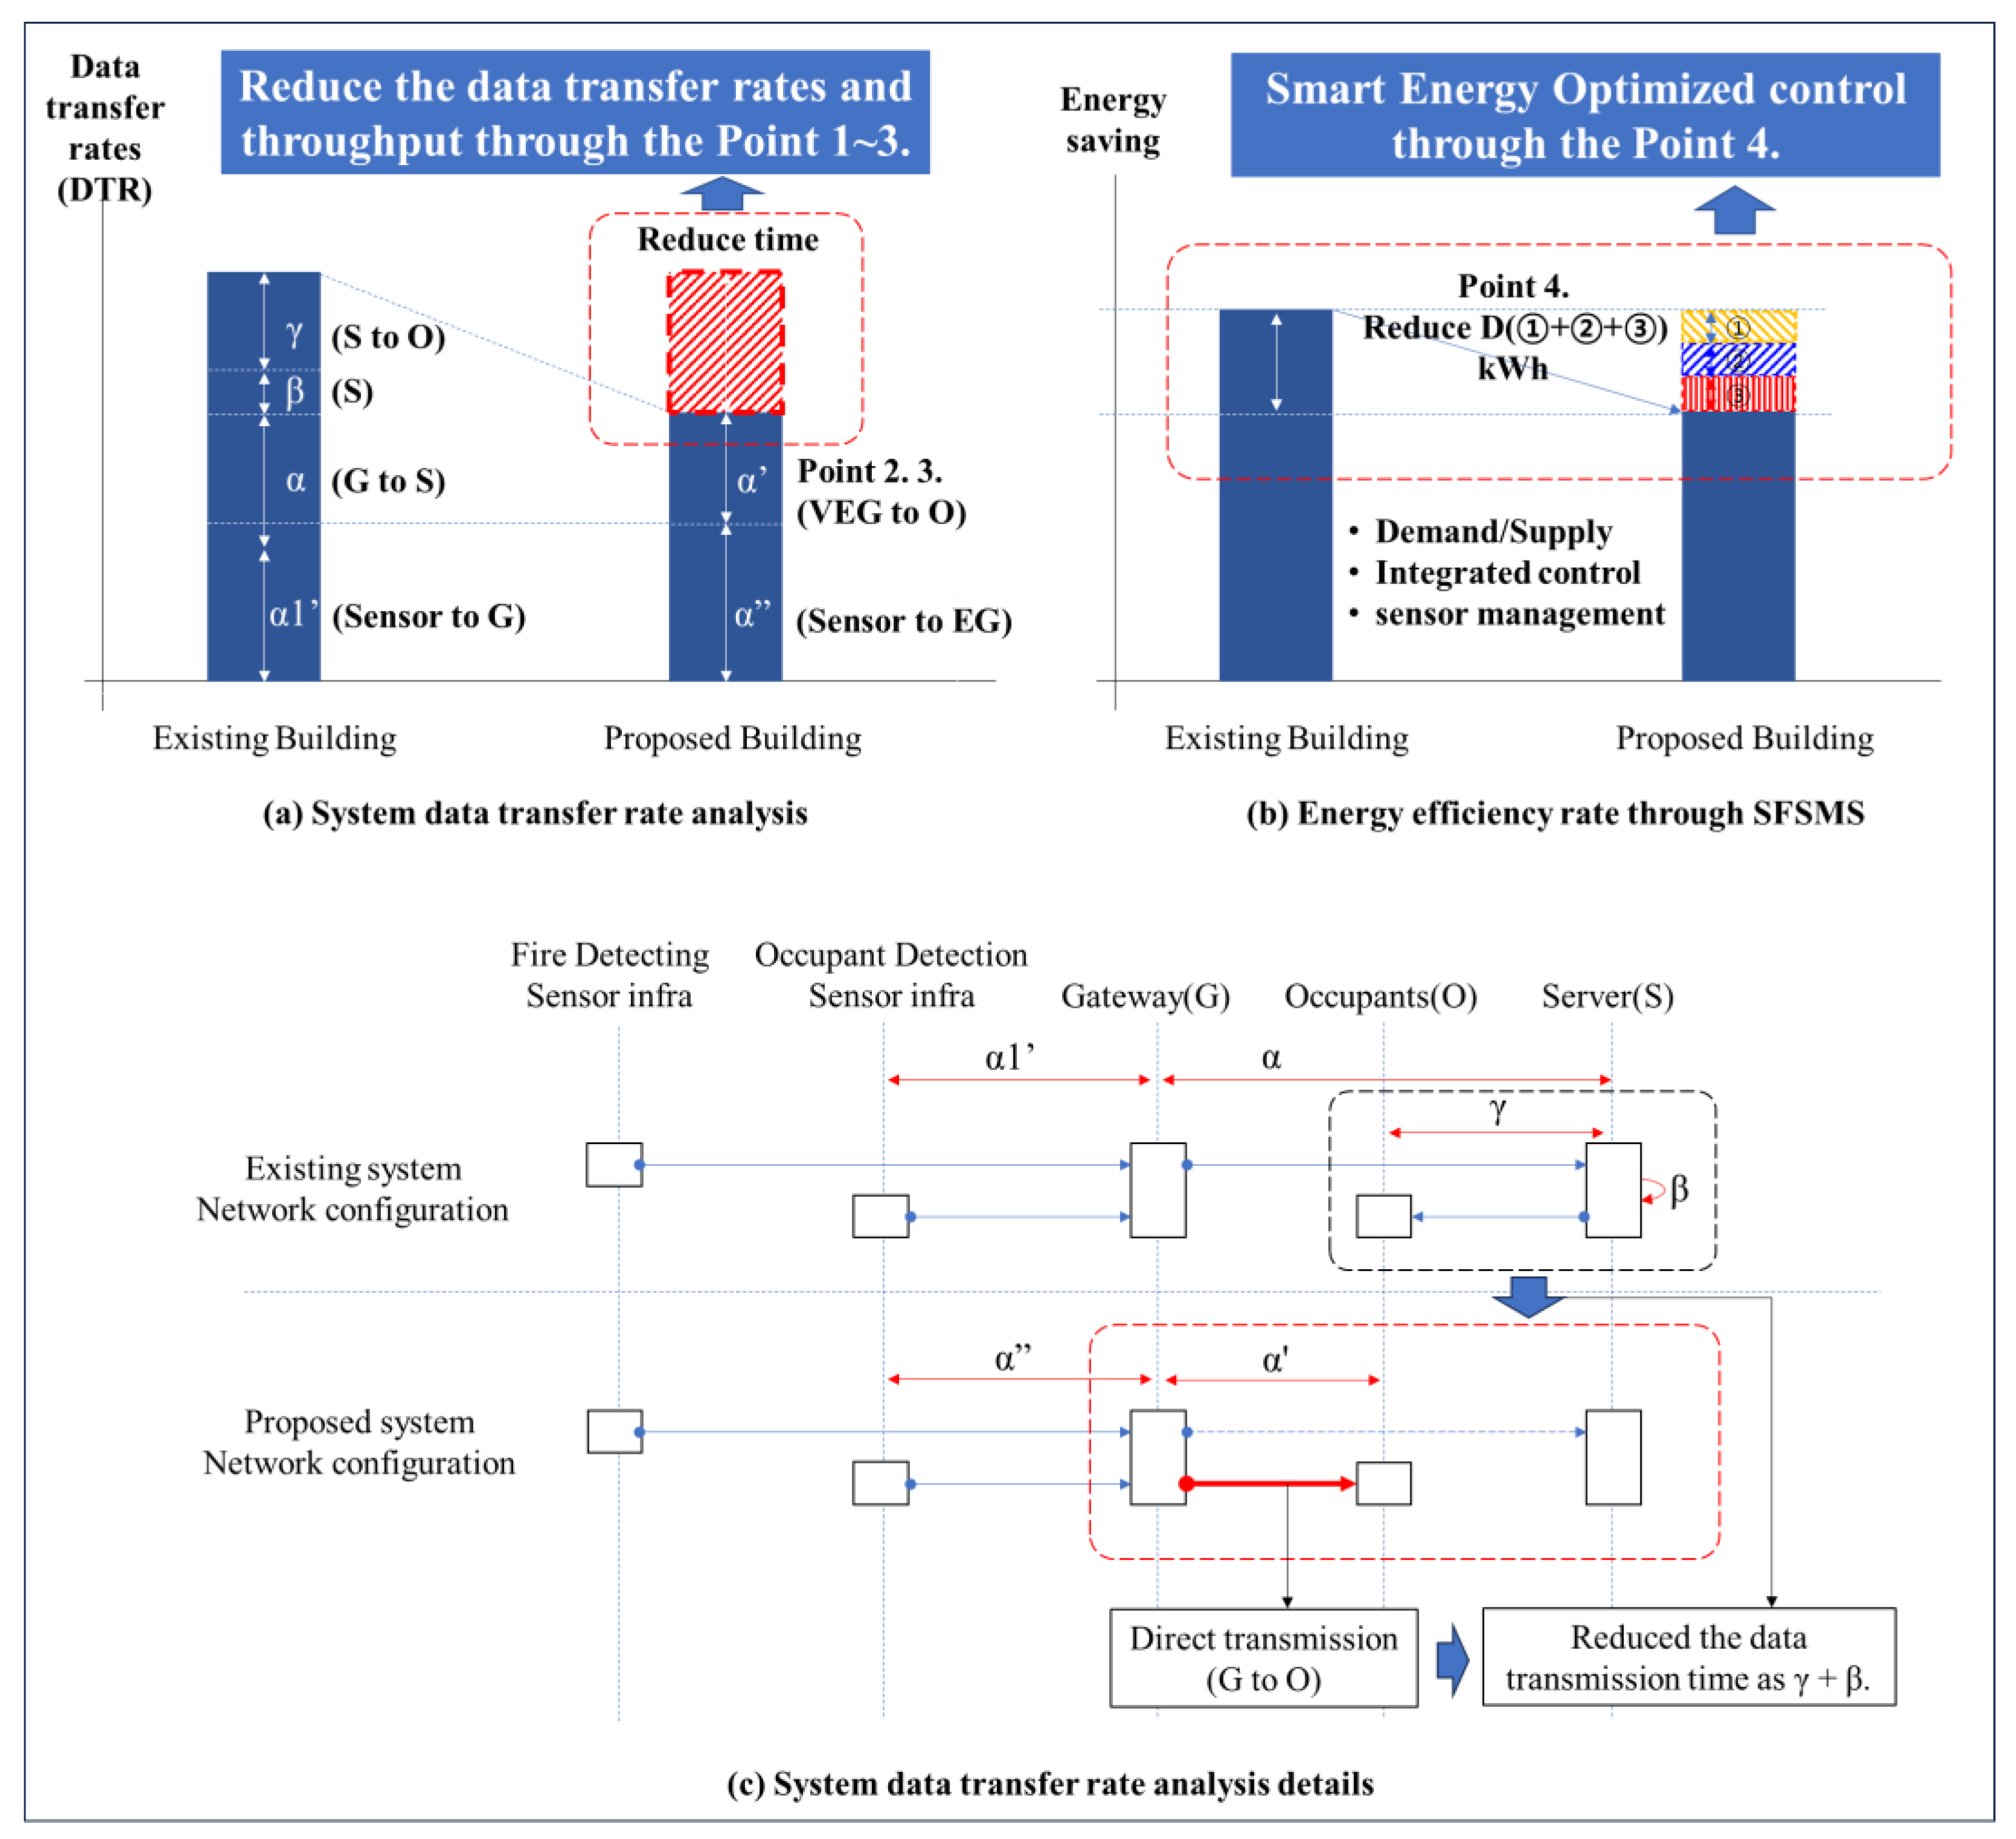
- The proposed system transmits data to the cloud server in real time through the VEG internal network. Reduce the safety data transfer rates and throughput through the VEG.
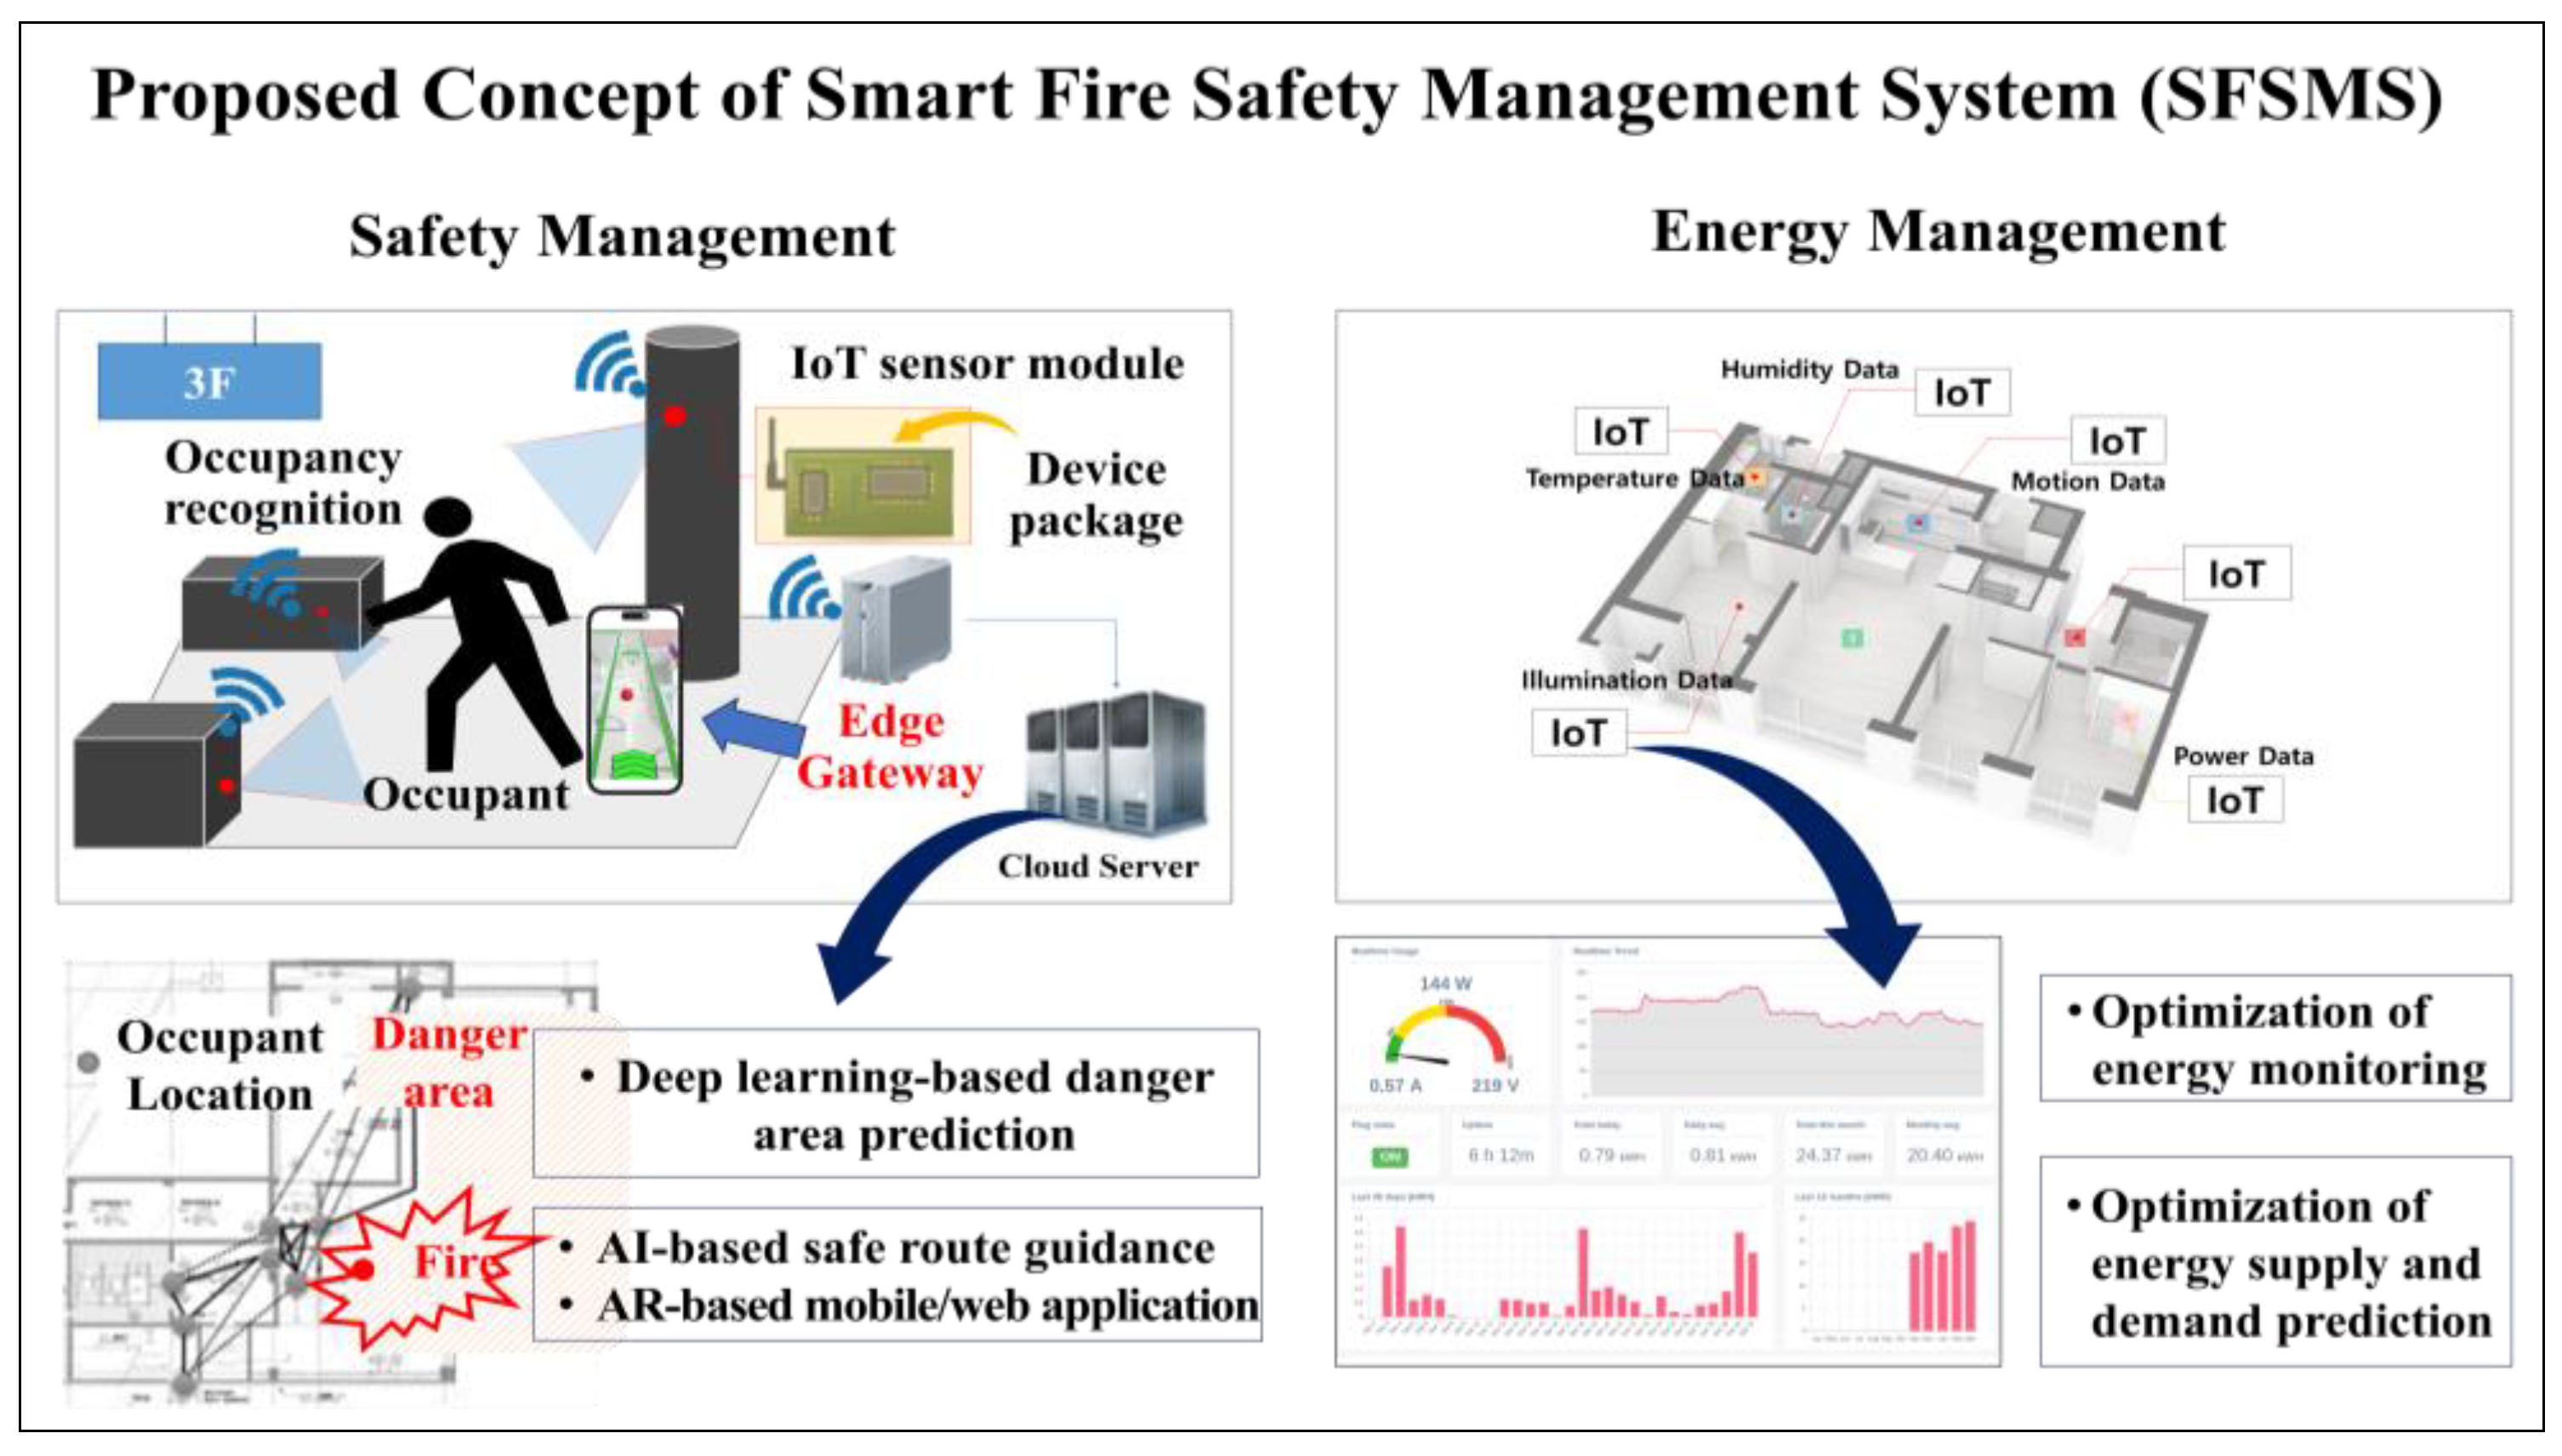
- We introduce a safety and energy convergence system that is capable of energy monitoring and a safety management system.
2. Related Work
2.1. Fire Safety and Energy Management
2.2. Fire Safety Management
2.3. Mobile Applications for Fire Safety Management
2.4. BIM-Based Visualization for Fire Safety Management
2.5. Wildfire Detection Using UAVs
2.6. Smart Energy
3. System Architecture
3.1. Five-Layer Architecture in Smart City for Proposed System
3.1.1. Digital Layer
3.1.2. Physical Layer
3.1.3. Virtual Layer
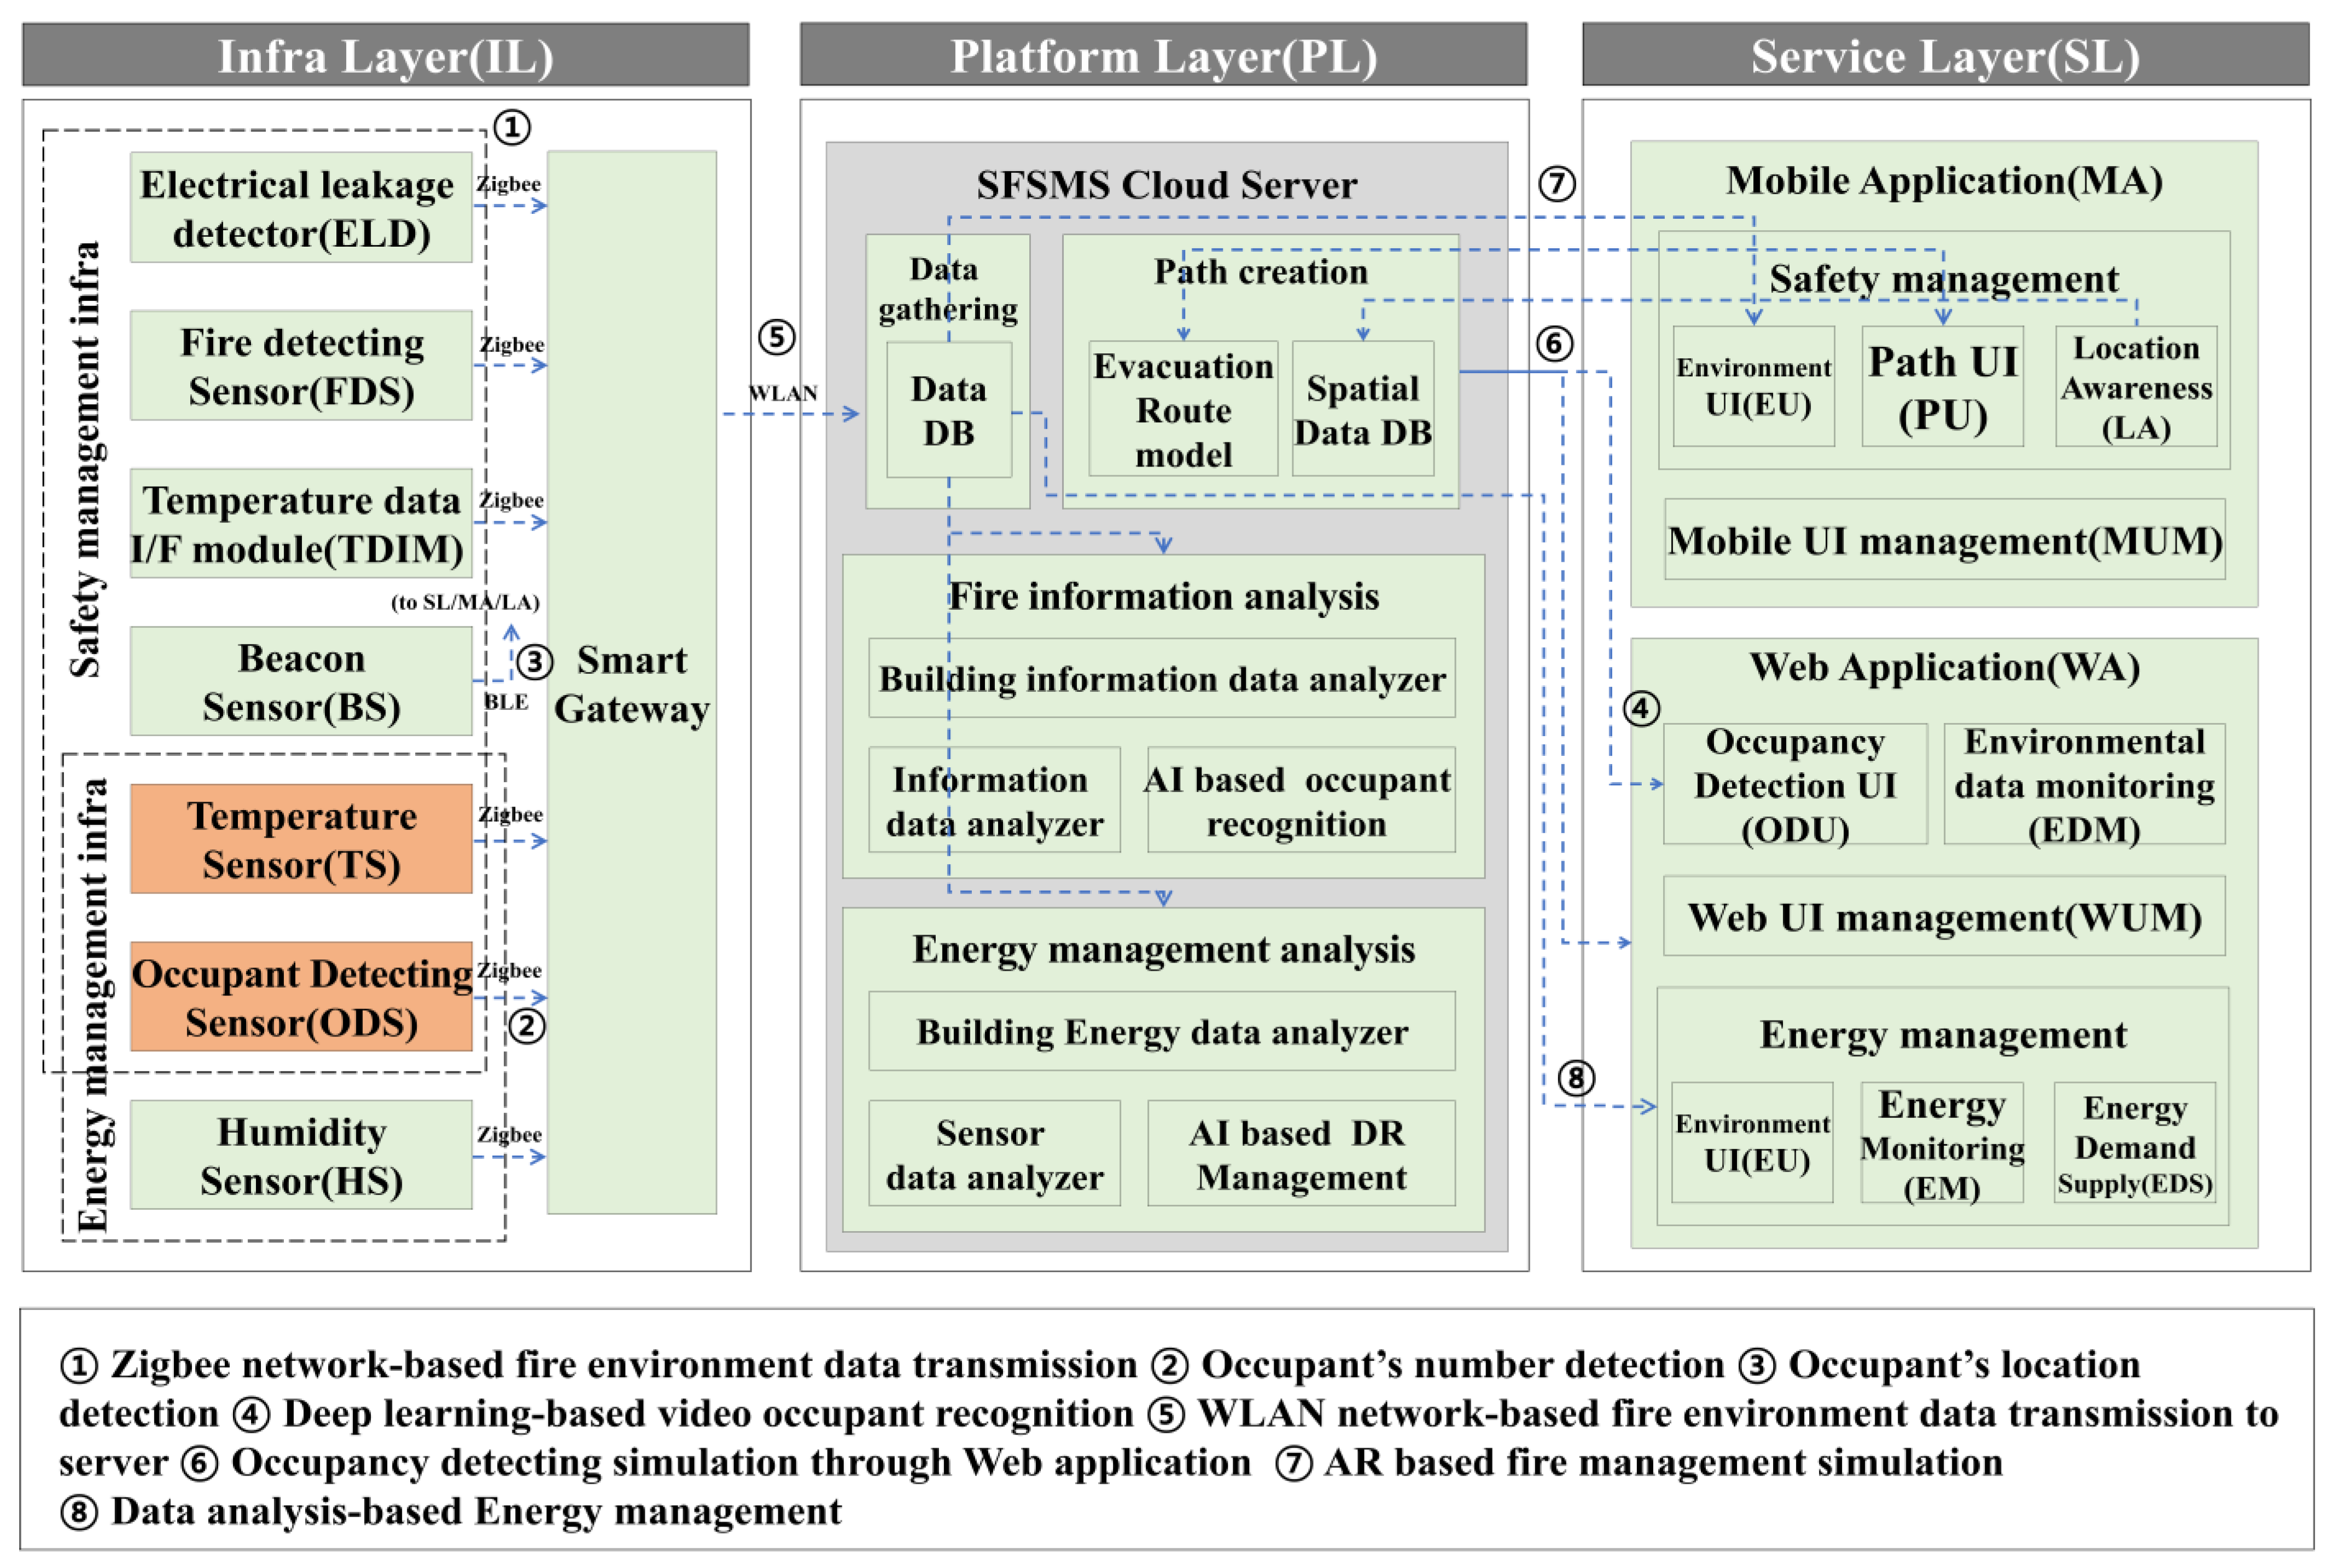
3.2. SFSMS Architecture
3.2.1. Service Layer
3.2.2. Platform Layer
3.2.3. Infrastructure Layer
4. System and Configuration
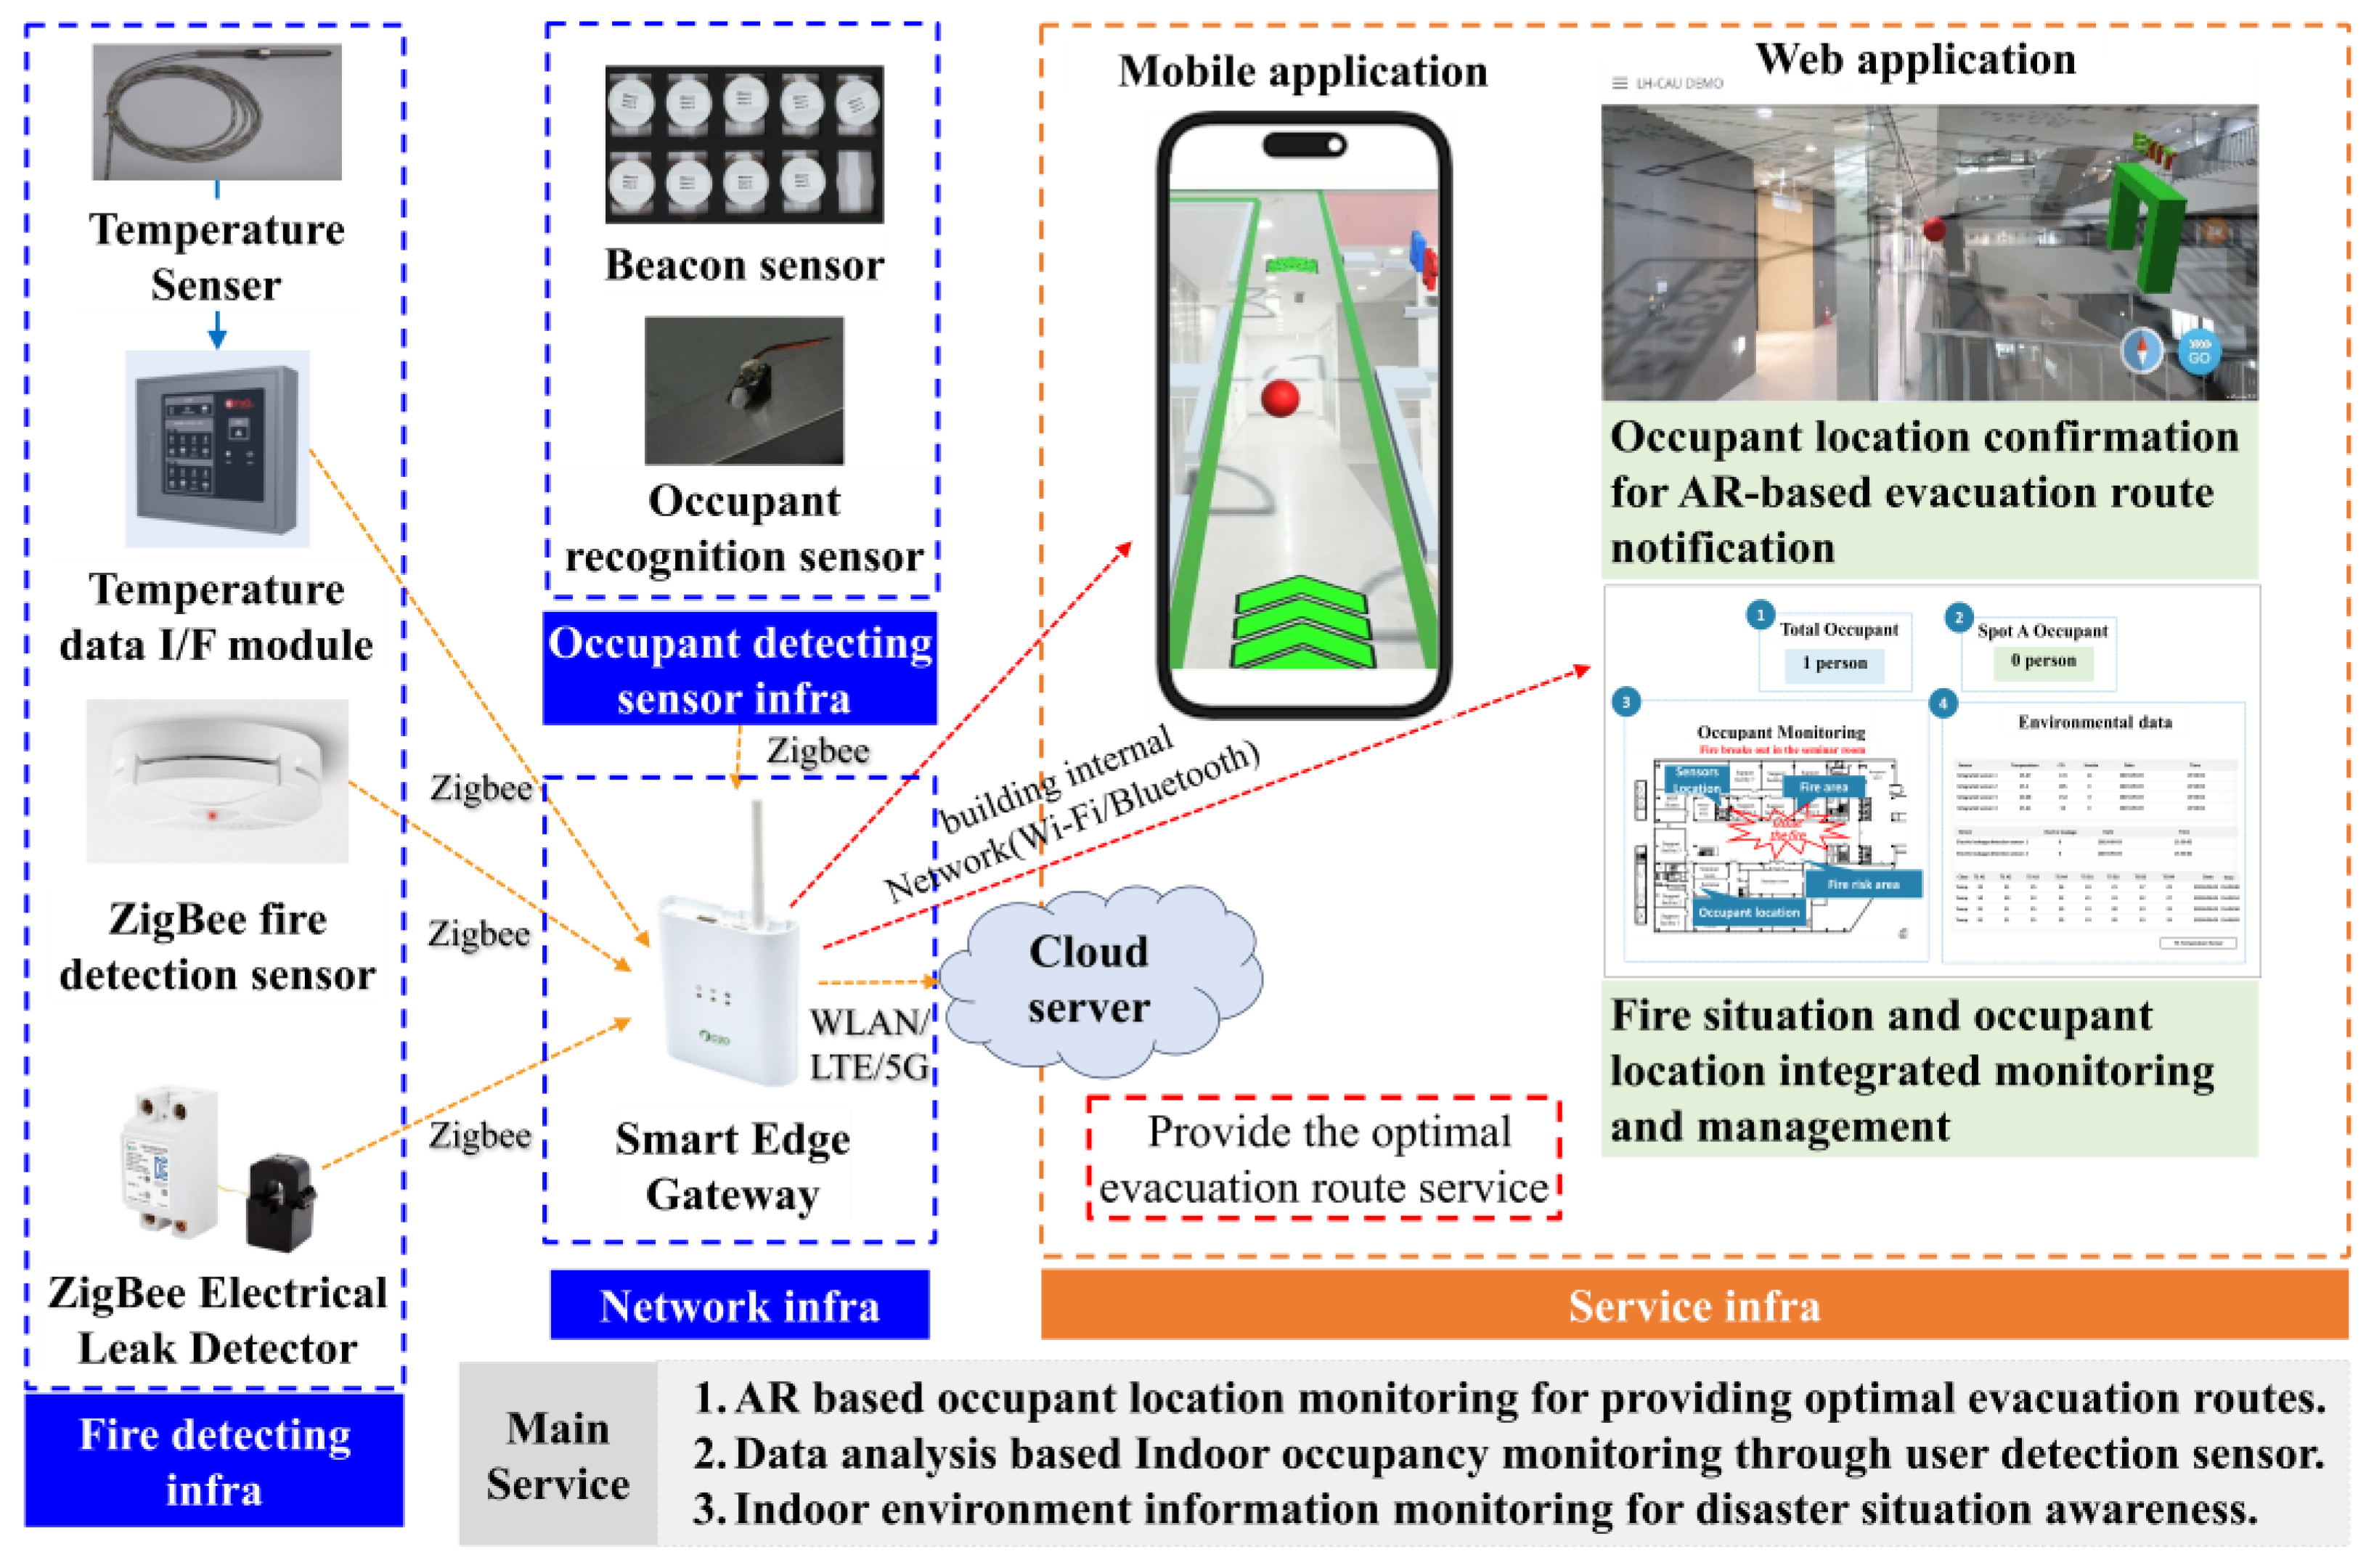
4.1. Overview of the SFSMS in the Building Domain
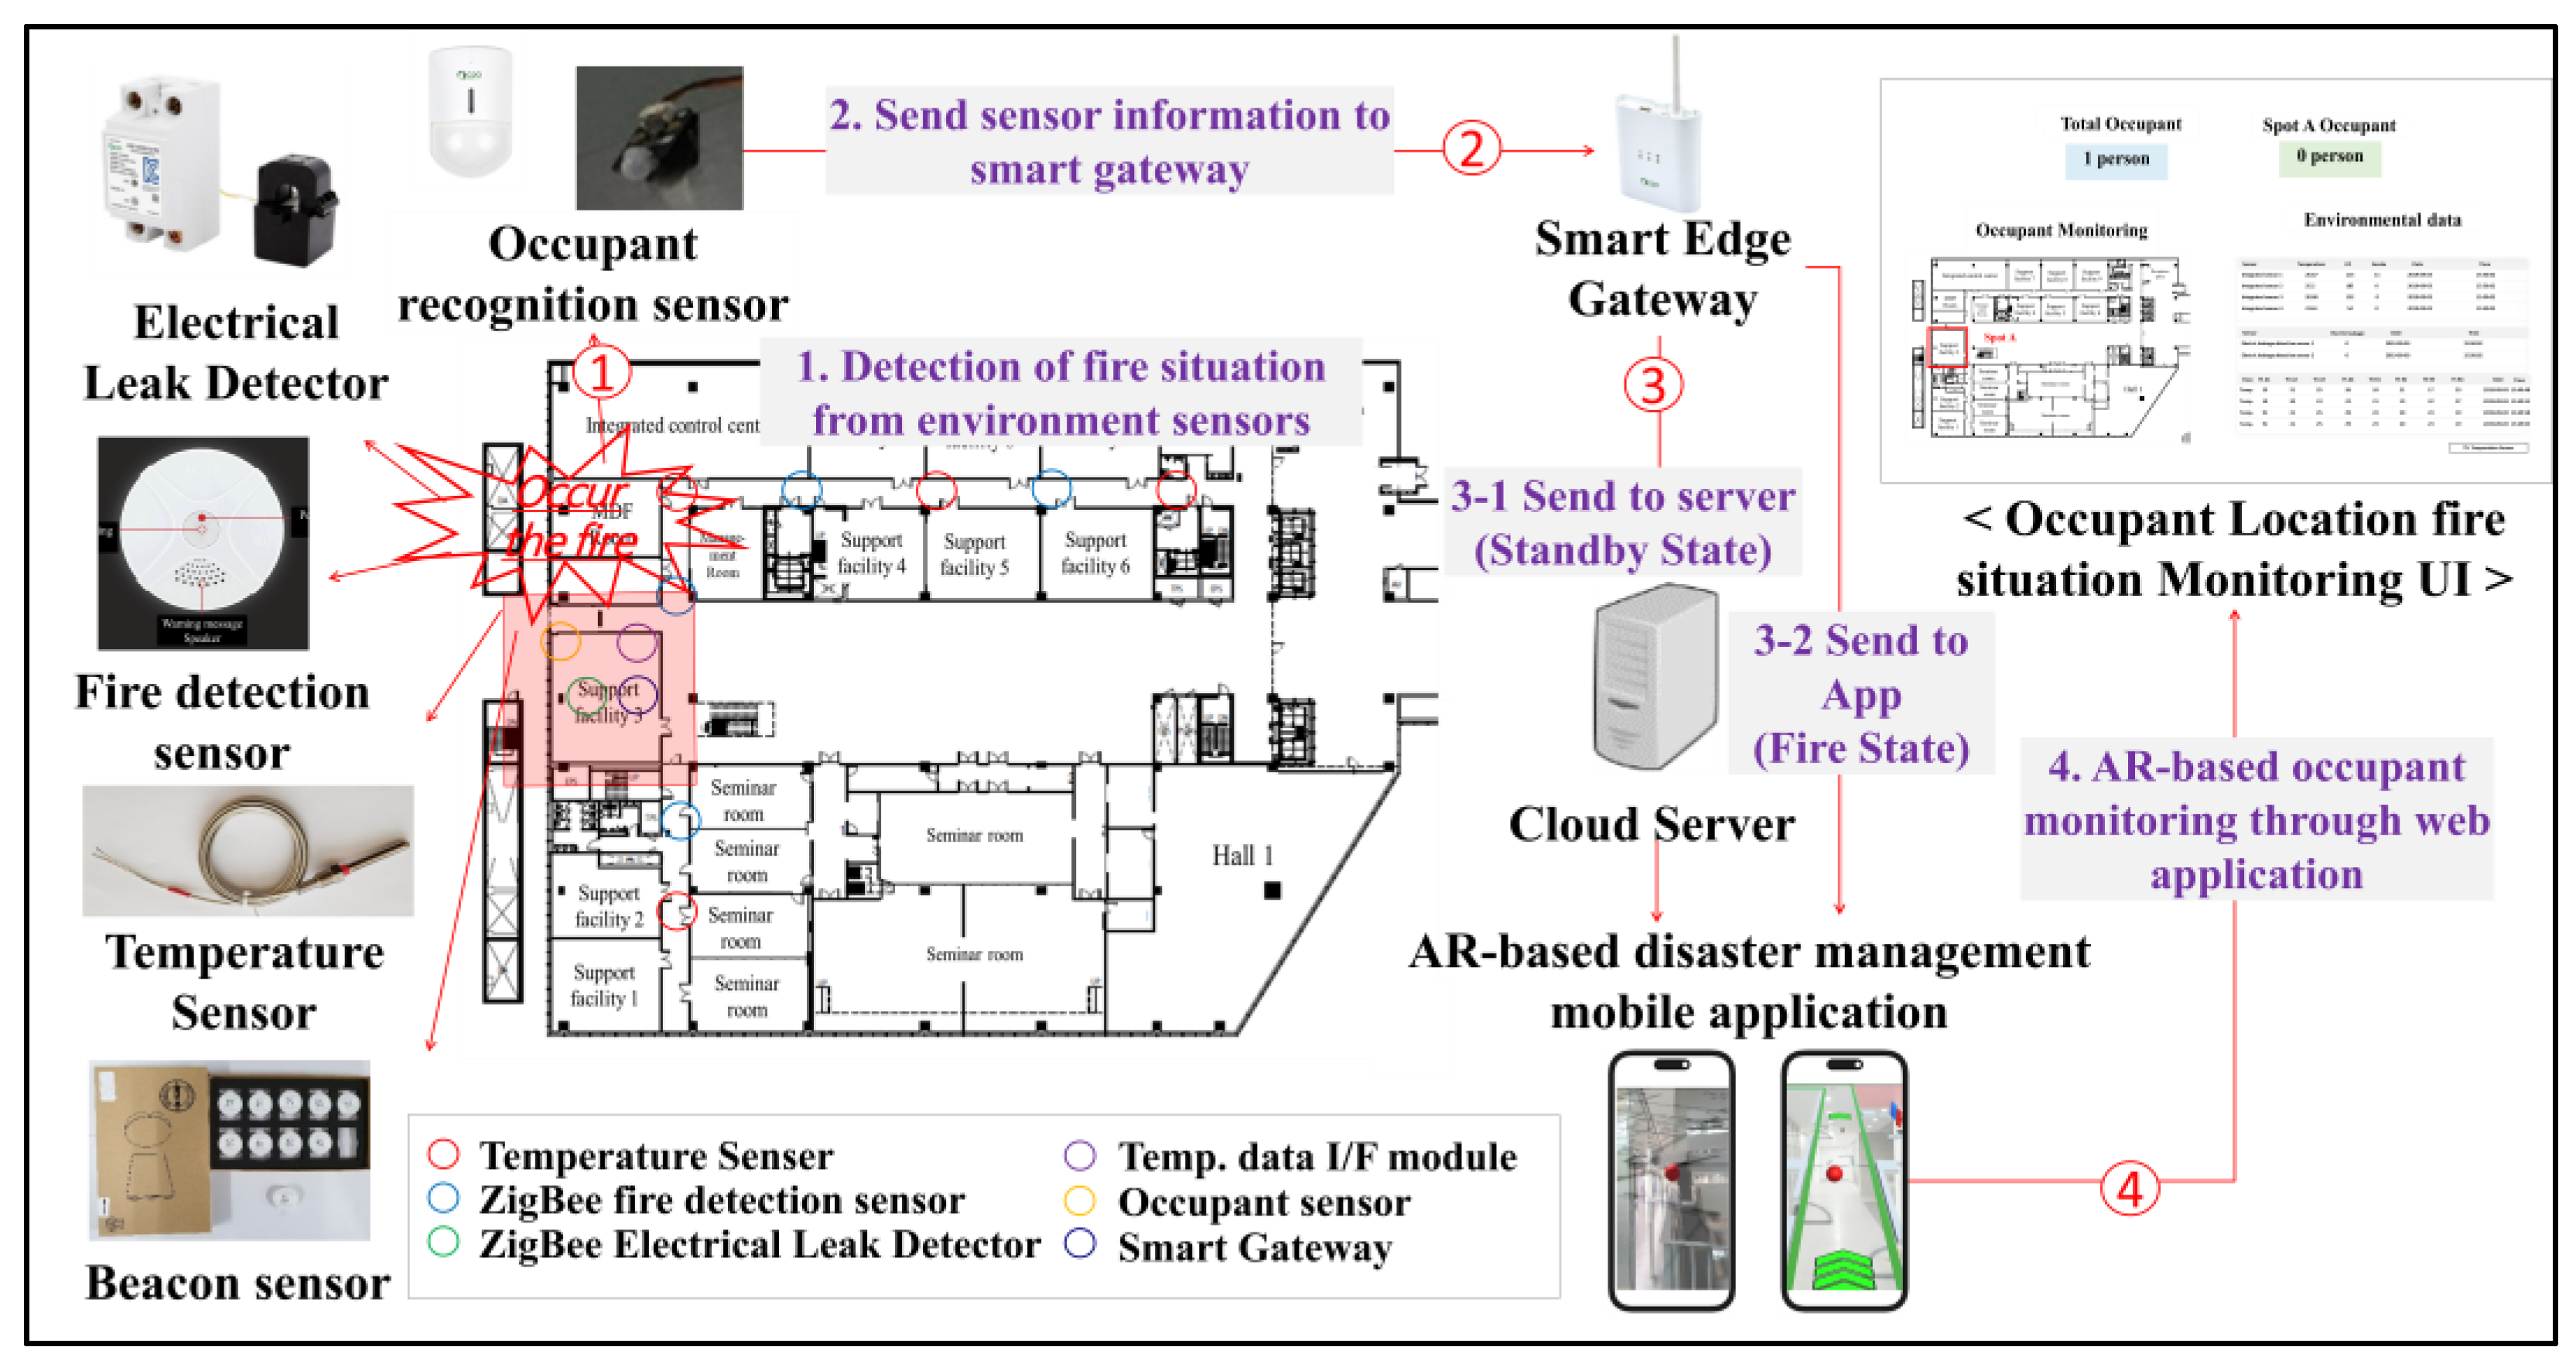
4.1.1. Overview of the SFSMS
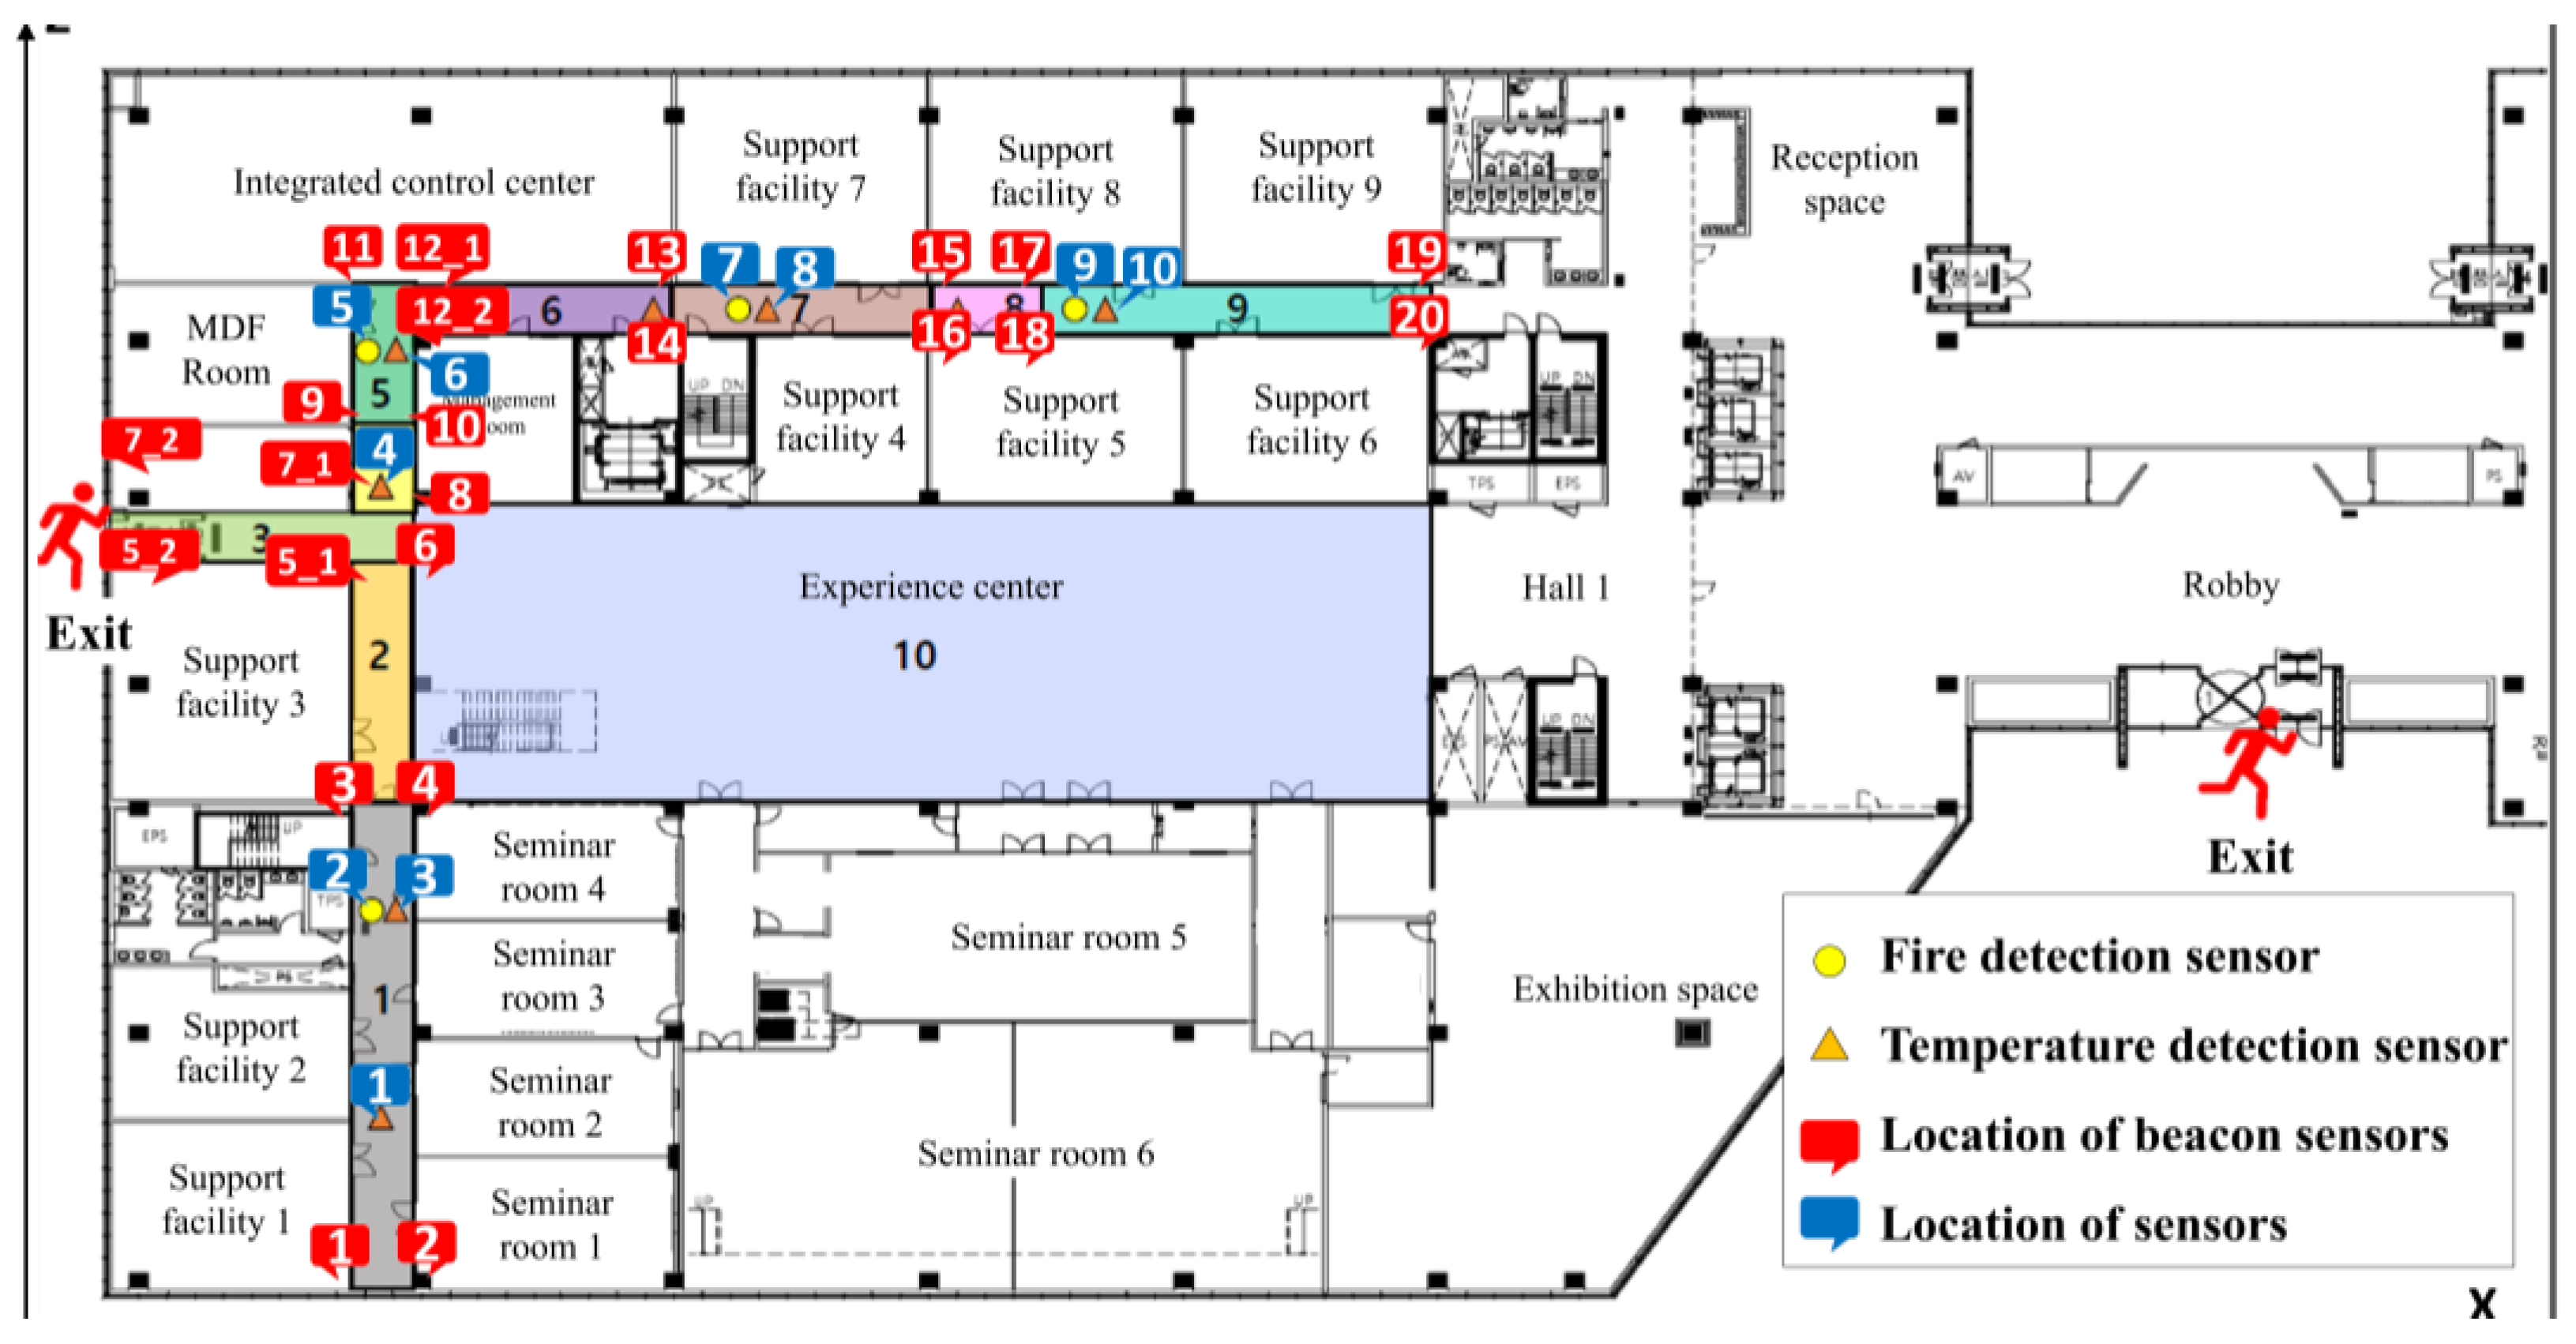
4.1.2. Location of Sensors in the Building Testbed
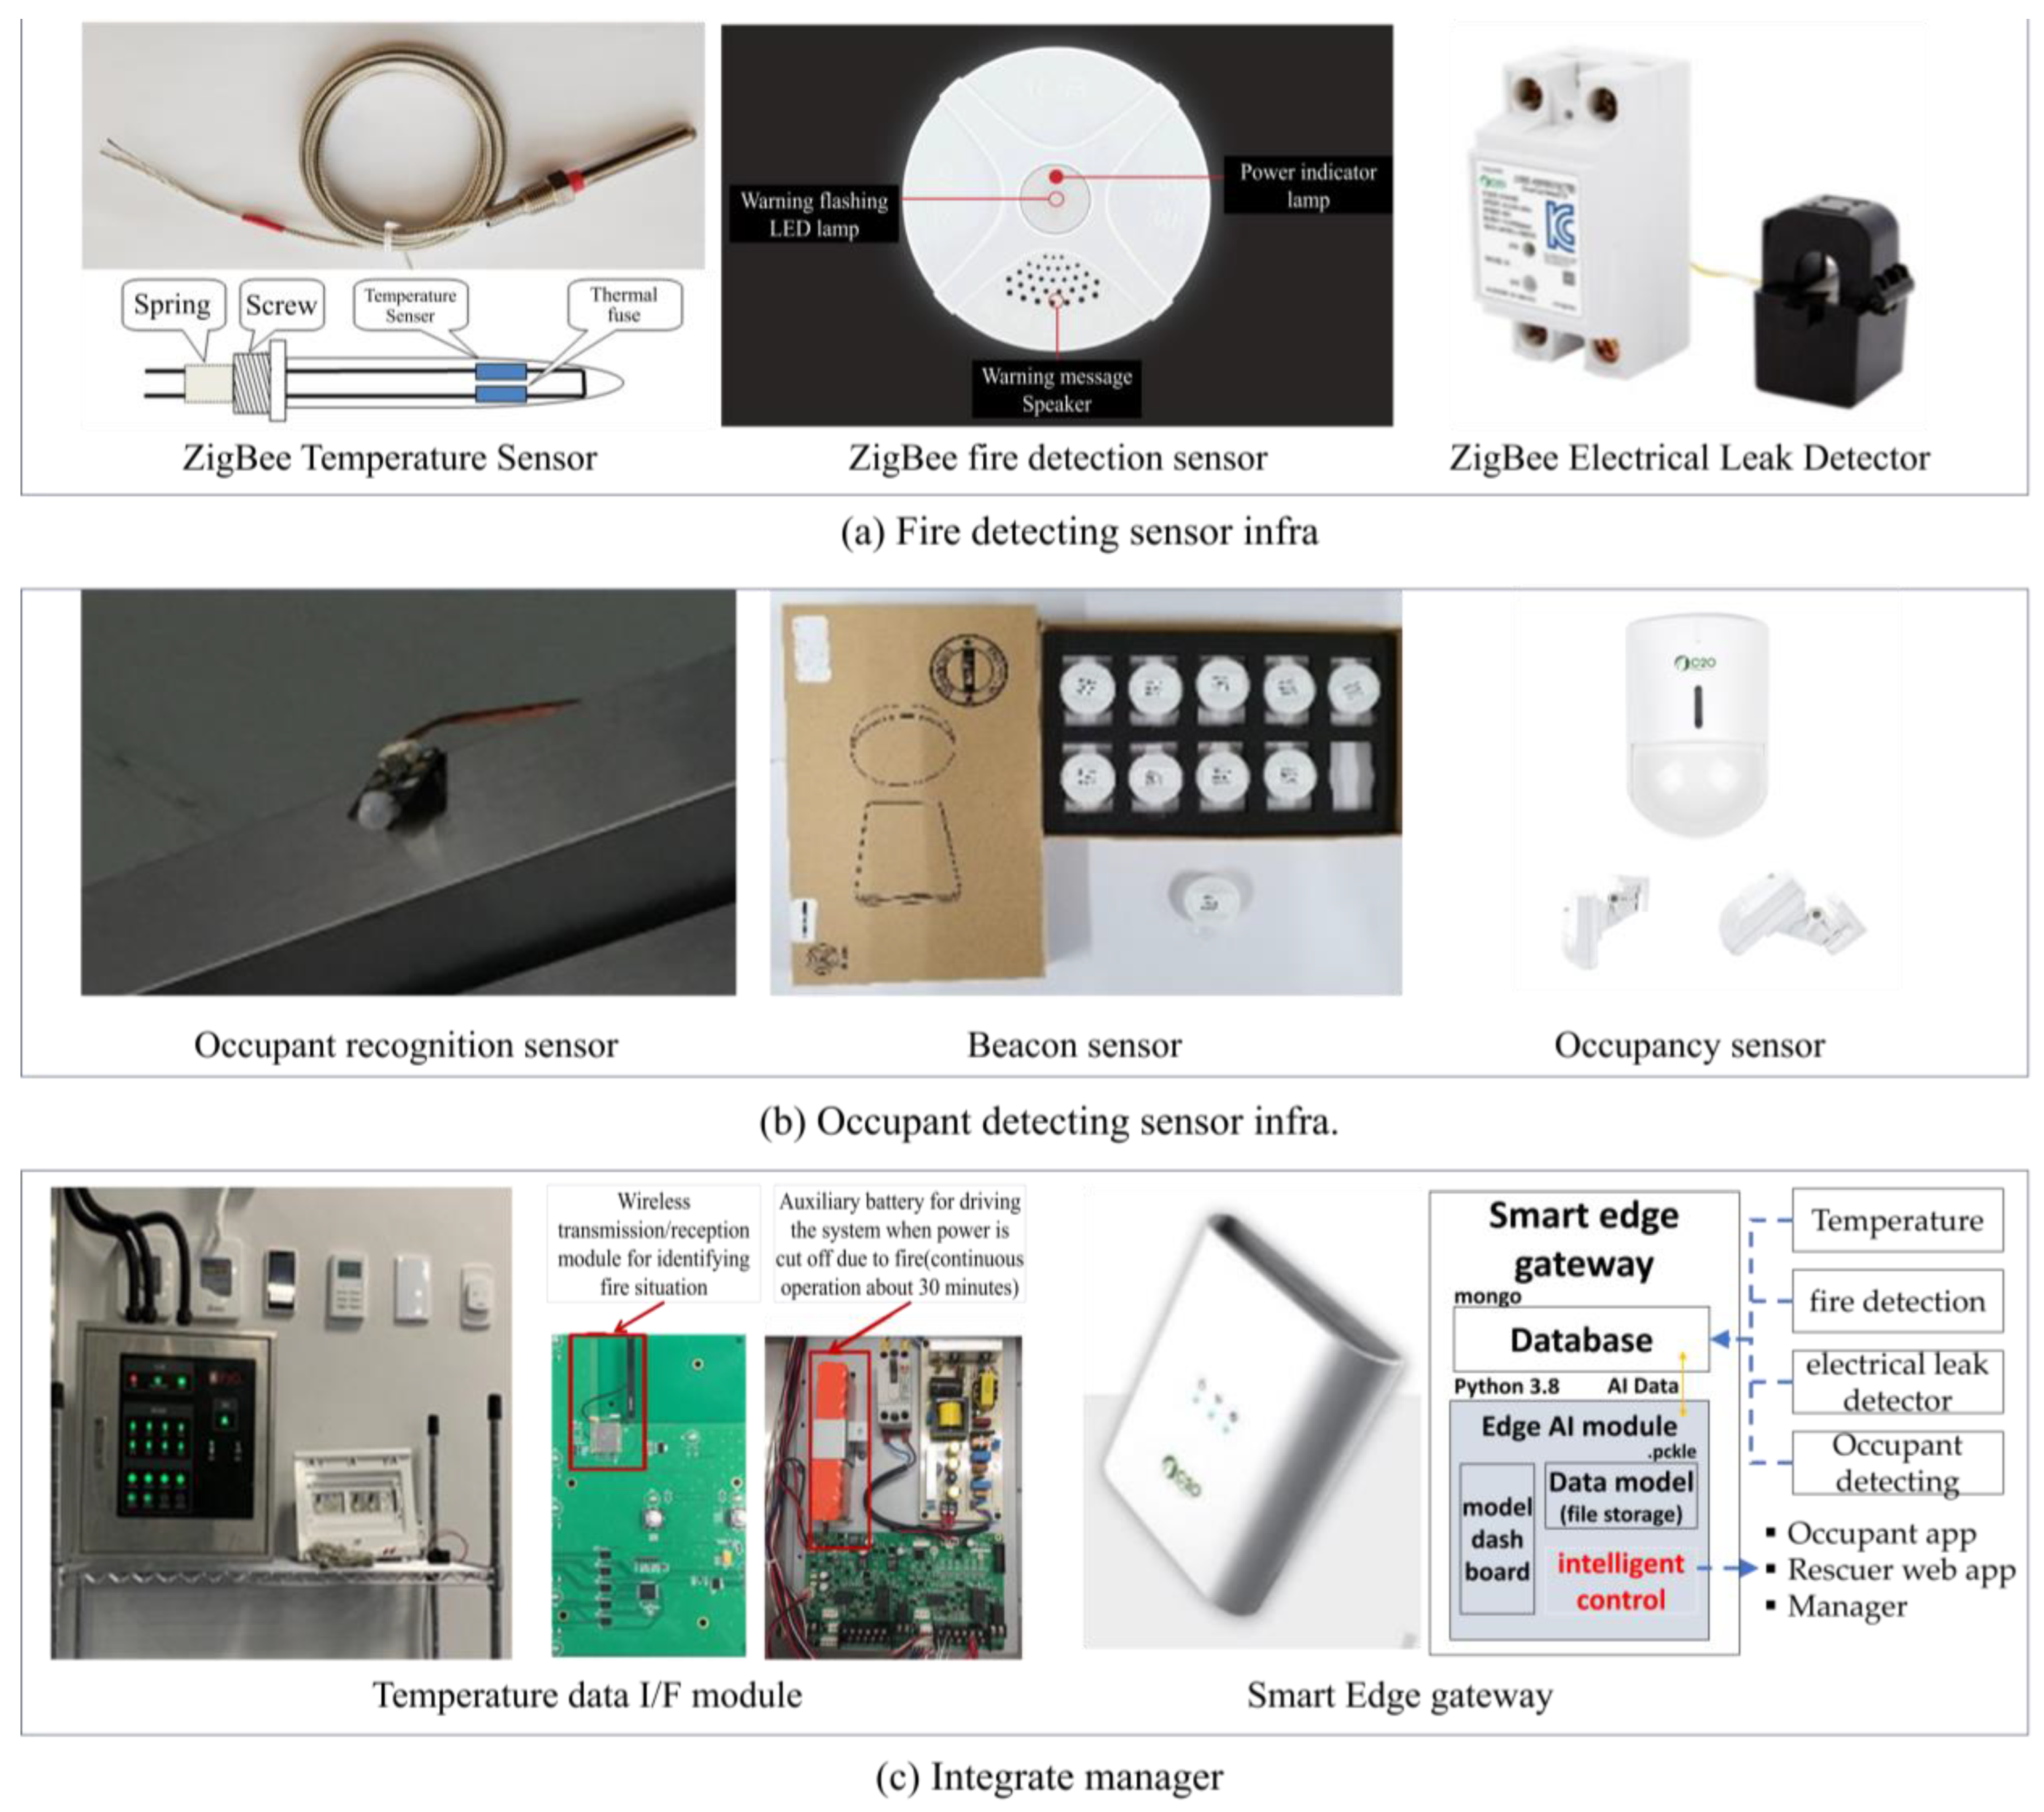
4.2. SFSMS IoT Devices (Infrastructure Layer)
4.2.1. Fire Detecting Sensor Infra.
4.2.2. Occupant Detecting Sensor Infra.
4.2.3. Integrated Manager (Temperature Data I/F Module, Smart Edge Gateway)
4.3. SFSMS Platform (Platform Layer)
Cloud-Based Web Server for SFSMS
- Cloud server: Instance A
- ▪
- Environment data collection cycle setting function;
- ▪
- Periodic data collection function through API (such as temperature, CO, and smoke);
- ▪
- API_A function that can handle requests of mobile applications and Instance B;
- ▪
- Fire situation recognition function through environmental data;
- ▪
- PUSH message notification function to mobile application when fire situation is recognized.
- Cloud server: Instance B
- ▪
- Evacuation route model generation cycle setting function;
- ▪
- Periodic generation or renewal of evacuation route through unsupervised learning method;
- ▪
- Ability to process requests from mobile applications through Socket.io;
- ▪
- Real-time communication function through mobile and web applications and Socket.io;
- ▪
- Environment data request cycle setting function.
4.4. Service Configuration (Service Layer)
5. System Control Process
5.1. Main Service Configuration
5.1.1. AI-Based User Location Detection
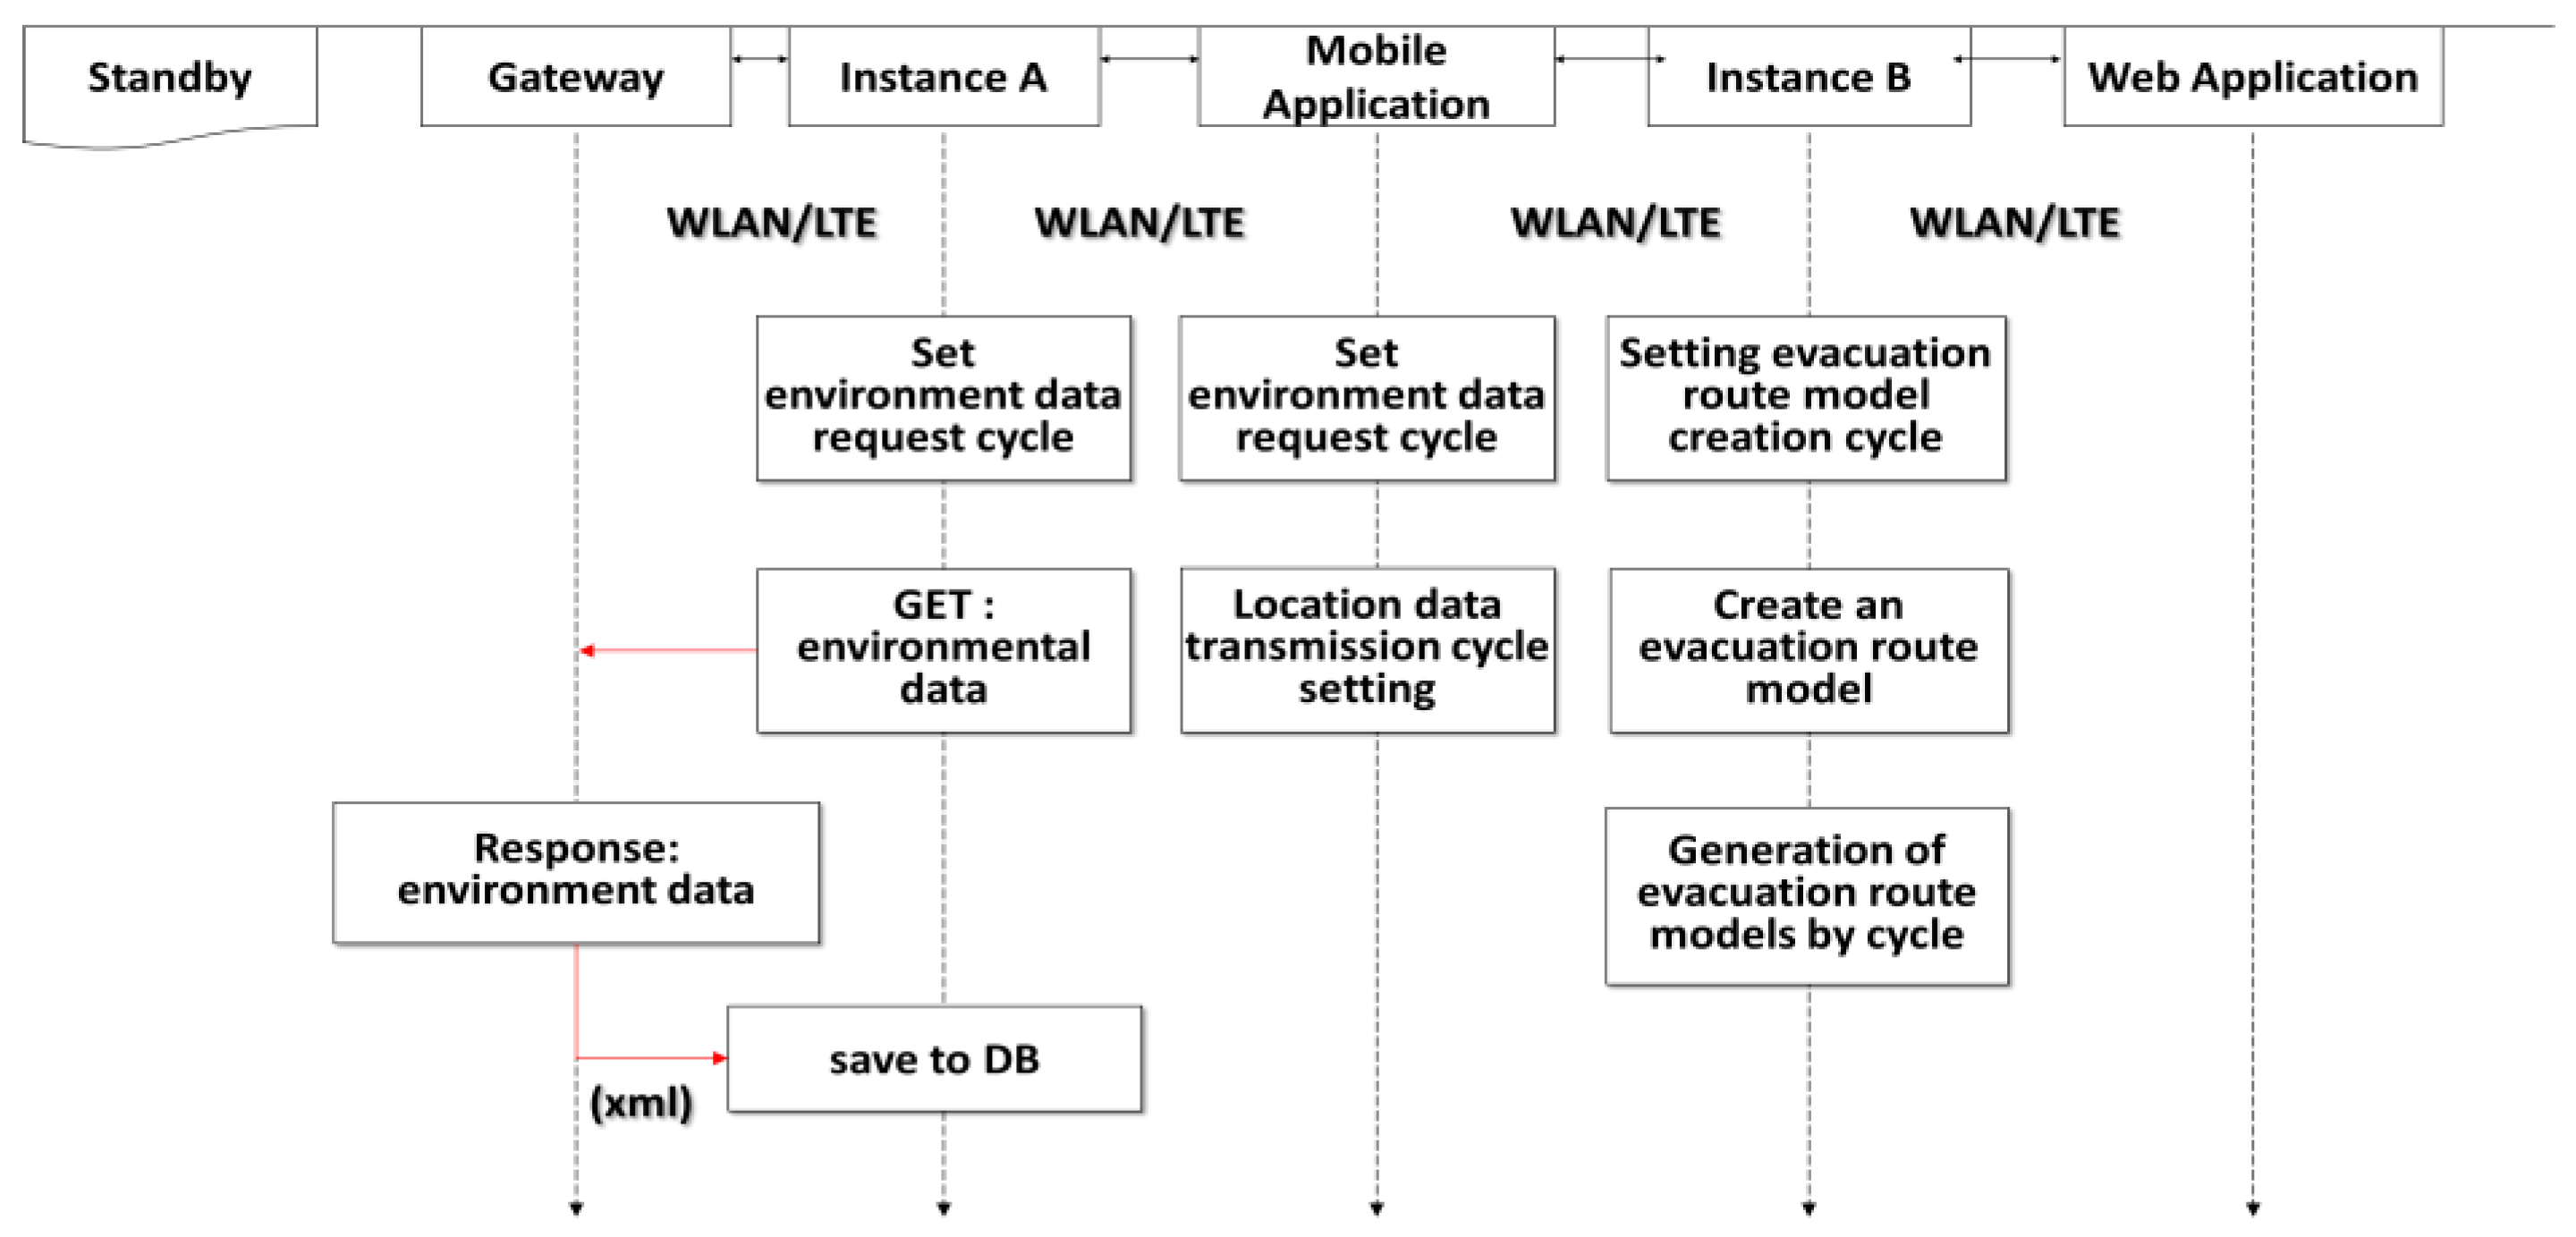
- System state: standby
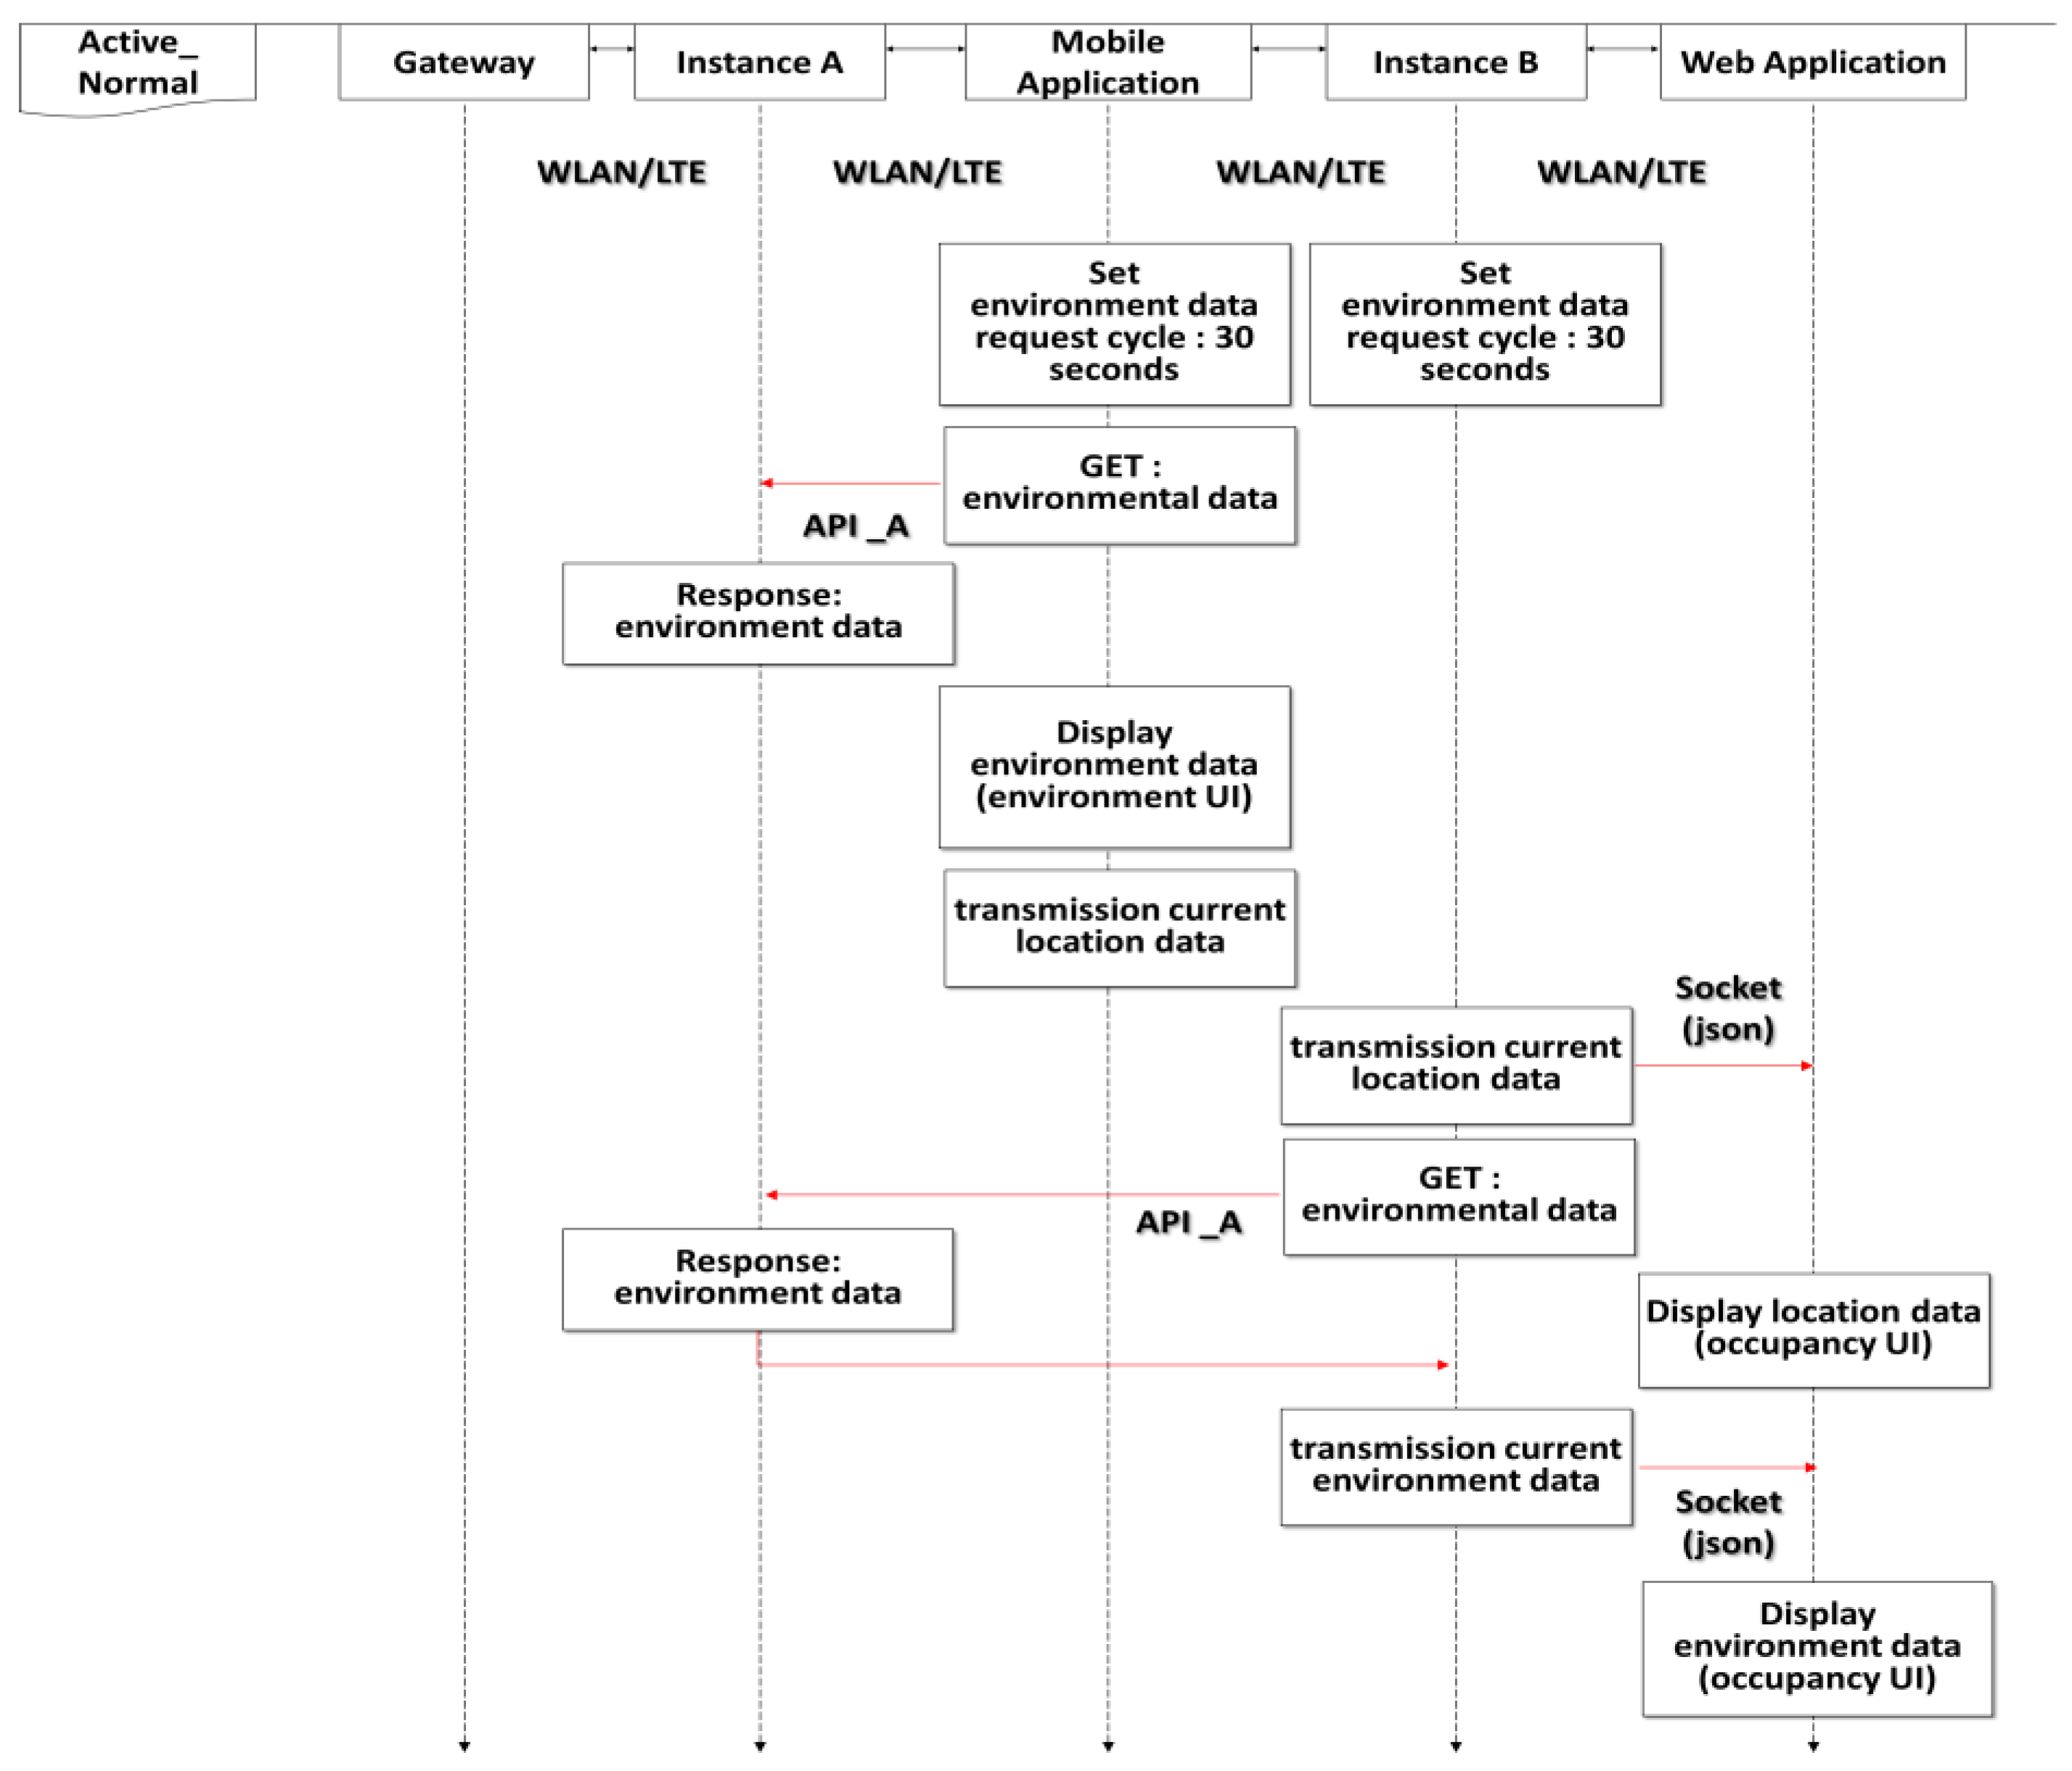
- System status: active_normal (monitoring the current environment information and checking the energy status information)
5.1.2. Data Analysis to Provide Optimal Evacuation Guide
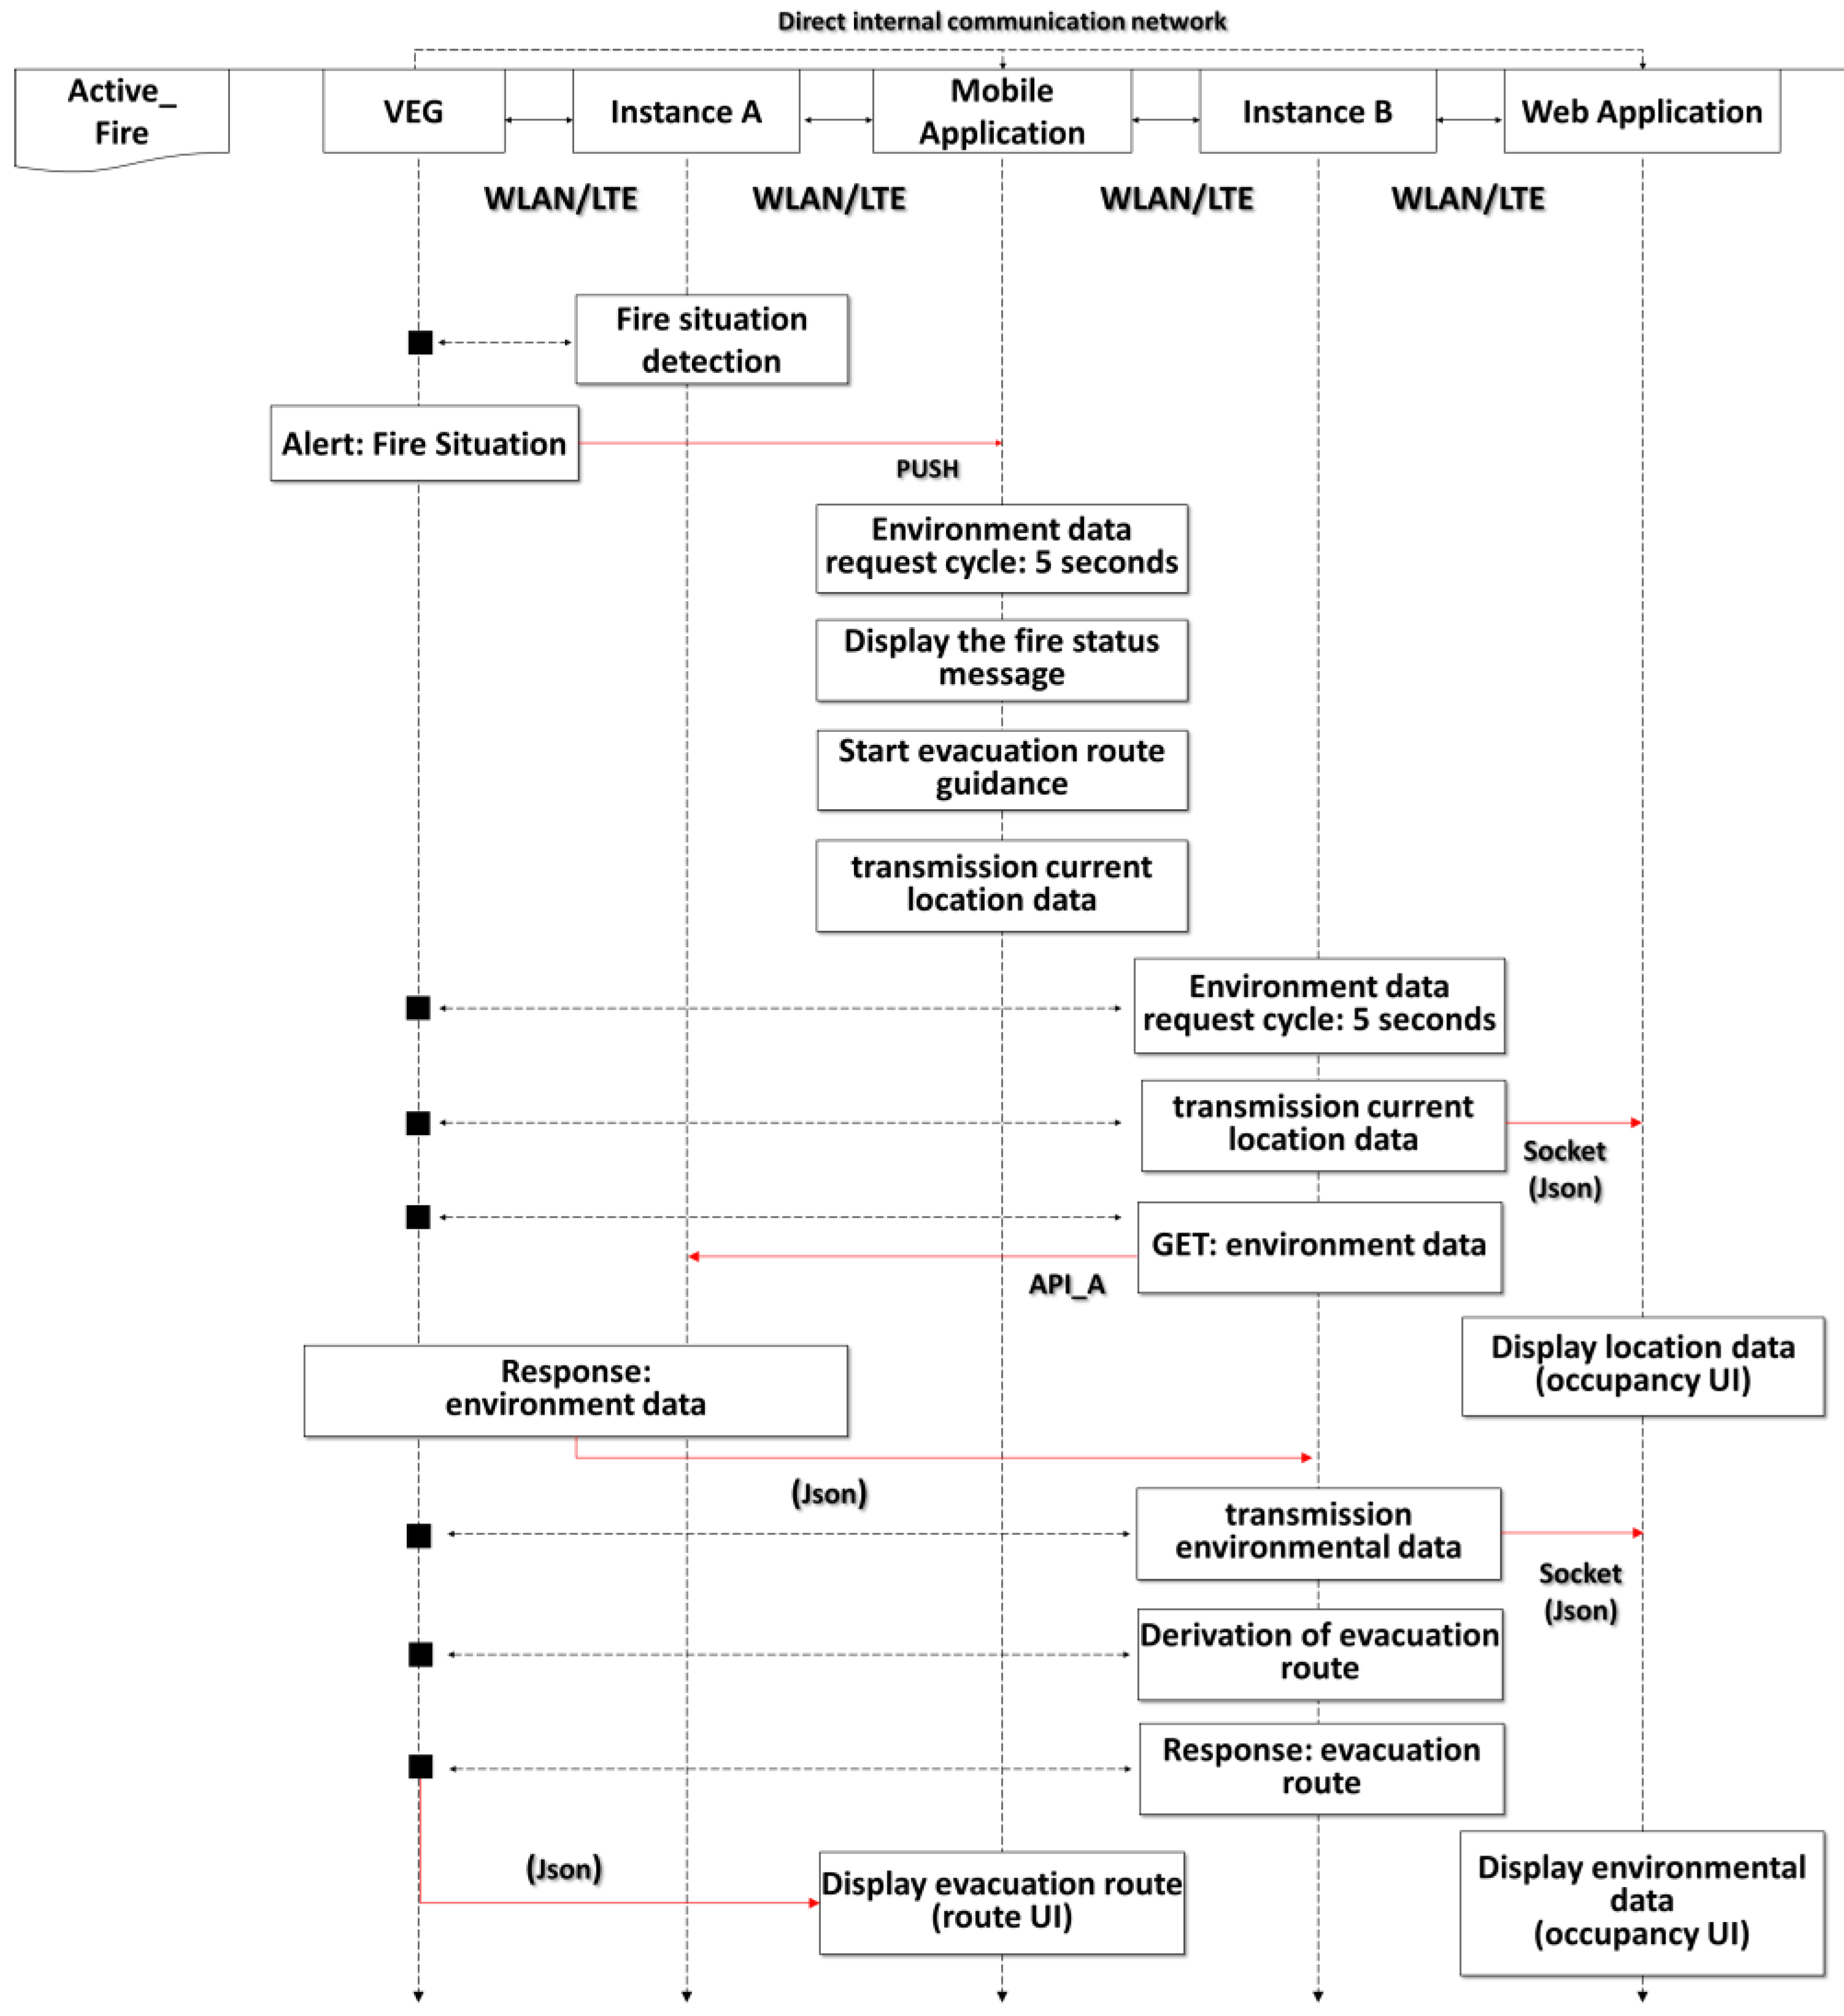
- System status: active_fire
- Fire situation detection: The temperature/fire sensor installed in the room detects a fire situation under certain conditions. (Current conditions: when detecting a temperature ≥60 °C).
- Fire situation notification: Notifies of the fire situation through mobile application and web dashboard via a PUSH message. (Simultaneously, it is possible to contact related organizations, such as fire departments).
- Delivery of environment/location information: When the occupant checks the fire notification and runs the mobile application, the current location and environment data are delivered to create the optimal evacuation route.
- Display of occupant location and environment information for rescuers: The current location of the occupant and environment data are displayed periodically. (Current cycle: 5 s)
- Create an optimal evacuation route considering the current location of the occupant and the fire situation through an evacuation route generation model created by learning factors such as the location and environmental data. In addition, the model can create a more accurate evacuation route as more actual data are accumulated. The model is created by learning data derived through simulation.
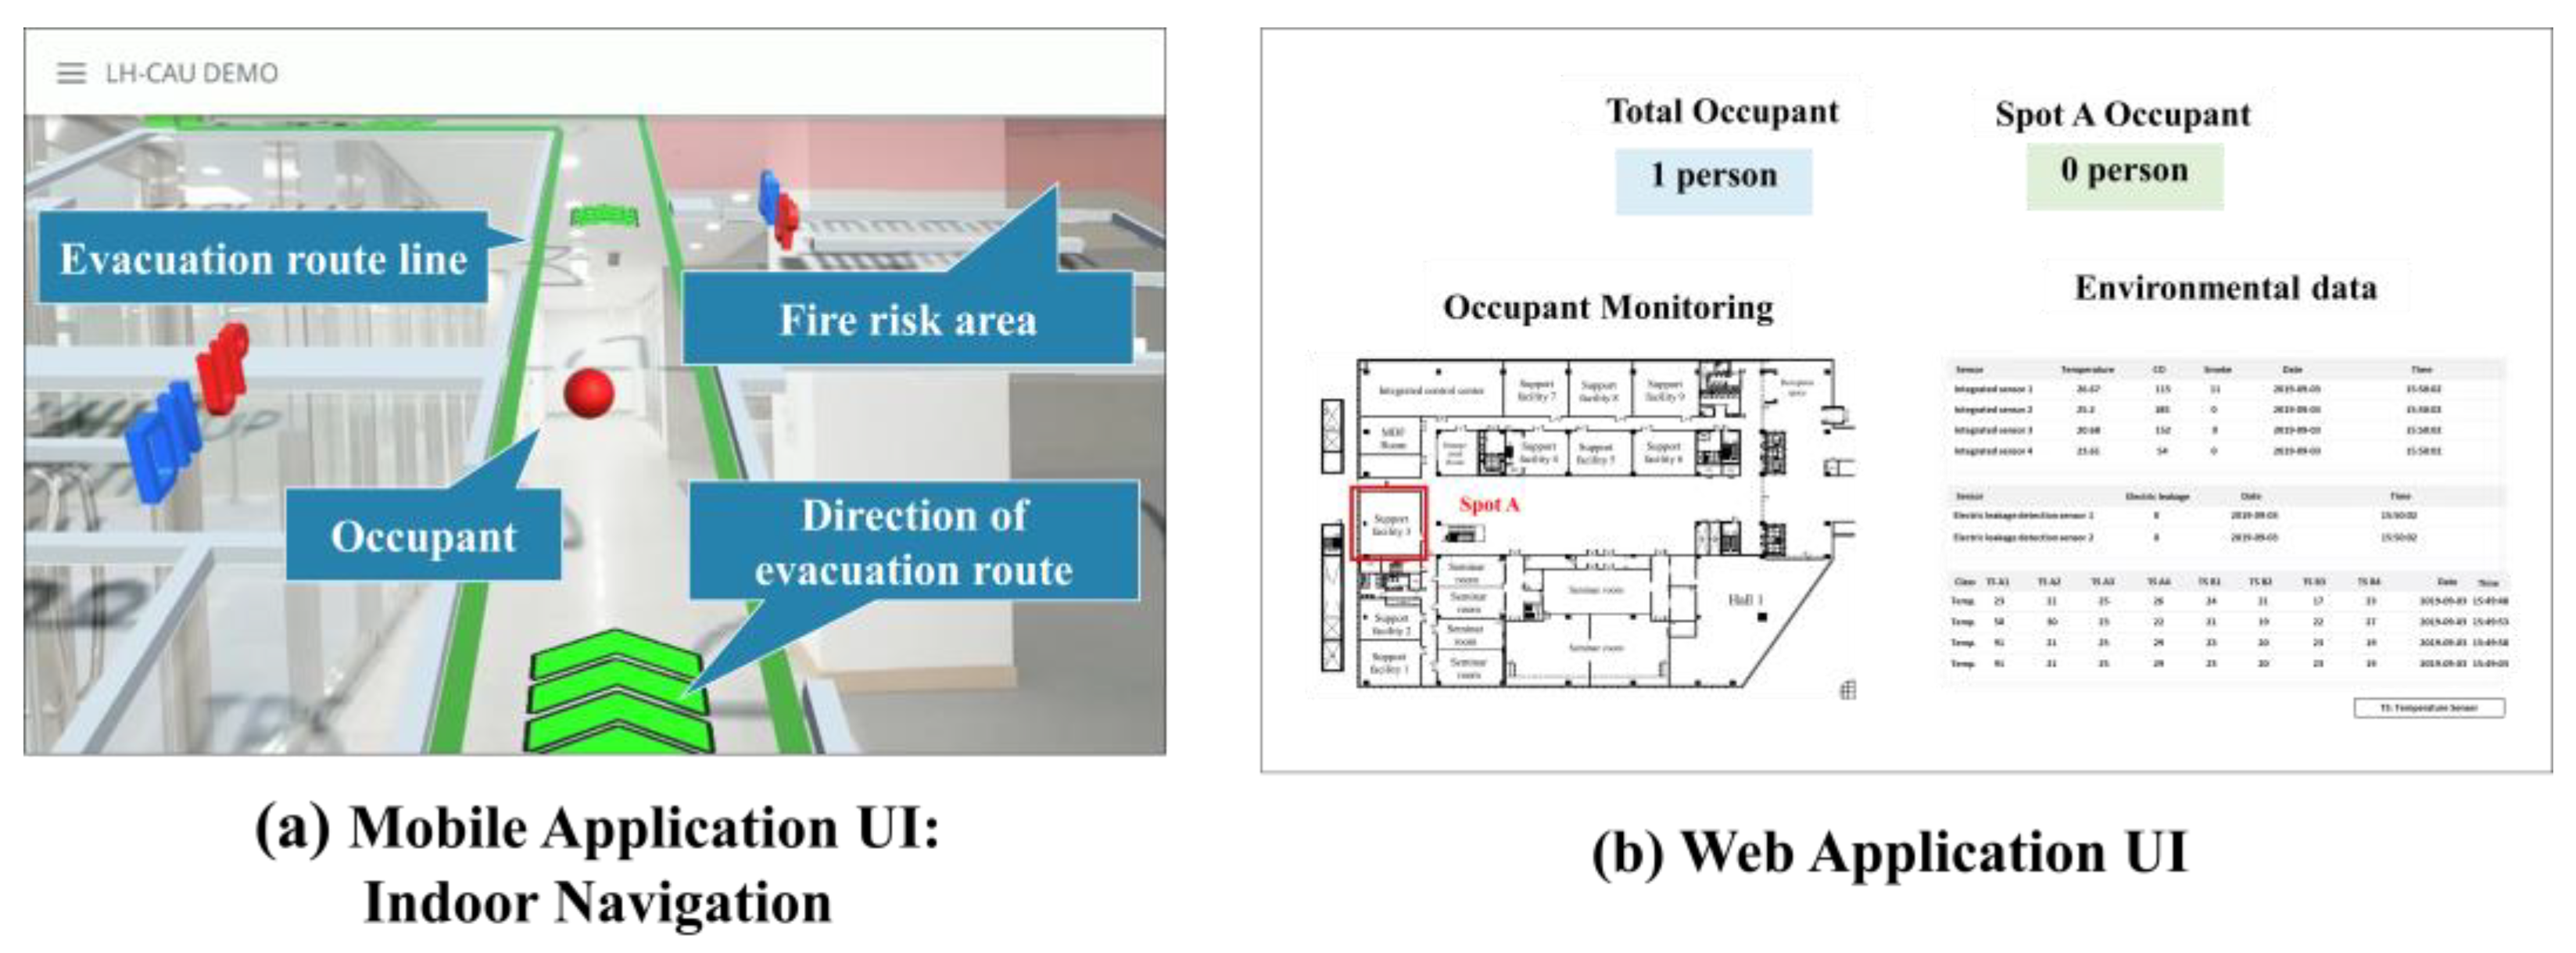
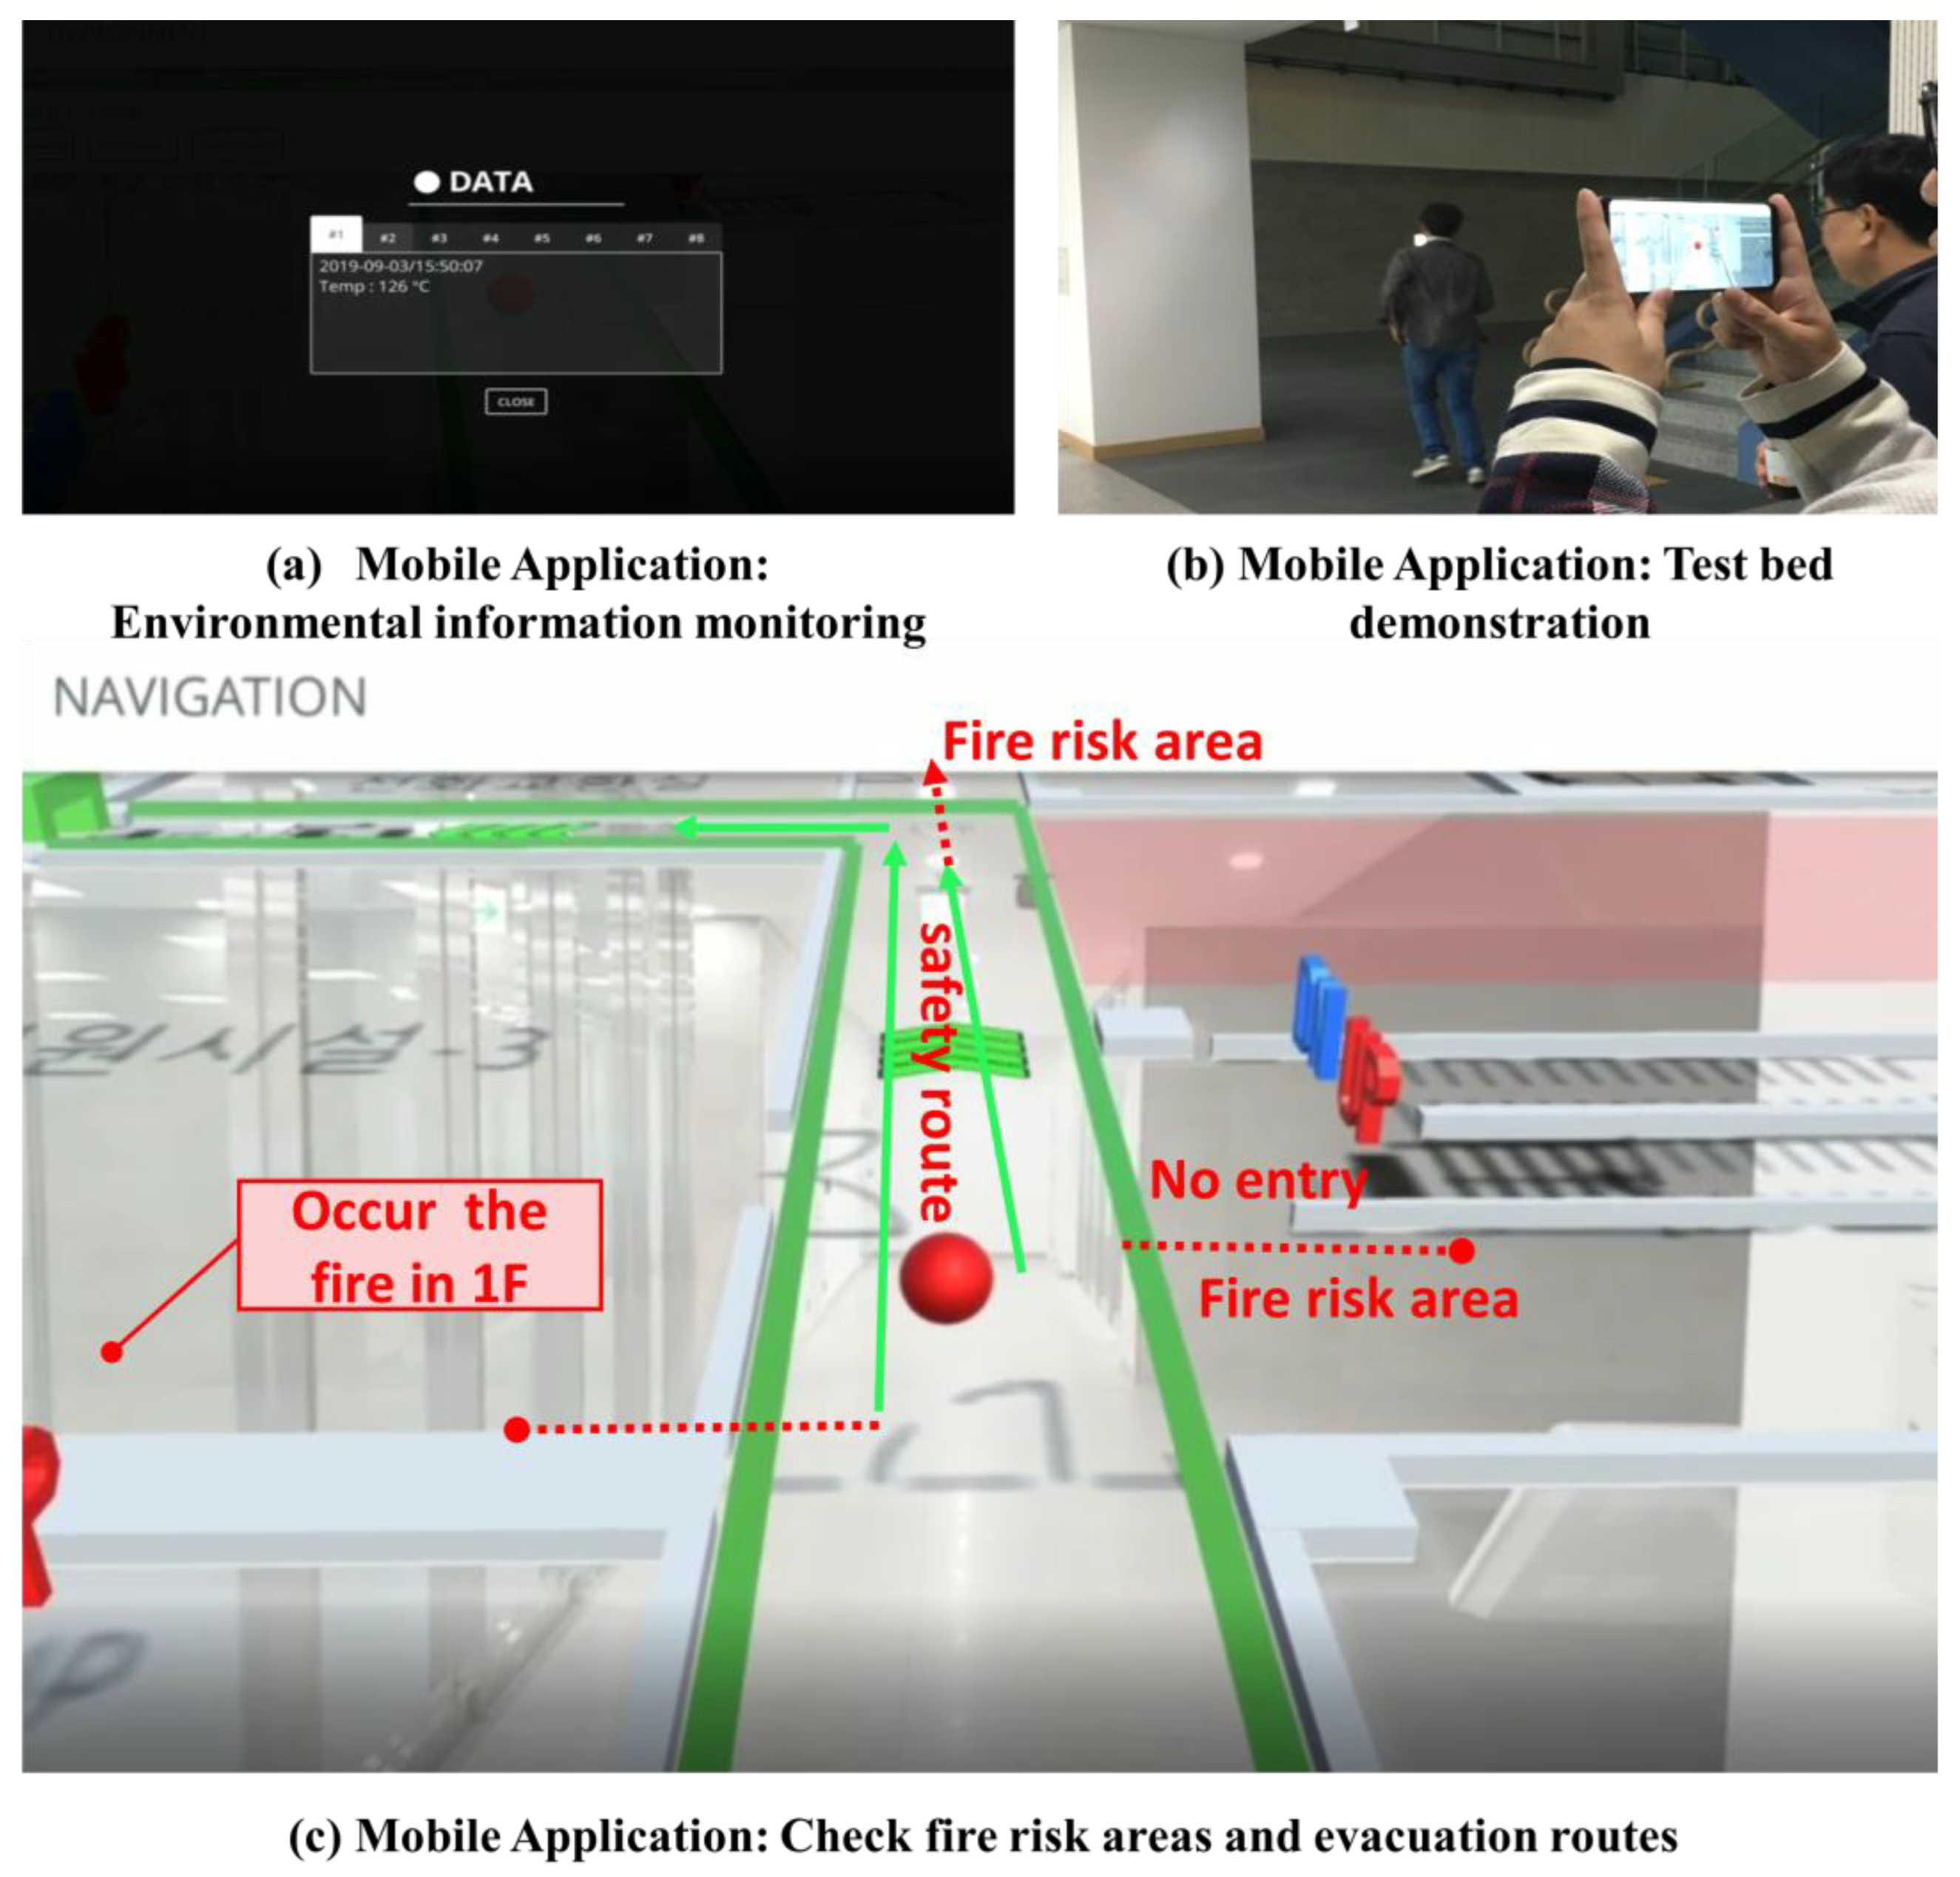
5.1.3. AR-Based User Mobile Application
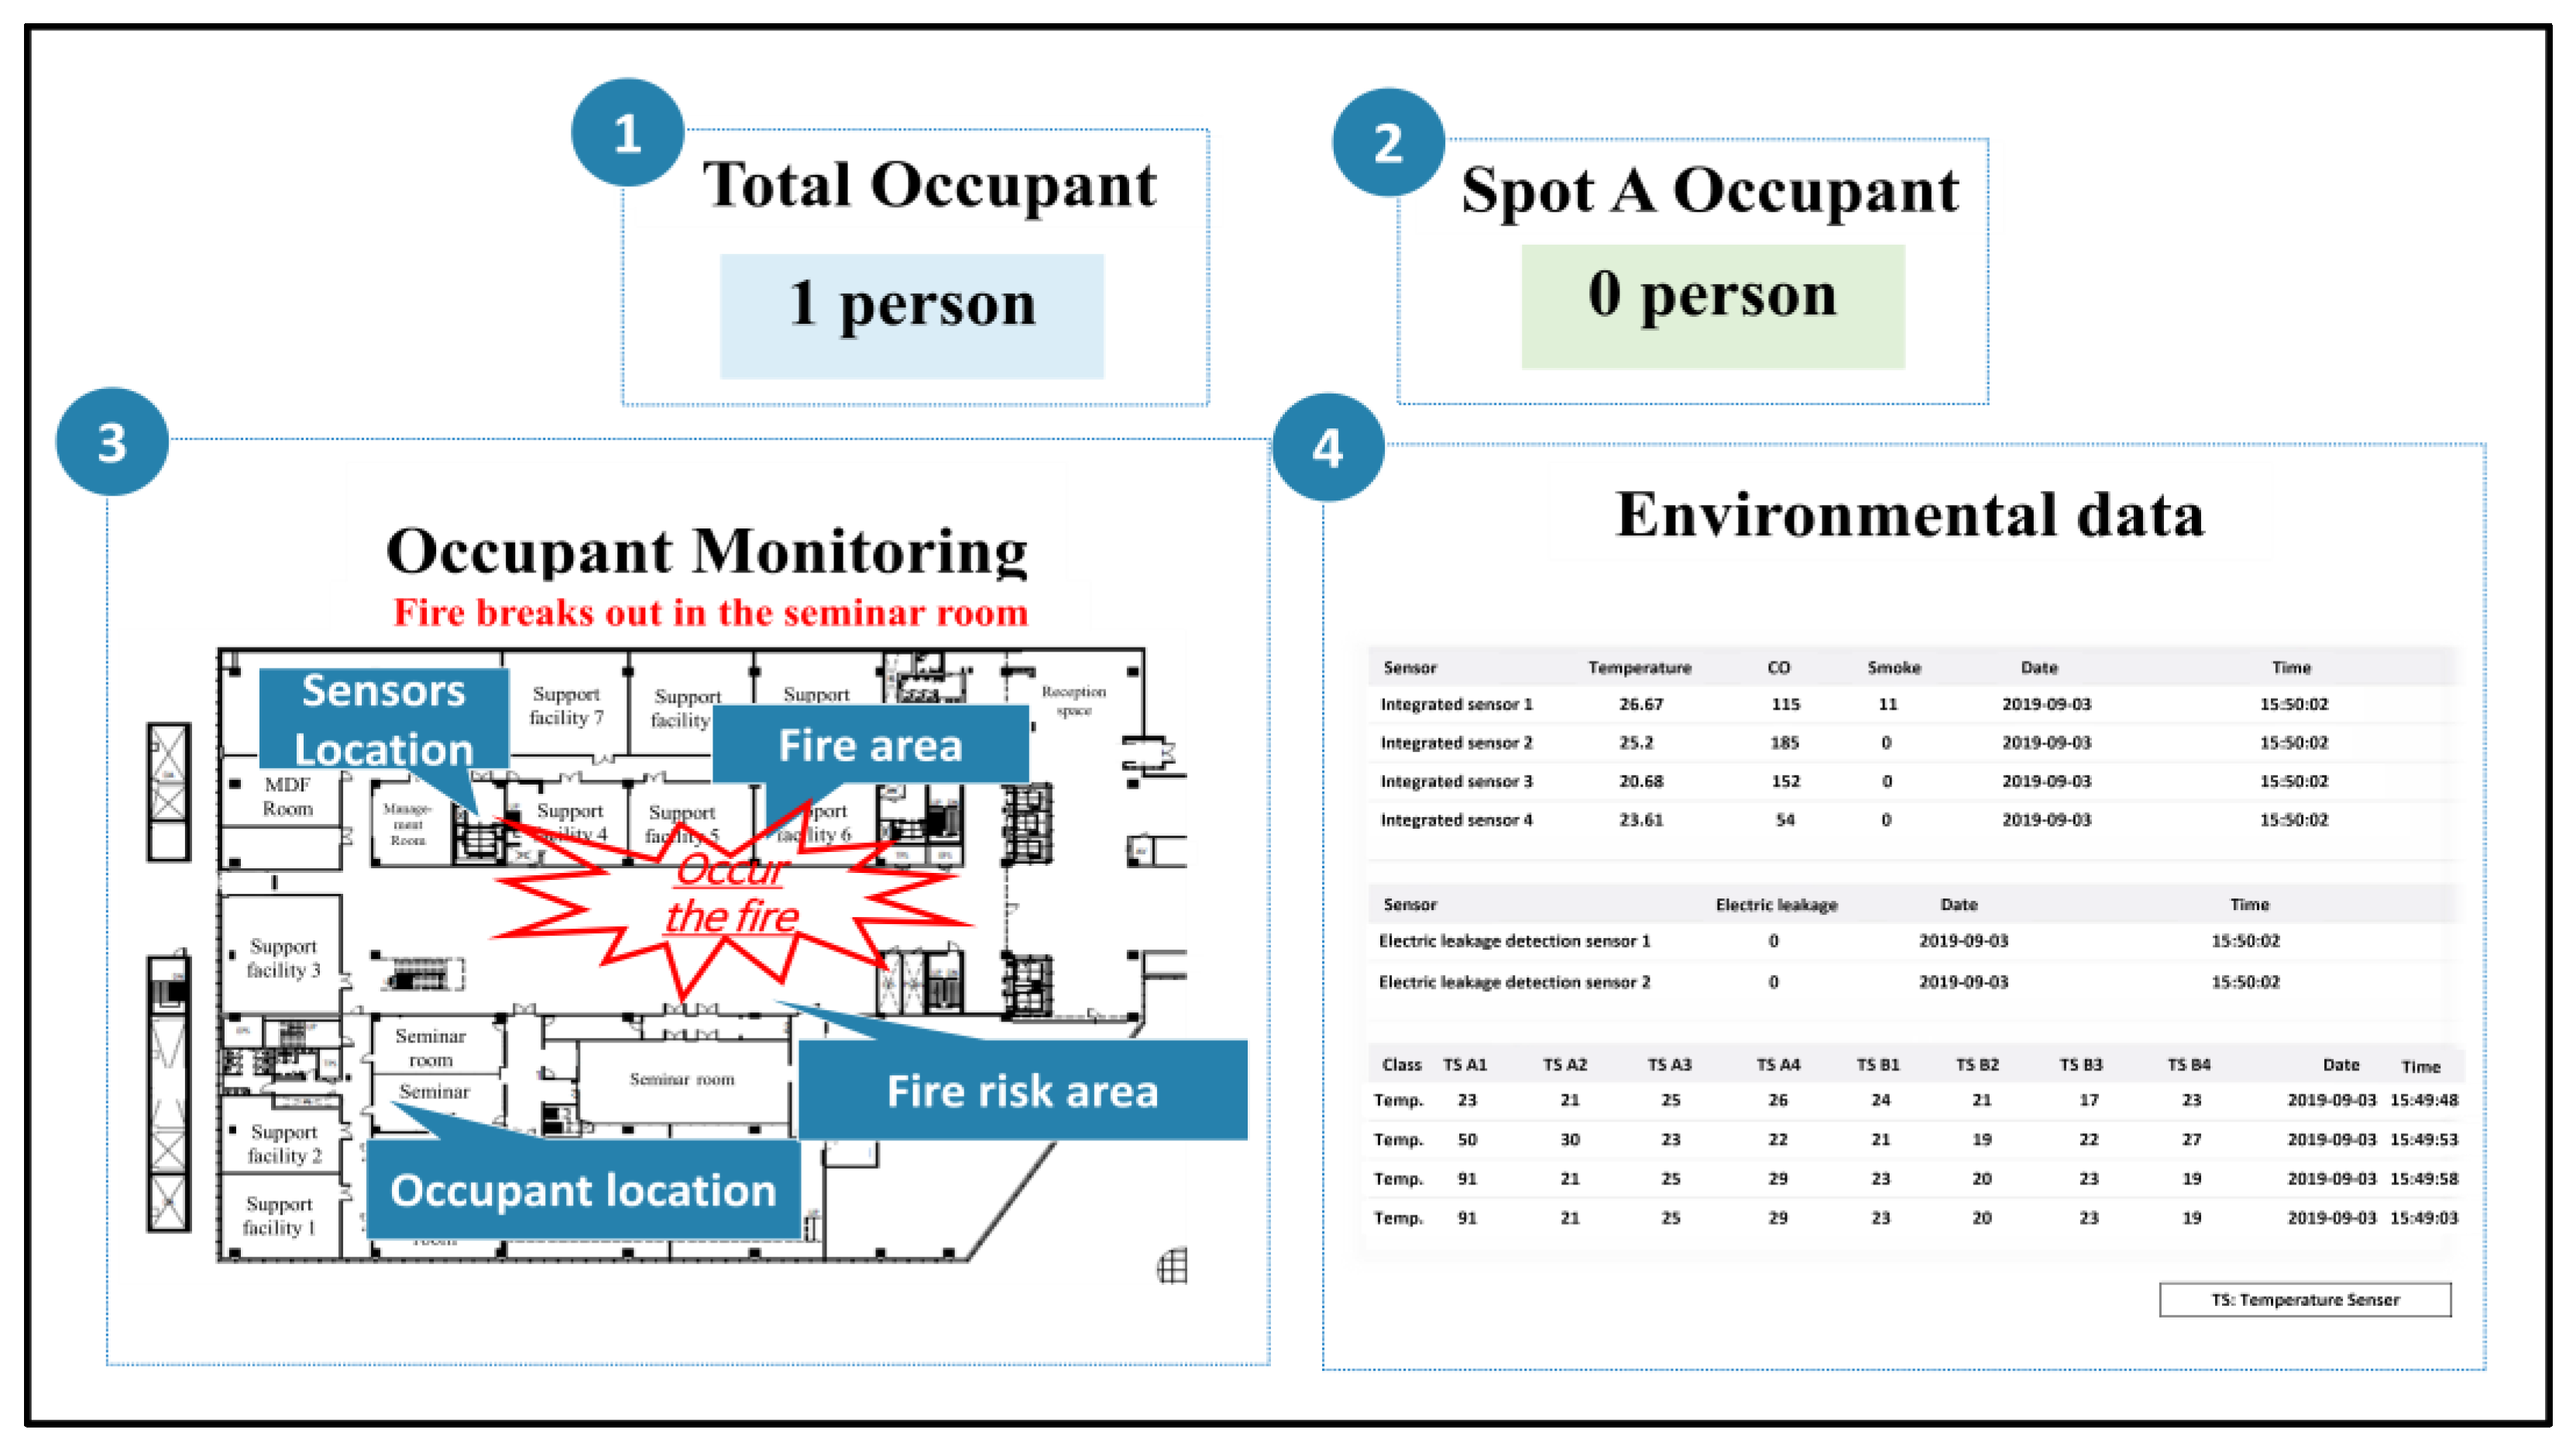
5.1.4. Integrated Control Web Application for Administrators
- Total number UI: It is possible to check the total number of people who are currently running the mobile application and the number of people in Support Facility-3.
- Support Facility-3 Personnel UI: This can check the number of personnel inside Support Facility-3 through the sensor installed at its entrance.
- Occupant tracking UI: This can check occupants and sensor locations in the building. If a fire occurs, it is possible to check the fire area and the danger area of the fire.
- Environmental data UI: This can periodically check information such as temperature/CO/smoke/electric leakage from installed sensors (current cycle: 5 s)
5.2. Energy Management Platform Connection Control
6. Discussion
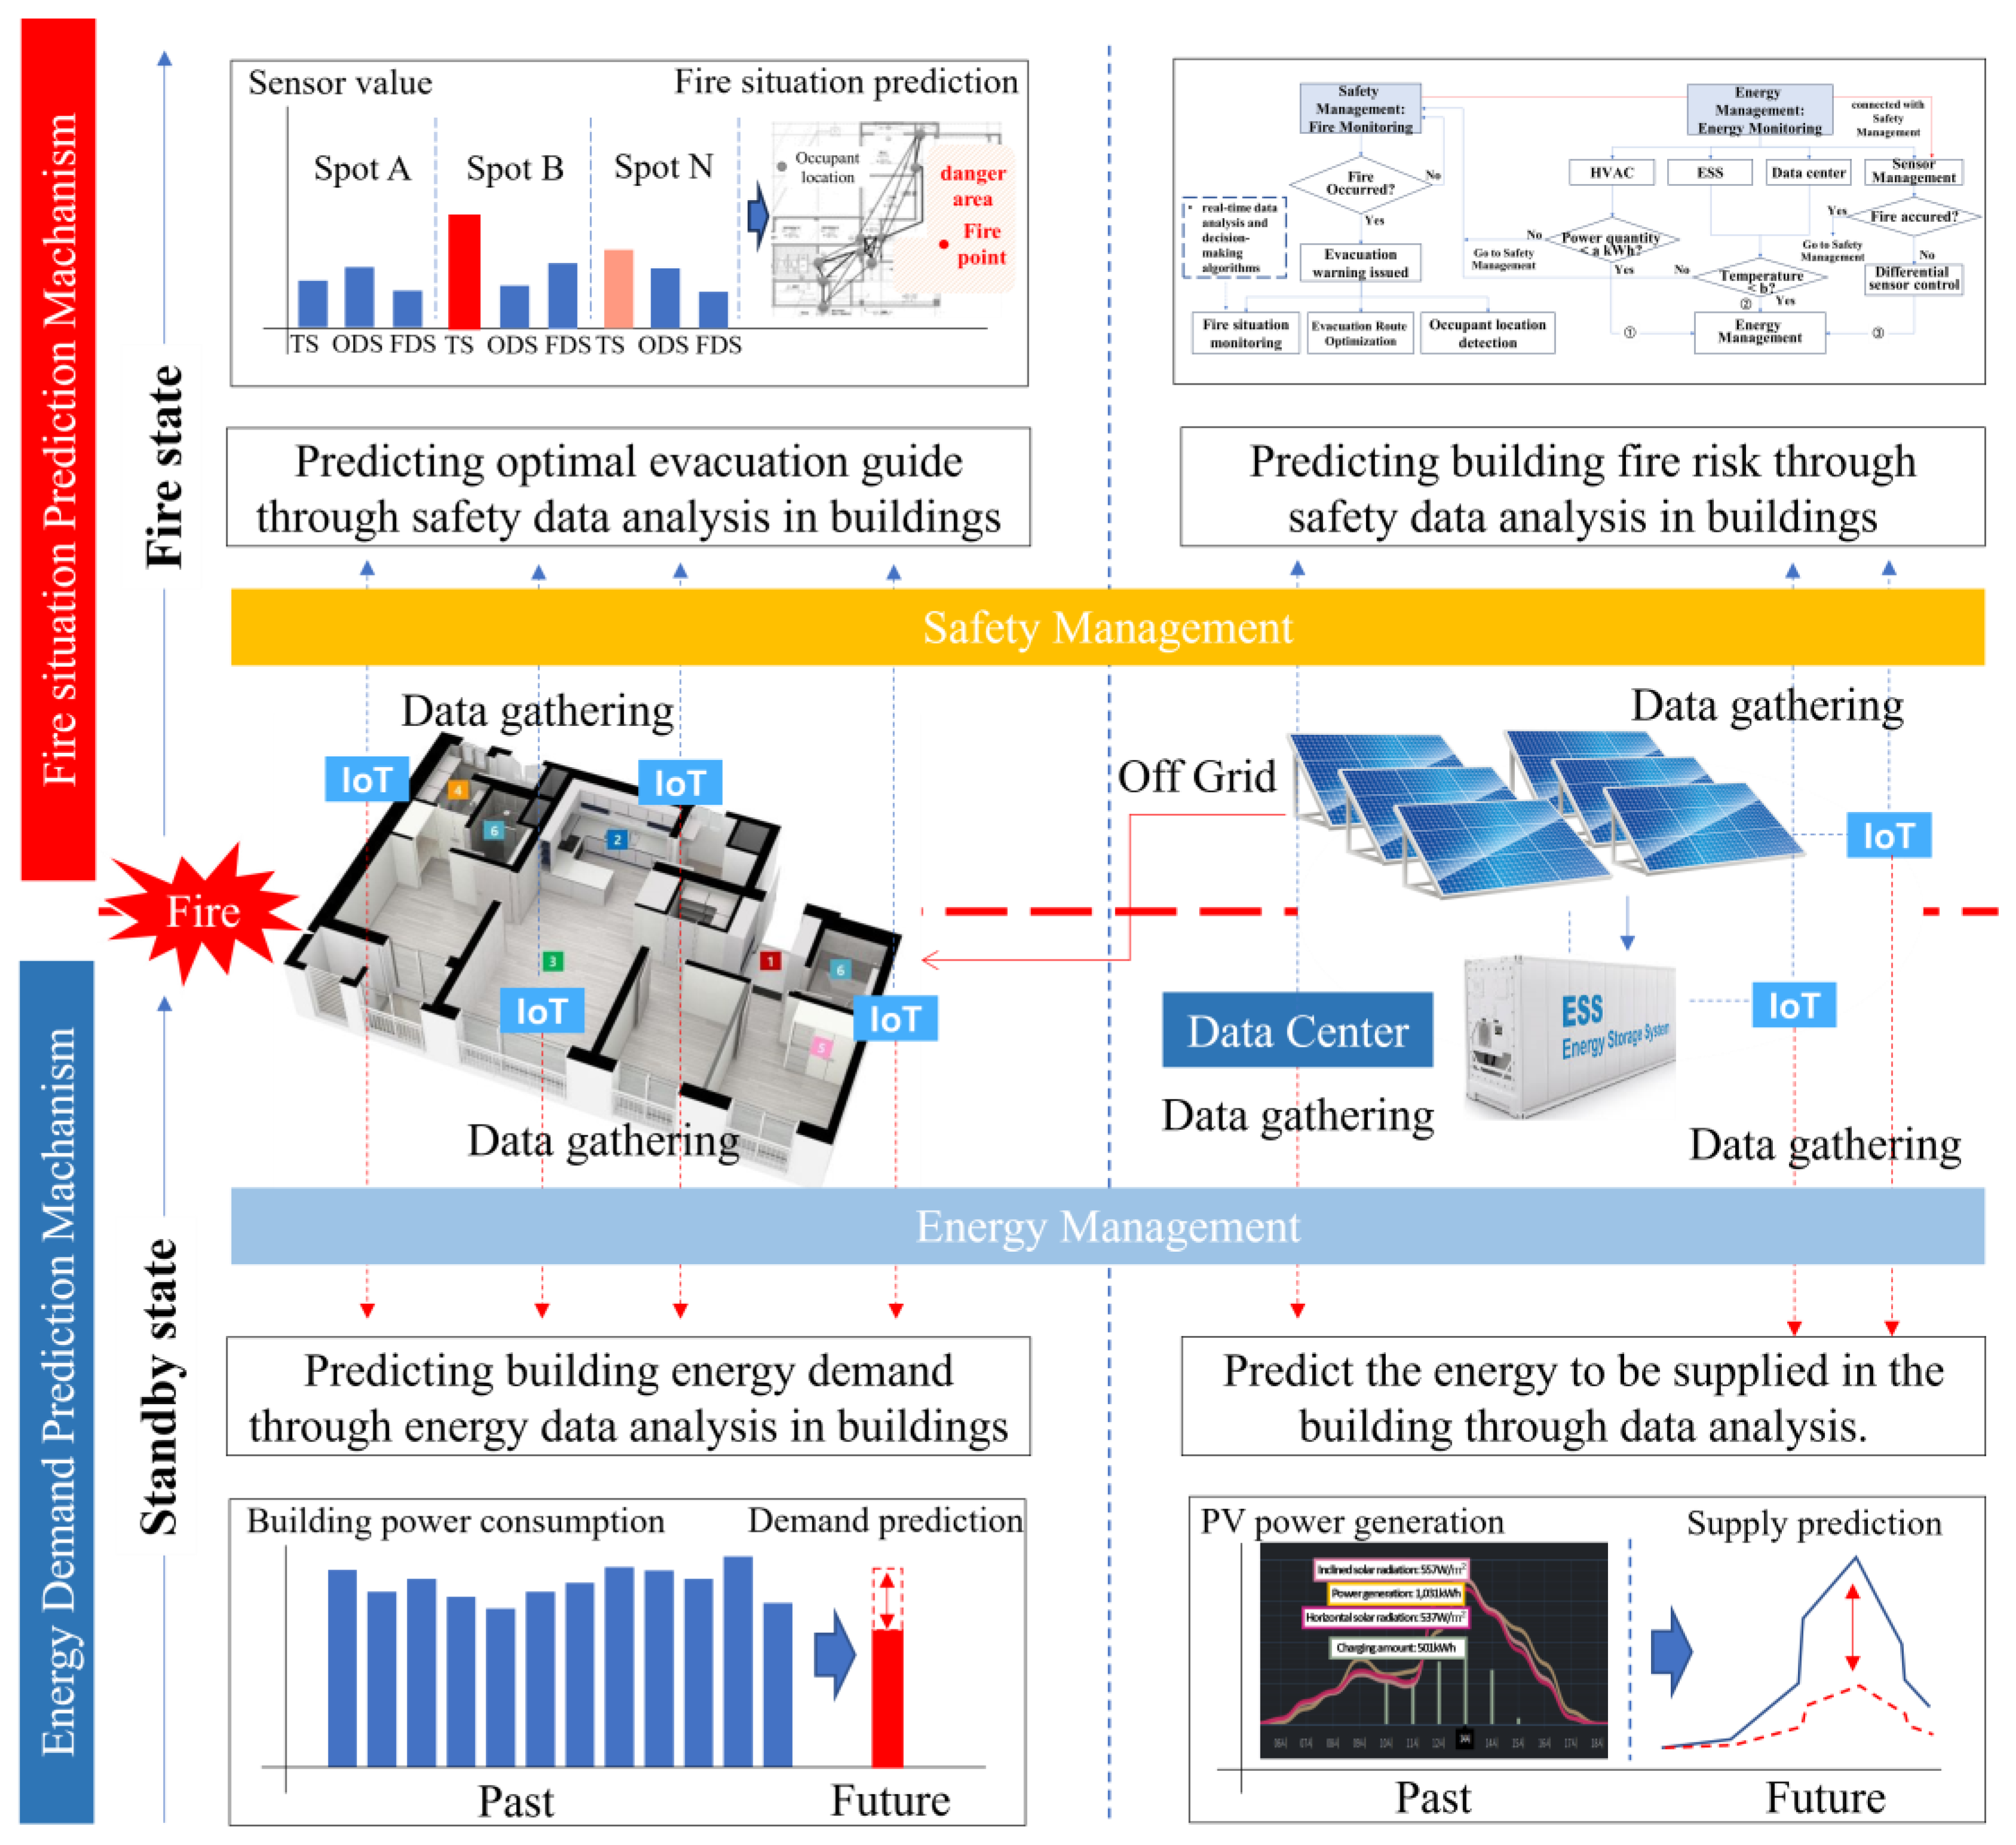
6.1. Fire Situation Prediction and Energy Demand/Supply Prediction Mechanism
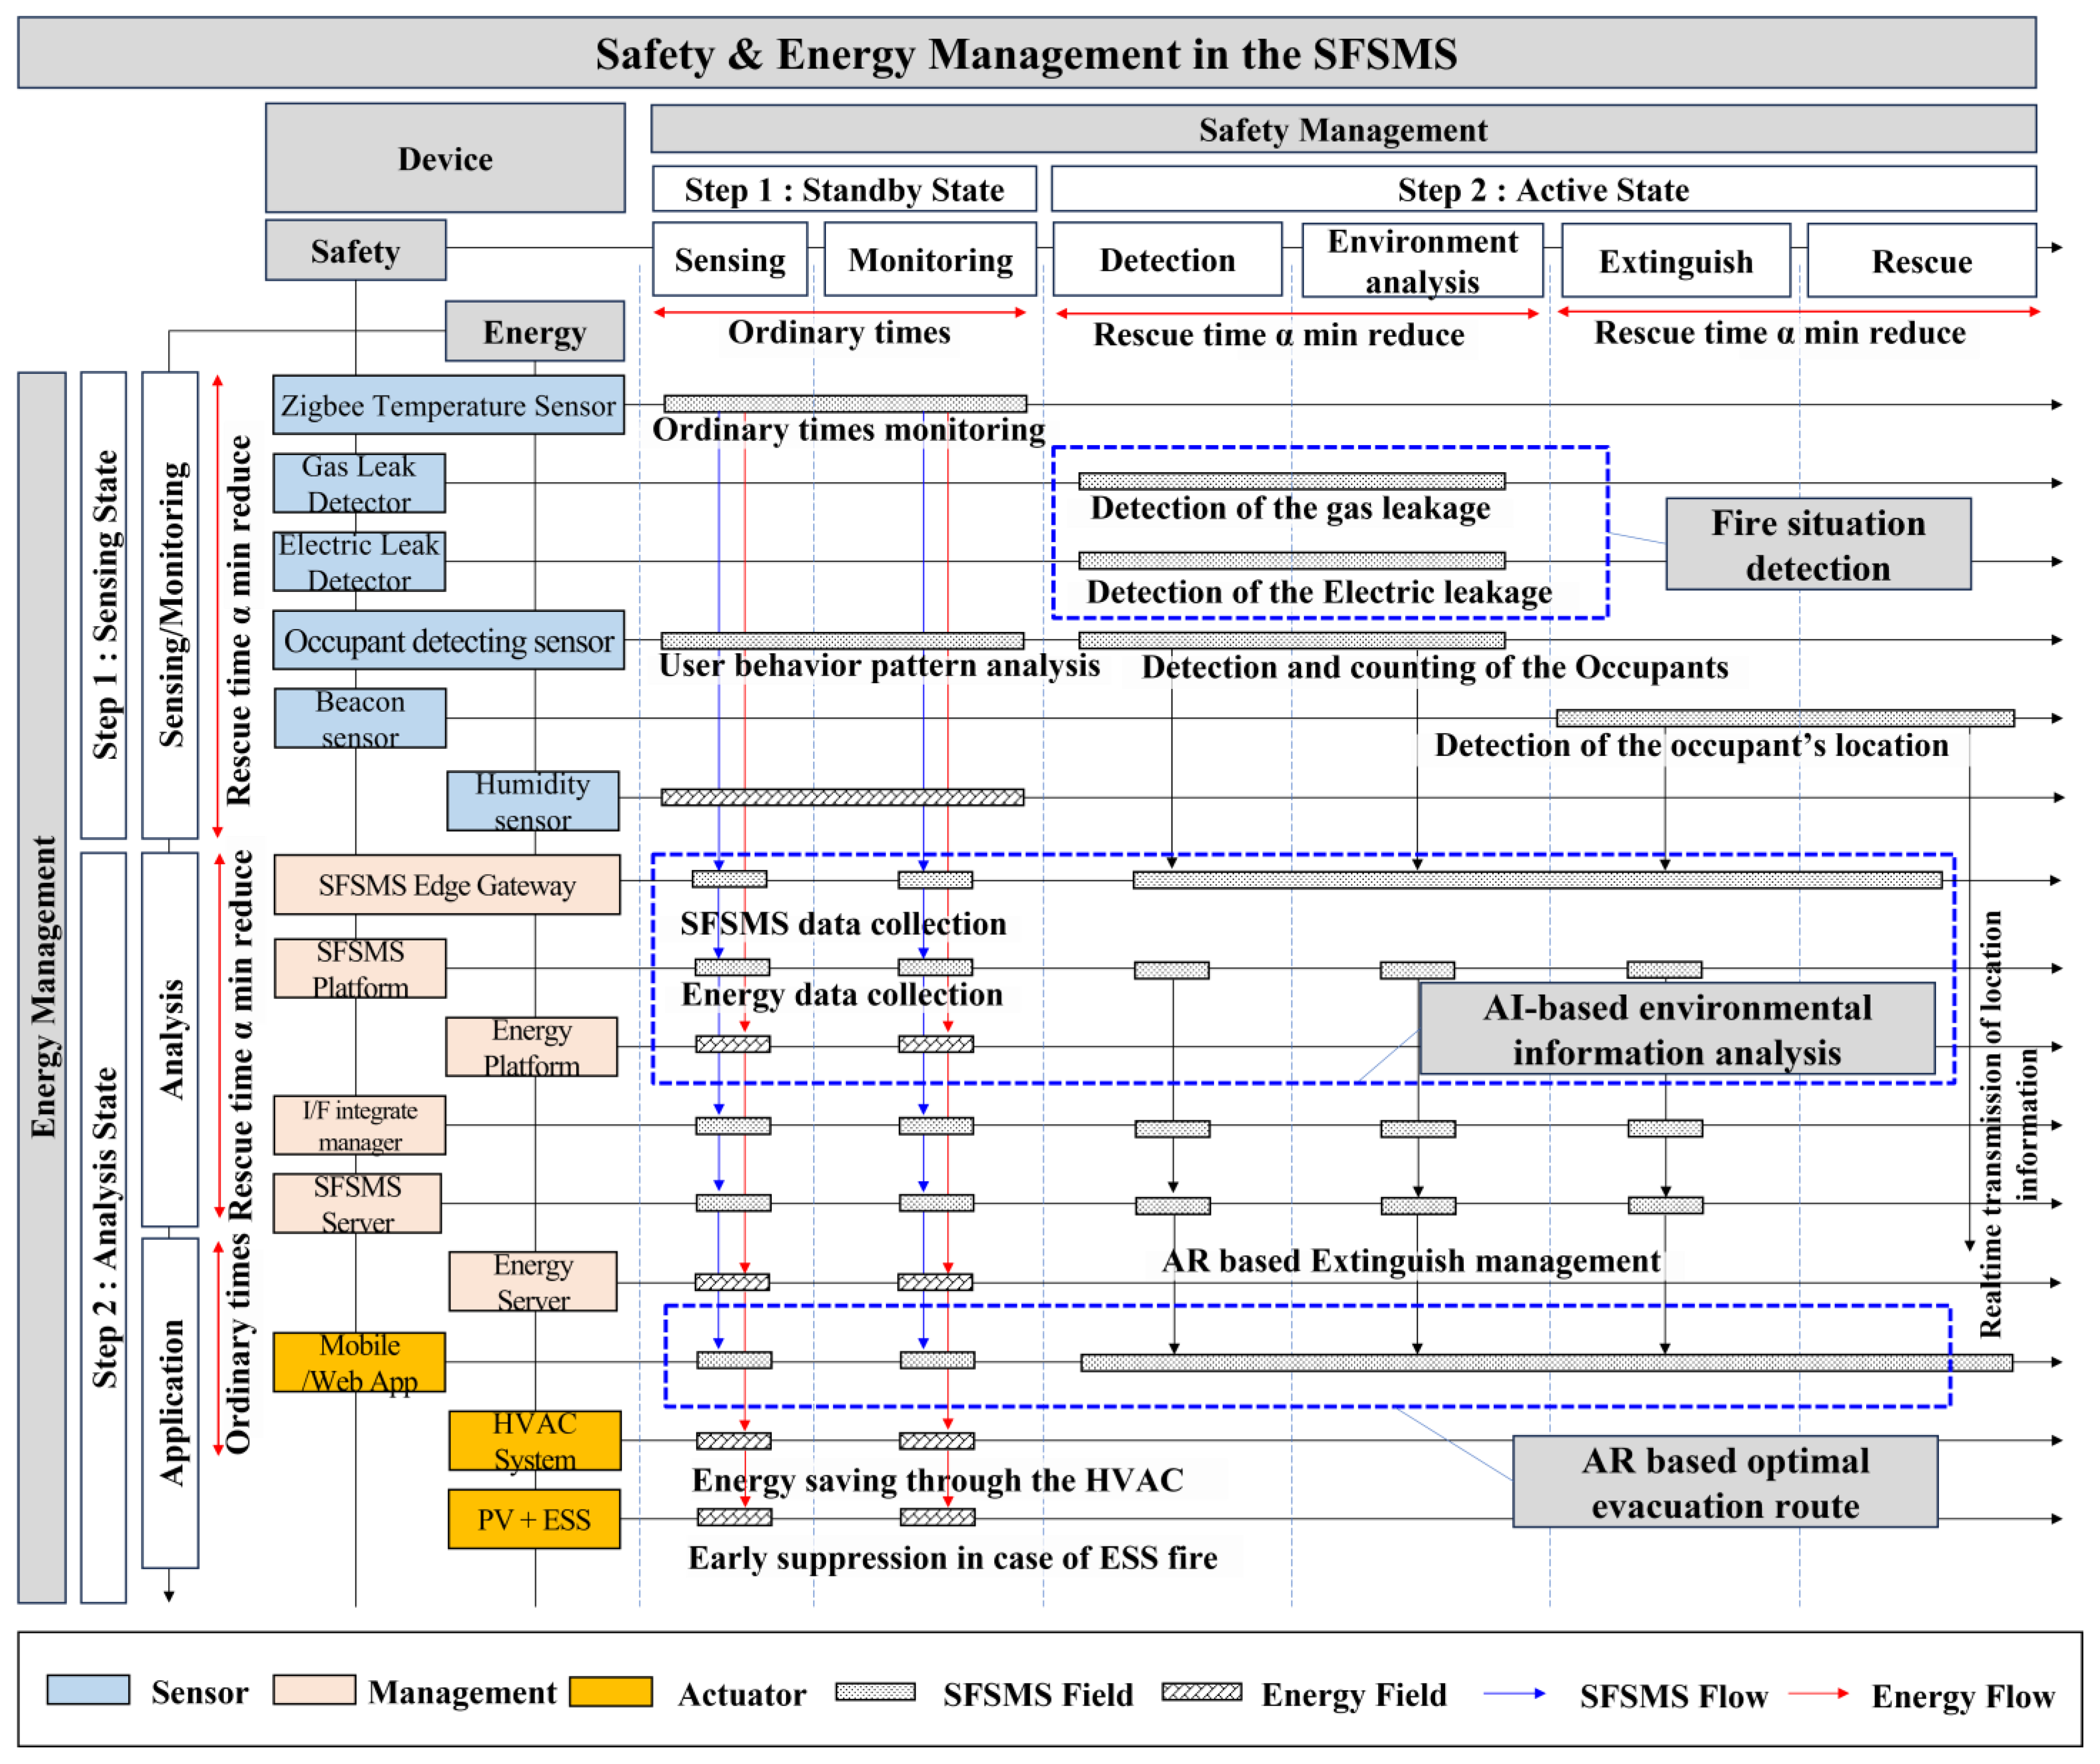
6.2. Analysis of the Relationship between Safety and Energy Management in the SFSMS
6.2.1. Analysis of the Safety Management in the SFSMS
- Sensing: Sensing in the safety management system is performed during normal times. At this stage, the sensor detects whether there is a sudden temperature change in advance to prepare for a fire situation [37]. The server receives real-time information from various sensors (such as temperature and occupancy) and determines whether there are any safety problems. In addition, it monitors energy related to sensors, including temperature, occupancy, and humidity.
- Monitoring: In the monitoring stage, the server integrates and monitors real-time temperature data during normal times. If there is a rapid temperature change detected through temperature monitoring, it is highly likely that an emergency has occurred. In the sensing and monitoring phases, accuracy is more important than speed because they are normal detection phases.
- Detection: In the detection step, when a fire situation occurs, it is detected by the sensors and then transmitted to the server, from which occupants and administrators are notified of an emergency. At this stage, it is necessary for the sensor to detect the fire situation and quickly deliver it to the server. From this stage, promptness for rapid evacuation is very important.
- Environment analysis: This stage involves collecting data on fire information and predicting fire information inside the building based on the collected data. This is a very important step because the current fire situation must be quickly identified and communicated.
- Extinguish: This is the evacuation phase, in which occupants must quickly evacuate through a mobile application. The server transmits the fire situation and the optimal evacuation route to the application after analyzing the environmental information. The occupants then confirm and evacuate through the application. At this stage, the usability of the application is very important.
- Rescue: In this stage, the role of rescuers is important, and they can locate occupants through a web application.
6.2.2. Analysis of Energy Management in SFSMS
- Sensing/Monitoring: Sensors related to energy suggest temperature, occupant detection, and humidity sensors [38]. The temperature/humidity historical data are collected to predict the future temperature/humidity, and the movement of the occupant is detected through the occupant-detecting sensor and the predicted behavior patterns.
- Analysis: This is a predictive analysis stage for energy saving through the collected data. Here, it is possible to predict future demand/supply energy consumption by analyzing the data patterns of stored energy data from the past. The key point of AI and big data-based energy data analysis technology is to predict demand and supply by analyzing the consumption patterns of energy data for energy supply stability and energy cost savings in the analysis stage.
- Application: The application field can be regarded as an application or actuator that can apply energy services [39]. In the buildings, energy data (such as the power demand of HVAC systems) will be collected through the IoT and stored in a server. Here, it is possible to predict future demand-side energy consumption by analyzing patterns of energy data stored from the past. In addition, it should be possible to predict how much energy can be supplied to the demand side through PV supply forecasting.
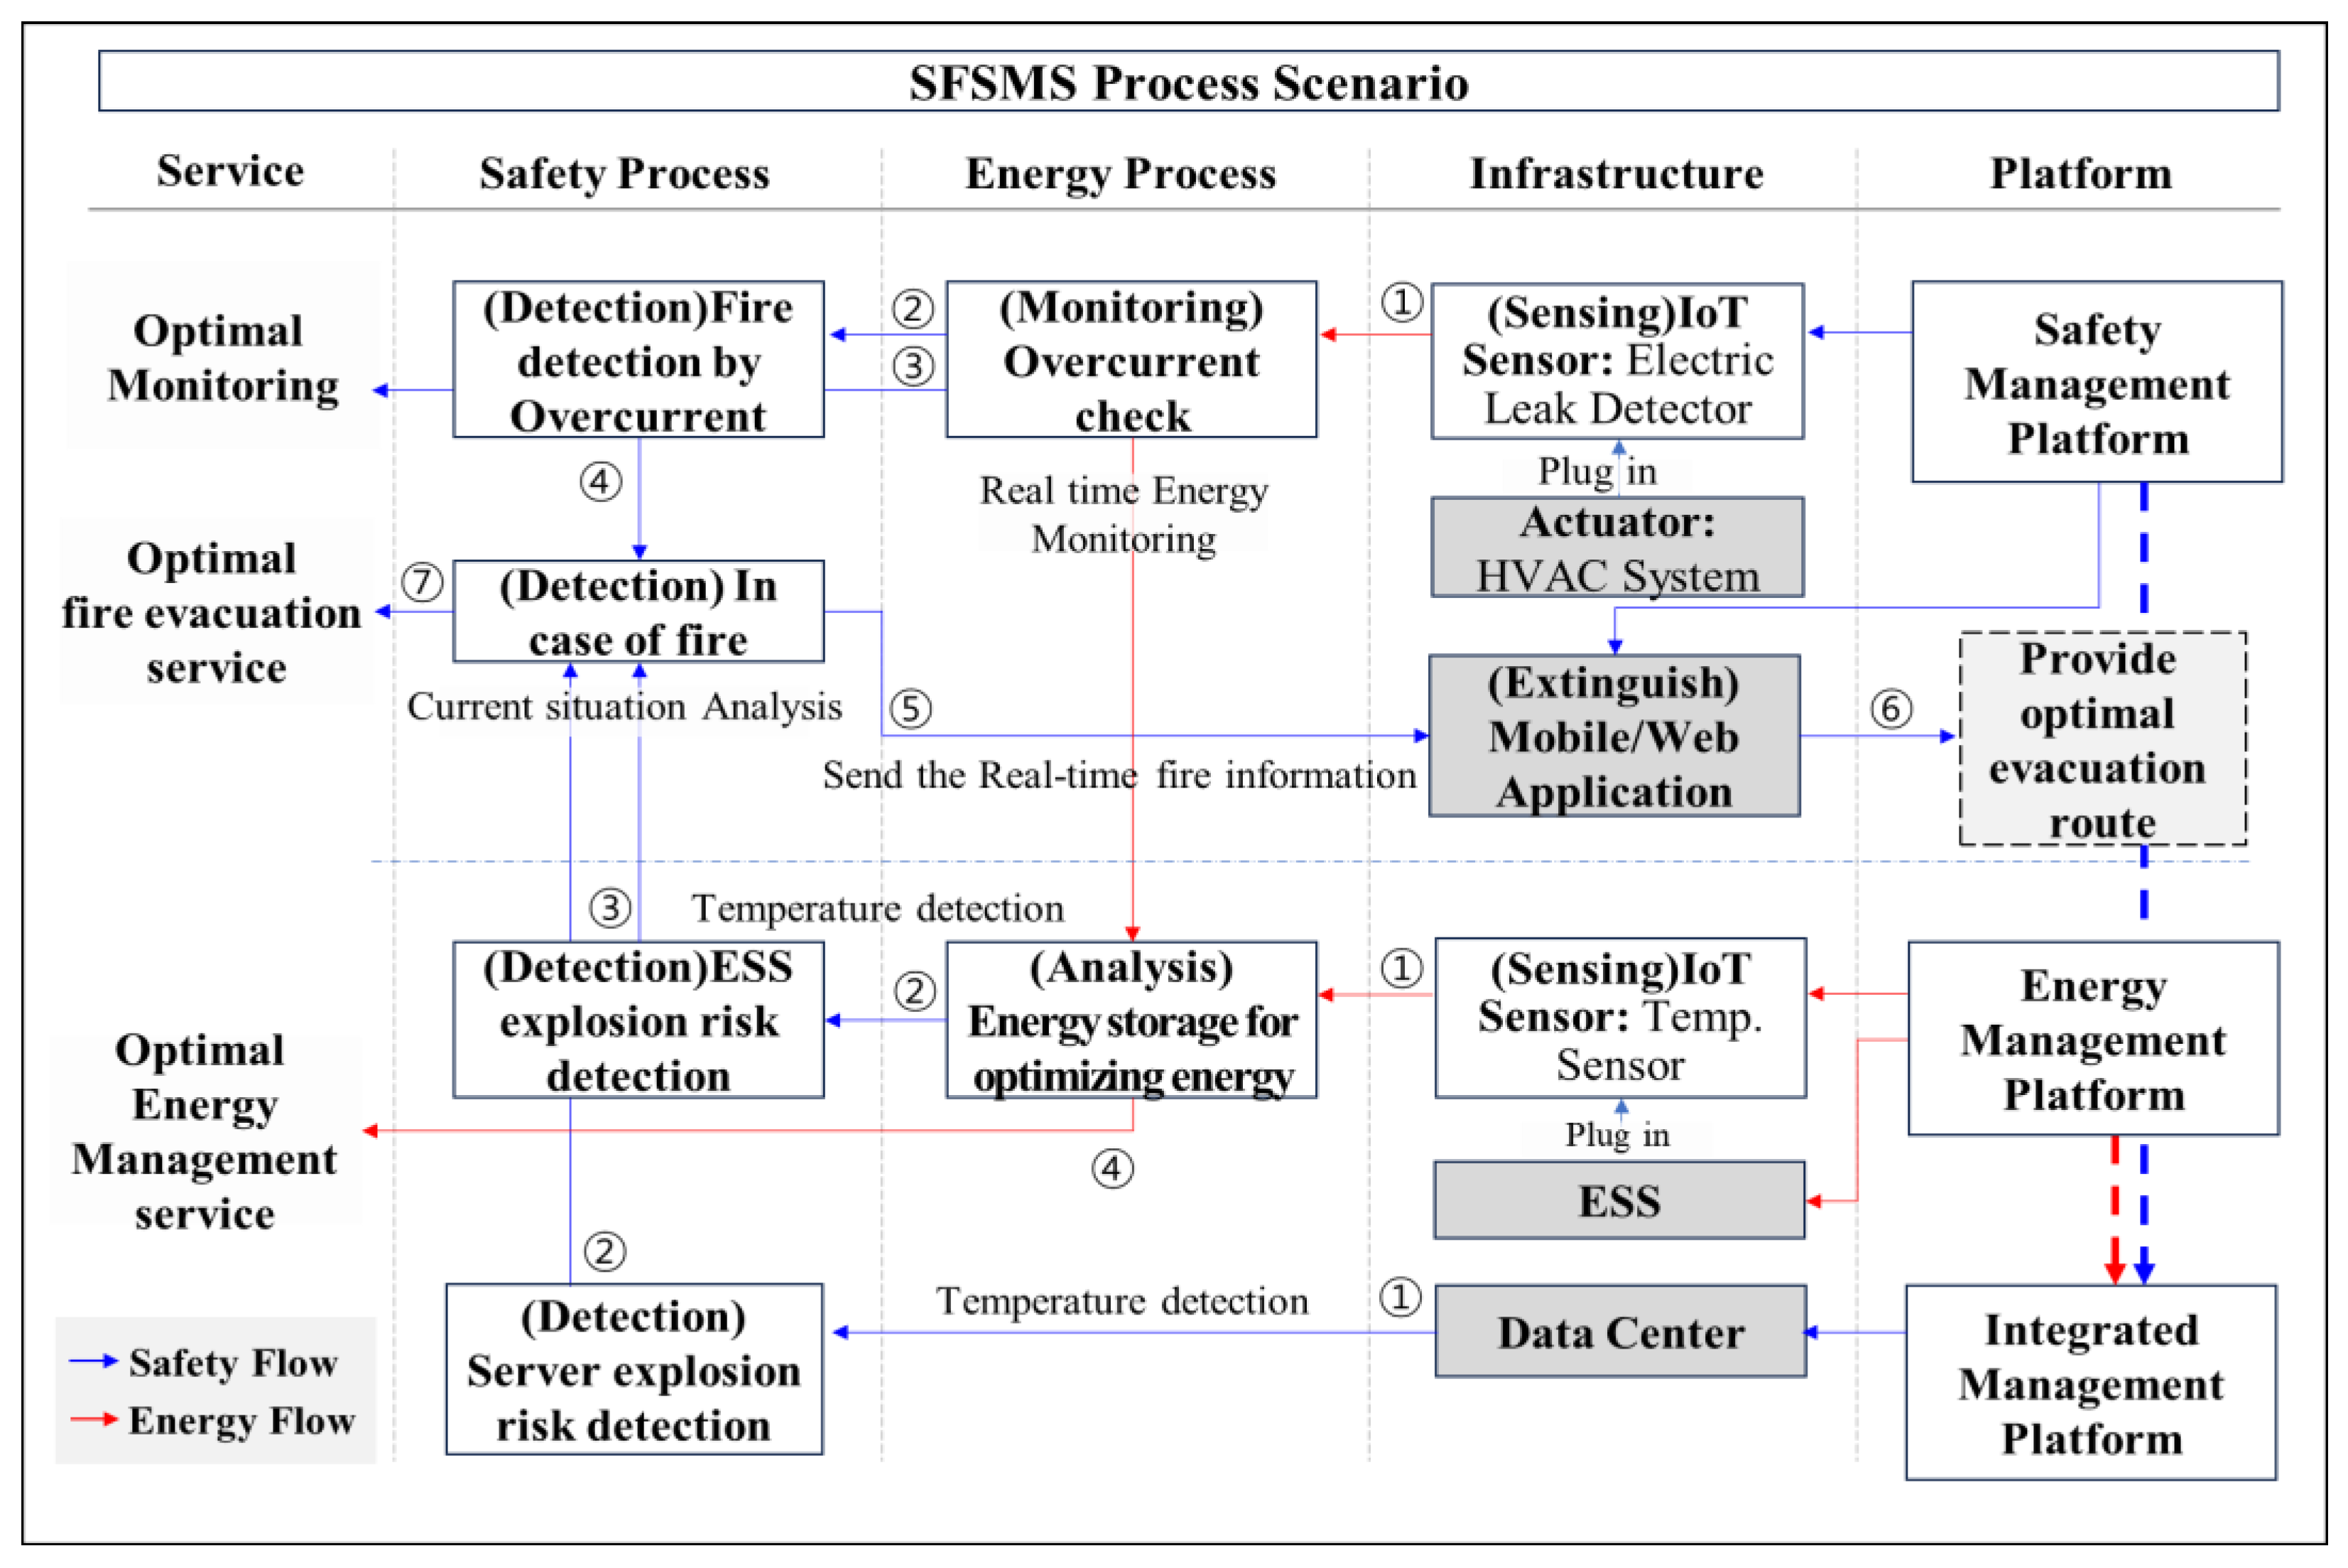
6.2.3. Scenario Simulation of Safety and Management in the SFSMS
- Safety Management: (1) (Sensing) The air conditioning system is an actuator with a plugged-in IoT sensor that transmits power information from the IoT sensor to the server. (2) (Monitoring) The SFSMS server monitors energy and simultaneously determines whether there is a risk of fire due to overcurrent. (3) (Monitoring) At this stage, the server performs energy monitoring for energy saving and monitoring for fire safety. (4) (Detection) When a fire occurs due to overcurrent in a building, the server determines that a fire has occurred and delivers the fire situation to occupants and rescuers. (5) (Rescue) The occupants evacuate through the mobile application, and the rescuer determines the current locations of the occupants through the web application. The server delivers the current fire situation in real time to occupants and rescuers. (6) (Extinguish) The occupants are evacuated through an application that provides optimal evacuation and rescue routes.
- Energy Management: (1) (Sensing/Monitoring) The ESS has plugged-in IoT sensors and transmits data (such as temperature, charging amount, and charging time) from the IoT sensors to the server. (2) (Energy analysis) The server monitors the energy and analyzes the temperature to determine whether there is a fire risk in the ESS. (3) (Detection) In this step, the risk of fire is detected, and the current situation is communicated to occupants and the manager’s mobile/web application. If a fire occurs due to an ESS explosion, go to Step 5 of SFSMS management, as suggested previously.
- Integrated Management: This refers to the integrated management of all areas, such as system safety and energy. The sequence presented in Figure 17 is as follows. (1) (Sensing) The IoT sensor built into the data center detects the temperature in the data center and transmits it to the server. (2) (Monitoring) The server determines whether there is a risk of server explosion due to the temperature increase. If there is a fire due to a server explosion, go to step 5 of the SFSMS management.
7. Analysis of the Result
7.1. SFSMS System Compared to the Existing System
7.2. SFSMS Algorithm Compared to the Existing System
7.2.1. Optimized Evacuation Time Analysis
7.2.2. Energy Efficiency Analysis
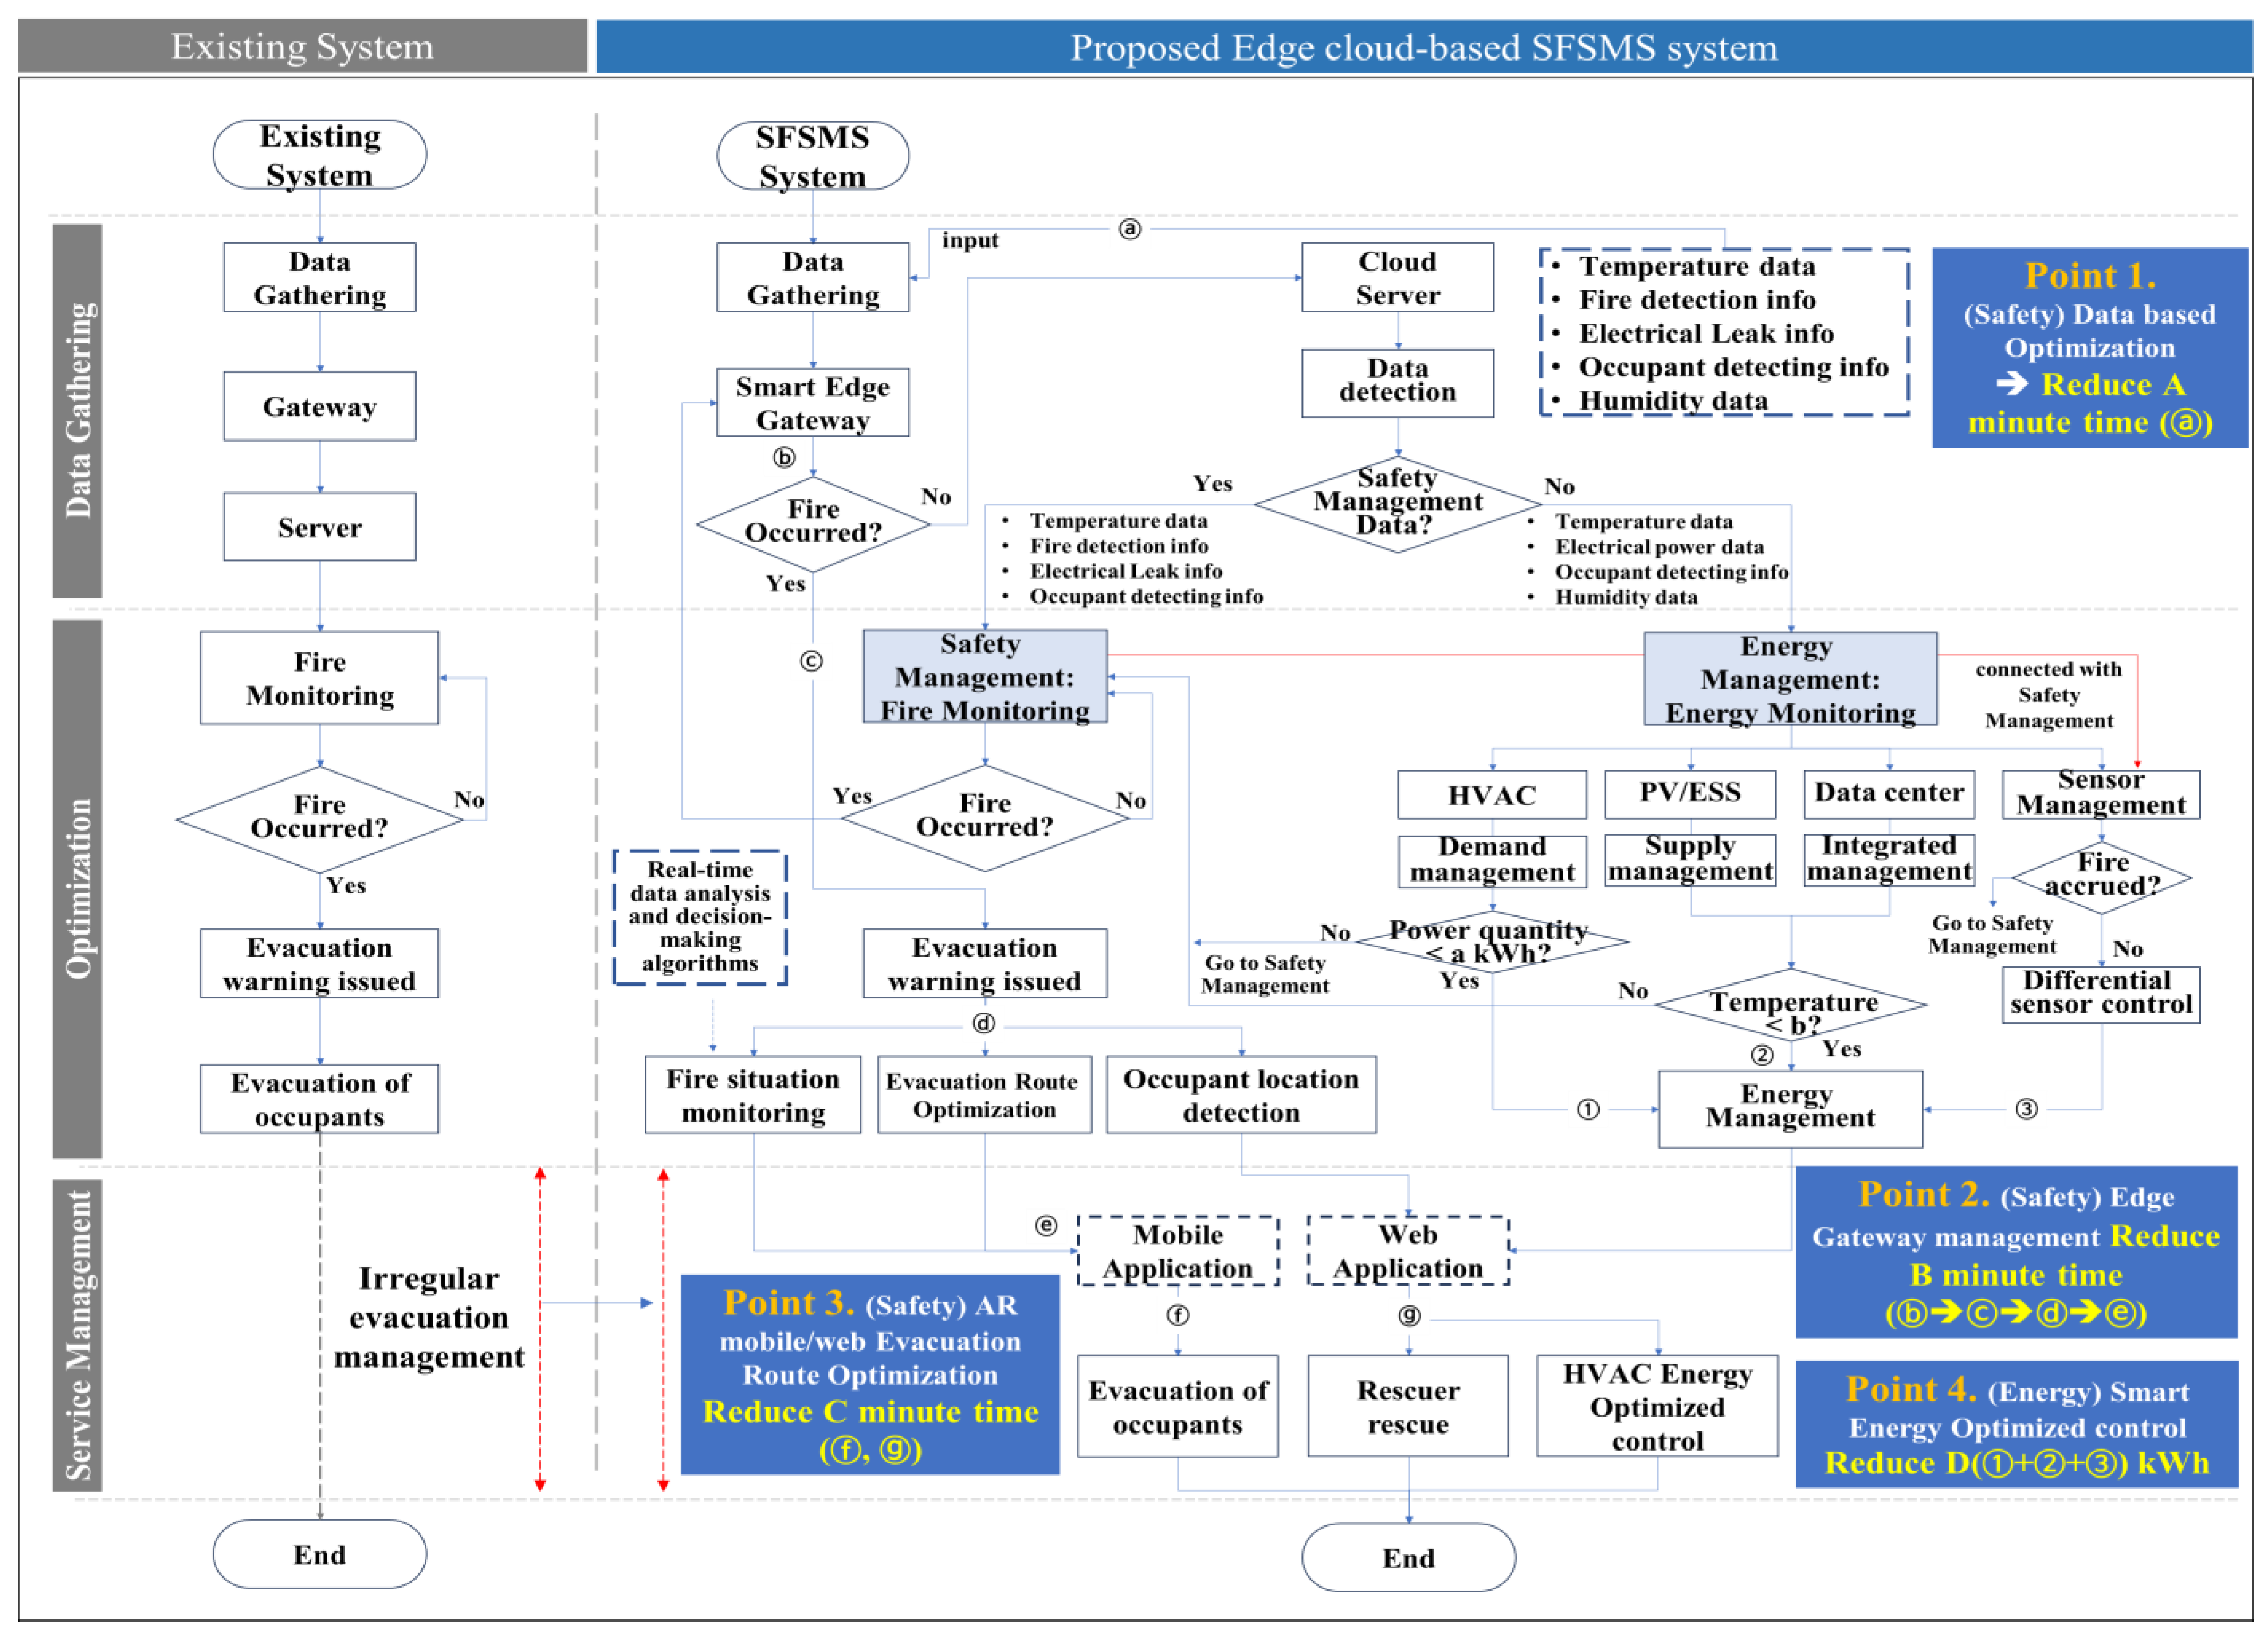
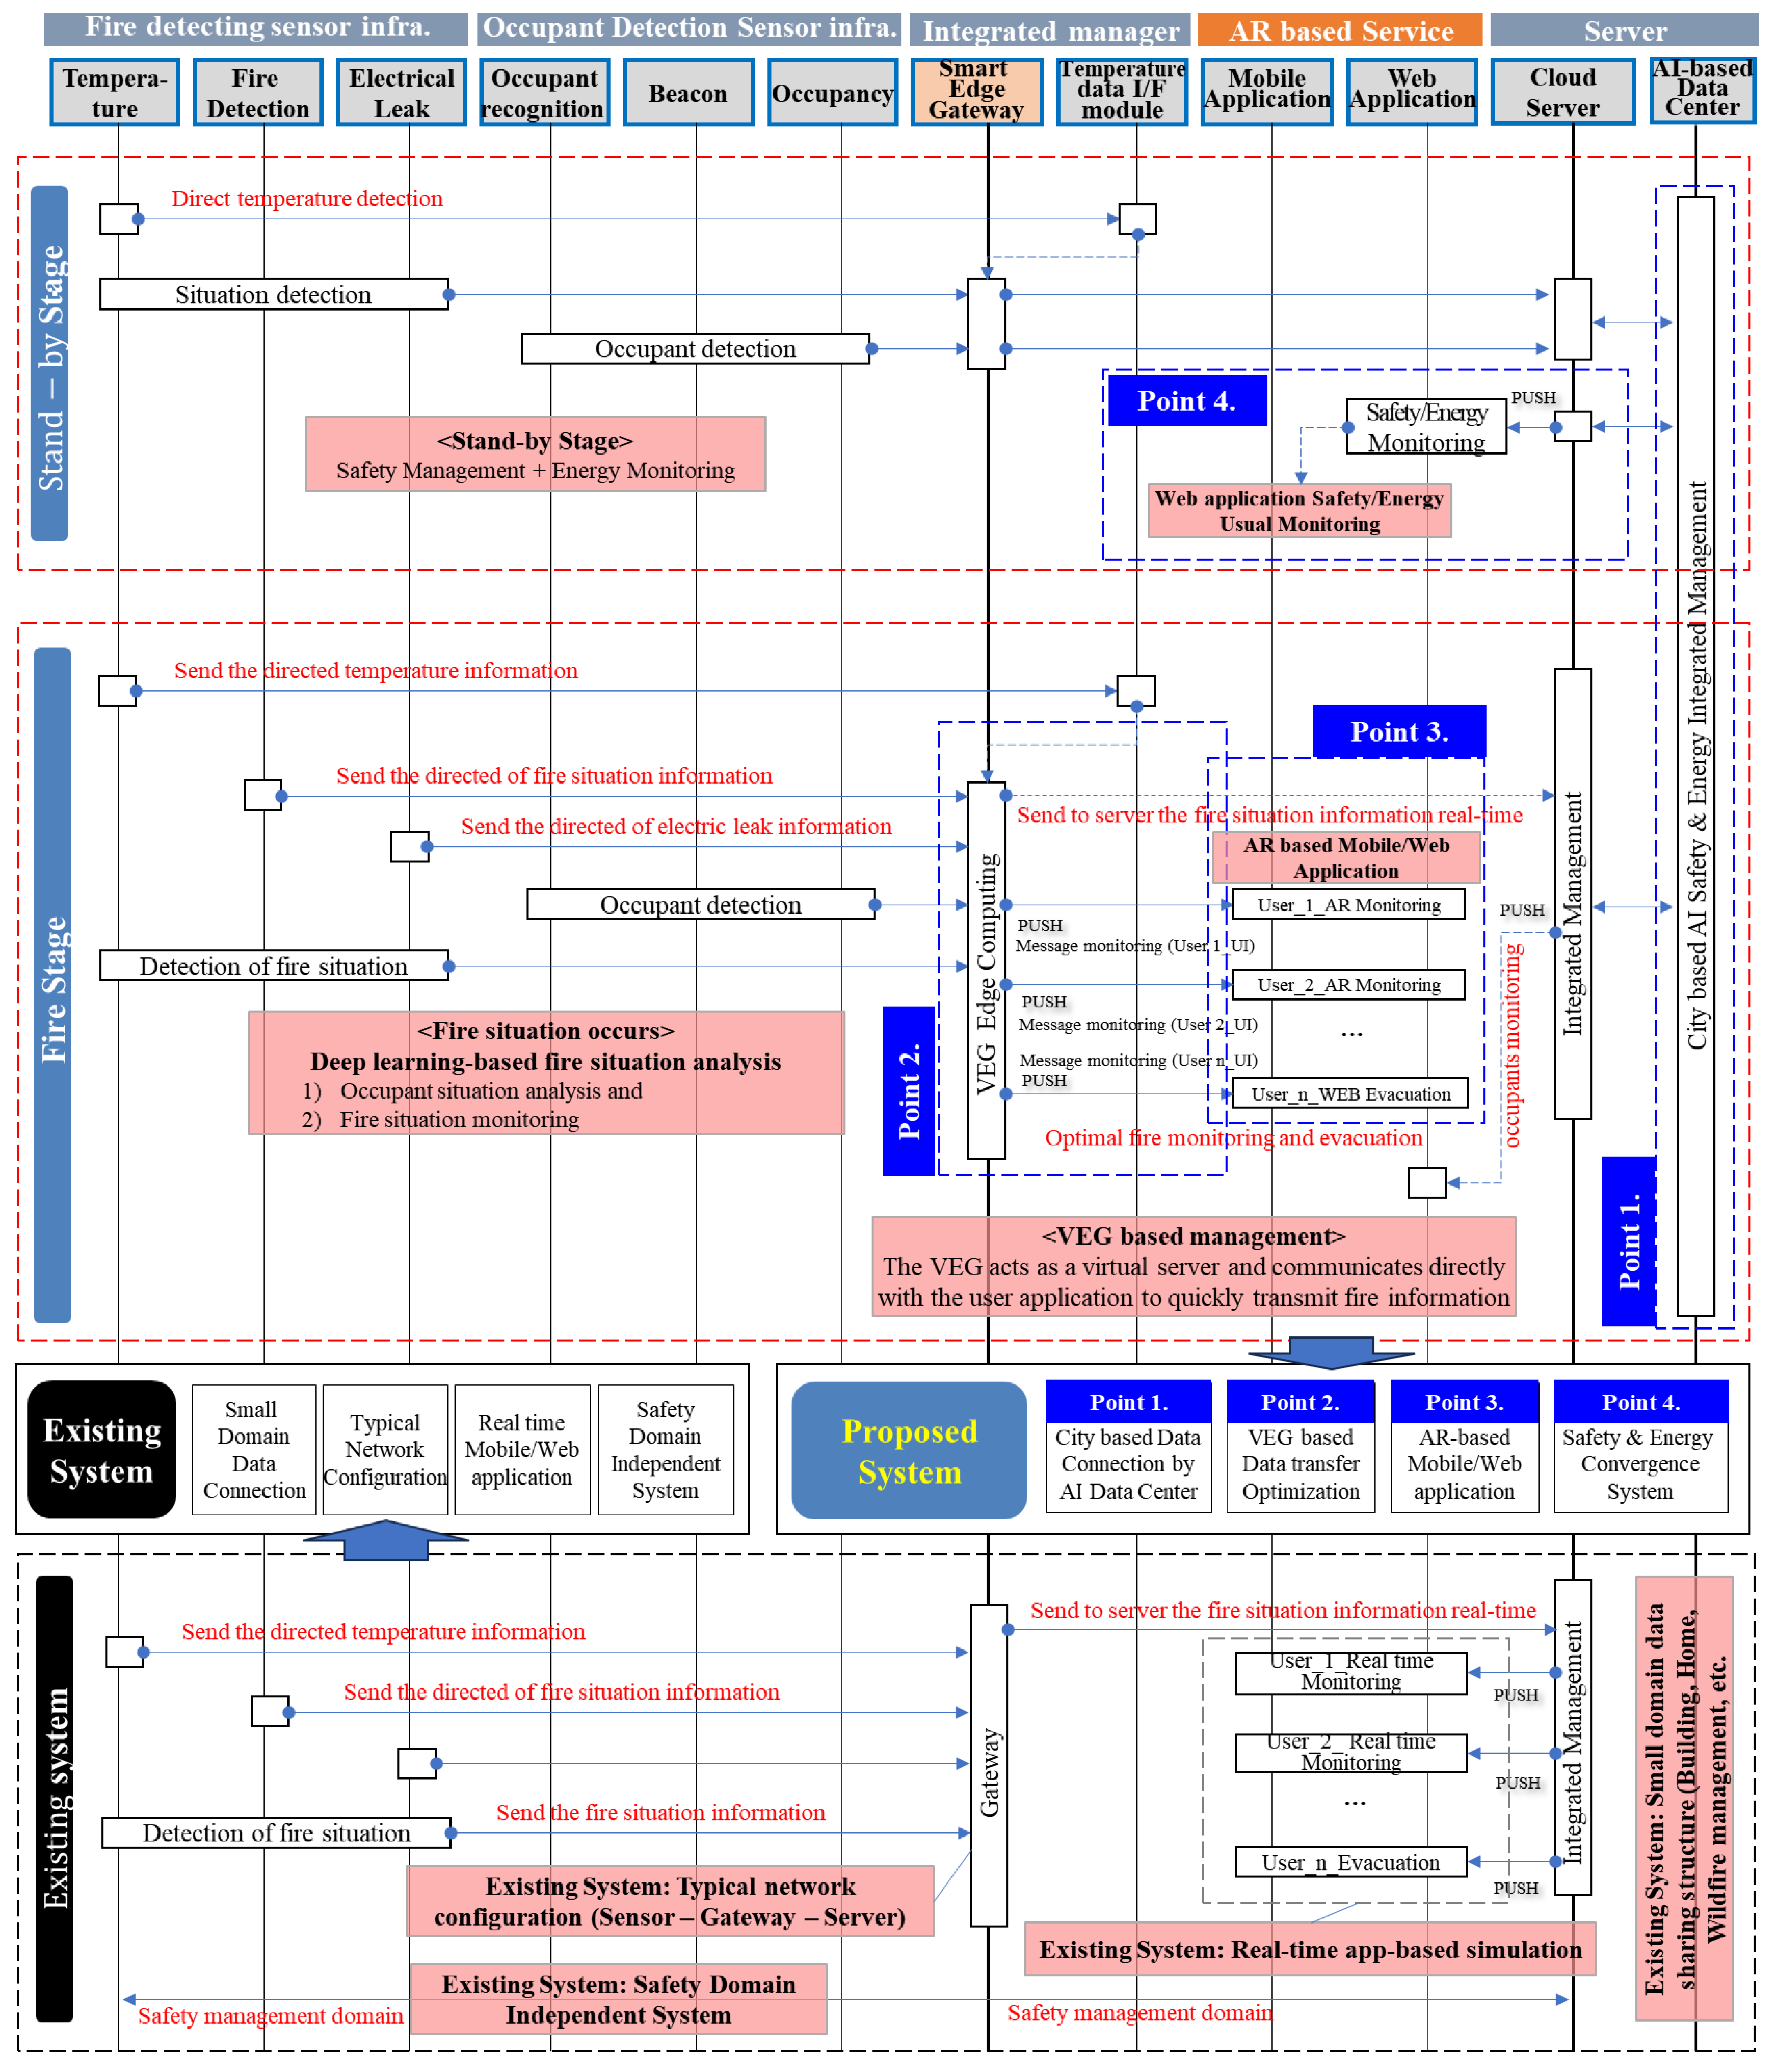
7.2.3. Safety/Energy Four Points for SFSMS
- Point 1: (Safety) digital-based data center integrated management.
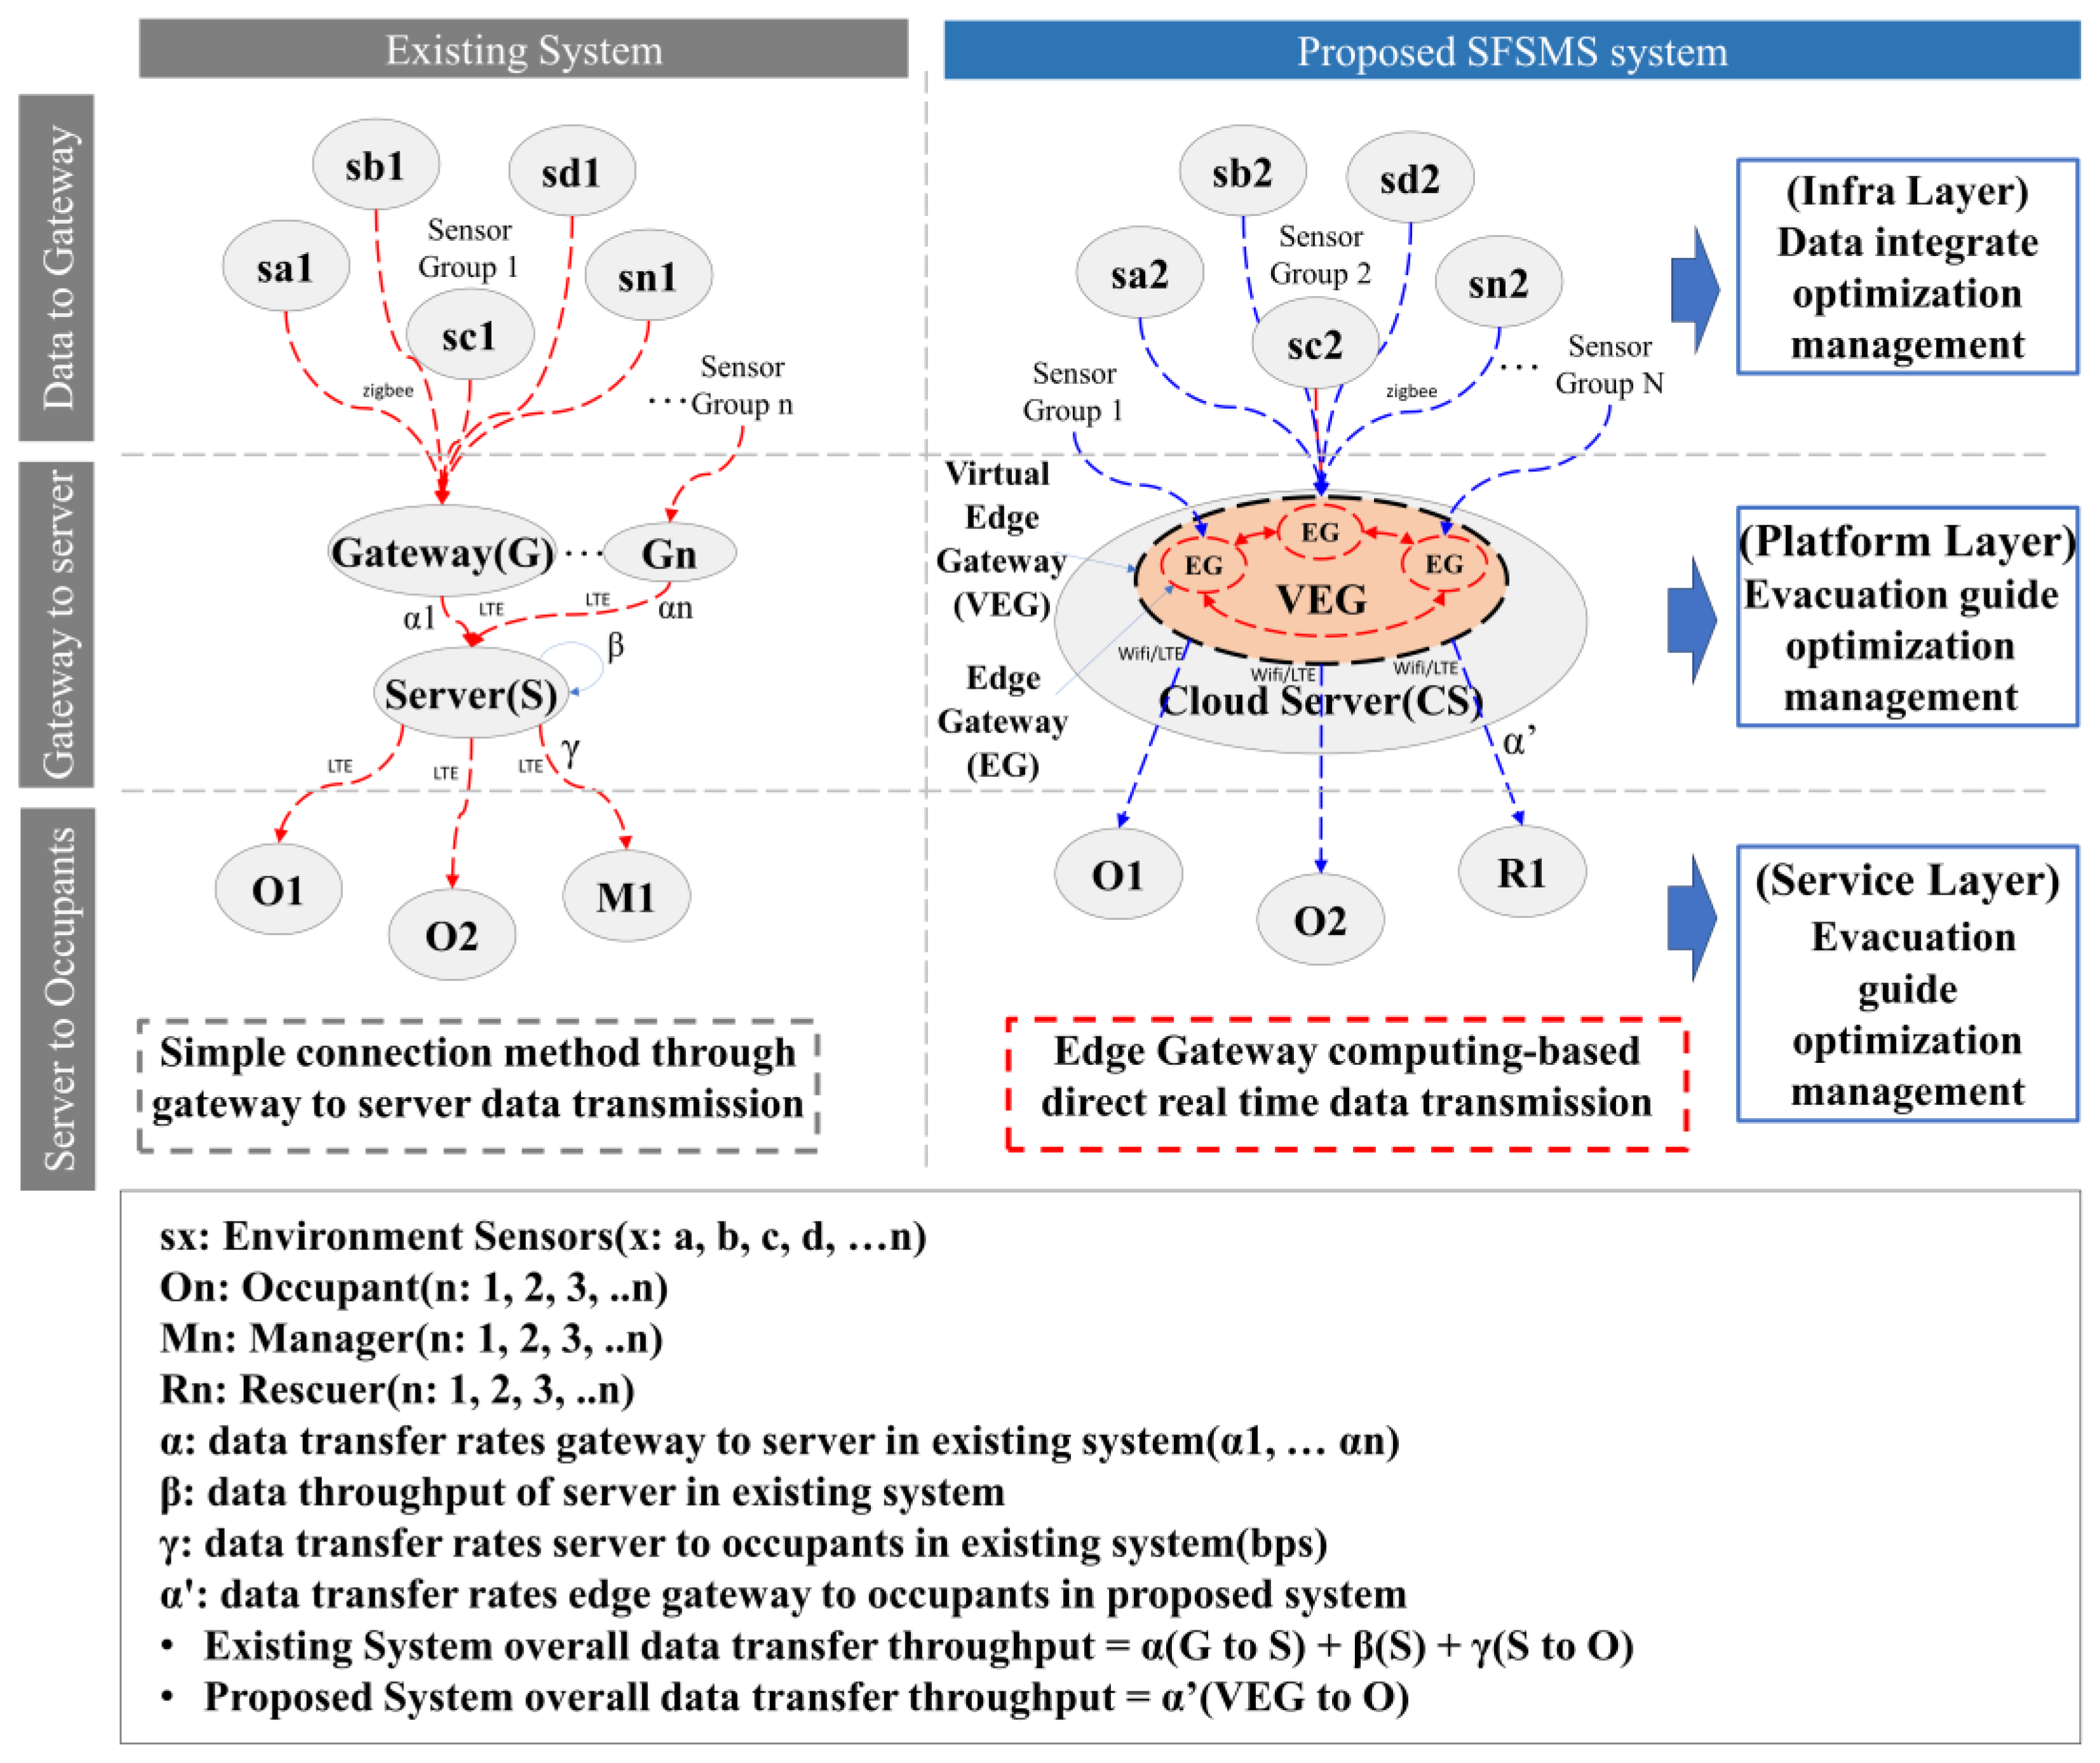
- Point 2: (Safety) Reduce the safety data transfer rates and throughput through the Virtual Edge Gateway. Figure 20 displays a network configuration diagram of the existing and proposed systems for delivering sensor data to the occupants and managers.
- Point 3: (Safety) AR mobile/web application for evacuation routing optimization.
- Point 4: (Energy) HVAC, PV, ESS, and sensor management.
7.3. SFSMS Data Flow Diagram Compared to the Existing System
8. Conclusions
Author Contributions
Funding
Data Availability Statement
Conflicts of Interest
References
- Kusumastuti, R.D.; Nurmala, N.; Rouli, J.; Herdiansyah, H. Analyzing the factors that influence the seeking and sharing of information on the smart city digital platform: Empirical evidence from Indonesia. Technol. Soc. 2022, 68, 101876. [Google Scholar] [CrossRef]
- Park, S. Machine Learning-Based Cost-Effective Smart Home Data Analysis and Forecasting for Energy Saving. Buildings 2023, 13, 2397. [Google Scholar] [CrossRef]
- Chamari, L.; Petrova, E.; Pauwels, P. An End-to-End Implementation of a Service-Oriented Architecture for Data-Driven Smart Buildings. IEEE Access 2023, 11, 117261–117281. [Google Scholar] [CrossRef]
- Liu, X.; Ansari, N. Toward Green IoT: Energy Solutions and Key Challenges. IEEE Commun. Mag. 2019, 57, 104–110. [Google Scholar] [CrossRef]
- Yoon, G.; Jang, H.; Park, S.; Kim, S.; Shin, H.; Cho, K.; Lee, T.; Choi, M.I.; Kang, B.; Park, S.; et al. Carbon-Neutral ESG Method Based on PV Energy Generation Prediction Model in Buildings for EV Charging Platform. Buildings 2023, 13, 2098. [Google Scholar] [CrossRef]
- Rakesh Kumar, L.; Amiya Kumar, R.; Suraj, S. Building Reliable Routing Infrastructure for Green IoT Network. IEEE Access 2019, 7, 129892–129909. [Google Scholar]
- Kim, H.; Choi, H.; Kang, H.; An, J.; Yeom, S.; Hong, T. A systematic review of the smart energy conservation system: From smart homes to sustainable smart cities. Renew. Sustain. Energy Rev. 2021, 140, 110755. [Google Scholar] [CrossRef]
- Kim, D.; Cha, H.-S.; Jiang, S. The Prediction of Fire Disaster Using BIM-Based Visualization for Expediting the Management Process. Sustainability 2023, 15, 3719. [Google Scholar] [CrossRef]
- Ministry of Public Administration and Security. Promoting Customized Response Strategies for Vulnerable Evacuees such as Elderly Households, National Fire Information System Statistics. Available online: https://www.safetynews.co.kr/news/articleView.html?idxno=218904 (accessed on 15 October 2023).
- Nahyang, B. Fire safety in planning of elderly residential facilities: A case study from Korea. J. Asian Archit. Build. Eng. 2019, 18, 617–626. [Google Scholar]
- Zhang, Y.; Geng, P.; Sivaparthipan, C.B.; Muthu, B.A. Big data and artificial intelligence based early risk warning system of fire hazard for smart cities. Sustain. Energy Technol. Assess. 2021, 45, 100986. [Google Scholar] [CrossRef]
- Bazmohammadi, N.; Madary, A.; Vasquez, J.C.; Mohammadi, H.B.; Khan, B.; Wu, Y.; Guerrero, J.M. Microgrid Digital Twins: Concepts, Applications, and Future Trends. IEEE Access 2022, 10, 2284–2302. [Google Scholar] [CrossRef]
- Samiappan, D.; Venkatesh, C.; Rajamanickam, N.; Ramamoorthy, K.; Gerard, D.; Dinesh Babu, D.; Ramalingam, S. Thermal management of solar photovoltaic panels using a fibre Bragg grating sensor-based temperature monitoring. Case Stud. Therm. Eng. 2022, 31, 101834. [Google Scholar]
- Bae, J.; Bae, H.; Cho, J.; Jung, J.; Choi, Y.; Kim, Y. Zero fire battery concept: Water-in-battery. J. Mater. Chem. A 2022, 10, 6481–6488. [Google Scholar] [CrossRef]
- Yan, K.; Zhou, X.; Yang, B. Editorial: AI and IoT applications of smart buildings and smart environment design, construction and maintenance. Build. Environ. 2023, 229, 1–6. [Google Scholar] [CrossRef]
- Fang, H.; Lo, S.; Lo, J.T.Y. Building Fire Evacuation: An IoT-Aided Perspective in the 5G Era. Buildings 2021, 11, 643–666. [Google Scholar] [CrossRef]
- Kaur, A.; Sahil; Sood, S.K. Cloud-fog assisted energy efficient architectural paradigm for disaster evacuation. Inf. Syst. 2021, 107, 101732. [Google Scholar] [CrossRef]
- Chou, J.-S.; Cheng, M.-Y.; Hsieh, Y.-M.; Yang, I.T.; Hsu, H.-T. Optimal path planning in real time for dynamic building fire rescue operations using wireless sensors and visual guidance. Autom. Constr. 2019, 99, 1–17. [Google Scholar] [CrossRef]
- Zhang, Y.; Zhang, X.; Huang, X. Design a safe firefighting time (SFT) for major fire disaster emergency response. Int. J. Disaster Risk Reduct. 2023, 88, 103606. [Google Scholar] [CrossRef]
- Yang, Y.; Sun, Y.; Chen, M.; Zhou, Y.; Wang, R.; Liu, Z. Platform Development of BIM-Based Fire Safety Management System Considering the Construction Site. Buildings 2022, 12, 1268. [Google Scholar] [CrossRef]
- Monedero, S.; Ramirez, J.; Cardil, A. Predicting fire spread and behaviour on the fireline. Wildfire analyst pocket: A mobile app for wildland fire prediction. Ecol. Model. 2019, 392, 103–107. [Google Scholar] [CrossRef]
- Radianti, J.; Lazreg, M.B.; Granmo, O.-C. Fire simulation-based adaptation of SmartRescue App for serious game: Design, setup and user experience. Eng. Appl. Artif. Intell. 2015, 46, 312–325. [Google Scholar] [CrossRef]
- Athanasis, N.; Karagiannis, F.; Palaiologou, P.; Vasilakos, C.; Kalabokidis, K. AEGIS App: Wildfire Information Management for Windows Phone Devices. Procedia Comput. Sci. 2015, 56, 544–549. [Google Scholar] [CrossRef]
- Jung, S.; Cha, H.S.; Jiang, S. Developing a building fire information management system based on 3D object visualization. Appl. Sci. 2020, 10, 772. [Google Scholar] [CrossRef]
- Battistoni, P.; Cantone, A.A.; Martino, G.; Passamano, V.; Sebillo, M.; Vitiello, G.; Romano, M. A Cyber-Physical System for Wildfire Detection and Firefighting. Future Internet 2023, 15, 237. [Google Scholar] [CrossRef]
- Aral, R.A.; Zalluhoglu, C.; Akcapinar Sezer, E. Lightweight and attention-based CNN architecture for wildfire detection using UAV vision data. Int. J. Remote Sens. 2023, 44, 5768–5787. [Google Scholar] [CrossRef]
- Abdulzahra, A.M.K.; Al-Qurabat, A.K.M.; Abdulzahra, S.A. Optimizing energy consumption in WSN-based IoT using unequal clustering and sleep scheduling methods. Internet Things 2023, 22, 100765. [Google Scholar] [CrossRef]
- Zhu, H.; Zhang, D.; Goh, H.H.; Wang, S.; Ahmad, T.; Mao, D.; Liu, T.; Zhao, H.; Wu, T. Future data center energy-conservation and emission-reduction technologies in the context of smart and low-carbon city construction. Sustain. Cities Soc. 2023, 89, 104322. [Google Scholar] [CrossRef]
- Park, S.; Lee, S.; Park, S.; Park, S. AI-based physical and virtual platform with 5-layered architecture for sustainable smart energy city development. Sustainability 2019, 11, 4479. [Google Scholar] [CrossRef]
- Sangmin, P.; SeolAh, P.; Sang-Pil, Y.; Kyungeun, L.; Byeongkwan, K.; Myeong-in, C.; Hyeonwoo, J.; Sehyun, P. Design and Implementation of a Futuristic EV Energy Trading System (FEETS) Connected with Buildings, PV, and ESS for a Carbon-Neutral Society. Buildings 2023, 13, 829. [Google Scholar]
- Park, S.; Park, S.H.; Park, S.; Lee, S.; Lee, T.; Lee, S.H.; Jang, H.; Kim, S.M.; Park, S.; Park, L.W.; et al. Design and implementation of a Smart IoT based building and town disaster management system in Smart City Infrastructure. Appl. Sci. 2018, 8, 2239. [Google Scholar] [CrossRef]
- Lakshmi, P.; Rejith, G.; Toby, T.; NB, S.S.; Rao, S.N. A Resilient IoT System Architecture for Disaster Management in Collapsed Buildings. In Proceedings of the 2022 International Conference on Wireless Communications Signal Processing and Networking (WiSPNET), Chennai, India, 24–26 March 2022; pp. 282–287. [Google Scholar]
- Basabi, A.E.; Hashemi, S.M. Energy Consumption Evaluation of ZigBee Routing Protocols in IOT. Wirel. Pers. Commun. 2023, 130, 707–727. [Google Scholar] [CrossRef]
- Liu, E.; Zheng, L.; He, Q.; Lai, P.; Xu, B.; Zhang, G. Role-Based User Allocation Driven by Criticality in Edge Computing. IEEE Trans. Serv. Comput. Serv. Comput. 2023, 16, 3636–3650. [Google Scholar] [CrossRef]
- Chen, H.-M.; Chang, K.-C.; Lin, T.-H. A cloud-based system framework for performing online viewing, storage, and analysis on big data of massive BIMs. Autom. Constr. 2016, 71, 34–48. [Google Scholar] [CrossRef]
- Chen, H.; Hou, L.; Zhang, G.; Moon, S. Development of BIM, IoT and AR/VR technologies for fire safety and upskilling. Autom. Constr. 2021, 125, 103631. [Google Scholar] [CrossRef]
- Noveri Lysbetti, M.; Rahyul, A.; Edy, E.; Nurhalim Dani, A. Analysis of Controlling Wireless Temperature Sensor for Monitoring Peat-Land Fire. Int. J. Electr. Energy Power Syst. Eng. 2018, 1, 14–19. [Google Scholar]
- Jabirullah, M.; Khan, A.; Ali, M.Z.; Wajih, S.S.; Hussain, M.A. Iot-based occupancy monitoring techniques for energy efficient smart buildings. Turk. Online J. Qual. Inq. 2021, 12, 5402–5409. [Google Scholar]
- Chou, J.-S.; Telaga, A.S.; Chong, W.K.; Gibson, J.G.E. Early-warning application for real-time detection of energy consumption anomalies in buildings. J. Clean. Prod. 2017, 149, 711–722. [Google Scholar] [CrossRef]
- Peng, Y.; Wang, X.; Shen, D.; Yan, W.; Deng, Q.; Fu, Y. Design and modeling of survivable network planning for software-defined data center networks in smart city. Int. J. Commun. Syst. 2018, 31, e3509. [Google Scholar] [CrossRef]


| Class | Existing System | Proposed System |
|---|---|---|
| Service Domain |
|
|
| Discrimination in services |
|
|
| Network architecture |
|
|
| Energy management |
|
|
| Class | Item | Contents and Components |
|---|---|---|
| Fire detection Sensor |
|
|
|
| |
|
| |
| Occupant detection Sensor |
|
|
|
| |
|
| |
| Integrated manager |
|
|
|
| |
|
| Class | Item |
|---|---|
| Characteristics |
|
| Service Domain |
|
| Beacon | X | Z | Beacon | X | Z | Sensor | X | Z |
|---|---|---|---|---|---|---|---|---|
| 1 | 23.83 | 10.72 | 11 | 23.83 | 69.21 | 1 | 25.18 | 20.6 |
| 2 | 26.54 | 10.72 | 12_1 | 26.54 | 69.21 | 2 | 24.18 | 32.83 |
| 3 | 23.83 | 38.91 | 12_2 | 26.54 | 66.27 | 3 | 26.18 | 32.83 |
| 4 | 26.54 | 38.91 | 13 | 38.17 | 69.21 | 4 | 25.18 | 57.61 |
| 5_1 | 23.83 | 52.82 | 14 | 38.17 | 66.27 | 5 | 24.18 | 63.88 |
| 5_2 | 13 | 52.82 | 15 | 49.38 | 69.21 | 6 | 26.18 | 63.88 |
| 6 | 26.54 | 52.82 | 16 | 49.38 | 66.27 | 7 | 41.67 | 66.74 |
| 7_1 | 23.83 | 55.77 | 17 | 54.63 | 69.21 | 8 | 41.67 | 68.74 |
| 7_2 | 13 | 55.77 | 18 | 54.63 | 66.27 | 9 | 55.34 | 66.74 |
| 8 | 26.54 | 55.77 | 19 | 72.39 | 69.21 | 10 | 55.34 | 68.74 |
| 9 | 23.83 | 60.98 | 20 | 72.39 | 66.27 | - | - | - |
| 10 | 26.54 | 60.98 | - | - | - | - | - | - |
| Class | Sensor | Field | Details Specifications | |
|---|---|---|---|---|
| (a) Fire detecting sensor infra. | ZigBee Temperature Sensor | Safety Energy | Thermal fuse |
|
| Sensor |
| |||
| Measurement performance |
| |||
| Thermal fuse characteristics |
| |||
| Metal material |
| |||
| Insulation material |
| |||
| Wire material |
| |||
| Operating temperature |
| |||
| Size |
| |||
| ZigBee Fire detection sensor | Safety | Sensor |
| |
| Performance |
| |||
| Operating power |
| |||
| Texture |
| |||
| Operating temperature |
| |||
| Weight/Size |
| |||
| ZigBee Electrical Leak Detector | Safety | Characteristic |
| |
| (b) Occupant Detection Sensor | Occupant recognition sensor | Safety | Operation method |
|
| Beacon sensor | Safety | Operation method |
| |
| Occupancy sensor | Energy |
| ||
| (c) Integrated manager | Smart Edge Gateway | Safety Energy | Network type |
|
| ||||
| ||||
| Encryption method |
| |||
| Temperature data I/F module | Safety | Total weight |
| |
| Radiation time |
| |||
| Working pressure |
| |||
| Operating temperature |
| |||
| Class | Proposed System | Existing System |
|---|---|---|
| Point 1. |
|
|
| Point 2. |
|
|
| Point 3. |
|
|
| Point 4. |
|
|
Disclaimer/Publisher’s Note: The statements, opinions and data contained in all publications are solely those of the individual author(s) and contributor(s) and not of MDPI and/or the editor(s). MDPI and/or the editor(s) disclaim responsibility for any injury to people or property resulting from any ideas, methods, instructions or products referred to in the content. |
© 2023 by the authors. Licensee MDPI, Basel, Switzerland. This article is an open access article distributed under the terms and conditions of the Creative Commons Attribution (CC BY) license (https://creativecommons.org/licenses/by/4.0/).
Share and Cite
Park, S.; Lee, S.; Jang, H.; Yoon, G.; Choi, M.-i.; Kang, B.; Cho, K.; Lee, T.; Park, S. Smart Fire Safety Management System (SFSMS) Connected with Energy Management for Sustainable Service in Smart Building Infrastructures. Buildings 2023, 13, 3018. https://doi.org/10.3390/buildings13123018
Park S, Lee S, Jang H, Yoon G, Choi M-i, Kang B, Cho K, Lee T, Park S. Smart Fire Safety Management System (SFSMS) Connected with Energy Management for Sustainable Service in Smart Building Infrastructures. Buildings. 2023; 13(12):3018. https://doi.org/10.3390/buildings13123018
Chicago/Turabian StylePark, Sangmin, Sanghoon Lee, Hyeonwoo Jang, Guwon Yoon, Myeong-in Choi, Byeongkwan Kang, Keonhee Cho, Tacklim Lee, and Sehyun Park. 2023. "Smart Fire Safety Management System (SFSMS) Connected with Energy Management for Sustainable Service in Smart Building Infrastructures" Buildings 13, no. 12: 3018. https://doi.org/10.3390/buildings13123018