
Multivariate Evaluation of Photovoltaic Utilization Potential of Primary and Secondary School Buildings: A Case Study in Hainan Province, China

Abstract
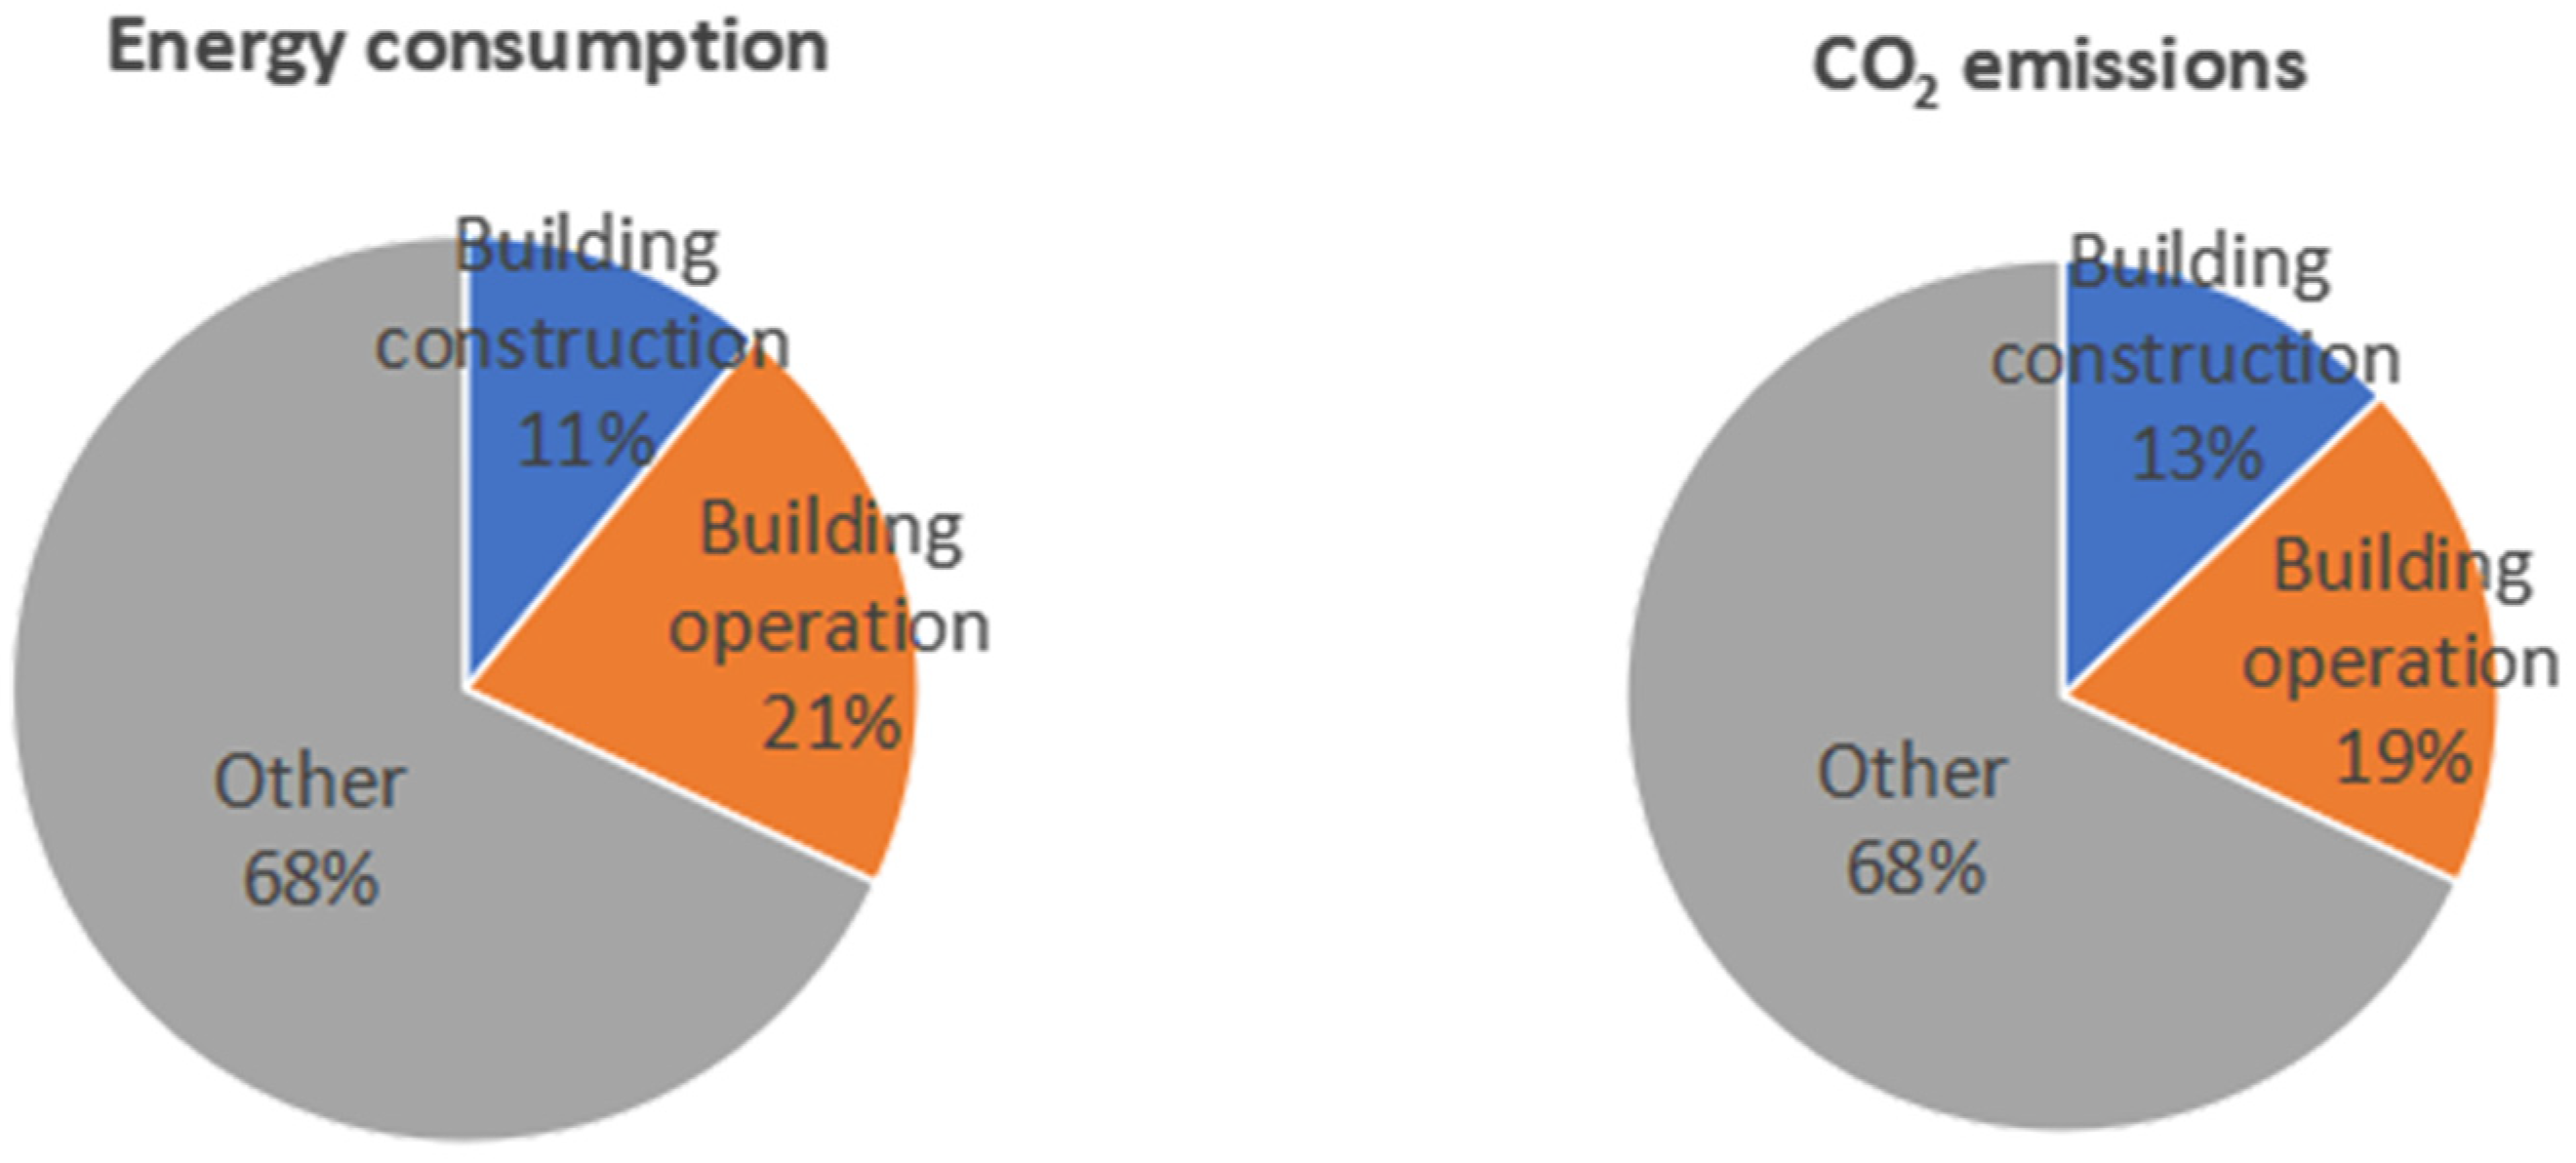
:1. Introduction
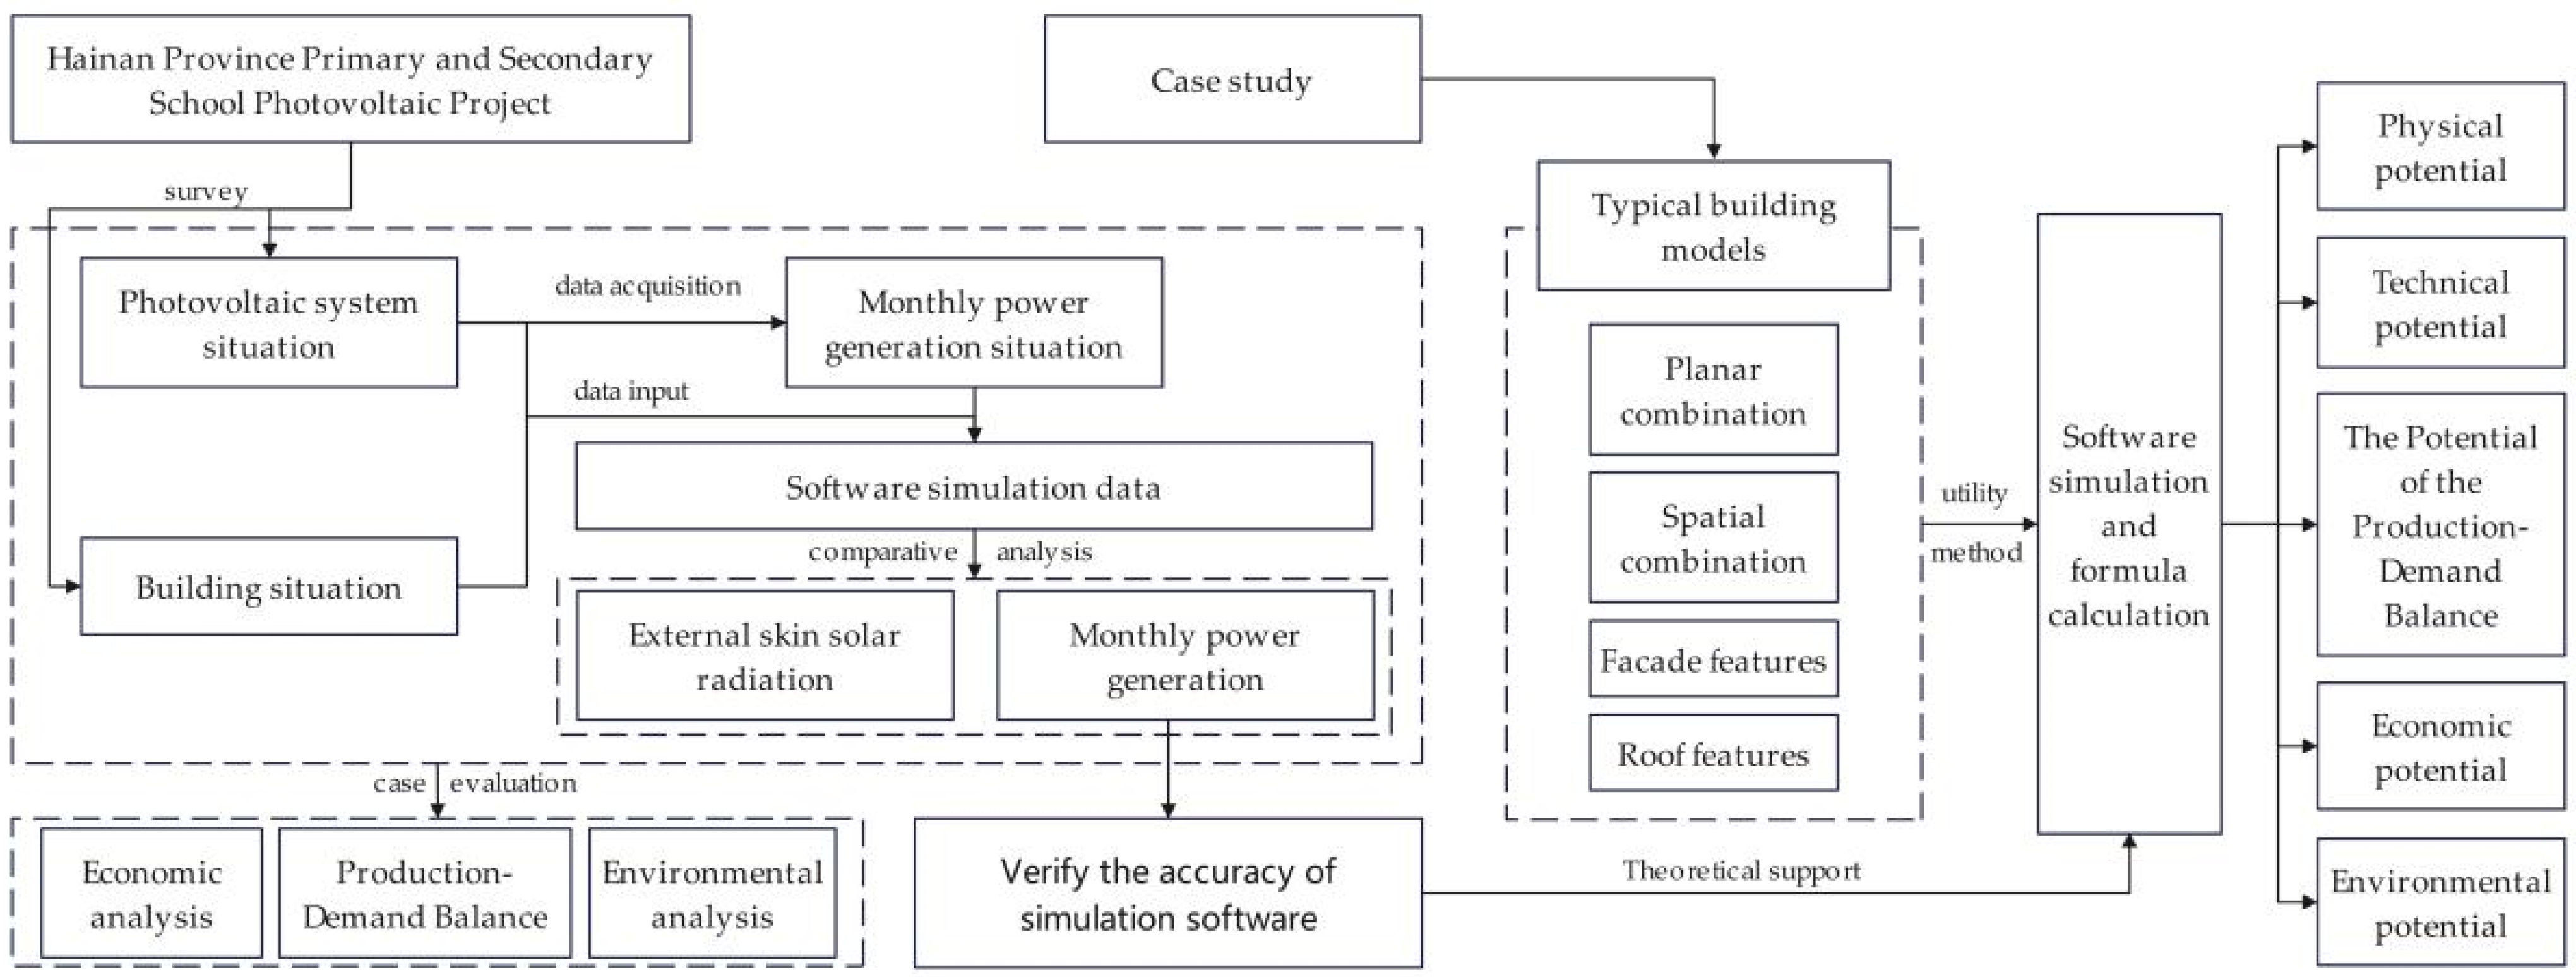
2. Methodology
3. Analysis of Photovoltaic Systems in School Buildings in Hainan Province
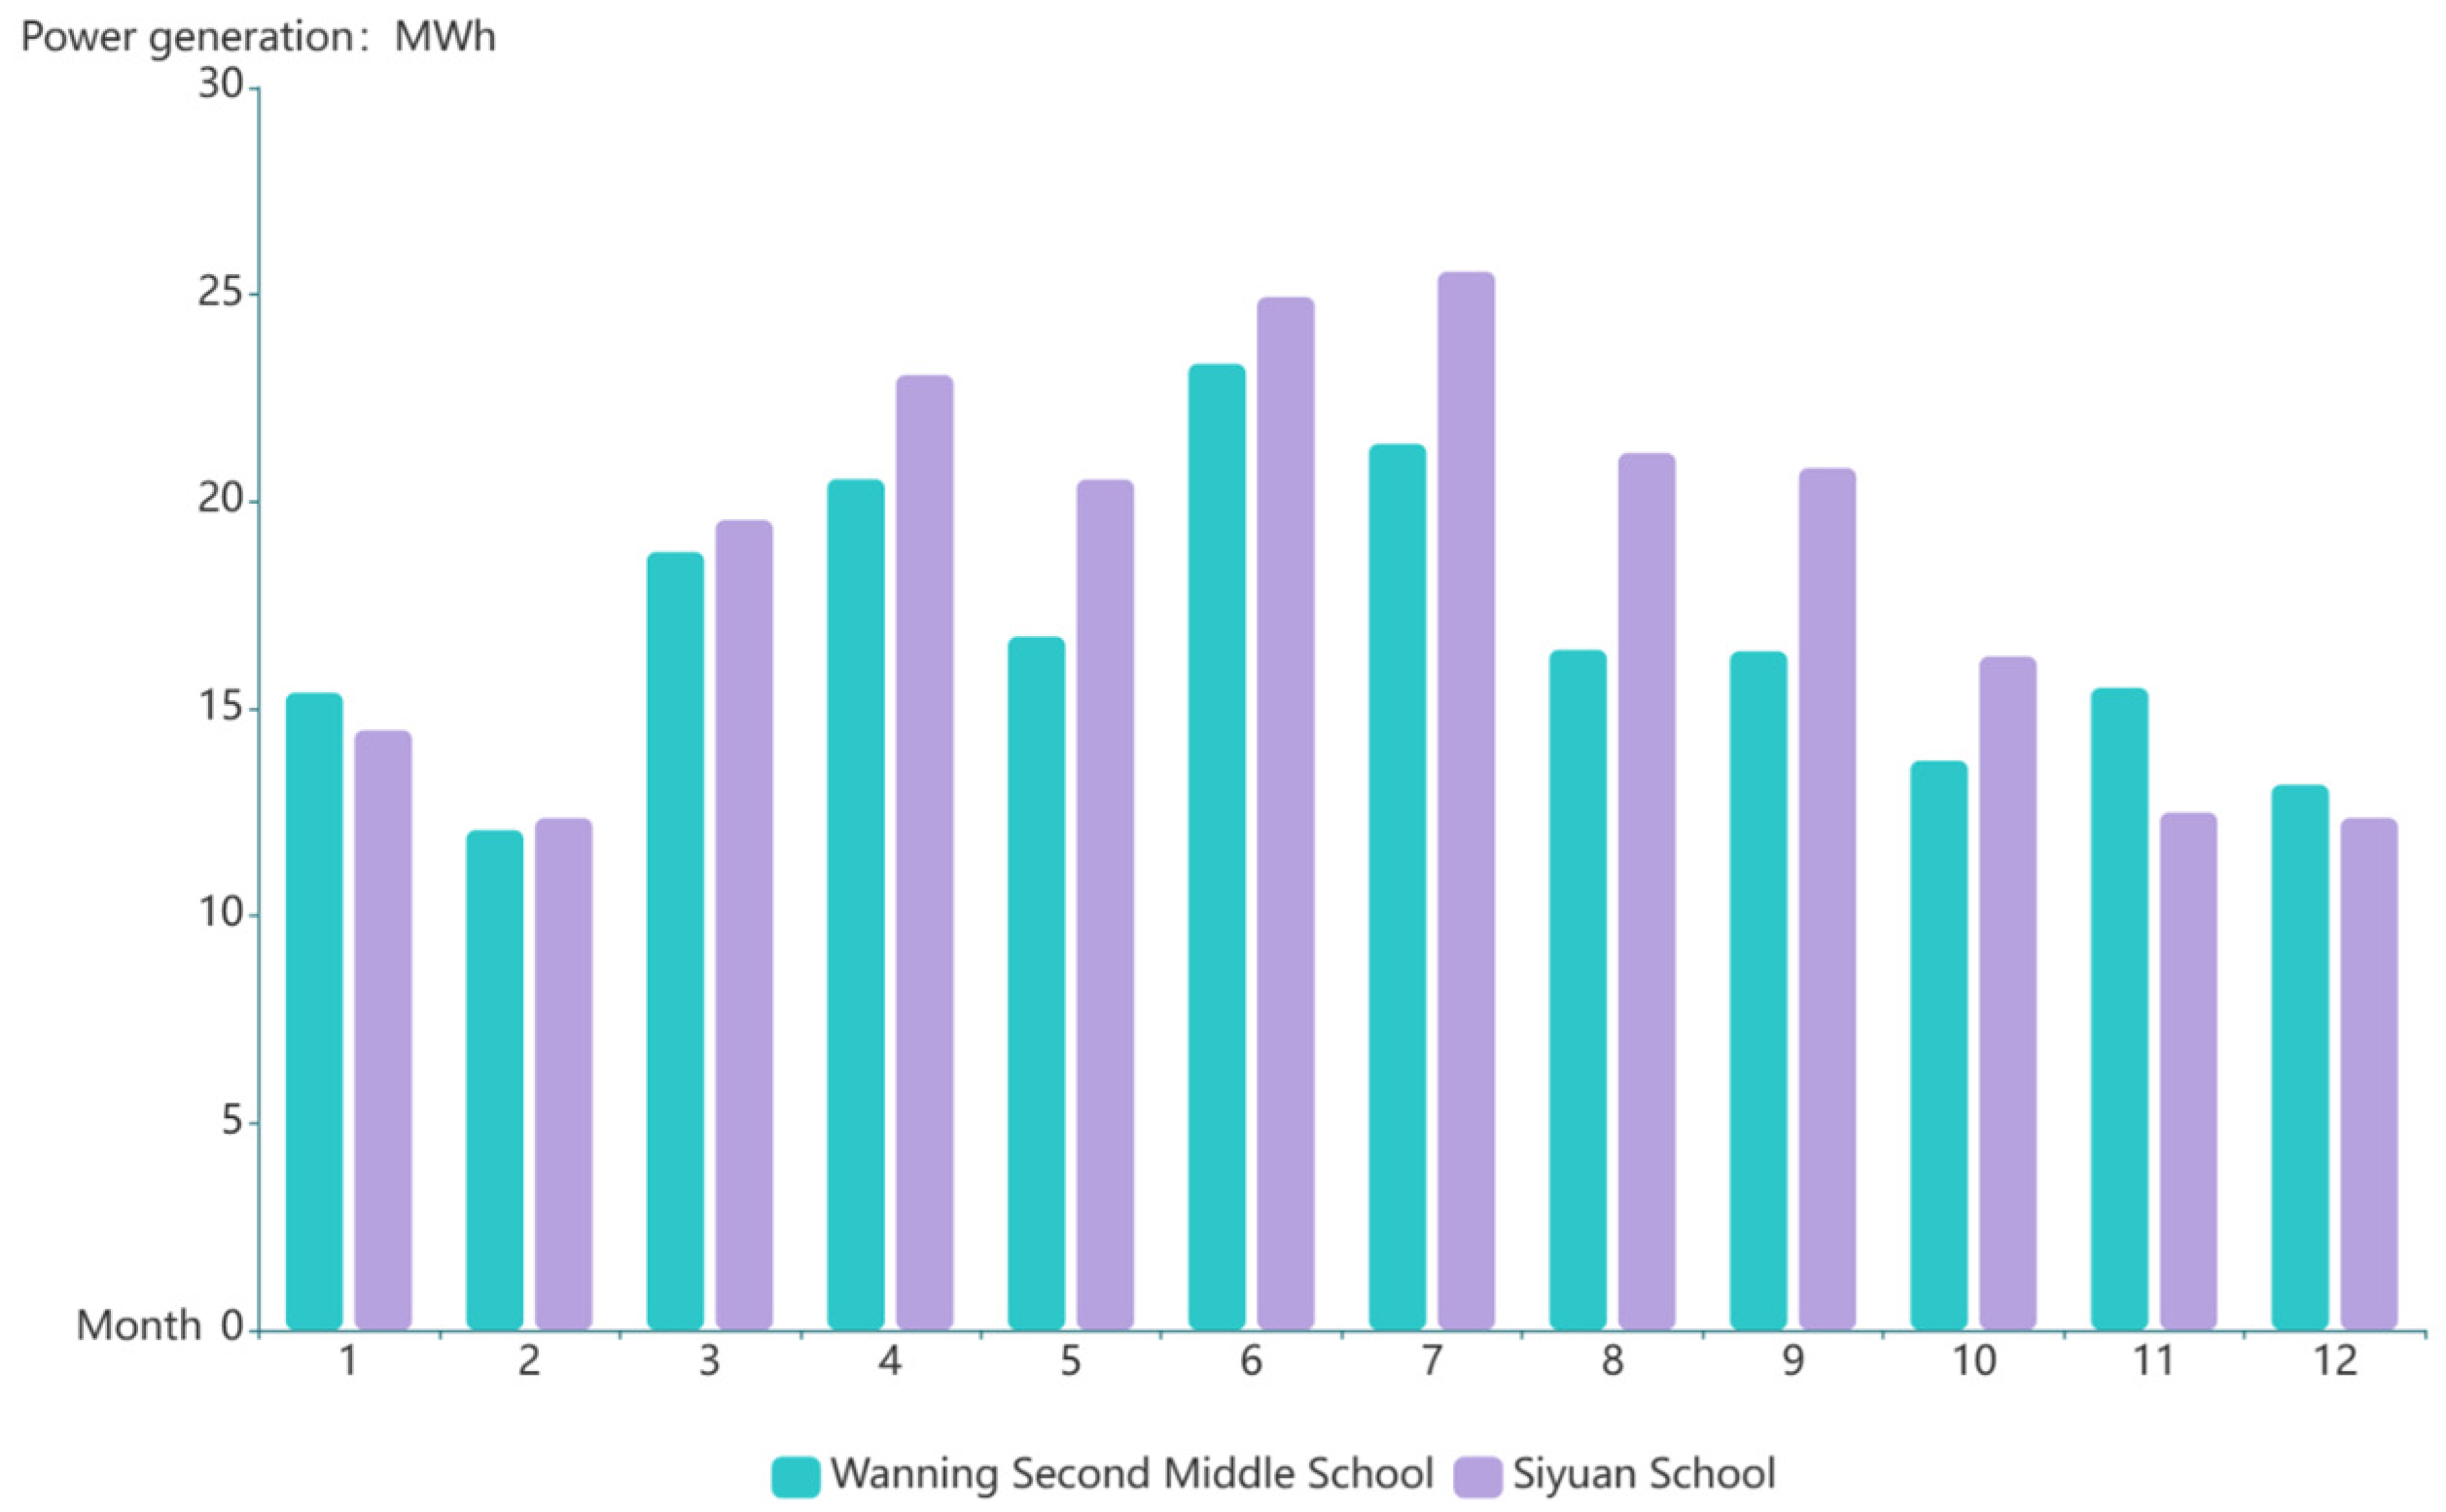
3.1. Row-Type Building—Overview of the Photovoltaic System of the Second Middle School in Wanning City
3.2. Integrated Building—Overview of the Photovoltaic System of the Wanning Siyuan School
3.3. Analysis of the Balance between Production and Demand
3.4. Economic Analysis of Photovoltaic Utilization
3.5. Environmental Benefit Analysis
3.6. Summary
4. Analysis of Primary and Secondary School Building Types in Hainan Province
4.1. Analysis of Primary and Secondary School Building Types in Hainan Province
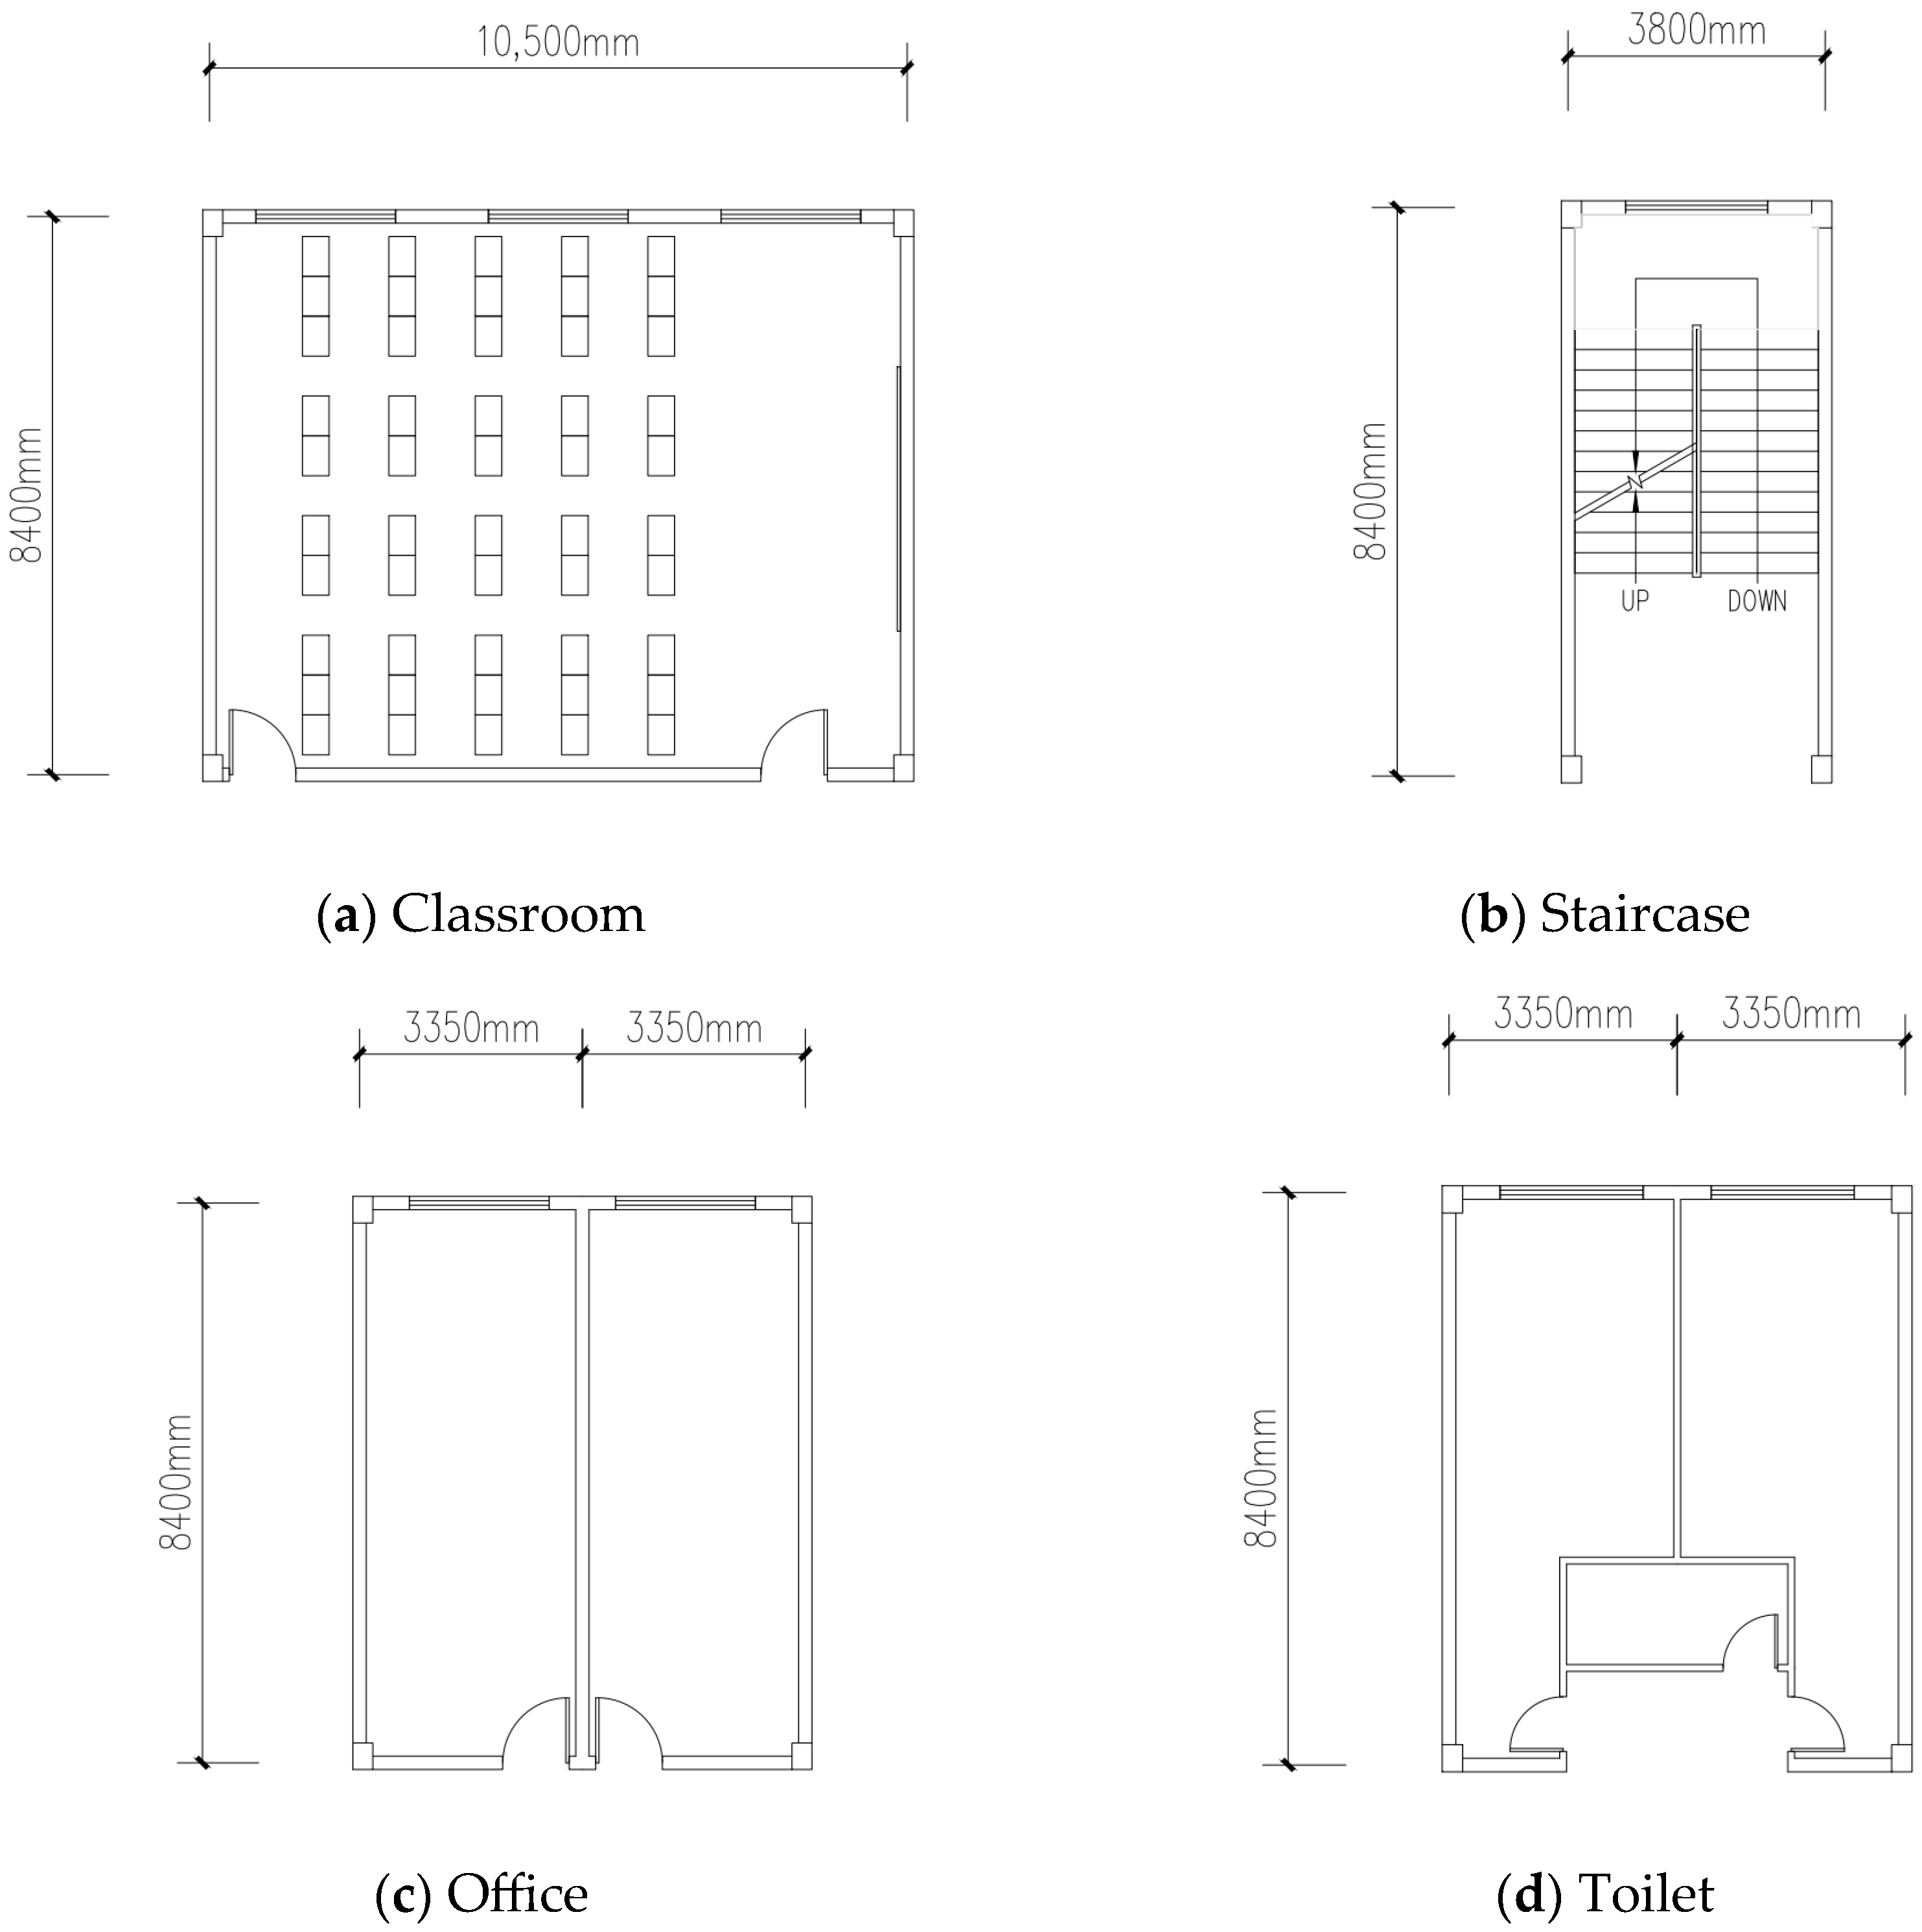
4.1.1. Room Configuration of School Buildings
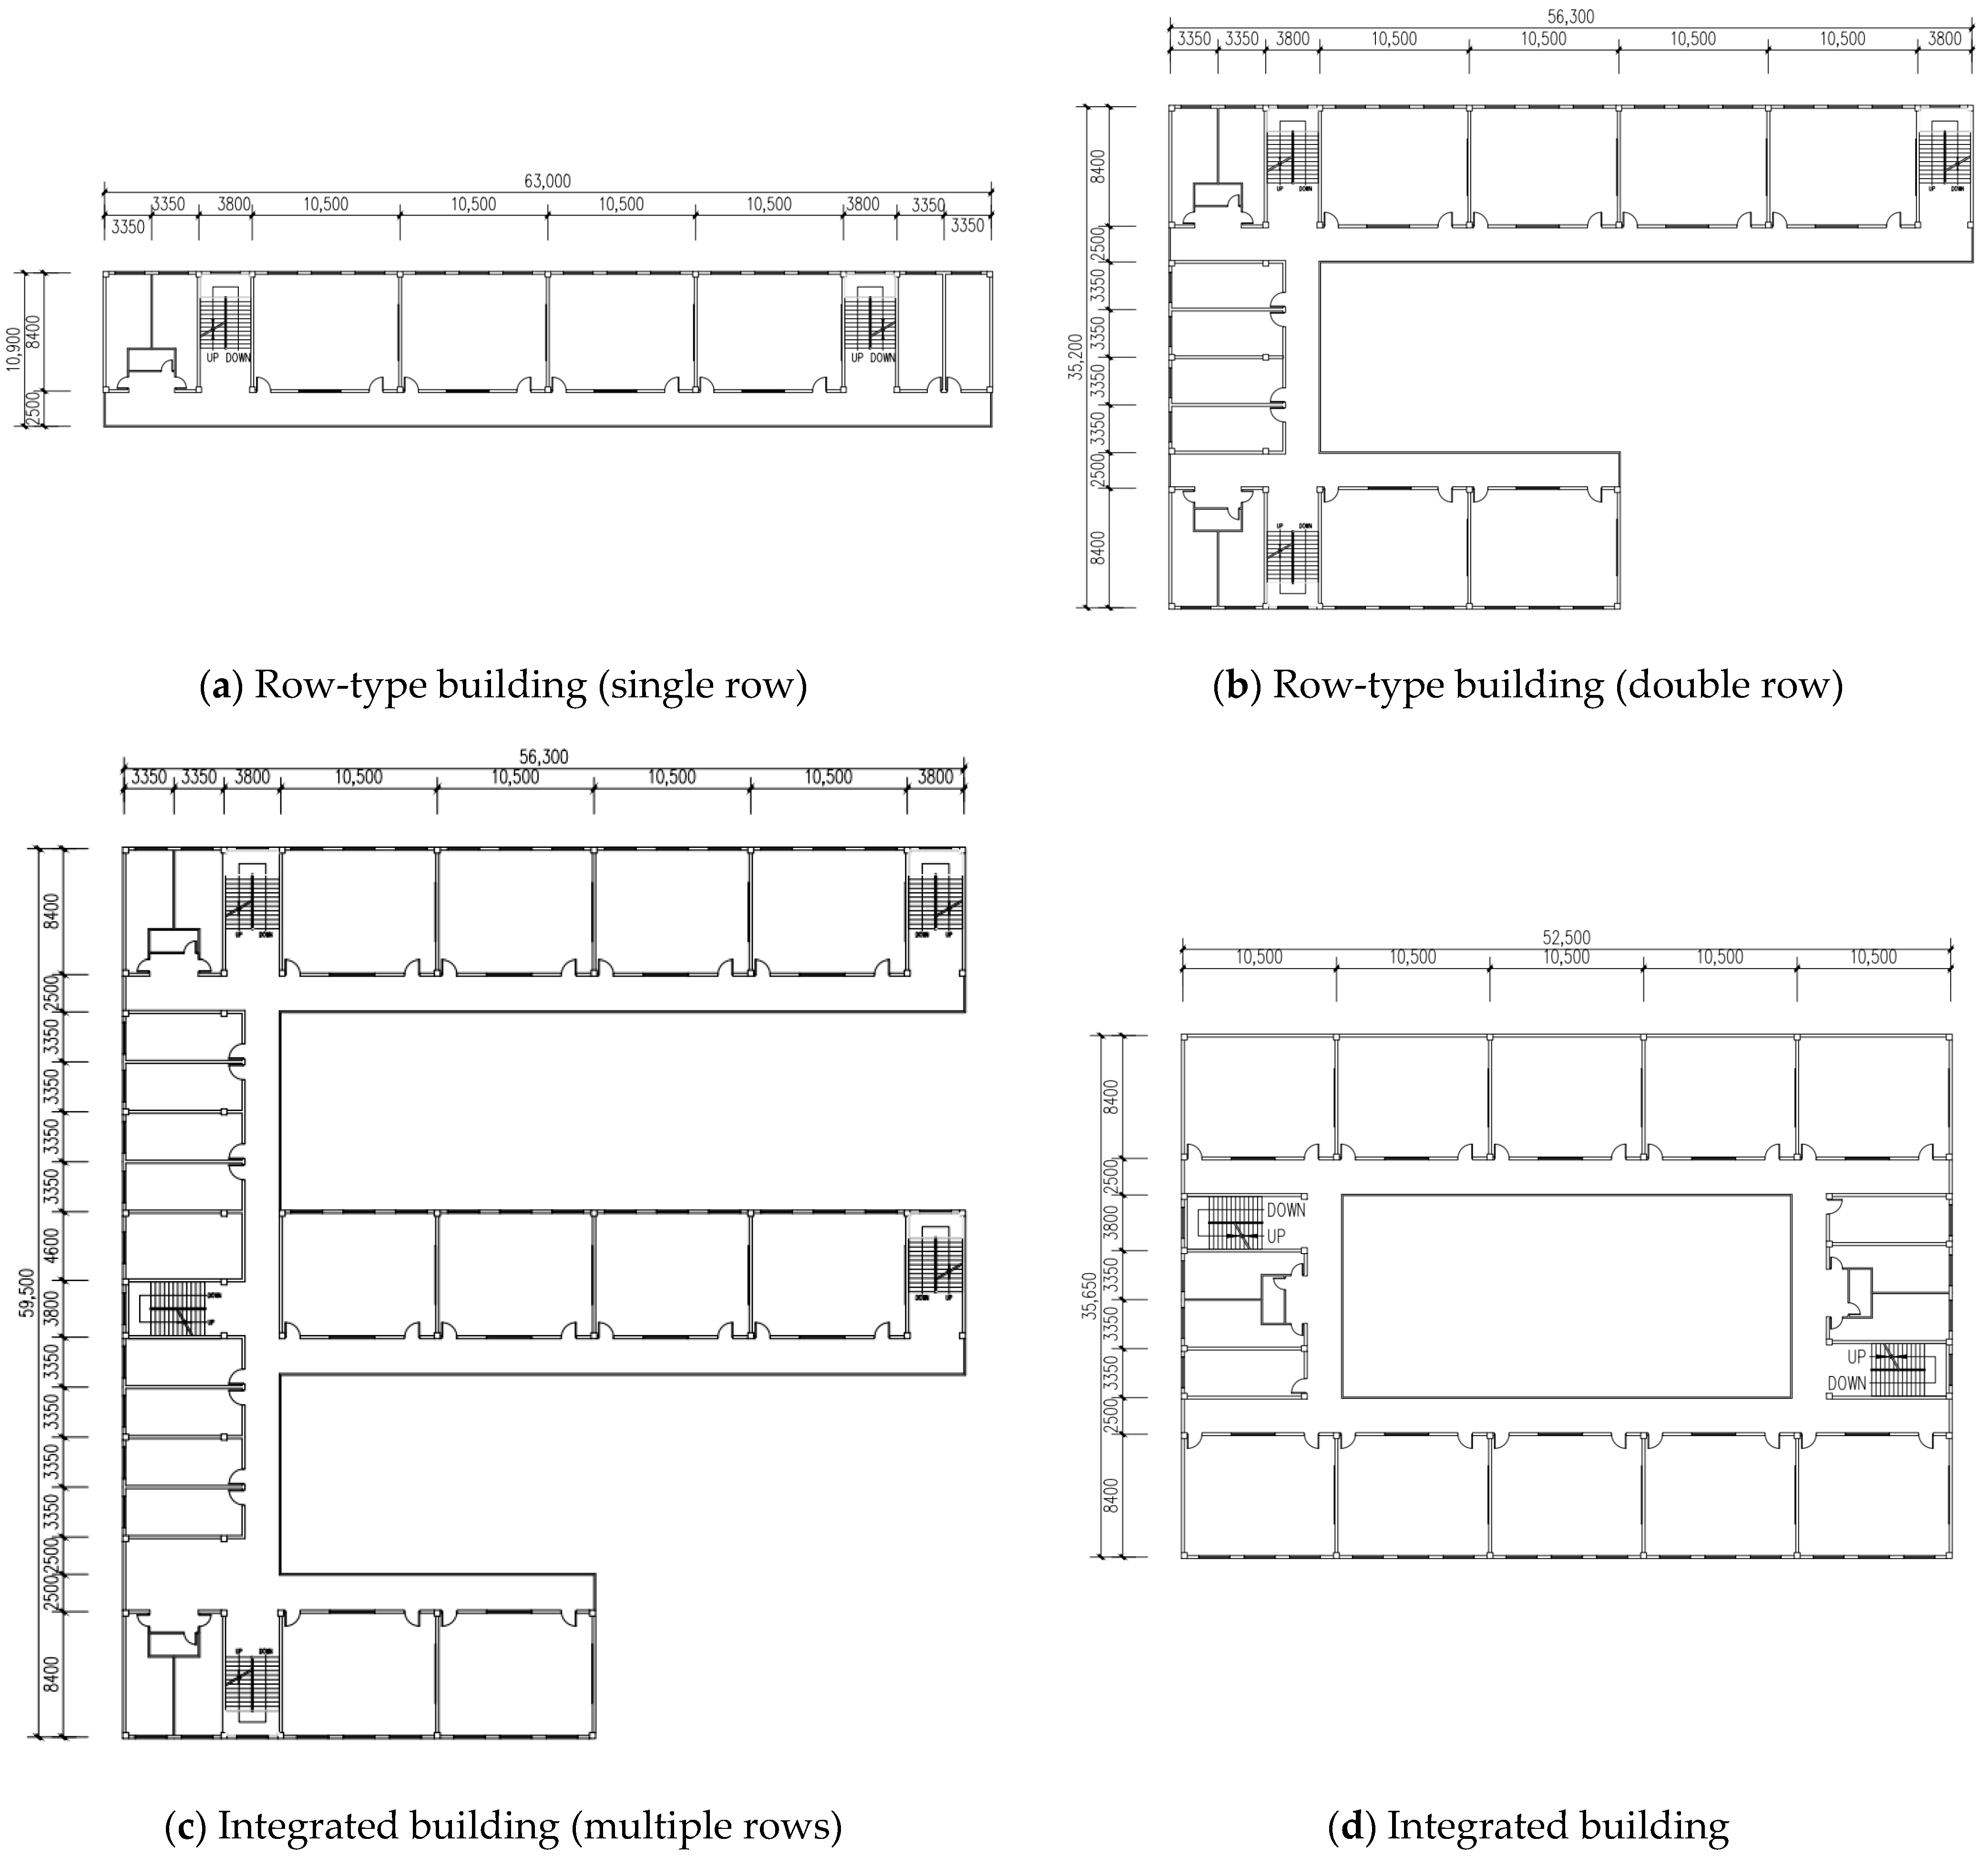
4.1.2. Configuration of School Buildings
- (1)
- The most common orientation of the buildings is north to south, and bilateral lighting is typical. Most primary schools have five floors, and most secondary schools have six floors.
- (2)
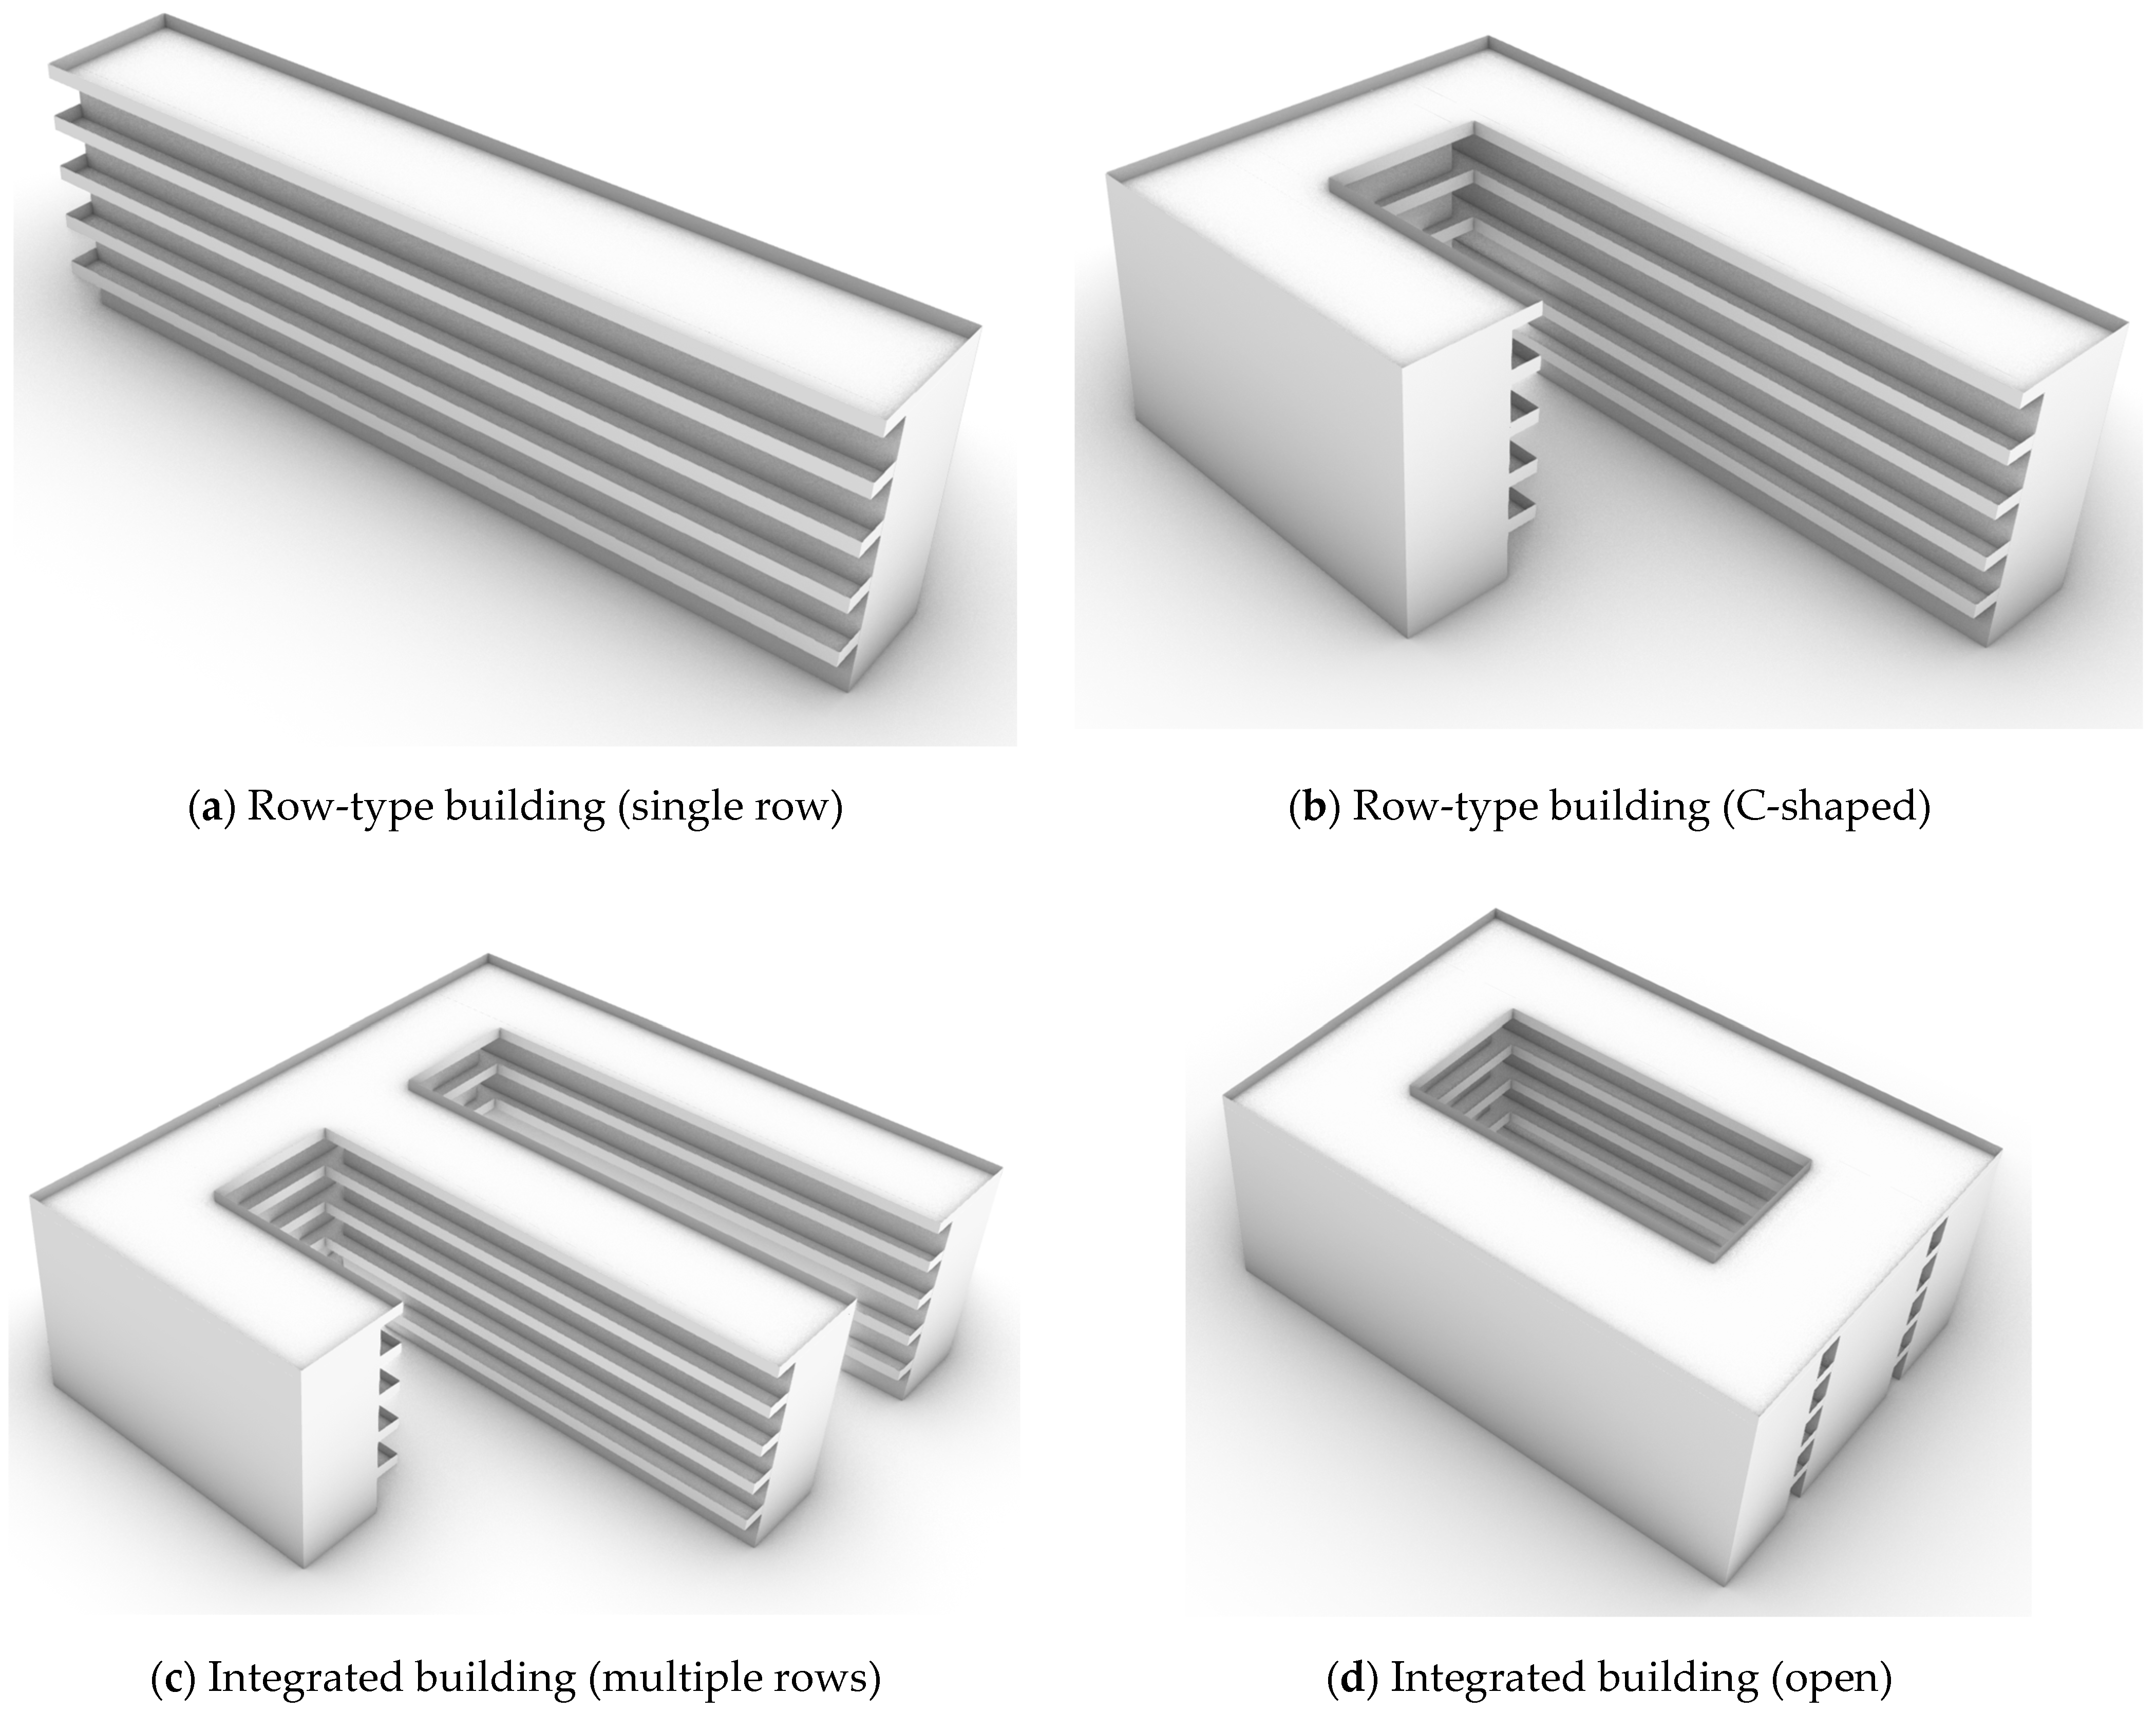
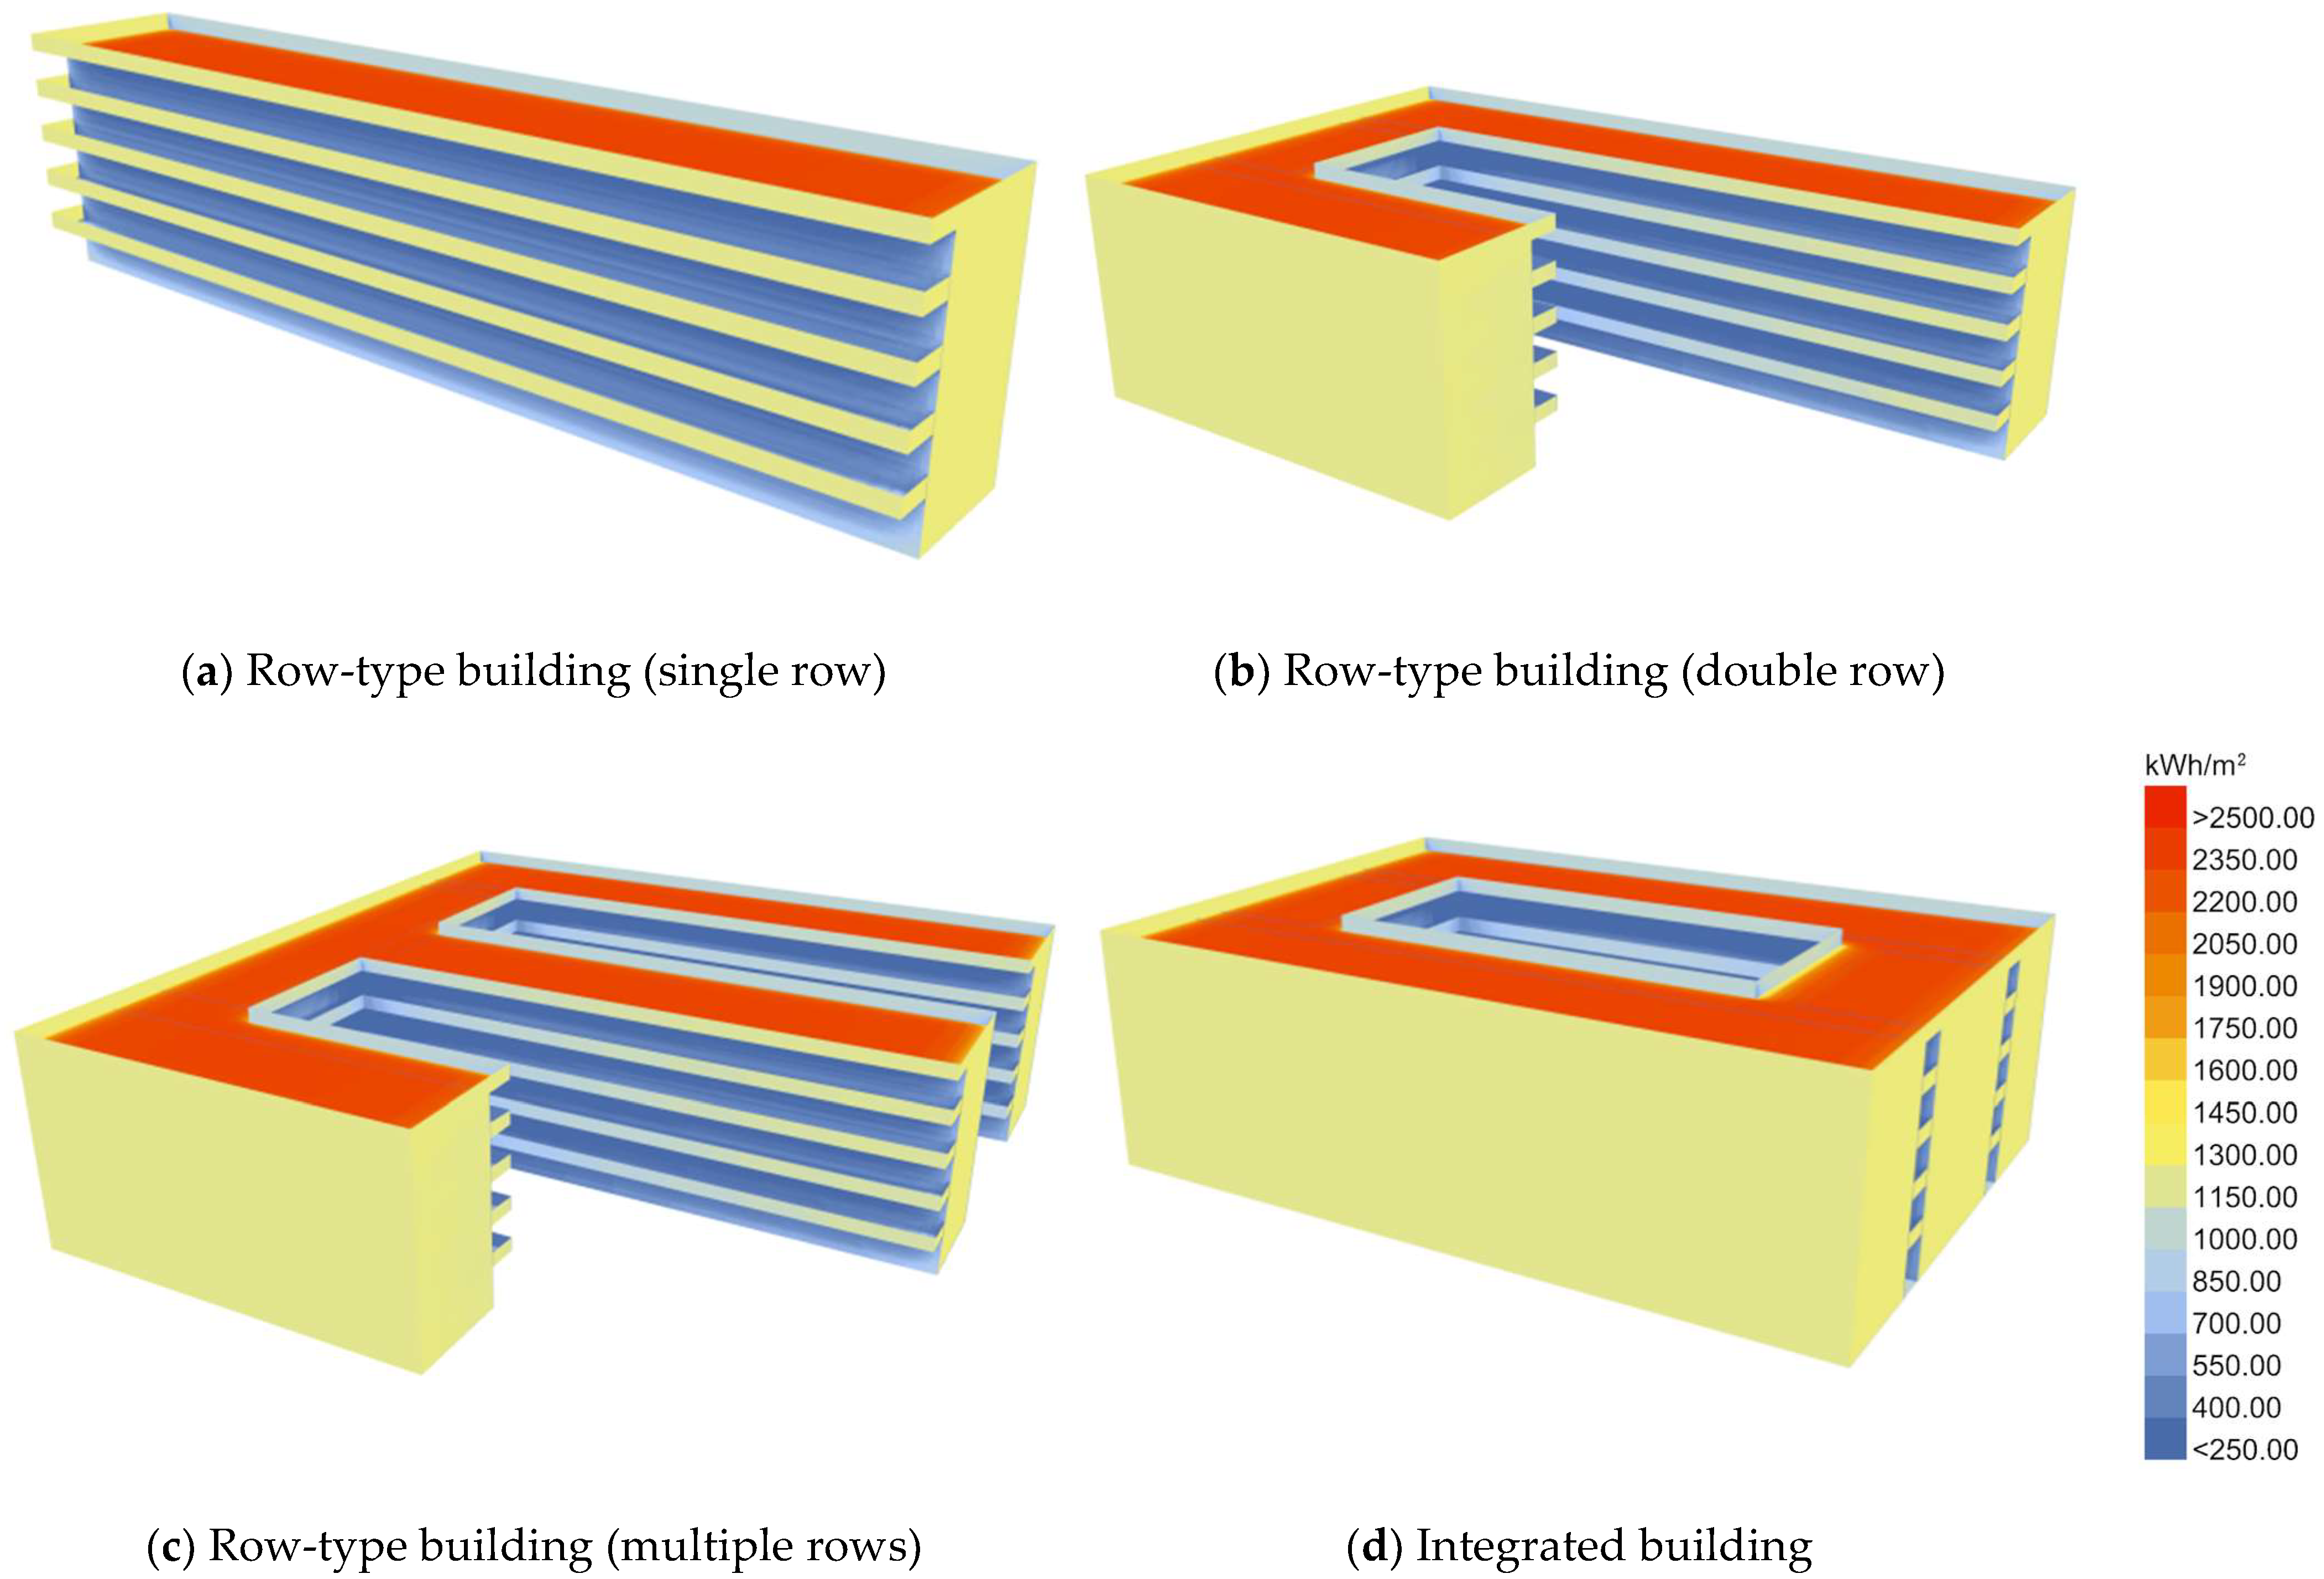
- Two configurations are prevalent: row-type and integrated buildings.
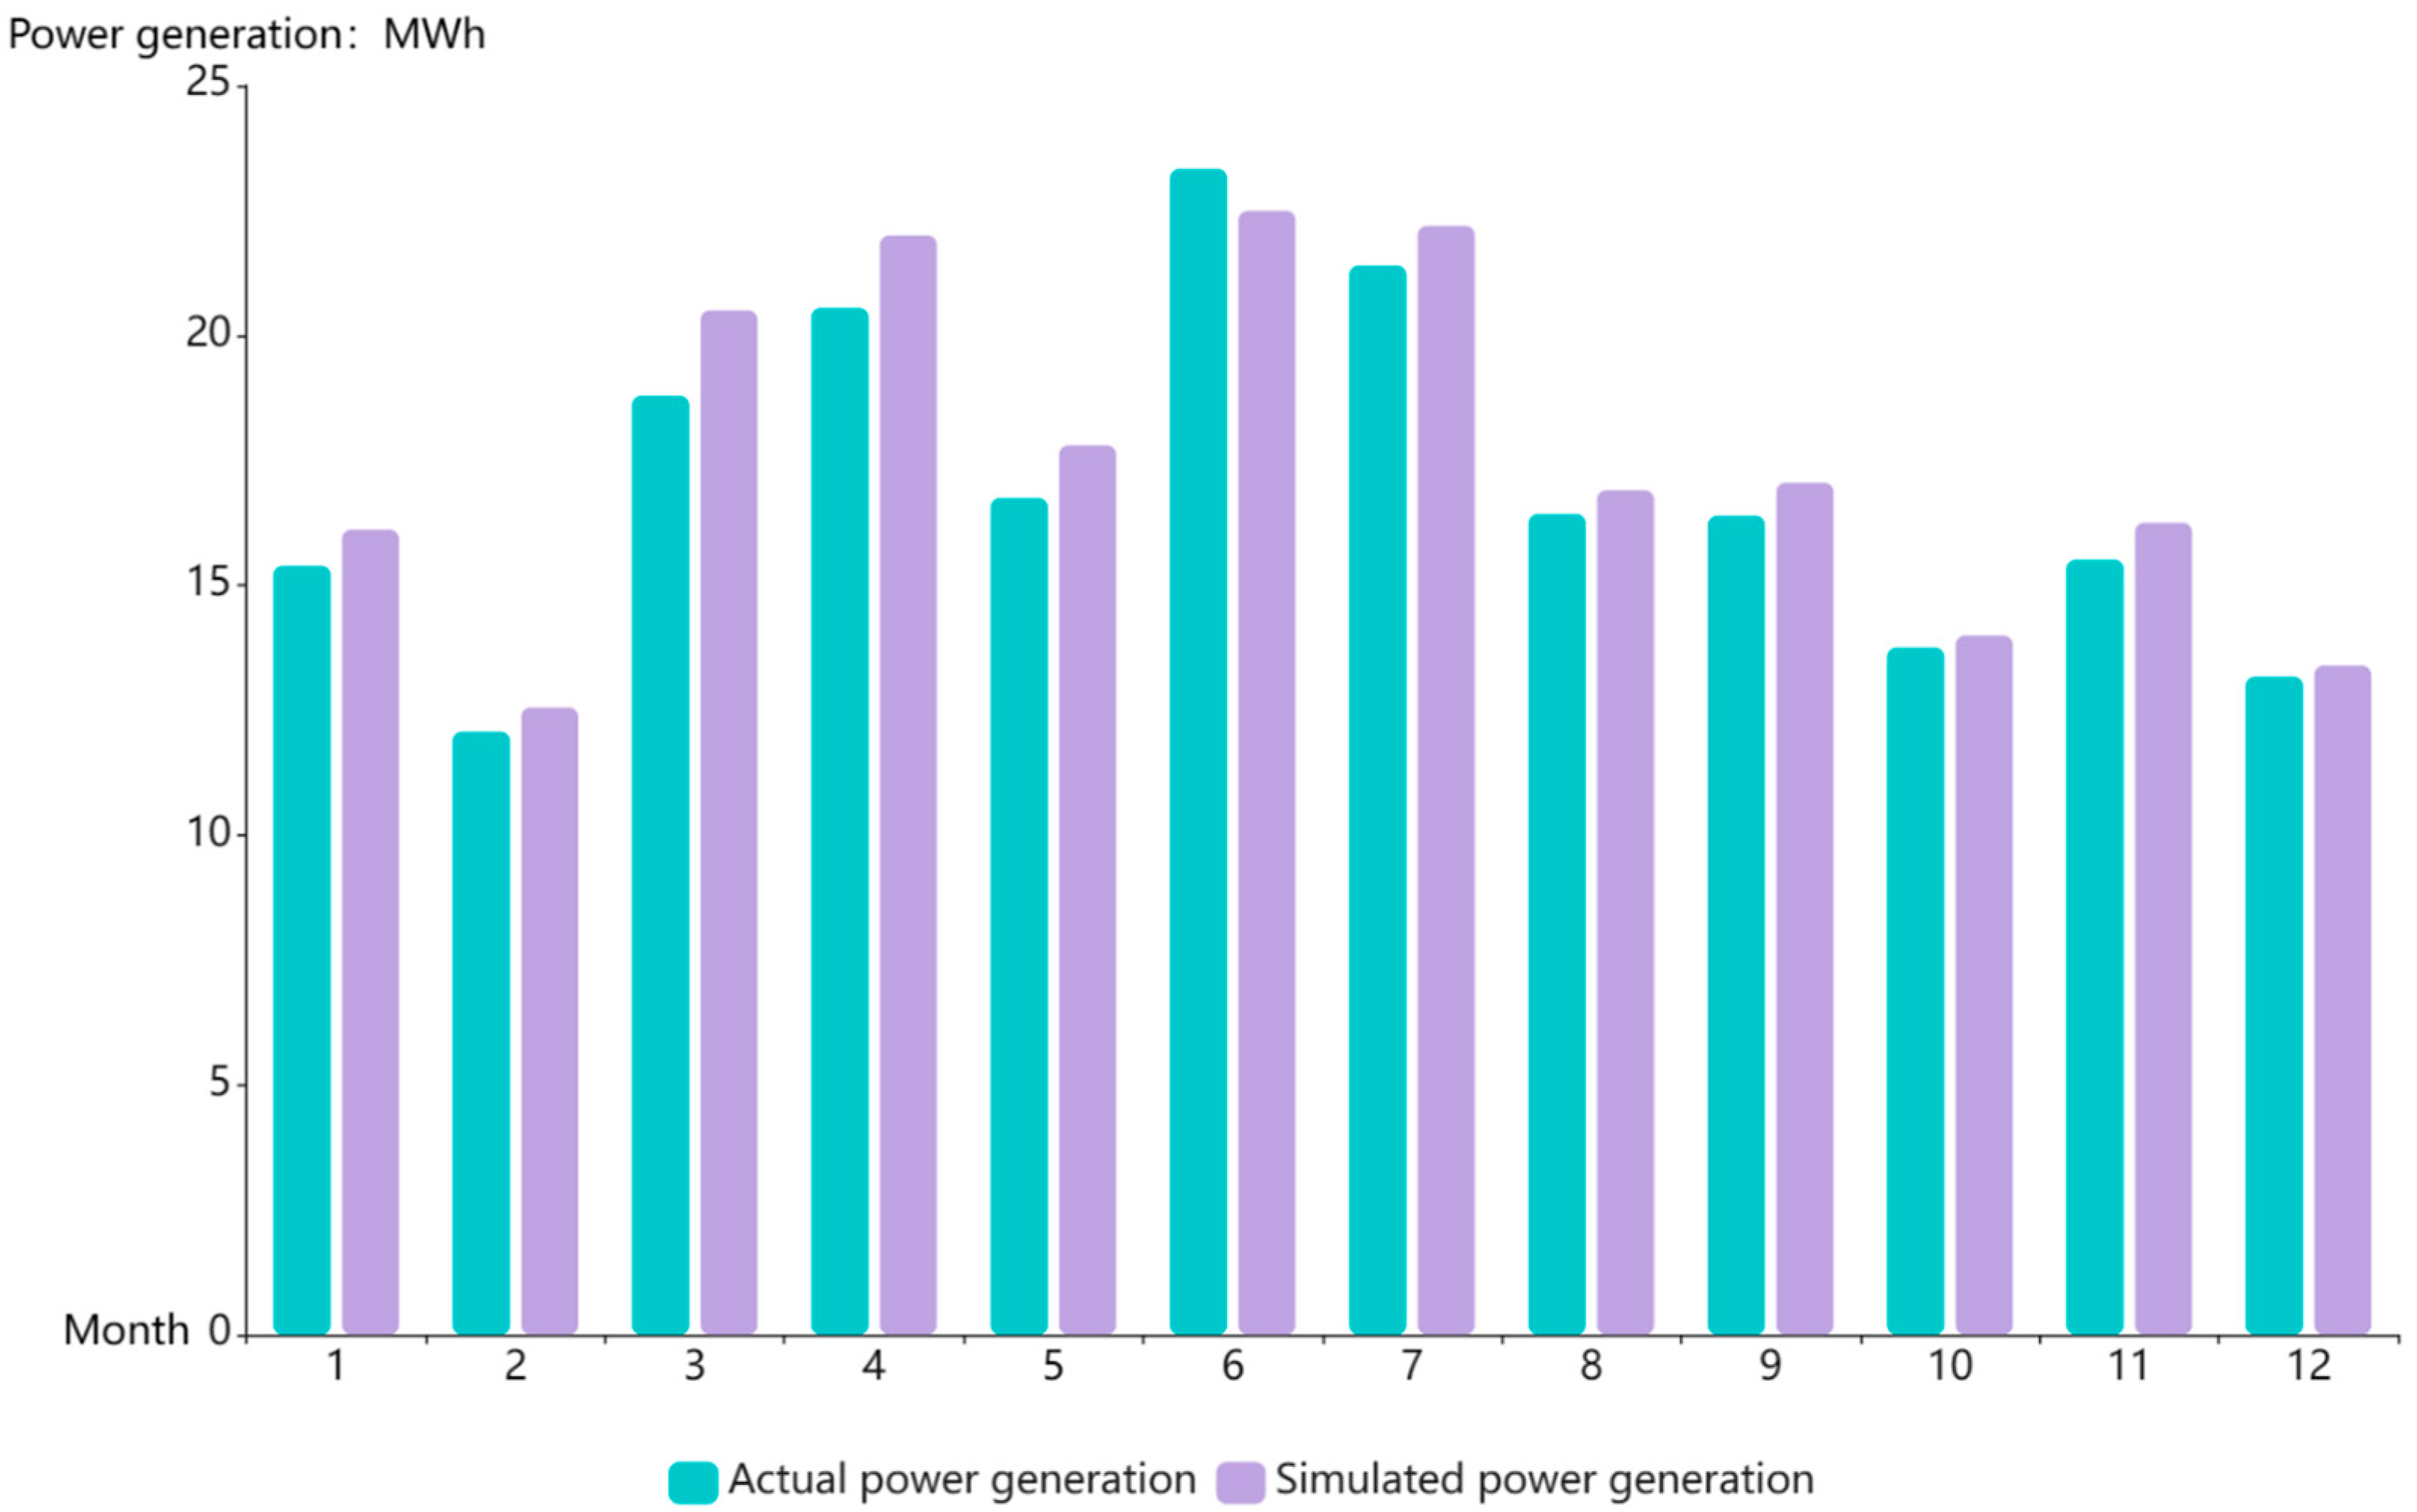
4.2. Simulation and Verification of Building Photovoltaic System Model
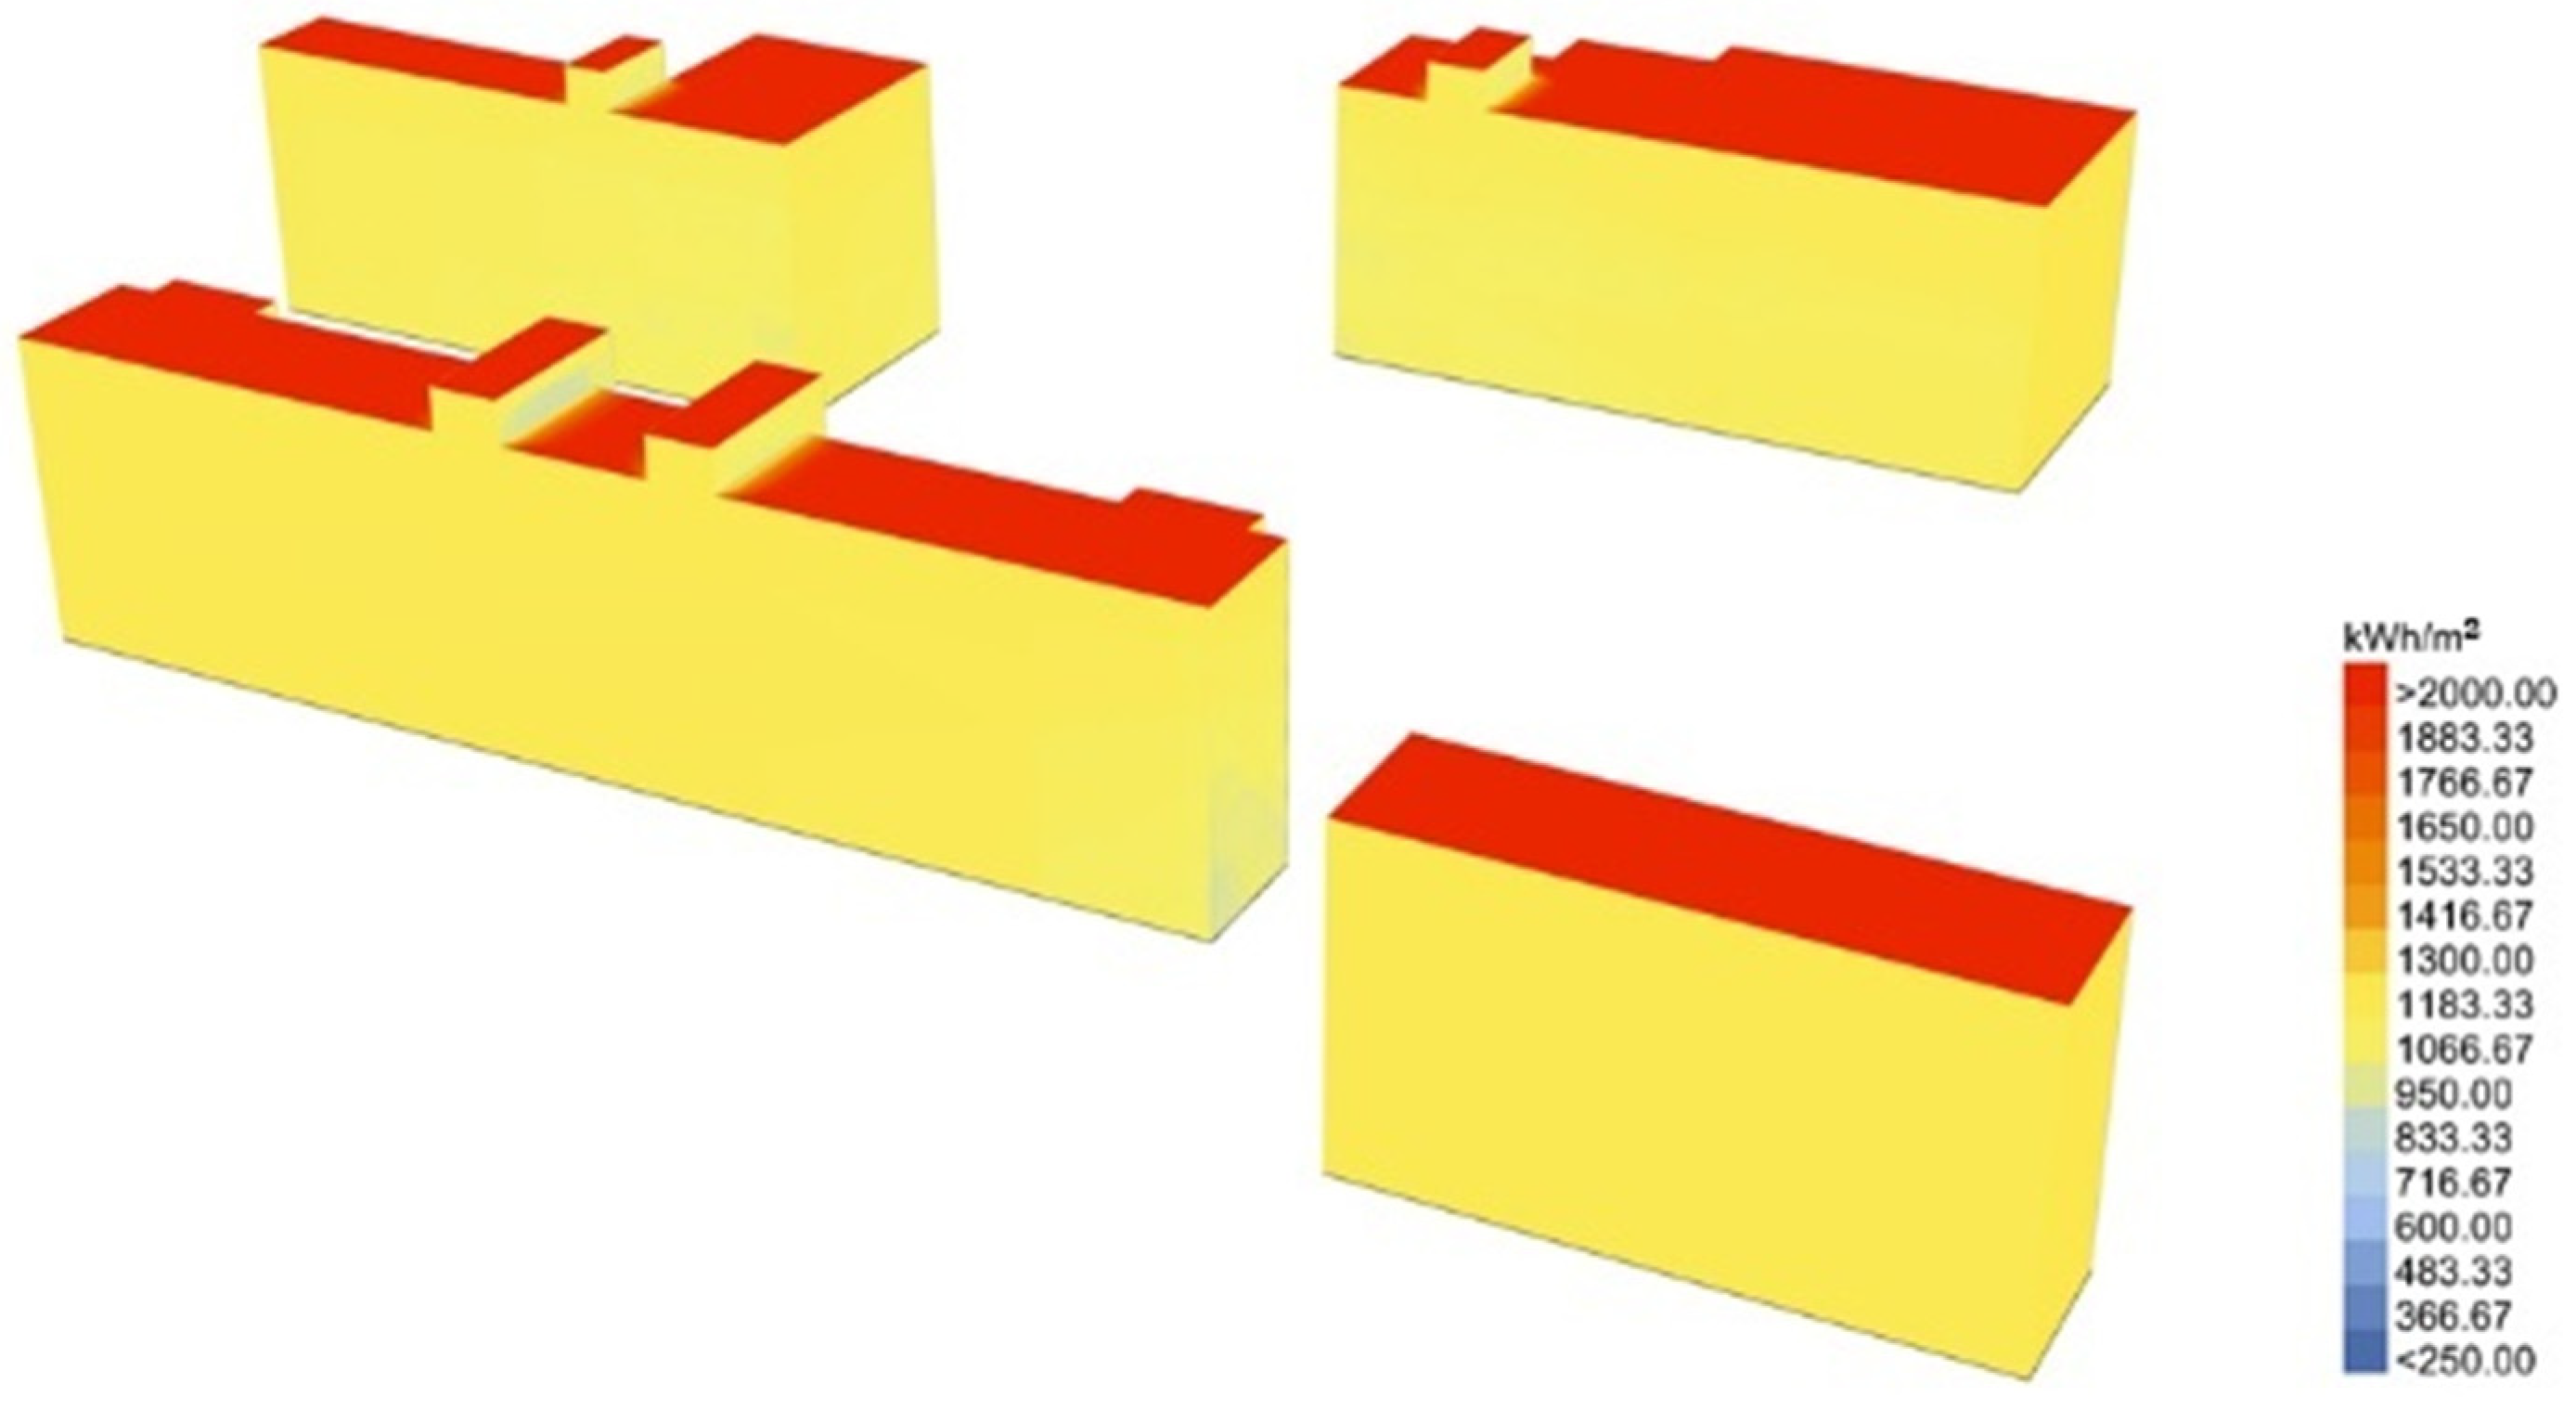
4.3. Physical Potential of the Photovoltaic System
4.4. Technical Potential of the Photovoltaic System
4.4.1. Optimization of Photovoltaic Systems
4.4.2. The Optimal Installation Angle and Azimuth of Photovoltaic Modules
4.4.3. The Optimal Installation Angle and Azimuth of Photovoltaic Modules
4.5. The Potential of the Production-Demand Balance of the Photovoltaic System
4.6. Economic Potential of the Photovoltaic System
4.7. Environmental Potential of the Photovoltaic System
5. Conclusions
Author Contributions
Funding
Data Availability Statement
Conflicts of Interest
References
- Zhang, H.; Wang, L.X.; Li, Z. Evaluation method and application of photovoltaic potential of urban building roof. Urb. Probl. 2017, 36, 33–39. [Google Scholar] [CrossRef]
- Hu, M.J.; Liu, Z.; Huang, Y.H.; Wei, M.J.; Yuan, B. Estimation of Rooftop Solar Photovoltaic Potential Based on High-Resolution Images and Digital Surface Models. Buildings 2023, 13, 2686. [Google Scholar] [CrossRef]
- Ranjgar, B.; Niccolai, A. Large-Scale Rooftop Solar Photovoltaic Power Production Potential Assessment: A Case Study for Tehran Metropolitan Area. Iran. Energies 2023, 16, 7111. [Google Scholar] [CrossRef]
- Zhao, K.M.; Gou, Z.H. Influence of urban morphology on facade solar potential in mixed-use neighborhoods: Block prototypes and design benchmark. Energy Build. 2023, 297, 113446. [Google Scholar] [CrossRef]
- Singh, D.; Gautam, A.K.; Chaudhary, R. Potential and performance estimation of free-standing and building integrated photovoltaic technologies for different climatic zones of India. Energy Built Environ. 2022, 3, 40–55. [Google Scholar] [CrossRef]
- Singh, D.; Chaudhary, R.; Karthick, A. Review on the progress of building-applied/integrated photovoltaic system. Environ. Sci. Pollut. Res. 2021, 28, 47689–47724. [Google Scholar] [CrossRef]
- Chandrika, V.; Thalib, M.M.; Karthick, A.; Sathyamurthy, R.; Manokar, A.M.; Subramaniam, U.; Stalin, B. Performance assessment of free standing and building integrated grid connected photovoltaic system for southern part of India. Build. Serv. Eng. Res. Technol. 2021, 42, 237–248. [Google Scholar] [CrossRef]
- Zhang, W.J.; Huang, F.C.; Mao, K.; Lin, C.Q.; Pan, Z. Evaluation of Photovoltaic Energy Saving Potential and Investment Value of Urban Buildings in China Based on GIS Technology. Buildings 2021, 11, 649. [Google Scholar] [CrossRef]
- Wang, Y.; Jiang, P.P. Research on solar photovoltaic transformation potential of existing residential areas in Shanghai. Hous. Sci. 2021, 41, 48–54. [Google Scholar] [CrossRef]
- Chen, Y.B.; Tan, H.W.; Li, S.M.; Song, X.D. GIS-based dimensionless assessment of distributed rooftop PV in Chinese residential communities. Procedia Eng. 2017, 205, 205–212. [Google Scholar] [CrossRef]
- Xu, W.; Zhang, H.H. Solar energy utilization potential evaluation of public building photovoltaic system. J. Chongqing Univ. 2021, 44, 53–62. [Google Scholar] [CrossRef]
- Liu, C.P.; Xu, W.; Zou, Y. Analysis of photovoltaic potential in different climate regions of China. Build. Sci. 2019, 35, 1–7+15. [Google Scholar]
- Wiginton, L.K.; Nguyen, H.T.; Pearce, J.M. Quantifying rooftop solar photovoltaic potential for regional renewable energy policy. Environ. Urb. Syst. 2010, 34, 345–357. [Google Scholar] [CrossRef]
- Izquierdo, S.; Rodrigues, M.; Fueyo, N. A method for estimating the geographical distribution of the available roof surface area for large-scale photovoltaic energy-potential evaluations. Sol. Energy 2008, 82, 929–939. [Google Scholar] [CrossRef]
- Feng, S.J.; Li, S.M. Analysis of Building Application Potential of Solar Energy Resources in Panzhihua Area. Sichuan Archit. 2016, 36, 84–86, 88. [Google Scholar] [CrossRef]
- Jacques, D.A.; Gooding, J.; Giesekam, J.J.; Tomlin, A.S.; Crook, R. Methodology for the assessment of PV capacity over a city region using low-resolution LiDAR data and application to the City of Leeds (UK). Appl. Energy 2014, 124, 28–34. [Google Scholar] [CrossRef]
- Khan, J.; Arsalan, M.H. Estimation of rooftop solar photovoltaic potential using geo-spatial techniques: A perspective from planned neighborhood of Karachi–Pakistan. Renew. Energy 2016, 90, 188–203. [Google Scholar] [CrossRef]
- Wang, G.H.; Tang, X.M.; Zhang, T.; Dai, H.L.; Peng, Y.Y. Potential analysis of national building remote sensing monitoring and distributed photovoltaic construction. Chin. Eng. Sci. 2021, 23, 92–100. [Google Scholar] [CrossRef]
- Mekhilef, S.; Saidur, R.; Kamalisarvestani, M. Effect of dust, humidity and air velocity on efficiency of photovoltaic cells. Renew. Sustain. Energy Rev. 2012, 16, 2920–2925. [Google Scholar] [CrossRef]
- Liu, Z.D.; Zhang, S.D.; Jia, H. Economic and Environmental Benefit Analysis of Grid Connected Photovoltaic Systems in Anyang City. Chin. Electr. Power 2013, 46, 43–47. [Google Scholar] [CrossRef]
- Brito, M.C.; Freitas, S.; Guimarães, S.; Catita, C.; Redweik, P. The importance of facades for the solar PV potential of a Mediterranean city using LiDAR data. Renew. Energy 2017, 111, 85–94. [Google Scholar] [CrossRef]
- Gong, X.L.; Jiang, W.; Qian, S.H. Development Potential and Benefit Analysis of Rural Household Photovoltaic Power Generation. Agric. Sci. Technol. Equip. 2015, 37, 49–50. [Google Scholar] [CrossRef]
- Liu, J.J.; Gao, L.C.; Zhang, X.P.; Hao, Q.Y.; Xie, Y. Economic analysis of distributed photovoltaic power generation technology based on EPC mode. Henan Sci. 2021, 39, 1738–1745. [Google Scholar] [CrossRef]
- Peng, J.Q.; Lin, L. Investigation on the development potential of rooftop PV system in Hong Kong and its environmental benefits. Renew. Sustain. Energy Rev. 2013, 27, 149–162. [Google Scholar] [CrossRef]
- Zhang, M.; Liu, J.; Lin, J.G.; Zhao, X.B. Environmental benefit analysis of rooftop distributed photovoltaic development under the background of “dual carbon”. Energy Res. Utiliz. 2021, 33, 37–41. [Google Scholar]
- Zhao, T.X.; Liao, H.; Li, J.T.; Yin, J.C.; Jing, M.M.; Ma, X.; Liu, Z.M. Economic and Environmental Benefit Analysis of BIPV—Taking Yunnan Normal University’s 120kWp Photovoltaic Curtain Wall as an Example. Sol. Energy 2017, 38, 62–65, 61. [Google Scholar]
- 11th Province Shanxi Province Issued the Policy of Promoting Distributed Photovoltaic in the Whole County (Report before 9 July). Available online: https://baijiahao.baidu.com/s?id=1703804914999411688&wfr=spider&for=pc (accessed on 30 July 2021).
- Zhang, R.; Liu, C.P.; Du, X.; Li, G.H.; Chen, W. Research on the Potential of Photovoltaic Application in Existing Buildings in Hainan Province Based on Typical Case Analysis. Constr. Technol. 2022, 21, 36–40. [Google Scholar] [CrossRef]
- DB 46/T481-2019; Energy Consumption Quota Standard for Public Institutions in Hainan Province. Hainan Provincial Administration for Market Regulation: Haikou, China, 2019.
- Notice of Hainan Provincial Development and Reform Commission on Forwarding the Notice of the National Development and Reform Commission on Further Deepening the Market-Oriented Reform of Coal-Fired Power Generation Grid Electricity Prices. Available online: https://www.hainan.gov.cn/data/zfgb/2022/05/9689 (accessed on 20 October 2021).
- Zhu, Q.Z.; Si, L.L.; Jiang, T.Y. Economic and Environmental Benefits of Building Photovoltaic Systems with Different Installation Methods. J. Sol. Energy 2012, 33, 24–29. [Google Scholar] [CrossRef]
- Sun, Y.W.; Wang, R.; Xiao, L.S.; Liu, J.; Yu, Y.J.; Zhuang, X.S. Economic and environmental benefits of China’s grid connected photovoltaic power generation system. Chin. Popul. Resour. Environ. 2011, 21, 88–94. [Google Scholar] [CrossRef]
- Wei, X.H.; Zhou, H. Estimation of Environmental Value Standards for Reducing Pollutants in China’s Thermal Power Generation Industry. Environ. Sci. Res. 2003, 16, 53–56. [Google Scholar] [CrossRef]
- GB 50099-2011; Code for Design of School. General Administration of Quality Supervision, Inspection and Quarantine of the People’s Republic of China: Beijing, China, 2010.
- Compagnon, R. Solar and daylight availability in the urban fabric. Pop. Utiliz. Electr. 2004, 36, 321–328. [Google Scholar] [CrossRef]
- Yin, H.M.; Zhang, L.Z. Design of universities apartments in Jinan based on solar energy utilization potential. J. Shandong Jianzhu Univ. 2020, 35, 46–52. [Google Scholar] [CrossRef]
- GB 50797–2012; Code for Design of Photovoltaic Power Station. General Administration of Quality Supervision, Inspection and Quarantine of the People’s Republic of China: Beijing, China, 2012.
- Jiang, K.; Gu, F.Y.; Li, X.; Wang, L. Economic analysis of copper indium gallium selenium photovoltaic curtain wall technology. J. Archit. 2019, S2, 92–95. [Google Scholar]


| Building Name | Number of Photovoltaic Modules | Installed Capacity | Photovoltaic Module Specifications | Inverter Configuration |
|---|---|---|---|---|
| Building 1 | 84 | 45.36 kW | Size: 2274 × 1134 × 35 mm Peak power: 540 W Module efficiency: 20.94% | 20 kW × 1 unit 50 kW × 2 unit 60 kW × 1 unit |
| Building 2 | 76 | 41.04 kW | ||
| Building 3 | 50 | 27 kW | ||
| Building 4 | 106 | 57.24 kW |
| Building Name | Number of Photovoltaic Modules | Installed Capacity | Photovoltaic Module Specifications | Inverter Configuration |
|---|---|---|---|---|
| Building 5 | 108 | 58.32 kW | Size: 2274 × 1134 × 35 mm Peak power: 540 W Module efficiency: 20.94% | 30 kW × 1 unit 36 kW × 1 unit 60 kW × 2 unit |
| Building 6 | 58 | 31.32 kW | ||
| Building 7 | 66 | 35.64 kW | ||
| Building 8 | 112 | 60.48 kW |
| Pollutant | Pollutant Emission Rate/kg·t−1 | Environmental Cost/Dollars·kg−1 |
|---|---|---|
| CO2 | 1731 | 0.0032 |
| SO2 | 22 | 0.83 |
| NOX | 10 | 1.1 |
| TSP | 17 | 0.31 |
| Project Name | Pollutant | Emission Reduction/t | Environmental Benefit/Dollars |
|---|---|---|---|
| School A | CO2 | 2689.71 | 8599.79 |
| SO2 | 34.19 | 28,512.59 | |
| NOX | 15.54 | 17,280.36 | |
| TSP | 26.42 | 8078.57 | |
| Total | 2765.85 | 62,471.31 | |
| School B | CO2 | 2927.02 | 9358.51 |
| SO2 | 37.20 | 31,028.15 | |
| NOX | 16.91 | 18,804.94 | |
| TSP | 28.75 | 8791.31 | |
| Total | 3009.87 | 67,982.91 |
| Corridor Type | Layout | ||||
|---|---|---|---|---|---|
| Row-Type Building | Integrated Buildings | ||||
| south outer corridor | 4, 6, 7, 14 | 1, 8, 10, 19 | |||
| north outer corridor | 17, 18 | 9 | |||
| south and north double outer corridors | 15, 3 | 5 | |||
| circular external corridor | 12, 13 | 2, 11 | |||
| middle corridor | 16 | 20 | |||
 |  |  |  |  | |
| 1 | 2 | 3 | 4 | 5 | |
 |  |  |  |  | |
| 6 | 7 | 8 | 9 | 10 | |
 |  |  |  |  | |
| 11 | 12 | 13 | 14 | 15 | |
 |  |  |  |  | |
| 16 | 17 | 18 | 19 | 20 | |
| Building Type | Building Parts | Proportion of Available Area |
|---|---|---|
| Row-type building (single row) | South-facing railing | 80% |
| Gable on the east | 62% | |
| Gable on the west | 62% | |
| Row-type building (double row) | South wall | 46% |
| Gable on the east | 62% | |
| Gable on the west | 54% | |
| Row-type building (multiple rows) | South wall | 46% |
| Gable on the east | 62% | |
| Gable on the west | 51% | |
| Integrated building | South wall | 44% |
| Gable on the east | 56% | |
| Gable on the west | 56% |
| Project | Row-Type Building (Single Row) | Row-Type Building (Double Row) | Row-Type Building (Multiple Rows) | Integrated Building |
|---|---|---|---|---|
| Installed capacity of photovoltaic system/kWp | 69.1 | 110 | 189 | 147 |
| Area of facade photovoltaic system/m2 | 192 | 288 | 434 | 340 |
| Investment cost of rooftop photovoltaic system/dollars | 36,025.11 | 57,348.22 | 98,534.67 | 76,638.07 |
| Investment cost of facade photovoltaic system/dollars | 71,106.65 | 106,660.04 | 160,730.72 | 125,918.06 |
| Total cost/dollars | 107,131.75 | 164,008.26 | 259,265.39 | 202,556.13 |
| Building Type | Pollutant | Emission Reduction/t | Environmental Benefit/dollars |
|---|---|---|---|
| Row-type building (single row) | CO2 | 1208.57 | 3864.51 |
| SO2 | 15.36 | 12,812.78 | |
| NOX | 6.98 | 7765.32 | |
| TSP | 11.87 | 3630.29 | |
| Total | 1242.78 | 28,072.91 | |
| Row-type building (double row) | CO2 | 1934.39 | 6185.41 |
| SO2 | 24.59 | 20,507.72 | |
| NOX | 11.18 | 12,428.92 | |
| TSP | 19.00 | 5810.52 | |
| Total | 1989.15 | 44,932.57 | |
| Row-type building (multiple rows) | CO2 | 3239.72 | 10,359.33 |
| SO2 | 41.18 | 34,346.35 | |
| NOX | 18.72 | 20,815.97 | |
| TSP | 31.82 | 9731.47 | |
| Total | 3331.43 | 75,253.12 | |
| Integrated building | CO2 | 2557.90 | 8179.13 |
| SO2 | 32.51 | 27,117.91 | |
| NOX | 14.78 | 16,435.10 | |
| TSP | 25.12 | 7683.41 | |
| Total | 2630.31 | 59,415.55 |
Disclaimer/Publisher’s Note: The statements, opinions and data contained in all publications are solely those of the individual author(s) and contributor(s) and not of MDPI and/or the editor(s). MDPI and/or the editor(s) disclaim responsibility for any injury to people or property resulting from any ideas, methods, instructions or products referred to in the content. |
© 2024 by the authors. Licensee MDPI, Basel, Switzerland. This article is an open access article distributed under the terms and conditions of the Creative Commons Attribution (CC BY) license (https://creativecommons.org/licenses/by/4.0/).
Share and Cite
Wang, C.; Zhang, X.; Chen, W.; Jiang, F.; Zhao, X. Multivariate Evaluation of Photovoltaic Utilization Potential of Primary and Secondary School Buildings: A Case Study in Hainan Province, China. Buildings 2024, 14, 810. https://doi.org/10.3390/buildings14030810
Wang C, Zhang X, Chen W, Jiang F, Zhao X. Multivariate Evaluation of Photovoltaic Utilization Potential of Primary and Secondary School Buildings: A Case Study in Hainan Province, China. Buildings. 2024; 14(3):810. https://doi.org/10.3390/buildings14030810
Chicago/Turabian StyleWang, Chaohong, Xudong Zhang, Wang Chen, Feihu Jiang, and Xiaogang Zhao. 2024. "Multivariate Evaluation of Photovoltaic Utilization Potential of Primary and Secondary School Buildings: A Case Study in Hainan Province, China" Buildings 14, no. 3: 810. https://doi.org/10.3390/buildings14030810