Article

Evaluation Method for the Bearing Capacity of Reinforced Concrete Beams Based on the Kaiser Effect

1
Hebei Provincial Key Laboratory of Civil Engineering Diagnosis, Reconstruction and Disaster Resistancer, Zhangjiakou 075000, China
2
School of Traffic and Transportation, Shijiazhuang Tiedao University, Shijiazhuang 050043, China
*
Author to whom correspondence should be addressed.
Buildings 2023, 13(8), 2003; https://doi.org/10.3390/buildings13082003
Submission received: 5 July 2023 / Revised: 2 August 2023 / Accepted: 4 August 2023 / Published: 5 August 2023

Abstract

:
The Kaiser effect is an important phenomenon that occurs in acoustic emission. The estimation of reinforced concrete structures based on acoustic emission is receiving widespread attention. Cumulative acoustic emission parameters were used for the preliminary estimation of Kaiser points through the step loading experiments on four simply supported reinforced concrete beams under bending load. Taking this Kaiser point as the centre, an appropriate interval value was determined. After functional fitting of the “load-acoustic emission parameter” curve, the difference between the estimated value and the measured value was calculated. The Kaiser point was modified in accordance with the “load-difference” curve. The modified Kaiser point was used to calculate the Felicity ratio. The ratio of the maximum load to the ultimate bearing capacity of the beams was calculated. The curves of the ratio and the Felicity ratio were obtained. Fitting of the corresponding relational function was performed. Based on the relational function, the ultimate bearing capacity of the beams was estimated according to the mean of the experiment. The results showed that if there was a significant difference between the preliminarily estimated value and the measured value of the Kaiser point, modifications can be conducted to avoid any significant difference in the Kaiser point caused by human factors. Using the Felicity ratio and based on function fitting, the maximum difference in the ultimate bearing capacity of the beams was estimated to be no more than 10%. Moreover, it was concluded that the estimated ultimate bearing capacity of the beams was characterized by high stability in the case of different sample data. This method will provide a theoretical basis for evaluating the ultimate bearing capacity of reinforced concrete beams under bending load based on the Kaiser effect.

1. Introduction

Since the introduction of Portland cement, after two hundred years of development, a large number of concrete bridges have been put into use. Under the influence of innate mass, late load and environment, material aging, fatigue, cracking and other factors make the structural bearing capacity decrease, causing a great threat to the safety of people’s lives and property. According to incomplete statistics, in the three years from 2017 to 2019 alone, 26 bridge collapse accidents have occurred worldwide, resulting in 80 deaths and more than 100 injuries [1]. In this context, it is essential to take certain measures for the damage identification and safety assessment of these bridges. The actual operating conditions of a structure can be obtained on the basis of periodic or random non-destructive testing, as needed, and this is of great significance for evaluating structural safety and predicting residual life. Meanwhile, acoustic emission (AE) is a non-destructive testing technology that is widely used in the detection and safety evaluation of various bridges [2].
AE is a physical phenomenon that widely exists in nature, which means that the potential energy accumulated in an object is released in the form of elastic waves when an object is deformed or damaged under load. It is defined in ASTME1316-2011 as the phenomenon in which the local source in a material quickly releases energy to generate transient elastic waves [3,4,5]. Such waves come from the structure itself; here, the dynamic information of structural damage can be obtained. Moreover, the damage location, degree and category of the structure can be evaluated accordingly [6,7,8]. In the 1950s, Kaiser, a German scientist, found that when the load did not reach the historical maximum of the load on the material, the material would not produce an obvious acoustic emission phenomenon; this irreversible phenomenon of acoustic emission was called the Kaiser effect [9,10]. The Kaiser effect laid the foundation for the application of acoustic emission in engineering. Hence, the effect and its mechanism have long been popular research topics in this research area.
The Kaiser effect was studied first in metal materials. Rusch and McCabeetal discovered this effect in brittle materials such as concrete and rock [11,12]. Takeshi-Watanabe found that the higher the concrete strength, the more obvious the Kaiser effect will be [13]; this represents the correlation between the effect and strength of concrete. Ji et al. studied the relationship between the Kaiser effect and the Felicity effect of concrete materials and reported that the Kaiser effect on concrete materials is related to their stress level. When the stress level is greater than 30% of the ultimate stress (lower limit) and less than 80% (upper limit), the Kaiser effect is obvious, the Felicity ratio is generally greater than 1, and the upper limit of stress depends on the failure mechanism of the material, while the lower limit of stress depends on the structural characteristics of the material itself [14]. Thus, the Kaiser effect acquired from concrete has been studied from the perspectives of the AE characteristics of the materials under different loads in most cases [15,16,17,18,19]. However, few studies have highlighted the Kaiser effect of concrete components and structures, particularly on the AE characteristics of the whole process of concrete beam failure [20,21,22,23,24]. In the study of concrete beams, SHIELD found that concrete beams have an obvious Kaiser effect under bending load [25]. Ge et al. pointed out that the Kaiser effect is strict and effective in the low-stress stage of reinforced concrete beams, but it is more obvious with increasing stress [26]. LAI et al. showed that acoustic emission can be detected in the whole process, whether that is emitted in the initial compaction and elastic deformation stage, or later in plastic deformation and penetrating fracture damage stage. In different stages, the acoustic emission has significantly different characteristics [27].
Research on the AE characteristics of reinforced concrete structures has mainly focused on the estimation of the Kaiser point and monitoring of damage; however, the Kaiser effect is rarely used for estimating the ultimate bearing capacity. With reference to previous studies, this paper analyses the Kaiser effect of simply supported reinforced concrete beams subjected to the bending load through experiments according to the AE-based load changing law. Moreover, the method used for evaluating the ultimate bearing capacity of reinforced concrete beams is studied based on the Kaiser effect.

2. Experiment

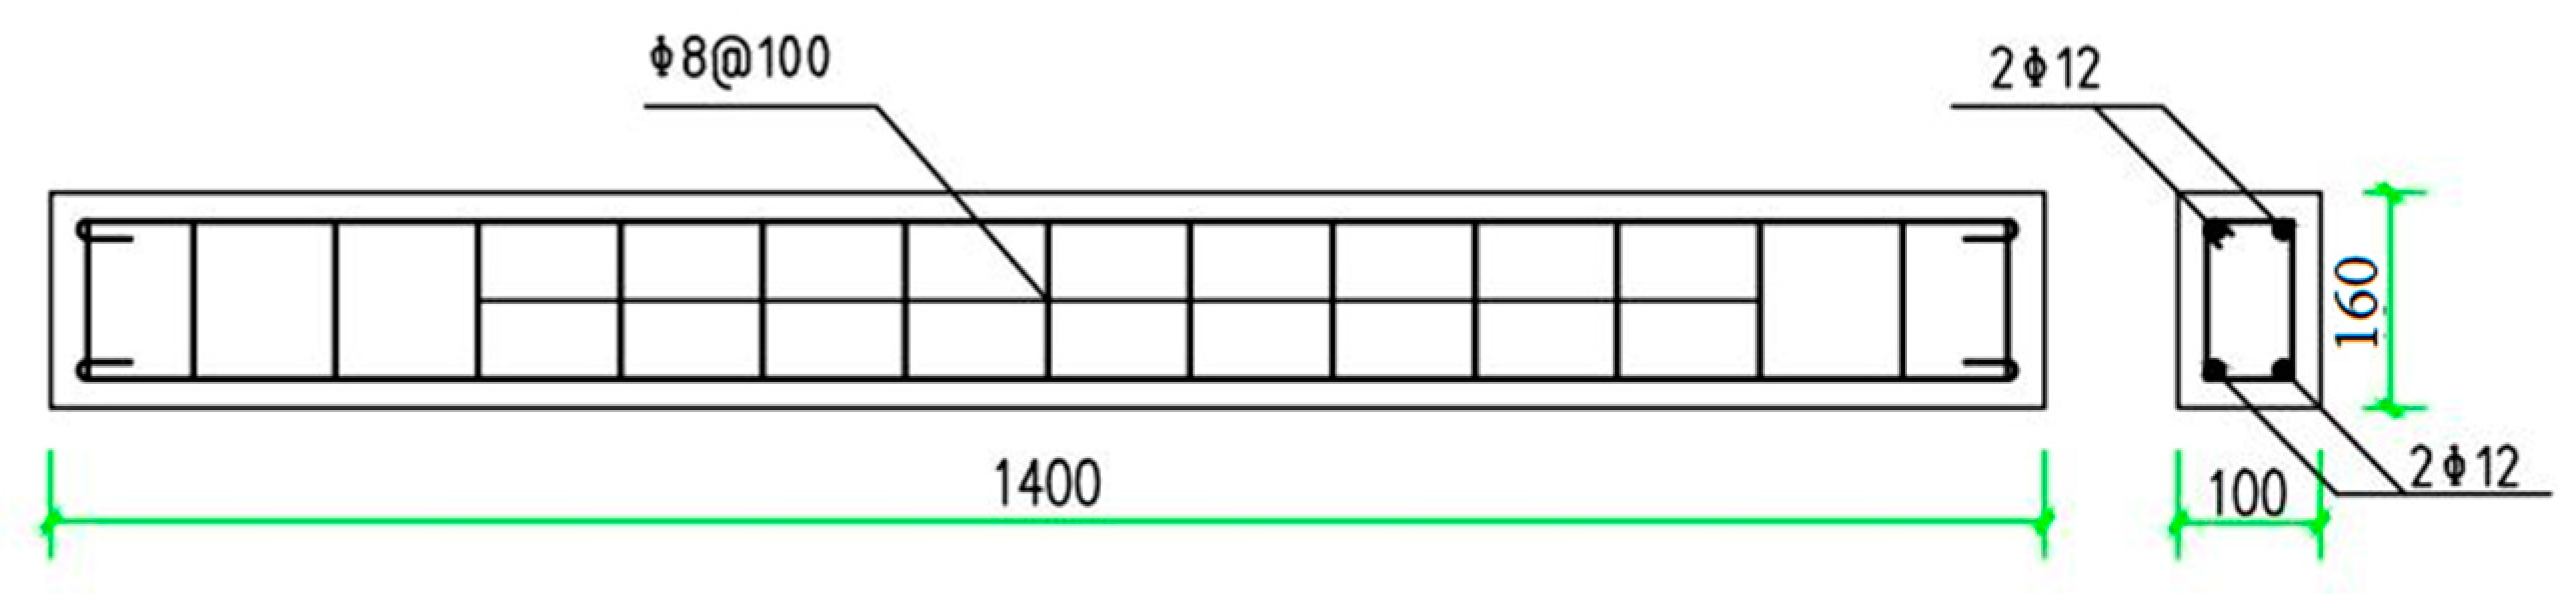
2.1. Specimen Making

As per the test requirements, four beams were poured and then numbered L1–L4 before testing. The length, width and height of the beam were 1400 mm, 100 mm and 160 mm, respectively. The specimens were poured by manually mixing concrete with the strength of C25. When the rebar binding was complete, concrete was poured into the formwork, and as it was poured, it was vibrated with a real pirated piece with a diameter of 2.5 cm. The materials and mix proportions of the concrete are shown in Table 1.
The Portland cement shown in Table 1 was produced by Xuanhua Cement Factory of China. River sand was used for the fine aggregate, and broken stone was used for the coarse aggregate. Additionally, 2 ribbed steel bars with a diameter of 12 mm and yield strength of 335 N/mm² were arranged in the tension zone and the compression zone, respectively; the stirrup was composed of round steel bars with a diameter of 8 mm and a yield strength of 235 N/mm²; the stirrup spacing was 100 mm, and the reinforcement protective layer had a thickness of 20 mm, as shown in Figure 1.
Prior to the experiment, the defects of the specimens were detected with the application of the SCE-MATS-B multi-functional non-destructive testing instrument for concrete produced by Sichuan Shengtuo Investigation Technology Co., Ltd., Chengdu, China with impact echo and elastic wave tomography (CT) as the detection methods. The impact echo method was adopted to extend the length of the measuring line with an interval of 0.1 m between measuring points. The CT method was used to test the measuring lines of 7 × 7 = 49, with a profile area of 1.4 × 0.15 m. The measuring lines were arranged, as shown in Figure 2. Moreover, the striking side of the beam was marked as ①, and the receiving side of the elastic wave was marked as ② during testing.
The results of the impact echo test show that no obvious defect was found in L1, L2 and L3, with non-compaction observed in L4 at 0.5 m. Furthermore, the results of the CT scanning test reveal that there were 3.9% suspected defects in L1, 3.9% serious defects with 7.3% suspected defects in L2, 1.5% serious defects with 7.9% suspected defects in L3 and 0.8% serious defects with 10.4% suspected defects in L4. Furthermore, the wave velocity is represented with different colours, of which red and blue represent high and low wave velocities, respectively. With the P-wave velocity as the judgement base, a reduction of ≤5% is considered a suspected defect and a reduction of more than 20% is considered a serious defect.
The concrete experimental beam was poured on 11 May 2021, a time that was suitable for concrete pouring as the weather forecast temperature ranged from 11 °C to 25 °C. After pouring, the specimens were watered for 28 days in a cool place and placed in the open air for drying under a natural environment for roughly 4 months. The produced specimens were applicable for experiments as long as there were no defects seriously affecting their carrying capacities.

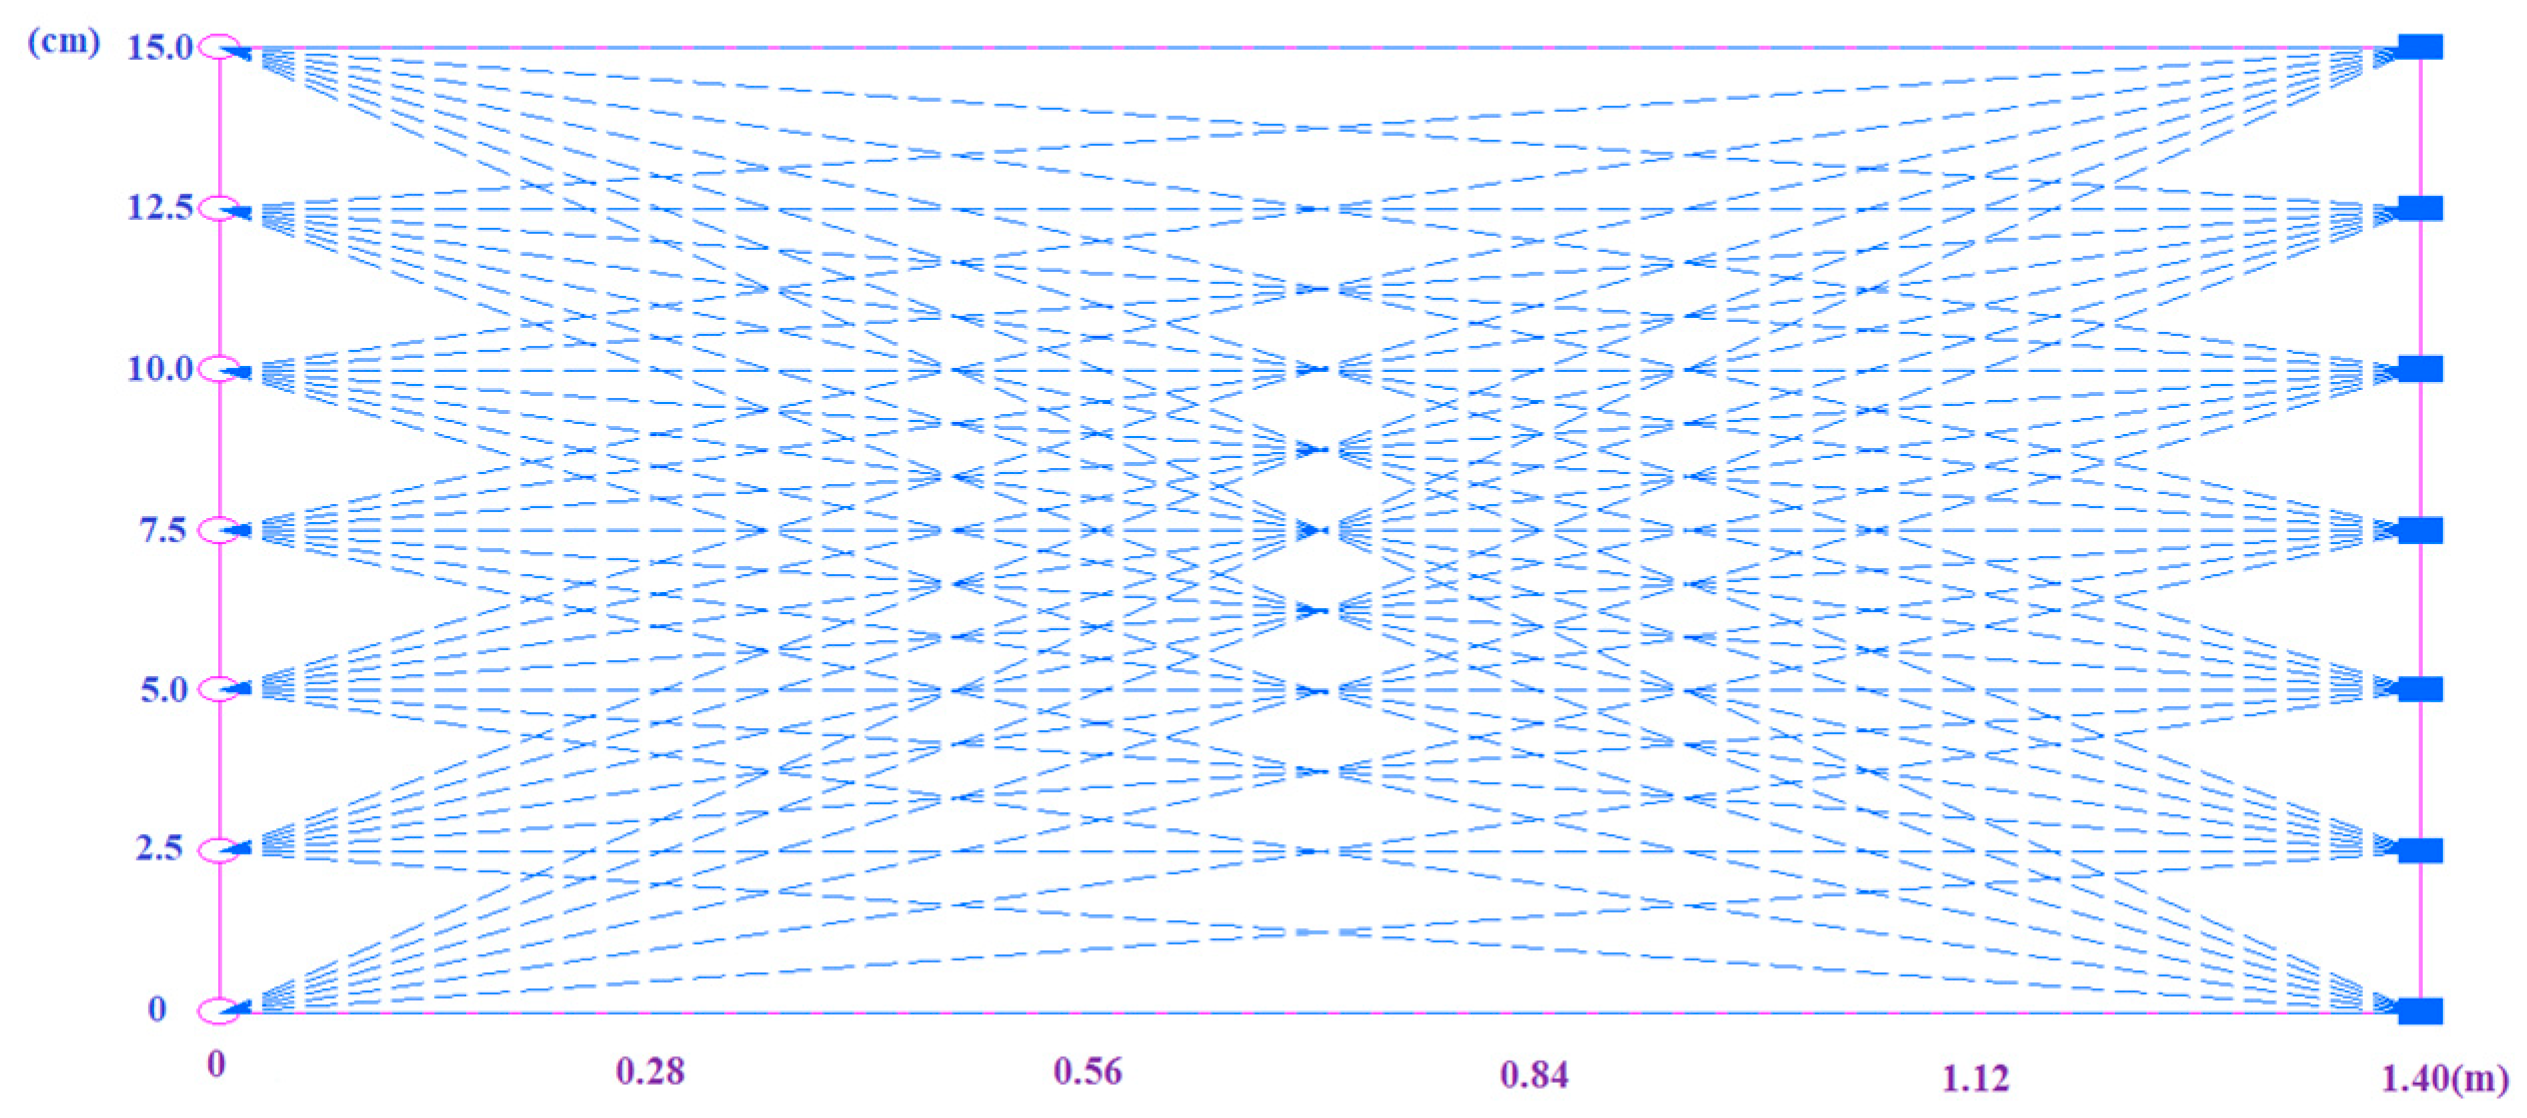
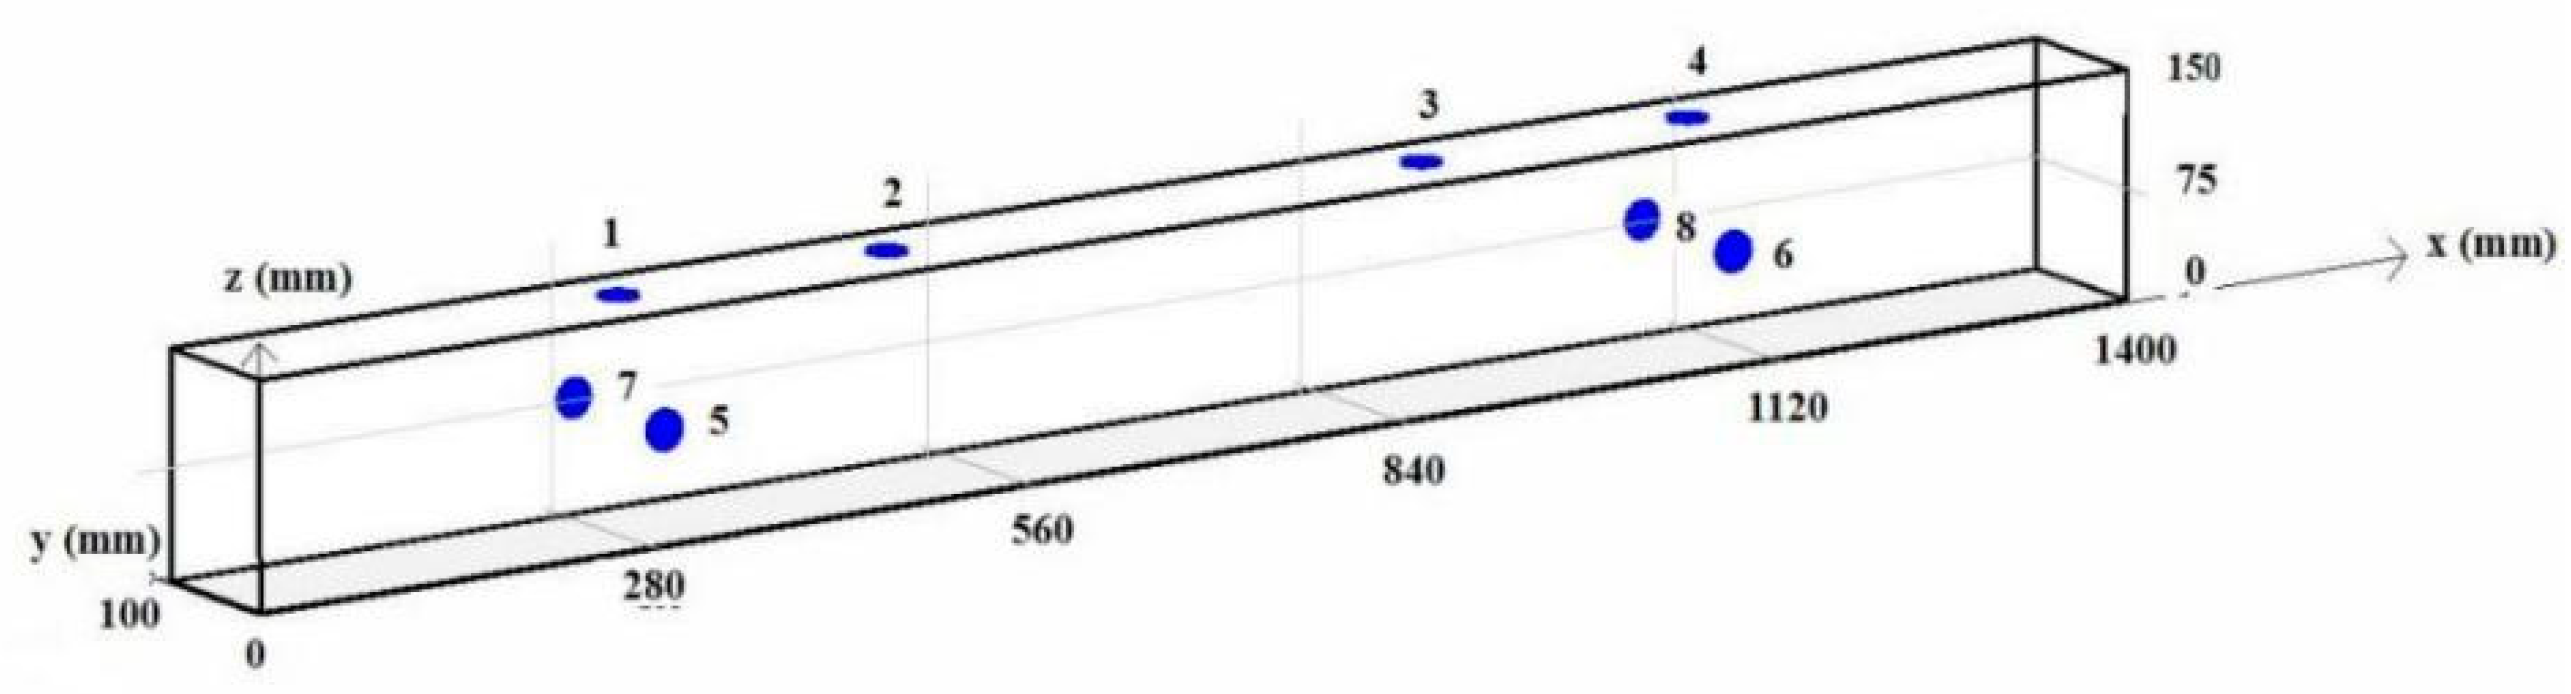
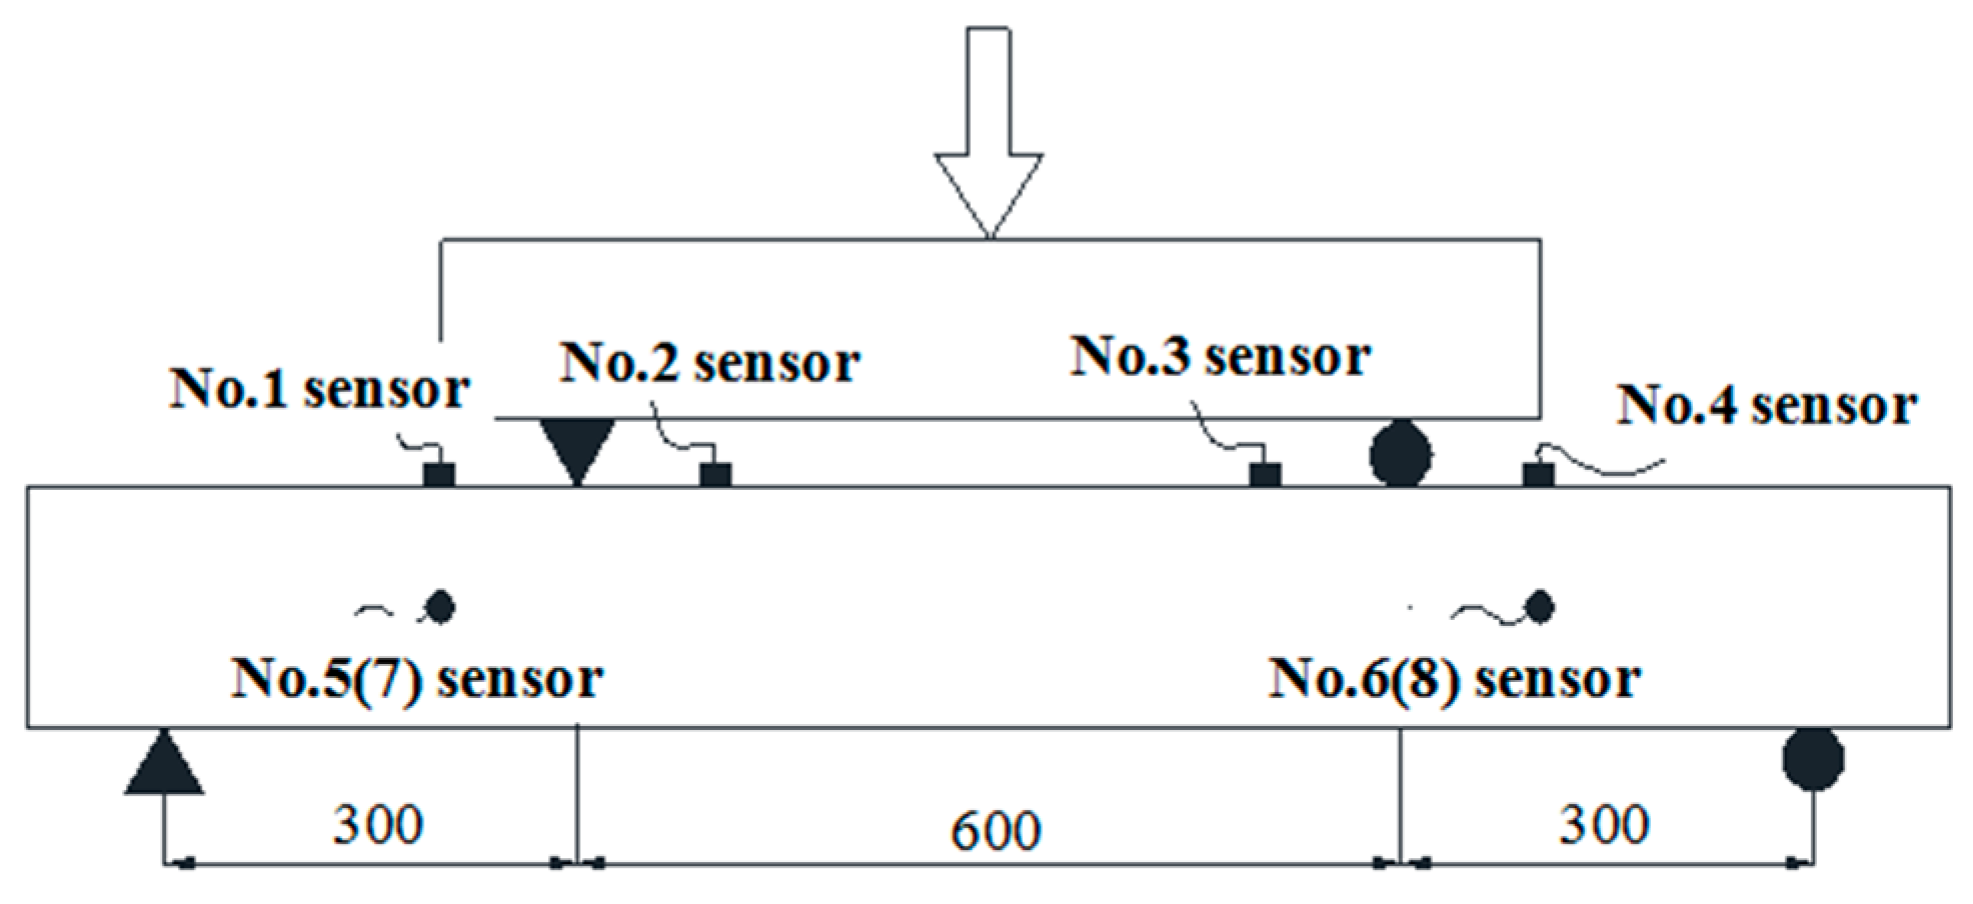
2.2. Experimental Scheme

The experiment was conducted with the DS5-8B full information AE signal analyser manufactured by Beijing Softland Times Technology Co., Ltd., Beijing, China, and 8 RS-2A AE sensors were leveraged for acquiring AE signals. The acquisition instrument works in 8 channels at the same time, the continuous data passing rate is greater than 262 MB/s, the sampling frequency is 3 M, the A/D conversion accuracy is 16 bits, and the system noise is 10 dB. Sensor frequency range is 50–400 kHz, and the centre frequency is 150 kHz. The sensor location coordinates were set with the X, Y and Z axes in the beam length, beam width and beam height directions, respectively. The sensors were numberd with 1-8, as shown in Figure 3. In the experimental procedure, a manual jack with a maximum capacity of 20 t was adopted as the loading equipment, and a 200 kN pressure sensor was used as the force-measuring device. The loading system consisted of a jack, a pressure sensor and a steel reaction frame, as shown in Figure 4.
The AE experiment was performed using four-point bending loading. The simply supported beam was calculated with a span of 1200 mm and a pure bending section of 600 mm, as shown in Figure 5.
The cyclic loading with staged sections was conducted during the loading process of each specimen so as to induce damage to the specimens. The bearing capacity of the beams was continuously loaded by collecting its AE signal. The AE information was not collected during the unloading process after the completion of each stage of loading.

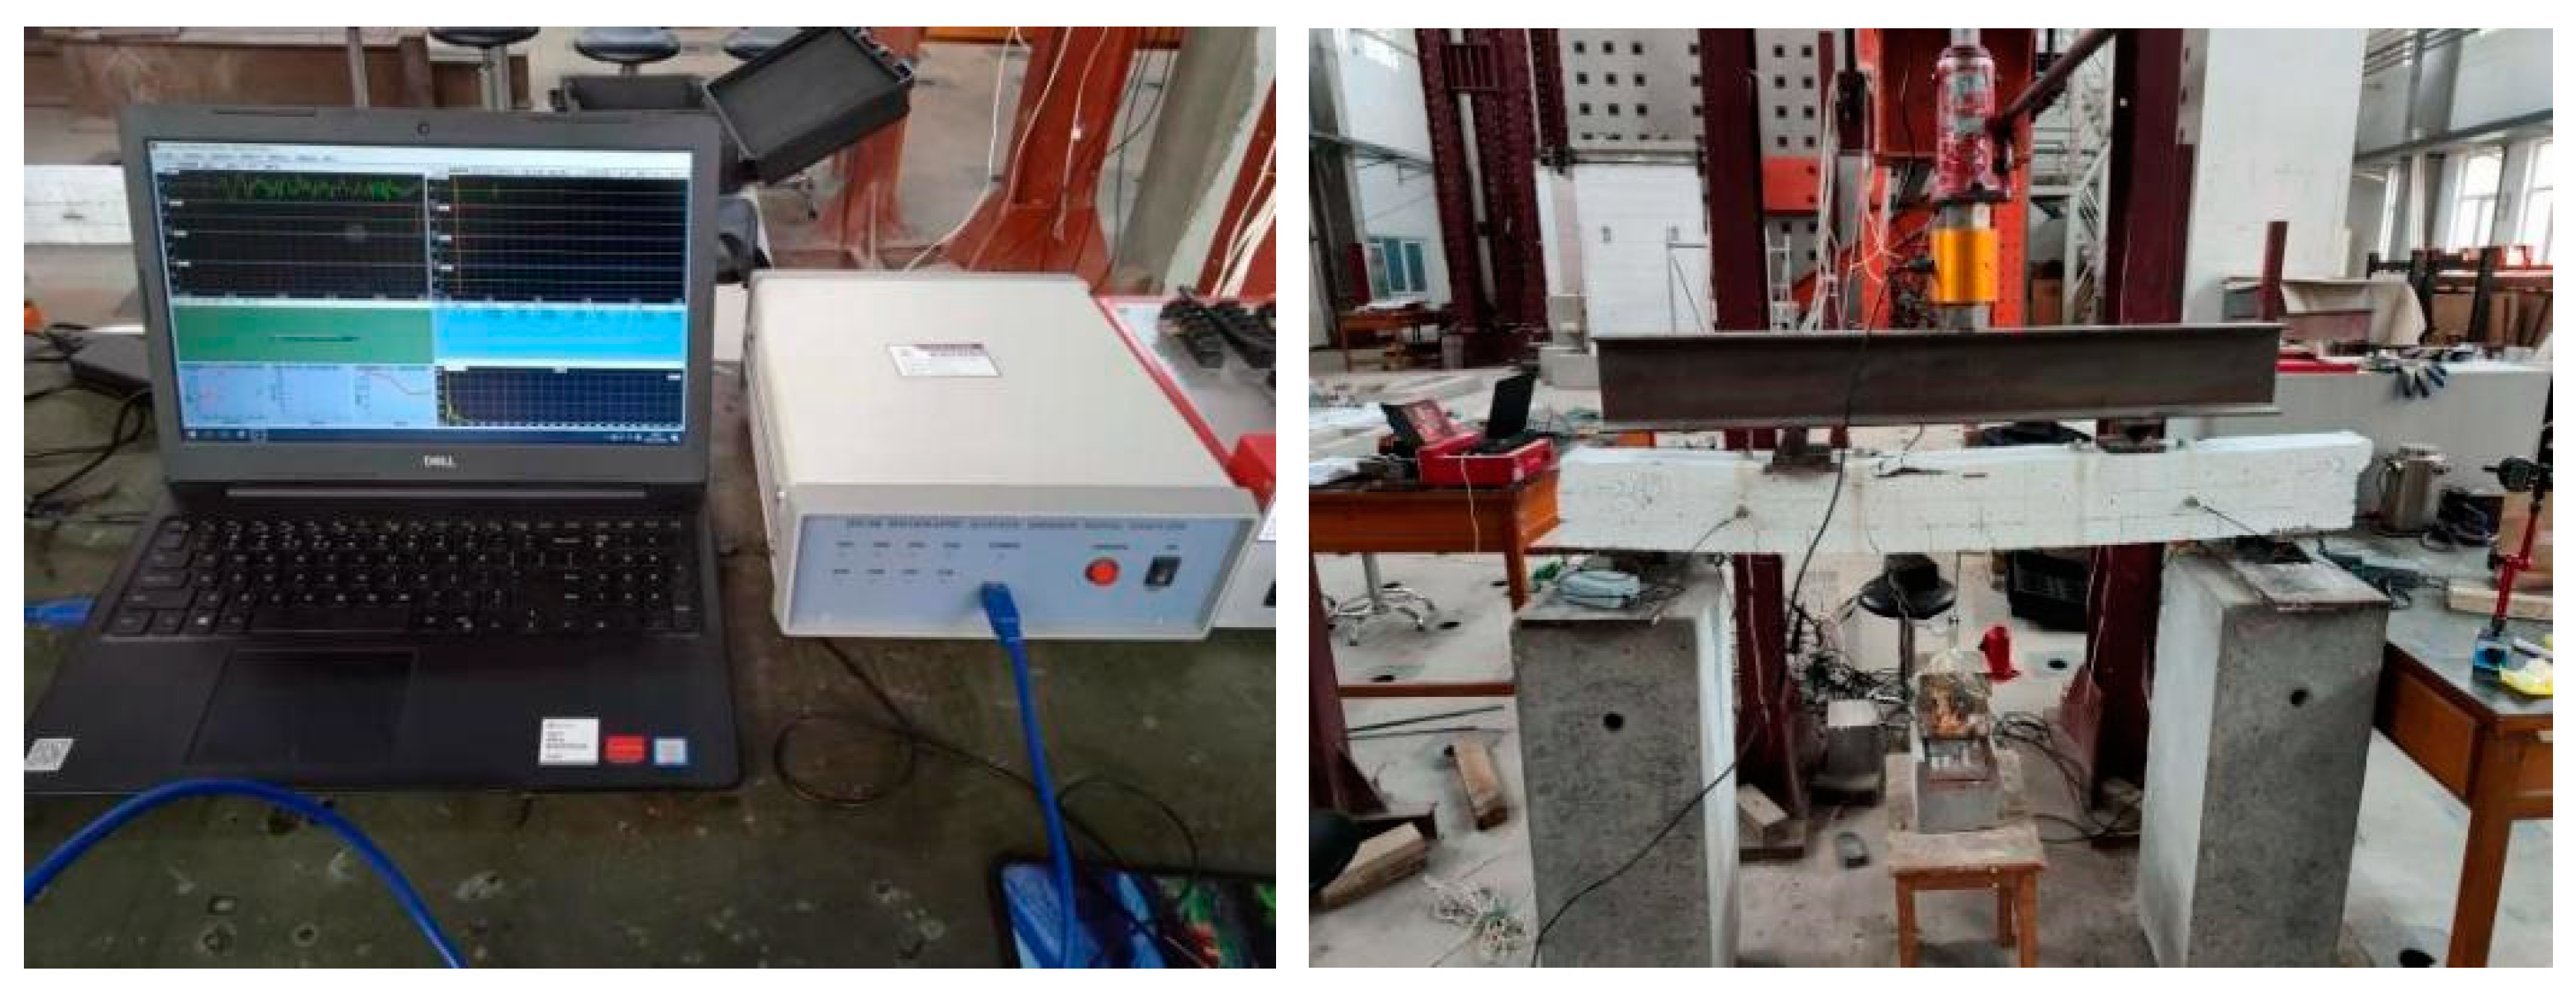
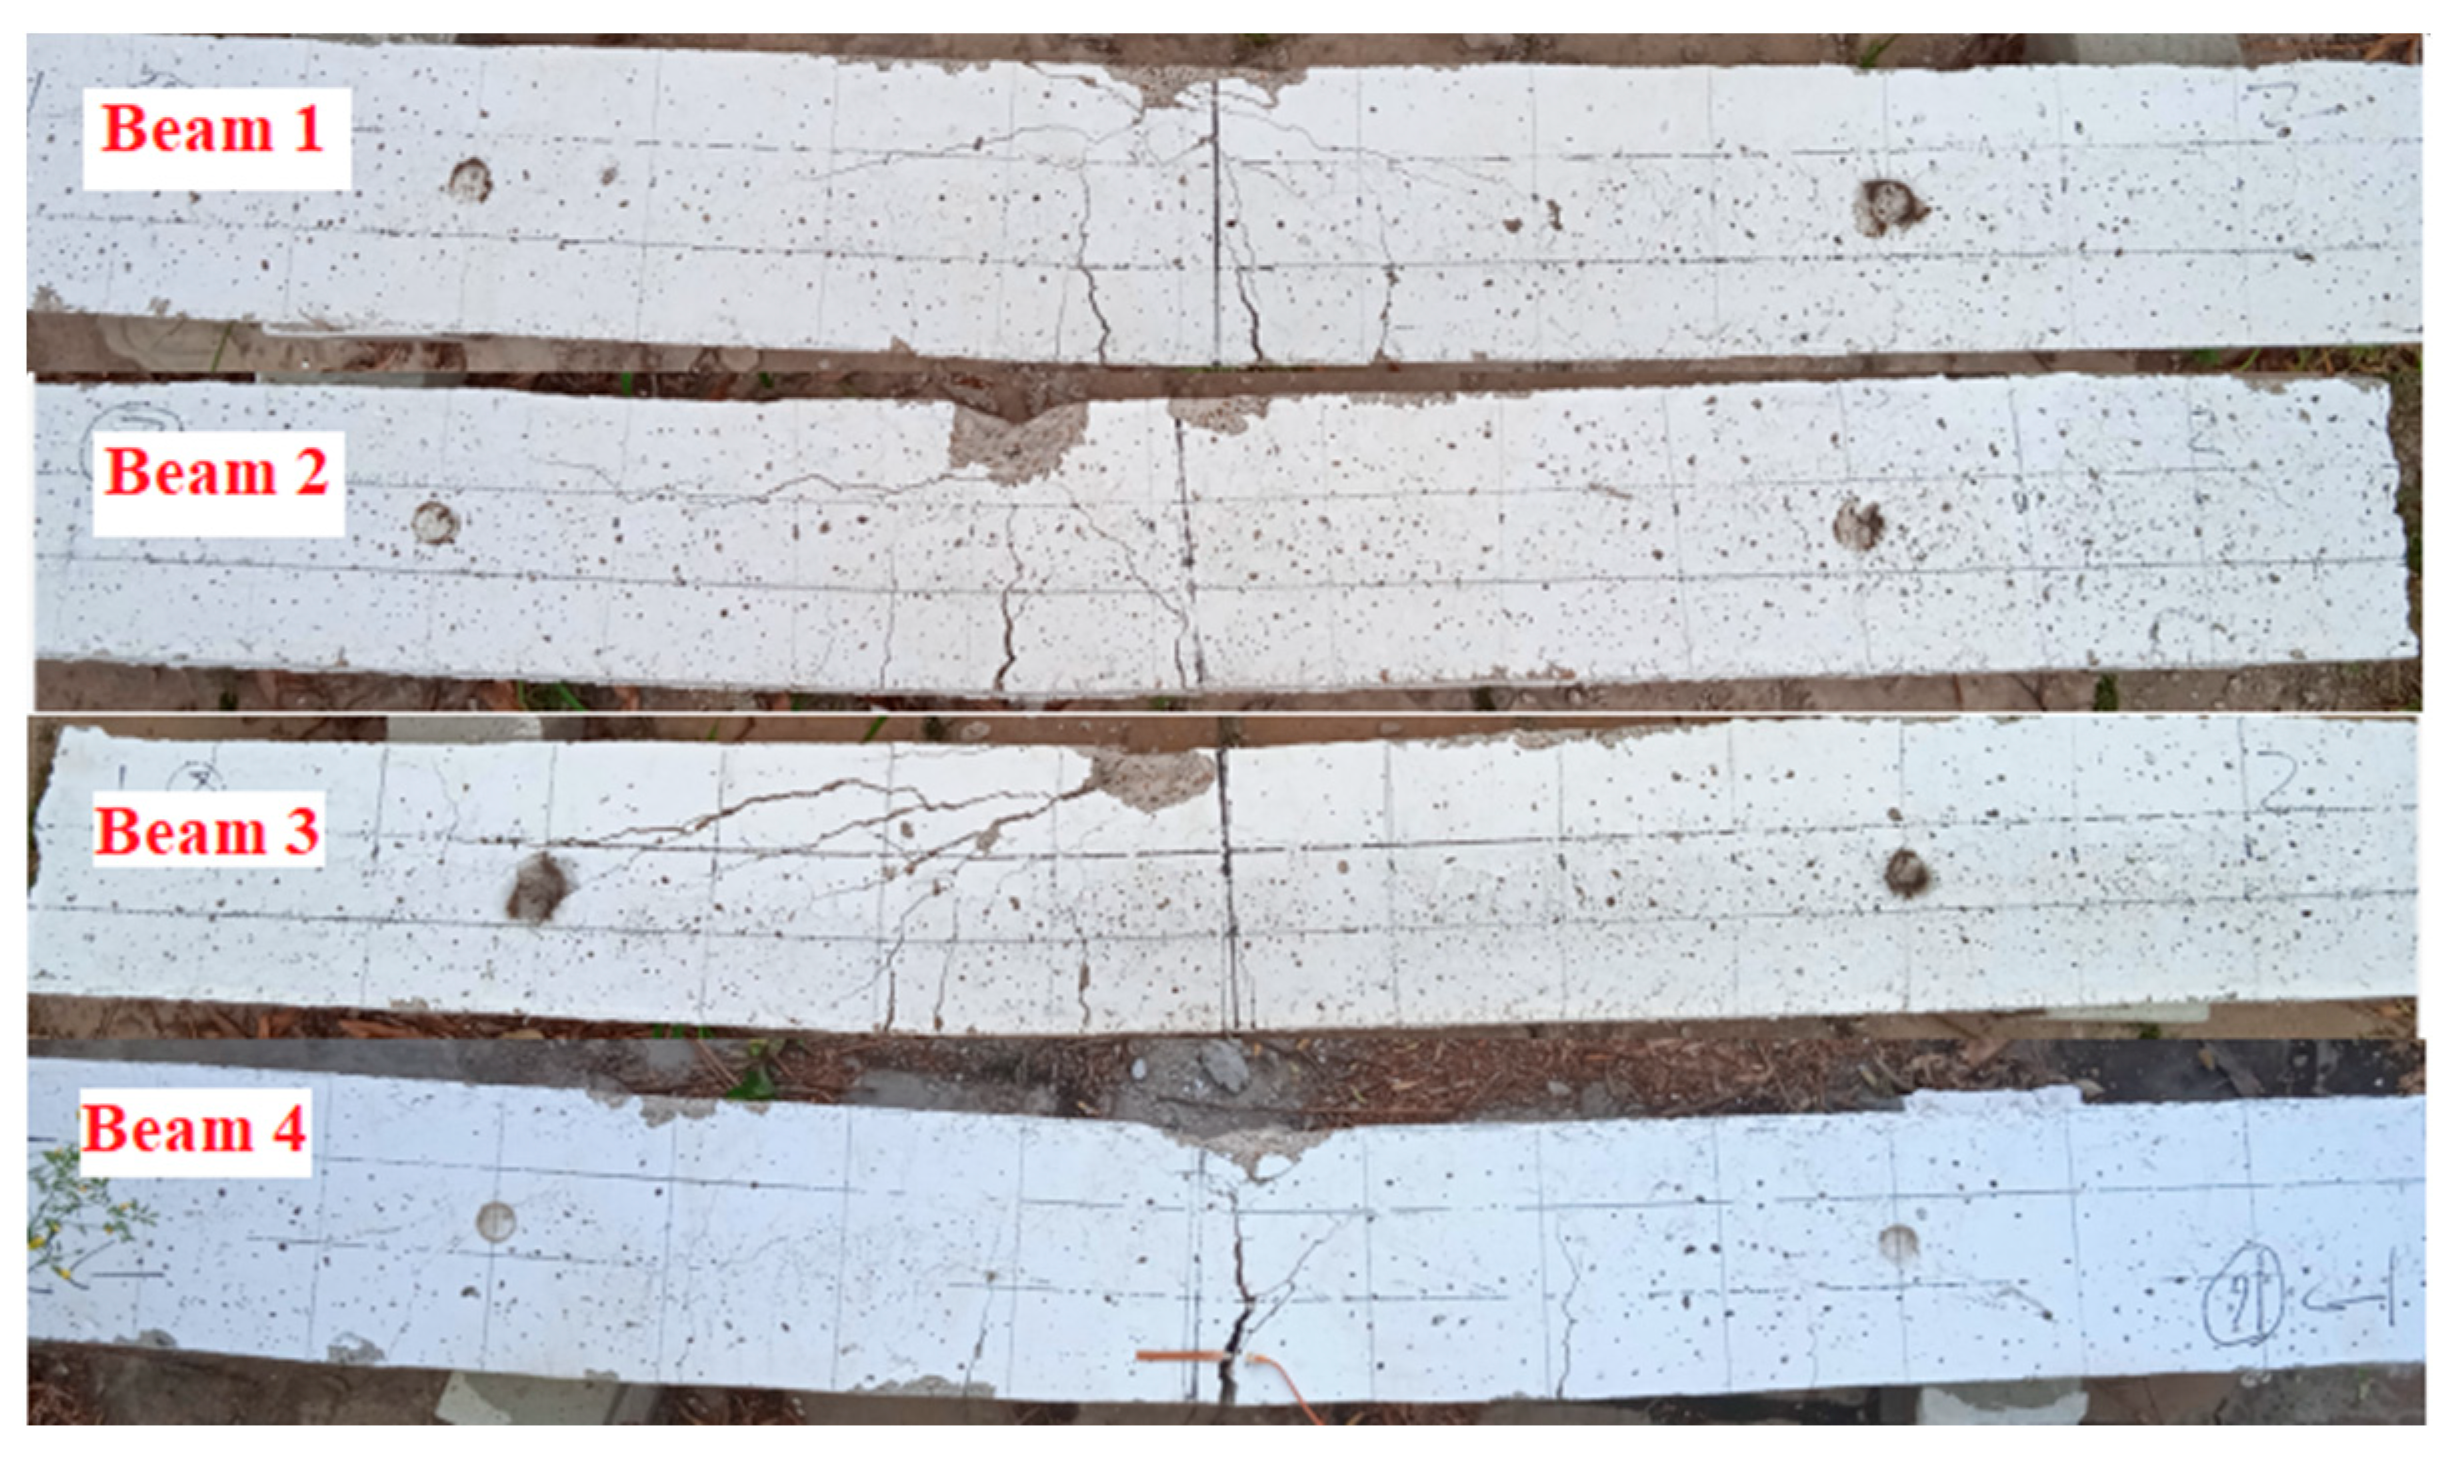
2.3. Experimental Process and Phenomenon

Before the experiment started, the experimental system was preloaded. The AE phenomenon is irreversible, so the preload value should not be too large, otherwise it will affect the AE data in the formal experiment; thus, the preload value was set to 2 kN. When the load reached 2 kN, we stopped loading and checked whether the instrument was working properly and whether the bracket was stable. After confirming that there was no problem, the load continued and the acoustic emission signal was collected. The threshold was set to 40 dB, and the gain was set to 40 dB during data acquisition. Furthermore, the hardware analogue filter was set to the pass-through mode [28], with a sampling frequency at 3 MHz. The peak definition time (PDT), hit definition time (HDT) and hit lockout time (HLT), respectively, were 300 µs, 650 µs and 800 µs [29]. According to the design parameters and loading position of the beams, the maximum load that the beams could bear was 50 kN, and 20%, 30% and 50% of the calculated maximum loads were taken as the first loading amounts of each beam.
Beams L1–L4 were loaded in different stages with varying loads in the experiment. They were unloaded as long as the beams achieved the ultimate bearing capacity. Next, they were loaded for two more rounds. The specific loading procedure is shown in Table 2, and the beam damages are observed in the compression zone. There were many vertical cracks in the pure bending section of the tension zone, among which the maximum crack in the L4 span reached up to 10 mm, almost running through the entire beam height. There were also serious oblique shear cracks in L3. Additionally, a large amount of deformation occurred with beam damage. Please refer to Figure 6 for more details.

3. Analysis of the Kaiser Effect

3.1. Parameter Selection and Judgement Method of the Kaiser Point

Parameter analysis is commonly utilised in studies investigating the Kaiser effect on AE due to its ability to reflect different AE characteristics with various parameters. AE parameters, such as hit, event, ringing, energy and effective voltage, can directly demonstrate the intensity of AE activities. Specifically, the number of hits and events show the number of generated AEs, while ringing, energy and effective voltage indicate the intensity and energy released when an AE event occurs. The Kaiser effect refers to the obvious AE information not produced by the structure when stress fails to reach its historical extreme value. The so-called obvious AE refers to the newly and effectively generated AE information, of which is the new AE event (hit). As a result, hit was selected as the analysis parameter for the Kaiser effect in the current study. The threshold, hit definition time and peak definition time are determinants of the hitting number, which are normally determined by experience and change with the environment and experimental materials, showing a strong uncertainty. As an essential AE parameter, the ringing count can be counted unimpededly using the settings of other parameters under a specific threshold. Simultaneously, the number and intensity of AE events are also reflected by their cumulative value in an intuitive way. Ge et al. concluded that the ringing count is more appropriate for acting as the judgement basis parameter of the Kaiser point [26] than other parameters in their study, as it is more deterministic. Hence, ringing and hit were selected as parameters for analysis.
The Kaiser effect of AE is judged by the reappearance of the effective AE phenomenon in the loading process. However, the appearance of an obvious AE signal is generally taken as the judgement basis in most of the documents, thereby resulting in the extension of different judgement methods. Common methods, such as mutation point, maximum curvature determination, bitangent and reloading methods, as well as the comprehensive application of these methods, are based on the principle of AE recovery after reaching the Kaiser point with the rapid increase of statistical AE parameters [29]. The current paper corrected the Kaiser point using the difference between the fitting curve and the measured value on the basis of determining the Kaiser point using the aforementioned method. This resulted in a reduction in the error caused by subjectivity and the inconspicuous inflexion point of the curve. The concrete steps are presented as follows:
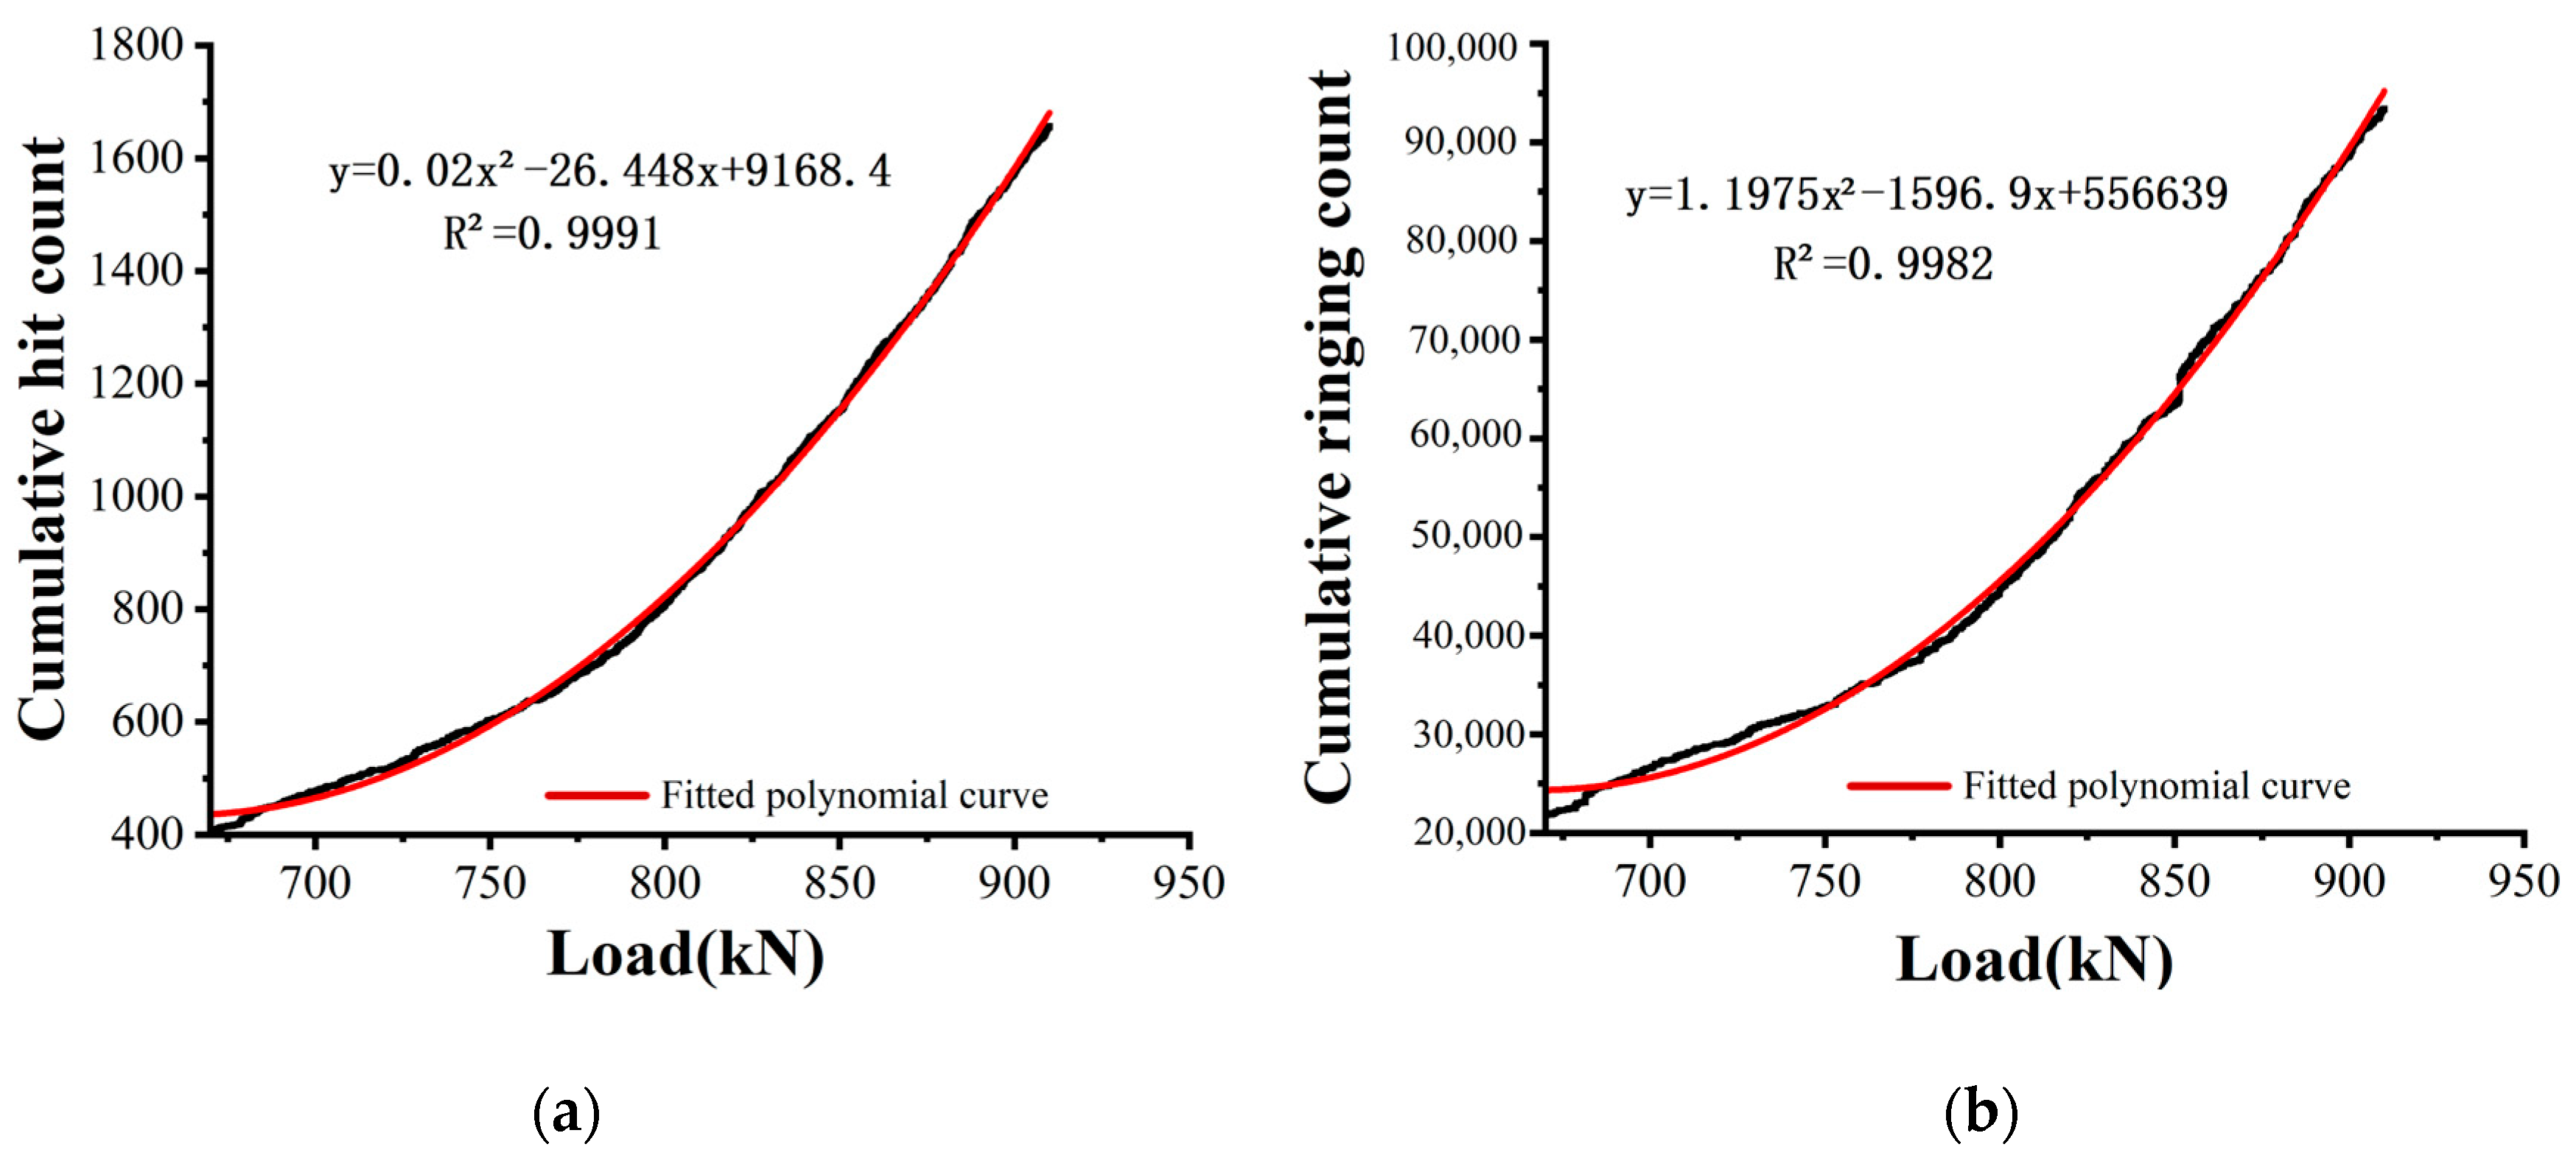
  • First, draw the load AE signal curve as per the hit number and ringing count in the AE signal during loading, and then adopt it to initially determine the Kaiser point.
  • With the initially judged Kaiser point as the centre, extend the appropriate intervals forward and backward to perform function fitting on the measured data. On this basis, the difference between the measured and functional values can be calculated to draw the load–difference curve. Then, the maximum positive value point between the zero points of the difference curves is deemed as the Kaiser point (which is approximate to the maximum curvature point).
For instance, the Kaiser point was corrected by reloading a concrete cube (150 mm × 150 mm × 150 mm) with the historical load extreme value of 800 kN to 1000 kN. First, the load hit number and load ringing curves of the AE information were drawn with the initial judgement that the Kaiser point was 790 kN, with 790 kN as the centre from which to extend 800 × 0.15 = 120 kN forward and backward. On this basis, function fitting was performed on the measured data with the interval of [670, 910], as shown in Figure 7.
Evidently, the fitting function and measured data are well fitted between the selected areas on the selected interval, as shown in Figure 7. Furthermore, the load–difference curve is presented by subtracting the measured hit number and the ringing count from the values calculated using the fitting function, as shown in Figure 8.
The load corresponding to the maximum difference value in the curve was selected as the Kaiser point. The Kaiser points determined using the number of hits and ringing count were 786.11 and 785.67 kN, respectively, with Felicity ratios of 0.983 and 0.982, respectively. Notably, the 0.1% difference between the Kaiser points determined using the hit number, and the ringing count can be ignored.
To study the influence of the initially judged Kaiser point error on the corrected results, these Kaiser points were assumed as 760, 800 and 820 kN for the purpose of correcting them. Meanwhile, the experimental results for the Kaiser points, as shown in Table 3, were judged using the method listed in reference [26].
The corrected Kaiser points remained unchanged even when they were initially judged to be significantly different. The Kaiser point determined using the ringing count was 785.67 kN, whereas that determined using the hit was 786.11 kN in most cases. However, it was 790.56 kN when the initial determination point was 760 kN, with a difference of 0.57%. It can be seen that the proposed correction method can effectively lower the subjective hit on the results, as the correction of Kaiser points is rarely affected by the initially judged error. The Kaiser point was judged as 777.78 kN according to the method listed in reference [26], with the ringing count as the parameter, representing a 1.01% difference from the 785.67 kN point determined using the proposed method. Thus, the proposed method is feasible for correcting the Kaiser point.

3.2. Evaluation Method of the Bearing Capacity Based on the Kaiser Effect

The AE signal collected from the RC beam in Section 2.3 was analysed and judged for their Kaiser points through the ringing count using the correction method proposed in Section 3.1. Then, its Felicity ratio was calculated, with the results shown in Table 4.
As shown in Table 4, there is a more obvious Kaiser effect in RC simply supported beams in the low-stress stage. The Kaiser effect was gradually replaced by the Felicity effect as the load increased and the Felicity ratio became smaller. The load ratio K is hereby introduced, in which we set K = F i / F cr , with F i as the historical maximum load and F cr as the ultimate bearing capacity. The load ratio at each Kaiser point was then calculated. A plot was drawn with the Felicity ratio of each Kaiser point as the horizontal axis and the load ratio as the vertical axis, as shown in Figure 9. When a load ratio is equal to 1, the average value of the Felicity ratio obtained from two loads after loading L4 to the ultimate load in the experiment is taken as 0.275. By conducting function fitting, a quadratic function can be obtained (Equation (1)). The quadratic curve R2 is 0.9836, which shows a good fit. In Equation (1), K is the load ratio, FRi is the Felicity ratio and F R i = F i + 1 / F i . F i + 1 is the load that produces a significant acoustic emission signal when reloaded.
K = 1.5609 F R i 2 + 0.716 F R i + 0.9122
By substituting K = F i / F cr into Equation (1), we can obtain the following:
F c r = F i 1.5609 F R i 2 + 0.716 F R i + 0.9122
According to Equation (2), the ultimate load capacity of a structure can be estimated by conducting AE experiments and acquiring the corresponding Kaiser point and Felicity ratio through the application of different loads. The Felicity ratios obtained from the experiments in this study and literature [26,30] were substituted into Equation (2). Then, the ultimate bearing capacity was estimated using the historical maximum loads at different stages. Finally, the detailed results are shown in Table 5.
In Table 4, there are varying degrees of errors between the Felicity ratios of the experiments and the estimated bearing capacity of the RC girder and the actual ultimate load capacity, where the error ranged from −45.23% to 12.95%. In the results, all the bearing capacity errors obtained in the literature [30] were positive, with negative errors obtained in L2 as well as both positive and negative errors in the rest. The two maximum error points found in the literature [26] were −45.23% and −24.55%, corresponding to the Felicity ratios of 0.318 and 0.5, respectively. The Felicity ratio corresponding to the load ratio of 0.318 can be eliminated as an outlier upon a comparison with other experimental trends. This is because the Felicity ratio is consistent with that at the load ratio of 0.5, according to the literature [26]. By combining the data in the literature [26,30] with the data obtained in this study and then refitting the load ratio–Felicity ratio function, an estimation formula of the ultimate bearing capacity can be found, as shown in Equation (3). A load ratio–error curve shown in Figure 10 can be obtained by applying the new fitting equation to re-estimate the ultimate load capacity and calculating its errors.
F c r = F i 1.5825 F R i 2 + 0.8104 F R i + 0.8884
As shown in Figure 9, the ultimate bearing capacity obtained using Equation (3) had the same variation trend as that obtained using Equation (2). Furthermore, the errors obtained using Equations (2) and (3) were very small at the corresponding points, although those obtained using Equation (3) for estimating the ultimate bearing capacity are different from those obtained using Equation (2) after adding the data from literature [26,30] into the data set. Thus, this indicates that the ultimate bearing capacities of concrete beams estimated using the load and Felicity ratios are stable. Various bearing capacity errors of beams after obtaining the average ultimate bearing capacity, which is estimated from each group of data, are presented in Table 6. Table 6 shows that the maximum and minimum bearing capacity errors of each beam are 9.76% and 2.02%, respectively.
The aforementioned analysis shows that the load capacity of RC beams based on the Kaiser effect with the load ratio and Felicity ratio can be evaluated in a stable manner. However, there are large errors in the estimated values under the influence of the experimental method and the form of loading, particularly the different means used in the judging process of the Kaiser point and the subjective factors of the judge. In response, the method of averaging multiple estimations at different loading ratios can be used to effectively reduce the estimation error.

4. Conclusions

This study investigated the Kaiser effect of the AE of four simply supported RC beams under the bending load, using an AE experiment based on the experimental data found in the literature [26,30]. Then, the application method of the Kaiser effect in the evaluation of the bending ultimate bearing capacity of RC beams was discussed to arrive at the following conclusions.
  • An appropriate interval near the initial judgement point was selected for function fitting upon the initial judgement of the Kaiser point with the cumulative value of AE parameters. The results reveal that it is feasible to correct the Kaiser point using the difference curve between the fitting function and the measured value to effectively lower the hit of human factors in the judgement process. The Kaiser point determination method lays a foundation for evaluating the bearing capacity of reinforced concrete beams using Kaiser points.
  • According to existing studies, concrete has a relatively obvious Kaiser effect under tension and compression, especially when the stress level is greater than 30% and less than 80%. The stress distribution of reinforced concrete beams under bending is not uniform, and it makes the Kaiser effect not obvious at lower stress levels. Under the action of bending load, when the load is less than 35% of the ultimate load, the Felicity ratio is greater than 0.9 due to the different stress distributions associated with each section, and the Kaiser effect is obvious. However, when the load reaches about 40% of the ultimate bearing capacity, the Felicity ratio drops to below 0.9, exhibiting a more obvious Felicity effect. Moreover, as the load continues to increase, the Felicity ratio shows a regular decline until the Kaiser effect completely disappears. The trend of the Kaiser effect with stress levels provides a theoretical basis for evaluating the ultimate bearing capacity of reinforced concrete beams by the Kaiser effect.
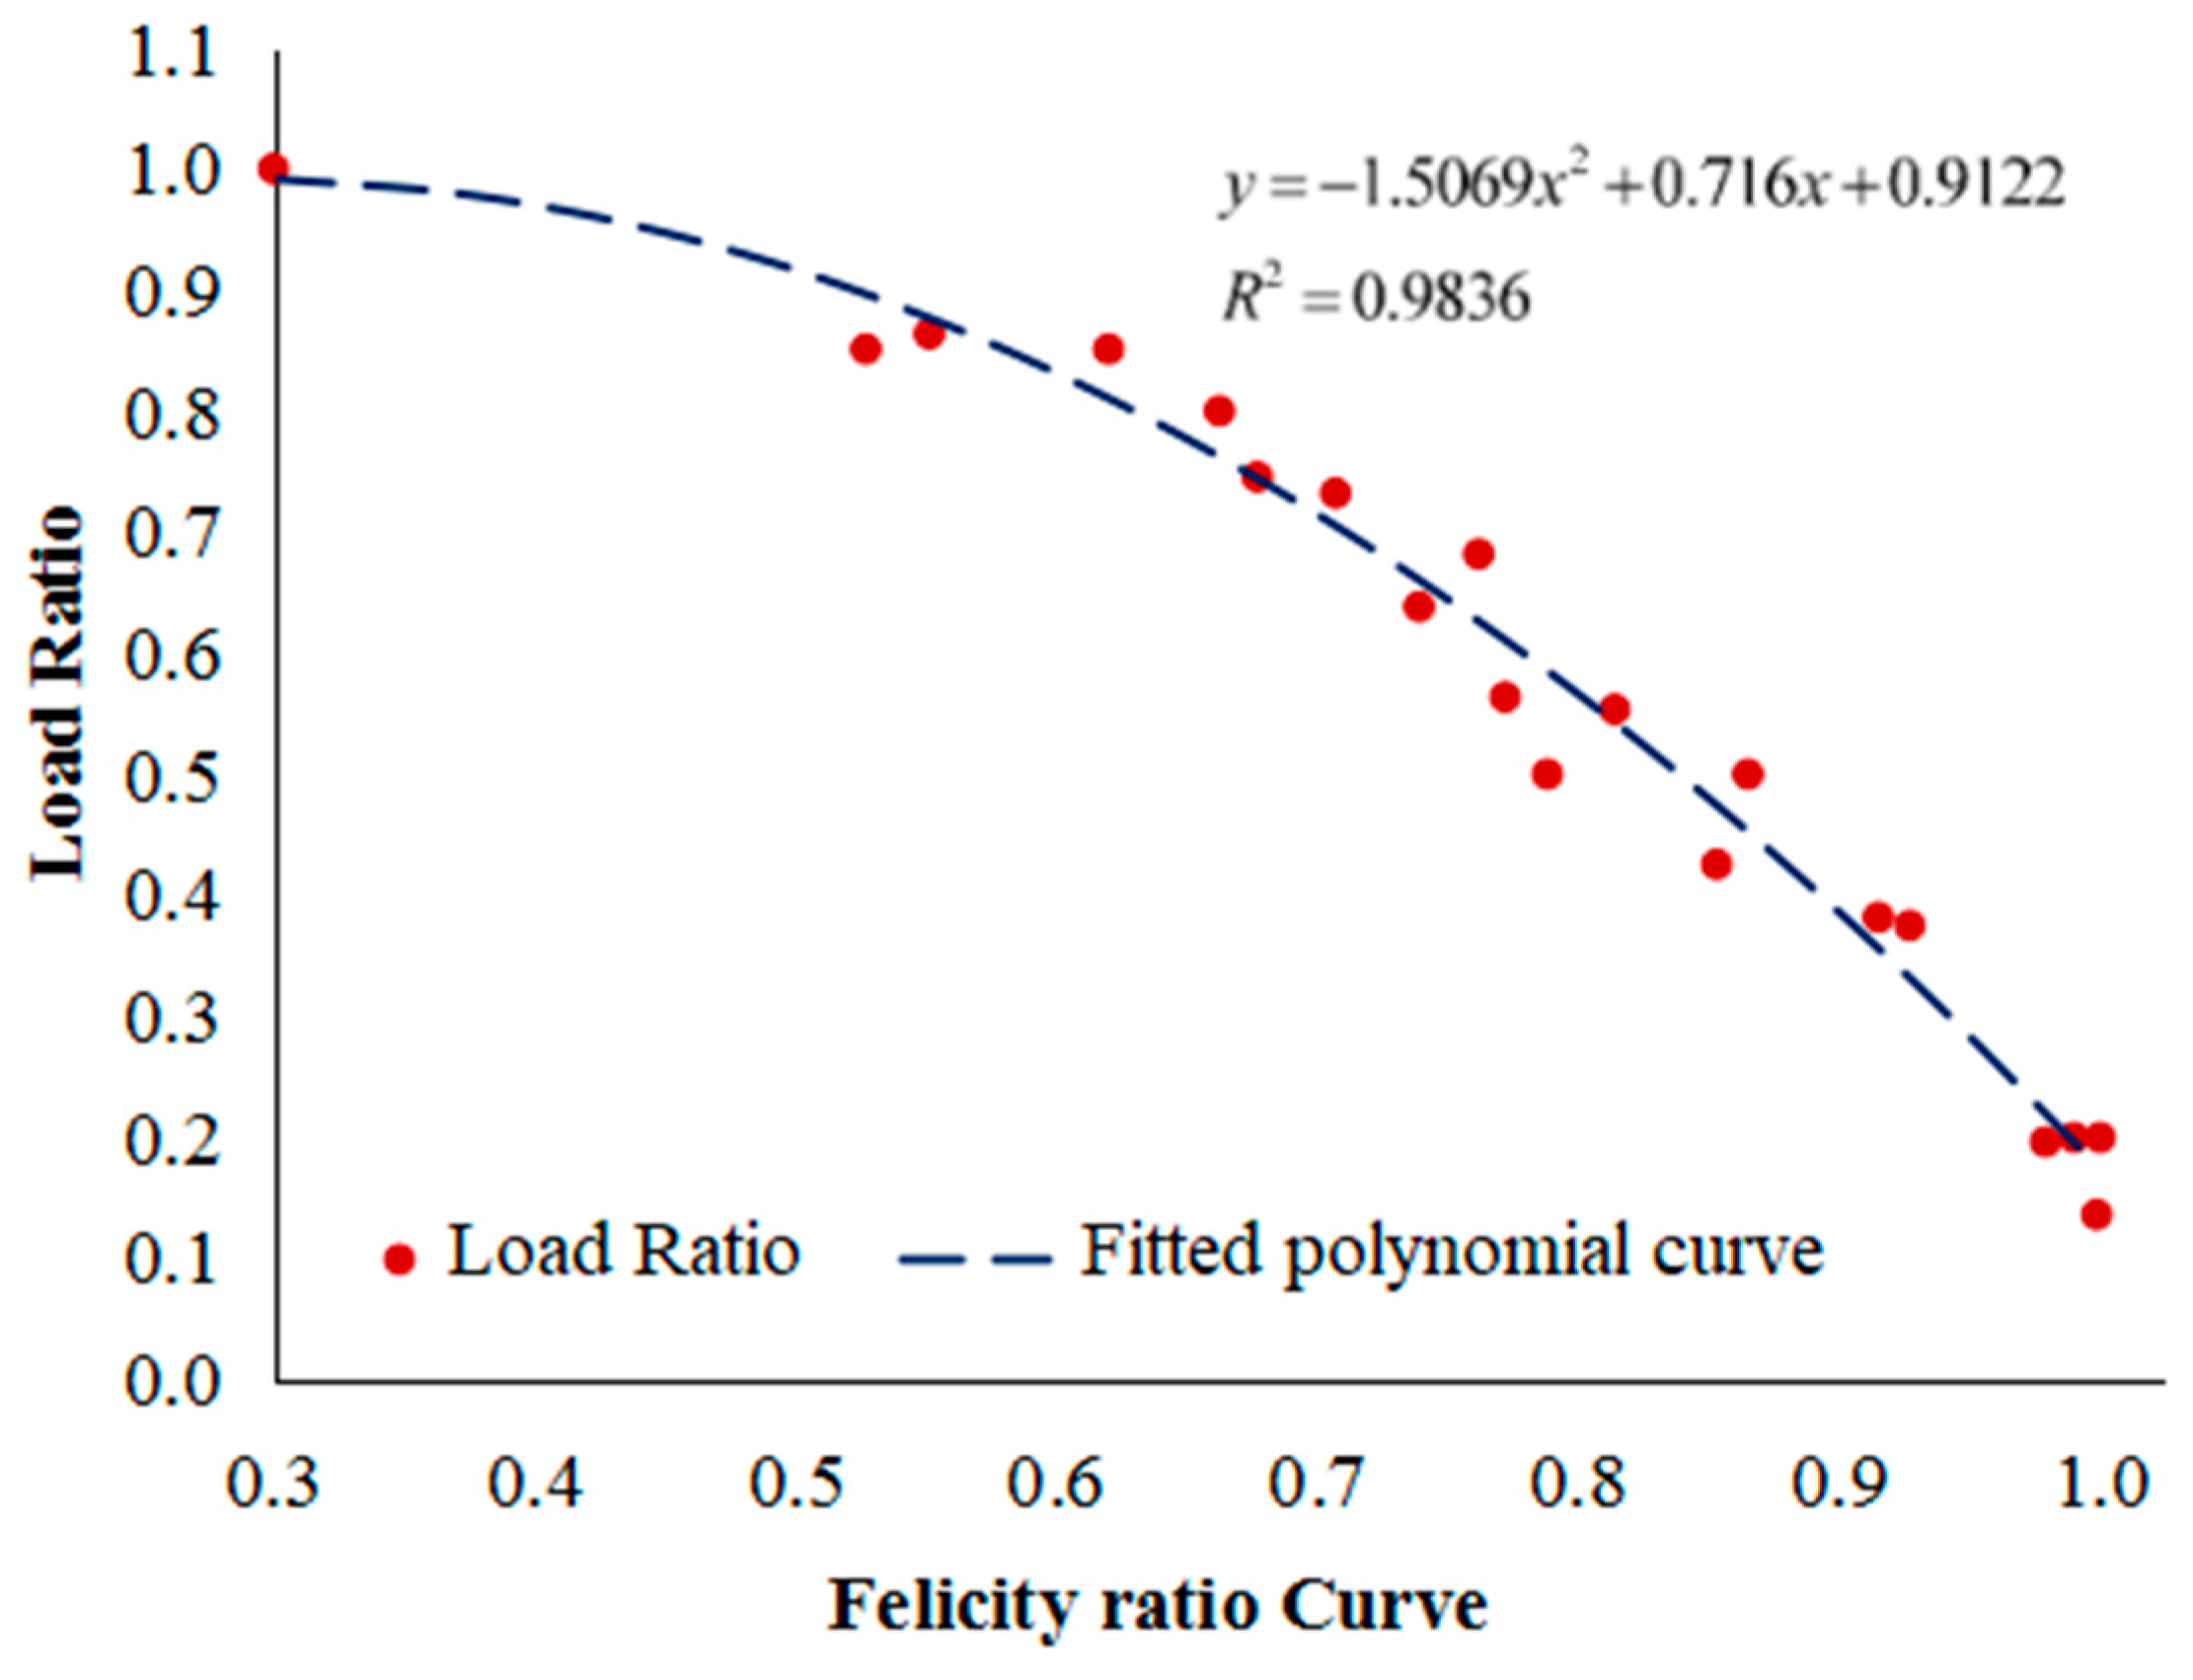
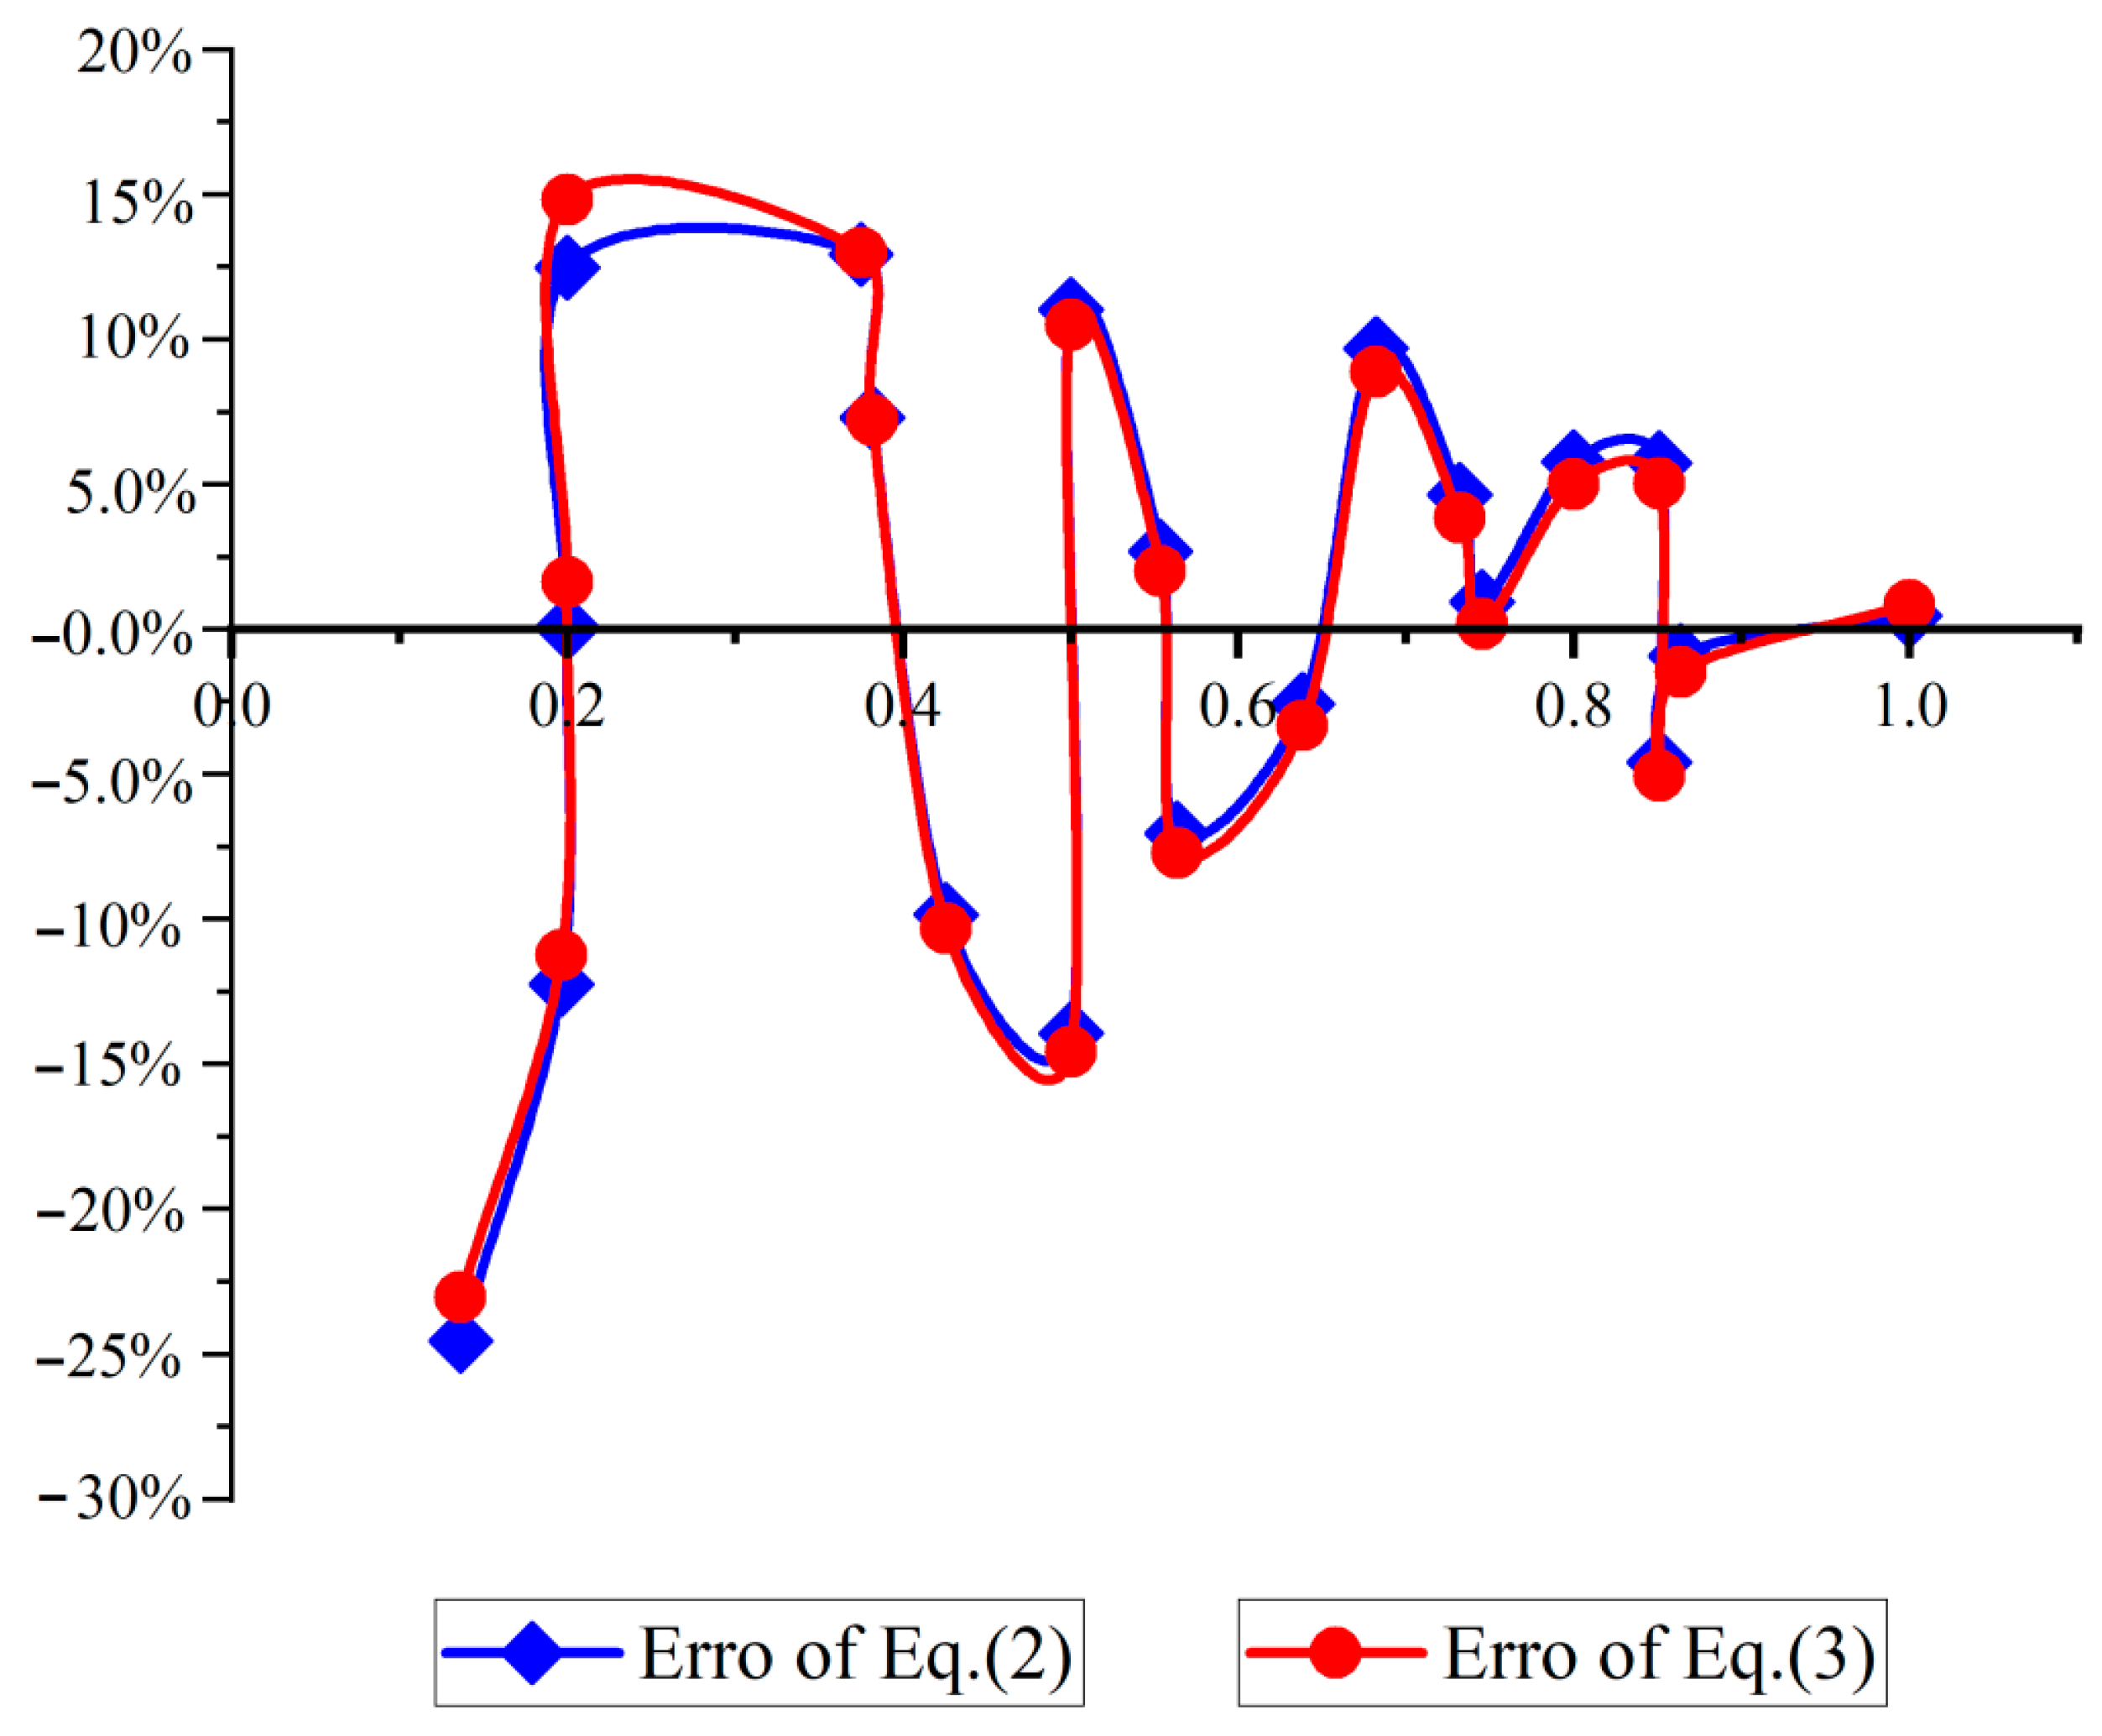
  • Based on the relationship between stress levels and the Felicity ratio, the ultimate bearing capacity function expression of reinforced concrete beams is established. Using the data obtained from the Kaiser effect experiment, the ultimate bearing capacity of reinforced concrete beams is evaluated by this function, and the error is within the acceptable range. The experimental results show that different fitted curves have little effect on the final bearing capacity evaluation value when the sample data are different and the average of multiple experimental evaluations can effectively lower the error. Hence, it is also feasible to evaluate the flexural bearing capacity of RC beams with the fitting function of the load ratio–Felicity ratio curve. This method provides a new way to evaluate the ultimate bearing capacity of reinforced concrete beams in bridges and buildings by using the Kaiser effect. However, due to the number of experiments, this method needs further research. In particular, it is necessary to determine the coefficient range of each parameter in the function through a large number of experiments.

Author Contributions

Conceptualization, M.L., L.L. and Y.L.; Methodology, Y.X. and A.J.; Validation, M.L. and L.L.; Formal analysis, H.W. and P.L.; Investigation, Y.X. and Y.L.; Resources, Y.X. and H.W.; Data curation, P.Z. and A.J.; Writing—original draft, M.L., P.L. and Y.L.; Writing—review & editing, P.Z.; Supervision, H.W.; Funding acquisition, Y.X. All authors have read and agreed to the published version of the manuscript.

Funding

The “3-3-3 Talents Project” funding project of Hebei Department of Human Resources and Social Security, China (No. A202001016), the Science and Technology Project of Hebei Education Department, China (No. QN2020440 and No. 2022QNJS07) and Hebei Province construction science and technology research project, China (No. 2021–2050).

Data Availability Statement

The data used to support the findings of this study are available from the corresponding author upon request.

Conflicts of Interest

The authors declare no conflict of interest.

References

  1. Wang, F.; Wu, H.Y.; Zhao, R.X. Causes and Lessons of Bridge Collapse Accidents in Past Three Years at Home and Abroad. Urban Roads Bridges Flood Control 2020, 12, 73–76. [Google Scholar] [CrossRef]
  2. Wang, Y. Damage Determination of Pre-Stressed Reinforced Concrete Beam Based on the Acoustic Emission Detection Technology. Master’s thesis, Jiangsu University, Jiangsu, China, 2016. [Google Scholar]
  3. Editorial Board of “Training Materials for Qualification Certification of Nondestructive Testing Personnel of Science, Technology and Industry for National Defense of China”. Acoustic Emission Detection; China Machine Press: Beijing, China, 2005. [Google Scholar]
  4. American Society for Testing Materials Standard E1316; Standard Terminology for Nondestructive Examinations; American Society for Testing Materials: West Conshohocken, PA, USA, 2011.
  5. Kunihisa, K. Application of Acoustic Emission (AE) Technology; Feng, X., Translator; Metallurgical Industry Press: Beijing, China, 1996. [Google Scholar]
  6. Kaiser, J. A Study of Acoustic Phenomena in Tensile Test; Technische Hochschule München: Munich, Germany, 1953. [Google Scholar]
  7. Wang, J.G. Study on Acoustic Emission Energy Characteristics of Reinforced Concrete Beams during Flexural Failure. Master’s thesis, Yangzhou University, Yangzhou, China, 2021. [Google Scholar]
  8. Verstrynge, E.; Van Steen, C.; Vandecruys, E.; Martine, W. Steel corrosion damage monitoring in reinforced concrete structures with the acoustic emission technique: A review. Constr. Build. Mater. 2022, 349, 128732. [Google Scholar] [CrossRef]
  9. Zhao, K.; Xiang, W.B.; Zeng, P.; Yang, X.D.; Wu, W.K.; Gong, C. Research status and prospect of Kaiser effect in rock acoustic emission. Met. Min. 2021, 50, 94–105. [Google Scholar] [CrossRef]
  10. Liu, T.; Mao, H.L.; Huang, Z.F.; Mao, H.Y. Chaotic characteristics of Kaiser effect of metal acoustic emission. J. Vib. Shock 2017, 36, 50–54. [Google Scholar] [CrossRef]
  11. Rusch, H. Physical problems in testing of concrete. Zement-Kalk-Gips 1959, 12, 15–25. [Google Scholar]
  12. McCabe, W.M.; Koerner, R.M.; Lord, A.E. Acoustic emission behavior of concrete laboratory specimens. ACI J. 1976, 73, 255–260. [Google Scholar]
  13. Carol, K.S. Comparison of acoustic emission activity in reinforced and prestressed concrete beams under bending. Constr. Build. Mater. 1997, 11, 189–194. [Google Scholar]
  14. Ji, H.G.; Li, Z.D. Experimental study on the relationship between Felicity effect and Kaiser Effect in concrete material. Appl. Acoust. 1996, 16, 30–33. [Google Scholar]
  15. Bu, J.W.; Xu, H.Y.; Wu, X.Y.; Chen, X.D. Experimental study on fracture properties of dam concrete under post-peak cyclic loading based on DIC and acoustic emission techniques. Fatigue Fract. Eng. Mater. Struct. 2022, 45, 2646–2661. [Google Scholar] [CrossRef]
  16. Wu, S.X.; Zhang, S.X.; Shen, D.J. An experimental study on Kaiser effect of acoustic emission in concrete under uniaxial tension loading. J. Civ. Eng. 2008, 41, 31–39. [Google Scholar]
  17. Wang, B.L.; Yan, S.R.; Huang, T.Y.; Chu, F.M. Acoustic emission characteristics and Kaiser effect of recycled concrete. Nondestruct. Test. 2022, 4, 40–44+85. [Google Scholar] [CrossRef]
  18. Yu, J.; Pi, Y.J.; Qin, Y.J. Acoustics emission characteristics of damage of recycled aggregate concrete under cyclic loading. Mater. Rep. 2021, 35, 13011–13017. [Google Scholar]
  19. Li, Y.L.; Chen, J.H.; Wen, L.F.; Li, K.P. Study of the damage evolution of concrete with different initial defect rates under uniaxial compression with acoustic emission technology. Adv. Cem. Res. 2021, 12, 5871. [Google Scholar] [CrossRef]
  20. Chen, Z.G. Damage Identification and Deterioration Evaluation of RC Based on Acoustic Emission Technology. Ph.D. thesis, Zhejiang University of China, Hangzhou, China, 2018. [Google Scholar]
  21. Vidya Sagar, R.; Raghu Prasad, B.K.; Singh, R.K. Kaiser effect observation in reinforced concrete structures and its use for damage assessment. Arch. Civ. Mech. Eng. 2015, 15, 548–557. [Google Scholar] [CrossRef]
  22. Su, M.; Gu, A.J.; Wang, J.G. Study on acoustic emission characteristics and ba-value of concrete beams during failure. J. Yangzhou Univ. (Nat. Sci. Ed.) 2021, 24, 55–62+68. [Google Scholar] [CrossRef]
  23. Ohtsu, M.; Uchida, M.; Okamoto, T.; Yuyama, S. Damage assessment of reinforced concrete beams qualified by acoustic emission. Struct. J. 2002, 99, 411–417. [Google Scholar]
  24. Otsuka, K.; Date, H. Fracture process zone in concrete tension specimen. Eng. Fract. Mech. 2000, 65, 111–131. [Google Scholar] [CrossRef]
  25. Nair, A.; Cai, C.S. Acoustic emission monitoring of bridges: Review and case studies. Eng. Struct. 2010, 32, 1704–1714. [Google Scholar] [CrossRef]
  26. Ge, R.D.; Liu, M.J.; Zhao, Y.L. Determination of Kaiser point in reinforced concrete beam under cyclic loading. J. Guilin Univ. Technol. 2011, 31, 554–557. [Google Scholar]
  27. Lai, Y.S.; Xiong, Y.; Cheng, L.F. Study of characteristics of acoustic emission during entire loading tests of concrete and its application. J. Build. Mater. 2015, 18, 380–386. [Google Scholar]
  28. Chen, S.D.; Shi, Q.Y.; Yang, F.; Cao, L.L.; Yang, B.X. Study of injury classification of prestressed concrete beams. Sci. Technol. Eng. 2014, 14, 110–117. [Google Scholar]
  29. Liu, J.D.; Fan, X.Q.; Ge, F.; Yin, Y.Y. Fracture characteristics analysis of FRP reinforced concrete based on acoustic emission (AE). Mag. Concr. Res. 2022, 75, 541–555. [Google Scholar] [CrossRef]
  30. Jiao, H.D. A Study of the Acoustic Emission Monitoring and the Fracture Mechanism as Demonstrated in the Damaging Process of Reinforced Concrete. Master’s thesis, Jinan University, Ninan, China, 2015. [Google Scholar]
Figure 1. Design of the concrete experimental beam.
Buildings 13 02003 g001
Figure 2. Routing layout of CT.
Buildings 13 02003 g002
Figure 3. Sensor location.
Buildings 13 02003 g003
Figure 4. Experimental instrument and loading device.
Buildings 13 02003 g004
Figure 5. Schematic of the loading mode.
Buildings 13 02003 g005
Figure 6. Destruction of beams in the experiments.
Buildings 13 02003 g006
Figure 7. Function of the experimental data fitting curve: (a) cumulative hit count and (b) cumulative ringing count.
Buildings 13 02003 g007
Figure 8. Corrected Kaiser points using difference curves: (a) cumulative curve of hit counts and (b) cumulative curve of ringing counts.
Buildings 13 02003 g008
Figure 9. Load ratio–Felicity ratio curve.
Buildings 13 02003 g009
Figure 10. Difference comparison of evaluated values of the ultimate bearing capacity of varying sample data.
Buildings 13 02003 g010
Table 1. Mix proportions of the concrete.
Portland Cement
(32.5)
Fine Aggregate
(0.25–0.5 Mm)
Coarse Aggregate
(4.5–10 Mm)
Water
11.572.790.5
Table 2. Experimental Loading Procedure.
Specimen Step 1 (kN)Step 2 (kN)Step 3 (kN)Step 4 (kN)Step 5 (kN)Step 6 (kN)Step 7 (kN)
L1-beam13040474236//
L2-beam22040474038//
L3-beam311213141563936
L4-beam411213141555250
Table 3. Comparison of the Kaiser Points Determined Using Different Methods.
Initial ValueParameterSectionKaiser PointFelicity Ratio
760 kNRinging counts[640, 880]785.670.982
Hit counts 790.560.988
790 kNRinging counts[670, 910]785.670.982
Hit counts 786.110.983
800 kNRinging counts[680, 920]785.670.982
Hit counts 786.110.983
820 kNRinging counts[700, 940]785.670.982
Hit counts 786.110.983
Literature [26]777.780.972
Table 4. Measurement of the Kaiser Points and Felicity Ratio.
Load StepStep 2Step 3Step 4Step 5
L1-beam1Kaiser point (kN)21.41623.809//
Felicity ratio0.7140.595//
L2-beam2Kaiser point (kN)16.56320.091//
Felicity ratio0.8280.502//
L3-beam3Kaiser point (kN)10.39718.69720.04427.970
Felicity ratio0.9650.8900.7470.682
L4-beam4Kaiser point (kN)10.49818.94324.46126.733
Felicity ratio0.9540.9020.7890.652
Table 5. Evaluation Values and Errors of Ultimate Bearing Capacity.
Data
Sources
Historical Maximum (kN)Felicity RatioLoad RatioCalculated Value of Load RatioBearing Capacity (kN)Calculated Bearing Capacity (kN)Error
L1-beam1200.8280.4260.4724742.378−9.83%
400.5950.8510.80549.7065.76%
L2-beam2300.7140.6380.6554745.787−2.58%
400.5020.8510.89244.849−4.58%
L3-beam3110.9650.2000.2005555.0340.06%
210.8900.3820.35659.0187.31%
310.7470.5640.60651.139−7.02%
410.6520.7450.73855.5220.95%
550.2751.0000.99555.2690.49%
L4-beam4110.9540.1960.2245649.149−12.23%
210.9020.3750.33263.25112.95%
310.7890.5540.53957.5092.69%
410.6820.7320.70058.6044.65%
Literature [26]11.40.9740.1360.18183.663.079−24.55%
26.60.7630.3180.58145.784−45.23%
41.80.7630.5000.58171.946−13.94%
570.7370.6820.62291.6959.68%
72.20.5260.8640.87282.834−0.92%
Literature [30]80.9750.2000.1784044.99412.48%
200.8400.5000.45044.40811.02%
320.6380.8000.75642.3155.79%
Table 6. Error of Average Ultimate Bearing Capacity.
Data SourcesL1-Beam1L2-Beam2L3-Beam3L4-Beam4Literature [26]Literature [30]
Calculated bearing capacity (kN)46.0445.3255.2057.1377.3943.90
Bearing capacity (kN)4747555683.640
Error−2.04%−3.58%0.36%2.02%−7.43%9.76%
Disclaimer/Publisher’s Note: The statements, opinions and data contained in all publications are solely those of the individual author(s) and contributor(s) and not of MDPI and/or the editor(s). MDPI and/or the editor(s) disclaim responsibility for any injury to people or property resulting from any ideas, methods, instructions or products referred to in the content.

