Article

Predictive Model of Temperature Regimes of a Concrete Gravity Dam during Construction: Reducing Cracking Risks

by
Nikolai Alekseevich Aniskin
1 and
Trong Chuc Nguyen
2,*
1
Institute of Hydraulic Engineering and Power Plant Construction, Moscow State University of Civil Engineering (National Research University), 129337 Moscow, Russia
2
Institute of Technics Special Engineering, Le Quy Don Technical University, Hanoi 10000, Vietnam
*
Author to whom correspondence should be addressed.
Buildings 2023, 13(8), 1954; https://doi.org/10.3390/buildings13081954
Submission received: 5 July 2023 / Revised: 28 July 2023 / Accepted: 28 July 2023 / Published: 31 July 2023
(This article belongs to the Collection Advanced Concrete Structures in Civil Engineering)

Abstract

:
In consideration of the mild climatic conditions of North Vietnam with average monthly air temperatures ranging from 15 °C in winter to 26.5 °C, this study analyzes the regulation of the temperature regime and thermally stressed state of a concrete gravity dam made of rolled concrete. Despite the favorable weather conditions, there remains a risk of thermal cracking, necessitating the presentation of crack-formation models from different countries to assess and mitigate the risk of cracking through the adjustment of construction conditions. The study has developed a predictive model for the temperature regime and thermally stressed state of a layer-by-layer concrete mass under the given construction conditions using the factor-analysis method. Regression equations were then derived from the factorial experiment to quantify the responses of the maximum temperature and maximum stress in the concrete mass. The numerical finite-element method using the Midas Civil software package was employed to calculate the temperature regime and thermally stressed state of the concrete mass. To validate the mathematical predictive model, it was tested on the Ban Lai gravity dam in North Vietnam. The dam, which was constructed from rolled concrete and stands 56 m tall, was selected as the object in this practical example. The results obtained from applying the predictive model were compared to the results obtained from numerical calculations of the dam under construction, as well as the findings from field observations. These results were found to be in good agreement, indicating the effectiveness of the predictive model. Furthermore, an evaluation of the potential for temperature cracking of the concrete during the construction period was conducted.

1. Introduction

Concrete gravity dams are widely used water structures worldwide due to their reliability and ease of construction. Temperature is a key factor that affects these structures during both construction and operation. This has been noted in various studies [1,2,3].
The hydration of cement during the construction process releases a substantial amount of heat, as indicated by several studies [2,3]. This heat causes compressive stresses in the newly formed concrete. However, as the temperature decreases, the concrete shrinks, causing tensile stresses [3,4]. If the tensile stresses exceed the concrete’s capacity, cracks can form, leading to a reduction in the structure’s bearing capacity, material leaching, and an increase in seepage flow.
The challenge of preventing thermal cracking emerged during the construction of large concrete dams. In an attempt to minimize costs and reduce the risk of thermal cracking, rolled concrete technology was developed for dam construction. This technology has gained popularity in recent times, as noted in various reports [5]. Nevertheless, even for dams constructed using this method, thermal cracking remains a significant challenge [6].
Currently, the problem of thermal cracking in concrete dams has not been entirely solved, as evidenced by recent observations of crack formation in modern dams [7,8,9]. However, practical experience has resulted in the development of several classifications of temperature cracks in massive concrete structures. For instance, cracks can be categorized as either surface or internal [10], based on their location.
Depending on the causes of cracks during the construction of a concrete dam, the following classifications were proposed [10]:
(i)
Cracks induced by temperature in an exposed concrete block arise from a considerable temperature differential between the concrete’s inner and surface zones. This is due to the rapid cooling of the outer surfaces of the block, especially during winter concreting, or the intense exothermic heating of the central zone, as observed during summer concreting;
(ii)
Temperature-induced cracking in overlapping concrete blocks arises from a significant temperature disparity between cooled previously laid concrete and newly laid concrete that releases substantial heat;
(iii)
Cracking induced by the temperature in high-speed concreting results from the emergence of an uneven temperature field between the cooling side surfaces and the internal zones of the concrete that produce substantial temperature gradients;
(iv)
Temperature-induced cracks may develop in aged concrete masses owing to the temperature gap between the cooled inner zone of the concrete and the side surface that experiences external heat discharge.
Requirements for temperature regimes and thermal stress control have been formulated based on years of experience constructing concrete dams and other massive structures. Standards have been developed in countries, including Russia, to regulate the formation of thermal cracks during construction, with each standard tailored to the relevant climatic conditions and construction techniques. A straightforward approach to measuring temperature differences is widely used, enabling field measurements to monitor the temperature regime during construction. Processes can be adjusted to reduce the likelihood of cracking. The temperature difference ΔT between the concrete surface and the central zone is typically limited to 20 °C, irrespective of the concrete type or structure zone [9].
Several regulatory documents in Russia prescribe specific requirements for the temperature difference based on the construction zone and concreting technique [11]. Based on standard SP 357.1325800.2017 [12], the temperature difference ΔT in the contact zone should not exceed 16–18 °C when using long concrete blocks, and 20–27 °C when using columnar sections. The height of the contact zone from the base is equal to 0.2 of the maximum length of the concrete block laid on the base of the structure. In the free zone (above the contact zone), the temperature difference should not exceed 20–25 °C [12].
International construction standards also outline similar requirements for the temperature regime of constructed concrete masses. In the Vietnamese standards (Vietnamese standard 305.2004 “Massive concrete—production and control during construction”), to prevent cracking, two conditions must be met. The first limits the temperature difference between the core of the array and its surface: ΔT < 20 °C. According to the second condition, the temperature gradient is limited. It should not be more than 50 °C/m [13]. Chinese norms for the construction of concrete dams [1] limit the temperature differences between the central zone and the surface of the concrete mass based on its size (Table 1).
In accordance with the criterion for assessing crack formation according to the CIRIA C600 standard (Great Britain), the maximum temperature difference between the inner zone of the concrete mass and its outer surface ΔTmax is determined by the Formula (1) [14]:
Δ T max   = 3.7 ε α ,
where: ε —ultimate tensile strength of early age concrete; α —coefficient of thermal expansion of concrete.
The average values of the parameters included in Formula (1) are equal: α = 13 × 10−6 and ε = 70 × 10−6. After substituting the values in Formula (1), we get ΔTmax = 19.9 °C ≈ 20 °C which practically coincides with the conditions of Russian, Vietnamese, and Chinese standards.
Various criteria have been proposed by foreign and Russian experts for thermal cracking by comparing tensile stresses in the construction with acceptable values. Such criteria consider several operating factors to assess the likelihood of cracks appearing in the structure under construction.
In the practice of designing and erecting concrete structures, the well-known criterion of thermal crack resistance is used, based on the theory of concrete strength [10]:
σ * τ E τ ε n p k
where: σ * τ —maximum tensile stress in the concrete mass at the time τ; E(τ)—modulus of elasticity of concrete at a point in time τ; ε n p —ultimate elongation (elongation) of concrete without creep (obtained from conventional tensile tests); and k—safety factor [10].
When laying a massive concrete block, the value of ε’pr depends on many factors: the composition of concrete, its age, homogeneity, stress state, load duration, loading speed, etc. [10]. As a first approximation, one can take ε’пp = (7–10) × 10−5.
SP 41.13330.2012 (suggested by Vasiliev) [11] presents the formulation of the criterion used to assess thermal crack resistance:
σ(τ) ≤ γb3 γb6 εlim φ(τ)Eb(τ)
where: σ(τ)—temperature stresses at the time; γb6 = 1.15—coefficient of working conditions for massive structures; γb3—the coefficient of working conditions for concrete structures considers the impact of deformation gradient across the section on the tensile strength of concrete; εlim—ultimate tensile strength of concrete, taken according to [11]; ϕ(τ)—coefficient taking into account the dependence of εlim on the age of concrete, determined by [11]; and E(τ)—modulus of elasticity of concrete at age τ.
In foreign construction practices, comparable criteria are used to evaluate the potential thermal cracking of massive concrete structures. A proposed method in [1] involves using an expression similar to Equation (3) for determining the possibility of crack formation. However, instead of relying on the ultimate tensile strength of concrete, the expression considers the temperature difference ΔT. To prevent thermal cracking, the thermal tensile stresses σ(τ) should not surpass the admissible value.
σ(τ) ≤ R Kp E(τ) α ΔTRt/K
where: R—pinch factor; Kp—relaxation factor; E(τ)—modulus of elasticity of concrete at a point in time τ; α—coefficient of linear expansion of concrete (α~1.0 × 10⁻⁵); ΔT—temperature difference in the concrete mass; Rt—allowable tensile stress of concrete; and K—safety factor [1].
The cracking assessment of arrays in Japan relies on the cracking index, described as follows [15]:
I c r = f s p   τ f t   τ ,
where: Icr—thermal cracking index; ft(τ)—tensile strength corresponding to the “age” of the concrete τ; fsp(τ)—maximum tensile stress caused by the cement hydration process at a point in time τ [15].
The likelihood of cracking is assessed by determining the value of the thermal crack index, utilizing the criterion values outlined in Table 2 [15].
The temperature difference and thermal stress-state requirements are established based on the experience of constructing concrete structures and may not always account for various operational factors and process-specific features. Prior to implementation, the maximum temperatures, temperature differences, and resulting maximum temperature tensile stresses occurring within the concrete structure must be known. During the design phase, calculating these values can be achieved by solving problems related to determining the temperature regime and thermally stressed condition of a gravity dam. Such computations are challenging due to various factors that influence the temperature regime [16,17,18]. Numerical methods, such as the finite-element method (FEM), have been used to solve these complex, nonstationary problems [19,20,21,22,23], as offered by software systems like “Midas Civil”. These software systems enable the consideration of a large array of operational factors [24].
Over time, the list of measures aimed at preventing cracking and mitigating the formation of dangerous cracks has broadened, as evidenced by [4,5,14,15]. One of these measures involves lowering the cement consumption during construction to decrease the structure’s heat and mitigate the probability of thermal cracks [25,26]. Present-day measures focused on the supervision of temperature regimes during layer-by-layer concrete-mass construction can be classified into two main categories [25,26].
  • Optimization of concrete-mix composition (quantity and quality of cement, use of fly ash, slag, chemical additives, etc.);
  • The optimization of construction procedures, including the temperature monitoring of the concrete mixture, layer thickness selection, construction pace, and technology implementation, such as pipe cooling or surface insulation, can have a significant impact on reducing thermal cracks and improving overall structure quality.
Utilizing numerical modeling to examine the temperature regime’s formation in concrete gravity dams enables the incorporation of a wide range of factors and the ability to generate predictions of development. There is considerable academic research on creating predictive models for temperature regimes and thermally stressed states. Numerous researchers have contributed to this field, including those cited in [17,18,27,28]. As a general rule, these models examine specific structure and construction requirements.
The focus of this article is a newly developed mathematical model that forecasts the temperature regime of layer-by-layer concrete masses. This model can be used to identify the main factors that influence the temperature-related risks of construction, such as reaching maximum temperature values or encountering significant tensile stresses. The model also offers a solution for the inverse problem: it can predict the appropriate combination of factors based on a specified maximum temperature value. The model’s implementation allows for the selection of a favorable combination of the primary factors linked to temperature regimes, reducing the risk of developing cracks in the concrete structure. In contrast to previous studies, this work was conducted using the certified Midas Civil software package in a three-dimensional format [24]. The research considered the climatic conditions of Northern Vietnam and accounted for differing temperatures during construction, ranging from 26.5 °C for summer conditions to 17 °C and 5 °C for winter and mountainous regions, respectively. With several gravity-dam hydroelectric projects currently underway in the region, the problem’s significance is evident.

2. Materials and Methods

To solve the temperature issue, the primary differential equation of heat conduction theory with internal heat sources [1] is used as the foundation for computation.
x k x t x + y k y t y + z k z t z + q v = ρ c t t ,
where: kx, ky, and kz—coefficient of thermal diffusivity of the material in the direction of the coordinate axes ox, oy, and oz (kx = ky = kz = λ/cρ), m2/c; qv—the amount of heat generated by internal sources at a given point in time (for example, during cement hydration), W/m3; c—specific heat, kJ/kg.°C; ρ—concrete density, kg/m3; 2t—Laplace operator; and τ—hardening time of concrete, days.
To solve Equation (6), you need to know the initial and boundary conditions [1]: boundary condition of the 1st kind: determine the temperature known at any time; boundary condition of the 2nd kind: a heat flux is specified at the boundary of the body; boundary condition of the 3rd kind: the condition of heat exchange of the body with the environment:
λ t n = h t Π t c p ,
where: t1k and t2k—temperatures of the first and second bodies at the boundary of their contact, °C; λ1 and λ2—thermal conductivity coefficients of the first and second body, W/m·°C.
The heat released during cement hydration and concrete hardening is a critical factor to consider. The interaction between cement and water initiates the hydrolysis reaction of clinker minerals that release heat. The reaction rate and the amount of heat released are dependent upon the content and composition of the cement minerals. As concrete exhibits low thermal conductivity, the heat generated during hydration accumulates within the structure. Moreover, the rate of heat release is proportional to the surface area of heat dissipation to the concrete volume, leading to lower cooling rates in larger blocks than in smaller ones. The heat transfer process in a concrete block undergoing the cement-hydration and hardening processes is essentially an adiabatic process. The heat production resulting from the cement-hydration reaction is the energy source for subsequent heat exchange. The q value in Formula (6) corresponds to the heat source per unit volume.
The main factors affecting the heat release of concrete are [29]:
  • specific content of cement per unit volume of concrete mix;
  • type of cement (heat release depends on its chemical and mineralogical composition);
  • starting temperature of the concrete mixture;
  • cement-grinding fineness (the finer the grinding, the greater the specific surface area of the hydration process);
  • water-to-cement ratio (depending on the temperature of the concrete mixture, it can increase or decrease the rate of heat release);
  • the presence of additives in the composition of concrete (accelerators or retarders of the process).
Obtaining precise results from mathematical models for the temperature field formation in massive concrete structures requires a reliable determination of the heat released during cement hydration. In Russian practice, the method proposed by Zaporozhets [29] is widely accepted for evaluating cement heat release. The method has consistently proven accurate for determining the heat generated by cement hydration.
Q = Qmax ∙ [1 − (1 + At · τ)−1/m−1], kJ
where: Qmax—total heat release of concrete; At—coefficient characterizing the rate of heat release at temperature t; m—hydration reaction order; and τ—time elapsed since shutdown. This dependence was used in the calculations of the temperature regime.
The construction of a concrete gravity dam involves solving a nonstationary temperature problem to determine the temperature field and the thermal stress state at specific intervals of time (τ) with a defined time step (Δτ). During this process, the structure’s geometry changes as new blocks release heat due to cement hydration while heat transfer occurs. The computational domain surfaces also vary, with convective heat transfer considered on new surfaces in contact with air and heat conduction laws governing heat transfer over surfaces that move inside the structure. To simulate this stage-by-stage dam construction process using the Midas Civil software, the “birth and death of elements” technique was employed.
Figure 1 illustrates the scheme of using this technique in relation to a concrete mass erected in time (steps from i-1 to i + 1).
The construction process for a concrete dam begins with the laying of the first block at step i-1 (Figure 1a). At this stage, the block array is “birth” with specified thermal conductivity and its corresponding boundary conditions (i.e., convective heat transfer on the upper surface) established. Upon the further erection of the concrete mass at steps i and i + 1, new block arrays and their boundary conditions are “born” on the upper boundaries of the growing area. Conversely, boundary conditions inside the area where construction has already occurred are “dead.” Once an element has passed the “birth” stage, it cannot return to the “death” operation in subsequent steps and both stages cannot operate simultaneously. With this technology, calculations can be performed on a single grid while configuring the structure at each step for accurate results.
When influencing factors affect an array of low-cement concrete, stresses and plastic deformations may occur and accumulate over time, leading to a thermally stressed state. In accordance with the theory of elasticity, the stresses and strains present before the material transitions to the plastic stage are related based on a specific dependence.
σ i j = D i j k l · ε k l
where: σ i j stress tensor components, ε k l strain tensor components, and D i j k l elasticity tensor components.
When entering the plastic region, the relationship between stresses and strains occurs based on the law of plastic fluidity, which assumes that under any loading, the strain comprises both elastic and plastic components.
d ε i j e + d ε i j p = d ε i j ,
where: d ε i j e elastic strain component, d ε i j p plastic strain component.
The dependence of N.Kh. Harutyunyan was used to determine the modulus of elasticity based on the maturity of the concrete.
E t = E 0 · 1 ξ · e β t
where: E 0 —maximum value of the modulus of elasticity for hardened concrete, MPa, and β , ξ experimentally determined parameters.
To determine the temperature regime and thermally stressed state of structures, accounting for internal and environmental factors, numerical methods in the Midas Civil software package [24] were utilized. Prior to this, some test problems were solved and a numerical simulation of a full-scale experiment was conducted, demonstrating strong agreement between the results.

3. Results

By employing a mathematical model, it has become feasible to foresee the temperature fluctuations of a concrete gravity dam while under construction. Furthermore, a thorough examination was conducted on the effects of various factors, not only on the temperature but also on the thermal stress conditions during construction. The study also encompasses an evaluation of technological interventions, such as the implementation of a pipe cooling system [30] and the thermal insulation of concrete-block surfaces [31].

Predictive Model of the Temperature Regime of a Layer-by-Layer Concrete Mass

This paper outlines the development of a mathematical model aimed at predicting the temperature regime during the construction of a concrete pillar on a foundation mass. The study incorporates the impact of air temperature, considering three cases that are typical of the Northern Vietnam climatic zone.
To create a mathematical model, the factor-analysis approach was adopted, as described in [32]. The investigation was performed through a full factorial experiment of type 2n, with the number of considered factors being n = 5. For this particular plan, the total number of experiments required was N = 25 = 32. The response function was obtained in the format of a regression equation, which is presented as follows [32].
η = β0 X0 + β1 X1 + β2 X2 + β3 X3 + β4 X4 + β5 X5 + β12 X1 X2 + β13 X1 X3 + … + β123 X1 X2 X3 +
β124 X1X2X4 + …+β234 X2X3X4 + … +β345 X3X4X5 + … + β12345 X1X2 X3 X4 X5
The proposed model takes into account the following factors (parameters) (Table 3) by material:
-
consumption of binder (kG/m3) used for the preparation of concrete (cement or cement with additives);
-
maximum (total) heat release of 1 kg of binder used for the preparation of concrete (cement or cement with additives).
According to the technology of laying concrete:
-
thickness and length of the laid layer of concrete during layered construction;
-
temperature of the concrete mix being laid;
-
laying technologies: rolled concrete and vibrated concrete.
By external temperature influences:
-
air temperature for three variants in relation to the climatic features of North Vietnam (from 26.5 °C for summer conditions to 17 °C and 5 °C for winter and mountainous regions).
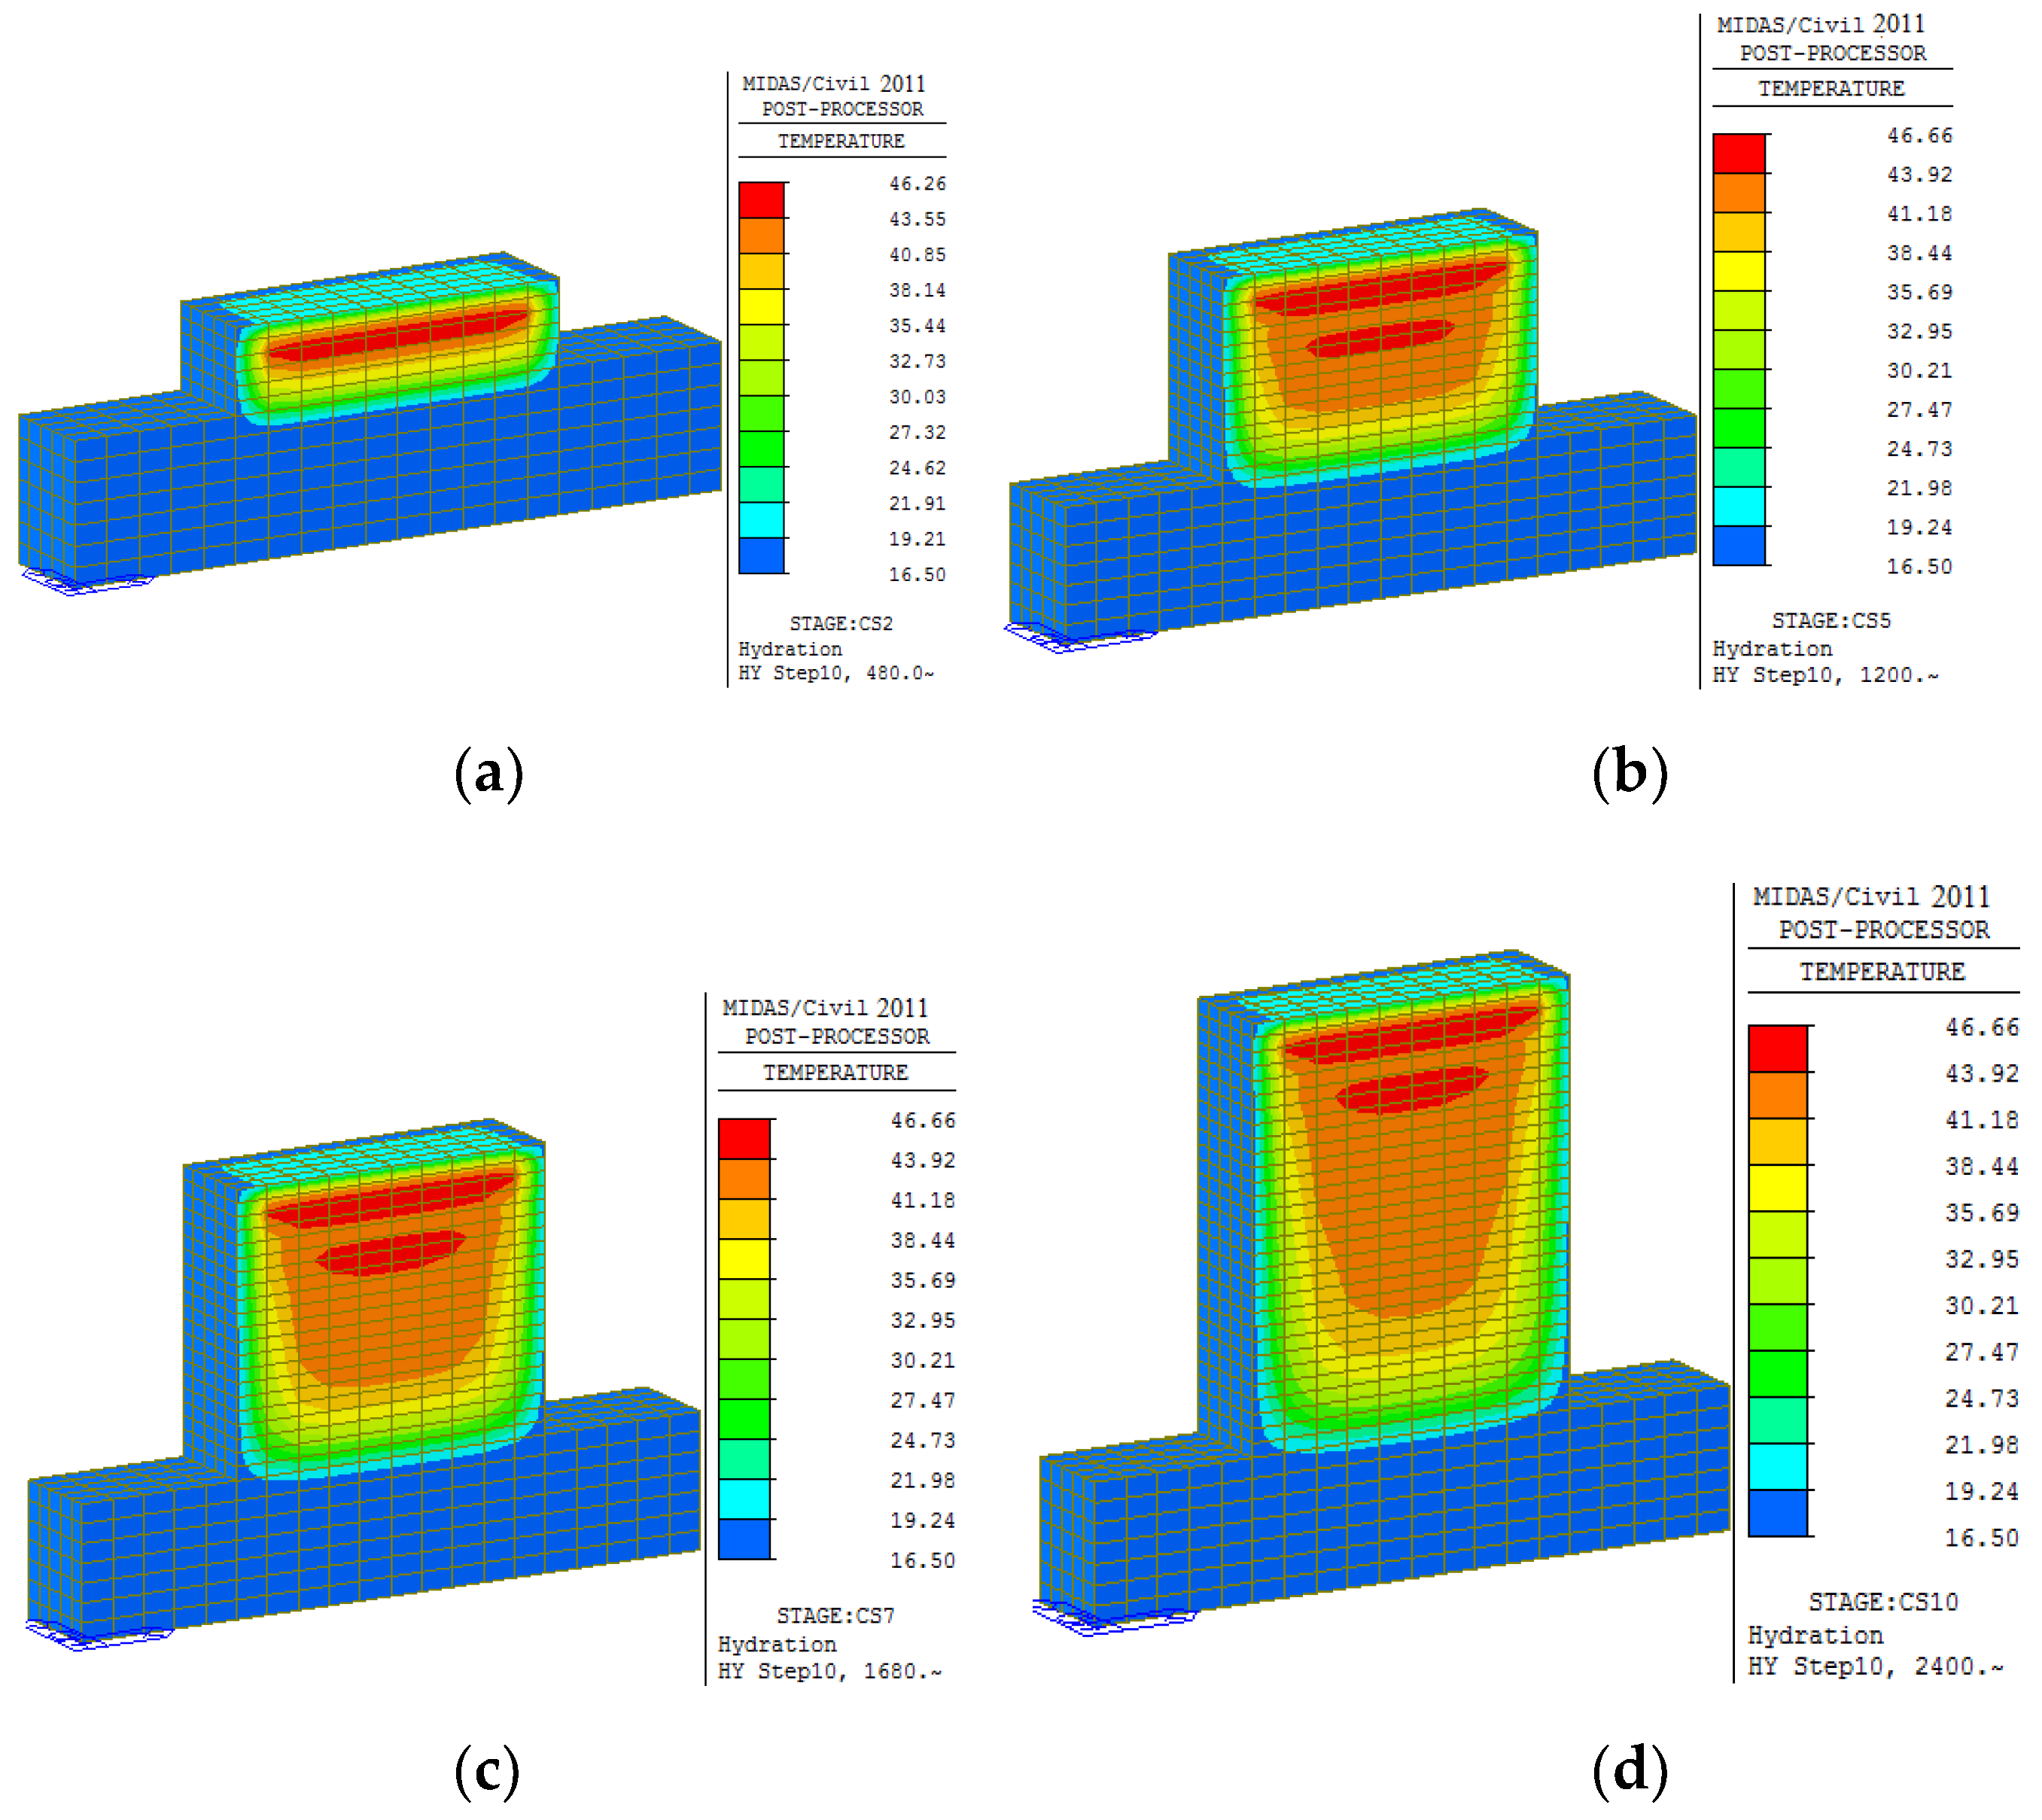
The maximum temperature values observed within the inner region of the concrete mass were used as the response metric. The temperature calculations were executed based on the experimental plan, aided by the Midas Civil software package, which allowed for a determination of the corresponding response values. Figure 2 illustrates the temperature distribution within the considered array while calculating one of the cases.
As a result of processing the results of the factorial experiment, response regression equations were obtained for three variants of the average annual air temperature when laying according to the technology of rolled concrete (Table 4) and vibrated concrete (Table 5).
Figure 2 shows the results of the temperature calculation of the concrete pillar being erected. Since an array of considerable length (from 10 to 40 m) is considered, it can be argued that the temperature inside it is the maximum and close to the conditions of the adiabatic process. The outflow of the released heat occurs through the surfaces of the array. A similar picture will take place in the case of the construction of a large array of another geometric shape (for example, a massive gravity dam). This makes it possible to use the resulting model for large arrays with a geometry different from the column.
If the concreting process is considered at an air temperature different from the values considered, but located in the interval between them, the interpolation method can be used. For example, if the temperature value is 20 °C, that is, it is in the range between 26.5 and 17 ° C, the maximum temperature in the concrete array is determined by the known values of the factors for these boundary temperature values; then, the value at 20 ° C is determined by interpolation. Since the temperature-change interval is insignificant, this technique gives values close to the actual ones. This has been verified by verification calculations.
The consumption of cement (X1), the maximum heat release of cement (X3), and the temperature of the laid concrete (X5) have been identified as the most crucial factors. The impact of factors X2 and X4 on the maximum temperature is moderate when compared to X1, X3, and X5. Their cumulative effect on the maximum temperature value can be approximately estimated between (1.5–2.9) °C.
Unlike the rolled concrete variant (Table 4), the thickness of the laid layer (X2) has a greater impact on the maximum temperature value for vibrated concrete (Table 5).
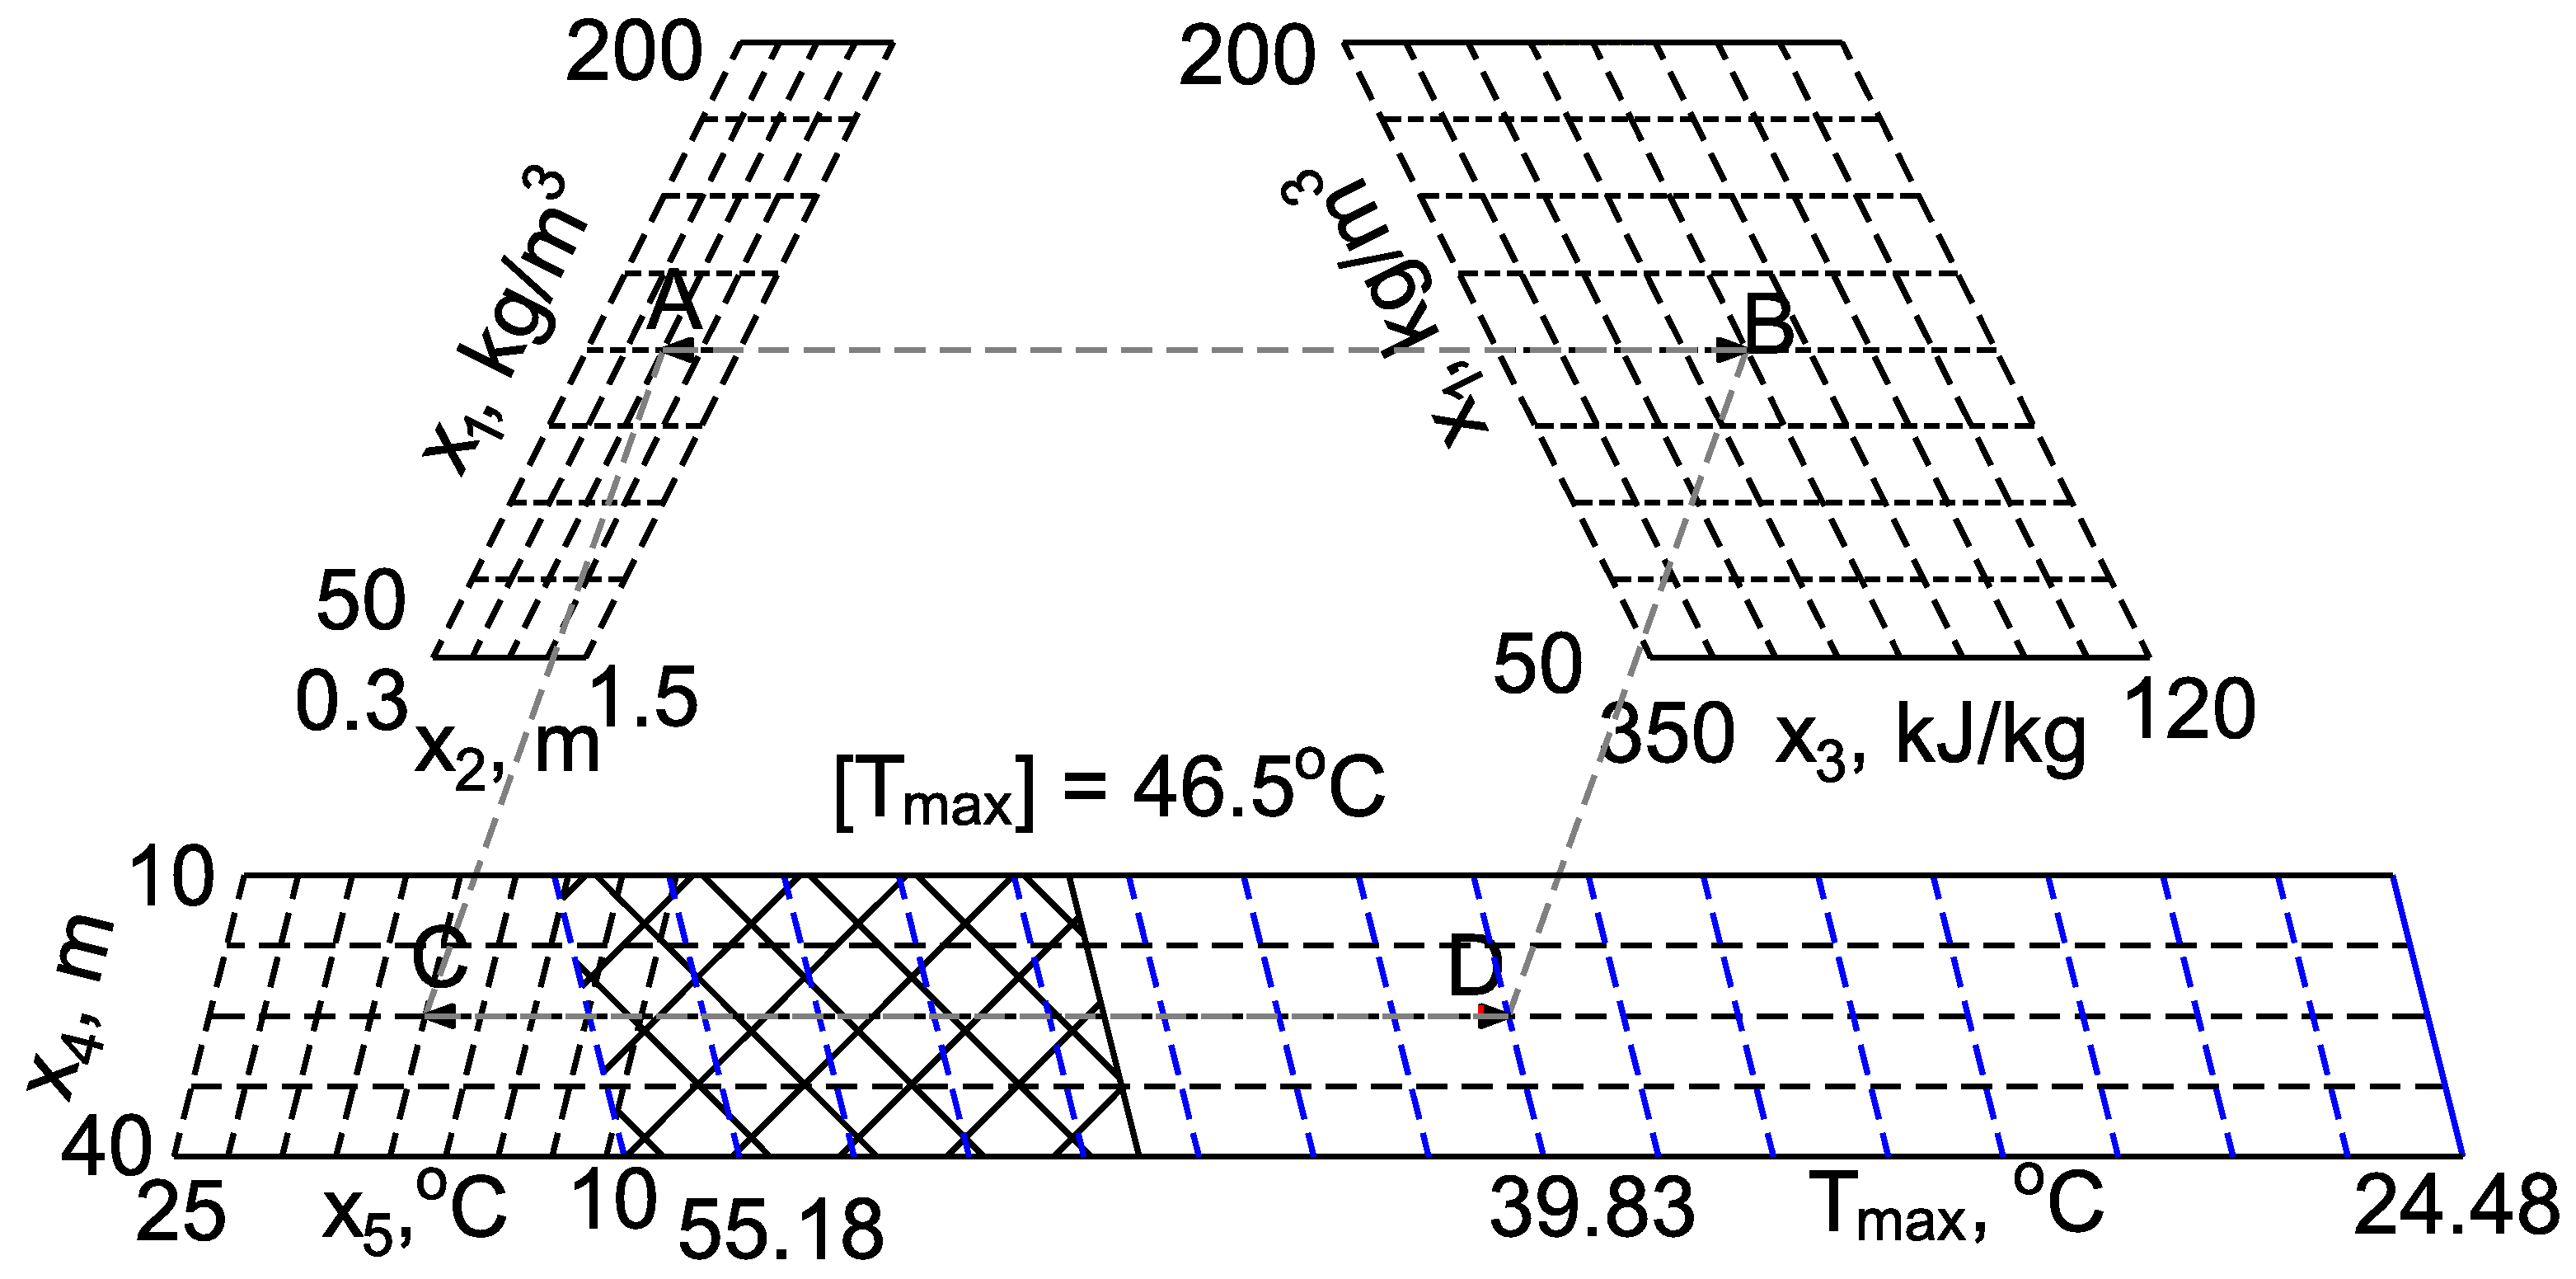
Nomograms have been developed for a rapid evaluation of the maximum temperature in the center of concrete masses. A nomogram for the summer variant of rolling concrete placement is presented in Figure 3. These nomograms can assist in determining the necessary values of the factors that influence the maximum temperature of the concrete based on the desired maximum temperature.
To model the thermally stressed state of the concrete massif, numerical experiments were conducted using factor analysis for both rolled and vibrated concrete variants, with accepted factors and their corresponding intervals outlined in Table 2. The response evaluated was the maximum stress in the inner zone of the concrete mass. Table 6 and Table 7 present the regression equations that were obtained from the factorial experiments.
As can be seen from the presented dependencies (Table 4 and Table 5), the most significant factors are cement consumption (factor X1) and the maximum heat release of cement (factor X3). To a lesser extent, the length of the concreting block (X4), the temperature of the concrete mixture to be laid (X5), and the thickness of the concrete layer to be laid (X2) affect it.
Under the given construction conditions within a certain time interval, the maximum tensile stresses are observed near the concrete–base contact in its lower layer. These stresses can appear either at the center of the mass or at another location, depending on the variant considered. The time when the maximum tensile stresses occur ranges widely, from 504 to 1360 h (21 to 57 days) after starting to lay the first layer of the concrete mass.
The regression equations obtained enabled the construction of nomograms that can be used to determine the maximum tensile stress given the accepted values of the factors. 
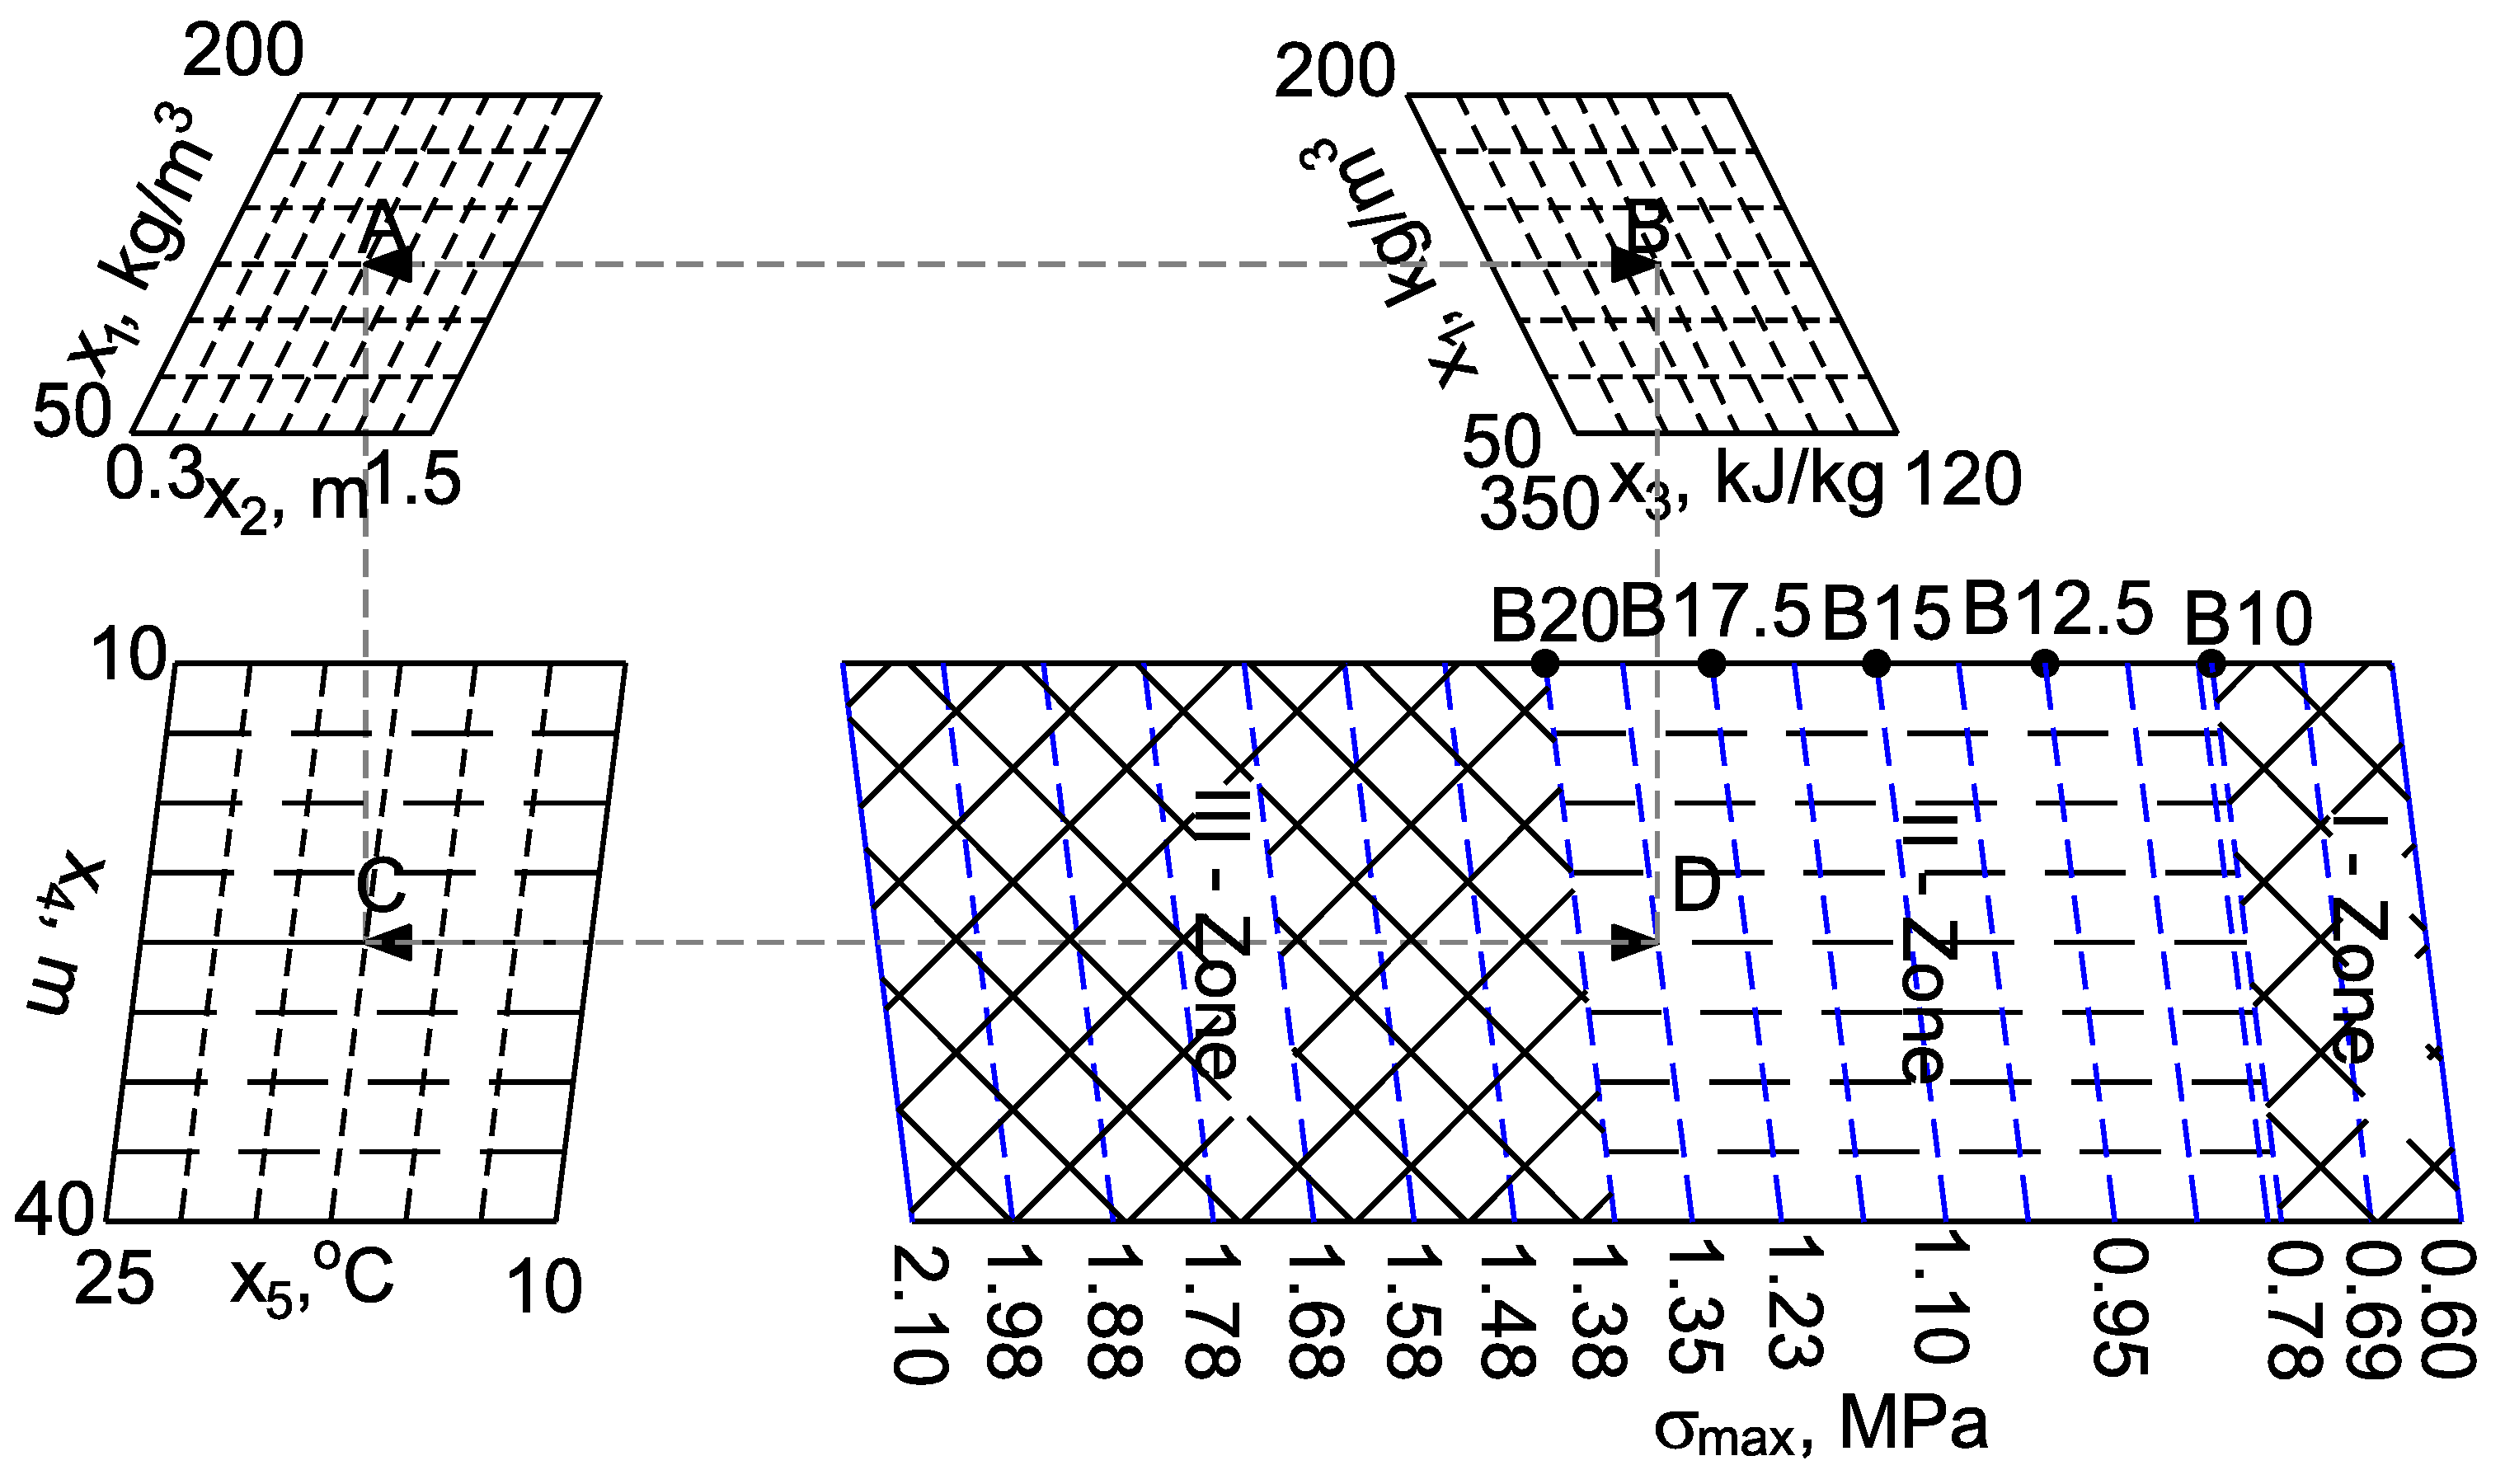
Figure 4 displays the nomogram for rolled concrete in the case where the external temperature is 26.5 °C.
The usage of class concrete B5; B7.5; B10; B12.5; B15; B17.5; and B20 is mandated by Russian standards when preparing a concrete mixture using rolled concrete technology [11]. Hydrotechnical construction recommendations in Vietnam suggest the use of class B10–B20 concrete (M150–M250) for rolled concrete dams [13].
The standards specify that, for concrete classes falling within this range, the maximum permitted compressive strength for limit states of the second group is between (7.5–14.9) MPa. Additionally, the maximum allowed tensile strength for limit states of the second group is within the range of (0.78–1.38) MPa.
The nomogram’s binary fields of (X4, σmax) demarcate the allowable maximum tensile stress values for rolled concrete classes B10–B20, as detailed in [11]. Figure 3 highlights the corresponding areas (denoted by different shades).
Area 1 of the highlighted regions guarantees maximum tensile stresses lower than the allowed limit for the lowest class of concrete, B10 (0.78 MPa), thus preventing any occurrence of cracking.
Area 2 marks regions exhibiting maximum tensile stresses greater than the allowable limit for lower class concrete B10 (0.78 MPa), though still falling under the limit for the highest class B20 (1.38 MPa). Instances of temperature cracks may arise in this region if the value of maximum tensile stress, as indicated on the nomogram, exceeds the allowable value for the given concrete class.
Area 3 denotes regions indicating maximum tensile stresses that surpass the allowable limit for the highest class of concrete, B20 (1.38 MPa), thereby causing cracks in the concrete.
For comparison, it is possible to bring the conformity of concrete grades according to the Russian standard [13] and the European standard EN 206-1. Russian concrete grades B10, B15, and B20 correspond to European grades C8/10, C12/15, and C16/20. The numbers in the designations, according to the European standard, indicate the compressive strength of concrete in MPa when testing concrete samples of a cylindrical shape (diameter 150 and height 300 mm) and a cube shape (with sides 150 mm). The numbers in the designations of Russian concrete brands correspond to the strength of a cubic-shaped sample (also with a side of 150 mm).
The resulting model makes it possible to estimate with greater accuracy not only the temperature regime but also the thermally stressed state of the layer-by-layer concrete array. The influence of five factors is considered, whereas, in all previous models, it did not exceed four. The forecast model is made in relation to the climatic conditions of North Vietnam, or close to those. In addition, two possible options for laying concrete are considered: rolled and vibrated, and a different rate of construction of the array in height. All this allows us to talk about the advantages of the proposed model as a whole and in relation to the conditions considered.
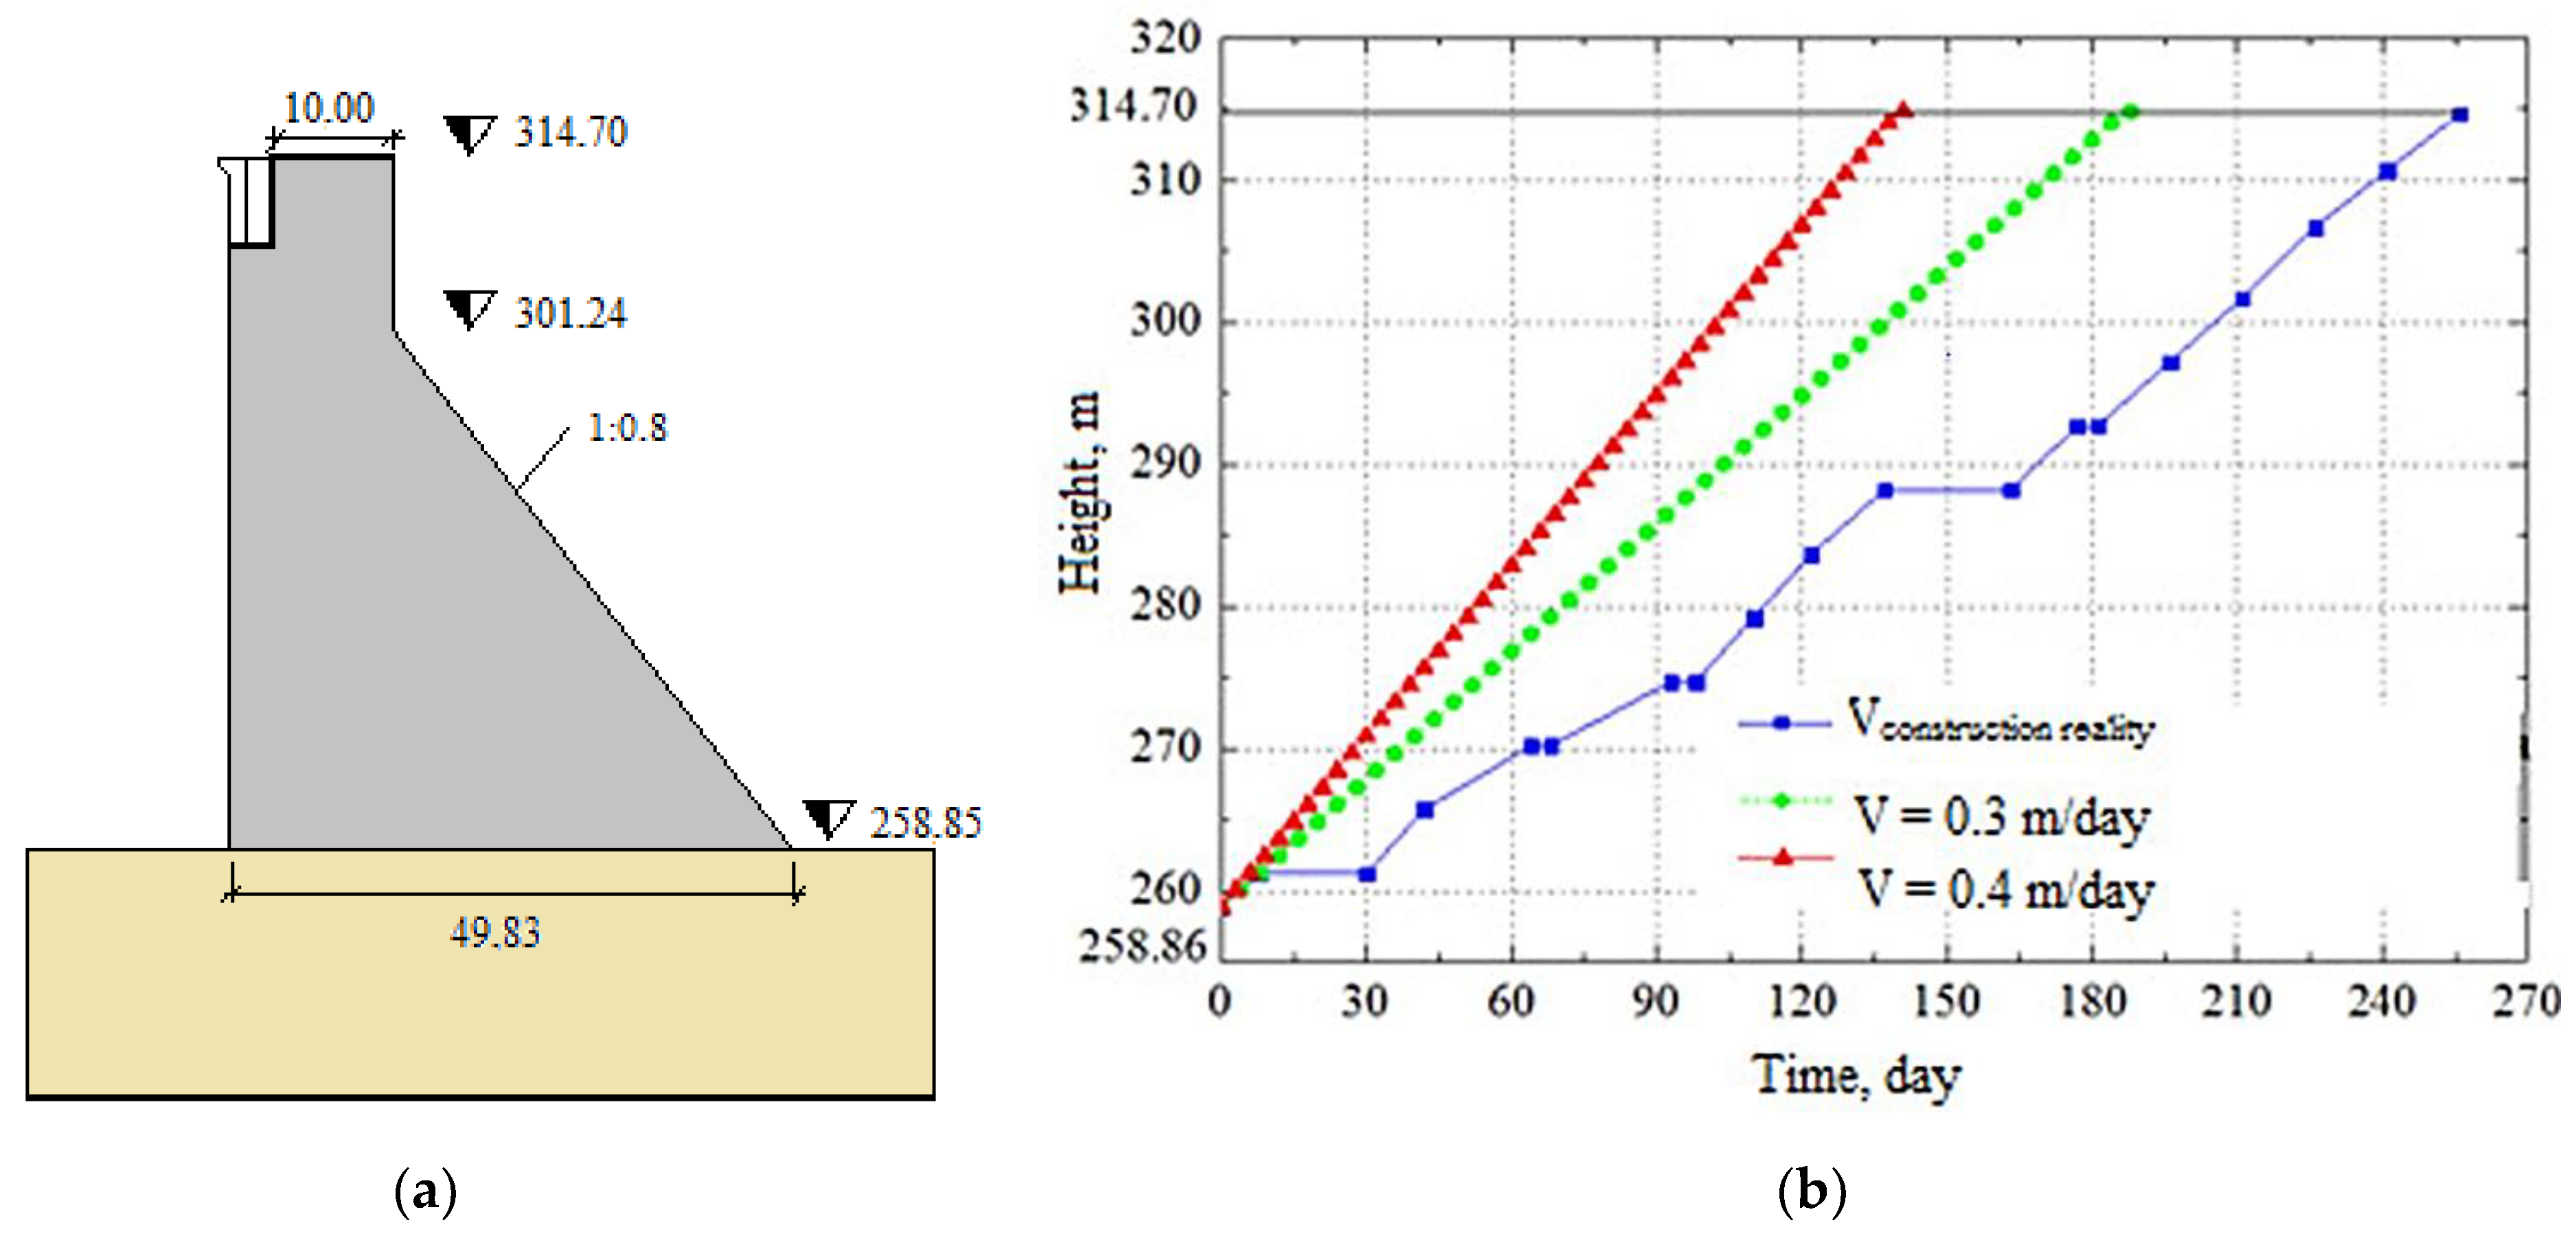
A developed mathematical model was employed to predict the temperature regime and thermal stress state of the gravity concrete dam constructed from rolled concrete in Ban Lai in Vietnam. The dam stands 56 m tall and was erected in the northern part of Vietnam, with a climate characterized by air-temperature fluctuations of 15.0 °C in winter to 26.5 °C in summer. The concrete laying commenced on the 10th of March, with the initial temperature of the laid concrete at 23 °C and the base temperature at 20 °C. Two construction options were considered, with the first featuring a speed of 0.3 m/day (option 1) and the second at 0.4 m/day (option 2). Figure 5 depicts the cross profile of the dam and the dam erection height schedules of the three options, including the actual construction schedule implemented in practice (option 3). For option 1, the time step between laying adjacent layers of concrete was set at 24 h, while for option 2, it was 18 h with a concrete layer thickness of 0.3 m.
A mixture of Portland cement and pozzolan (85 kg and 45 kg per 1 m3 of rolled concrete, respectively) was used as a binder for the concrete of the dam. The addition of pozzolan improves the properties of hydraulic concrete with a grade of M150.
According to the results of experiments conducted in the laboratory of the Institute of Hydraulic Engineering Materials (Vietnam), changes in the compressive and tensile strength of concrete, as well as the modulus of elasticity (
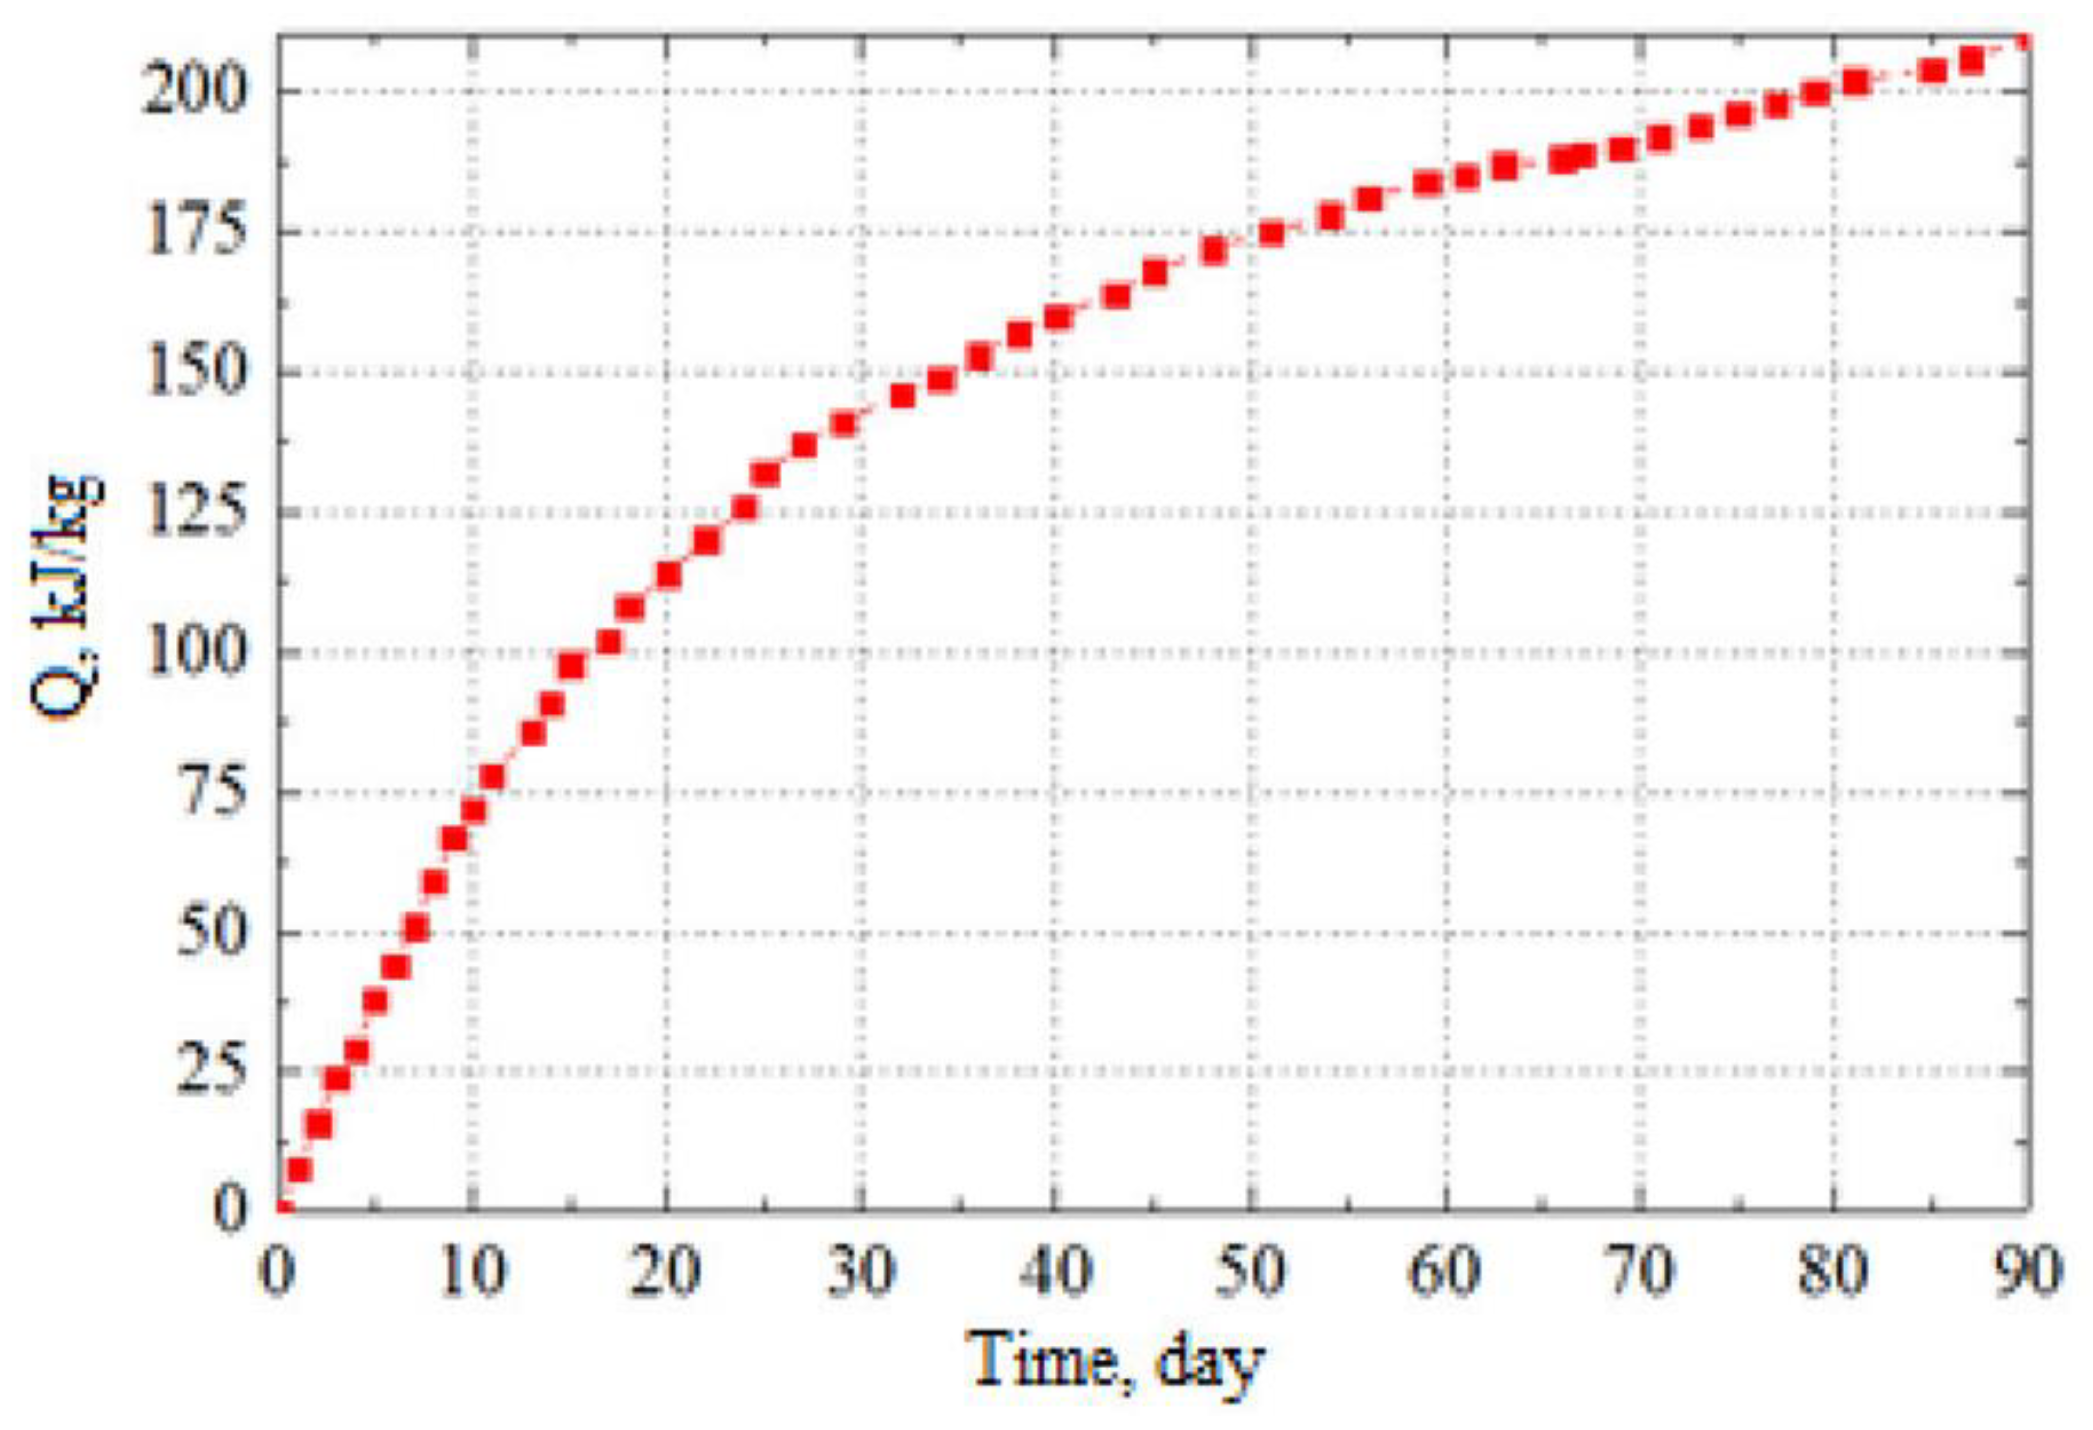
Table 8), were determined, according to which curves of changes in these values over time were constructed. The obtained curves were used in calculations. Standard samples of cylindrical shape (diameter and height of 150 mm each) and cubic (with sides of 150 mm) were tested. Experimental studies in the calorimeter under adiabatic conditions also obtained the heat release curve of the binder (a mixture of cement and pozzolan) during hydration in Vietnam, shown in Figure 6.
The model was used for a preliminary assessment of the temperature regime of the dam under construction. Using the mathematical model generated, a preliminary estimation was conducted on the highest temperature within the concrete mass as well as the maximum tensile stresses that can be found in the contact region of the under-construction dam. Employing the regression equations obtained from Table 4 and Table 5, along with the established nomograms from Figure 3 and Figure 4, the highest temperature projected to be reached by the concrete mass was 39.8 °C while the maximum tensile stresses were set to be 1.2 MPa.
A numerical model utilizing the Midas Civil software package was designed for the Ban Lai dam to analyze the temperature patterns and thermal stress of the structure during the construction stage and the operational phase. Two construction options based on the height of the structure were considered. The maximum temperature and tensile stresses achieved using the numerical solution method are exhibited in Table 9.
It is notable that the predicted maximum temperature value (39.8 °C) is in good agreement with the result derived from the numerical model (40.04 °C). Similarly, the maximum tensile stress value aligns well with predicted and numerical solution methods, with 1.20 MPa and 1.17 MPa, respectively. It can be observed that elevating the construction speed of the dam from 0.3 m/day to 0.4 m/day results in a temperature hike inside the mass up to 44 °C, while the maximum tensile stresses increase from 1.17 MPa to 1.48 MPa.
As a result, the intensity of the dam construction at a height of 0.3 m/day was recommended. This was implemented in practice (the slope of the construction schedule at such a speed has the same angle of inclination as the real graph in Figure 2b).
The outcomes of mathematical modeling were contrasted against the findings of natural observations. During the dam construction process, field observations to capture its temperature were done utilizing control and measuring equipment. Analyzing the results from the actual temperature measurements of the structure made it possible to evaluate the credibility of the mathematical model’s predictions.
Option 1 was deemed the most favorable for the structure’s temperature regime according to the results of mathematical modeling. However, the practical construction scheme varies from the plan for option 1 (shown in Figure 5). Halts during concreting and some deviations from the designated speed of construction were caused by issues like the construction of the grouting gallery, bad weather, and lack of funds. Although the changes increased the construction period, the intensity of concreting remained close to the theoretical value of V = 0.3 m/day during concrete placement, as seen in Figure 5. Using the actual construction schedule illustrated in Figure 5 and the mathematical model generated, assessments of the structure’s thermal state and temperature were also carried out. Table 8 contains a comparison of temperature sensor readings at the center of corresponding structural segments, recorded at the same elevation during construction, with outcomes obtained from the mathematical model.
The evaluation of the thermally stressed state of the construction heap generated stress-distribution data. Maximum tensile stresses were identified at the interface near the dam’s lower area. Using the figures from numerical calculations, a value of 1.14 MPa was arrived at (given the vertical construction speed of V = 0.3 m/day).
The temperature-regime simulation data for the construction timeframe, up to the elevations provided in Table 10, is displayed in Figure 7.
Table 10 and Figure 7 show the results for the four selected moments of construction in time and height of the dam. Full-scale observations and calculations using a mathematical model make it possible for such an analysis in almost all sections where control and measuring equipment is installed.
The results obtained demonstrate a close correlation between the numerical simulation and the figures gathered from field measurements. The maximum deviation recorded was 7.6%, while the minimum difference was 0.1% (refer to Table 10). The numerical model, with its mathematical simulation grounded on numerical solutions, delineates the temperature state of the dam precisely during construction. It is, therefore, a useful tool for forecasting and can be employed in tackling analogous challenges.
An appraisal was conducted to determine the probability of cracking of the concrete mass of the gravity dam. This evaluation leveraged the thermally stressed state and prognostic model of the temperature regime to quantify the likelihood of thermal cracks forming.
(a)
As per the temperature criterion outlined by the Russian and Vietnamese standards, the temperature differential, ΔT, between the center and surface of the concrete mass should not exceed 20 °C. The dam body concretization took 255 days, as displayed in the construction schedule depicted in Figure 5b, with a timeframe spanning between March 10 and November 20. The maximum temperature value recorded at the center of the massif was approximately 40 °C, based on the predictive model. Thus, the temperature differential requirement will be unmet if the structure’s surface temperature is below 20 °C. This can only be fulfilled in March and November, in accordance with the variation of air temperature in the construction zone, as indicated by Table 11. To preclude the occurrence of cracks in this period, it is advisable to safeguard the outer surfaces of the massif with a covering material like PVC membrane;
(b)
Concerning the maximum tensile stresses, current normative literature on the design of concrete and reinforced concrete structures [11] specifies that the criterion for cracking is formulated as follows:
σ(τ) ≤ γb3 γb6 εlim φ(τ)Eb(τ)
Based on stress calculations conducted on the 45th day, specifically at node No.1, maximum tensile stresses were recorded in the dam’s contact zone near the bottom surface, with a value of σ(τ) = σ(45) = 1.14 MPa. The relevant parameters related to this calculation were as follows: modulus of elasticity: E(τ) = E(45) = 240,000 kg/cm2 = 24 × 103 MPa and working conditions coefficients: γb3 = 1.2; γb6 = 1.15. The value for ultimate elongation was εlim(τ) = φ(45) εlim = 3.99 × 10⁻⁵.
The verification of the structure’s crack-resistance conditions, accounting for the coefficients, is conducted through the use of Formula (13).
σ ( 45 ) = 1.14   MPa γ b 3 γ b 6 ε lim φ ( τ ) E b ( τ ) = 1.2 × 1.15 × 3.99 × 10 5 × 24000 = 1.32   MPa
The allowable tensile stress value obtained from the analysis is greater than the stress value of 1.17 MPa calculated from the stress numerical model. Consequently, it can be inferred that the dam is adequately resistant to cracking within the near-contact zone.
In addition to the Banmong Dam, the forecast model was used for the Ban Lai Dam, also being built in Northern Vietnam.

4. Conclusions

  • Using the theory of factorial experiment, a predictive model was developed to determine the temperature conditions and corresponding thermal stress state in a layer-by-layer concrete mass. The model was specifically tailored to suit the climatic conditions of North Vietnam with an emphasis on two construction technologies: rolled and vibrated concrete;
  • The proposed predictive model is based on a well-proven method of factor analysis in numerous studies. Checking the adequacy of the obtained regression equations showed good convergence. The method for determining the temperature regime and the thermally stressed state has been thoroughly tested by solving a number of test tasks and field experiments. All of this allows us to state the fact of the reliability of the results of using the model;
  • The predictive model that was generated was employed to conduct an initial evaluation of the Ban Lai concrete gravity dam, which was constructed in North Vietnam. By utilizing the model, it was possible to estimate the maximum temperature level and maximum tensile stresses that the dam may experience throughout the construction process;
  • A model number was created to depict the temperature regime and thermal stress state of the Ban Lai Dam during both the construction and operation phases, with the aid of the Midas Civil software package utilizing the finite-element method. This model factors in the actual parameters that influence the creation of the temperature regime within the structure;
  • After conducting a comparative analysis of the Ban Lai dam using the predictive model, numerical finite-element model, and field observations, it was discovered that the results aligned and displayed favorable comparability;
  • The predictive model that was formulated can be implemented to conduct early evaluations of the temperature regime and thermal stress state for concrete dams constructed under comparable climatic conditions. As a result, the probability of thermal cracks forming during the structure’s construction can be minimized;
  • Recommendations and prospects for further development of the topic. It is necessary to continue studying the processes of crack formation in massive concrete structures. Research is required to clarify the existing criteria for assessing possible cracking. Further laboratory studies are needed to optimize the composition of the concrete mixture and the properties of the material. Computational models and research methods also require development.

Author Contributions

Conceptualization, N.A.A. and T.C.N.; methodology, T.C.N.; software, T.C.N.; validation, N.A.A.; investigation T.C.N.; writing—review and editing, N.A.A.; visualization, N.A.A.; supervision, N.A.A.; project administration, N.A.A. All authors have read and agreed to the published version of the manuscript.

Funding

This research received no external funding.

Data Availability Statement

Not applicable.

Conflicts of Interest

The authors declare no conflict of interest.

References

  1. Zhu, B. Thermal Stresses and Temperature Control of Mass Concrete; Butterworth-Heinemann: Oxford, UK, 2013; 500p. [Google Scholar]
  2. Li, B.; Wang, Z.; Jiang, Y.; Zhu, Z. Temperature control and crack prevention during construction in steep slope dams and stilling basins in high-altitude areas. Adv. Mech. Eng. 2018, 10, 1–15. [Google Scholar]
  3. Struchkova, A.Y.; Barabanshchikov, Y.G.; Semenov, K.S.; Shaibakova, A.A. Heat dissipation of cement and calculation of crack resistance of concrete massifs. Mag. Civ. Eng. 2017, 78, 128–135. [Google Scholar] [CrossRef]
  4. Shaw, Q.H.W. The early behavior of RCC in large dams. Int. J. Hydropower Dams 2010, 17, 83–90. [Google Scholar]
  5. Reeves, G.N.; Yates, L.B. Simplified Design and Construction Control for Roller-Compacted Concrete; ASCE: New York, NY, USA, 1985; pp. 48–61. [Google Scholar]
  6. Tatro, S.; Schrader, E. Thermal Analysis for RCC—A Practical Approach; Roller Compacted Concrete III; ASCE: New York, NY, USA, 1992; pp. 389–406. [Google Scholar]
  7. Nagayama, I.; Jikan, S. 30 years’ history of roller-compacted concrete dams in Japan. In Roller Compacted Concrete Dams; Routledge: Milton Park, UK, 2018; pp. 27–38. [Google Scholar]
  8. Dunstan, M.R.H. RC Dams, 2014. In World Atlas & Industry Guide, International Journal of Hydropower & Dams; Aqua-Media International: Wallington, UK, 2014. [Google Scholar]
  9. Dunstan, M.R.H. World developments in RC dams—Part 1, Proceedings. In Proceedings of the Hydro-2014 International Conference & Exhibition, Cernobbio, Italy, 13–15 October 2014. [Google Scholar]
  10. Eydel’man, S.Y. Full-Scale Studies of the Bratsk Hydroelectric Dam; Energy: St. Petersburg, Russia, 1968; 253p. [Google Scholar]
  11. SR 41.13330.2012; Concrete and Reinforced Concrete Structures of Hydraulic Structures. Ministry of Regional Development of Russia: Moscow, Russia, 2012.
  12. SR 357.1325800.2017; Concrete Structures of Hydraulic Structures. Ministry of Construction and Housing and Communal Services of Russia: Moscow, Rassia, 2017.
  13. Aniskin, N.A.; Chuc, N.T. The problem of temperature cracking in concrete gravity dams. Vestn. MGSU Mon. J. Constr. Archit. 2020, 15, 380–398. Available online: http://nso-journal-03.mgsu.ru/en/component/sjarchive/issue/article.display/2020/3/380-398 (accessed on 15 March 2020). [CrossRef]
  14. Bamforth, P.B. Early-Age Thermal Crack Control in Concrete; CIRIA C660; CIRIA: London, UK, 2007; 268p. [Google Scholar]
  15. Japan Concrete Institute. Guidelines for Control of Cracking of Mass Concrete; Japan Concrete Institute: Tokyo, Japan, 2016; 302p. [Google Scholar]
  16. Nilsson, M. Restraint Factors and Partial Coefficients for Crack Risk Analyses of Early Age Concrete Structures. Ph.D. Thesis, Department of Civil and Mining Engineering Division of Structural Engineering Lulea University of Technology, Lulea, Sweden, 2003; 213p. [Google Scholar]
  17. Krat, T.Y.; Rukavishnikova, T.N. Assessment of Temperature Regime and Thermal Stress State of Concrete Blocks under Different Conditions Concreting; News of VNIIG: St. Petersburg, Russia, 2007; Volume 248, pp. 77–85. [Google Scholar]
  18. Ginzburg, S.M. Assessment of the Temperature Regime of Concrete Massifs during Their Construction, Taking into Account Random Factors; Ginzburg, S.M., Sheynker, S.M., Eds.; News of VNIIG: St. Petersburg, Russia, 2002; Volume 241, pp. 188–192. [Google Scholar]
  19. Gaspar, A.; Lopez, F. Methodology for a probabilistic analysis of an RCC gravity dam construction: Modelling of temperature, hydration degree and ageing degree fields. Eng. Struct. 2014, 65, 99–110. [Google Scholar] [CrossRef]
  20. Aniskin, N.A.; Hoang, N. Forecast of Cracking of Concrete Massive Dams during Construction in Severe Climatic Conditions; Bulletin of the Moscow State University of Civil Engineering: Moscow, Russia, 2014; pp. 165–178. [Google Scholar]
  21. Kuzmanovic, V.; Savic, L.; Mladenovic, N. Computation of thermal-stresses and contraction joint distance of RCC dams. J. Therm. Stress 2013, 36, 112–134. [Google Scholar] [CrossRef]
  22. Malkawi, A.I.H.; Aufleger, M.; Mohammed, R.A.J. Temperature distribution in al-mujib roller compacted concrete (RCC) gravity dam. Int. J. Hydropower Dams 2004, 11, 86–95. [Google Scholar]
  23. Aurich, M.; Filho, A.C.; Bittencourt, T.N.; Shah, S.P. Finite element analysis of concrete cracking at early age. Civ. Environ. Eng. 2011, 37, 459–473. [Google Scholar] [CrossRef]
  24. Midas GTS NX. User’s Guide; MIDAS Information Technology Co. Ltd.: Seongnam, Republic of Korea, 1989.
  25. ICOLD Bulletin 117. The Gravity Dam—A Dam for the Future. ICOLD. 2000. Available online: https://www.icold-cigb.org/GB/publications/bulletins.asp (accessed on 1 March 2023).
  26. ICOLD Bulletin 165. Selection of Materials for Concrete Dams; ICOLD: Antalya, Turkey, 1999; Available online: https://www.icold-cigb.org/GB/publications/bulletins.asp (accessed on 1 March 2023).
  27. Ginzburg, S.M.; Rukavishnikova, T.N.; Sheinker, N.Y. Simulation models for estimation of temperature regime of concrete dam by example of Bureyskaya HPP. Vedeneev 2002, 241, 173–178. [Google Scholar]
  28. Adrian, M.L. A Finite Element Model for the Prediction of Thermal Stresses in Mass Concrete. Ph.D. Thesis, University of Florida, Gainesville, FL, USA, 2009; 177p. [Google Scholar]
  29. Zaporogets, I.D.; Okorokov, S.D.; Pariyskiy, A.A. Heat Dissipation of Concrete; Stroyizdat: St. Petersburg, Russia, 1966; 313p. [Google Scholar]
  30. Aniskin, N.A.; Chuc, N.T. Temperature regime during the construction massive concrete with pipe cooling. Mag. Civ. Eng. 2019, 5, 156–166. [Google Scholar]
  31. Aniskin, N.A.; Chuc, N.T. The effect of formworks on the temperature regime in the mass concrete. Mag. Civ. Eng. 2020, 99, 9911012. [Google Scholar]
  32. Adler, Y.P. Planning the Experiment in the Search for Optimal Conditions; Stroyizdat: Moscow, Russia, 1976; 588p. [Google Scholar]
Figure 1. Technique of “birth” and “death” of elements: (a)—at step i-1; (b)—at step i; (c)—at step i + 1.
Buildings 13 01954 g001
Figure 2. The temperature regime of the concrete block during the construction period in winter (air temperature 17 °C): (a)—480 h after the start of concreting (mass height 6 m); (b)—1200 h after the start of concreting (mass height 15 m); (c)—1680 h after the start of concreting (mass height 21 m); (d)—2400 h after the start of concreting (mass height 30 m).
Buildings 13 01954 g002
Figure 3. Nomogram for determining the maximum temperature in a concrete mass of rolled concrete during laying in the summer (air temperature 26.5 °C).
Buildings 13 01954 g003
Figure 4. Nomogram for determining the maximum stress of a concrete mass of rolled concrete during construction in the summer (Tair = 26.5 °C).
Buildings 13 01954 g004
Figure 5. Ban Lai Rolled Concrete Dam (Vietnam): (a)—cross section of the dam; (b)—graphs of the construction of the dam in time in height.
Buildings 13 01954 g005
Figure 6. Experimental heat release curve during cement hydration.
Buildings 13 01954 g006
Figure 7. Temperature simulation results for a real construction schedule. (a)—elevation mark +270.20; (b)—elevation mark +274.70; (c)—elevation mark +283.70; (d)—elevation mark +288.20.
Buildings 13 01954 g007
Table 1. Permissible temperature gradients according to Chinese design codes 1.
Block HeightPermissible Temperature Gradient ΔT(°C)
Concrete-Block Length L (m)
<16 m(17–20) m(21–30) m(31–40) m>40 m
(0–0.1) L26–2524–2222–1919–1616–14
(0.1–0.4) L33–3131–2828–2624–2020–18
Table 2. Criteria for evaluation by cracking index.
The Possibility of Cracking OccursThermal Cracking Index (Icr)
To prevent any thermal cracksIcr ≥ 1.5
Possibility of limited cracks1.2 ≤ Icr ≤ 1.5
Possibility of dangerous cracks0.7 ≤ Icr ≤ 1.2
Table 3. Factors and intervals of their change.
FactorsLimits of Factors Change
DesignationFactor DescriptionRolled ConcreteVibrated Concrete
X1Consumption of cement, kg/m350–200200–450
X2Thickness of the laid layer, m0.3–1.51.5–5.0
X3Maximum heat release of cement, kJ/kg120–350120–350
X4Block length, m10–4010–40
X5Temperature of laid concrete, °C10.0–25.010.0–25.0
Table 4. Regression equations for the rolled concrete case.
Average Annual Air Temperature, °CRegression Equation for the Maximum Temperature in the Array
Rolled Concrete
26.5Tmax  =  39.8 + 5.1X1 + 1.3X2 + 4.2X3 + 1.2X4 + 3.6X5 + 1.0X1X3
17.0Tmax  =  29.0 + 5.1X1 + 0.9X2 + 4.1 X3 + 0.6X4 + 3.1X5 + 1.1X1X3
5.0Tmax  =  19.0 + 5.5X1 + 1.2X2 + 4.6X3 + 0.7X4 + 1.8X5 + 0.7X1X3
Table 5. Regression equations for the vibrated concrete case.
Average Annual Air Temperature, °CRegression Equation for the Maximum Temperature in the Array
Vibrated Concrete
26.5Tmax  =  52.6 + 9.5X1 + 2.0X2 + 12.2X3 + 0.6X4 + 2.5X5 + 1.0X1X3
17.0Tmax  =  44.2 + 10.1X1 + 4.6X2 + 12.7X3 + 3.1X5 + 2.0X1X3 + 1.0X2X + 1.2X2X5
5.0Tmax  =  39.4 + 9.3X1 + 4.7X2 + 12.3X3 + 3.2X5 + 0.6X1X2 + 0.7X1X3
Table 6. Maximum stress regression equations for rolled concrete.
Average Annual Emperature Air, °CThe Equation That Predicts the Maximum Stress (MPa) in a Rolled Concrete Mass
26.5σmax  =  1.30 + 0.21X1 + 0.07X2 + 0.15X3 + 0.13X4 + 0.14X5 + 0.06X1X2 + 0.10X1X3
17.0σmax  =  1.16 + 0.15X1 + 0.04X2 + 0.12X3 + 0.08X4 + 0.10X5 + 0.07X1X3
5.0σmax  =  1.11 + 0.13X1 + 0.04X2 + 0.11X3 + 0.09X4 + 0.04X5 + 0.03X1X2 + 0.06 X1X3
Table 7. Maximum stress regression equations for the vibrated concrete case.
Average Annual Temperature
Air, °C
The Equation That Predicts the Maximum Stress (MPa) in a Vibrated Concrete Mass
26.5σmax  =  2.16 + 0.26X1 + 0.08X2 + 0.36X3 + 0.12X4 + 0.01X5 + 0.02X1X2 + 0.18X1X3
17.0σmax  =  1.83 + 0.22X1 + 0.10X2 + 0.31X3 + 0.21X4 + 0.01X5 + 0.14X1X3 + 0.08X1X4
5.0σmax  =  1.56 + 0.19X1 + 0.10X2 + 0.23X3 + 0.18X4 + 0.01X5 + 0.09X1X3 + 0.06X1X4
Table 8. Change in time characteristics of concrete.
Age, Days714285690
Rc, MPa (compressive strength)3.96.910.414.316.9
Rr, MPa (tensile strength)0.30.50.70.91.1
E, GPa (modulus of elasticity)9.414.820.225.027.8
Table 9. Results of numerical modeling of the Ban Lai dam.
OptionTmax, °Cσmax, MPaσmin, MPa
No. 1, V = 0.3 m/day40.041.17−1.55
No. 2, V = 0.4 m/day44.071.48−1.83
Table 10. Comparison of the results of numerical simulation and field measurements.
Elevation MarkMaximum Temperature in Concrete Mass, °CError, %
Numerical Model of FEMField Measurements
+270.2041.6542.502.0
+274.7039.9943.307.6
+283.7040.4540.400.1
+288.2039.2640.703.5
Table 11. Average monthly air temperature in the construction area.
Month123456789101112
Tair,°C15.017.520.023.525.526.526.025.824.822.719.015.9
Disclaimer/Publisher’s Note: The statements, opinions and data contained in all publications are solely those of the individual author(s) and contributor(s) and not of MDPI and/or the editor(s). MDPI and/or the editor(s) disclaim responsibility for any injury to people or property resulting from any ideas, methods, instructions or products referred to in the content.

