1. Introduction
In recent years, fossil fuel carbon emissions and global warming have encouraged the optimization of living spaces by maximizing the efficiency, sustainability, and overall quality of living spaces, especially in urban areas where most people are concentrated. As individuals spend most of their days indoors, it is essential that these indoor environments are maintained in optimal conditions to ensure the well-being and comfort of the occupants [
1]. The way buildings are designed, constructed, and operated to maintain thermal comfort can have a significant impact on their energy consumption. When a building is designed to provide thermal comfort to its occupants, it typically requires heating, cooling, and ventilation (HVAC) systems to maintain a consistent and comfortable indoor temperature. These systems require energy to operate, which contributes to the overall consumption of the building. By giving an energy-efficient solution to occupants, they can adjust their environment to their preferences without wasting energy, thus creating spaces which are not only comfortable and healthy for occupants, but also sustainable and cost-effective to operate [
2]. Therefore, ensuring thermal comfort can increase technology adoption and the quality of life of the users, thereby making them more likely to enjoy their living spaces, be more satisfied with their health and living arrangements, and encourage the wider adoption of home automation technologies [
3].
The ANSI/ASHRAE Standard 55-2020 [
4] defines thermal comfort as a subjective parameter that is influenced not only by quantitative variables, but also by a person’s mentality, culture, and social conditions. Several indices have been used to measure the level of thermal comfort of users. The standard effective temperature (SET) provides an equivalent temperature that represents overall thermal sensation. Another metric, the thermal sensation vote (TSV)m is a rate gave by individuals to indicate their perceptions of thermal comfort. The predicted percentage of those dissatisfied (PPD) estimates the percentage of occupants who feel uncomfortable with thermal conditions in a given space [
5,
6]. However, in terms of building design, HVAC system control, and thermal optimization, one of the most relevant metrics is the predicted mean vote (PMV). This PMV is an index that aims to predict the average value of the votes of a group of users on a seven-point wind chill scale. Thermal equilibrium is obtained when the internal heat production of a user is equal to his heat loss [
7]. The PMV calculation relates four quantitative variables, namely, air speed, air temperature, mean radiant temperature, and relative humidity, as well as two expected parameters: clothes (CLO) and metabolic rate (MET) [
8], which are defined in the ANSI/ASHRAE standard 55-2020 [
4]. All these variables directly affect an occupant’s perception of thermal comfort. Air speed, air temperature, mean radiant temperature, and relative humidity are factors that affect the heat exchange between a person and the surroundings. Clothing and metabolism rates are personal factors that determine how much heat people generate and how much insulation they have against the environment. Taking into account all of these variables and parameters, the PMV calculation can estimate whether an occupant is likely to feel too hot, too cold, or comfortable in a given environment.
Traditional methods for evaluating thermal comfort based on the PMV usually rely on computationally inaccurate and expensive procedures to implement, since they are based on dynamic calculations that do not take into account the changes in the the occupant’s behavior and preferences as a human. Instead, most of the simulation processes base the calculations on the people density (person/m
2) and the schedule room (values between 0–1) in order to ‘inhabit the space’. These methods can result in an inaccurate prediction of the thermal comfort and have limited applicability in spaces with nonuniform thermal conditions, special occupancy requirements, or nonstandard building designs. This also implies that limited feedback could be offered to occupants or building operators, which can make it difficult to adjust the indoor environment to improve thermal comfort and energy efficiency [
9]. Consequently, advances made with machine learning (ML)-based solutions can help mitigate the shortcomings and challenges faced by traditional comfort models and upgrade them to a real-time environment, thereby adapting to changing environmental conditions and occupant behavior to maintain optimal thermal comfort and energy efficiency [
10].
In Chile, building codes and standards have been established to guarantee thermal comfort according to the Chilean Ministry of Housing and Urbanism, such as thermal insulation requirements based on the buildings location and altitude (
http://bit.ly/3kB0S1p, accessed on 27 February 2023). In addition, efforts to achieve energy efficiency have been made through several programs aiming at reducing consumption in buildings while maintaining thermal comfort. For example, the National Energy Efficiency Program provides funding and technical assistance to building owners and managers to implement energy efficiency measures with the objective of promoting the rational use of energy resources (
http://bit.ly/3Y6vjKs, accessed on 27 February 2023). However, there is still a lack of adequate coordination among the different service providers to integrate the technology needed to achieve these goals in efficiency and sustainability. In addition, there is a lack of awareness among building owners, managers, and occupants about the importance of thermal comfort and energy efficiency in buildings, thereby making it challenging to promote the adoption of sustainable building practices.
Furthermore, the climate varies significantly across different regions of the country, thus making it challenging to develop standardized thermal comfort measures that are applicable to all buildings. For example, buildings in the northern desert region may require different cooling strategies than those in the central and southern regions. This has hindered the development of the research and data available in buildings, which can make it difficult to develop evidence-based policies and programs. In particular, there is a need for research in this field to develop methodologies to automate smart homes while guaranteeing user comfort standards, which can be applied in different climates and geographical conditions. Specifically, the following aspects need to be solved:
A user-centric approach is necessary to effectively learn and model user preferences and thermal comfort requirements to make personalized decisions in different households, regardless of their location.
There is a need for investigating the most suitable ML models and data sources to enable this user-centric solution.
It is necessary to study how a user-centric approach has impacts on energy efficiency while maintaining thermal comfort that considers the interaction with home appliances such as an AC or heater.
By addressing these research gaps, a comprehensive understanding of the feasibility, effectiveness, and potential benefits of employing a smart avatar for enhancing thermal comfort in houses can be achieved. Considering the diverse climate in Chile, addressing these challenges in this context can pave the way for further research on user-centric approaches for evaluating thermal comfort in regions with similar conditions.
The objective of this research is to develop a smart avatar that emulates user behavior in a shoe-box structure. By delivering this user-centric approach, a more accurate simulation tool can be built, which can significantly impact the thermal comfort assessment. This work proposes a data-driven decision-making approach that allows for evaluating the thermal comfort experienced by a user residing in a simulated experimental room. The approach involves isolating specific parameters within the room, as well as utilizing data analysis and machine learning techniques. The location of the room is not specified within any specific region of Chile, thus making the proposed avatar a valuable tool to assess the thermal comfort of people across the country, regardless of the region. A random forest (RF) regressor was proposed to predict the PMV for a user who inhabits the structure simulated in Rhino v6 software (McNeel Associates, Seattle, WA, USA). As long short-term memory (LSTM) networks are useful for managing time series, such a model was proposed to forecast the future level of comfort based on the past sequences of the PMV obtained. A ruled-based decision-making algorithm was implemented to emulate the behavior of the avatar, thus offering a series of recommendations intended to guarantee the comfort and well-being of the users. The data was generated through the Rhino Grasshopper plug-in using the environmental parameters of several representative climates of Chile, particularly those corresponding to the cities of Calama, Puerto Montt, Punta Arenas, and Valparaiso. Subsequently, new data from Santiago and Calama were used to vary the airspeed value and evaluate the generalization of the system. For each climate, the data had an hourly resolution. The clothing parameters and metabolic rate were held constant based on the ANSI/ASHRAE 55-2020 standard and software limitations.
The proposed avatar’s decision-making algorithm promotes the use of energy in a more efficient manner to use the HVAC system only when necessary. While previous research has examined building design considerations for providing comfortable conditions to occupants, such as analyzing both naturally ventilated buildings and enclosed environments, there appears to be no existing user-oriented approach that is specifically designed to evaluate thermal comfort. Additionally, to the best of our knowledge, no prior research has employed ML-based forecasting techniques to develop a system with similar capabilities. The contributions of this study are summarized as follows:
An in-depth analysis for achieving the comfort level of users has been offered by proposing a solution able to adapt to the different climate conditions.
Machine learning models were used for PMV calculation and forecasting, which increase the adaptability and reliability of the proposed system.
A smart avatar living in a simulated room was proposed, which benefits from the ML models to save energy, accordingly, and use it efficiently while maintaining comfort. This will allow for building more accurate simulation tools that account for user interests, which can significantly impact on thermal comfort assessment, not only for the scope of this study, but also for researches globally.
The remainder of this paper is organized as follows. In
Section 2, the related work is described, including setpoint control and the computation of comfort indices. In
Section 3, the proposed smart avatar is presented, wherein we provide a description of the modeling assumptions, PMV calculations and forecasting, and decision-making algorithm. The results are presented in
Section 4 and discussed in
Section 5. Finally, conclusions and guidelines for future work are provided in
Section 6.
2. Related Work
Comfort level analysis has always been an interesting topic in the scientific community due to the many benefits it brings, not only for the quality of life of people, but also for its impact on energy efficiency and sustainability. The main research on thermal comfort has debated two main topics: setpoint control and the computation of comfort indices. In [
11], the authors focused on the reliability of the most common indices to evaluate comfort—PMV and the PPD—with an emphasis on the accuracy of the PMV in predicting both the observed thermal sensation (OTS) or observed mean vote (OMV) and comparing the PMV–PPD relationship with binned OTSs. To achieve such goals, authors used the ASHRAE Global Thermal Comfort Database II to evaluate the performance of the model proposed in the ASHRAE standard [
4]. The authors of [
8] based the use of the Fanger’s heat balance equation given in the ASHRAE standard 55-2020 to calculate the PMV and analyze comfort in naturally ventilated buildings. They stated that an improved PMV model needs to be developed in order to achieve a fair comparison between the proposed model and the actual vote of the occupants. In [
12], the authors also analyzed thermal comfort in naturally ventilated buildings; however, the predictions were based on machine learning models that showed effective and competitive results. The same strategy was also used by the authors in [
7,
10] for the estimation of the PMV. The authors of [
13] presented a survey on machine learning applications for thermal comfort in which they highlighted the most relevant techniques, metrics, and programming languages used in the thermal comfort field. A different approach was conducted in [
14] to predict the aspects of adaptative thermal comfort and investigate their vality in purpose-built residential tower blocks in Famagusta, Cyprus. This study highlighted the importance of considering local climate conditions when defining acceptable comfort ranges. The results found can be used to inform building design and HVAC system settings to enhance occupants’ thermal comfort in similar climates. In [
15], the authors addressed the impacts of climate change on indoor thermal conditions and the associated risks with respect to evaluating existing long-term thermal comfort indices. The PMV indicated the upper limit in the ASHRAE Standard-55 summer comfort zone.
However, ML techniques for setpoint control have also raised the interest of the research community. This is the case for [
10,
16,
17,
18]. Limitations or challenges arose in their respective approaches, such as potential increases in energy consumption due to continuous AC control or limited generalization capabilities due to various building types and geographic regions. These limitations suggest areas for improvement and further research in the field of indoor thermal control using ML techniques.
Although ML techniques have proven to be effective and reliable in solving thermal comfort challenges, several limitations still need to be overcome:
The current research suffers from a lack of diverse datam since without a comprehensive and varied dataset representing different building occupants and indoor environments, the models may exhibit limited performance.
ML techniques often struggle with transparency in how they arrive at their predictions, thus making it difficult for researches to understand and interpret the results. This gap requires human interpretability to gain insights into the underlying factors influencing thermal comfort predictions.
If the training data used to develop ML models are not representative of the actual building occupants or indoor conditions, the models’ performance results may be compromised. Ensuring an inclusive and accurate representation of the target population is crucial for achieving reliable thermal comfort predictions.
These above limitations are not exhaustive and may vary depending on the specific context and application.
Table 1 summarizes all the revised literature during this study, where it compares the year of publication, the main contribution, and the techniques used for thermal comfort with the solution given in this paper.
3. Smart Avatar for Evaluating Thermal Comfort
To assess thermal comfort for users in Chile, it is important to consider the diversity of the Chilean climate. The climate in Chile varies greatly due to its unique geography, with the Andes mountains to the east and the Pacific Ocean to the west. Generally, Chile can be divided into three distinct climate zones:
The Northern desert region, which is hot and dry year-round, with very little rainfall and cold nights.
The Central Region, which has a Mediterranean climate with mild, rainy winters, and hot, dry summers.
The Southern region, which has a colder and wetter climate with more rain and snow.
The proposed smart avatar aims to contribute to the assessment of thermal comfort by leveraging data-driven decision-making and ML techniques. The main motivation of this design is to develop an intelligent tool that evaluates and enhances the thermal comfort experience for users in various environments. This system is shown in
Figure 1. First, by using Rhino’s Grasshopper and ClimateStudio plug-ins for energy-based thermal analysis (educational license), environmental data for different regions of the Chilean geography were generated and stored. According to ANSI/ASHRAE Standard 55-2020, nine variables are of relevant interest: external and internal temperature, external and internal humidity, air speed, metabolic rate, clothes, and the PMV (the index to evaluate the thermal comfort of users). Data from the cities of Calama (North Desert), Valparaiso (Central Region), Puerto Montt (South Region), and Punta Arenas (South Region) were used to train ML models that fed an algorithm that makes decisions with the aim of maintaining thermal comfort while saving energy. This algorithm emulates the intelligent user (avatar) living in the developed Rhino structure. Data from the city of Santiago, located in the central region and capital of Chile, were reserved for inferences to assess the system’s generalization. A random forest (RF) regressor computed the PMV for every hour, and, based on the value obtained, the system takes one decision among nine possible options. In addition, an LSTM regressor was developed to forecast the value of the PMV for the next hour, which will complement the current PMV calculation to determine the best decision to take at an instant of time. The following subsections provide a detailed description of each component of the proposed avatar.
3.1. Modelling Assumptions
For this work, certain parameters were assumed in order to simulate the user behavior in a given structure, regardless of its location in Chile’s geography. The avatar’s environment was modeled in Grasshopper, which offers a flexible and intuitive platform for thermal comfort analysis in building design, thereby providing a wide range of analysis tools and real-time feedback. Its seamless integration with Rhino and its visualization capabilities enable data-driven decision-making and interdisciplinary collaboration for sustainable building design. The structure under consideration was a shoe box measuring , including a window oriented to the north and two adiabatic walls. This design closely resembles a standard bedroom in a typical residential building in Chile.
To determine the ground truth PMV of the user in this bedroom, a series of simulations were conducted for each hour of the year that totaled 8760 h. The U-values for the building envelope complied with the Chilean Regulation NCh-1079-2008 standards [
29]. Then, the plug-in ClimateStudio based Energy Plus+ (Educational licensed) was launched to evaluate the PMV of the user in this room.
The software use these factors to calculate the PMV:
The external T° and helative humidity (RH): these comprise theweather file.
Thei nternal T° and RH: these entail software calculation.
MET: this ranges from 0 to 1.
CLO: ASHRAE 55-2020.
Airspeed: this ranges from 0.5 to 1 m/s.
The MET value was set at a constant value of one, and the wind speed inside the room was adjusted to vary between 0.5 to 1 m/s. However, it should be noted that the software has a limitation. It only allows for a constant value for the MET parameter, meaning that the user’s metabolic rate cannot be changed throughout the simulation and is assumed to be the same. This limitation is significant, because the proposed smart avatar should account for changes in the MET, which is something that a real person would naturally experience.
To address the variability in the CLO factor, which represents the insulation value of clothing, the dynamic clothing method specified in ASHRAE 55-2020 (dynamic CLO) was used. The CLO factor was determined based on the external temperature and weather climate, thereby allowing for variations in clothing insulation according to the prevailing conditions.
In this way, the ground truth PMV values and input parameters for training and testing the ML models were developed.The dataset was generated using data from four different Chilean climates, which were selected from the
https://climate.onebuilding.org/ website (accessed on 5 September 2022). External temperature and relative humidity directly influence the interior temperature and humidity, which are two key factors that affect the PMV. The particular weathers were selected since they are markedly distinct from each other and represent a range of latitudes (as classified by the Köppen system): cold desert (Calama), Mediterranean coast (Valparaiso), oceanic (Puerto Montt) and sub-polar oceanic (Punta Arenas). Furthermore, the model envelope was designed to conform to the Chilean normative (Nch-1079-2008).
3.2. PMV Calculation
The proposed smart avatar bases on the PMV to take decisions. For computing the PMV, a RF regressor was developed. The training pipeline of this model is shown in
Figure 2. Then input variable are as follows:
The RF model is a ML meta-estimator which fits a number of decision trees on different sub-samples of a dataset and uses averaging to improve the accuracy of predictions and reduce the overfitting. First, it randomly select a subset of the training data. Then, it builds a decision tree on the subset of the training data and repeats these two steps multiple times to create a forest of decision trees. To make a prediction, it passes the input data through each decision tree in the forest and the average of the output values (since this is a regression problem). Finally, the model returns the final prediction as the average or mode of the individual predictions from all the trees [
30]. The metrics used to evaluate the system are the mean square error (
MSE), root mean square minimum distance (
RMSE), and mean absolute error (
MAE), which are shown in Equations (
1)–(
3), respectively.
where
n is the number of samples in the dataset,
is the actual value of the
i-th sample, and
is the predicted value of the
i-th sample.
The process of randomly selecting a subset of the training data is called bagging (bootstrap aggregating), and it helps to reduce overfitting by introducing variation into the decision trees. Additionally, each decision tree is built by randomly selecting a subset of features at each node, which further increases the diversity of the trees. The random forest regressor can handle a large number of input features, can detect feature interactions, and is relatively insensitive to outliers and irrelevant features. It is often used for regression problems where there are complex relationships between the input features and the target variable.
A grid search was implemented to select the best combination and increase the performance of the model. Furthermore, a feature importance analysis was made to evaluate the impact of the input features in the model’s predictions [
31]. In the proposed training pipeline, a feature’s importance was calculated by permutation importance. This method consisted of calculating the difference between a baseline score and the average score obtained by permuting the corresponding column of the test set. A number of ten repeats and the estimator’s default scorer were set to fit the permutation model.
As ML excels at learning from data and adjusting predictions accordingly, the system only need to sense and incorporate input parameters to achieve successful outcomes, regardless of the building model or climate to which the building is exposed.
3.3. PMV Forecasting
To complement the decision-making process, the smart avatar also incorporates the use of the future PMV. This model receives as input a sequence of the past PMV values with a resolution of 1 h. In order to forecast these future PMV index values, a regression LSTM network was employed. The long short-term memory network is a type of recurrent neural network (RNN) that includes a memory cell with gated inputs, outputs, and feedback loops. The main advantage is that it overcomes the issue of the vanishing gradient problem, which is commonly observed in RNNs. The vanishing gradient problem occurs when gradient information is lost or amplified and then propagated back through time. Therefore, LSTM networks are better suited for time-series data [
32,
33].
Figure 3 represents an LSTM cell.
To successfully predict, it performs computations in each of its four gates that are given as follows:
Forget gate: This decides which information to keep and which to discard from the cell state. This is done by taking as the input the previous hidden state
and the current input
, thereby producing a number between 0 and 1 for each element of the cell state
, as described in Equation (
4):
where
is the weight matrix for the forget gate,
is the bias term, and
is the sigmoid activation function.
Input gate: This adds new information that is selected and added to the cell state. This is done by taking as input the previous hidden state
and the current input
, thus producing a number between 0 and 1 for each element of the cell state
, as described in Equations (
5) and (
6):
where
is the weight matrix for the input gate,
is the bias term, and tanh is the hyperbolic tangent activation function.
is the new candidate cell state, which is computed using a tanh activation function.
Update Cell State: With this gate, the next step is to update the cell state by combining the information from the forget gate and the input gate. This is achieved using Equation (
7):
where ∗ denotes element-wise multiplication.
Output Gate: This decides which information to output from the cell state. This is achieved as described in Equations (
8) and (
9)
where
is the weight matrix for the output gate,
is the bias term, and
is the output of the LSTM cell.
The proposed training pipeline is shown in
Figure 4. A sequence of the past PMV values is formed, normalized using Equation (
10), and inputted into the LSTM.
The regression network contains an input LSTM layer with as many cells as the length of the sequences formed. In addition, it includes a hidden LSTM layer of 100 cells and an output dense layer of one neuron, which correspond to the predicted value.
3.4. Decision-Making Algorithm
Once the PMV computation models are trained, they are feed a decision-making algorithm that aims to guarantee the comfort of the users and behave as the smart avatar of a user living in the shoe-box simulated in Rhino Grasshopper. It is a rule-based algorithm, which allows for determining the following decisions:
The turn ON/OFF of the AC;
The turn ON/OFF of the heater;
The Dress/Undress;
The Open/Close of the window;
Do nothing.
The last decisions (dress/undress, open/close the window, and do nothing) are introduced in the system to help reducing the total power consumption of the house. The proposed system emulates a user who lives in the simulated structure. Therefore, the objective of the decision-making algorithm is not to recommend or give instructions to users living in this environment, but to emulate actions that a person would do in the same situation. It is assumed that the person will always take the best decision aiming to achieve energy efficiency while maintaining comfort.
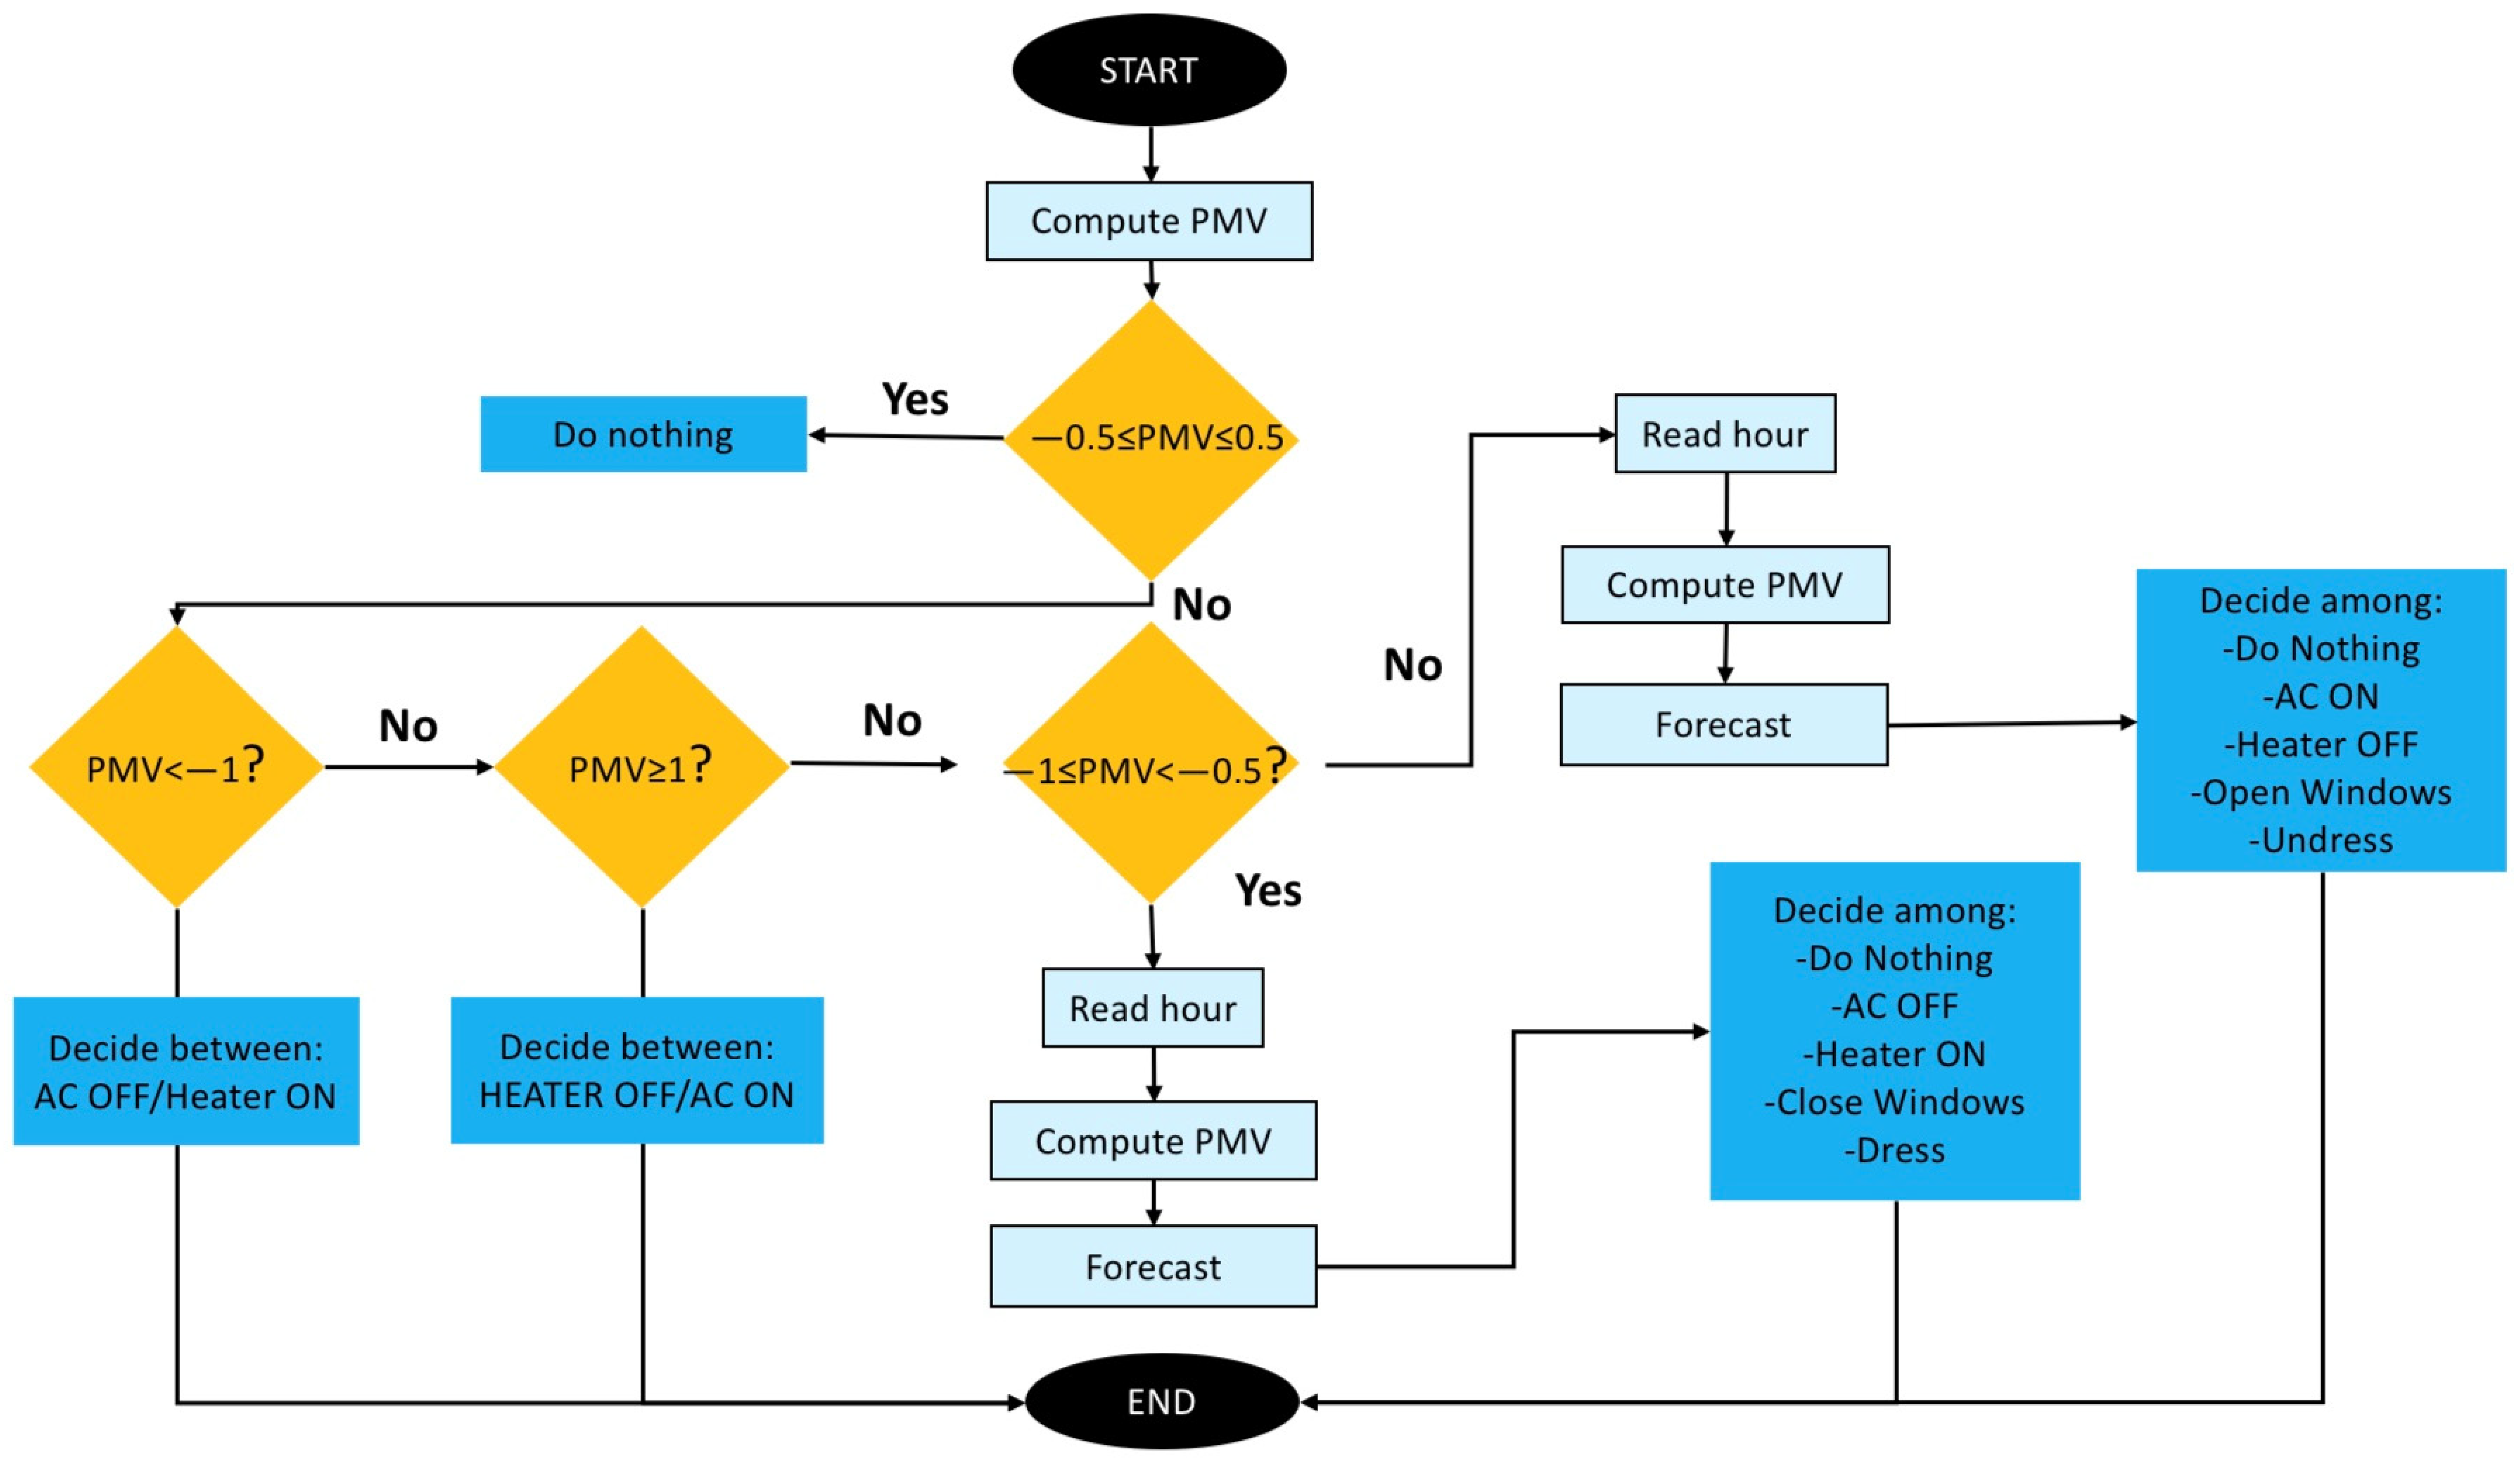
Figure 5 shows the flow diagram of the proposed algorithm. Every time an input feature is available, i.e., for every hour related to the given data resolution, the
is calculated using the RF model. Then, based on the range of the value obtained, decisions are taken. If
, no action is needed, since this range means that the person feels comfort (not feeling cold or hot). For values above 1 or below
, the AC or the heater, respectively, will be used. In the cases where the weather is slightly cold or hot, i.e.,
or
, another analysis is made. In order to save energy while maintaining comfort, the system decides between opening or closing a window; when it is slightly cold the window closes, and when it is slightly hot, a window is opened. These decisions are recommendations that are intended to reduce consumption. To do that, two input parameters (CLO and airspeed, which are directly related with these actions), are modified, and the RF model predicts the value of the PMV in case where one of these decisions are taken. To complement the best decision, the LSTM network predicts the future behavior of the PMV for each possible decision. The input parameter that leads to the best results, based on the range of the PMV obtained, will define the decision taken. Another factor that influence the decisions or actions taken is the time of the day under which the system is working. If it is night, recommendations like open/close a window or dress/undress will not have a meaning, since, mostly during night, users are resting; therefore, performing such tasks will be an inconvenience for them.
4. Results
The results obtained are divided in three groups to be detailed in the next subsections. First, we cover the analysis of the RF model predictions and the feature importance. Then, the forecasting results with the LSTM network and the decision taken are shown. All data used were generated in the Grasshopper Rhino simulation considering the cities of Calama, Puerto Montt, Valparaiso, Punta Arenas, and Santiago. The time resolution among samples was one hour, and all data were stored in
.csv files for further experiments in JupyterLab using the Python language.
Table 2 shows a short subset of the dataset formed, which includes the time, the ground truth PMV values, and all input variables for the ML models, such as external/internal temperature and humidity, metabolic rate, clothes, and airspeed. The total amount of data correspond to a year. The column named City corresponds with the name of the city that was simulated. From these data, three sets of data were formed: a training set (80% of the data), a validation set (10% of the data), and a test set (10% of the data).
4.1. PMV Prediction and Feature Importance
To improve the performance of the RF model, a grid search was implemented to find the best combination of hyperparameters. The set of hyperparameters used to train the RF model are shown in
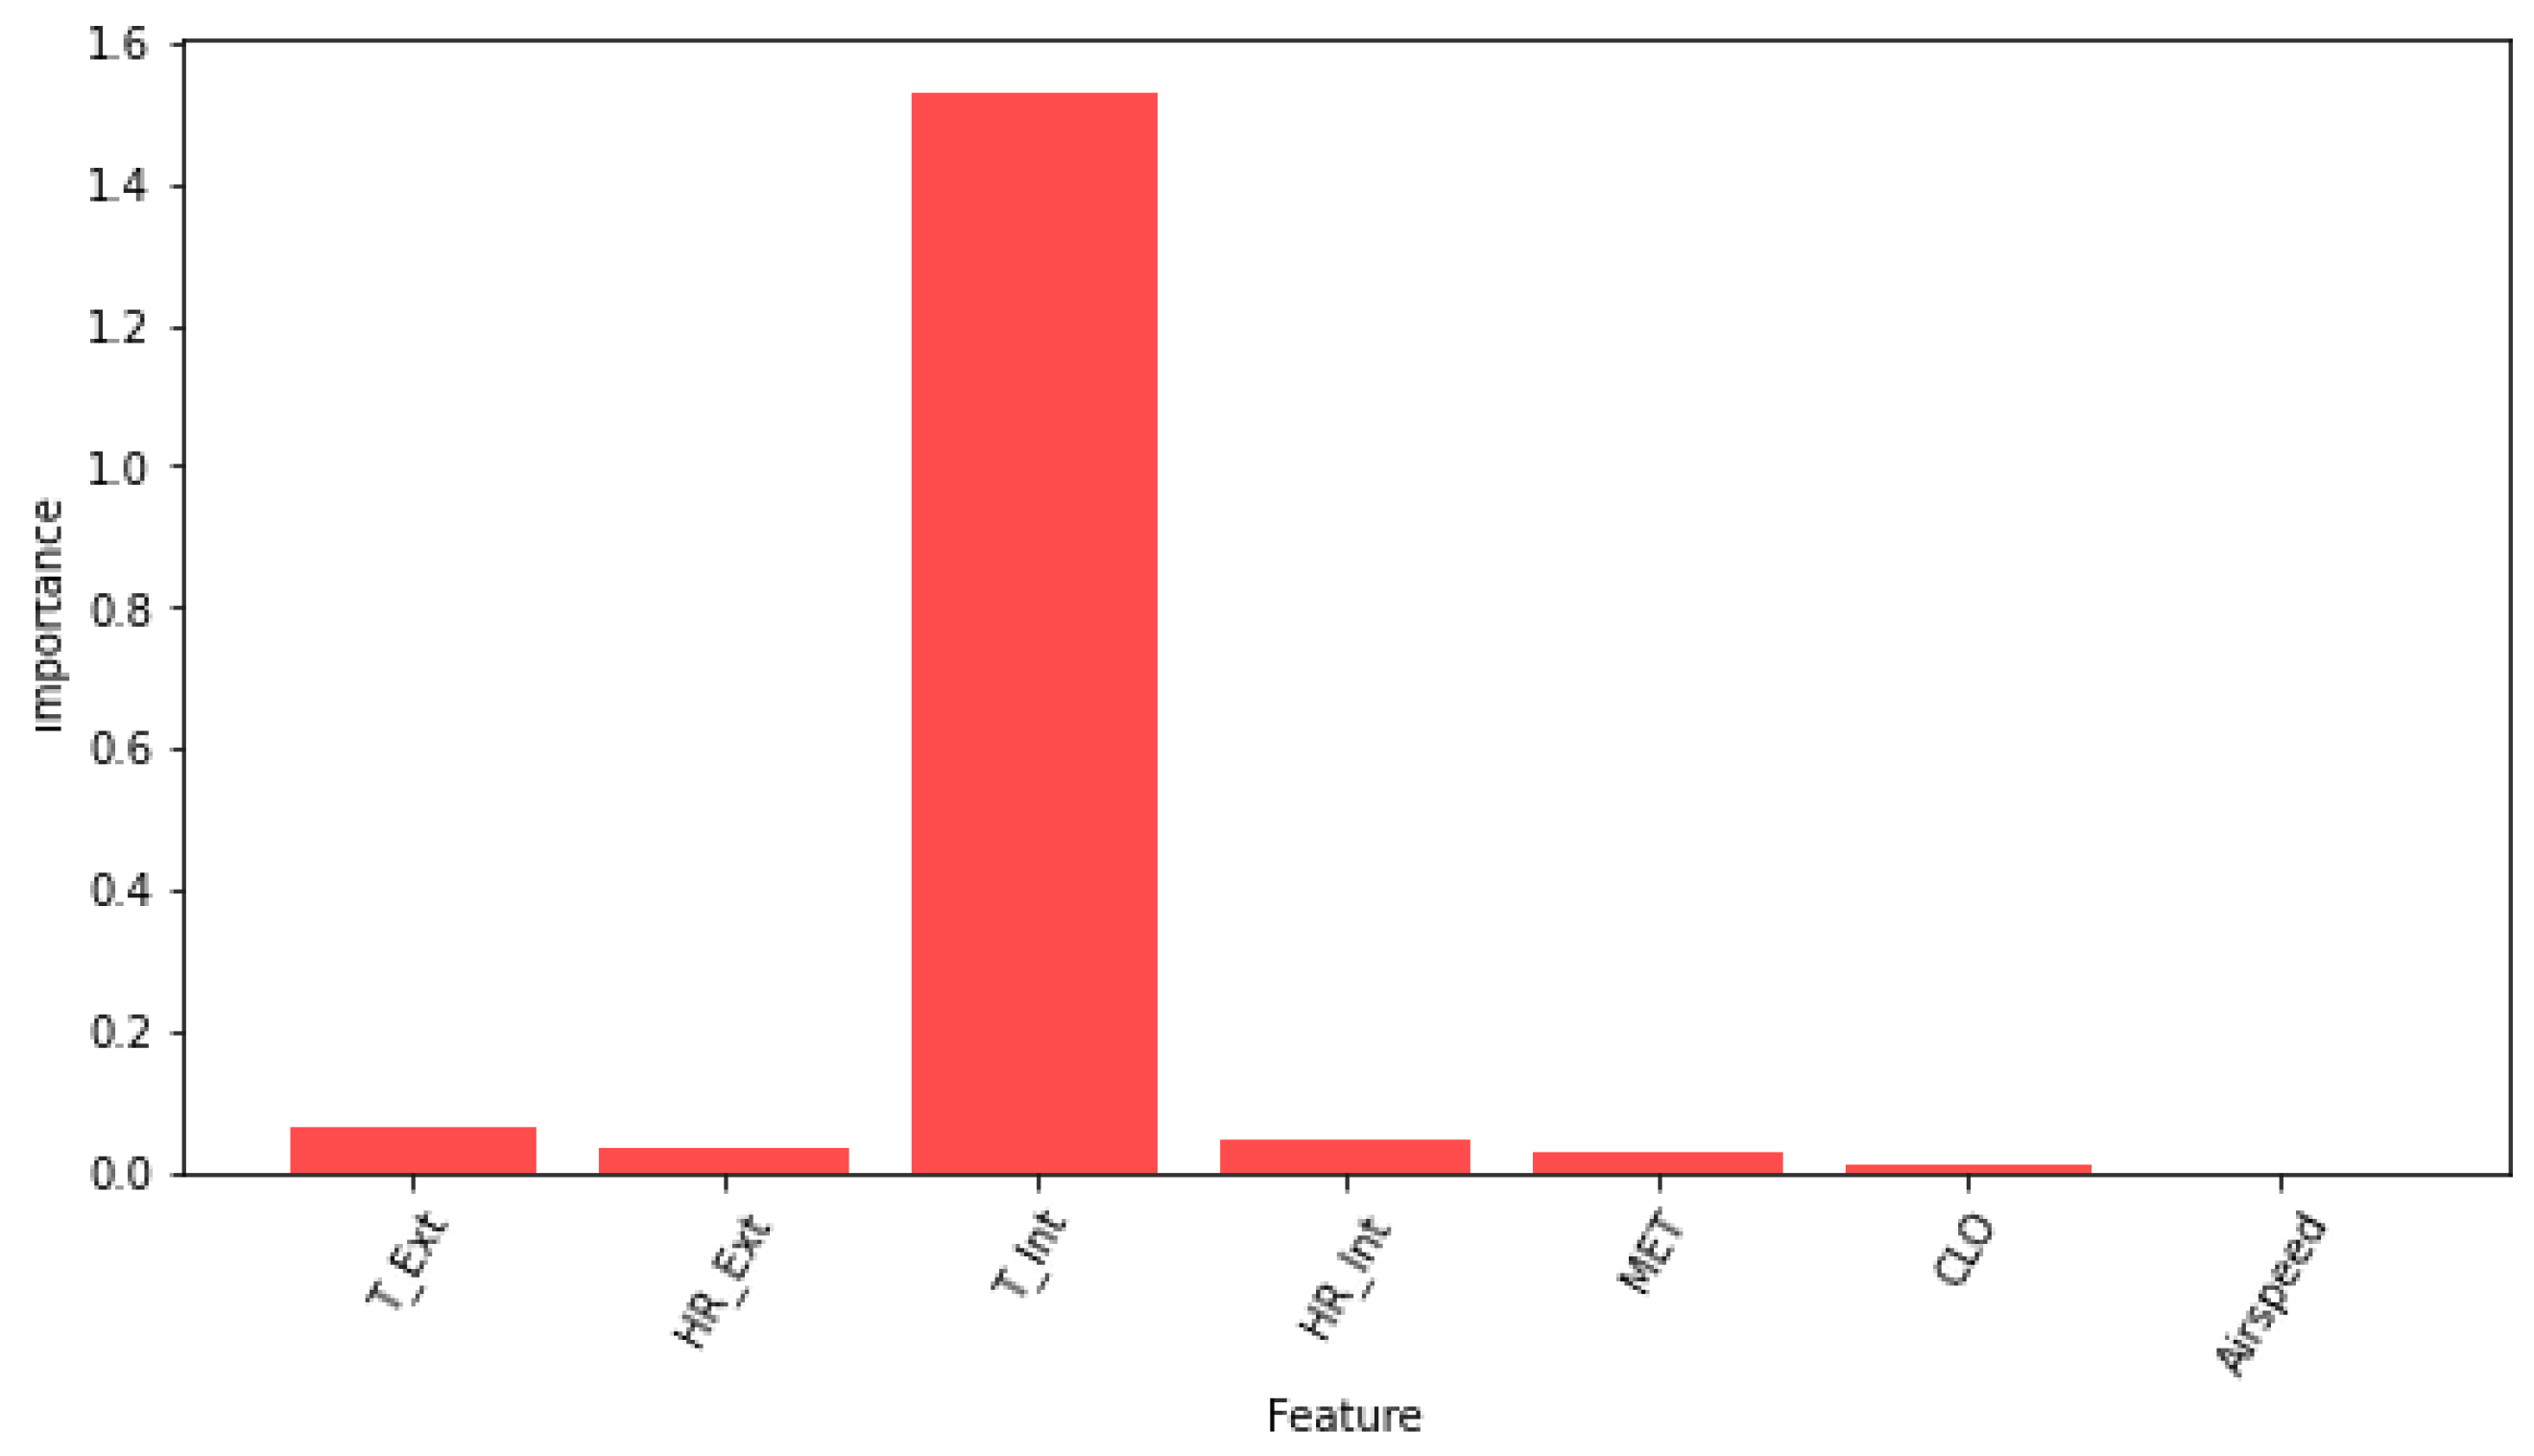
Table 3, where we highlight in bold the best combination obtained. Once finished, a feature importance analysis, based on permutation importance, was deployed to have a better understanding of the impact of the input features on the predictions made. The results of this analysis are shown in
Figure 6. The internal temperature was the input parameter with a higher influence on the PMV prediction, thus meaning that this feature was indispensable for this problem, i.e., it cannot be omitted. On the other hand, the rest of the feature impacts were relatively similar, having considerably less impact than the internal temperature. This is due to the fact that this feature has limited variability in the training set.
Figure 7 shows the predicted PMV values compared to the ground truth obtained with the RF model. With an RMSE of 0.54 and an MAE of 0.28, the model offers good performance and reliable results over the test set.
To test the model’s generalization, data that were not in the training set corresponding to the city of Santiago were inputted into the model. The results obtained show an RMSE of 1.64 and an MAE 0.98, which indicates a poor performance when faced with new data. Therefore, in order to be applied in a new city or climate, the model needed to be retrained. These results are shown in
Figure 8.
4.2. Forecasting with LSTM
To complement decisions, an LSTM network was deployed to forecast the PMV for the next hour using only a sequence of past values. Once the model architecture was designed, a sensitivity analysis of the hyperparameters that influenced the performance of the neural network was carried out. The metrics used to evaluate the system were the MSE, RMSE, and MAE, which were similar to the RF for the PMV calculation, since forecasting is also a regression problem.
Table 4 shows the performed sensitivity analysis. The input length (sequence length), number of layers, number of neurons, iterations, and batch size were varied following a manual tuning approach, thus retraining the model with different combinations of hyperparameters. To evaluate theresults, the MSE, RMSE, and MAE were used. The best combination was obtained with an input size of six, an LSTM and dense layers of 100 cells, and one neuron, respectively, as well as 200 iterations and a batch of 64 samples, as there was no overfitting (i.e., the difference between the training MSE and validation). With the rest of the combinations, the results were acceptable with a very slight tendency toward overfitting. It should be noted that with a size 3 sequence, the results are reliable; thus, the system could predict with only three previous PMV samples if necessary. A computationally light model was also sought; therefore, variants that slightly improved the results but used more resources (i.e., layers and neurons) were discarded. The best training hyperparameters are highlighted in bold.
Figure 9 shows a comparative between the predictions made and the ground truth values. The results showed a very good performance over the test set with an RMSE of 0.051 and an MAE 0.025. As input sequence is scaled between 0 and 1, predictions are, on average, off by 0.051 units on the same scale. Complementing with the MAE, this suggests that the LSTM predictions are, on average, off by 0.025 units in absolute terms and off by 0.051 units in terms of squared errors. Similarly to the analysis made for the RF model, to assess the generalization of the LSTM forecasting model, data from the city of Santiago were inputted into the model. In this case, the model showed competitive performance with an RMSE of 0.088 and an MAE of 0.057. This translates into an acceptable generalization capacity, thereby being able to apply the model in new climates, regardless of the variation in certain parameters such as airspeed. These results are shown in
Figure 10.
4.3. Decision-Making
Once the MLs were trained, they were both integrated to the decision-making algorithm to build the smart avatar of a user living the shoe-box structure.
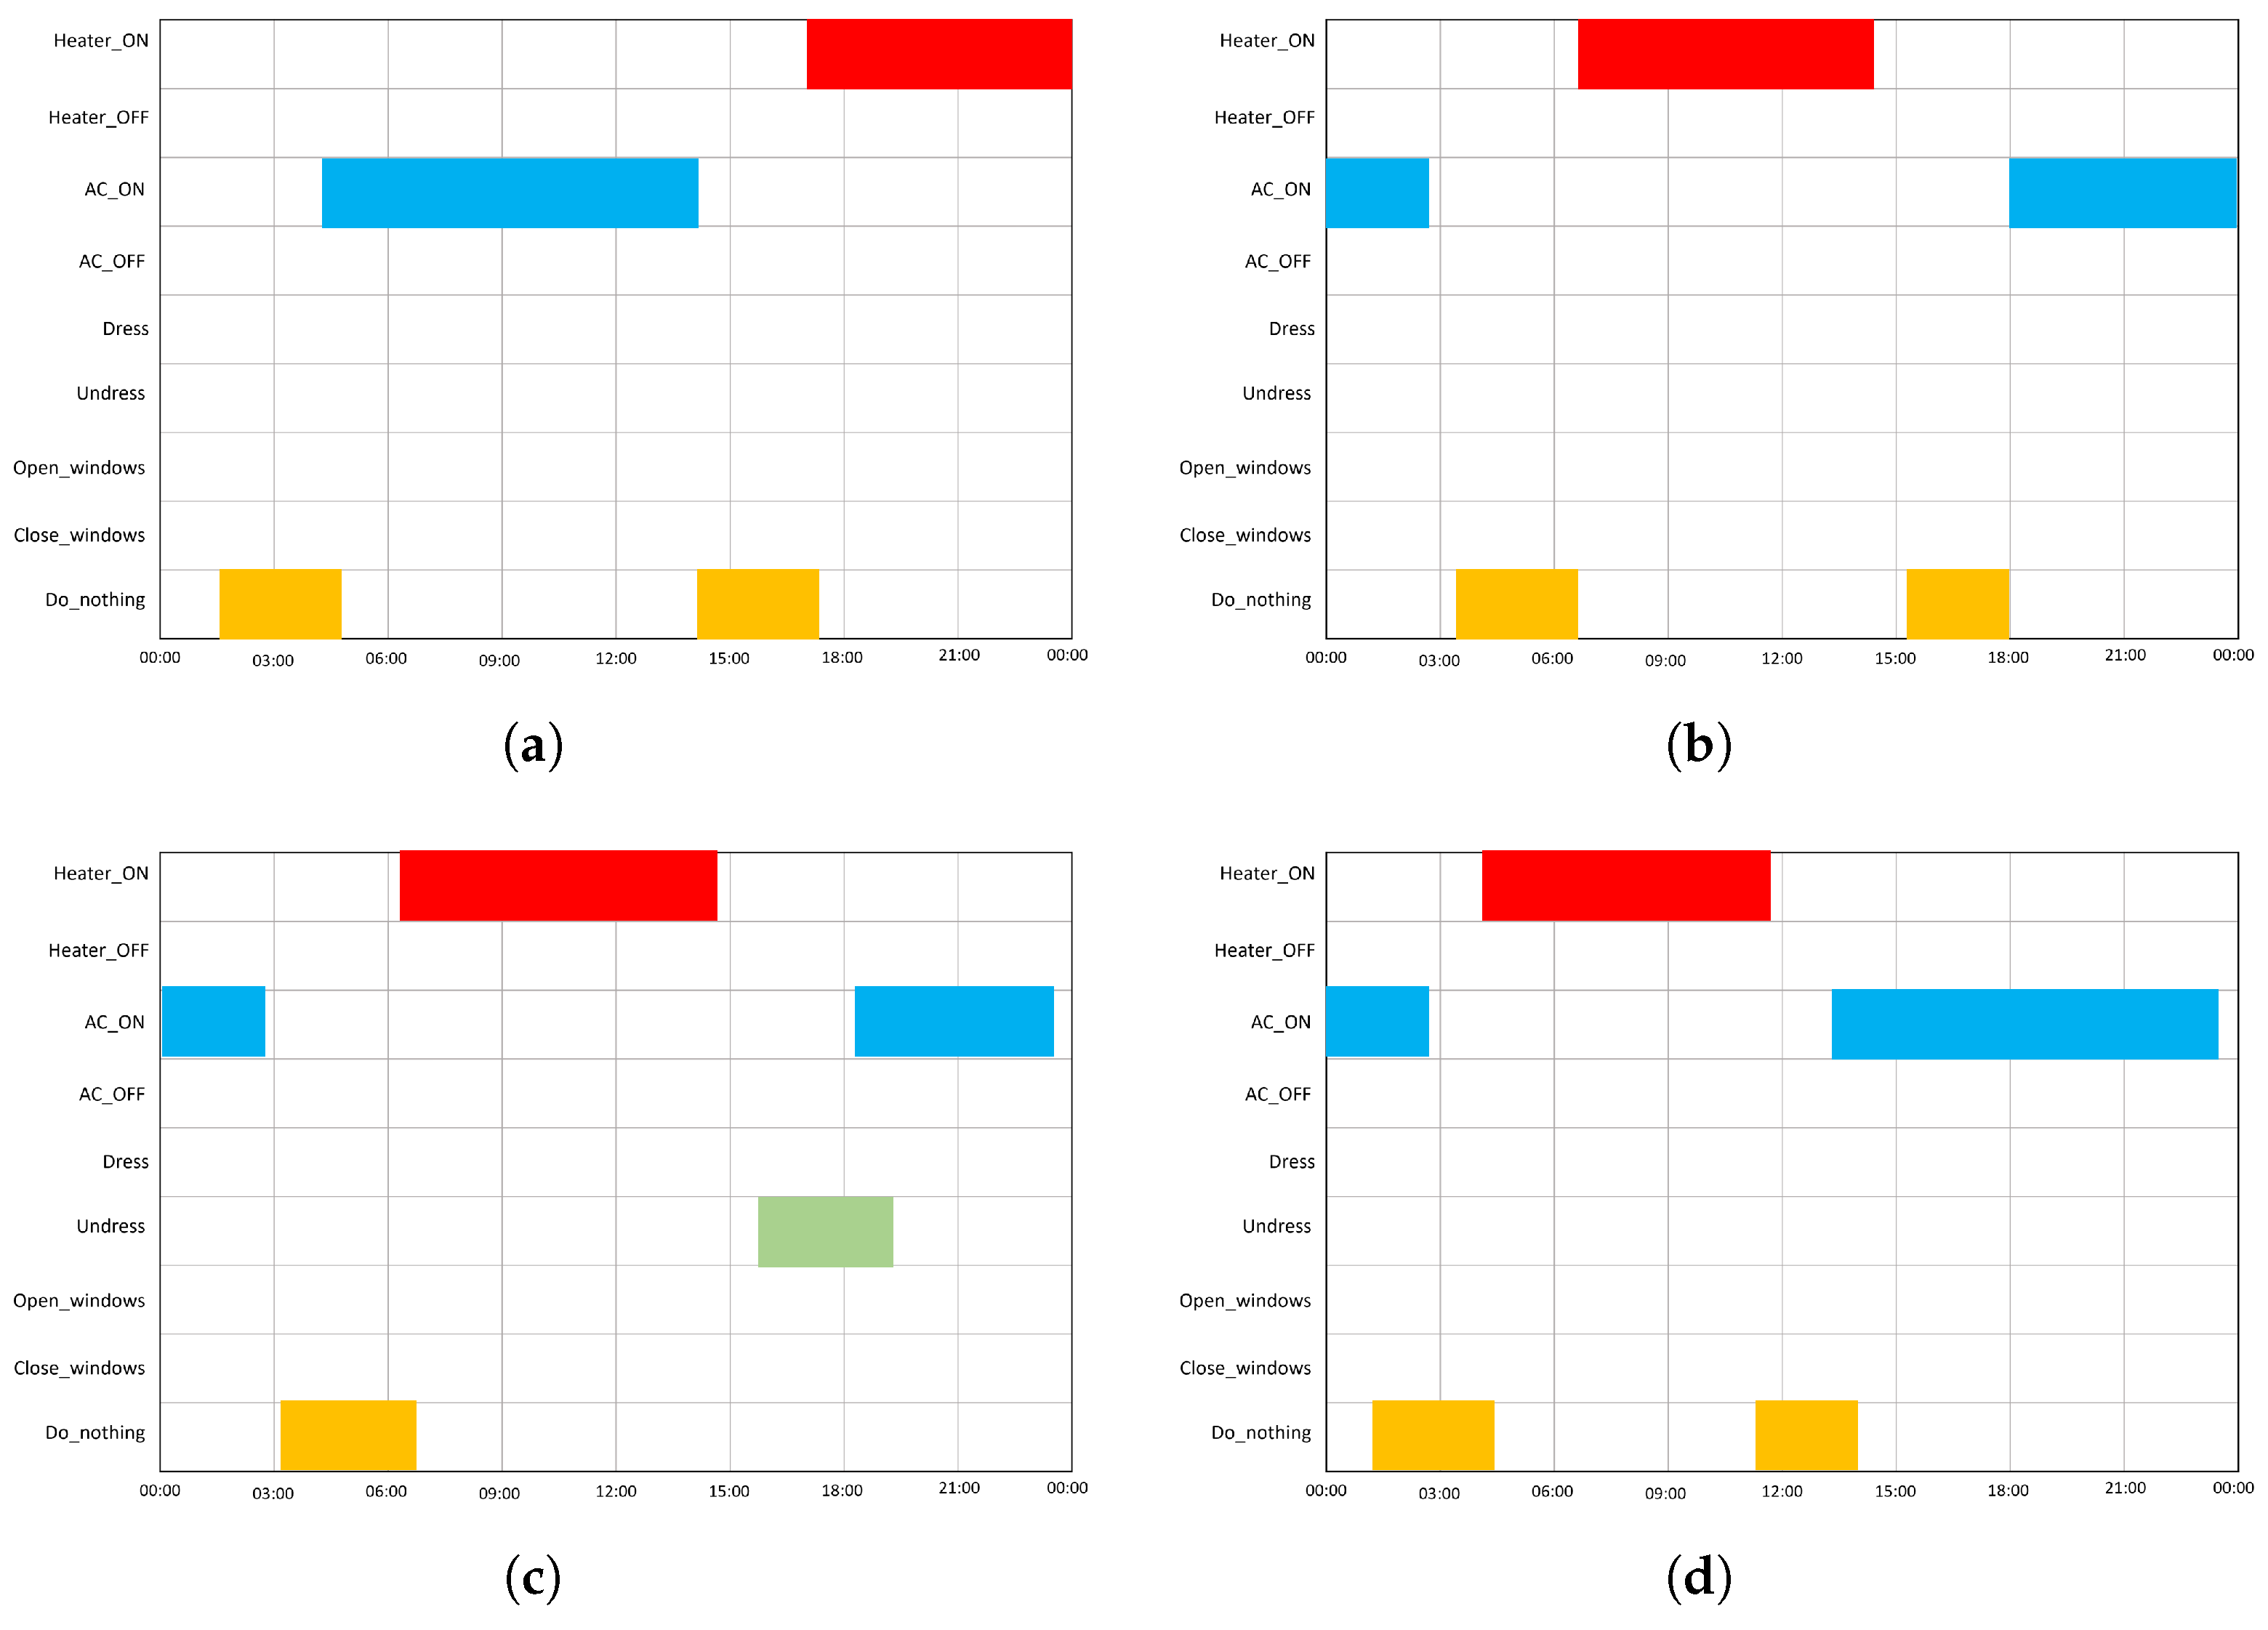
Figure 11,
Figure 12,
Figure 13 and
Figure 14 show a comparison of four randomly selected days, one per season of the year, for each of the cities considered in the training set. In this case, Santiago was not included, since the data from this city were only used to test the machine learning model generalization capacity. Generally speaking, the results reflected the actions taken by the proposed avatar, which showed a high dependence of thermal comfort on appliances, such as the heater and AC. This means that, in order to achieve the satisfaction of a user in a certain environment, a higher demand of power consumption is required, which is usually not convenient for users and service providers. Actions such as opening a window or putting on more clothes can help diminish consumption, especially in summer and spring seasons with higher temperatures; however, this actions are not considered for several days during winter, when the lower temperatures force the system to always have the heater on.
For each city, the usage frequency of the heater and AC was obtained. In addition, the performance frequency of alternative actions such as dress/undress and/open/close the window was also obtained. With this information, it was possible to obtain the rate that alternative actions represented from the total actions taken. In this way, the effects of user behavior intending to achieve thermal comfort could be quantified.
Particularly, in Calama (northern desert),
Figure 11, hot temperatures during the day and colder temperatures during the nights made the use of the AC and heater a routine (used a total of 3395 and 2812, respectively, during the whole year). Even in winter days in which temperatures are a little bit colder, the AC had to be used in order to achieve comfort. In this city, the use of alternatives represented a 9.7% of the total decisions taken, which translates into an almost 10% of time in which energy was being saved. On the other hand, the time in which no action was needed representws a 21.5% for the entire year, meaning that the structure of the building made the environment comfortable enough to withstand those temperatures. These statistics are given in
Table 5.
For the city of Valparaiso (central region),
Figure 12 shows a considerable usage of the AC (3034 times during the year), most significantly during summer season. In contrast, the heater was slightly less used than in Calama, being turned on 1326 times, which is explained by the cool temperatures and Mediterranean climate of the fifth region, in which the city Valparaiso is the capital. During the year of simulation, alternative recommendations such as dressing or undressing represented 12.4%, and the frequency of ‘Do Nothing’ increased as well with respect to Calama, being around the 50.5% of the total amount of actions taken. This means that the relationship between climate of the region and the building structure played a more determinant role in this case, thereby saving energy while keeping the user satisfied.
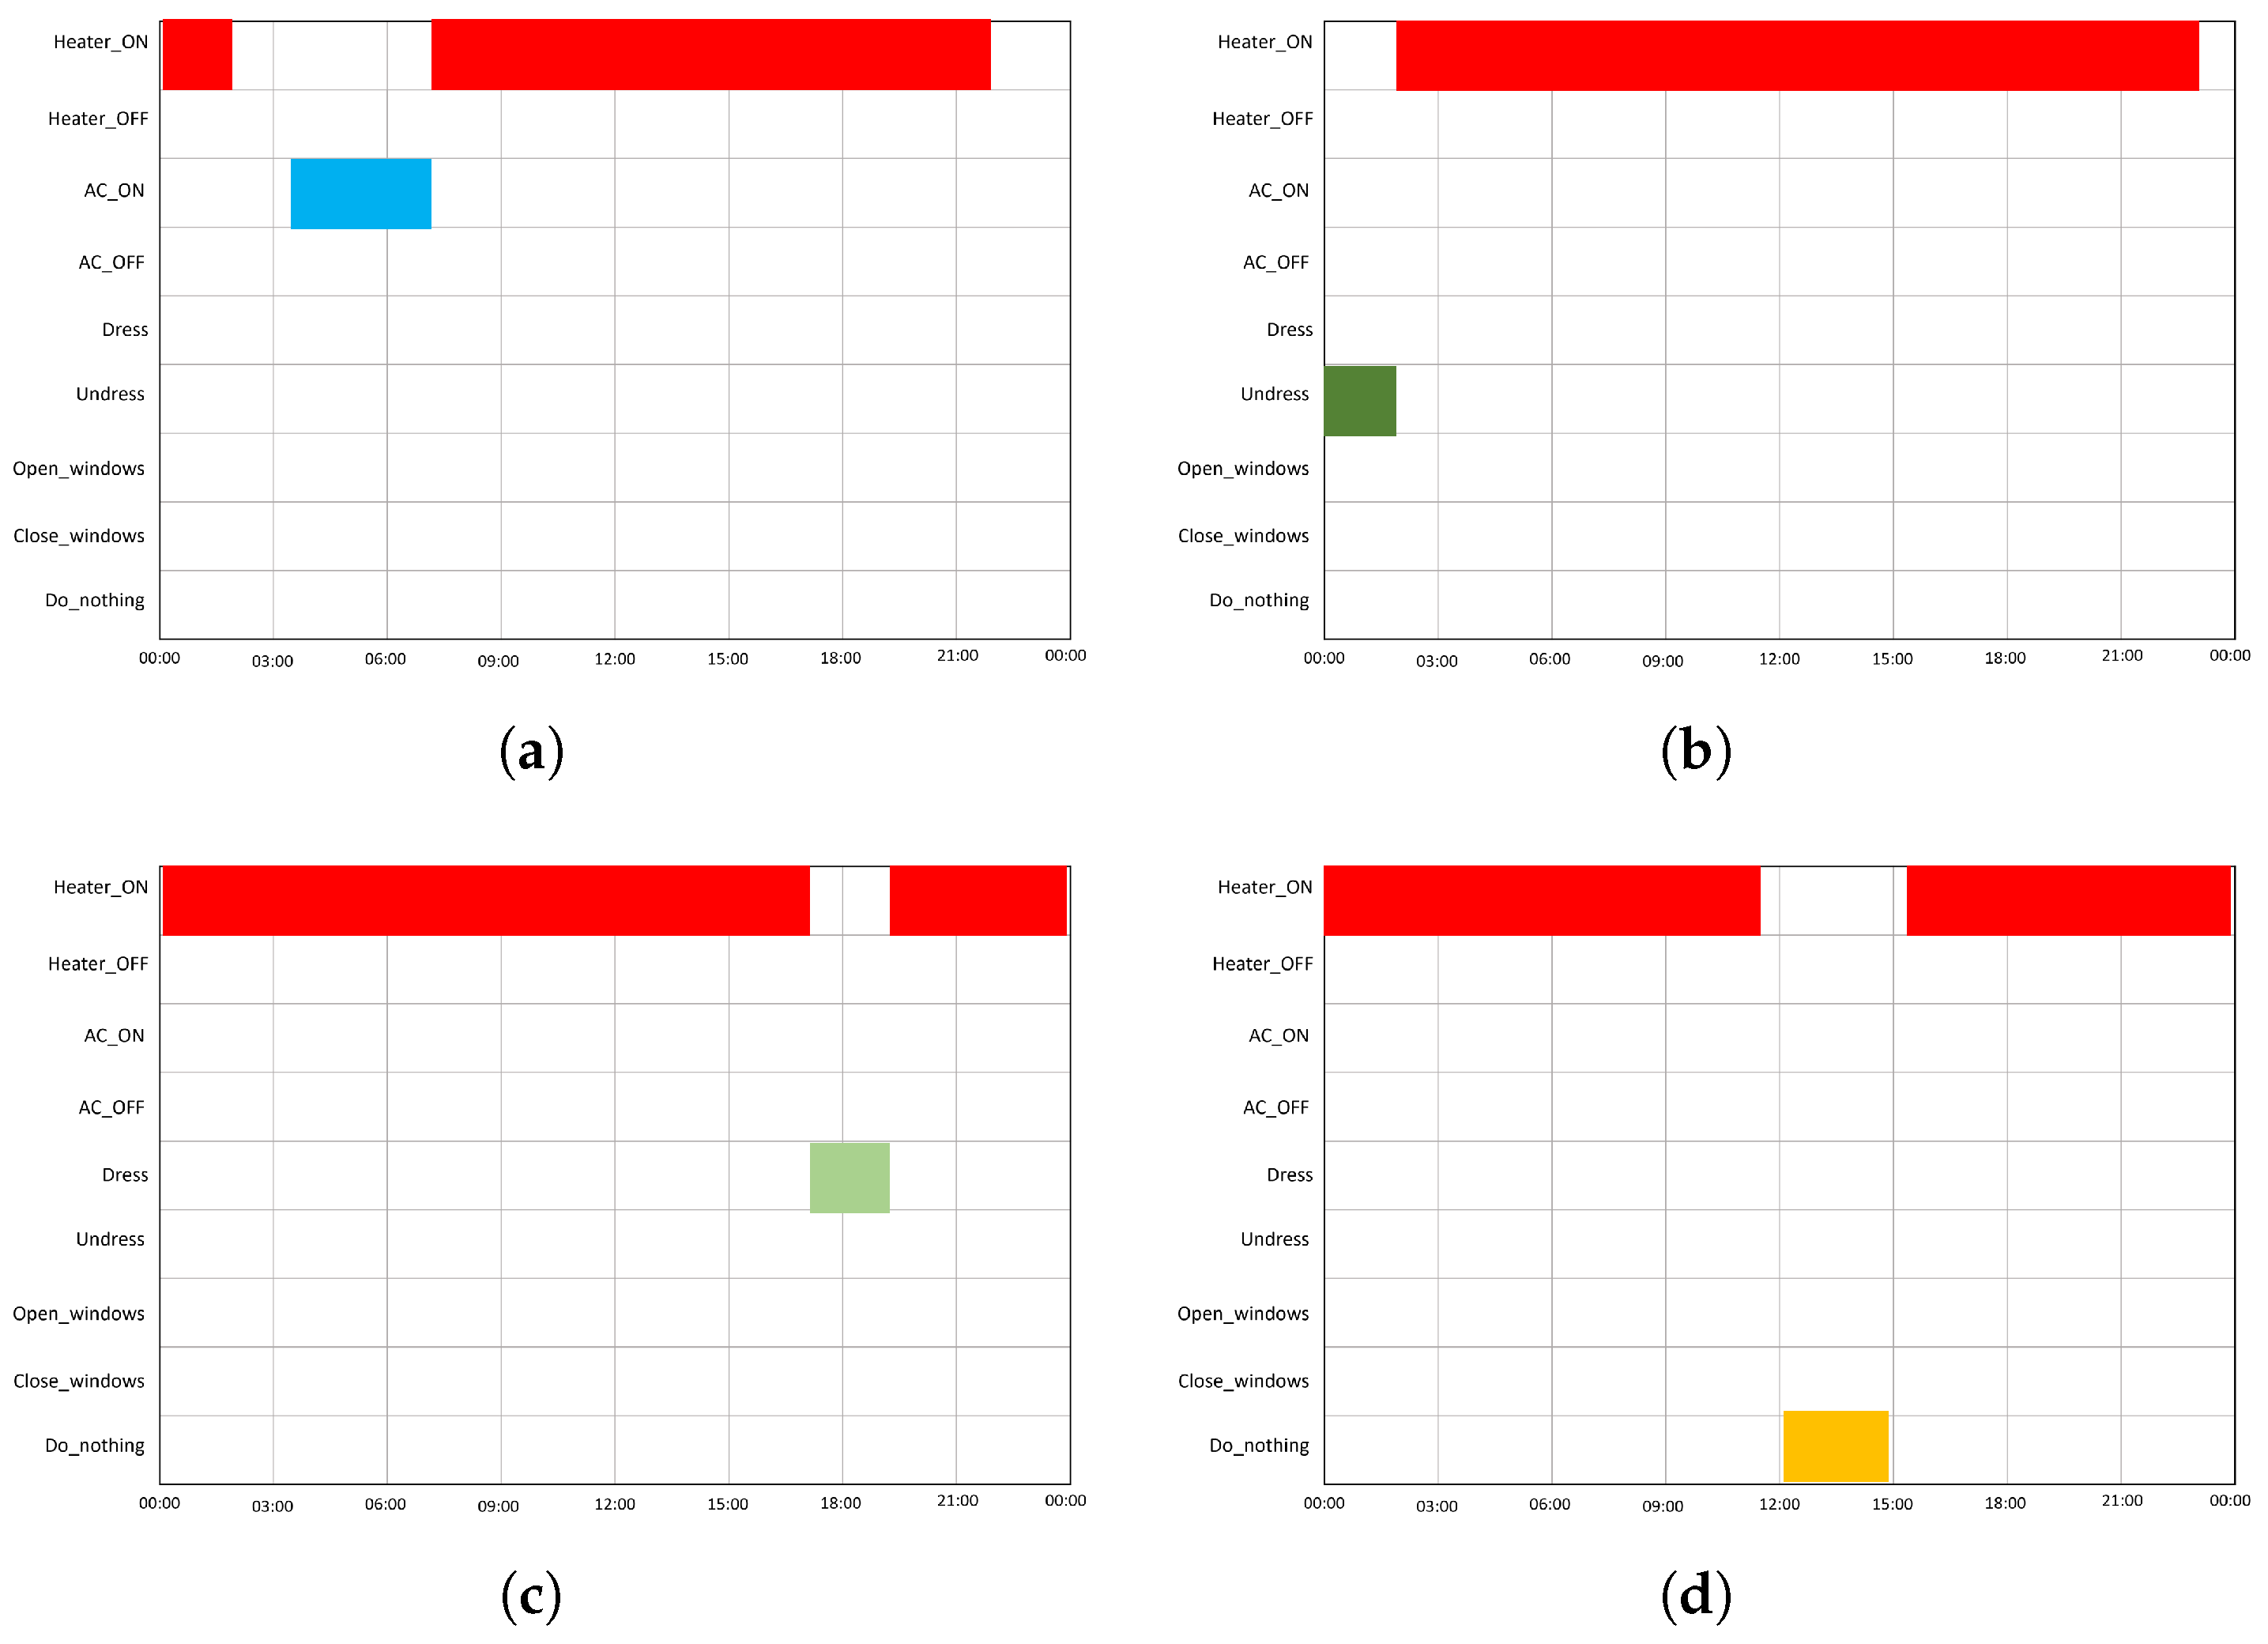
For the city of Puerto Montt (southern region),
Figure 13, the colder and wetter climate made the smart avatar practically use the heater all the time on certain days (5599 times in total during the year), including in the spring and summer. Only during the summer and fall were recommendations such as dressing having a higher impact on the results. In this case, alternative actions accumulated a frequency of 9.5%, and the times where no action was needed had a frequency of 14.1%. A similar situation happened in Punta Arenas (southern region),
Figure 14, where ‘Heater ON’ was the most common action taken (6258 times) during all seasons. In this city, temperatures are even colder than Puerto Montt, since it is a city near the southernmost tip of Chilean Patagonia; therefore, rain and snow are quite usual. The percentage of alternative actions taken here was around an 11%, while, for the times no action needed to be implemented, it 9.6%. In this case, extreme conditions made it difficult to maintain a balance between energy savings and user comfort; therefore, a higher power consumption was needed when user comfort was a priority. However, for 11% of the time, energy was saved by following alternative recommendations, such as dressing and undressing, which translated into adding or removing a piece of clothing. All frequency percentage rates of the possible actions to take explained above are shown in
Figure 15.
5. Discussion
The proposed smart avatar bases on computing and predicting the future behavior of the PMV for an experimental room that can be located in distinct zones of diverse Chilean geography. By using ML techniques, the proposed system can potentially capture the complex and nuanced interactions between various factors that influence thermal comfort within specific buildings. In our case, these factors included the external and internal temperature and relative humidity, metabolic rate (MET), clothes (CLO), and airspeed. As a result, the system only needed to sense and incorporate these parameters to achieve successful outcomes, irrespective of the climate to which the building was exposed.
It is a user-oriented approach that brings the potential to enhance comfort, energy efficiency, and user satisfaction. By leveraging the data analysis, ML, and personalized feedback, it helps create a more comfortable and user-centric solution to thermal comfort evaluation and management. Although the performance of the RF regressor can be improved, acceptable results were obtained with an RMSE of 0.54. In this regard, the main constraint was the model’s generalization, because, when faced with new data from a different city, the results were unreliable. To overcome this issue, a wider dataset needs to be developed that includes data from a larger number of cities.
Regarding the PMV forecasting, the LSTM performance was better than that of the RF in terms of the metrics obtained: an RMSE of 0.051 and an MAE of 0.025. In addition, this model exhibited good performance for new data, that is, acceptable generalization capacity with an RMSE of 0.088 in the city of Santiago. With only a sequence of past values, whose size could be modified in the range of 3–10 without a considerable negative impact on the results, the proposed model could provide reliable results. This means that, based on a database of PMV values, it is possible to obtain the PMV of the user independent of the geographic zone of residence. The traditional method for evaluating thermal comfort requires variables that depend on human perception (clothing and metabolism rate), which implies that it is a computationally complex and expensive procedure. Consequently, the proposed model can help overcome the issues of the traditional methods related to their dependence on subjective parameters. However, to do this, it is necessary to have previous knowledge of the PMV behavior in the first place, which represents a challenge and is difficult to obtain without any knowledge of the traditional input parameters: temperature, humidity, metabolic rate, airspeed, and clothes.
For decision making, the results were reasonable given the diverse climatic conditions that exist in Chile. It is important to note that alternative recommendations, such as opening a window, dressing, or undressing, were selected sequentially after the prediction process. In every tested scenario, the PMV results modifying the CLO and airspeed parameters were almost identical. Hence, the avatar selection was the one with the best future behavior, which, in all cases, was obtained after adding or subtracting clothes. These are the main reasons why open or closed windows were never selected; however, the avatar always considered these options. In addition, when deciding among the alternative recommendations, the avatar only analyzed the case when the user added or removed a piece of clothing once, because adding or removing more than two or more can be uncomfortable and, in some cases, inconvenient. To overcome these issues, exploring reinforcement learning-based approaches can be useful. This could also be convenient for the model to learn the behavioral patterns of users and adapt better to the characteristics of every climate. However, with the proposed algorithm over the entire year, a considerable percentage of the time thermal comfort was achieved without consuming energy: 31.2% of the time in a desert such as Calama, 69.2% for Valparaiso, and 23.6% and for the southern cities of Puerto Montt and Punta Arenas, respectively. These percentages represent the total percentage of alternative actions and the times when no action was required. At this rate, the structure of the house played a significant role. Therefore, the design and construction of a house can affect factors, such as heat transfer, air circulation, and insulation, all of which contribute to user satisfaction with the environment. For example, in cities such as Calama, the orientation of the house can affect the amount of sunlight it receives throughout the day, which can impact the internal temperature. The number and placement of windows can also affect the amount of natural light and ventilation, which can affect the thermal comfort.
It is important to emphasize that the primary goal of this research was to develop a user-centric approach by creating a smart avatar that emulated the experiences of an individual living in a simulated environment. This innovative solution allows for the enhancement of existing simulation tools by incorporating valuable insights into user preferences, which are often overlooked in such software. Hence, certain assumptions were made. However, it is acknowledged that further research is necessary to explore additional parameters and metrics, such as the PPD, to develop a more comprehensive and robust solution. By considering these factors, it will be possible to assess the impact of smart home technologies, such as home energy management systems (HEMS), on the daily routine of occupants. Additionally, as this is a simulation-based approach, the research only focused on the frequency usage of air conditioning (AC) and heater. The values of active power and other electrical variables remain out of the scope of this paper. An increase in the energy consumption was attributed to the activation of these appliances, regardless of the varying power consumption levels that they may exhibit as multi-state devices.
The next step in this work was to apply the ML algorithm directly in Grasshopper using Python. Once the ML was integrated into the Grasshopper and Rhino platform, the following stage was to improve the decision-making process by making it autonomous and by relying on reinforcement learning techniques. This algorithm allowed to understand multiple variations in the energy consumption of users. However, the process still needs improvement, since the energy simulation software does not allow for the free modification of the MET, blinds, and airspeed (opened and closed windows). These inputs were pre-set before the simulation using a schedule with hourly values between 0 and 1 for the whole year. While this method is acceptable for general calculations, it does not work to train our smart avatar.
To test whether an smart avatar would save energy in buildings by taking actions to improve thermal comfort (PMV), energy simulation plugins must incorporate modifications in their program structure to allow for the free modification of the MET and CLO values for PMV calculations. Alternatively, its necessary to design another plugin to evaluate the energy consumption in buildings using the proposed system. Furthermore, the smart avatar could interact as a normal human within rooms, thus taking actions to improve its comfort levels and engaging in activities with different metabolic rates. In fact, this avatar could have different characteristics, such as gender, age, profession, interests, and environmental knowledge, to establish which of these factors could save more energy by classification.
With the integration of ML, the smart avatar can learn and adapt to user behaviors and preferences over time. This would enable the avatar to make recommendations that align with the user’s goals while also considering energy-saving opportunities. By including diverse characteristics, the smart avatar can be personalized to represent a variety of occupants and improve the accuracy of the energy consumption model. In order to achieve this, the energy simulation plugins must incorporate a dynamic and adaptable algorithm that can respond to changes in user behavior and preferences. By incorporating ML and character into the energy consumption model, the smart avatar has the potential to significantly reduce energy consumption in buildings while enhancing user comfort levels. This approach represents an exciting development in the field of sustainable building design and has the potential to revolutionize the way we think about building energy consumption.
6. Conclusions
In this work, a smart avatar was developed that aimed to provide a user-centric approach which allowed for the evaluation of thermal comfort in an experimental room, which could be located in different regions of Chile. The proposed avatar was based on the PMV, thus computing this value through environmental and physical parameters such as temperature, humidity, airspeed, metabolic rate, and clothes. Among them, the internal temperature was the most relevant variable, which could not be omitted in this type of analysis. the data from four cities with different climatic conditions in Chile were used to train a random forest regressor to compute the hourly PMV. The data were generated using Rhino Grasshopper modelling a 3.0 m × 3.0 m × 2.4 m shoe-box with two adiabatic walls, which closely resembled a standard bedroom in a typical residential building in Chile. The RF regressor showed good performanceby reaching an RMSE of 0.54 and an MAE of 0.28. In addition, an LSTM network was trained to forecast the future behavior of the PMV and help a decision-making algorithm select the proper action to reduce energy consumption while maintaining the comfort. The LSTM achieved an RMSE of 0.051 and an MAE of 0.025. On the other hand, the avatar’s decision-making algorithm was based on the current and next-hour PMVs to implement actions related to power consumption, such as turning the AC or heater ON/OFF, recommendations such as dressing/undressing, opening/closing the window, and by doing nothing in the case that no action was needed. These last actions helped save energy by 31.2% of the time in Calama, 69.2% in Valparaiso, and 23.6 % in the southern cities of Puerto Montt and Punta Arena, respectively. Therefore, achieving thermal comfort may require an increase in power consumption that depends on the user’s previous behavior patterns.
The results showed that, by using ML, the PMV can be forecasted accurately, thus offering an alternative to other simulations that rely on different parameters and external weather data, which may not always be available. ML techniques proved to be reliable for the PMV calculation and thermal comfort assessment. With this solution, the impact of thermal comfort maintenance can be accounted to consider user interests. This new approach allows architects and climate engineers to know the PMV from a different perspective; however, there is still room for improvement. It is necessary to explore more datasets and simulations by modifying the MET values and airspeed within the room to get more information about the user. Due to software limitations, these values remained constant throughout the year for the proposed avatar. However, the way to get results is still reliable. Taking into account other actions that are not related to appliances can overcome this issue. Future work will focus on improving the generalizability of the ML models and exploring new alternatives for decision making, such as reinforcement-learning-based solutions. In addition, other parameters such as the PPD will be considered to develop a more robust solution that emulates a digital twin of Chilean users.


